Equity and Gender Concerns in Managing Devolved Funds in Kenya · Equity and Gender Concerns in...
60
Equity and Gender Concerns in Managing Devolved Funds in Kenya
Transcript of Equity and Gender Concerns in Managing Devolved Funds in Kenya · Equity and Gender Concerns in...

Equity and Gender Concerns inManaging Devolved Funds in Kenya

Canadian International Development Agency
Equity and Gender Concerns in Managing Devolved Funds in Kenya

About the Society for International Development
The Society for International Development (SID) is an international network of individuals and organizations with an interest in development, policy and governance research and dialogue. Since its creation in 1957, SID has consistently been at the forefront of reappraising prevalent development ideas and has confronted the theory and practice of development, challenging existing practices and suggesting alternative approaches. Over the years, three values have been – and remain – at the core of the Society’ work – respect for diversity, participation and equity. SID East Africa is incorporated as a Company Limited by Guarantee under the Laws of Kenya. It serves as the Regional Offices of the SID International Secretariat, which is headquartered in Rome, Italy.
Published by:Society for International DevelopmentRegional Office for Eastern AfricaBritam Centre, First Floor, Ragati/Mara RoadPO Box 2404-00100Nairobi, KenyaTelephone: +254-20-2737991Fax: +254- 20- 273 7992Email: [email protected]: www.sidint.netISBN: 978 9966 029 15 7
© Society for International Development, 2012
Permission should be sought from SID before any part of this publication is reproduced, stored in a retrieval system or transmitted in any form or by any means. Agreement will normally be given, provided that the source is acknowledged.
Design & Print by:Blue Eyes Limited,Phone: +254 20 2056959Email: [email protected]

i
CONTENTS
Preface ..................................................................................................................................................................................................................................................................................... ii
Acknowledgements ................................................................................................................................................................................................................................................. iii
Abbreviations/Acronyms ................................................................................................................................................................................................................................ iv
1. Introduction ..................................................................................................................................................................................................................................................... 1
2. Review of Key Concepts................................................................................................................................................................................................................... 4
2.1 Equity ...................................................................................................................................................................................................................................................... 4
2.2 Devolution ....................................................................................................................................................................................................................................... 5
2.3 Gender Mainstreaming ..................................................................................................................................................................................................... 7
2.4 Participation .................................................................................................................................................................................................................................... 8
3. Devolution and the Context of Own County Revenues .......................................................................................................................... 10
3.1 Constitutional Devolution in Kenya ................................................................................................................................................................ 11
3.2 County Own Revenue Performance................................................................................................................................................................ 15
3.3 Reviewing County Own Revenue Capacities ....................................................................................................................................... 18
3.4 Modelling CRA Resources ........................................................................................................................................................................................... 22
4. Gender in the Kenyan Context ................................................................................................................................................................................................. 25
4.1 Gender Participation in Decentralized Funds Management ............................................................................................... 27
4.2 Gender Sensitivity of CDF Spending .............................................................................................................................................................. 29
4.3 Improving Transparency and Accountability in Management ......................................................................................... 30
5. Discussion .......................................................................................................................................................................................................................................................... 33
6. Conclusions and Recommendations................................................................................................................................................................................ 37
References ........................................................................................................................................................................................................................................................................... 39
Appendices ........................................................................................................................................................................................................................................................................ 42

ii
PREFACE
Following the enactment of Kenya’s new constitution (2010), issues relating to fiscal decentralization and public financial management are now at the center of policy reforms. The
Public Financial Management Act 2012 was signed into law on July 23rd 2012. The PFM Act 2012 sets out to promote transparency and accountability in the management of public finances at the National and County Government levels. The Act details how resources will be shared in the country between the national government and the county government and also creates new institutions with a public financial mandate, such as the Commission on Revenue Allocation (CRA) and the Office of the Controller of Budget, amongst others, with distinct functions aimed at enhancing efficiency within the sector.
The need for reforms in the public financial management sector in Kenya arose out of previous challenges faced and gaps identified that lead to embezzlement of public funds, inequities arising in resource redistribution nationally and centralized systems of governance with inadequate checks and balances. The PFM reforms in Kenya were aimed at making public financial management more efficient, effective, participatory and transparent resulting in improved accountability and better service delivery. Introduction of devolution with responsibilities shared between the national and county governments is a significant part of these reforms. In implementing the PFM Act 2012 county governments will be expected to avoid previous challenges that plagued the sector including corruption, nepotism, and gender discrimination, among others. In this regard county governments need to take advantage of the new framework to not only manage the funds received through the Commission on Revenue Allocation (CRA), but also to generate their own revenue.
SID undertook a study to analyze the performance of past devolved funds in Kenya with the aim of documenting best practices, challenges faced and lessons learned. All these are expected to serve as a useful guide in implementing the new public financial management system. A key issue the study sought to identify is an understanding of the formation and composition of previous devolved funds; how well did these funds mitigate the inequities and inequalities in Kenyan society; how were the benefits of the funds shared by communities, as well what the potential revenue the counties have a review of their performance in revenue generation and use of the local authority funds. The study documents how potential for revenue generation by different counties in Kenya will impact their public financial resources, and also how gender equity and equality can be enhanced.
The lessons learned from this research have very important policy implications for the devolved government system in Kenya. We do hope that you find the information in this publication a useful contribution to better public financial management in Kenya.
Mary Muyonga,Program OfficerSID Regional Office for Eastern AfricaNairobi

iii
ACKNOWLEDGEMENTS
The Society for International Development wishes to acknowledge the contribution of various individuals and organizations that made this publication possible. This publication emerged
from interest expressed by a wide range of stakeholders to assess what lessons can be learnt from previous devolved funds, as the country moves to a new constitutional dispensation.
We would like to acknowledge the valuable contribution of the lead author Dr. Othieno Nyanjom a Consultant and Researcher on development issues for his indepth study of past devolved funds in Kenya, including a gender audit of the composition of these funds, and the valuable recommendations he provides towards enhancement of equity and equality in public financial management in Kenya. We appreciate the time taken by the peer review teams and for their valuable insights and information that contributed to shaping the content of this report. We acknowledge the inputs of our technical reviewers including Mr. Benson Kiriga and Mr. Davis Adieno and institutional representatives from Tax Justice Network Africa, National Taxpayers Association, KENDREN, The Institute of Social Accountability (TISA), and the Research Triangle Institute (RTI).
Special thanks to the SID Regional Office for Eastern Africa staff who worked on this project: Mary Muyonga who managed the programme, for her leadership, and other staff of the Regional Office including Katindi Sivi-Njonjo, Jacob Akech, Irene Omari, Leonard Wanyama, Jackson Kitololo for their administrative and logistical support. We recognize the programme leadership by our colleagues Stefano Prato (Managing Director) and Arthur Muliro (Deputy Managing Director) in the SID Secretariat in Rome, for their intellectual guidance and support, which made this publication possible.
Our gratitude goes to the Canadian International Development Agency (CIDA) for the financial support to this project. We wish to thank Robert Simiyu and Beatrice Atieno of CIDA CCO office in Nairobi, Kenya, for their unyielding support over the duration of this project. This report is part of the publications under the CIDA funded project titled ‘Institutionalizing equity and equality in public finance management under the new constitution of Kenya’, that is being implemented by Society for International Development Regional Office for Eastern Africa.
Ali Hersi,Regional DirectorSID Regional Office for Eastern AfricaNairobi

iv
ABBREVIATIONS/ACRONYMS
AEZ Agro-Ecological Zone
ASALs Arid and Semi Arid Lands
CACC Constituency AIDS Control Committee
CDF Constituency Development Fund
CEDAW Convention for the Elimination of Violence Against Women
CILOR Cash in Lieu of Rates
CMC Constituency Monitoring Committee
CRA Commission on Revenue Allocation
FPE Free Primary Education
GDI Gender-related Development Index
GEM Gender Empowerment Measure
GPT Graduated Personal Tax
HDI Human Development Index
HERAF Health Rights Advocacy Forum
IEA Institute of Economic Affairs
IPPG Inter-Parties Parliamentary Group
KADU Kenya African Democratic Union
KANU Kenya African National Union
KHRC Kenya Human Rights Commission
KIHBS Kenya Integrated Household Budget Survey
KIPPRA Kenya Institute for Public Policy Research and Analysis
KLGRP Kenya Local Government Reform Programme
KNBS Kenya National Bureau of Statistics
LA Local Authority
LASDAP Local Authority Service Delivery Action Plan
LATF Local Authorities Transfer Fund
MP Member of Parliament
NASSEP National Sample Survey Evaluation Programme
NFLS Nairobi Forward Looking Strategy
NGO Non-Government Organization
NTA National Taxpayers Association
PSC Public Service Commission
RMLF Road Maintenance Levy Fund
SEBF Secondary Education Bursary Fund
SID Society for International Development
SPAN Social and Public Accountability Network
SSA Sub-Saharan Africa
TA Transition Authority
TOR Terms of Reference
UN United Nations
WSTF Water Services Trust Fund

1
1. Introduction
In August 2010, Kenya concluded a two-decade long constitution review process when a nationwide referendum sanctioned the proposed constitution, which was subsequently promulgated into law.
The Constitution of Kenya 2010 re-affirms the supremacy of “the people” to whom sovereign power belongs, which may be exercised directly or through democratically elected representatives at the national and county levels. This Constitution is revolutionary in that it has ceded a lot of powers to the people of Kenya in terms of reining on the Executive, Legislature and Judiciary and ensuring that these three arms of government are accountable to the people of Kenya. For instance, most senior public appointments are now subject to public scrutiny, a situation not previously tenable under the old constitution.
In addition, the Constitution enshrines national values and principles such as “democracy and participation of the people… human dignity, equity, social justice, inclusiveness, equality, human rights, non-discrimination and the protection of the marginalized.” It provides various means for delivery of these principles, including an elaborate Bill of Rights, and a distinction between national and county levels of government with distinct revenue-raising opportunities, revenue sharing frameworks, and service delivery functions.
While the independence constitution provided for regional governments, these were abolished by 1964. Over the years, and as post-independence regimes eroded peoples participation in decision making and especially in allocation of resources, the perception has been that centralization of government has fuelled inequalities, and thus poverty, in most parts of the country.
Kenya’s inordinately high levels of poverty and inequality are founded on the failure of successive independence governments to ameliorate the wide disparities originally founded on diverse agro-ecological heritage.1 The independence development blueprint, Sessional Paper No. 10 of 1965, proposed that high potential areas generate surpluses to be redistributed to the low potential areas as a strategy for effective reduction of nationwide poverty, ignorance and disease (Government of Kenya, 1965). However, lack of an effective redistribution framework meant that the mal-distribution of scarce investment resources expanded the development gap between the high and marginal potential areas. This reality has fuelled long-standing demands for decentralized management of equitably shared budget resources and service delivery. Meanwhile, Kenya’s social cultural heritage – such as patriarchy and elder veneration – has also disadvantaged certain groups in the population, most notably women, children and minorities. In the case of women, even Kenya’s extensive commitment to various gender equality protocols has hardly narrowed the inequality gap.
The above scenario promptly led to agitation for decentralization of certain funds, especially through the local government system. Although several other funds have been established over the years, the most well-known and prominent (not necessarily popular) have been the Local Authorities Transfer
1. For example, colonial infrastructure investments focused exclusively on the parts of the country that were considered suitable for European settlement.
22
Fund (LATF) launched in 1989, and the Constituency Development Fund (CDF) launched in 2003.2 Along with several others, these rather ad hoc decentralization experiments were launched in an era of weak scrutiny of public financial management. Thus, while they were grassroots-based, limited participation undermined the optimal exploitation of their admittedly limited potential.
Broadly, these efforts at decentralization of development funding, by virtue of their nature or structure, have not been successful. Therefore, it would be expected that their success in addressing the issues of the marginalized groups, and especially women, would be dismal. In the context and scope of this paper, one can argue that the governance context of the decentralized funds undermined the government’s capacity for realizing the provisions of the various gender-focused protocols it signed up to the 1984 ratification of the 1967 declaration of the Committee on the Elimination all forms of Discrimination Against Women (CEDAW). This has meant that women have had fewer rights than men, such as over citizenship and property, and livelihood opportunities for the girl child have been compromised through premature reproductive responsibilities.
The Constitution of Kenya 2010 provides frameworks within which to address these previous shortcomings by emphasizing equity. It champions the equal treatment of equals, and the appropriately unequal treatment of unequals. This allows for positive discrimination and affirmative action to address unjust (ifiable) inequalities, providing an opportunity for those who have been lagging in development to catch up with those who are leading. A key agency of these endeavours is participation by all community members in determining own priorities and in overseeing implementation of selected interventions, an area that has previously extensively marginalized women and girls. The Constitution further provides for devolution to 47 county governments, clearly delineating their functions from those of the national government, with operational frameworks being provided by various legislations.
Two chapters of the Constitution specifically address devolution; that is Chapters 11 (Devolution) and 12 (Public Finance). Meanwhile, the Fifth Schedule of the Constitution provides a four-year timetable within which to enact legislation for implementing all aspects of the Constitution. In the case of devolution, this timeframe expires in July 2014. As Kenya fulfils the letter and spirit of the Constitution, civil society is among the stakeholders with an interest in enabling the development of legal and institutional frameworks conducive for effective implementation of the letter and spirit of the Constitution. This is the context in which the Society for International Development (SID) has commissioned this study.
Specifically, this study aims to:
1. Introduce key concepts such as devolution, devolved funds (management), expenditure reviews, and other related concepts as deemed fit;
2. Review comparative local and international experiences regarding devolved government systems compared to Kenya’s model, including the distinction of best practices;
3. Review the roles and functions of the National and County level government systems in resource generation and management as expected by the constitution and other policy documents;
4. Carry out an audit of previous devolved funds, their beneficiaries and lessons learned from these;
2. The two funds are arguably most well-known because they serve many sectors and are controlled by politicians – the ward councilor and parliamentarian – to whom people often go for financial assistance. When managed according to their respective legislation, they also involve wide community participation.

33
5. Analyse the revenue potential for counties, in order to inform future planning;
6. Review the mechanisms that exist for monitoring and evaluation of decentralized funds at the county levels; and
7. Make policy recommendations pertinent to improved management of devolved funds.
The underlying focus in the analysis will be on the extent to which the two explicitly-linked concepts of equity and gender sensitivity are ensured, even as the constitutional provisions for devolution are implemented. The premise is that if the equity principle underlies the identification of priorities, planning, budgeting and service delivery, then the ideals of gender responsiveness will have been met. Moreover, in a patriarchal society such as Kenya, the persisting unequal treatment of men, women, boys and girls requires affirmative action to provide them with opportunities for which they can exploit their full endowments towards maximizing their entitlements. This approach strives for vertical equity among individuals and groups, whose attainment will also deliver horizontal equity across groups. Conceptually, these concerns are akin to the rights-based approach to gender equity.

4
2. Review of Key Concepts
This section reviews literature on the key concepts of equity, devolution, gender and participation. An early understanding of what these concepts entail is important in understanding what they
do not entail.
2.1 - Equity
Equity is a powerful but little understood concept. It is often confused with equality, which in many instances nature makes impossible to attain, yet the two concepts are related. People are unequal to the extent that they have differing natural heritages – such as height and colour – about which they can often do nothing about even if they dislike what they have. Furthermore, areas, regions and countries are initially unequal to the extent that they have varying natural heritages that can only partly be mediated through vast investments. Kenya’s agro-ecological zones (AEZs) reflect such divergent natural heritage.3 In the face of such realties, Sen (1980) early raised the question of what should be equalized, such as in concerns on service delivery. For Sen, government policy and practice should strive to equalize basic capability of exploiting one’s potential even if one does not end up doing so.
The essence of equity is to treat equals equally, and unequals appropriately unequally. In later writings, Sen elaborated on the ‘capabilities approach’, extending the analysis to its effect on the stock of ‘entitlements’ of the individual. Sen’s capabilities4 and entitlements approaches provide a sound basis for reviewing resource allocation for service delivery in contexts of gross initial inequalities. The approaches argue that resource allocation should enable individuals and regions to exploit their capabilities to increase their pool of entitlements, which determine their welfare status. This does not imply that either individuals or regions must eventually have equal capabilities or entitlements, but the government should provide equal opportunities for exploiting existing potential, even if people and regions remain unequal thereafter.
The literature distinguishes horizontal from vertical equity. Equity analysis is often encountered in the literature on taxation, but is also prominent in public service delivery, such as in health and education. In taxation, horizontal equity is attained when individuals with equal earnings are taxed equally, and vertical equity is attained when individuals with higher incomes are taxed at an appropriately higher rate than those with lower incomes.5 Such taxation is said to be ‘progressive’, as opposed to a neutral 3. Kenya’s agro-ecological zones include: 1–ever-wet, evergreen rainforests; 2–evergreen rainforests; 3–seasonal rainfall (1 to 2 dry months); 4–seasonal, semi-
deciduous forests/savanna; 5–deciduous unimodal/bimodal rainfall grasslands; 6–short grass savanna/thorny trees/bushes; 7–bush land with perennial grass suitable for ranching ; 8–semi-deserts; and 9–deserts.
4. Thus, if the government knows – as it does – that education is a good means of increasing capability and entitlement, then the opportunity to acquire it should be provided equally to all. Similarly, if good physical infrastructure promotes capabilities and entitlements, then this should also be provided as possible.
5. Progressive taxation is based on income bands. In Kenya, the first Ksh 10,164 is taxed at 10%, the next Ksh 9,576 is taxed at 15%, the 3rdKsh 9,576 is taxed at 20%, the 4thKsh 9,576 at 25%. These bands add up to Ksh 38,892, with any income above that being taxed at 30%. A regressive tax would charge higher rates for the lower bands than the higher bands. A progressive tax is both vertically and horizontally equitable, charging people in different income bands differently, while charging all those in the same income band equally.

55
tax, which levies the same rate on all individuals irrespective of income, or a regressive one, which levies higher rates on lower incomes. In (public) service delivery, horizontal equity will be attained if those with equal need are treated equally, while vertical equity is attained when those with unequal need are treated unequally, proportionate to the inequality in their need.6 In a country such as Kenya, where service delivery is often viewed through ethnic or regional lenses, attaining vertical equity would ensure that all are treated appropriate to their varying need levels, regardless of their ethnicity or region of residence. This would enable a minimization of unnecessary or unjust inequalities, even if people or regions will not necessarily be equal thereafter. Critically, equity requires that no one is made worse off than they were before, meaning that in the face of scarce resources, the status of the most well off should at least be maintained at that level, even as concerted efforts are made to improve the status of the less well off, which is the basis of ‘affirmative action’ and ‘positive discrimination’.
2.2 - Devolution7
In theory, the management of enterprises, including governments, can stride a continuum from complete centralization to complete decentralization. In reality, however, the two extremes are never attained; the choice of a management system is more fluid over time and across space in ‘a complex mix of activities’ (Cabral, 2011). Besides federation, devolution is arguably the most extreme form of decentralization under a unitary government, involving the ceding of substantive authority to sub-national entities that might consequently be in charge of policy making, revenue generation, and policy execution. Because of the sub-national autonomy implicit in devolution, the form of governance is often referred to as democratic decentralization. The other forms include deconcentration, which transfers execution of policy hierarchically to other points within the enterprise, such as a department, or to external branches of the same enterprise, such as regional branches. Delegation offers a slightly stronger model of decentralization than deconcentration, such as in the government delegating responsibility to state corporations. Discussions on decentralization also distinguish administrative from political decentralization, the former merely decentralizing systems under the same management, while the latter involves the election of managers. Fiscal decentralization incorporates some tax-generating capacity for decentralized units. Cabral (2011) also distinguishes privatization and deregulation as aspects of decentralization. However, in both instances, the decentralizing authority cedes control to the extent of the privatization or deregulation, which might be such that it loses all control. The fundamental reality of decentralization is that it often involves the subsidiarity principle, which refers to the transfer of functions to the lowest feasible unit of management.
Proponents of decentralization, especially of devolution, argue that these systems are a means to greater efficiency, equity, and citizen participation and empowerment because they reduce the monopoly of authority and choice from the centre. Demands for devolution and decentralization arise from perceptions of poor, inequitable and autocratic service delivery from the centre, which is often likely to base its interventions on a perceived average need among all the people in the country, rather than differentiated local needs.8 Allowing sub-national levels to identify their own priorities
6. Thus, when estimating the health budget, allocations for treating the same malaria strain everywhere in the country should be the same, but must be appropriately different from allocations for treating the same cancer strain. Assuming malaria and cancer to be the only diseases, how much money County X gets compared to County Y will depend on their relative burdens (incidences) of the two diseases, given the unit costs of their respective treatment.
7. Greater insights into decentralization can be obtained from Cabral (2011) and Nyanjom (2011).
8. Thus, ffor example, while many Kenyans would expect communities of the arid and semi-arid lands (ASALs) to prioritize spending on water, Section 4.2 will show how such communities instead prioritize education.

66
makes it possible to design service delivery that responds to locally perceived needs. Regional biases in government service delivery can generate secessionist demands, and devolution is one way to appease disgruntlement. Whether devolution is more effective in poverty reduction remains unclear (Cabral, 2011), but it certainly provides an opportunity for democratic deepening that places the ordinary people in close contact with the leaders who must account to them. Where there is need for affirmative action to redress past injustices, a devolved government is likely to be better attuned to service delivery than a national government.
However, the effectiveness of devolved governance depends very much on the extent to which its structures respond to the service delivery bottlenecks of the pre-reform context, otherwise devolution can transfer the inefficiencies of the national government to the sub-national level. For one, devolution requires political goodwill, which is likely to be more forthcoming in a democratic than non-democratic system. Ideally, devolution structures should be specified in the Constitution, or at least in legislation, assigning expenditures (which distinguishes the functions of the devolved governments from those of the national government) and assigning revenues (to be raised by the national level from those that can be raised by the sub-national levels). Since devolution might undermine national economies of scale, its implementation would best thrive in a context of positive economic growth.
Besides the costs of excessive competition among devolved units, other risks to success include: citizen ignorance and apathy regarding participation (Cabral, 2011); the failure to establish sustainable sub-national institutions (Fjeldstad, 2003); the transfer of national inefficiencies to the sub-national level;9 and balkanization of the country into unsustainable socio-economic enclaves (based on religion, ethnicity or culture). These risks underscore the importance of the perception of devolution as a means to an end, rather than an end in itself, constantly monitored and evaluated and reformed as necessary.10
The literature offers various reviews of decentralization in Africa. Cabral (2011) and Kauzya (2007), acknowledging Ndegwa (2002), are among the most comprehensive studies. The most extreme form of decentralization is the federal state, of which sub-Saharan Africa (SSA) has only four: Comoros, Eritrea, Ethiopia, and Nigeria. This low incidence of SSA political federalism is consistent with the continent’s history of one-party ‘democracies’, which were justified on the basis of the rule of traditional societies through consensus (rather than the contestations that characterize multi-party politics). Ndegwa (2002) estimated the rate of fiscal decentralization to be a low 5% in 19 out of the 30 countries studied, compared to a rate of 40% in the Nordic states. The study, based on perceptions of World Bank staffers in respective countries, found decentralization to be greater in the constitutionally devolved states of South Africa and Uganda than it was in the constitutionally federal states of Eritrea, Ethiopia and Nigeria. In Ndegwa’s study, Kenya ranked fourth in political decentralization, but was sixth in fiscal decentralization and seventh in administrative decentralization. Ndegwa attributed the SSA discomfort with decentralization to these countries’ perpetuation of the centralized colonial governance structures, to insecurity of the central state, and to weak sub-national revenue-generating capacities. In all, these positions undermine citizen participation, which is critical for good governance (Cabral, 2011; Work, n.d). However, various other factors are also critical for effective decentralization, including the process chosen, such as the sequencing of reforms in an evolutionary rather than revolutionary way (Peterson, 2001).9. For example, Green (2008) argues that decentralization in Uganda replaced national level conflict with local level conflicts.
10. Rwanda decentralized to 106 local authorities after the 1994 genocide, but has since reduced these to 30.
77
2.3 - Gender Mainstreaming
Sex refers to the biological and physiological differences that distinguish males from females. However, gender refers to the socially constructed divisions of roles and indentities created by society that distinguish masculinity from femininity. Viweing society throguh gender lenses has led to the marginalization of females even in situations where they have no inherent advantage, such as educating boys because the girls’ place is in the kitchen. Attempts to reverse such artificial biases are at the centre of the gender intiative, such as gender mainstreaming, which the United Nations Economic and Social Council defined in July 1997 as:
“…the process of assessing the implications for women and men of any planned action, including legislation, policies or programmes, in any area and at all levels. It is a strategy for making the concerns and experiences of women as well as of men an integral part of the design, implementation, monitoring and evaluation of policies and programmes in all political, economic and societal spheres, so that women and men benefit equally, and inequality is not perpetuated. The ultimate goal of mainstreaming is to achieve gender equality…” (quoted in World Bank, 2003).
The global community’s espousal of the principle of gender mainstreaming was an explicit acknowledgement of the fact that throughout history, socio-cultural values have defined a distribution of opportunities that impacts differently on men and women, boys and girls – purely because individuals belong to different sexes. Indeed, in many cultures, women have been – and continue to be – largely invisible. For example, while women’s reproductive functions maintain households, national accounting systems have traditionally ignored this output since it is unpaid work. Thus, while gender concerns often appear to seek affirmative action in favour of women and girls, this is only an incidental consequence of the need to attend historical injustices against these categories in society. In truth, however, gender concerns focus on the reality that interventions have varied impacts on men and women, boys and girls. Gender equality calls for equitable interventions that create a level playing field for both sexes, enabling the equal enjoyment of opportunities, socially valued goods, resources and rewards (Wanjala and Odongo, 2010: 42-3). Since existing inequality burdens women more than it does men, empowering women will ensure their access to opportunities in a manner unburdened by their female gender.
Concerns with gender equality have their roots in the Universal Declaration of Human Rights of 1948, the International Covenant on Civil and Political Rights of 1966 and the International Covenant on Economic and Social Rights, also of 1966. Building on the foregoing, the global community signed up to the Convention on the Elimination of All forms of Discrimination Against Women (CEDAW). By 1985, the Nairobi Forward Looking Strategy (NFLS) for the advancement of women committed to reducing socio-economic inequalities by promoting women’s participation in all areas of their communities’ activities, a key initiative being the restructuring of public spending to improve women’s access to economic and productive opportunities. This was followed by the Beijing Declaration and Platform for Action (1995), which fostered commitments to mobilizing the resources required to fulfill previous undertakings. The year 2003 saw the signing of the Protocol to the African Charter on Human and People’s Rights and the Rights of Women in Africa.
While great strides have been made on gender equality as a result of these and related initiatives, inequalities persist. For many countries, the gender equality rhetoric has not, for instance, translated into gender responsive budgeting, which distinguishes different targets for women and men. Such budgeting remains gender neutral, mainly because adequate resources have yet to be set aside for the development of gender disaggregated data. Gender gaps are widest in the poorer countries, where they undermine economic growth (Wanjala and Odongo, 2010: 52). Indeed, the pursuit of gender equality concurs with other less contentious pursuits, such as the use of a human rights-based

88
approach to the design of development interventions. Ouma and Maina (2010: 76-7) emphasize that the pursuit of gender equality must not ignore other inequalities in society. The Institute of Economic Affairs - IEA (2007) emphasizes that gender mainstreaming involves additional budgeting costs, but recognizes that budget interventions are never gender neutral, and that not all women-focused spending is inequality-reducing.
Concerns over gender have spawned a new set of human welfare measures. The United Nations Development Programme’s Human Development Report 1995, for instance, introduced two gender performance measures: the gender-related development index (GDI) and the gender empowerment measure (GEM). The GDI adjusts a country’s human development index (HDI) for the extent of inequalities in attainments between men and women.11 In turn, the GEM explores the extent to which women’s participation in political and economic forums is advancing, given an original GDI status. Numerous other organizations also monitor progress with gender issues, often conceptualizing their own measure around the basic GDI concept. Thus, for example, the Mo Ibrahim Foundation’s Ibrahim Index of African Governance monitors participation and human rights, under which one indicator is a country’s gender status.12 The World Bank’s Worldwide Governance Indicators also monitor gender using various indicators, such as education enrolment and participation in politics13. Further, the Global Gender Gap Report index captures economic participation, education, health and political empowerment (Hausman et al., 2011).
2.4 - Participation
Participation as an instrument is a means to an end, a strategy for creating the opportunities through which to acquire a desirable status, such as development. Yet, participation is also an end in itself, an intrinsic reality (condition) that reflects the attainment of an aspiration (IEA, 2007). Thus, women’s participation can be the means with which to improve their status in society, but is also evidence of that improved status. Effective participation is, therefore, both the driver towards democracy and the product of the existence of such democracy. The literature distinguishes between indirect participation by citizens through elected representatives, and their direct participation through various ways, including administration and project management, public hearings, sittings on committees, councils and panels, membership of resident associations, and response to surveys, focus group discussions and polls (Mashinya, 2007). Participation provides the opportunity for people to be active in realizing their destiny, rather than being passive beneficiaries of development interventions. Thus, grassroots participation has the additional advantage of defying the capture of the agenda by the local elite.
Mashinya (2007: 27-30) presents two frameworks that conceptualize participation as a continuum of options from nominal to meaningful, direct, effective, empowering participation. One can move from passive interaction (with information, possibly involving indoctrination, flows from the informed entrepreneur to the passive recipient) to the self-mobilization or self-management. Thus, beyond passive receipt of information, a participant can merely provide information (such
11. A country’s HDI score is based on its attainments in three dimensions: life expectancy, education, and income. For details, see http://hdr.undp.org/en/statistics/hdi/, accessed on 15/10/2012.
12. See http://199.204.253.133/ibrahim-index/, accessed on 15/10/2012.
13. See http://data.worldbank.org/data-catalog/worldwide-governance-indicators, accessed on 15/10/2012.

99
as in a survey), or discuss and be consulted to influence outcomes. At a further level, a participant can contribute materially, thereby becoming a risk-taker in the activity, the extent of contribution in relation to the overall undertaking determining whether the participant has acquired a partnership status. Beyond that point, participation can be in terms of self-mobilization or self-management, where the participant assumes the status.
Within communities, effective participation requires resilient institutions that can stand up to adversity. This suggests that such institutions should precede the devolution of activities to the grassroots, or that capacity building should be undertaken at an early stage to empower effective participation. Where public projects are involved, people’s payment of the tax that funds such undertakings is an adequate motivation for participation, as is the fact that they are consumers of the products of such projects, providing a self interest in ensuring value for money (Omolo, 2011). Participation is consequently enabled when projects are integrated into the bigger community picture, the mandating of women roles expanding the pool from which to pick leaders, thereby deterring the holding of multiple roles that likely breed local elite and undermine transparent democracy.

10
3. Devolution and the Context of Own County Revenues
As highlighted in Section 1, Kenya is a country of extensive socio-economic inequalities, some of which are avoidable.14 The country’s independence constitution had provided for devolution
of government to regions whose representatives sat in the Senate of the bi-cameral Parliament, with constituency representatives – the Members of Parliament (MPs) – sitting in the National Assembly. This framework was designed ostensibly to protect the ‘smaller’ ethnic groups coalesced in the Kenya African Democratic Union (KADU) party from being dominated by a centralized government that was expected to be controlled by the ‘big’ ethnic groups, notably the Kikuyu and Luo, who were in the Kenya African National Union (KANU) party. KANU won the independence elections of 1962 and had by 1965 convinced the opposition KADU on constitutional changes that would get rid of regional governments and the bi-cameral Parliament, and on disbanding itself as a party. The 17 constitutional changes of founding President Kenyatta and his successor’s 13 changes were mostly designed to centralize power in the incumbent, including the 1982 constitutional transformation from a de facto to a de jure single-party state. The 1991 return to constitutional multi-party politics was a small concession on the government’s part: some 25 ad hoc amendments to that date had generated a widespread perception on the need for a comprehensive review of what remained of the independence constitution, in order to arrive at a more coherent document with greater sensitivity to the political and socio-economic challenges facing the county. Yet, after the return to multi-partyism, the most that the Moi government would concede to would be the 1997 Inter-Parties Parliamentary Group (IPPG) reforms package.
Among the major independence era challenges has been the failure of successive governments to address poverty and inequality, despite the promise of Sessional Paper No. 10 of 1965. These scourges are partially the product of wide AEZ differences already mentioned, which for example informed the choices of which parts of the country would be set aside for settler occupation, and therefore for colonial socio-economic and physical infrastructure investment. However, independence government interventions have also not focused on ameliorating these nature-based differences, polarizing the country between ‘devolutionists’ who ascribe poverty and inequalities to inequity in the management of the national cake, and ‘anti-devolutionists’ who disingenuously ascribe these scourges to the victims’ lack of initiative.15 Yet, the extent of inequalities that fuelled the demand for devolution is illustrated by Kiringai’s (2006) analysis, partially illustrated in Figure 3.1. The figure measures the rate of household poverty in districts based on the 1997 household welfare poverty survey data across the bottom scale, and that of per head government spending on the vertical scale.16 14. For example, for 2008, total fertility rate (numbers of pregnancies per women of child bearing ages 14 to 59) ranged from 2.8 in Nairobi Province to 5.0 for North
Eastern Province, Meanwhile, under five mortality (children dying before their fifth birthday) ranged from 51 in Central Province to 149 in Nyanza Province.
15. The devolutionist/anti-devolutionist dichotomy is not intended to imply the existence of two rigid categories. However, ever since the Bomas Constitutional Review process, there have been proponents of a strong centralized government, while others have proposed variants of decentralization. The conference eventually settled on five tiers, which the Constitution (2010) whittled down to two levels.
16. The per head spending includes all the funds channeled through the various district department heads, as well as three decentralized funds: CDF, LATF, RMLF.

1111
Thus, districts in the bottom left quadrant have low poverty rates and low budget allocations, while those in the top right hand quadrant have high poverty rates/high budget allocations.17 The figure shows that Murang’a (230) with a rate of poverty of about 27% received the same approximately Ksh 750 per head as Kuria (670) with a poverty rate of 79%.18 This reflects vertical inequity, the failure to treat unequals (based on poverty rate) appropriately unequally.19 The figure also illustrates horizontal inequity, with Murang’a and Nyeri (250) having the same poverty levels yet the respective per head allocations are Ksh 750 and Ksh 1,250.
Figure 3.1: Mapping Kenya’s per capita spending and poverty (1999/00-2003/04)
Source: Kiringai (2006)
Meeting vertical and horizontal equity based on poverty rates would require the districts to be lined along a diagonal going from bottom-left to top-right. The reality is that for the majority of districts, government spending has been low, but it has also not discriminated in favour of the poor, hence the demands for devolution and other forms of decentralized funding. After many years of debate, Kenya promulgated a new constitution in August 2010, among its most significant provisions being that of devolution of government to the county level (Chapter 11) and the related public finance management arrangements (Chapter 12).
3.1 - Constitutional Devolution in Kenya
Article 174 of the Constitution (2010) lists the objectives of devolution (see Box 3.1), while Article 175 lists its principles to include democracy, separation of powers, reliable revenues and gender sensitivity. Articles 176 to 186, read together with the First Schedule and Fourth Schedule, provide
17. Of course, current levels of poverty depend on the stream of realities, such as private effort, public spending , environment issues and the returns acquired, rather than just current public spending. Yet, a history of incremental budgeting in Kenya suggests that the pattern of Figure 3.1 is likely to be representative of what had been happening in previous periods.
18. For details of the district codes, see Kiringai (2006: 51).
19. The inequity here is based only on two factors, the poverty rate and per head allocations. Obviously, there are other reasons for the pattern of allocations. Nyeri might have got greater allocation than Murang’a because it was the President’s home district. The poverty rates of Moyale (455) and Busia (920) are comparable, but the former’s allocation is three times that of the latter, a possible reason being the greater distances to be covered by officers delivering services in the expansive Moyale.
210
3000
2500
2000
1500
1000
500
20 40 60 80
POVERTY HEAD COUNT
SPEN
DIN
G P
ER C
API
TA
210
250
230 240260220
820
840
340
710210
740
730
270
770460
720970660780
330450
455
360
410350
620680
680415
210210210
540 625210
430490780
750
880830
810
670
310650
690635640
430920370
495
630320
670615
680860910
950860
420
880

1212
for 47 county governments, each with a County Assembly and County Executive Committee, and their respective functions.20 Article 196 mandates the County Assembly to promote citizen participation in the conduct of its business. Part 5 of the chapter discusses relations between the national and county governments.
Article 201 of Chapter 12 lists the principles of public financial management to include openness, accountability, public participation, and the promotion of an equitable society observing justice in taxation and revenue sharing. The Commission on Revenue Allocation (CRA) established by Article 215 is mandated to recommend a fair basis of revenue sharing between the national and county levels as well as among counties (Article 216). Article 209 distinguishes the taxes collectable by the national as opposed to the county governments. Due to extensive socio-economic disparities across the country, an Equalization Fund is established to finance the provision of “basic services... to marginalized areas to the extent necessary to bring the quality of those services in those areas to the level generally enjoyed by the rest of the nation, so far as possible (Article 204).” Article 219 provides that revenues destined for counties be released to them promptly. As mandated by the Fifth Schedule, several legislation have been enacted to operationalize constitutional devolution, including the Devolved Government Act, Urban Areas and Cities Act, Inter-governmental Relations Act, Transition to Devolved Government Act and the Public Finance Management Act.
The Constitution provides that levying of all income-based taxes remain under the national level of government, including income tax, value-added tax, customs duties and other dues on imports and exports, and excise duty. In turn, county revenues will come from grants from the government (Article 203 and 204) and from own county revenues, the permitted sources being listed in Article 209 (3) to include property rates, entertainment taxes, and any other taxes legislated by Parliament. Counties may also borrow with the approval of their respective assemblies and the national government. Viewed against the ideals spelt out in Section 2.2, Kenya’s framework for devolution looks sound because: (i) it is embedded in the Constitution and related legislation; (ii) it clearly assigns expenditure (functions) and revenues; and (iii) it specifies frameworks for relations between the national and county government levels, including provisions for conflict resolution.
Box 3.1: Article 174’s objectives of devolution include:
Promoting democratic and accountable exercise of power; Fostering national unity amidst diversity; Enabling self-governance of the people towards their interrogation of the State; Recognizing the right of communities to self-management and development; Protecting and promoting the rights and interests of minorities and marginalized groups; Promoting socio-economic development; Ensuring equitable sharing of national and local resources; Rationalizing further decentralization of State organs; and Enhancing checks and balances.
20. The choice of 47 counties was an instrumental one by the Committee of Experts on the Constitution to avoid a potential impasse over the right numbers and boundaries. President Moi found 47 lawfully established districts, confirmed by a 1997 High Court decision. During his 24-year tenure, he decreed 24 illegal districts into existence, with President Kibaki decreeing a further 180-odd in his seven years to 2010. The Experts simply ignored these illegal districts.

1313
The Fourth Schedule of the Constitution details the respective functions of the national and county governments. Those of the county governments are summarized in Table 3.1, and the various legislations listed above provide the basic frameworks within which the services will be delivered. The Transition to Devolved Governments Act provides for a Transition Authority (TA), which will oversee the regulated transfer of these functions from the national government to county governments to ensure sustained service delivery during the formative stages of the latter governments. This report intends to use the context of the Kenya local authorities (LAs) to gauge county’s potential for service delivery. For a start, it compares the services presently delivered by LAs to those the Constitution mandates counties to deliver. The objectives of LAs include the provision of government that is responsive to citizens, enabling community participation, mobilization of human and material resources for development, and provision of two-way channels of communication (between the governors and the governed) (Mboga, 2009). These objectives resonate with those of devolution in many respects. The functions of LAs are detailed in the Local Government Act, primarily in Sections 143 to 194.21 While the two sets of functions match quite closely, the reality for LAs is that they have increasingly provided very few of their designated functions as their resources dwindled since the early 1970s, and as the government withdrew what had been their revenue mainstay, the Graduated Personal Tax (GPT) (Menon et al., 2008). Indeed, it is this incapacitation of the LAs that led to the 1998 launch of LATF, which was designed to enable the LAs to clear their accruing debts, while providing the services that remained in their dockets.
21. Like all other government legislation, this Act is available at http://www.kenyalaw.org/kenyalaw/klr_home/, accessed on 15/10/2012

1414
Sector: Activities
Agriculture: Crop and animal husbandry; livestock sale yards; county abattoirs; plant and animal disease control; and fisheries.
County health services: County health facilities and pharmacies; ambulance services; promotion of primary health care; licensing and control of undertakings that sell food to the public; veterinary services (excluding regulation of the profession); cemeteries, funeral parlours and crematoria; and refuse removal, refuse dumps and solid waste disposal.
Pollution control: Control of air pollution, noise pollution, other public nuisances and outdoor advertising.
Cultural activities, public entertainment and public amenities: Betting, casinos and other forms of gambling; racing; liquor licensing; cinemas; video shows and hiring; libraries; museums; sports and cultural activities and facilities; and county parks, beaches and recreation facilities.
County transport: County roads; street lighting; traffic and parking; public road transport; and ferries and harbours, excluding the regulation of international and national shipping and matters related thereto.
Animal control and welfare: Licensing of dogs, and facilities for the accommodation, care and burial of animals.
Trade development and regulation: Markets; trade licences (excluding regulation of professions); fair trading practices; local tourism; and cooperative societies.
County planning and development: Statistics; land survey and mapping; boundaries and fencing; housing; and electricity and gas reticulation and energy regulation.
Education: Pre-primary education, village polytechnics, home-craft centres and childcare facilities.
Natural resource policies: Soil and water conservation; and forestry.
County public works and services: Storm water management systems in built-up areas; and water and sanitation services.
Fire fighting services and disaster management
Control of drugs and pornography:
Community participation in governance
Source: Condensed from the Fourth Schedule of the Constitution
As mandated by the Constitution, the Public Finance Management Act and its own CRA Act, the Commission on Revenue Allocation (CRA) has developed a formula for the sharing of revenues among the 47 counties. The Constitution (2010) invokes equity – justice, fairness – in many instances, reflecting the perception and reality that the old constitution and the laws, policies, institutions and practices emanating from it had allowed negative discrimination against the weak and disadvantaged to influence governance and service delivery. The CRA’s original equitable share for each county was as follows:
Table 3.1: Comparing county government and local authority services

1515
Ci= Pi + PVi + Ai + BSi + FDi
C is county’s revenue share. Every county will get a basic equal share (BS) which has a 25% weight among these factors. P is the county’s population share (45% weight) while PV is the county’s poverty rate (20% weight). A is its area (8% weight), and FD is a measure of its fiscal discipline (2% weight) (CRA, 2012). These are the final weights that CRA has recommended to Parliament after extensive debates and consultations on its original formula, which had given population a 60% weight while poverty had a mere 12% weight. Further, while CRA had originally proposed to set aside a mere 15% of national revenue, its final recommendation to Parliament set this at 33.4% of the shareable Ksh 610.7 billion revenue, leaving a non-shareable Ksh 230.3 billion to cover non-discretionary government spending, such as debt servicing (CRA, 2012: 15-19).22 The resulting allocations to counties are listed in Section 3.4.
3.2 - County Own Revenue Performance
As noted above, Article 209 (3) mandates counties to generate own revenues. Kenya counties have wide variations in natural and artificial characteristics, such as in area, population, agro-ecological heritage, and social and physical infrastructure, all of which are significant for own revenue generation. The revenue sources permitted to counties are quite similar to those that are presently exploited by LAs. 23 This is the reason why this report uses the revenue capacities and performance of LAs to review the scope for own revenue generation among counties. The immediate concern is that when CRA shares the ring-fenced 15% share of national revenue among the 47 counties, some attention should be given to variations in county capacities for own revenue. Appendix Table A–3.1 provides a full list of the 175 LAs across the 47 counties. While LATF provided some relief, it was clear that a major problem for LAs remained the poor management of revenues. This led to the 2006 establishment of the Kenya Local Government Reform Programme (KLGRP), a European Union funded activity within the Ministry of Local Government, whose objectives included the expansion of own revenue sources, and the efficient collection and custody of such revenues. To this end, KLGRP has developed a revenue and expenditure database for each of the country’s 175 LAs between financial years 2004/05 and 2009/10,24 which forms the basis of the current study’s interrogation of counties’ own revenue capacities.
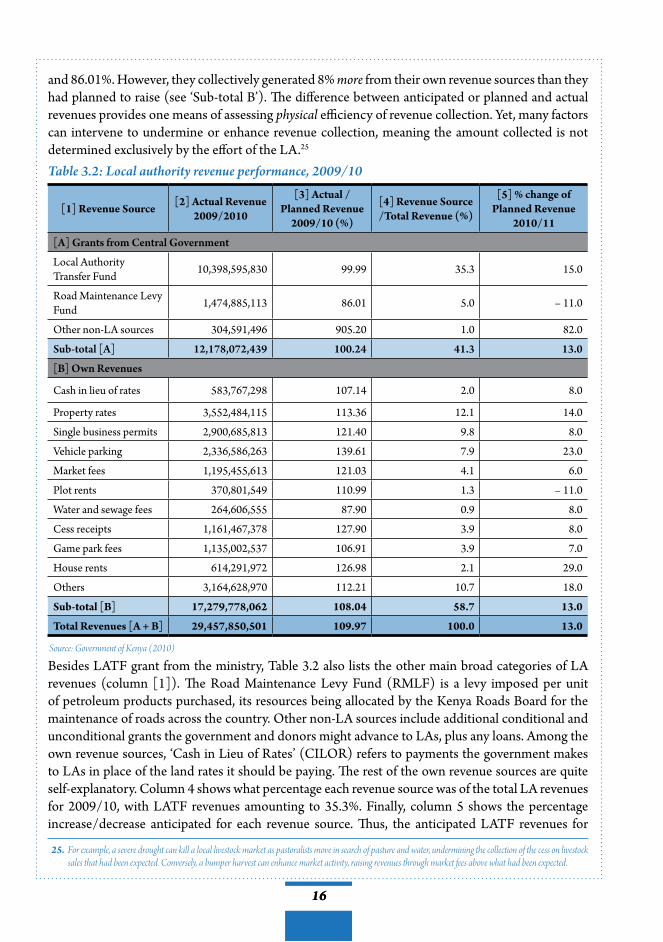
Table 3.2 illustrates the varied sources of revenues and their outputs for all the 175 LAs for financial year 2009/10, based on data from KLGRP’s annual report for that same year. Alongside estimating their annual budgetary needs, LAs are required to also project their own revenues, but there is unlikely to be a universal or scientific means of establishing this potential. In Kenya’s historical incremental budgeting tradition, it is likely that revenue offices simply raise the previous year’s collection by some convenient percentage. Column [5] of Table 3.2 illustrates the wide divergences in projected aggregate revenues between 2009/10 and 2010/11, including projections of declining revenues from two sources. In the table, column [2] shows the actual revenue raised from each source (column [1]), while column [3] shows what percentage that actual revenue was of the planned revenues. Thus, the 175 LAs together received less LATF and RMLF resources than they expected, respectively 99.99%
22. Budgeting distinguishes discretionary from non-discretionary spending. Thus, for example, current debt repayments are the product of loans agreements signed months, years or decades in the past. For governments to remain credible (creditworthy), it is important that they fulfil such obligations when due, making such spending non-discretionary.
23. Administratively under the old constitution, Kenya was divided into 8 provinces and the districts discussed above. Further, there were 175 LAs under the Local Government Act providing for tiered authorities. For a discussion of this system, see Menonet al. (2008).
24. Each LA has a dedicated treasury charged with the responsibility over revenue collection and expenditure.
1616
Besides LATF grant from the ministry, Table 3.2 also lists the other main broad categories of LA revenues (column [1]). The Road Maintenance Levy Fund (RMLF) is a levy imposed per unit of petroleum products purchased, its resources being allocated by the Kenya Roads Board for the maintenance of roads across the country. Other non-LA sources include additional conditional and unconditional grants the government and donors might advance to LAs, plus any loans. Among the own revenue sources, ‘Cash in Lieu of Rates’ (CILOR) refers to payments the government makes to LAs in place of the land rates it should be paying. The rest of the own revenue sources are quite self-explanatory. Column 4 shows what percentage each revenue source was of the total LA revenues for 2009/10, with LATF revenues amounting to 35.3%. Finally, column 5 shows the percentage increase/decrease anticipated for each revenue source. Thus, the anticipated LATF revenues for
[1] Revenue Source [2] Actual Revenue 2009/2010
[3] Actual / Planned Revenue
2009/10 (%)
[4] Revenue Source /Total Revenue (%)
[5] % change of Planned Revenue
2010/11
[A] Grants from Central Government
Local Authority Transfer Fund 10,398,595,830 99.99 35.3 15.0
Road Maintenance Levy Fund 1,474,885,113 86.01 5.0 – 11.0
Other non-LA sources 304,591,496 905.20 1.0 82.0
Sub-total [A] 12,178,072,439 100.24 41.3 13.0
[B] Own Revenues
Cash in lieu of rates 583,767,298 107.14 2.0 8.0
Property rates 3,552,484,115 113.36 12.1 14.0
Single business permits 2,900,685,813 121.40 9.8 8.0
Vehicle parking 2,336,586,263 139.61 7.9 23.0
Market fees 1,195,455,613 121.03 4.1 6.0
Plot rents 370,801,549 110.99 1.3 – 11.0
Water and sewage fees 264,606,555 87.90 0.9 8.0
Cess receipts 1,161,467,378 127.90 3.9 8.0
Game park fees 1,135,002,537 106.91 3.9 7.0
House rents 614,291,972 126.98 2.1 29.0
Others 3,164,628,970 112.21 10.7 18.0
Sub-total [B] 17,279,778,062 108.04 58.7 13.0
Total Revenues [A + B] 29,457,850,501 109.97 100.0 13.0
Table 3.2: Local authority revenue performance, 2009/10
Source: Government of Kenya (2010)
25. For example, a severe drought can kill a local livestock market as pastoralists move in search of pasture and water, undermining the collection of the cess on livestock sales that had been expected. Conversely, a bumper harvest can enhance market activity, raising revenues through market fees above what had been expected.
and 86.01%. However, they collectively generated 8% more from their own revenue sources than they had planned to raise (see ‘Sub-total B’). The difference between anticipated or planned and actual revenues provides one means of assessing physical efficiency of revenue collection. Yet, many factors can intervene to undermine or enhance revenue collection, meaning the amount collected is not determined exclusively by the effort of the LA.25

1717
2010/11 are 15% above the previous year (column [2]), whereas the anticipated RMLF revenues are 11% below the previous year’s. Across the list of own-revenue sources, property rates were most significant for 2009/10 for the 175 LAs, together contributing 12.1% of the LAs total revenues. It was followed by small business permits (9.8%) and vehicle parking (7.9%). These three dominant own-revenue sources will be more productive for the more urbanized authorities than for the less urbanized ones, for whom cess and market fees are likely to be more important. Efficiency in meeting planned revenue targets was very high during 2009/10, with all collection averaging 109.97%. As column [3] of Table 3.2 shows, the only areas where planned revenue was not attained were with respect to government grants, LATF and RMLF, over which the LAs do not have control. With respect to own revenues, whose performance is entirely in the hands of the LAs, realized revenues amounted to 108% of planned revenues.
Table 3.2 enables an illustration of a likely predicament of county governments over own revenues. During 2009/10, grants from the central government amounted to 41% of total LA revenues, meaning that own revenues were a mere 59% of the total resources available to LAs. KLGRP data show that this imbalance – including the dominance of LATF, which is financed by 5% of national income tax revenues – has been the general picture, with the central government transfers to LAs growing from a 35% share of the latter’s total resources in 2005/06 to 40% share in 2009/10 (Government of Kenya, 2010: 8). This LA revenue capacity shortfall is very significant, viewed against the share of national revenue the CRA has ring-fenced for counties, initially set at 15%. The 2009/10 transfers amounted to about 2% of national revenue, and should be compared to the 15% of national revenue that will be shared among county governments. However, the county governments will assume responsibility for the delivery of a large number of services hitherto handled by the central government, as set out in the Fourth Schedule of the Constitution. A concern, therefore, is whether the 15% national revenue share is adequate to cover county responsibilities.
Returning to the concern with varying county own revenue capacities, Table 3.2 illustrates the difference in potential for the various own revenue sources, dominated by property rates for 2009/10. Thus, Table 3.3 uses examples from the aggregate LA performance in each of 6 counties to further illustrate these variations. Nairobi county’s own revenues were more than four times that of the country’s second largest city, Mombasa, and nearly 300 times that of Tana River county, differences which are understandable even from the mere perspective of relative populations. What is more interesting, however, is the relative importance of own revenue sources across the counties. While the data of Table 3.2 shows the significance of property rates, on average, Narok and Wajir counties in Table 3.3 generate nothing from that source, and from CILOR which happens to be Lamu’s most important source. For Narok, 98% of its revenues are from others sources, likely dominated by game park fees. An obvious challenge for counties will be both to maximize revenue from these existing LA sources, and to see how to venture into other sources that their LAs do not currently exploit.

1818
3.3 - Reviewing County Own Revenue Capacities
Beyond the physical efficiency assessed through the KLGRP process (column [3] of Table 3.2), regression analysis provides an alternative approach to assessing efficiency, especially in the context of the constitutional provision that at least 15% of national revenue will be shared equitably – not equally – across the 47 counties. As mentioned above, the own revenue sources permitted to counties are quite similar to those own revenue sources currently used by LAs.26 Consequently to this similarity in own revenue sources, this study aggregates the revenue data from Kenya’s 175 LAs at the county level as listed in Appendix Table A–3.1 to analyze certain aspects of the 47 county governments’ capacities over revenue.27 Each county’s revenue data for 2004/05 to 2009/10 are aggregated and divided by 6 to find the average revenue for the period (see Appendix Table A–3.2). The objective is to use regression analysis to this period average own revenue to identify which county characteristics are significant in explaining the reported county revenues. Obviously, each county’s revenues depend on: (i) the number of revenue sources; (ii) the respective rates charged; and (iii) the number of people paying28. A rate or fee can be determined mechanically, such as a media house setting a newspaper cover price. The media house’s revenue level will depend on the number of people buying that newspaper. But other factors will guide the media house in setting its cover price, such as cost of newsprint, wages and transportation costs. Other factors will also determine the number of people who buy the paper, which in turn is affected by whether people can afford it, and what other papers are on the market. Thus, in trying to understand the differences in revenue across counties, it is important to go beyond the various rates imposed and numbers of people paying up, to other county characteristics that determine whether people like the service, can afford to pay the
Nairobi Mombasa Narok Lamu Wajir Tana River
Cash in lieu of rates 3.1 3.0 0 32.4 0 11.9
Property rates 28.4 29.6 0 23.1 0 11.2
Single business permits 14.6 21.4 1.1 15.8 12.7 13.5
Market fees 3.6 6.7 0.6 6.8 21.4 13.5
Vehicle parking; Plot rents; Water and sewage fees; Cess receipts; Game park fees; House rents; Others
50.2 39.2 98.3 21.9 65.9 49.8
Total (Ksh) 6,437,140,362 1,315,826,280 991,154,773 28,247,891 20,030,272 21,537,501
Source: Government of Kenya (2010)
26. Article 209(3) allows county governments to raise revenue through: property taxes; entertainment taxes; any other tax authorized by an Act of Parliament; and charges for services. However, like LAs, county governments may not collect income tax, value-added tax, customs duties (on import and exports) and excise tax – all of which are set aside for the national government.
27. For example, Wajir County only has one LA, Wajir County Council, but Kisii has 10 and Kiambu has 8. In the following discussion, LA and county own revenues are used freely given their common source.
28. The reported revenues also depend on the integrity of treasuries, whether they report all that they collect.
Table 3.3: Shares (%) of sources of own county revenues, 2009/10

1919
rate, and actually pay it. A key guide to which county characteristics to include among the probable predictors of revenue is to look at the theoretical or empirical context and identify characteristics that are proximate across most counties to the output variable – revenue in the present case.29
Various county characteristics that are considered to relate to – predict – the amount of revenue raised were considered, such as population, area, level of poverty, level of urbanization, and household welfare measures, amongst others, many of them from household surveys or census databases. These variables are termed predictor or independent variables, while the average own revenue variable they seek to explain is termed the outcome or dependent variable. Given the context of, and timeframe for, the research for this report, the county characteristics explored were those that were readily found in the 2005/06 Kenya Integrated Household Budget Survey (KIHBS) and the National Census 2009. The justification for using county characteristics spread over such a timeframe is that the own revenue being examined also stretches over the same period, from 2004/05 to 2009/10. Given the important discussion surrounding Figure 3.1, one important variable missing from the analysis is the level and/or trends in comparative aggregate or sectoral budget spending. While the analysis considers the length and/or quality of roads, which is a proxy for roads spending, the bulk of budget spending is hardly ‘captured’ by the two data sources above. Thus, for example, there is neither data on, nor a suitable proxy for, cooperative department budgets, which is critical for the success of farmers whose spending power is significant for own revenues.
Paired characteristics were assessed for correlation, which is the extent to which their values across the counties rise or fall together: where this is high, they are assumed to have the same impact on the variable being explained – revenue, which raises caution over their joint employment in explaining the outcome variable, own revenues (see appendix Table A–3.3). However, the effects of such a high correlation between two variables may be mitigated through interactions with other variables, so as to make them admissible to the model.
A look at the values of the characteristics constituting the predictor and outcome variables shows vast differences in the actual sizes of the numbers involved, which are to be applied in regression modelling (see appendix Table A–3.4). For example, population density stretches from 4.1 to 4,515, numbers of households with improved sanitation from 19 to 469,830. Further, the means for the variables stretches from 402 for population density to Ksh 189,333,160 for the main central government grants to the LAs, LATF and RMLF. And of course, these variables measure very different characteristics, from population density, to money to households. These realities make the interpretation of the output of a regression model rather difficult. One solution to that problem is to take the natural logarithm of all the numbers used, which provides a growth base exponential (e) from which to compare the variables’ values sensibly.30 The use of logs also has the practical benefit of providing an elasticity measure, which is the change in the dependent variable occasioned by a unit change in a predictor (see below).
The Ordinary Least Squares regression was run using a Statistical Package for Social Scientists (SPSS) method, which examines all the predictor variables presented and picks the one that has the highest significant explanatory power over average own LA revenues. The method then undertakes several rounds of examination of the remaining predictor variables, adding them to the emerging model as long as the subsequent one is statistically significant; meaning their association with the
29. Thus, for example, snow on Mt Kenya might explain Central Province counties’ revenue performances through tourism numbers, but it would be a useless predictor of revenues for most ASAL counties. Note that we do not declare that Mt Kenya snow causes revenue; only that it is related to increased revenues through its attraction of tourists.
30. If so inclined, the non-mathematical reader might go to the following website http://betterexplained.com/articles/an-intuitive-guide-to-exponential-functions-e/ to understand e. If not, these is well-advised, then just accept that the natural logarithm constricts the individual values to manageable numbers.

2020
dependent variable is not by chance. The result presented in appendix Table A–3.5 shows that the significant predictor that accounted for the highest share of the log of own LA revenues was the log of households with electricity, whose unit rise is associated with a 50% increase in the log of own LA revenues. A unit change in total main central government grants – that is LATF and RMLF – is associated with a 108% increase in LA revenues, but a unit increase in the urban population size is associated with a 43% decrease in LA revenues. It is logical for an increase in grants to be associated with a rise in own revenues. However, the decline in revenue with growth in urban populations probably reflects the migration of rural youth into urban unemployment and poverty, meaning they contribute little or nothing to revenues.31 This model suggests that county own revenue capacities will be quite modest.
The purpose of the regression was to predict how own revenues ought to be shared across the LAs given their current revenues and county characteristics. The formula of the model reported in Table A–3.5 is as follows:
Predicted Revenues = -1.234 (constant) + 0.495 (Numbers with electricity) + 1.075 (Main grants) – 0.429 (Urban population)
Since the values in the model were log-transformed, they have to be ‘unlogged’ by finding their exponential value.32 The actual own revenues and their predicted counterparts are presented in columns [1] and [2] in Table 3.4. Column 1 shows the average revenue per LA or county for the five fiscal years (2004/05 to 2009/10) – also shown in the last column of Appendix Table A–3.2. Using the regression coefficients of the model above, multiplying the coefficients with their respective predictor values provides the respective predicted revenues of columns 2. Thus, while Baringo’s average revenue was Ksh 59,172,020, the three county characteristics of the model predict it should have an average of Ksh 101,445,270, meaning the county under-generated revenue by Ksh42, 273,250, a massive 71.4% of what it actually generated. The performance of Nyandarua (-161.5%) and Migori (-102.3%) were the worst across the counties. The leading over-performers included Nyamira (85%) and Kajiado (82%). Quite a number of counties had variance of less than 5% either way, including Busia, Kilifi, Kisii, Kisumu, Kwale and Turkana. These findings can be used as a rough gauge of revenue efficiency, over and above KLGRP’s measure reported in column 3 of Table 3.2. Why revenue collection falls above or below potential is difficult to explain, but a model such as this points the direction to the incoming county managers on possible concerns to pay attention to. It is worthwhile underscoring here that the established levels of efficiency reported here are based on the county characteristics used in the model above, and that other county characteristics would provide different under- or over-performers. Which county characteristics are best to employ depends on the quality of data available, which forces this modelling to use data from varied sources, which can itself be problematic.
Table 3.4: Average actual and predicted own revenues, 2004/05 to 2009/10 (Ksh)
31. The R square of the model shows that the three predictors explain 82% of the change in own revenues. The tolerance and VIF measures also suggest that the predictors are not interfering with each other.
32. This is done by raising the log-transformed values to the power of e, which is equals 2.718281828.
CountyOwn LA Revenues [3] LA Difference
[1] Actual [2] Predicted Amount Rate (%)
Baringo 59,172,020 101,445,270 (42,273,250) (71.4)
Bomet 78,140,842 80,957,914 (2,817,072) (3.6)

2121
CountyOwn LA Revenues [3] LA Difference
[1] Actual [2] Predicted Amount Rate (%)
Bungoma 134,172,825 122,586,811 11,586,014 8.6
Busia 113,868,896 110,767,060 3,101,836 2.7
Elgeyo-Marakwet 30,349,894 48,867,837 (18,517,943) (61.0)
Embu 113,290,251 120,634,998 (7,344,747) (71.4)
Garissa 39,030,909 74,678,292 (35,647,383) (6.5)
Homa Bay 86,298,517 95,944,456 (9,645,939) (91.3)
Isiolo 132,854,285 23,005,411 109,848,874 (11.2)
Kajiado 136,774,167 144,719,798 (7,945,631) 82.7
Kakamega 173,384,080 236,507,387 (63,123,307) (5.8)
Kericho 153,267,539 108,474,969 44,792,570 (36.4)
Kiambu 628,504,498 603,526,193 24,978,305 29.2
Kilifi 224,547,906 201,622,965 22,924,941 4.0
Kirinyaga 127,585,640 128,633,779 (1,048,139) 10.2
Kisii 129,995,419 134,253,451 (4,258,032) (0.8)
Kisumu 292,836,239 256,859,551 35,976,688 (3.3)
Kitui 113,819,390 108,265,814 5,553,576 12.3
Kwale 69,070,876 102,331,694 (33,260,818) 4.9
Laikipia 141,880,559 104,892,859 36,987,700 (48.2)
Lamu 15,088,970 21,208,657 (6,119,687) 26.1
Machakos 391,723,975 175,098,635 216,625,340 (40.6)
Makueni 75,262,553 119,492,002 (44,229,449) 55.3
Mandera 31,749,568 23,473,437 8,276,131 (58.8)
Marsabit 36,164,482 28,075,841 8,088,641 26.1
Meru 163,019,020 329,768,021 (166,749,001) 22.4
Migori 104,985,313 89,014,515 15,970,798 (102.3)
Mombasa 912,397,948 832,255,464 80,142,484 15.2
Murang'a 178,780,180 179,527,687 (747,507) 8.8
Nairobi 4,913,296,147 3,881,587,281 1,031,708,866 (0.4)
Nakuru 539,467,542 577,783,622 (38,316,080) 21.0
Nandi 62,441,736 86,304,302 (23,862,566) (7.1)
Narok 723,819,271 105,643,418 618,175,853 (38.2)
Nyamira 24,455,364 63,942,193 (39,486,829) 85.4
Nyandarua 150,105,506 138,510,958 11,594,548 (161.5)
Nyeri 223,771,652 241,877,026 (18,105,374) 7.7
Samburu 114,464,721 34,185,427 80,279,294 (8.1)
Siaya 73,582,202 111,949,675 (38,367,473) 70.1
Taita Taveta 89,210,961 62,809,695 26,401,266 (52.1)
Tana River 17,659,711 16,438,554 1,221,157 29.6

2222
CountyOwn LA Revenues [3] LA Difference
[1] Actual [2] Predicted Amount Rate (%)
Tharaka Nithi 50,906,966 26,604,209 24,302,757 6.9
Trans Nzoia 109,746,475 105,006,205 4,740,270 47.7
Turkana 20,920,015 38,076,582 (17,156,567) 4.3
Uasin Gishu 321,683,127 267,679,252 54,003,875 (82.0)
Vihiga 48,456,792 56,337,447 (7,880,655) 16.8
Wajir 22,167,299 29,303,866 (7,136,567) (16.3)
West Pokot 23,825,486 35,200,118 (11,374,632) (32.2)
Totals 12,417,997,734 12,417,998,824
Source: Government of Kenya (2010); author’s computations
3.4 - Modelling CRA Resources
The regression model of Section 3.3 enabled the prediction of the comparative revenue capacities of the 47 counties, enabling the distinction of those that are underperforming given their socio-economic characteristics, from those performing above expectations. The same principle can be applied to CRA’s proposed county revenue shares to assess its fairness given county characteristics. The first evaluation is to determine the correlation between actual county revenues and CRA resources, which are reported in CRA (2012: 34). From Appendix Table A–3.3, the correlation coefficient between the two datasets is +0.554, meaning that every unit rise in own revenue of a county attracts an increase in CRA resources of 55%. Further, the significance level of the correlation coefficient confirms that the relationship is not accidental. As in the previous analysis of own revenues, county level budget spending is unfortunately missing from the following analysis of CRA resources.
Applying regression method to the CRA resources allows us to further assess fairness in county shares, which are listed in column [1] of Table 3.5. The method applied was as described in Section 3.3, and the regression results are reported in Appendix Table A–3.6. Through this process, the significant predictor with the highest explanatory power of CRA resources was the number of poor people, with a unit increase being associated with a 20% increase in CRA resources. This is an interesting coincidence, as poverty in the CRA formula had a weight of 20%. A unit increase in urban populations raised CRA resources by 30%, while male literacy raised it by 20%. Rising population density and numbers of households with improved sanitation lowered CRA resources by 8% and 19%, respectively. The fall in CRA resources in response to rising population density and access to sanitation both suggest attention to the sparsely-populated ASALs, which have very poor or non-existent sanitation facilities. This model seems to confirm CRA’s disregard for finance-based indicators, such as levels of previous public spending or levels of own revenue capacity as a basis for sharing resources. The predicted county allocations are presented in column [2] of Table 3.5, the variations between CRA ‘actuals’ and ‘predicted’ being presented in column [3]. The most under-resourced counties included Machakos (29%), Taita Taveta (23.9%) and Vihiga (23.5%). The ‘winners’ were Nairobi (29%), Mandera (22.2%) and Kakamega (21.6%). The variance was 5% or less for about 14 counties. While the rates of discrepancy are modest on the whole, the amounts of monies involved are large, since the figures are in billions of Kenyan shillings. One way of placing the allocations in perspective is to consider that Nairobi’s over-allocation of Ksh 3 billion is one-seventh of the total CDF allocation for 2012/13. Conversely, Machakos’ under-allocation is about 50% of the aggregate Ksh 3.2 billion allocated to its 6 parliamentary constituencies since CDF was launched during 2003/04!

2323
CountyCRA Resources [3] CRA Difference
[1] Actual [2] Predicted Amount Rate (%)
Baringo 3,470 3,853 (383) (11.0)
Bomet 3,678 4,375 (697) (19.0)
Bungoma 6,604 6,397 207 3.1
Busia 3,646 3,714 (68) (1.9)
Elgeyo-Marakwet 2,556 2,925 (369) (14.4)
Embu 2,999 2,910 89 3.0
Garissa 4,510 4,411 99 2.2
Homa Bay 4,403 4,035 368 8.4
Isiolo 2,389 2,300 89 3.7
Kajiado 3,448 3,952 (504) (14.6)
Kakamega 6,961 5,458 1,503 21.6
Kericho 3,520 3,956 (436) (12.4)
Kiambu 5,832 6,338 (506) (8.7)
Kilifi 5,815 6,323 (508) (8.7)
Kirinyaga 2,765 2,482 283 10.2
Kisii 5,543 5,823 (280) (5.0)
Kisumu 4,440 4,776 (336) (7.6)
Kitui 5,679 6,668 (989) (17.4)
Kwale 4,005 4,830 (825) (20.6)
Laikipia 2,696 2,922 (226) (8.4)
Lamu 1,603 1,493 110 6.8
Machakos 5,289 6,842 (1,553) (29.4)
Makueni 4,665 4,924 (259) (5.6)
Mandera 6,998 5,448 1,550 22.2
Marsabit 4,055 4,319 (264) (6.5)
Meru 5,074 4,848 226 4.5
Migori 4,561 4,776 (215) (4.7)
Mombasa 4,062 4,364 (302) (7.4)
Murang'a 4,185 3,594 591 14.1
Nairobi 10,156 7,198 2,958 29.1
Nakuru 6,342 6,312 30 0.5
Nandi 3,716 3,951 (235) (6.3)
Narok 4,132 3,492 640 15.5
Nyamira 3,247 3,643 (396) (12.2)
Nyandarua 3,366 3,570 (204) (6.1)
Nyeri 3,477 3,474 3 0.1
Samburu 2,776 2,782 (6) (0.2)
Table 3.5: Proposed CRA resources 2012/13 (Ksh millions)

2424
CountyCRA Resources [3] CRA Difference
[1] Actual [2] Predicted Amount Rate (%)
Siaya 3,904 3,749 155 4.0
Taita Taveta 2,586 3,203 (617) (23.9)
Tana River 3,114 3,039 75 2.4
Tharaka Nithi 2,452 2,181 271 11.1
Trans Nzoia 3,985 4,096 (111) (2.8)
Turkana 8,189 5,762 2,427 29.6
Uasin Gishu 4,056 4,426 (370) (9.1)
Vihiga 3,025 3,675 (650) (21.5)
Wajir 5,652 5,112 540 9.6
West Pokot 3,371 3,323 48 1.4
Totals 203,000 202,043 954 0.5
Source: Commission on Revenue Allocation (2012: 34) and Author’s computations
It is worth repeating that a different model using different characteristics on the product of the CRA formula would arrive at different resource shares. The fact, for example, that ‘own revenue capacity’ has a relatively low weight in the CRA formula is seemingly confirmed by the fact that the various revenue or finance-based indicators that were entered into our model turned out to be non-significant. As the country gets devolution underway, and in light of some projected county resource shortfall anticipated by the work of the Parliamentary Budget Office (Government of Kenya, 2012b: 32-33), comparative own revenue capacities should play a more significant role in CRA resource sharing.

25
4. Gender in the Kenyan Context
Kenya acceded to the gender equality platform in the context of its commitments to UN resolutions, such as the Universal Declaration of Human Rights and CEDAW. It also espoused
the 1966 covenants on civil, political, economic, social and cultural rights. By 1985, the country was at the heart of gender equality initiatives, hosting the formulation of the Nairobi Forward Looking Strategy for the advancement of women, and was at forefront of continental preparations for the 1994 International Conference on Population and Development and the 1995 Beijing Platform for Action, a motion adopted by Parliament in 1996.
As early as 1976, the government had established a Women’s Bureau in the Ministry of Culture and Social Services, alongside the Community-Based Nutrition Programme (Government of Kenya, 2000: 2). The National Gender Policy of 2000 lists the functions and responsibilities of the Bureau to include: “policy formulation, implementation and evaluation; coordination of all government initiatives and programmes for women; collection and analysis of data and information required for the design, monitoring and evaluation of policies and projects for women; and support to and liaison with non-government organization (NGO) projects and women’s organizations.” Since the Bureau’s inception, the Policy lists its activities to include:
development of a training manual for sensitization of stakeholders on gender issues; strengthening the capacity of women groups for socio-economic development; establishment and strengthening of Units of Gender Issues in key sectors; establishment of a gender disaggregated database; setting up a resource centre; conducting gender-based studies; developing and disseminating the National Action Plan for Implementation of the Beijing
Declaration and Platform for Action; participating in review and formulation of sectoral policies; and participating in the task force set up by the government to review laws relating to women.
Yet, the lukewarm treatment of gender matters in the highly patriarchal Kenyan society is reflected in the fact that it was not until the year 2000, a full 14 years after the Bureau’s establishment, that the government developed the National Gender Policy. Ouma and Maina (2010) lament that it would be a further eight years before an action plan would be developed for the policy that had been anticipated to empower women through greater efficiency in resource allocation. The policy lamented the manner in which traditional gender roles and responsibilities had undermined women’s participation “in strategic areas and positions of power and influence,” and pointed to the need for quality gender disaggregated data for efficient and productive gender-sensitive planning and programming. While championing Kenyan men and women’s equality before the law, and in

2626
accessing economic and employment opportunities, the policy sought to attain gender parity in education access, retention, transition and performance. While emphasizing a genderized approach to health care management, it also sought to remove obstacles to women’s access to and control of socio-economic assets, increase their participation in politics, decision-making, the media and communications sectors.
Yet, in a review of Kenya’s Vision 2030, Githinji (2010) points to persisting gender neutrality, which keep women in lower paying jobs even as their share of the labour force has increased from 18% in 1966 to 30% in 2006, and a likely 55% by 2016. While highlighting many areas of women’s disadvantage, Wanjala and Odongo (2010) note that women constitute a mere 23% of members of Kenyan cooperative societies, which are known to provide easier access to credit. They also note the gender neutrality of the Special National Accounts framework of 1993, as well as the Social Accounting Matrices of 1997 and 2003, meaning that specific attention is not being paid to the differences in the nature of men’s and women’s contribution to national output (Wanjala and Odongo, 2010: 54). The persisting poor status of women in Kenya is captured in various global gender measures. The Global Gender Gap Report for 2011 has Lesotho, a country presumed to be quite traditionalist, at number 9 globally with a score of 0.7666 compared to Iceland’s position 1 with a score of 0.8530 (Hausmann et al., 2011). While Lesotho improved from position 43 in 2006, Kenya is at 99 with a score of 0.6493, having been 73rd. The (Mo) Ibrahim Index of African Governance 2012 places Kenya at position 24 with a score of 52.9, having dropped from 60.4 in 2008, which compares badly with leading country South Africa’s score of 78.1, never having dropped below 60 for the whole decade.33
The interest of the current study is on the scope for women’s improved participation in the management of community affairs, such as in decentralized funds, including the upcoming devolved funds in county governments. On the basis of history, the prospects do not look good, meaning there is need for much awareness creation and capacity building. For example, getting women into enterprise is likely to create their greater awareness of how infrastructure investment resources are spent; yet, Wanjala and Odongo (2010: 59) drew the following conclusions regarding Kenyan women entrepreneurship:
“Women’s businesses generally start small, grow slowly and end smaller than men-owned enterprises. Women locate more in the home, rely more on less skilled and unpaid workers, and are less likely to diversify into other activities. In addition, women’s activities tend to be less remunerative than men’s. The participation of women is also low in sectors that require high capital requirements (especially in manufacturing), where they have been found to earn only about 32 per cent of what their male counterparts earn.”
These conclusions echo the findings of SID (2007), which found that women participate in ‘humble roles’ given their slate of other responsibilities. Yet, gender inequity is not perpetuated simply by women’s weak entrepreneurial acumen. Wanjala and Odongo (2010: 51) paint a situation that is akin to a conspiracy not to create the context within which Kenya can aspire for gender equity, leading to eventual gender equality, in noting that:
“Despite the existence of the policies, legislative reforms, plans and programmes, gender disparities persist in legal, social, economic and political levels of decision making, as well as access to and control of resources, opportunities and benefits. The Plan of Action (Government of Kenya, 2008) attributes the slow implementation
33. http://www.moibrahimfoundation.org/downloads/2012-IIAG-data-report.pdf, accessed on 15/10/2012.

2727
process mainly to gaps in the laws, delayed enactment of gender-related legislation and lack of comprehensiveness in the content of some laws. Other challenges include weak coordination, harmonization and networking among actors at all levels; inadequate resources (human and financial); limited technical capacity; and capacity consistency resulting from deployment/transfers. Socio-cultural issues, misinterpretation of the concept of gender as applying only to women rather than to women, men, boys and girls, and a lack of gender sensitivity in the development of core sector indicators and targets are also well entrenched barriers. Finally, despite the ambition of the gender action plan, sector and national budgetary allocations are lacking to support targeted gender activities at all levels.”
Another Kenyan gender audit ascribed the persisting gender inequalities to the continuing strength of neo-patrimonial relations that foster corruption networks that exclude women (World Bank, 2003: 37-41). Household level patriarchy translates into acquiescence by women at the national level, which might explain why Kenyan women remain marginalized in national decision-making, with a 10% share of parliamentary seats compared to a range of between 35% and 56% for neighbours such as Mozambique, South Africa, Tanzania, Uganda and Rwanda. The audit noted that Kenyan women have responded to their exclusion by forming their exclusive organizations focusing on poverty and basic survival. Since support from such groups is, however, significant for prospective local and national politicians, the groups are now offering an entry point for women into national decision making. The next sections consider two contexts of community and gender participation in managing decentralized funds and other resources.
4.1 - Gender Participation in Decentralized Funds Management
During 2009, a consortium of non-government organizations (NGOs) led by the Kenya Human Rights Commission (KHRC) and the Social and Public Accountability Network (SPAN) evaluated the management of various existing decentralized funds with the objective of using the output to inform the legal and institutional framework reforms that would come in the wake of the finalization of the constitution review process. As with an earlier study of decentralized funds by the Kenya Institute for Public Policy Research and Analysis (KIPPRA), reported in KIPPRA (2006), KHRC/SPAN (2010) covered LATF, CDF, RMLF, Free Primary Education (FPE), Secondary Education Bursary Fund (SEBF), Constituency AIDS Control Committee (CACC), and Water Services Trust Fund (WSTF). It is useful to clarify that except for CDF and LATF, the other funds are merely decentralized funds whose use is pre-determined from the national office, the sub-national managers being mere conduits of expenditure. CDF and LATF are devolved to the extent that what they are spent on is decided by sub-national frameworks, respectively the Constituency Fund Executive and the Local Authority Service Delivery Action Plan (LASDAP).
While the KIPPRA study had covered eight administrative districts, the KHRC/SPAN study covered a single parliamentary constituency in each of the eight provinces, including: Baringo Central (Rift Valley), Isiolo North (Eastern), Kisumu East (Nyanza), Makadara (Nairobi), Mandera West (North Eastern), Mumias (Western), Mwatate (Coast), and Nyeri Town (Central). The findings generated through a participatory methodological approach are summarized in Table 4.1. KIPPRA (2006) had been keen to ensure gender balance among respondents, but did not explore gender differences in awareness of the various funds. However, KHRC/SPAN (2010) was keen on gender differentiation, which allows the present report to use its findings as a gauge for genderized participation in the management of sub-national resources, such as will be provided under devolution.

2828
While the highest level of awareness in KIPPRA (2006) had been decisively for FPE, the KHRC/SPAN study found awareness to be comparable between CDF and FPE with a mean of 91%, but there was a wide range across the various funds, the lowest being that for WSTF at 30% (Table 4.1). The latter study also found that awareness was on average equal across the gender divide, the highest variance across individual funds being RMLF’s 8 percentage points in favour of males. The highest level of awareness was for CDF. Involvement in project identification was generally low with an average of 24% across all the funds and minimal gender variance. However, the picture for individual funds is interesting. The very low participation rate in identifying LATF projects is disturbing because it has a very elaborate mandatory participatory framework for this, LASDAP.34 The gender differentials in RMLF and WSTF can be justified on roads being a male domain, while water is arguably a female one; but the low rates of participation in identifying priorities is disturbing in these two sectors crucial for rural development.
Table 4.1: Levels of community awareness and participation in decentralized funds (%)
Kenya’s devolution frameworks envisage the participatory production of an integrated county development plan, which will be the basis of all development interventions in respective counties. The plans’ implementation, monitoring and evaluation should be equally open to citizen participation. Against those backdrops, Table 4.1 paints a very bleak picture of the 2009 status of participation in these aspects of project management, with an average 13% of respondents acknowledging citizen
LATF (1999)
CDF (2003)
RMLF (1994)
FPE (2003)
Bursary (1994)
CACC (1999)
WSTF (2002) Average
Awareness of the existence of the fund
F 54.0 93.6 44.6 89.6 84.7 71.3 32.2 67.1
M 57.4 90.2 52.5 93.4 86.9 72.1 26.2 68.4
Citizens involved in project identification
F 21.3 38.6 8.9 33.2 29.2 23.8 6.9 23.1
M 19.7 45.9 11.5 32.8 34.4 29.5 3.3 25.3
Citizens involved in planning and budgeting
F 9.9 20.3 3.0 22.8 16.8 11.4 4.0 12.6
M 9.8 29.5 4.9 21.3 23.0 18.0 1.6 15.4
Citizens involved in implementation
F 10.4 26.7 6.4 26.7 20.3 16.8 4.5 16.0
M 13.1 36.1 13.1 41.0 36.1 18.0 3.3 23.0
Citizens involved in monitoring
F 12.4 24.8 5.4 24.3 21.3 12.9 4.0 15.0
M 13.1 31.1 8.2 26.2 29.5 14.8 3.3 18.0
Awareness of management guidelines
F 26.2 48.0 17.8 53.0 44.6 32.7 12.4 33.5
M 31.1 52.5 19.7 60.7 50.8 32.8 13.1 37.2
Citizens involved in management
F 37.6 64.9 20.8 54.0 50.5 38.1 15.3 40.2
M 42.6 71.5 32.8 75.4 67.2 45.9 16.4 50.3
Respondent participated in management
F 9.9 15.8 5.0 20.3 69.3 9.9 5.9 19.4
M 13.1 23.9 4.9 26.2 29.5 9.8 4.9 16.0
Fund focus on community priorities
F 34.4 76.7 18.8 78.2 12.9 44.1 15.3 40.1
M 19.7 67.2 50.8 80.3 26.2 8.2 20.9 39.0
Source: KHRC/SPAN (2010)
34. See a summary of its workings at http://web.thikamunicipal.com/index.php/planning-a-budget/lasdap, accessed on 10/08/2012.

2929
participation in planning and budgeting, 20% in implementation and 17% in monitoring. The low LATF rates underscore failed adherence to the LASDAP guidelines. While low citizen involvement in these activities is usually attributed to ignorance of their management frameworks, sometimes the problem is citizen apathy. For example, awareness of the management guidelines for FPE and secondary bursary funds is quite substantial at an average 56% and 47%, respectively, yet the average participation in the various activities is well below 30%.
KHRC/SPAN (2010) does not provide a sample of its survey instrument, which would have been useful in clarifying the ‘citizen involvement in management’, whose rate are in instances so much higher than the ones for the various activities listed above, such as the average 67% and 65% rates for CDF and FPE, respectively. However, the respondents’ personal rates of involvement in project management were modest, consistent with their perceptions of citizen involvement in the various project management stages. While on average females interestingly outdo the males in respondent participation in management – respectively 19.4% against 16%, this difference is actually driven by the females’ dominant participation in the management of secondary bursary funds. Finally, a modest 40% of respondents across the gender divide found the funds to focus on local priorities – unsurprising given the low rates of involvement in project identification, planning, budgeting, implementation and monitoring.
4.2 - Gender Sensitivity of CDF Spending
Time-use studies provide evidence of the central place in households played by women, especially in rural areas. For example, women spend 23% more time on crops than men do, about 40 hours collecting water, and generally work 12 more hours per week than men do (Wanjala and Odongo, 2010: 57). Among the reasons behind the interest in women’s participation in decentralized funds management is that because budget policy and spending is never gender neutral (SID, 2007: 18-9), they might influence investment in projects that reduce their reproductive burdens. Thus, education projects would enhance enlightenment, especially of the girl child, with attendant welfare benefits. Health sector projects would reduce morbidity and health care seeking costs, allowing women more time for other things, and indeed for some leisure. Water projects would also reduce the risks of water borne diseases, and time spent in fetching water. However, SID (2007: 21) emphasizes that not all spending targeting women is gender-inequality-reducing, unless expenditure design is based on gender disaggregated data.
This report, therefore, considered the pattern of sector spending of CDF as a proxy for the pattern of spending of decentralized funds in general. CDF is preferred to LATF because it is a larger budget and targets a constituency compared to an LA ward for the latter devolved fund. Additionally, CDF spending is multi-sectoral, unlike the other funds of Table 4.1, which are all function-exclusive. The CDF regulations provide spending ceilings for certain areas, amounting to a total of 32% of all allocations. Bursary spending is capped at 15%, and 5% is reserved for emergencies. Office administration and recurrent spending are each capped at 3%, while monitoring and evaluation (M&E), sports activities and environment activities are each capped at 2%. Table 4.2 provides a summary from the national CDF secretariat of the sector distribution of spending across the whole country for the CDF years 2003/04 to 2009/10. Spending under the non-discretionary categories fell below the ceiling at 24.3%. Of the discretionary spending, the education sector was the greatest beneficiary with 33.9% on infrastructure, and a further 12.3% on bursaries, making a grand total of 46.2% for the sector. Interestingly, as with the national budget’s performance with respect to the

3030
Abuja Declaration, health spending was a small 6.5%.35 The modest share of water spending, at 11.5%, is also surprising for a country whose land area is dominated by ASALs.
Table 4.2: Sectoral CDF funding 2003/04 to 2009/10
The focus of 64.2% of all CDF spending in 2009/10 on the social sector (education, health, water) could be lightening women’s reproductive burdens. Additionally, spending on roads could also lighten their burdens as it could improve transport communications, especially in rural areas, making it easier for them to get to markets and hospitals, for example. Yet, a lot more information than the table provides is necessary to draw such conclusions. SID (2007: 62) warns that gender responsive budgeting could be by chance rather than design if it is not based on a sound gender analysis. The regional distribution of such spending is important, whether the targeted projects bring communities out of basic want, or whether they merely diversify existing opportunities. Secondly, there is much evidence of under-utilization and non-use of CDF structures: The Health Rights Advocacy Forum - HERAF (2011: 35) reports that poor consultation between CDF committees and sector specialists led to poor needs assessments and prioritization, such that by 2008/09, some 700 out of 1,000 CDF facilities remained idle. A study in Bondo District also found that because of piecemeal allocations across 12 health infrastructure projects, none had been completed by 2006, meaning the people of Bondo and Rarieda constituencies had yet to benefit from CDF health spending (Nyanjom, 2007). Further, education sector spending highlights the need for a gendered benefit analysis. Constituencies in North Eastern Province spend an average 70% of their CDF resources on education, with relatively modest gains for females; the average 1990-2003 primary school gross enrolment rate for males was 29.3% compared to 15.7% for females (Achoka et al., 2007: 280).
4.3 - Improving Transparency and Accountability in Management
A third approach to evaluating gender and participation considered the extent to which women are represented in grassroots project committees and whether their presence influences the quality of management. The experiences of the National Taxpayers Association (NTA) illustrate the need for perseverance and flexibility in the pursuit of transparent and accountable public resource management. The NTA champions citizen awareness of the right to quality services, obligation to pay taxes, and ways to demand for and get accountability from government service providers and devolved fund managers. It has been developing citizen score cards for the social sector and
Investment Sector Percentage share
Education – infrastructure 33.9
Education – bursaries 12.3
Health 6.5
Water 11.5
Roads and bridges 6.2
Security 4.0
Agriculture 1.3
Others (M&E); emergency; recurrent spending; environment; sports, etc) 24.3
Total 100.0
Source: http://www.cdf.go.ke/about-cdf, accessed on 20/8/2012
35. The Declaration of 2000 committed African Union governments to raising their public health spending to 15% of national public spending. As with many African countries, Kenya has never attained this target, its current rate being 7%.

3131
decentralized funds. While NTA had targeted training 12,000 schools on citizens’ participation in public expenditure reviews beginning 2008, Nzuma (2011: 13) reports that only 8,000 schools had been covered by the time of a mid-term review. During the period, NTA had only received 3,286 returns, a major impediment being the antagonistic attitude of the Kenya National Union of Teachers, which discouraged ministry officials from collecting such returns. In Nyanza Province, for instance, 2,683 primary schools were trained, with a forms return rate of a mere 28%. While NTA surpassed its target of establishing 50 Citizen Action Groups, managing 57 with 1,016 members, weak accountability has meant there have been a mere six demonstrations, suggesting the need for more training (Nzuma, 2011: 17). The call centres established in Western Province with support from the provincial administration, and the road shows, have been vibrant. However, women’s participation in activities has been low. While 50% gender share was attained for the Constituency Monitoring Committees (CMCs) that oversee the CDF executive committees, women participation in action groups was lower at 35% (Nzuma, 2011: 29). Low participation is also reported for people with disabilities and people affected by HIV/AIDS. The mid-term review noted that, initially, the parliamentarians dismissed the CMCs and their Citizen Report Cards as evidence of vendetta. However, the parliamentarians’ attitudes have changed after reading the reports, with several of them actually participating in the CMC’s activities (Nzuma, 2011: 21).
Table 4.3 provides a sample of NTA evaluation of the activities of CDF committees for 2006/07 and 2007/08. For the latter fiscal year, for example, NTA established that Ksh 444 million had either been badly used, wasted, or was unaccounted for. While this figure was a mere 4.5% of that year’s total allocations, the table shows that the poorest performing constituency, Makadara’s rate was 82% for 2006/07 and 65% for 2007/08. The table also shows little relative consistency in accountability across the 17 constituencies; for while Kieni was best in the initial year, it dropped to position 7. However, the rate of mismanagement was quite consistent for some constituencies – Rarieda, Kaloleni and Kangema, suggesting there might be a capacity constraint rather than mischief. Whatever the explanation, there is little information in the public domain that mismanagement of public resources is ever punished, meaning there is no deterrence against it.
Table 4.3: National Taxpayers’ Association CDF audit summary, 2006/07 and 2007/08
2007/08 Average Performance Women on CDF BoardPosition Constituency Rate Rate Position Rate Position
1 Kieni 11.3 17.4 7 14.4 1 1 – Treasurer
2 Mumias 12.1 18.2 9 15.2 2 1 – General
3 Bahari 12.6 18.0 8 15.3 3 1 – NGO representative
4 Kaloleni 13.7 11.9 2 12.8 4 1 - Secretary
5 Rarieda 16.5 16.3 4 16.4 5 0
6 Bondo 18.5 27.6 11 23.1 10 1 – General
7 Matungu 20.8 16.9 6 18.9 7 2 – Secretary; General
8 Amagoro 22.2 13.6 3 17.9 6 1 – Councillor
9 Kangema 24.7 27.4 10 26.1 11 0
10 Mathira 24.8 84.7 17 54.7 16 1 – General

3232
2007/08 Average Performance Women on
CDF BoardPosition Constituency Rate Rate Position Rate Position
11 Gem 29.3 16.6 5 23.0 9 1 – Religious representative
12 Kamukunji 30.1 69.0 16 49.6 14 1 – Religious representative
13 Ganze 34.7 51.1 14 42.9 12 0
14 Budalangi 36.0 2.8 1 19.4 8 0
15 Embakasi 36.3 56.0 15 46.2 13 2 – General
16 Aldai 62.0 44.7 12 53.4 15 1 – NGO rep
17 Makadara 82.1 48.1 13 65.1 17 1 - General
Average 27.3 26.4 30.3
Source: http://www.nta.or.ke/reports/crc/Nairobi/Advert.pdf
The underlying interest in women’s greater participation in managing decentralized funds is driven by the fact that it is their right as an end in itself, but also as a means of their determining the shape of service delivery in their communities. This instrumentalist concern incorporates a hypothesis that women’s presence in project committees might improve the management of financial and other resources. This led to an attempt by this study to map women’s presence on CDF executive committees and the levels of transparency in the management of the funds of those committees. The Constituency Development Fund Act reserves two seats each on the committee of at most 16 for men’s and women’s representatives, meaning any of the other 12 members could be women.36 Among the 12, however, the CDF patron, the incumbent Member of Parliament (MP) would have discretion over the sex of 10, since in theory the MP does not determine who the local district officer becomes, or who the NGOs and religious organizations nominate to represent them. The last column of Table 4.3 lists the number of women occupying the discretionary slots on the executive committees of the constituencies covered by the NTA evaluation.37 The most remarkable is that a mere 15 women sat across the committees of the 17 constituencies. Three (3) constituencies had no woman at all on their committee, and only two (2) constituencies had more than one woman on board. The further interest in which positions the women hold on the committee shows that three women – two secretaries of the committee and a treasurer – held fundamentally influential positions. While NTA found their committees to be in the upper half of the good management league, this is not enough to link gender with performance, since one committee without any woman – Rarieda – also performed quite commendably. Further, the only constituency in the list with a woman MP, Aldai, performed poorly, but also had only one woman on its committee, holding a general position. Thus, it is not possible to conclude on the influence of women on the management of CDF resources.
36. The Act provides for membership as follows: the elected Member of Parliament; two councillors; one District Officer; two persons representing religious organizations; a representative of the youth; a nominee of active NGOs; and a maximum of three other persons to make at most 15. The national CDF Board seconds an ex-officio delegate.
37. The NTA evaluation bestrides the first and second CDF Parliaments, the cut off having been December 2007. The national CDF Secretariat could not provide the CDF committees between 2003 and 2007. The lists reviewed here are therefore for the current CDF committees alone

33
5. Discussion
Political will for reforms in Kenya is often weak, especially where the beneficiaries of the outgoing order are in charge. So it has been with gender mainstreaming, and looks to be with devolution.
Gender mainstreaming has been undermined by the place of patriarchy in society, which even causes women to feel that their subordination to men keeps with natural order. Yet, the arguments for gender equity – which constitutes affirmative action towards gender equality – are straightforward and are nested in the Constitution and other legislative and policy frameworks espoused by the government. The Bill of Rights aspires for the full exploitation of all individuals’ potentials, with human dignity, equality, equity and freedom. On devolution, the unequal development evident in Figure 3.1 is often attributed by those at the top of the pile – the World Bank’s (2010) ‘leading areas’ – to relative effort, the lagging areas being seen to be the product of ‘laziness’. Resistance to devolution thus arises from a perception that the reform requires hard working Kenyan counties to subsidize the lazy non-performing ones. Yet, the central role of agro-ecological differentiation to the patterns of colonial and post-colonial public – and consequently, private – investment is indisputable. Colonial social and physical infrastructure investment focused on the more agriculturally productive AEZs to facilitate European settlement and, critically, to ensure that the deprived AEZs remained a labour reserve.38 Infrastructure significantly opens opportunities for growth, and also for livelihoods diversification (World Bank, 2010), which illustrates wide national disparities.39 While AEZ differentials are natural, infrastructure differentials are the product of government policy and practice, not the variance in individual communities’ attitudes.40
A good understanding of equity, and of the Constitution and related laws that provide for it, is imperative for the success of both gender mainstreaming and devolution. From the onset, it is important to underscore the fact that the espousal of equity should not make any one worse off than they were before. However, its espousal definitely requires affirmative action and positive discrimination – i.e. unequal treatment in favour of lagging areas – to rid society – not of all inequalities (which is impossible), but only – of unjust inequalities. Thus, if nearness to safe water, electricity, or a tarmac road is good for human welfare, then government policy and practice should strive to make such amenities accessible to all citizens. Thus, infrastructure inequalities reported by the World Bank (2010) are unjust – certainly 50 years into independence. The espousal of equity – equal opportunities for enhancing capacities and entitlements41 – is an even more powerful tool for enhancing human – men and women’s – welfare than gender mainstreaming is: for while gender mainstreaming focuses on differences between the sexes, with little attention to differences among
38. Colonial policy barred Africans from running shops to ensure their labour was available for settler agriculture, the only way they could earn money to pay the multiple taxes imposed on them.
39. The study notes that the mean distance to tarmac road in Central Province is 3.8km compared to a mean of 8km for the whole country (excluding Nairobi and North Eastern provinces). The mean distance to water and electricity is 1km in Central Province, compared to respective study sample averages of 5km and 8km.
40. Á qualification is useful here: the high density of physical education and health infrastructure in Central Province is the product of community capabilities, largely through harambee fund raising. However, it is the high density of tarmac roads build by public funds that enable Central Province communities to exploit their good agro-ecological potential to grow and diversify, generating the resources with which to build the education and health infrastructure.
41. Equal opportunity does not mean equal spending. Immunization of children in one community may only require spending on the vaccines and nurse; but in another, it may also be necessary to spend money on civic education for people to realize the value of the intervention.

3434
women or among men, equity focuses on justice for all individuals and regions. Thus, while the attainment of equity will automatically deliver more than the aims of gender mainstreaming, the attainment of the latter alone cannot secure an equitable society. But gender mainstreaming is an important step in the direction of an equitable society.
Kenya’s constitutional and legislative provisions for devolution are true to the theory, principles and international best practices. Yet, the context within which Kenya is transitioning to devolution is not ideal. The constitutional review process was hampered by a weak political will for reform, undermining attention to areas that would have enabled greater preparation for the transition to devolution. Indeed, it is conceivable that the constitution review process would not have been completed were it not for the timeframes imposed by the National Accord that resolved the post-2007 election stand-off. The context is not ideal, amongst other reasons, because of the current extents of unjust inequalities whose resolution require national government interventions, which are now likely to be ignored, or to be left to less capable county governments.42 A better rationalized transition to devolution would require the determination of a basic social and physical welfare status for counties, which the national government strives for within a given timeframe – the Equalization Fund’s “quality (and) level generally enjoyed by the rest of the nation”, after which county governments then take control.43 For example, despite the hype surrounding rural electrification, the service remains out of reach for many Kenyans living beyond the 600 metre radius to the step-down transformer provided at a public facility, such as a school or dispensary.44
There is, therefore, also a strong argument for the sequencing of the transition to devolution, which legislation does provide for under the Transition to Devolved Government Act. Yet, the politicization of devolution is likely to create impatience and acrimony if actual or perceived levels of preparedness – to be determined by Transition Authority (TA) – are emphasized as the basis of transition. The perception is strong of devolution being the key that unshackles sub-national levels from Nairobi’s chains, meaning that any continued subservience to Nairobi (institutions such as TA) will be viewed with suspicion and even hostility. The inherent risk here, and in other areas of the Constitution and related legislation, arises from a persisting poor understanding of the provisions of these important documents. Much will depend on the commitment of the first president under Constitution (2010) to fully implement the document and its policies, legislations and institutions. Borrowing from Article 20(3) (b) on the application of the Bill of Rights, one hopes the incoming president will adopt an interpretation of the Constitution and its appendages that most favours the full implementation of the document. A lot will also depend on the roadmap TA develops into devolved governance.
Much has been made of the Equalization Fund for the marginalized, which CRA has set at Ksh 3 billion, i.e. 0.5% of disposable national revenue. ‘Marginalization’ has yet to be defined,45 yet the extent of inequalities inherent in Figure 3.1’s district distribution suggests that money will be inadequate to bring services to the level generally enjoyed across the country, even if Parliament eventually extends
42. For example, whereas the national government could maximize scale economies in delivering electricity from county A to adjacent counties B and C, a decision under devolution by county B not to prioritize electricity would raise the costs of acquiring the same for county C.
43. Thus, for example, investment in the Thika Superhighway should have been deferred in favour of the development of a tarmacked network in northern Kenya, linking Garissa, Wajir, El Wak, Mandera, Moyale and Marsabit. Such a road network is critical for these areas’ commercialization of their one known resource, livestock.
44. Consequently, prospective consumers in many communities close to or below the poverty line, which live outside that radius, are required to purchase an unaffordable Ksh 300,000 step-down transformer.
45. CRA (2012: 17) reports fieldwork in which it collected grassroots views on who the marginalized are, but does not present the findings from the data collected.

3535
the life of the Fund as provided by Article 204 (7). The equity insensitive allocation by the Fund is reminiscent of that of CDF, which only shared 25% of its resources on the basis of poverty, allowing the 75% shared equally across the 210 constituencies to perpetuate and/or widen the gap between leading and lagging areas.46
The Constitution emphasizes equity, which requires unequals to be treated appropriately unequally (vertical equity) and equals to be treated equally (horizontal equity). ‘Treatment’ – service delivery – requires sound data on need for and costs of services; and the principles of gender mainstreaming make a beginning is assessing that need, in requiring that budgeting be undertaken through a gendered lens. The most recent nationwide review of welfare is contained in the national census of 2009, whose subject coverage is not as broad as that of the 2005/06 KIHBS. Yet, neither of these exercises was designed with devolution in mind, meaning they do not provide all the data necessary for planning the seamless transition to devolution. The aggregation of welfare data at the provincial, district or county level significantly hides wide welfare disparities, leading to policies and interventions biased against the least well-off.47 The health sector has used ‘small area’ analyses to overcome such biases (Smith, 2003), an approach that Kenyan household welfare analyses should increasingly consider. The data constraint is reflected in, for example, the health sector’s concern as they develop the new health policy, with evaluating the quality and soundness of their data on the disease burden and costs of services for efficiency and effectiveness of interventions (Government of Kenya, 2009: 7-8).In spite of such grey areas, CRA has shared resources horizontally as reflected in Table 3.5. In these respects, it is opportune that the Kenya National Bureau of Statistics (KNBS) has recently updated its National Sampling Survey and Evaluation Programme (NASSEP) framework, suggesting an impending household welfare survey that should provide better data on the comparative welfare statuses between and within counties.
As illustrated in Table 3.4, counties will have varied revenue generating capacities because of their varied revenue sources, rates imposed, numbers of people paying and efficiency in collection and management. The current evidence that CRA resources have a weak relationship with county level financial performance indicators is disturbing, as this should be a significant basis for sharing resources (given needs). With time, however, analysis of improved data on need and the costs of service delivery will enable an improved matching of transfers to county level service delivery.48 Meanwhile, however, it is imperative that counties optimize – rather than maximize49 – their own revenue sources and learn from other experiences to ensure efficient management of realized resources. Additionally, as noted in Section 2.2, neutral taxes – such as fees – and regressive taxes hurt the poor more than the rich. Counties should, therefore, be careful with the design of the respective revenue generation frameworks to ensure that their effects and impacts are equitable.
46. Decentralized funds in Kenya have been fundamentally inequitable. For example, RMLF disproportionately rewarded areas in which the government had already built good roads and punished those areas where government had overlooked such development. The award of a blanket Ksh 1,020 per child regardless of household poverty status was also equity insensitive.
47. The 2005/06 survey’s sampling seems questionable: its data’s conclusion that Kajiado is the country’s least poor county suggests a sample that was biased in favour of the Ngong , Kiserian, Ongata Rongai and Kitengela areas, thereby underplaying the extensive consumption poverty among the Maasai pastoralists.
48. Debates persist on the equitable sharing of resources in Britain’s National Health Service nearly seven (7) decades into its existence. These debates offer insights that CRA would do well to appraise itself of.
49. The LATF annual report shows that LAs have had varied own revenue sources, some with a basic 3, others with more than 6. Certainly, in the early stages of devolution, counties will do well to restrict their revenue sources to their capacity to manage these. Additionally, counties should appreciate that the imposition of some levies can deter the inflow of investments.

3636
The evidence of weak community participation in decentralized funds points to an area where immediate capacity building is required if the principle of participation in county governance is to be realized. While LASDAP provides a transparent framework for people participation in identifying projects for LATF funding, the framework has either not been used, or its output has not entirely directed LATF spending. KHRC/SPAN (2010) reported a 68% awareness of decentralized funds (Table 4.1), an arguably weak rate given the loci of these funds literally at the community level, where apparently only 18% of the study sample had participated in the funds’ management. While the Devolved Government Act demands community participation in planning, budgeting, implementation and monitoring, the highest perceived rate of participation in that study was 24% in project identification, that for planning and budgeting being a modest 14%. Additionally, Table 4.1 shows that in all these instances, women’s participation was inferior. The Devolved Government Act rightly provides for participation in the whole project cycle, but does not provide a framework for this. Instead, it is the Urban Areas and Cities Act whose Second Schedule provides a framework that could be customized for county level participation.
As with own revenue generation, the counties will have varied capacities to ‘go it alone’, this statement normally being directed at recruitment of staff about which there remains some ambiguity. Among the attractions of devolution to (ethnic) communities that have perceived themselves to be marginalized in public appointments – a strong feeling in North Eastern Province, for instance – is the expectation that their counties will be able to fill their personnel cadres with their own ethnic people. Yet, this is an area about which there remains ambiguities that the Public Service Commission (PSC) and the Directorate of Personnel Management must resolve urgently. The first concern is with the status of serving public servants in relation to the personnel that incoming county governments will consider necessary given their respective resource constraints, and the fact that counties may outsource service provision. The second concern is with how to ensure that County Public Service Boards attain the (ethnic) face of the county in the face of low qualifications among hitherto marginalized groups. Finally, and as has been the experience under the outgoing dispensation, many professionals detest working in marginalized areas and have only taken up such postings under some duress, such as the PSC requirement that officers work anywhere in the country. Shorn of that PSC imperative, such professionals might require the more marginalized counties to offer extensive inducements to acquire their services. This is a further jeopardy arising from the poorly rationalized context of transition.

37
6. Conclusions and Recommendations
Notwithstanding the various threats to devolution mentioned above, the form of government is good as it enhances participation and democratic deepening, and by emphasizing equity, it
strives to raise the level of human welfare wherever people are in the country. Kenya has consistently suffered the lack of political will for reforms that can improve the welfare of its citizens, such as the 7-year wait for the development of an implementation strategy for the National Gender Policy. However, the Constitution (2010) and the various policy, legal and institutional frameworks arising from it provide an opportunity to demand commitment to reforms. One such reform is the shift from a highly centralized government to a devolved, two-tier one in which neither level is more important than the other. Devolution champions equity and people participation. There is little to show for the long-standing cry for gender equality. Yet, various aspects of the Constitution (2010) now provide an opportunity for gender equality, among the most important being the Bill of Rights and Devolution. The equity imperative in these two constitutional provisions require that all unequal people are treated appropriately unequally, while all equal people are treated equally. The Bill of Rights provides that “men and women have the right to equal treatment (in) opportunities in political, economic, cultural and social spheres.” Thus, the espousal of equity will deliver more than gender mainstreaming, but attention to the latter forms an important first step towards equity.
This report concludes with the following recommendations for a journey that has just began with the race to fully implement the Constitution (2010):
Since the country is on the verge of the first general elections under the new constitution, the national electorate should ensure that the incoming president will be committed to the changes mandated in, or implied by, the constitution. This process should involve the development of materials for extensive civic education so that Kenyans know what the Constitution provides, thereby dispelling the many misconceptions about the document, and improving the capacity for participatory government. In relation to this report, the special areas of civic education focus should include the Bill of Rights, devolution and its related legislation, equity, gender equality, public participation and public finance management. The development of this material could point the way to the design and content of participation frameworks. Such materials should be developed and disseminated by both the Government, including CRA and TA, and non-state actors among whom there are already many initiatives. However, there should be improved coordination of such initiatives to ensure a common interpretation and understanding of existing frameworks, common civic education curricula and syllabi, and an integrated delivery strategy that is synergistic and avoids duplication.
A second area of concern is with what to do about inherited unequal development, which county level resources would be unable to handle in the short to medium term. Since the national government retains such a large share of national revenue, it is imperative that it develops a time bound programme for upgrading the basic social and physical infrastructure
3838
needs upon which counties can then build on. Non-state actors can assist in this task by highlighting the inequalities and the deprivations that exist in the places where they work, which government research or investigations might not easily reach. Related to this, the concept of marginalization and the framework for its management should be defined to enable a re-assessment of the size and role of the Equalization Fund. CRA is already at work on this and should be joined by the Transition Authority (TA). The update of household welfare data is an imperative that the ministries of Finance and Planning (and development partners) should enable KNBS to deliver sooner rather than later.
A further area of concern is with the need to base the planning for devolution on credible data. The need for KNBS to base this data on the small areas – such as the ward or village – cannot be over-emphasized as aggregation at high administration levels, such as a county, hides serious welfare differences within. Much work has been done to develop county information booklets, and these initiatives should extend to painting a picture of the extent of welfare inequalities within counties. Consequently, the government (notably KNBS, CRA and TA) should hasten to undertake a devolution-customized national welfare survey with data collection based on small areas that enables the accurate estimation of need for the services that the county governments will offer. Where service delivery costs are unavailable, CRA should also push sectors for their priority estimation to enable it to arrive at realistic resource sharing between the national and county levels, as well as among and within counties. The disaggregation of data to the sub-county levels will be important for the design of county development plans, and for the monitoring of the implementation of the same by the County Assembly and grassroots communities.
Related to these costs of service delivery is the rationalization of staffing needs and costs. The risk is real of county government emulating the national government, whose budget has hitherto been dominated by personnel emoluments, especially in labour-intensive sectors such as health and education. Policy should also specify the fate of serving officers who the counties might not take up, and the modes of county recruitment. Personnel matters also form a critical area to be covered by the civic education advocated above: communities must be aware of the trade-off between employing ‘our own’ and the needs for the sustained delivery of services of acceptable standards.

39
References
Achoka, J. S. K., Stephen O. Odebero, Julius K. Maiyo and Ndiku J. Mualuko (2007), “Access to basic education in Kenya: Inherent concerns”. Educational Research and Review, Vol. 2 (10): 275-284, October 2007.
Cabral, L. (2011), “Decentralisation in Africa: Scope, motivations and impact on service delivery and poverty.’ Working Paper 20. Futures Agriculture Consortium (March 2011).
Commission on Revenue Allocation - CRA (2012), Recommendations on sharing of revenue raised nationally between the national and county governments for the fiscal year 2012/2013 and among county governments for the fiscal years 2012/13-2014/15. Nairobi: Commission on Revenue Allocation.
Fjeldstad, O.H. (2003), Decentralization and corruption. A review of the literature. Mimeo Utstein Anti-Corruption Resource Centre, Bergen.
Gĩthĩnji wa Mwangi (2010), Growing unequally: An audit of the impact of Kenya’s Vision 2030 growth on equality. In Society for International Development (2010), p. 1–40.
Government of Kenya (1965), Sessional Paper No. 10 of 1965 on African Socialism and its Application to Planning in Kenya. Nairobi: Government Printer.
Government of Kenya (2000), National Gender and Development Policy. Nairobi: Ministry of Gender, Sports, Culture and Social Services (November, 2000).
Government of Kenya (2008), Plan of Action (2008-2012) to Implement the National Policy on Gender and Development. Nairobi: Ministry of Gender, Sports, Culture and Social Services (March 2008).
Government of Kenya (2009), Towards a new health policy for Kenya: A concept note. Nairobi: Ministry of Public Health Services and Ministry of Medical Services.
Government of Kenya (2010), Local Authority Transfer Fund – Annual Report and Review of the Local Authority Financial Performance 2009-2010.
Government of Kenya (2012a), National Health Policy 2013-2025.
Government of Kenya (2012b), The MP’s Budget Watch by The Parliamentary Budget Office Financial Year 2012/13. Nairobi: Parliamentary Service Commission.
Green, E.D. (2008), “Decentralization and conflict in Uganda”. Conflict, Security and Development, 8 (4): 427-450.

4040
Hausman, R., L. Tyson and S. Zahidi (2011), The Global Gender Gap Report 2011: Rankings and Scores. Geneva: World Economic Forum. Available at http://www3.weforum.org/docs/GGGR11/GGGR11_Rankings-Scores.pdf
Health Rights Advocacy Forum - HERAF (2011), Mapping report on decentralized government funding available for health in Kenya and organizations involved in monitoring. Nairobi: Health Rights Advocacy Forum.
Kauzya, J.M. (2007), Political decentralisation in Africa: The experiences of Uganda, Rwanda and South Africa. Discussion Paper, Department of Economics and Social Affairs, UN.
KHRC/SPAN (2010), Harmonization of decentralized development in Kenya: Towards alignment, citizen engagement and accountability. Nairobi: KHRC/SPAN.
KIPPRA (2006), Baseline survey report on decentralized funds in Kenya: A review of Bondo, Bungoma, Nakuru, Machakos, Kirinyaga, Wajir and Mombasa districts, and Nairobi Province. KIPPRA Special Report No. 12. Nairobi: Kenya Institute for Public Policy Research and Analysis.
Kiringai, Jane (2006), Public spending in Kenya: An inequality perspective. In Society for International Development (2006), pp. 11-56.
Mashinya, J. (2007), Participation and devolution in Zimbabwe’s Campfire Programme: Findings from local projects in Mahenye and Nyaminyami. Unpublished thesis of the Faculty of the Graduate School of the University of Maryland, College Park.
Mboga, Hamisi (2009), Understanding the local government system in Kenya: A citizen’s handbook. Nairobi: Institute of Economic Affairs.
Menon, Balakrishan, James Mutero and Simon Macharia (2008), Decentralisation and local government systems in Kenya. International Studies Programme Working Paper 08-32, December 2008.
Ndegwa S.N. (2002), Decentralization in Africa: A stocktaking survey. Africa Region Working Paper Series No. 40.
Nyanjom, Othieno (2007), Kenya’s Constituency Development Fund and the public health sector: Does health care delivery improve? A paper prepared for the EU project, Democratic Governance Support Programme.
Nyanjom, Othieno (2011), Devolution in Kenyan’s new constitution. Constitution Working Paper Series No. 4. Nairobi: Society for International Development.
Nzuma, J. M. (2011), Mid-term review of National Taxpayers Association - Kenya: Improving government service delivery and financial accountability through citizen report cards programme (October 2011).
Omollo, Annette (2011), Policy proposals on citizen participation in devolved governance in Kenya. Nairobi: Institute of Social Accountability.
Ouma, H. and B.N. Maina (2010), Vision 2030, social pillar gender analysis. In Society for International Development (2010), p. 72–138.
Peterson S. (2001). “Financial reform in a devolved African country: Lessons from Ethiopia”. Public Administration and Development, 21: 131–148.

4141
Sen, A. (1980). “Equality of what?”In The Tanner Lecture on Human Values, I, 197-220. Cambridge: Cambridge University Press.
Smith, S.K. (2003), Small-area analysis. In Paul Demeny and Geoffrey McNicoll (Eds), Encyclopedia of Population. Farmington Hills, MI: Macmillan, pages 898-901.
Society for International Development (2006), Readings on Inequality in Kenya: Sectoral dynamics and perspectives. Nairobi: Society for International Development.
Society for International Development (2007), Gender budgeting and CDF: A gender benefit incidence analysis of four constituencies. Nairobi: CDF.
Society for International Development (2010), Kenya’s Vision 2030: An audit from an income and gender inequalities perspective. Nairobi: Society for International Development.
Wanjala, B.M. and M.T. Odongo (2010), Gender and Kenya Vision 2030: An audit of the economic pillar. In Society for International Development (2010), p 41-69.
World Bank (2003), The Kenya strategic country gender assessment. PREM and ESSD - Africa Region, World Bank, October 2003.
World Bank (2010), A bumpy ride to prosperity: Infrastructure for shared growth in Kenya. Nairobi: PREMU Africa Region.

42
Appendices
Baringo Kakamega Laikipia Nyamira
County Council of Baringo County Council of Butere-Mumias County Council of Laikipia County Council of
Nyamira
Town Council of Eldama Ravine
County Council of Kakamega
Municipal Council of Nanyuki Town Council of Nyamira
Municipal Council of Kabarnet
Municipal Council of Kakamega Town Council of Rumuruti Town Council of
Nyansiongo
County Council of Koibatek County Council of Lugari Lamu Nyandarua
Bomet Town Council of Malava County Council of Lamu Municipal Council of Nyahururu
County Council of Bomet Municipal Council of Mumias Machakos County Council of
Nyandarua
Municipal Council of Bomet Kericho Town Council of
Kangundo Town Council of Ol'Kalou
County Council of Bureti Municipal Council of Kericho
Municipal Council of Machakos Nyeri
Town Council of Litein Town Council of Kipkelion County Council of Masaku Municipal Council of Karatina
Town Council of Sotik County Council of Kipsigis Town Council of Matuu County Council of Nyeri
Bungoma Town Council of Londiani Municipal Council of Mavoko Municipal Council of Nyeri
County Council of Bungoma Kiambu Makueni Town Council of Othaya
Municipal Council of Bungoma Town Council of Karuri County Council of
Makueni Samburu
Municipal Council of Kimilili County Council of Kiambu Town Council of Mtito
Andei Town Council of Maralal
Town Council of Malakisi Municipal Council of Kiambu Town Council of Wote County Council of
Samburu
County Council of Mount Elgon Town Council of Kikuyu Mandera Siaya
Town Council of Sirisia Municipal Council of Limuru
County Council of Mandera County Council of Bondo
Municipal Council of Webuye Municipal Council of Ruiru Town Council of Mandera Town Council of Bondo
Table A–3.1: Counties of Kenya and their respective local authorities

4343
Busia County Council of Thika Marsabit County Council of Siaya
County Council of Busia Municipal Council of Thika County Council of Marsabit Municipal Council of Siaya
Municipal Council of Busia Kilifi County Council of Moyale Town Council of Ugunja
Town Council of Funyula County Council of Kilifi Meru Town Council of Ukwala
Town Council of Malaba Town Council of Kilifi Municipal Council of Maua Town Council of Yala
Town Council of Nambale County Council of Malindi County Council of Meru Taita taveta
Town Council of Port Victoria
Municipal Council of Malindi Municipal Council of Meru County Council of
TaitaTaveta
County Council of Teso Town Council of Mariakani County Council of Nyambene Town Council of Taveta
Elgeyo Marakwet Kirinyaga Migori Municipal Council of Voi
Town Council of Iten-Tambach
Municipal Council of Kerugoya Kutus Town Council of Awendo Tana River
County Council of Keiyo County Council of Kirinyaga
Municipal Council of Kehancha
County Council of Tana River
County Council of Marakwet Town Council of Sagana County Council of Migori Tharaka Nithi
Embu Kisii Municipal Council of Migori Town Council of Chogoria
County Council of Embu County Council of Gucha Town Council of Rongo Municipal Council of Chuka
Municipal Council of Embu County Council of Gusii Mombasa County Council of Meru South
County Council of Mbeere Town Council of Keroka Municipal Council of Mombasa County Council of Tharaka
Municipal Council of Runyenjes Municipal Council of Kisii Murang’a Trans Nzoia
Garissa Town Council of Masimba Town Council of Kandara Municipal Council of Kitale
County Council of Garissa Town Council of Nyamache Town Council of Kangema County Council of Nzoia
Municipal Council of Garissa
Town Council of Nyamarambe Town Council of Makuyu Turkana
County Council of Ijara Town Council of Ogembo County Council of Maragwa
Municipal Council of Lodwar
Homa Bay Town Council of Suneka Town Council of Maragwa County Council of Turkana
County Council of Homa Bay Town Council of Tabaka County Council of
Murang'a UasinGishu
Municipal Council of Homa Bay Kisumu Municipal Council of
Murang'aTown Council of Burnt Forest
Town Council of Kendu Bay Town Council of Ahero Nairobi Municipal Council of
Eldoret
Town Council of Mbita Point County Council of Kisumu City Council of Nairobi County Council of Wareng

4444
Town Council of Oyugis Municipal Council of Kisumu Nakuru Vihiga
County Council of Rachuonyo Town Council of Muhoroni Town Council of Molo Town Council of Luanda
County Council of Suba County Council of Nyando Municipal Council of Naivasha County Council of Vihiga
Isiolo Kitui County Council of Nakuru Municipal Council of Vihiga
County Council of Isiolo County Council of Kitui Municipal Council of Nakuru Wajir
Kajiado Municipal Council of Kitui Nandi County Council of Wajir
Town Council of Kajiado County Council of Mwingi Municipal Council of Kapsabet West Pokot
County Council of Olkejuado Town Council of Mwingi County Council of Nandi Town Council of
Chepareria
Kwale Town Council of Nandi-Hills
Municipal Council of Kapenguria
County Council of Kwale Narok County Council of Pokot
Town Council of Kwale County Council of Narok
Town Council of Narok
County Council of Trans Mara

4545
County 2004-05 2005-06 2006-07 2007-08 2008-09 2009-10 Period Average
Baringo 46,138,288 48,146,346 58,942,316 50,047,320 70,690,817 81,067,030 59,172,020
Bomet 72,122,630 62,024,276 67,267,641 68,392,348 84,333,126 114,705,032 78,140,842
Bungoma 100,126,649 79,813,022 122,151,622 134,769,619 172,452,778 195,723,259 134,172,825
Busia 73,508,782 85,566,313 104,792,127 113,966,568 147,487,950 157,891,635 113,868,896
Elgeyo Marakwet
20,864,428 26,220,386 23,985,768 31,754,413 37,380,788 41,893,580 30,349,894
Embu 101,367,828 84,517,825 102,130,793 116,295,222 129,803,701 145,626,138 113,290,251
Garrissa 36,217,342 32,726,869 37,454,944 38,928,207 35,012,846 53,845,246 39,030,909
Homa Bay 72,985,518 75,041,010 89,661,329 83,688,643 88,167,443 108,247,161 86,298,517
Isiolo 120,775,692 148,207,532 145,666,260 144,451,273 101,249,730 136,775,220 132,854,285
Kajiado 71,980,391 78,712,794 108,600,204 147,125,361 186,513,757 227,712,497 136,774,167
Kakamega 148,186,546 146,155,141 166,044,157 164,077,426 186,906,369 228,934,843 173,384,080
Kericho 100,515,517 81,906,800 97,484,062 82,215,277 160,072,022 397,411,555 153,267,539
Kiambu 447,442,268 499,431,679 565,293,516 696,395,166 771,541,639 790,922,719 628,504,498
Kilifi 158,881,935 177,812,811 205,885,354 221,711,259 268,053,740 314,942,336 224,547,906
Kirinyaga 109,965,808 113,172,262 128,171,929 129,233,246 133,160,022 151,810,570 127,585,640
Kisii 94,686,427 102,236,331 108,190,379 129,233,246 155,102,547 190,523,586 129,995,419
Kisumu 229,251,663 294,281,457 287,101,888 250,285,762 314,516,333 381,580,332 292,836,239
Kitui 83,056,423 91,034,812 102,454,051 110,388,303 135,911,150 160,071,598 113,819,390
Kwale 39,415,226 46,551,209 70,680,955 61,329,273 94,135,699 102,312,893 69,070,876
Laikipia 176,782,667 164,607,468 157,656,450 61,329,273 143,246,141 147,661,354 141,880,559
Lamu 11,295,011 12,616,283 13,937,700 13,843,563 19,749,459 19,091,803 15,088,970
Machakos 281,596,716 277,637,356 333,864,029 393,016,637 456,121,025 608,108,084 391,723,975
Makueni 57,494,162 52,021,224 73,848,230 74,573,958 68,823,476 124,814,270 75,262,553
Mandera 21,114,801 23,170,657 32,660,637 34,661,072 33,278,398 45,611,844 31,749,568
Marsabit 30,801,983 25,157,311 22,787,731 29,398,469 52,849,081 55,992,318 36,164,482
Meru 141,675,934 133,419,780 142,974,962 151,614,039 191,440,282 216,989,121 163,019,020
Migori 82,680,317 89,804,535 97,081,202 83,384,484 127,230,857 149,730,483 104,985,313
Mombasa 528,630,346 698,483,407 703,463,102 1,157,488,915 1,151,693,974 1,234,627,941 912,397,948
Murang'a 130,919,344 147,377,655 167,161,890 185,970,628 210,545,111 230,706,451 178,780,180
Nairobi 3,166,686,289 3,801,472,369 4,692,000,000 5,615,400,000 5,942,514,239 6,261,703,987 4,913,296,147
Nakuru 414,181,254 377,838,421 479,312,568 492,953,634 611,538,318 860,981,057 539,467,542
Nandi 51,456,961 51,364,439 59,835,887 55,380,711 69,004,437 87,607,979 62,441,736
Narok 539,370,732 575,881,287 801,068,372 732,077,528 619,539,459 1,074,978,248 723,819,271
Source: Government of Kenya (2010)
Table A–3.2: Actual county own revenues, 2004-05 to 2009-10 (Ksh)

4646
Source: LATF Annual Reports
Nyamira 21,634,652 20,937,076 24,715,871 22,543,176 25,945,477 30,955,934 24,455,364
Nyandarua 107,310,427 135,576,117 162,332,296 149,512,096 171,341,149 174,560,952 150,105,506
Nyeri 178,795,887 189,793,604 225,901,127 227,666,832 236,453,065 284,019,397 223,771,652
Samburu 115,591,009 110,579,764 121,895,775 129,669,197 104,901,913 104,150,669 114,464,721
Siaya 47,322,802 54,004,601 68,341,989 90,610,516 86,124,058 95,089,247 73,582,202
Taita/Taveta
60,707,534 57,643,128 68,536,060 86,424,395 126,175,636 135,779,010 89,210,961
TanaRiver 13,192,176 11,460,370 19,398,966 14,324,713 22,518,878 25,063,165 17,659,711
Tharaka-Nithi
36,717,241 39,774,227 50,437,014 51,308,333 57,443,637 69,761,342 50,906,966
TransNzoia 82,506,193 89,248,030 106,685,372 107,365,522 124,680,180 147,993,551 109,746,475
Turkana 14,239,736 13,574,605 14,343,090 21,215,003 33,928,128 28,219,530 20,920,015
UasinGishu 240,715,138 294,763,267 329,438,205 305,238,819 379,356,778 380,586,553 321,683,127
Vihiga 33,539,961 35,928,364 45,600,191 48,805,916 59,653,629 67,212,693 48,456,792
Wajir 18,588,348 14,850,755 28,165,131 25,254,808 25,580,388 20,564,362 22,167,299
WestPokot 14,002,104 17,259,050 17,035,594 34,130,138 29,073,837 31,452,190 23,825,486
Total 8,747,039,086 9,789,804,025 11,652,438,736 13,169,450,307 14,453,243,467 16,696,010,765 12,417,997,734

4747
[1]
[2]
[3]
[4]
[5]
[6]
[6]
[7]
[8]
[9]
[10]
[11]
[12]
[13]
[1] N
umbe
rs p
oor
1 .
[2] U
rban
pop
ulat
ion
0.36
0(*)
1
0.01
3.
[3] H
ouse
hold
s with
el
ectr
icit
y 0.
268
0.97
9(**
)1
0.06
90.
000
.
[4] H
ouse
hold
s with
im
prov
ed sa
nita
tion
0.26
00.
936(
**)
.948
(**)
1
0.07
70.
000
0.00
0.
[5] A
rabl
e la
nd k
msq
-0.0
90-0
.118
-0.1
08-0
.082
1
0.54
80.
429
0.47
00.
582
.
[6] N
umbe
rs li
tera
te m
ales
0.
662(
**)
0.83
2(**
)0.
789(
**)
0.70
8(**
)-0
.195
1
0.00
00.
000
0.00
00.
000
0.18
8.
[7]
Oth
er so
urce
s of
exte
rnal
LA
reve
nues
0.
270
0.93
5(**
)0.
935(
**)
0.97
6(**
)-0
.103
0.70
4(**
)1
0.06
70.
000
0.00
00.
000
0.49
00.
000
.
[8]
Cen
tral
gov
ernm
ent
gran
ts0.
378(
**)
0.97
8(**
)0.
964(
**)
0.96
5(**
)-0
.128
0.82
6(**
)0.
971(
**)
1
0.00
90.
000
0.00
00.
000
0.39
30.
000
0.00
0.
[9]
CRA
Aug
ust2
012
0.71
3(**
)0.
633(
**)
0.56
5(**
)0.
548(
**)
0.00
50.
721(
**)
0.52
3(**
)0.
622(
**)
1
0.00
00.
000
0.00
00.
000
0.97
30.
000
0.00
00.
000
.
[10]
Tot
al o
wn
reve
nues
0.
275
0.95
4(**
)0.
960(
**)
0.98
5(**
)-0
.083
0.74
0(**
)0.
982(
**)
0.97
6(**
)0.
554(
**)
1
0.06
10.
000
0.00
00.
000
0.58
00.
000
0.00
00.
000
0.00
0.
[11]
Pop
ulat
ion
dens
ity
0.25
20.
812(
**)
0.77
6(**
)0.
744(
**)
-0.1
740.
618(
**)
0.84
5(**
)0.
833(
**)
0.38
2(**
)0.
786(
**)
1
0.08
80.
000
0.00
00.
000
0.24
10.
000
0.00
00.
000
0.00
80.
000
.
[12]
CD
F 20
03/0
4-20
08/0
9 0.
650(
**)
0.35
0(*)
0.29
2(*)
0.21
8-0
.099
0.72
6(**
)0.
224
0.34
8(*)
0.53
3(**
)0.
237
0.20
01
0.00
00.
016
0.04
60.
141
0.50
80.
000
0.13
10.
016
0.00
00.
108
0.17
8.
[13]
CD
F 20
03/0
4-20
12/1
3 0.
635(
**)
0.36
8(*)
0.30
3(*)
0.21
0-0
.065
0.71
9(**
)0.
195
0.34
9(*)
0.59
4(**
)0.
230
0.16
10.
956(
**)
1
0.00
00.
011
0.03
80.
157
0.66
60.
000
0.19
00.
016
0.00
00.
120
0.28
00.
000
.
[14]
Ave
rage
tota
l cou
nty
reve
nues
200
4/05
-20
09/1
0
0.30
6(*)
0.96
5(**
)0.
965(
**)
0.98
4(**
)-0
.097
0.76
8(**
)0.
983(
**)
0.98
8(**
)0.
576(
**)
0.99
8(**
)0.
803(
**)
0.27
00.
264
1
0.03
70.
000
0.00
00.
000
0.51
50.
000
0.00
00.
000
0.00
00.
000
0.00
00.
066
0.07
2.
Tabl
e A–3
.3: C
orre
latio
n m
atri
x
*Cor
rela
tion
is sig
nific
ant a
t the
0.0
5 le
vel (
2-ta
iled)
.
**C
orre
latio
n is
signi
fican
t at t
he 0
.01
leve
l (2-
taile
d).

4848
a Dependent variable: Average own county revenues
Minimum Maximum Mean Std. Deviation
Ave Rev 2004/05 to 2009/10 15088970 4913296147 264212717.74 718080156.059
Numbers poor 21249.00 739770.00 322123.8298 186637.03343
Urban population 20238.00 3138369.00 263823.8723 480302.80286
Households with electricity 826 712859 42334.89 110117.668
Households improved sanitation 19 469830 14351.94 68420.024
Arable land kmsq 56.00 46888.00 3678.2340 7381.45655
Numbers of literate males 39699.00 1370856.00 327305.4468 235605.75478
Other sources of external LA revenues .00 128252962.50 6010537.2532 18922148.51027
Central government grants 24283127.70 2070885387.30 189333159.6596 300189268.87409
CRA August2012 1603.00 10156.00 4319.0851 1645.58472
Total own revenues 66622525.00 22511618226.00 1190875388.8298 3291729447.71305
Population density 4.10 4515.00 402.3340 881.17681
CDF 2003/04-2008/09 346664758.00 1817176889.00 929591458.9362 371821629.28316
CDF 2003/04-2012/13 841743831.00 4698240011.00 2331538355.1064 954501412.87820
Average total county revenues 2004/05-2009/10
40071846.17 7112434497.00 459414588.1723 1031731533.14720
Valid N (listwise) 47
Unstandardized Coefficients
Standardized Coefficients t Sig. Collinearity Statistics
B Std. Error Beta Tolerance VIF
(Constant) -1.234 3.097 -0.398 0.692
Numbers with electricity 0.495 0.114 0.585 4.324 0.000 0.244 4.091
Total main grants 1.075 0.260 0.700 4.141 0.000 0.156 6.395
Numbers urban -0.429 0.197 -0.374 -2.179 0.035 0.152 6.597
R = 0.904 R Squared = 0.817 Adjusted R Squared = 0.803
Table A–3.4: Descriptive statistics
Table A–3.5: Regression model explaining average own county revenues

4949
a Dependent variable: Average own county revenues
Unstandardized Coefficients
Standardized Coefficients t Sig. Collinearity Statistics
B Std. Error Beta Tolerance VIF
(Constant) 14.731 0.610 24.159 0.000
Numbers poor 0.199 0.044 0.411 4.518 0.000 0.472 2.119
Numbers urban 0.307 0.047 0.876 6.492 0.000 0.215 4.659
Population density -0.110 0.022 -0.509 -4.966 0.000 0.372 2.685
Numbers with sanitation -0.081 0.021 -0.480 -3.803 0.000 0.245 4.076
Numbers male literate 0.191 0.075 0.407 2.532 0.015 0.151 6.604
R = 0.921 R Squared = 0.847 Adjusted R Squared = 0.828
Table A–3.6: Regression model explaining CRA resources

5050
Notes


Society for International DevelopmentRegional O�ce for Eastern Africa
Britam Centre, First Floor, Ragati/Mara RoadP O Box 2404 – 00100 Nairobi Kenya