Equipment Reliability - INPO - George Manaskie
30
© Copyright 2017 Institute of Nuclear Power Operations Institute of Nuclear Power Operations Equipment Reliability George E. Manaskie 1
Transcript of Equipment Reliability - INPO - George Manaskie

© Copyright 2017 Institute of Nuclear Power Operations
Institute of Nuclear Power Operations
Equipment Reliability
George E. Manaskie
1

© Copyright 2017 Institute of Nuclear Power Operations
Overview
• INPO Top Priorities
• Continuous Monitoring
• Supplier Participant Advisory Committee
• Scram Initiative
• AC Power Reliability Initiative
• Nuclear Fuel Performance
2

© Copyright 2017 Institute of Nuclear Power Operations
INPO 2017 Top Priorities
• Identify and arrest plant declines quickly
• Recover and sustain performance of lower performing plants
• Improve INPO Organizational Resilience
• Strengthen WANO
• Advance safety and reliability while improving the efficiency of plant processes and programs

© Copyright 2017 Institute of Nuclear Power Operations
Institute of Nuclear Power Operations
Station Continuous Monitoring
4

© Copyright 2017 Institute of Nuclear Power Operations
Continuous Monitoring Update
• Evaluation report establishes performance baseline
• AMI – Area monitoring insight (one for each assessment area)
• CRM – collegial review meetings (internal challenge)
• IPSR – INPO performance summary report (provided to site VP)
• SPM – quarterly site performance report (provided to CNO & CEO)
• PID – performance insight document (final monitoring summary prior to next evaluation)
5

© Copyright 2017 Institute of Nuclear Power Operations
Institute of Nuclear Power Operations
INPO Supplier Participant Advisory Committee (SPAC)
Program

© Copyright 2017 Institute of Nuclear Power Operations
Benefits to Suppliers, Industry, & INPO
• SPAC members benefit by more targeted and collaborative engagement with INPO.
• Member utilities benefit by improved quality of goods and services, as well as improved safety and reliability.
• INPO benefits by improved supplier performance that supports reliability initiatives.

© Copyright 2017 Institute of Nuclear Power Operations
INPO Supplier Program
• Invitations to selected INPO webcasts, workshops, and open meetings, including the annual CEO Conference
• Opportunity to propose qualified staff for assignment to INPO
• Access to INPO member site
• Access to INPO Consolidated Events System (ICES)
• Access to INPO Leadership courses/seminars
• Access to two assistance visits per year
• Participation in bi-annual SPAC meeting

© Copyright 2017 Institute of Nuclear Power Operations
INPO Supplier Activities
• INPO 14-005
• IER L2-15-39
• Parts Quality Best Practice
• INPO Leadership Courses
• ICES Training, Reporting, and Analysis
• Supplier CAP Data
• Delivering the Nuclear Promise
• Supply Chain Industry Meeting
• Next Steps (2017)

© 2016 Rolls-Royce plc and/or its subsidiaries
Trusted to deliver excellence
Industry Continuous Improvement - Process Flow
10
INPO
Utility Executive Communication
Utility Assessment
Utility Data (ICES)
Supplier Trends
Supplier Executive Communication
Generic Utility
Trends
Generic Supplier
Trends
Four Key SPAC Areas1. Craft 2. Engineering3. Material4. Other

© 2016 Rolls-Royce plc and/or its subsidiaries
Trusted to deliver excellence
Where INPO Takes the Lead
11
Key INPO Inputs
1. Create Working Groups for the key SPAC areas (quarterly meetings)
2. INPO develops trend analytics
3. Provide candid input to solving problems, agree on resolution plans, check and adjust as process matures
4. INPO can assist suppliers who are unsure how to implement changes, or need help in certain areas
5. INPO is not assessing supplier performance, but measuring results against customer expectations
• Helping to close the gap
• INPO is the coordinator of the process; process will not work without their help

© Copyright 2017 Institute of Nuclear Power Operations
Issues Impacting Industry Performance• Increasing percentage of scrams caused by manufacturing issues
• Electrical subcomponent failures contributed to emergency AC power reliability challenges
• Most fuel failures are caused by maintenance-induced debris

© Copyright 2017 Institute of Nuclear Power Operations
Institute of Nuclear Power Operations
Scram Trend
13

© Copyright 2017 Institute of Nuclear Power Operations
Equipment remains the major cause of scrams
65 6770 71
7477
62 62
69
5964
52
46
5651
56 5762
40
50
57
41
50
40
2 2
85 4 5
14
4 48 7
2
17
9 11 1013
10
8
8 8 107
10
0
10
20
30
40
50
60
70
80
90
2005 2006 2007 2008 2009 2010 2011 2012 2013 2014 2015 2016
General Scram Causes by Number
Total Scrams Equipment External Direct Human Action
Data Management and Industry Trends, INPO

© Copyright 2017 Institute of Nuclear Power Operations
Manufacturing-Related Scrams
7477
62 62
69
59
64
52
2
8 86
10 119
6
13 12
21
0
10
20
30
40
50
60
70
80
90
2009 2010 2011 2012 2013 2014 2015 2016
Total Industry
Unplanned
Scrams
Vendor Quality
Related Scrams
Percentage of
Scrams Due to
Vendor Quality

© Copyright 2017 Institute of Nuclear Power Operations
Expected Outcome• Increased awareness of supplier activities impacting scrams and critical equipment failures– Manufacturing and receipt inspections
– Replacements (i.e., valves, pumps, turbines, etc.)
– Developing, implementing, and testing modifications
• Increased vendor engagement in recognizing vulnerabilities during work activities

© Copyright 2017 Institute of Nuclear Power Operations
0
20
40
60
80
100
120
2011 2012 2013 2014 2015 2016
Consequential Equipment Failures caused by Manufacturer
Defects or Refurbishment Services
Total
© Copyright 2017 Institute of Nuclear Power Operations
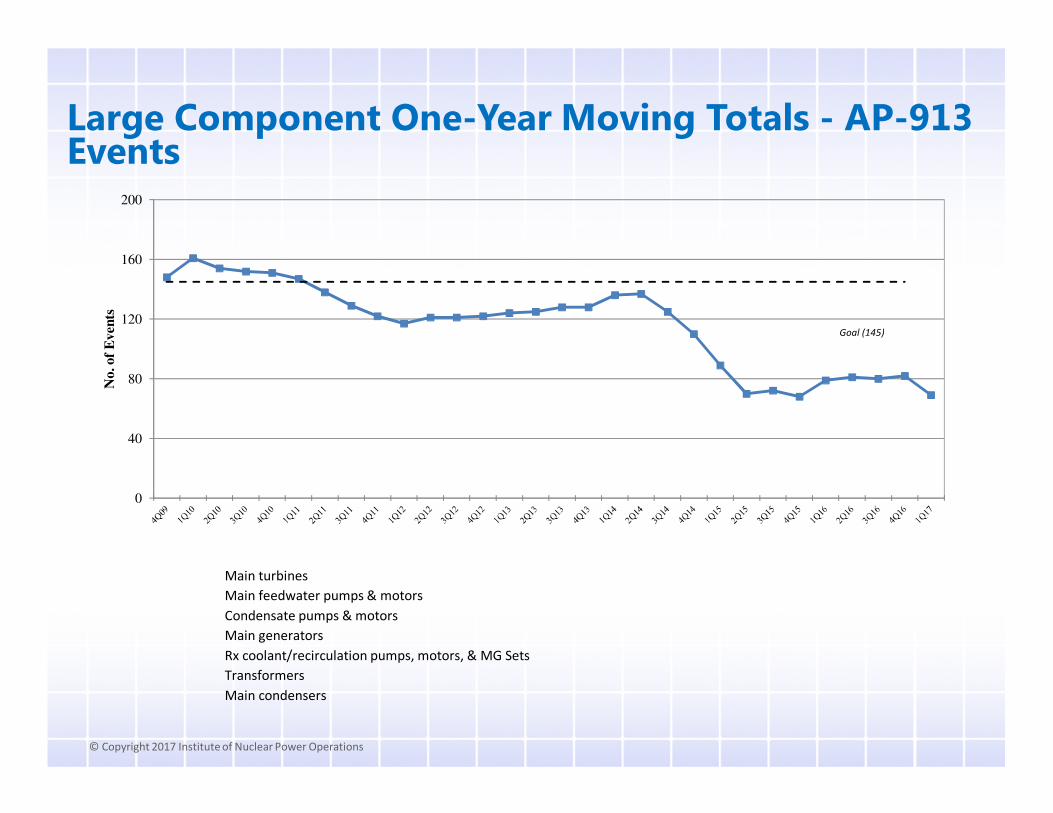
Large Component One-Year Moving Totals - AP-913 Events
0
40
80
120
160
200
No. of
Even
ts
Goal (145)
Main turbines
Main feedwater pumps & motors
Condensate pumps & motors
Main generators
Rx coolant/recirculation pumps, motors, & MG Sets
Transformers
Main condensers

© Copyright 2017 Institute of Nuclear Power Operations
Institute of Nuclear Power Operations
AC Power Reliability
19

© Copyright 2017 Institute of Nuclear Power Operations 20
0
5
0
10
78
3
1 1 1
28
39
33
41
23
21
37
22
2829
26
33
20 20
36
21
0
5
10
15
20
25
30
35
40
45
2010 2011 2012 2013 2014 2015 2016 last 365 days
ending 5-10-
17
2017 YTD
ending 5-10-
17
No.
of
Even
ts
Loss of Off-site Power (LOOP) Events
2017 YTD ending 5-10-17 Full LOOPs All LOOPs Partial LOOPs
G
O
O
D

© Copyright 2017 Institute of Nuclear Power Operations
INPO / Industry Actions• INPO Actions to Address Trend:
– Evaluation Team Focus Area
• AFIs include Switchyard and EDG issues
• INPO IER L4, Insights AC Power Reviews
– Contains ICES Records for Reference
• Improve industry use of EPRI and NATF documents that include:
– Workscope and Risk Review
– Indepth review of maintenance plan scope

© Copyright 2017 Institute of Nuclear Power Operations
Emergency AC Power
22

© Copyright 2017 Institute of Nuclear Power Operations
AC Power Review VisitsImportant and common recurring findings include the
following:• Work package content and owner acceptance reviews
• Use of predictive monitoring tools to detect degraded component conditions
• Scope of components included in maintenance strategies
• Use of performance monitoring limits or triggers for trends of test data
• Life-cycle management of critical components and spares
• Work schedule coordination between site and transmission activities
• Procedure detail for local operation of equipment
• Interim actions in response to the Open Phase IER, L2-12-14 for switchyard rounds did not include all appropriate bus work
• Time-sensitive tasks associated with an SBO event response are not monitored or periodically validated to ensure assumed time limits can continue to be met.
• EDG PM program gaps (single component vulnerability review) and EDG system LCM plan
23

© Copyright 2017 Institute of Nuclear Power Operations
Institute of Nuclear Power Operations
Nuclear Fuel Performance

© Copyright 2017 Institute of Nuclear Power Operations
The Basics
• Fuel failures have significant adverse impacts• Release of fission products results in increased:
–Gaseous and liquid releases to the environment
–Radiation/potential for personnel contaminations
–Station and supplier costs
• Supplier activities during refueling outages can negatively impact fuel performance
–Maintenance activities can generate debris
–Activities over or near reactor fuel present challenges

© Copyright 2017 Institute of Nuclear Power Operations
U.S. Units with Failures
8
9
8
6
5
8
10
00
2010 2011 2012 2013 2014 2015 2016 Goal
Percent
Good

© Copyright 2017 Institute of Nuclear Power Operations
Nuclear Fuel Failure Trend
• Increasing number of fuel failures over the past 2 years
• Renewed INPO focus on improving industry fuel performance
• Eight cores with failures identified in 2016– Removed failed fuel from 6 cores
– One station performed 2 mid-cycle outages to remove failed fuel
– Another station core is operating with 4 failures

© Copyright 2017 Institute of Nuclear Power Operations
Fuel Failure Causes
• Most failures are caused by debris fretting• Debris generated during open system work
–Physical work creates the debris
• Component degradation internal to systems
– Improperly installed or designed components
• Debris dropped in the refueling cavity or SFP
–During refueling activities
–Dry Cask Storage campaigns

© Copyright 2017 Institute of Nuclear Power Operations
Expected Outcome
• Increased awareness of activities that can impact nuclear fuel performance– Equipment maintenance and inspections
– Equipment replacements (i.e., valves, pumps, turbines, etc.)
– Cutting, grinding, or drilling activities
– Dry Cask Storage campaigns
– Fuel Fabrication
• Suppliers and utilities partner to prevent fuel failures

© Copyright 2017 Institute of Nuclear Power Operations
Institute of Nuclear Power Operations
30