Equipment Benchmarks for Capital Projects
55
State of Washington EQUIPMENT BENCHMARKS FOR CAPITAL PROJECTS Draft Report Prepared by MENG Analysis Office of Financial Management December 2015
Transcript of Equipment Benchmarks for Capital Projects

State of Washington EQUIPMENT BENCHMARKS FOR CAPITAL PROJECTS Draft Report Prepared by MENG Analysis
Office of Financial Management December 2015


TABLE OF CONTENTS
A. EXECUTIVE SUMMARY ............................................................................................................................. 1 Purpose .................................................................................................................................................................................. 1 1. Legislative Directive ............................................................................................................................................................ 1 2. Study Process ....................................................................................................................................................................... 2 3. Report Outline ....................................................................................................................................................................... 2 4. Summary of Findings and Conclusions......................................................................................................................... 3 5.
B. EQUIPMENT COST AND LIFE SPAN BENCHMARKS ............................................................................... 4 Project Scope – Equipment Types ................................................................................................................................. 4 1. Washington State Historical Equipment Cost Data ................................................................................................... 8 2. Equipment Cost Components ........................................................................................................................................ 12 3. Industry Standard Equipment Cost Benchmarks ..................................................................................................... 13 4. Equipment Life Span Benchmarks ............................................................................................................................... 18 5.
C. EQUIPMENT PROCUREMENT AND FUNDING ....................................................................................... 20 Current Funding Practices and Policy ......................................................................................................................... 20 1. Current Procurement Policies and Practices ............................................................................................................. 23 2. National Peer State and Institution Procurement and Funding Models ............................................................. 26 3. Industry Financing Models ............................................................................................................................................. 27 4.
D. LIFE CYCLE ANALYSIS OF ALTERNATIVE FUNDING MODELS ........................................................... 29 Life Cycle Modeling ........................................................................................................................................................... 29 1. Life Cycle Model Components ....................................................................................................................................... 29 2. Life Cycle Phases .............................................................................................................................................................. 30 3. Representative Life Cycle Model / Scenarios............................................................................................................ 31 4. Life Cycle Model Analysis ............................................................................................................................................... 34 5.
E. STUDY FINDINGS AND CONCLUSIONS ................................................................................................. 35 Study Findings .................................................................................................................................................................... 35 1. Conclusions ......................................................................................................................................................................... 37 2.

Appendix 1 – Bibliography and References Appendix 2 – Life Cycle Model Detail Appendix 3 – Study Participants and Contributors Appendix 4 – Data Tables

Equipment Benchmarks for Capital Projects
Page 1
A. EXECUTIVE SUMMARY
Purpose 1.The purpose of this study is to inform the Governor and the Legislature on equipment costs and equipment useful life for higher education and skills center capital projects. The state’s leadership is responsible for reviewing capital budget requests for equipment purchases and seeks benchmarking guidance for more consistent and reliable budget evaluation. In recent years, the reviewers have noted a significant variation in the amount and cost of equipment from one project to another, and with this study seek to better understand the basis for such variation. For the purpose of this study, we are defining “benchmarking” as determining a researched-based cost range for specific types of equipment used in a specific educational setting. In recent years, the state’s capital appropriations have included technical education to respond to the region’s demand for a more technically educated populace and workforce. This study focused on the types of equipment most commonly procured for those programs. The categories in this study are Internet technology and computers (IT), audiovisual (AV), science, technology, health and culinary programs. The study explores and identifies equipment funding options for the most cost-effective use of state, local and private funds. The study was also intended to produce life cycle models showing total cost over the full life of the equipment.
Legislative Directive 2.The 2015–16 capital budget instructed the Washington State Office of Financial Management (OFM) to evaluate and analyze capital project equipment costs and funding mechanisms for higher education and skills centers. The directive requested benchmarks for standard ranges of equipment expenditures in different types of facilities and an examination of alternatives for financing equipment costs where the equipment has a life expectancy that is less than the length of bond financing. Work on this study began Oct. 19, 2015, and will conclude with the delivery of this report to the Governor and the legislative fiscal committees prior to December 2015. The proviso is provided below.
NEW SECTION. Sec. 1083 FOR THE OFFICE OF FINANCIAL MANAGEMENT
Equipment Benchmarks for Capital Projects Study (92000010)
The appropriation in this section is subject to the following conditions and limitations: The office of financial management shall submit a higher education and skill center capital project equipment cost study to the governor and the appropriate legislative fiscal committees by December 1, 2015. The study must include benchmarks for standard ranges of fixed and nonfixed equipment expenditures in different types of facilities and an examination of alternatives for financing equipment costs where the equipment has a life expectancy that is less than the length of bond financing. The alternative analysis must include a life-cycle cost analysis of the competing alternatives to determine the most cost-effective options to the state bond and general fund budget.

Equipment Benchmarks for Capital Projects
Page 2
Study Process 3.This study was sponsored and managed by OFM. Through a request for qualifications and quotations, OFM selected MENG Analysis, a Seattle-based firm with considerable experience in Washington’s public higher education and K-12 sectors, to organize and conduct the study. OFM hosted an initial meeting in which the study purpose and scope were defined. Representatives from the consulting team, OFM, the Office of Superintendent of Public Instruction (OSPI), the State Board for Community and Technical Colleges (SBCTC), The Evergreen State College and the University of Washington attended and advised on current practices, availability of data and appropriate scope. The consulting team gathered historical capital project equipment procurement data from the University of Washington, Western Washington University, Central Washington University, Washington State University, SBCTC and OSPI, and entered information from representative projects in a database for analysis. In addition, SBCTC and the University of Washington provided representative excerpts from their current equipment asset inventory for a perspective on equipment procured outside the capital project funding process. The consultants also surveyed equipment manufacturer and vendor representatives, eliciting feedback on pricing, life span, and financing standards and practices. These representatives were asked to comment on typical pricing ranges for the types of equipment included in this study as well as typical shipping, warranty, setup, maintenance and salvage costs that contribute to total life cycle costs. The consultant team also surveyed a number of other state and higher institution procurement officials about their procurement and funding practices. Many of these sources provided summaries of their practices, and these were used to inform the range of life cycle models developed for this study. The consultant team facilitated a workshop that included representatives from most of the above groups as well as representatives from legislative staff, Oregon State University and the consultant team financial and cost analysts.
Report Outline 4.Section A provides an executive-level overview of the study, its purpose, process, findings and conclusions. Section B focuses on benchmarking equipment costs and useful life spans. This includes a review and analysis of Washington state historical capital project data as well as reviews of other national and industry standards and practices. These costs and standards are discussed both from an accounting and regulatory perspective as well as in the context of normal practice. Section C examines equipment procurement and funding practices. This includes a summary of current practices allowed by Washington state statute with an analysis of how and how much the institutions have been employing these various methods. In addition to Washington state practices, this chapter also presents procurement practices and funding methods employed by other states and

Equipment Benchmarks for Capital Projects
Page 3
institutions as well as some private sector methods that may be beneficial to Washington’s institutions. Section D presents the life cycle cost analysis models prepared for this study. These are presented for the most typical equipment types, modeled with various life spans and usage parameters under currently available funding options, as well as alternative funding options. Section E provides a tabulation and discussion of findings and conclusions resulting from this study analysis.
Summary of Findings and Conclusions 5.The state’s educational institutions maintain a large inventory of expensive equipment. This study explored ways to better understand the equipment costs for capital projects and to find ways to reduce cost and improve value for these assets. In general, this study found that the state has been paying industry standard costs for its equipment. With more flexible use of already available procurement and funding methods, first cost of equipment can be improved. With the favorable interest rates available to the state, most cost improvements will come from procurement practices rather than from funding methods. This study was tasked with recommending equipment cost benchmarks for use in budget request analysis. This study explores the components that go into benchmarking and concludes that only very broad metrics on a per-facility basis are feasible for benchmarking. This is due mostly to the large and broad variety of equipment types and options, with very few perfectly matched models from one facility to another that would allow individual equipment-type benchmarking. The study, however, did explore the issue on a per-facility basis. This benchmarking shows that for 75 percent of the technical facilities, equipment costs should fall between $25 to $50 per square foot of facility, or between 4 to 8 percent of total facility cost. If facilities do fall below or above those ranges, then there may be unusual mixes of program uses in those facilities; further investigation for cost efficiency may be warranted for the equipment being selected. In terms of life cycle value, the institutions have retained their equipment far beyond normal useful life. Although this results in lower life cycle costs, it produces an inventory with considerable obsolete equipment used in what is intended to be state-of-the-art technical training. Improving the replacement cycles for technical equipment can be accomplished with a relatively minor overall life cycle cost due to lower maintenance and operations costs for newer equipment. Replacing the equipment twice as frequently as in current practice will cost only 20 percent more over the total life cycle of the facilities. Conclusions are: OFM and the institutions should work together to improve asset management practices to
gain a better understanding of these assets and to use that data to inform budgeting decisions. The state can use rough order-of-magnitude benchmarking comparative standards for budget
review, but to do so must implement more rigorous standards for equipment definition and cost parameters.
If any benchmarking is to be used, it will be necessary to have modified cost data submitted for capital project requests. In particular, initial equipment costs must clarify all initial cost

Equipment Benchmarks for Capital Projects
Page 4
components, including equipment, shipping, installation, tax, training and warranty costs eligible for funding, and do so in a standardized format.
The state should continue to use all available funding mechanisms. It should encourage the use of certificates of participation (COPs) and other lease mechanisms, but should develop some sustainable programs such as endowment funds designated specifically for equipment.
The state could refine procurement tools and practices to better coordinate the procurement programs at the various educational institutions with each other as well as with various state programs.
The state should investigate other commercially available managed procurement services (MPS) and provide methods for those vendors to participate in state contracts and procurement programs.
B. EQUIPMENT COST AND LIFE SPAN BENCHMARKS
Project Scope – Equipment Types 1.During the initial project scoping, legislative staff and OFM noted that in recent years, the state’s capital authorizations have included science, technology, engineering, math (STEM) and health education projects. The initial scope for this study was to focus primarily on those types of equipment. OFM presented a list of capital higher education and skills center projects that have been funded between 2003 and 2015. The most representative facilities with technically focused programs were selected for inclusion in this study’s database. Figure 1 illustrates the relative amount of facility square feet in the state’s inventory (from OFM Comparable Framework 2009). Figure 1. Total Gross Square Footage of State-Owned Facilities
Central Washington University - 2,915,235
Community and Technical Colleges - 15,325,095
Eastern Washington University - 2,488,270
Spokane Intercollegiate
Research & Technology
Institute - 59,322
The Evergreen State College -
1,581,008
University of Washington -
17,506,536
Washington State University - 11,660,842
Western Washington University - 3,044,865
State Facility Inventory - Gross Square Footage

Equipment Benchmarks for Capital Projects
Page 5
Figure 2 illustrates the capital appropriation for major projects in the most recent decade. Figure 2. Washington Higher Education Capital Appropriations Since 2003
From this database, it became apparent that the equipment typically procured through the capital budget as “furniture, fixtures and equipment” (FF&E) could be categorized as either facility infrastructure type or as programmatic instruction type. There is also a category of equipment normally procured and installed as called for in construction contracts. These include items such as built-in casework, technical equipment such as built-in shop lifts, or mechanical and electrical systems to support lab or shop processes beyond the basic building systems and other specialty items normally installed as part of the facilities’ long-term systems. There is often a fine line between this latter category and the traditional definition of FF&E, and this study was interested in investigating how that definition has been interpreted and realized in the various procurement packages. Ultimately, the study team selected the following as primary categories for analysis:
IT infrastructure General appliances Office and classroom furniture AV IT Special program – technical instruction Special program – nontechnical instruction Noninstructional – building and site
Central Washington University - 132,258,000
Eastern Washington University - 43,421,000
State Board for Community and
Technical Colleges - 1,387,469,927
University of Washington - 331,256,000
Washington State University - 324,457,000
Total Gross SF Per Institution

Equipment Benchmarks for Capital Projects
Page 6
This study then focused on specific technical program instructional equipment under the following use types:
science technology health culinary IT
Figures 3 and 4 illustrate the relative amounts of equipment by institution type and by equipment use type in the study database. The charts show for each equipment type the percentage of total equipment cost in the study database. Figure 3. Equipment Cost by Institution Type
4-year Institution - 38,658,192
Community and Technical College -
44,986,066
Research Institution - 12,952,127
Skills Center - 2,603,232 Equipment Cost - Escalated to 2015

Equipment Benchmarks for Capital Projects
Page 7
Figure 4. Equipment Cost by Equipment Type
In addition, SBCTC contributed for this study a database of all the equipment in its current asset inventory, categorized by asset commodity groups. Figure A1 in Appendix 4 illustrates the amount of equipment by facility use category for the highest categories for the 39,000 items in its inventory.
The top four categories in their inventory by facility use category are: desktop computers servers data communications equipment laptops and notebook computers
AV - 7,589,179
Culinary - 559,583
General Appliances - 41,140
Health - 7,752,156
IT - 10,320,660
IT Infrastructure - 7,232,061
Noninstructional - Building and Site -
294,072 Office and Classroom Furniture - 30,850,948
Science - 25,922,442
Technology - 8,637,376
Total First Cost

Equipment Benchmarks for Capital Projects
Page 8
Washington State Historical Equipment Cost Data 2.This study used the aforementioned capital appropriation equipment request lists as well as the SBCTC asset inventory list to examine historical and current costs for the most commonly procured equipment types. The prototypical study list includes more than 8,000 items purchased since 2003. The SBCTC asset inventory includes more than 39,000 items, with some purchase dates going as far back as 1910. As previously described, more than 80 percent of the line items cost below the $5,000 accounting threshold. It was noted that in their equipment funding requests, the various institutions and projects handled the bundling or aggregation of related equipment in varying ways, with some bundling more equipment into larger line items and others showing all individual smaller components as separate line items. As a result, most of the analysis herein uses the total list including items costing less than $5,000. As a first step in benchmarking equipment costs, this study looked at total equipment cost per facility as a percentage of square footage and as a percentage of total facility capital cost. The total gross square feet of completed facilities are readily available in the state and institution databases, and it is fairly straightforward process to compute the equipment cost per facility gross square foot. Figure 5 presents this metric for each of the facilities included in this study.

Equipment Benchmarks for Capital Projects
Page 9
Figure 5. Equipment Cost per SF of Facility
$72 $64 $64
$62 $52
$44 $39 $39
$36 $35 $35 $34
$33 $32 $32 $32 $31 $31 $31
$30 $29 $29
$28 $27 $26
$25 $25
$22 $15
$13 $12
$11
0.00 20.00 40.00 60.00 80.00
Washington State University - Spokane Biomedical and Health…Central Washington University Science Building Central…
Cascadia Community College - Global Learning and the Arts…Washington State University - Vancouver Applied Technology…Western Washington University- Academic Instruction Center…
Columbia Basin Technical Skills Center Columbia Basin…Washington State University - Pullman Biotecnology Life Science…
University of Washington - Molecular Engineering Building…Everett Community College - Liberty Hall Everett Community…Spokane Falls Community College - Science Spokane Falls…
Bellevue College - T Building Bellevue CollegeClark College - Health and Advanced Technologies Building Clark…
University of Washington - Architecture Hall University of…Grays Harbor College - Schermer Instructional Grays Harbor…
Odegaard Undergraduate Learning Center 'University of…Bellevue College - S Building Bellevue College
Green River Community College - Cedar Hall Green River…University of Washington - Dempsey Hall University of Washington
Washington State University- Pullman - Cleveland Hall…Clark College East County Satellite CTC Clark College: East…
South Puget Sound Community College - Natural Science South…Pierce College Fort Steilacoom - Cascade Building Pierce College…
Pierce College Fort Steilacoom - Rainier Building Pierce College…Clover Park Technical College - Health Sciences Facility Clover…
Lake Washington Institute of Technology - Allied Health Building…Spokane Community College - Jenkins Wellness Center Spokane…
University of Washington - Savery Hall University of WashingtonUniversity of Washington Tacoma - William H Philip Hall…
The Evergreen State University - Seminar II The Evergreen State…Green River Community College Trades and Industry Green River…
Centralia College - New Science Center Centralia CollegeColumbia Basin College Career and Technology Columbia Basin…

Equipment Benchmarks for Capital Projects
Page 10
This review indeed indicates a very wide variation of expenditure per gross square foot. This variation is mostly explainable by the fact that very few of these facilities follow any standard ratio between spaces that require highly specialized (and therefore more costly) equipment and spaces that may contain more general office and classroom furniture. Many new facilities are designed to work in conjunction with other nearby facilities to deliver the entire departmental program mix among administrative, general instruction and specialized instruction/lab spaces. The skills center facilities in particular often contain a wide variety of technical and nontechnical specialized program space within one facility, with no standard from one campus to another. Intuitively, it seems that facilities containing predominantly general instructional space with general classroom furniture would present a more consistent range of equipment cost per facility square foot. These facilities, however, show a substantial range for this metric. In fact, the range of costs for this metric is wide, with historical cost per square foot ranging between $11–$72. Three-quarters of the technical facilities, however, fall in the $25–$50 per SF range. This indicates that this metric can be used as a benchmark to identify the facilities most worthy of further review that are outside this range. The second way to analyze historical costs is to look at the total equipment costs relative to total facility cost. Figure 6 shows the range of equipment costs as a percentage of total facility cost for the facilities in this study’s database.

Equipment Benchmarks for Capital Projects
Page 11
Figure 6. Equipment Cost as a Percentage of Facility Cost – by Facility
It is important to define “total facility cost” as it is used in these metrics. OFM maintains a database of historical project appropriations, but in most cases, this appropriation was not the source of all project or facility costs. Most higher education and skills center projects have some level of non-state capital appropriation. This is more the case for the four-year institutions and increasingly the case for the research institutions. For this study, the institutions were requested to provide total facility costs, including sources such as local funds, grants, and foundation and private donations.
3% 4% 4%
4% 4% 4% 5% 5% 5% 5% 5% 6% 6% 6% 6% 7% 7% 7% 7% 7%
8% 8%
9% 9% 9% 9% 10% 10%
13% 17%
26%
0% 5% 10% 15% 20% 25% 30%
Career and Technology Columbia Basin CollegeTrades and Industry Green River Community College
Savery Hall University of WashingtonMolecular Engineering Building University of Washington
Dempsey Hall University of WashingtonRainier Building Pierce College Fort Steilacoom
Natural Science South Puget Sound Community CollegeS Building Bellevue College
William H Philip Hall University of Washington TacomaSchermer Instructional Grays Harbor College
Seminar II The Evergreen State UniversityArchitecture Hall University of WashingtonCTC Clark College: East County Satellite
Health Sciences Facility Clover Park Technical CollegeHealth and Advanced Technologies Building Clark College
Liberty Hall Everett Community CollegeCascade Building Pierce College Fort Steilacoom
T Building Bellevue CollegeCedar Hall Green River Community College
Jenkins Wellness Center Spokane Community CollegeAllied Health Building Lake Washington Institute of…
Biotechnology Life Science Building Washington State…Global Learning and the Arts Cascadia Community College
Academic Instruction Center Western Washington UniversityOdegaard Undergraduate Learning Center University of…
Applied Technology Washington State University- VancouverScience Spokane Falls Community College
Columbia Basin Technical Skills Center Columbia Basin…Science Building Central Washington University
Cleveland Hall Washington State University- PullmanBiomedical and Health Sciences Washington State…
% of Facility Cost

Equipment Benchmarks for Capital Projects
Page 12
This study presents models for both costs as a percentage of appropriated funds as well as for costs as a percentage of total facility cost. The latter are the most reliable to use for benchmarking, although the former may explain some of the perception of extreme cost differences for similar facilities. Finally, it should be noted that the basic cost per square foot for instructional facilities increases substantially from K-12, through the community colleges, to university buildings and campuses. These vary based on factors such as building life expectancies, design standards and public expectations for image, with the research institution facilities typically costing 30 to 40 percent higher per square foot than the K-12 facilities. The higher facility costs lower the cost of equipment as a percentage of the facility cost, and indeed this is evident for some of the more expensive research facilities. This study reviewed individual types of equipment that might be benchmarked, but found that with the exception of some common furniture items identified as tables, chairs, shelving and computers, almost every other type has custom components to suit the specific program and location for which they are selected. And of course, even the common furniture items vary widely and change often as new models and styles are offered.
Equipment Cost Components 3.Another factor contributing to the variability of the equipment costs relative to total facility costs is the inconsistency of what is included in the initial equipment cost requests. Accounting standards allow actual equipment costs, delivery, setup, warranty, taxes and even maintenance agreements to be included as part of the initial costs. This study found little consistency in how these costs were funded or reported relative to the original capital requests. Some requests itemized each of these categories separately, others aggregated them in individual equipment prices, others used a combination of the above and still others did not include those components. This study attempted to reconcile these when looking at benchmarking relative to total cost or to square footage. These ancillary costs represent potentially 10 to 15 percent of the equipment costs, which at 5 to 10 percent of total facility cost are a borderline acceptable variable for budgeting guidelines. Figure 7 is an excerpt from the University of Washington’s equipment procurement guidelines for users of its online equipment procurement services. Although the University of Washington encourages the inclusion of maintenance agreements as part of the initial purchase, it appears that these are only occasionally included, and rarely at the other institutions. This is a good guideline to publish and encourage at the other institutions. If uniformly implemented, this would lead not only to more uniform cost standards for benchmarking, but also to improved equipment maintenance and extended life span. Figure 7. Excerpt from UW’s Procurement Guideline
Maintenance Agreements and Warranties
The first year cost of maintenance agreement and/or warranty can be included in the cost of a piece of equipment (coded as the appropriate taxable 06-XX object code) as an Ancillary Cost. Future years of these items should be coded 03-60 Outside Services Repair, Maintenance, and Alterations or 03-64 Outside Services—Maintenance Contracts.

Equipment Benchmarks for Capital Projects
Page 13
The DOR issued a special notice that specifically calls out extended warranties as being taxable even if the property is exempt. If the warranty is included in the cost of the total sales prices and can’t be broken out separately, then it won’t be subject to tax because it is considered part of the underlying price. If it is broken out separately, then it is taxable. Maintenance agreements continue to be taxable.
These ancillary costs are further discussed and accounted for separately in the life cycle models presented later in this report. Figure 8 illustrates the relative cost of these components for WSU’s reported facilities that did itemize them separately from actual equipment cost. Figure 8. Ancillary Procurement Costs for WSU Project Equipment Lists
Industry Standard Equipment Cost Benchmarks 4.
In addition to exploring the state’s historical equipment cost data, this study researched equipment cost standards in other states and higher education peer institutions. It also reviewed costs for specific representative pieces and types of equipment and reviewed them with manufacture and vendor representatives to gauge the competitiveness of the state’s purchases and procurement practices. Many standards and guidelines for fixed equipment are normally included in facility construction contracts. The UNIFORMAT II classification of building systems, used as a national method to categorize facility systems, includes a category for fixed equipment and for moveable equipment. Both are intended to include contractor installed long-term equipment and not shorter-term programmatic equipment normally procured outside the construction contract. Several of the national cost guidelines, such as “RS Means Construction Cost Guides” and “Whitestone Maintenance Cost Guides,” provide costs per square foot as well as cost as a percentage of total facility cost for these categories for a variety of facility use types. Even in Washington, OSPI, the Department of Enterprise Services (DES) and some of the higher education institutions maintain a
Equipment - 95%
Shipping and Install - 1%
Tax - 3% Warranty and
Maintenance - 1%

Equipment Benchmarks for Capital Projects
Page 14
historical database of these UNIFORMAT category costs. As discussed earlier, even though some of this permanent equipment is sometimes included in the shorter-term equipment requests, these guidelines provide no useful information for budgeting or benchmarking the shorter-term equipment included in this study. It is interesting to note that even though there is a category for movable equipment in the UNIFORMAT system, most of the cost guides leave that category blank, since there is so little agreement or reporting on what that category should include. For the equipment types included in this study, there are very few national budgeting guidelines using metrics such as cost per square foot or percentage of total facility cost. This study team reviewed capital budgeting guidelines from more than 20 representative states and an equal number of higher education and K-12 programs across the country. None of these contained cost benchmarks for budgeting. The study also reviewed publications and practice manuals from most of the higher education facility professional organizations such as the Association of Physical Plant Administrators (APPA), the National Association of College and University Business Officers (NACUBO), the National Institute of Building Sciences, the General Accounting Office, the Society for College and University Planners, the Counsel of Educational Facility Planners International, the Association of Higher Education Facilities Officers and the U.S. Department of Education and its National Clearinghouse for Educational Facilities. This research produced a few guidelines on equipment space planning and on the importance of equipment to viable educational programs. It produced some general discussion about the importance of budgeting for life cycle costs, but no guidelines for benchmarking. Both APPA and NACUBO reference equipment costs as potentially representing up to 20 percent of total facility cost. In researching guidelines from peer state budget and finance offices, the study team discussed a recent proviso issued by California that similarly also requested an equipment benchmark study in response to the varying cost ranges it was seeing for its capital projects. No progress has been made on that effort, although the state did describe similar issues and concerns about funding equipment for its universities and colleges, and did advise this study on other procurement and funding issues. Contact information for the California team can be found in the Appendix. Several studies have been initiated or completed on equipment planning metrics for administrative and general classroom spaces with guidelines on furniture costs per typical administrative offices at various staff hierarchies. The following universities are examples of flexible space planning guidelines with specific vendor recommendations. None contains cost guidelines.
Yale University – Steelcase and others Harvard University – Herman Miller and Steelcase (vendor partners) Rochester Institute of Technology – Steelcase Duke University – Herman Miller, McThrift and others Dartmouth – Steelcase University of Michigan – Steelcase Stanford University – has developed sole source vendor partnerships with Steelcase and Knoll
New York University has published cost studies on office furniture, citing $30–$35 per square foot budgeting figures for offices. Note that these numbers are relative to the actual net office area, not entire building gross square footage.

Equipment Benchmarks for Capital Projects
Page 15
Several equipment manufacturer professional organizations have developed cost guidelines for medical and lab equipment, with typical cost ranges of $16 per square foot for clinical settings and up to $35 per square foot for research hospitals. The federal government likewise publishes guidelines for medical equipment in representative clinical facilities at $20 per square foot. In lieu of focusing on individual facility procurement as part of the primary capital authorization, colleges and universities in almost every state either have or are implementing equipment procurement programs intended to take advantage of volume procurement, better contract negotiation, and more efficient management and handling processes. This topic will be further discussed in the procurement and funding alternatives section of this report. The more useful research conducted by this study was the discussion with manufacturer and vendor representatives from each of the equipment use types. This study polled more than 40 manufacturers’ representatives or vendors and asked them to review the costs in the historical procurement lists for the most prevalent types and pieces of equipment. With the questionnaire shown in Figure 9, they were asked to comment on the competitiveness of the prices Washington has been paying for its capital equipment. Figure 9. Purchase Cost Vendor Questionnaire In general for this type of equipment, are the equipment purchase costs shown: Very Low 20% or more lower than average Low 10–20% lower than average Medium Cost is average for this type of equipment High 10–20% higher than average Very High > 20% higher than average
Please cite specific examples of unusually low or high costs or in the representative equipment lists provided to you.
GENERAL Do you have any general comments about the selection, sourcing or procurement methods that the state and its educational institutions use for purchasing instructional equipment?
The responses to this query were strong, with most citing generally appropriate costs, but always with the caveat that there are large ranges of quality available for almost all types and pieces of equipment, and that those quality standards and specifications can vary greatly across the state and from one project to another. The representatives also consistently commented on the opportunity for more advantageous pricing with volume procurement. Figure 10 is a representative sampling of the information attained from this query.

Equipment Benchmarks for Capital Projects
Page 16
Figure 10. Purchase Cost Vendor Questionnaire Representative Responses Category Vendor Life Life Range Cost Cost Range Example Comments
IT Infrastructure Graybar Slightly long (5
vs OFM 6 yrs.) Medium Somewhat low (by 10%), especially for current technology
-10% Cat 5e cables priced right, but Cat 6 is priced low by 50%.
Most institutions get multiple quotes before ordering, so fairly competitive.
Furniture BiNw Short (often 15 vs OFM 10 yrs.)
Low Varies widely depending on quality
0% Soft seating high at $10.7K each, unless this is a grouping of pieces.
Furniture life depends heavily on quality indicated by warranty.
Furniture KCDA About right at 10 yrs. Medium
Many high to very high including chairs, tables and bookcases
20%
Item 2855 - Storage Cabinets, high at $2K each; KCDA cost typically $1K. Item 3622 - Upholstered Lobby Chair, high at $2K; KCDA cost typically $0.3K. See spreadsheet for more examples.
IT Computers Dell Short (2 to 3 vs OFM 4 yrs.) High
Competitive, but varies with degree of customization and software provided
0%
Need more contracts – too locked-up across state agencies – should follow other states with more flexible contracts. Growing trend toward more leasing; also more replacement warranties, especially for pads.
Research Lab
Thermo Fisher
About right (OFM 5 yrs.) Medium Varies widely 0%
70% of all research lab equipment is used one time; replaced for next grant, often 5-yr. periods.
Science Thermo Fisher
Much wider range (from 1 to 25, than OFM standard 5 yrs.)
Low About right, mostly fixed by purchasing pools; but varies widely with quality
0% Glassware often less than 1 yr. life. Refrigerators and autoclaves 10 to 15 yrs. or more.
Small items 1 to 3 yrs.; large items 10 to 25 yrs.; tech-based (computerized) 5 yrs. NASPO Contract No. SBP01336 widely used.
Science Scientific Supply
Short (10 to 20 vs OFM 5 yrs., except glassware)
Low Varies widely, but overall somewhat high
10%
Fume hoods, should budget $2K per linear foot, life 10 yrs. BSCs at $8K to $15K, life 10 yrs. Glass washers also $8K to $15K, life 10 yrs. Freezer dryer $10K to $35K, life 10 to 15 yrs. Vacuum
No extended warranties but often service agreement are required during the warranty period for analyzers. Warranties typically 1 to 3 yrs. Annual maintenance cost of 10% to maintain calibration and

Equipment Benchmarks for Capital Projects
Page 17
concentrator $10K to $15K, life 10 yrs.
safety. Unknown residual value, if any.
Health Laerdal
Too long for tech-based equipment (simulators); (6 vs OFM 12 yrs.)
High Somewhat low (by 10%) for high-end simulators
-10%
Items 499 & 1104 - Manikins. Medical simulator life is 5 to 7 yrs. High-end simulator cost is $100K. Some state historical purchases are over this, but many are less. See spreadsheet for details.
Prices change annually.
Culinary (kitchen)
Bargreen-Ellingson
Too short, especially non-powered (10 vs OFM 5 yrs.)
Low Depends on quality 0%
Stainless steel table life at least 10 yrs. (double OFM's 5 yrs.). Refrigerator standard warranty 3 yrs., with 5 on compressor, but life is 7 to 8 yrs.; same for ice machines. Unit price economy of scale for larger equipment. Do not use "economy grade" such as American Range.
Specs vary widely; some economy equipment is not appropriate for institution projects.
Culinary (kitchen) Clevenger Varies widely Medium-Low Varies widely
Life and cost depend on quality. See fishnick.com for life comparison. New state pooled contract.
Culinary (kitchen) Aramark Too short (10
vs OFM 5 yrs.) Low Aramark operates WWU Housing food service on contract at $18M/yr. budget, with 1% budget ($180K) for maintenance.
Technology (shop)
Peterson Hydraulics
Too short (15 to 20 vs OFM 10 yrs.) except computer-based at 5 yrs.
Low
Hard equipment costs generally high, storage and instrument costs about right
10%
HVAC life low. Hard equipment (drill presses, etc.) have 20 yr. life. Costs for hard equipment are high. Increase shop storage and furniture life to 15 yrs., but cost is right. Computer-based equipment life shorter at 5 yrs., but cost is right.
5-yr. extended warranties often available for shop equipment; typically 5% added to first cost. Residual cost at normal end of life typically 10%.

Equipment Benchmarks for Capital Projects
Page 18
Equipment Life Span Benchmarks 5.The most significant factor affecting equipment life cycle costs is the useful life span of each piece of equipment. This study addressed this issue from both the asset accounting and financing perspective as well as from the perspective of how long equipment is actually being retained and used relative to its normal expected useful life. The state adheres to national accounting standards for asset classification and tracking and uses those same national standards for useful life definitions. Most institutions across the country adhere to these standards for accounting purposes as required by tax law and Governmental Accounting Standards Board (GASB) policies. However, many states and institutions have their own “functional” useful life standards for various types of equipment that are used for internal accounting as well as to define equipment quality standards. In addition, many of the equipment manufacturer trade and professional organizations issue guidelines for expected useful life in their industries. Figure 11 summarizes these various standards for the equipment types included in this study. Figure 11. Equipment Useful Life Standards
Equipment Type
OFM Life IRS 946 White -
stone Other
National Institutions
Vendor Input Avg
Best Practice
Study Medium
Study High
SBCTC Inventory
IT Infrastructure 6 6 5 5 5 6 10 17
General Appliances 7 10 n/a - - - 20
Office & CR Furniture 10 10 15 15 15 10 25 28 AV 7 7 5 7 10 20 IT (computers) 4 6 5 3 3 4 8 11 Research Lab 5 5 10 5 - - - 14 Science 5 5 15 10 10 10 5 15 14 Health 12 10 10 10 10 12 14 34 Culinary 5 10 15 10 10 5 15 14
Technology (Shop) 10 15 15 12 10 25 28
Non-instructional Bldg & Site 20 20 n/a 56
In addition, this study examined useful life practices with the institutions and reviewed the current asset lists to assess how long equipment is actually being retained and functionally used across the state. The institutions universally commented that they retain and use their equipment far beyond its normal useful life. They noted that they often retain equipment until the facilities undergo a complete major renovation with a new equipment appropriation.

Equipment Benchmarks for Capital Projects
Page 19
SBCTC reviewed its current asset list containing more than 39,000 equipment items. Figure 12 illustrates the predominate pattern of equipment extending far beyond its asset classification normal useful life as defined in the State Administrative and Accounting Manual (SAAM). For the SBCTC equipment asset inventory, the average age of equipment is 2.8 times the normal useful life standards. Figure 12. SBCTC Equipment In-Use Beyond Useful Life
From this assessment, the study team recommended three levels to use for the life cycle budgeting models to assess the financial advantages or disadvantages to retaining equipment beyond normal useful life: Level 1) Best Practice. This represents a frequency of replacement in line with most manufacturers’ recommendations. This will maintain equipment with normal instructional use in good to fair operating equipment and replace prior to programmatic obsolescence. Level 2) Medium Term (OFM standard). This is the standard recommended under GASB policy and now Washington’s accounting standard. In most cases, this represents a fairly short replacement cycle relative to manufacturers’ recommendations. Level 3) Long Term (Washington practice). This is the standard for much of the equipment in the state’s inventory.
100
1000
10000
100000
1000000
10000000
0 10 20 30 40 50 60 70 80
Acqu
isitio
n Co
st
Years In-use Beyond SAAM Useful Life
Owned Equipment In Use Beyond Useful Life with Known Revenue Sources
Cash Bond

Equipment Benchmarks for Capital Projects
Page 20
C. Equipment Procurement and Funding
Current Funding Practices and Policy 1.Equipment for Washington higher education and skills centers facilities is typically funded from three primary sources:
a) Long-term capital bonds tied to the original facility capital appropriation for specific projects. Funds are maintained in the State Building Construction Account and for certain other limited-use bond accounts. They are funded typically by 25-year general obligation (GO) bonds. The projects and their associated equipment lists are submitted to OFM for approval, and as such are the focus of this study.
b) Certificates of participation. COPs are intermediate-term lease financing managed by the state. They provide funds for equipment purchase requests from the institutions. Typically they are used for equipment replacement later in the facility’s life cycle.
c) Cash or general operating funds. Funds are derived from a variety of sources from state appropriations as well as from local sources, and held in the institutions’ general funds. State appropriations are granted each biennium and are not identified for specific uses. Since the 1993–95 biennium, tuition and fees have been a nonappropriated funding source for the institutions.
Buildings are commonly referred to as state supported because state capital budget funds are typically a major source of funding for constructing the building. However, there are significant sources of revenue other than state funds available for operating and maintaining state-supported facilities. Such other sources include tuition and fees, and a portion of overhead charges (indirect cost recoveries) generated from government research grants and contracts. At the research university level in particular, these are becoming a major source of funding for not only equipment, but for entire capital projects. In addition, the University of Washington and Washington State University have authorization to fund equipment purchases with private financing. For the projects used as models in this study, the institutions were asked to confirm not only the state appropriated funds but also all other funds used to pay for the capital construction. For the metrics that include the facility cost, this study used the total project costs, including nonappropriated funds. SBCTC has tracked funding sources for the equipment in its inventory, including initial procurement as well as equipment replacement. Less than 10 percent of equipment is bond funded, whereas more than 90 percent is funded with cash. Figure 13 shows equipment procurement cost by specific fund name.

Equipment Benchmarks for Capital Projects
Page 21
Figure 13. SBCTC Equipment Procurement Cost by Specific Fund Name
The University of Washington, at the other extreme, reports that only about 11 percent of its equipment comes from state sources. The other 89 percent is derived from internal operations, grants, donors and endowments. Figure 14. UW Funding Sources for Equipment
Approximate Annual FF&E $101,000,000 FF&E from Capital Sources $11,300,000 (about 11%)
State Capital Appropriation $1,200,000 1% Local Funds 6,000,000 6% Tuition Based 3,200,000 3% State Operating Appropriation 900,000 1%
$11,300,000 11%
0 50000000 100000000 150000000
General FundInst of HI ED-Operating Fees Acct
Institutions of Higher Education - Dedicated Local…Institutions of Higher Education - Grant and Contracts…
State Building Construction AccountInstitutions of Higher Education - Plant Accounts
Institutions of Higher Education - Other Enterprises…Institutions of Higher Education - Data Processing…
Institutions of Higher Education - Associated Students'…Community/Technical College Capital Projects Account
Fish and Wildlife Equipment Revolving AccountInstitutions of Higher Education - Motor Pool AccountInstitutions of Higher Education - Bookstore Account
Gardner-Evans Higher Education Construction AccountInstitutions of Higher Education - Printing Account
Institutions of Higher Education - ParkingInstitutions of Higher Education - Food Services Account
Equipment Cost
Equipment Benchmarks for Capital Projects
Page 22
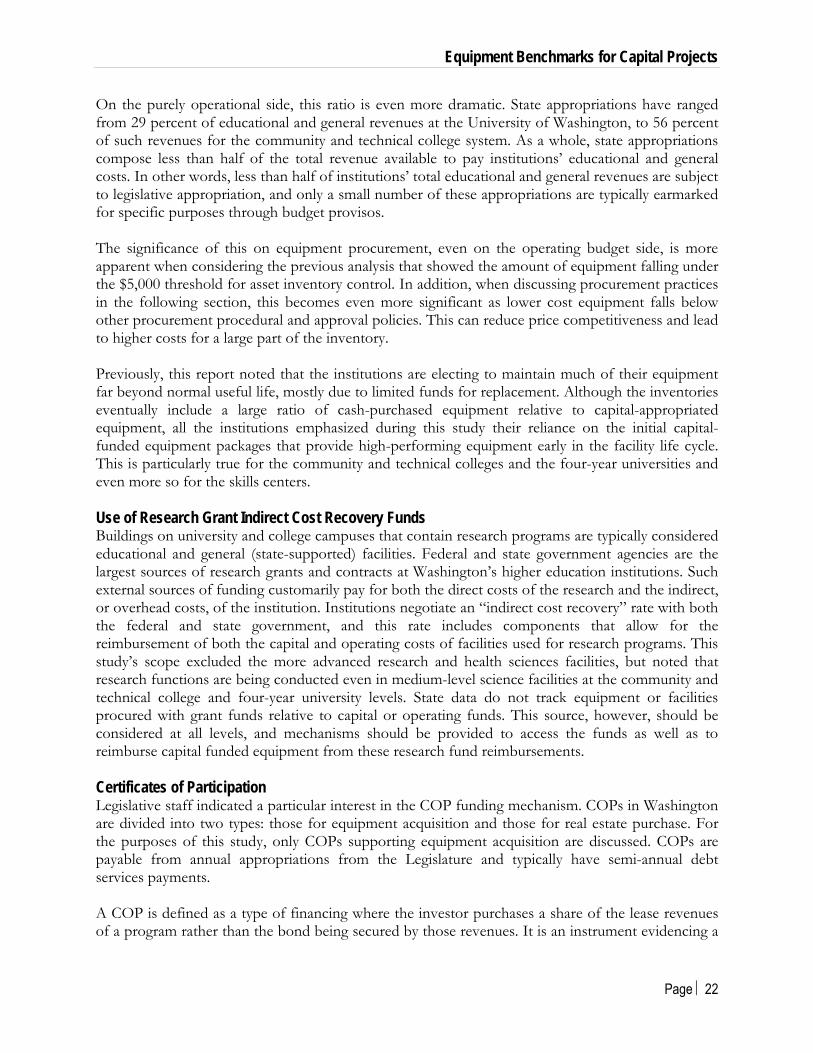
On the purely operational side, this ratio is even more dramatic. State appropriations have ranged from 29 percent of educational and general revenues at the University of Washington, to 56 percent of such revenues for the community and technical college system. As a whole, state appropriations compose less than half of the total revenue available to pay institutions’ educational and general costs. In other words, less than half of institutions’ total educational and general revenues are subject to legislative appropriation, and only a small number of these appropriations are typically earmarked for specific purposes through budget provisos. The significance of this on equipment procurement, even on the operating budget side, is more apparent when considering the previous analysis that showed the amount of equipment falling under the $5,000 threshold for asset inventory control. In addition, when discussing procurement practices in the following section, this becomes even more significant as lower cost equipment falls below other procurement procedural and approval policies. This can reduce price competitiveness and lead to higher costs for a large part of the inventory. Previously, this report noted that the institutions are electing to maintain much of their equipment far beyond normal useful life, mostly due to limited funds for replacement. Although the inventories eventually include a large ratio of cash-purchased equipment relative to capital-appropriated equipment, all the institutions emphasized during this study their reliance on the initial capital- funded equipment packages that provide high-performing equipment early in the facility life cycle. This is particularly true for the community and technical colleges and the four-year universities and even more so for the skills centers. Use of Research Grant Indirect Cost Recovery Funds Buildings on university and college campuses that contain research programs are typically considered educational and general (state-supported) facilities. Federal and state government agencies are the largest sources of research grants and contracts at Washington’s higher education institutions. Such external sources of funding customarily pay for both the direct costs of the research and the indirect, or overhead costs, of the institution. Institutions negotiate an “indirect cost recovery” rate with both the federal and state government, and this rate includes components that allow for the reimbursement of both the capital and operating costs of facilities used for research programs. This study’s scope excluded the more advanced research and health sciences facilities, but noted that research functions are being conducted even in medium-level science facilities at the community and technical college and four-year university levels. State data do not track equipment or facilities procured with grant funds relative to capital or operating funds. This source, however, should be considered at all levels, and mechanisms should be provided to access the funds as well as to reimburse capital funded equipment from these research fund reimbursements. Certificates of Participation Legislative staff indicated a particular interest in the COP funding mechanism. COPs in Washington are divided into two types: those for equipment acquisition and those for real estate purchase. For the purposes of this study, only COPs supporting equipment acquisition are discussed. COPs are payable from annual appropriations from the Legislature and typically have semi-annual debt services payments. A COP is defined as a type of financing where the investor purchases a share of the lease revenues of a program rather than the bond being secured by those revenues. It is an instrument evidencing a

Equipment Benchmarks for Capital Projects
Page 23
pro rata share in a specific pledged revenue stream, usually lease payments by the issuer that are subject to annual appropriation. The certificate generally entitles the holder to receive a share, or participation, in the lease payments from a particular project. The lease payments are passed through the lessor to the certificate holders. The lessor typically assigns the lease and lease payments to a trustee, which then distributes the lease payments to the certificate holders. Washington uses COPs in addition to traditional bond financing. Since 2010, the amount of COP funding secured from community colleges and universities ranges from $3.3 million to $54.3 million. These funds can be accessed by any participating institution through a formalized request process that does not require prior approval from the Legislature. When using COP funds, an institution submits an intent to finance to the State Treasurer’s Office. Once the equipment is procured, the institution sends the purchase paperwork to the treasurer’s office, which then bundles purchases from multiple institutions and sells COPs, usually in a semi-annual offering.
Current Procurement Policies and Practices 2.Both the state and the institutions have policies and practices that specify the methods for procuring and tracking equipment assets. OFM provides information to the institutions through its capital budget instructions, a document that is typically updated every other year. It outlines financing regulations, including allowable uses of long-term financing and of bond and COP proceeds. An important part of these practices, and a primary focus for this study, is the process for submitting equipment procurement packages to OFM for capital appropriation. Typically these lists appear as summary amounts as well as detailed equipment lists that accompany the predesign and later-stage project documents. As discussed in earlier sections, and as evidenced by the lists used for this study’s database models, these lists can vary widely in their level of detail, methods for aggregating related equipment and their inclusion or exclusion of ancillary first costs such as taxes, shipping, installation and warranties. Once submitted and approved, state policy and institutional policy provide some guidance on procurement protocol, but again, a large amount of that equipment may fall below regulatory thresholds. Figure 15 shows excerpts from WSU’s purchasing guidelines. These guidelines basically summarize state policy.

Equipment Benchmarks for Capital Projects
Page 24
Figure 15. WSU Purchasing Guidelines (Excerpts)
Purchase Cost Under $10,000: For computer equipment, services, or software purchases under $10,000 (not including tax and shipping), departments may select vendors with or without state purchasing contracts and without undergoing a bidding process. Departments may contact Purchasing Services for a current list of available state contract vendors or for other assistance. See also "Approved Purchasing Contracts" below. Purchase Cost $5000 or Less For purchases totaling $5000 or less, departments may: Submit a Department Order directly to the vendor (see 70.07), Process a purchasing card transaction directly with the vendor (see 70.08), or Submit a Department Requisition to Purchasing Services to process the purchase with the vendor (see 70.10). Purchase Cost Over $5000 Departments submit a Department Requisition to Purchasing Services to process purchases in excess of $5000. See 70.10. Include the following information with the Department Requisition: Name, address, contact telephone, and contact e-mail address for selected vendor, Written quote from vendor for requested purchase items, and Brief explanation of why vendor was selected as the "sole source" or best choice for the
department. Purchasing uses this information to verify with the vendor that the prices quoted are the best ones available to WSU. Purchase Cost Over $10,000 The Washington Department of Enterprise Services (DES) requires that WSU competitively bid computer equipment, services, or software purchases that exceed $10,000. Purchasing Services coordinates the bidding process for University departments. See 70.13. Purchases over $10,000 which are prepared under approved state contracts do not undergo the bidding process. Purchasing Services processes approved state contract requests immediately upon receiving the Department Requisition.

Equipment Benchmarks for Capital Projects
Page 25
Many institutions and some states are developing procurement sites available to the public. Most of these have underlying protocol and policy for soliciting and contracting with the equipment vendors that supply the available “catalog,” but there is generally a great deal of flexibility in this process and a resulting opportunity for either great or reduced price competitiveness. DES manages procurement for multiple institutions in Washington and publishes the Washington Purchasing Manual. This is a good comprehensive summary of procurement policy, including benchmarks for requests for qualification, open bid, select bid, direct purchase and sole source methods. Once again, one important benchmark relevant to this study is the $5,000 benchmark below which equipment can be purchased as direct purchase outside of state pre-negotiated contracts. eProcurement The University of Washington maintains a well-managed procurement site available to all university departments. eProcure is a state-of-the-art model for similar programs around the country. The eProcurement system is powered by Ariba software and supported by 65 individual vendor contracts. Each contract has different terms, but all include pricing that is a percentage discount from standard retail pricing. Vendors are sourced and selected through a request for proposal process, and the pricing is negotiated based on expected purchase volume. A single vendor can have different discount percentages in its contract that vary by commodity type. For example, an IT vendor may offer a 15 percent retail discount on the majority of its equipment offerings, but a 30 percent discount on the university’s “standard” computer. Each department follows its own processes for equipment purchase approval, with no involvement from central purchasing. The departments can purchase equipment as needed from the 65 vendors that are under contract. If there is a need to purchase equipment from a vendor that is not under contract, and if the purchase is less than $10,000, the department can select equipment and purchase at will. However, if the purchase is $10,000 or more, central purchasing must be involved in the procurement to ensure state regulations for fair competition are met. In addition, DES maintains a purchasing and contracting organization with a readily accessible Web presence available to all state agencies. The state subscribes to its own master contracts as well as to Western States Contracting Alliance contracts available to institutions beyond Washington. As part of its program, DES manages a technology procurement and support initiative that provides:
Technology master contracts allowing agencies to purchase directly from the vendor. The state saves money through pre-negotiated volume pricing and the avoidance of duplicated procurement efforts by multiple agencies for the same products.
Technology consulting and purchasing services providing state and local governments with a convenient source for IT products.
Technology leasing for desktop PCs, laptops, printers and servers. This program relies on COP funding to secure leases for IT equipment.

Equipment Benchmarks for Capital Projects
Page 26
Surplused Equipment Another resource for purchasing equipment that plays a larger role in some states than it does in Washington is used equipment recycled from the institutions (or other state agencies) when they no longer have use for the equipment. DES manages the equipment surplus functions that serve as a means to not only surplus but also purchase equipment. This service is available to all state agencies on a priority basis, and offers surplused equipment from state agencies as well as some federal and local agencies. DES offers an online auction site, like-kind exchange programs and other creative ways for recycling used equipment. Relative to the previous discussion of equipment life span and the practice of retaining equipment beyond normal useful life, much of this equipment has little remaining residual value and brings relatively little income to the state. It is reported that the program cannot cover the cost of operating the program from the sales of the salvaged equipment. Other sources for equipment to Washington agencies are Washington Correctional Industries and other community service organizations under the regulation of the Department of Social and Health Services.
National Peer State and Institution Procurement and Funding Models 3.This study researched purchasing and funding models and practices for states and institutions throughout the country. Almost every state, as well as every major college and university, has well- published and distributed policies and accessible procedures. Washington’s policies and procedures are very much in line with most states, a factor supported by the need to comply with federal (GASB) requirements that drive much policy. Most states have a mix of capital funding and noncapital funding, and most are exploring leasing, COPs and other private funding opportunities. Several states such as Minnesota, New Jersey, Texas and Virginia stand out with programs designed to address recurring equipment needs. These include revolving funds and trust funds readily accessible by the agencies. Virginia’s trust fund in particular is a model that should be of interest to Washington. Virginia Higher Education Equipment Trust Fund The Commonwealth of Virginia established the Higher Education Equipment Trust Fund (HEETF) in 1986 in response to a disparity between available funds and equipment replacements needs. The fund is intended to provide an ongoing program for the acquisition and replacement of instruction and research equipment at state-sponsored institutions of higher education. Since the fund’s inception, $1.2 million of equipment has been acquired through the program. Twenty-four institutions participate in the program. The Virginia Community College System represents all community colleges but is included as a single institution for funding purposes. Revenue bonds with a seven-year term are used to fund the HEETF. The interest rates vary with the market but are typically around 5 percent. The fund is overseen by the Virginia College Building Authority (VCBA), the State Council of Higher Education for Virginia (SCHEV) and the Department of Treasury. Each year, the institutions create a list of requested equipment that meets the requirements of the program and forwards to the SCHEV. The SCHEV confirms the items comply with funding rules before communicating the list to the VCBA. The SCHEV’s recommendation for funding is communicated to the governor and General Assembly for consideration during the budgeting process. The SCHEV recommends how to distribute the funds among the institutions.

Equipment Benchmarks for Capital Projects
Page 27
The primary benefit of the fund is that it matches equipment with a shorter expected life to a financing mechanism with a similar duration. A second benefit of this program is that future expenditures are known in advance and can be spread out over time, minimizing large spikes in the budget when more expensive items require replacement.
Industry Financing Models 4.Private industry has many of the same funding models that are available to the public sector, and likewise is aggressively seeking ways to stay current with its equipment at the most competitive cost. In fact, with equipment needed for production rather than instruction, it is even more imperative that state-of-the-art equipment be provided, maintained and replenished at the high levels needed for robust production. Many models and services are available to private industry that benchmark equipment relative to production. This is particularly true in the construction and vehicle equipment sectors, but also true in areas such as food service, chemicals and health care. Along with the need for staying current, industry seeks financial models and cycles that strike a profitable balance. Accordingly, many of the financial models are shorter-term financing, including competitive lease programs and manufacturer financing. Like the public institutions, industry seeks the cost advantages of quantity purchasing, and much of this is done through trade associations and consortiums. This study reviewed some of the methods and funding sources employed in the food service, health, research, technology and IT industries and used this information to gauge potential life span and cost benchmark recommendations. Industry employs a variety of operating and capital lease models, such as sale back leases, dollar buyout and 10 percent purchase options. Figure 16 highlights advantages and disadvantages of these leasing models. Figure 16. Comparing Lease Options
Advantages Disadvantages Commentary Fair market value
End-of-term option is open ended. Lower monthly payments. Maximized tax benefit. Great for rapidly depreciating equipment.
Can be ambiguous and result in a disagreeably high valuation.
Fair market value allows you and your leasing company to negotiate what the value of the equipment is at the end of the lease. There are normally 3 options at the end of the term: buy the equipment for a mutually agreeable price, continue leasing it or return it. You should ask your leasing company what it normally expects to receive at the of the lease term and if it can cap the amount.
10% purchase option (put)
End-of-lease payment is predetermined at either a fixed percentage of the equipment cost or a specified dollar amount.
You must pay the fixed put. It is considered an additional payment.
The fixed put is beneficial if you would like a lower monthly payment and are not concerned about making an additional payment at the end of lease.
$1.00 buyout End of lease payment is $1.00.
Higher monthly payments. Minimized tax benefit.
You can own the equipment for $1.00 at the end of the lease.

Equipment Benchmarks for Capital Projects
Page 28
Two considerations affect private industry financing decisions more than public agencies, particularly educational institutions. The first is the revenue side of the life cycle model, which is generally ignored. This affects not only financing, but also the types of equipment purchases. The second consideration is asset depreciation rates and limits. New IRS regulations under the Section 179 deduction allow greatly expanded limits with an accelerated bonus depreciation. Depreciation has insignificant tax advantages to states, so this is not a significant differentiator in procurement life cycle models. One of the primary restrictions that limit the public agencies’ access to private finance and leasing options is the requirement for the state to “own” the equipment in its asset inventory. When this study examined some of these leases, it became clear that there are no real bottom-line benefits to those lease options, given both the typical life cycles for the equipment and the aggressive interest rates already available to the state. With its strong credit rating, through COPs or similar models, Washington is attaining some of the best interest rates available — even better than some of those available to the larger private institutions and industries. Managed Equipment Services One area in which private industry leads the way is in managed equipment procurement services (MES). These take the form of companies that manage equipment procurement from cradle to grave (selection, procurement, delivery, setup, maintenance and disposal) as well as companies that do all of the above as equity partners. Just-in-time delivery and shipping efficiencies, expert setup, planned maintenance contracts and secondary market recycling are typical areas that can reduce procurement costs when highly managed. Under equity MES contracts, major equipment suppliers undertake ownership and management of the entire equipment requirement for operational facilities for the life of an agreed concession. This includes procurement, delivery, installation and commissioning, user training, asset management and maintenance. It also includes the ongoing replacement of equipment to ensure that it remains state-of-the-art as well as final disposal. Many large equipment companies in various industries, such as Phillips, Siemens, Toshiba and GE; leasing companies; equipment handling companies; and financing companies provide these services. For Washington’s education facilities, there may not be sufficient operational efficiency benchmarks to gauge operational savings on which to base the MES fees, but the efficiencies from some of these management services may still provide savings, even if procured on a fee- or percentage-of-equipment-cost basis. Previous Washington Computer Procurement Studies In 2002, OFM completed a similar study to this one that focused on desktop and notebook computers; agency network servers (Intel-based), desktop/notebook/server operating systems and office automation software such as word processing, spreadsheets, electronic mail and calendaring applications. It also explored various procurement programs, renewal cycles for IT equipment and alternative funding methods that are still valid, especially for desktop IT equipment. Although a more than a decade old, it offers a good summary of lease option programs. The study recommends a three-year replacement cycle and a mostly all-lease format for this type of equipment. It did not include a financial analysis.

Equipment Benchmarks for Capital Projects
Page 29
D. Life Cycle Analysis of Alternative Funding Models
Life Cycle Modeling 1.Consideration of a project’s life cycle cost is a requirement for most capital projects in Washington. OFM manages Washington’s life cycle analysis process and defines life cycle cost analysis (LCCA) as a method for assessing the total cost of ownership for a new facility or a building system. It takes into account all costs of acquisition, initial capital investment, ongoing operating and maintenance costs and other costs as needed if beneficial to the analysis being performed. The purpose of an LCCA is to estimate the total costs of project alternatives and to select the design that ensures the new facility or building system provides the lowest total cost of ownership consistent with the project’s intended quality, function and life span. OFM publishes LCCA guidelines and a working Excel tool (LCCT), and updates the model annually, including rate assumptions for inflation, discounting and energy. The LCCT inputs for capital costs align with the Uniformat II estimating format, which also aligns with the construction contracts tab in OFM’s capital budgeting system. These guidelines are written specifically for capital project building systems and not for equipment decisions. The guidelines emphasize system decisions that affect energy and maintenance costs. The models included for analyzing lease vs. purchase alternatives are designed for whole building real estate lease issues and not specific building component or equipment leasing. Accordingly, this study created its own LCCA modeling tool for analyzing equipment procurement options for various equipment types. For convenience, it will be referred to as the equipment procurement life cycle model (ELCM).
Life Cycle Model Components 2.The ELCM for this study analyzed eight categories of equipment across four distinct economic models through three distinct phases over a 25-year horizon. The equipment-use types selected are those used throughout this study to represent the predominant technical equipment types in higher education facilities and K-12 skills centers. The funding models represent the range of options that should be most attractive to the state. Life Cycle Metrics The model selected a uniform $100,000 original equipment cost for all categories. These numbers could be dynamically updated to provide data based on actual expenditures if the state were to determine its entire inventory for each equipment type. The metrics used in the ELCM are defined as follows: Category name: The category of equipment being modeled OEC: Original equipment cost Best practice: The number of years that the manufacturer of the equipment believes is the
useful life of the equipment that, with normal maintenance and use, will provide functional and programmatic service through its life
Medium term (OFM standard): The number of years that OFM has determined complies with the useful life of the equipment for accounting standards

Equipment Benchmarks for Capital Projects
Page 30
Long term (Washington practice): The number of years that the Washington institutions have been typically using equipment for standard operational purposes
The life cycles used for these models are shown in Figure A3 in Appendix 4.
Economic Models and Rates GO bond – GO bonds have been the predominant funding source for Washington’s primary
capital equipment. GO’s are a common type of municipal bond in the United States secured by a state or local government’s pledge to use legally available resources, including tax revenues, to repay bond holders. These models use a term of 25 years, based on the state treasury description of most common practice.
COP – COP bonds for this model are also commonly referred to as revenue bonds. These models use a term of 10–12 years, based on the state treasury description of most common practice.
Cash – This is money spent from the institutions’ operating budgets. Operating lease – The source of capital for this model is an outside commercial entity. The
state must appropriate these payments in the budget annually to continue the lease. The state may terminate the lease if insufficient funds are appropriated. With this option, the state is expected to refresh the equipment at the end of the term.
The economic rates used in these models were derived from the State Treasurer’s Office’s recent guidelines and practices as well as from current industry standards. These are shown in Figure 17. Figure 17. Current Life Cycle Economic Rates
Model Rate GO Bond 2.25% COP 2.50% Cash 1.41% Operating Lease 1.75% Type Rate Escalation 2.37%
Life Cycle Phases 3.Every piece of equipment purchased by the state of Washington has an acquisition phase, a usage phase and a disposition phase. These are outlined below. Acquisition Phase During this phase, the state is procuring equipment, having it delivered to a specific location and then having it installed for usage. These projected costs are based on industry research and historical data from the state and the institutions. The acquisition costs used for these models are shown in Figure A4 in Appendix 4.

Equipment Benchmarks for Capital Projects
Page 31
Usage – Warranty and Maintenance Phase During this phase, the institutions are using the equipment. These projected costs are based on industry research and data from OFM. The earlier years in the cycle include maintenance agreement costs, with lower actual maintenance needs, but increasing maintenance needs as the equipment ages. The warranty and maintenance costs used for these models are shown in Figure A5 in Appendix 4. Disposition – Residual Phase During this phase, the state is disposing of the equipment. Projected costs are based on industry research and data from OFM. In this model, the value of the equipment in the secondary market is based on a percentage of original equipment cost. The longer the equipment is used, the lower the value becomes in the secondary market. In the operating lease model, the commercial entity providing the lease would absorb this residual risk. The residual phase rates used for these models are shown in Figure A6 in Appendix 4. When analyzing the residual value of each category of equipment based on the typical refreshment cycle for the Washington institutions, the residual values are usually zero. This is because the Washington institutions typically use equipment as long as possible and “run-to-failure” in some cases. Comparing this methodology against what is commonplace for commercial entities, there is more emphasis on staying current with equipment life cycles in the commercial setting. This leads to a better user experience along with lower warranty and maintenance costs. The state may benefit from a study of residual recovery numbers under a more timely refreshment model as an alternative to its current practice.
Representative Life Cycle Model / Scenarios 4.The life cycle summary graphs below show total 20-year life cycle cost present value for the four representative funding models for each of the eight equipment types. These are each modeled for three life span scenarios as described previously: best practice, medium-term, long-term. Accordingly, for each of these eight types of equipment, this results in 12 models. Figure 18 shows that the various financing options, at today’s low interest rates and Washington’s competitive rates, are very close in total life cycle cost. If modeled in more inflationary cycles, when private financing might be more competitive than long-term public funding, the models would show greater differentiation.

Equipment Benchmarks for Capital Projects
Page 32
Figure 18. Total Life Cycle Cost by Funding Type
Figure 19 shows that even though furniture composes the largest category of equipment cost for capital projects, it has the lowest overall life cycle cost due to its long replacement cycle and minimal maintenance costs. Figure 19. Total Life Cycle Cost by Equipment Type
Figure 20 shows that the lowest costs are for the longest life span options, as would be expected. It is very important to note, however, the disproportionately smaller increase of total life cycle cost for the more frequent best practices scenarios. Relative costs for the life cycle phases are shown below for the most common equipment types: furniture, IT and science. This illustrates the importance of considering total life cycle costs rather than only initial costs when considering procurement and asset management for equipment. Figure A7 in Appendix 4 shows all the combinations of funding type and renewal periods for four representative equipment types. The complete data model can also be viewed in Appendix 2.
10.972
10.923
10.757
10.725
COP
GO Bond
CashOperating
Lease
Total Life Cycle Cost - Present Value in Millions $
IT
IT Infrastructure
AV
Science
Culinary
Health
Technology
Furniture
Total Life Cycle Cost $0 $200k $400k $600k $800k $1M $1.2M

Equipment Benchmarks for Capital Projects
Page 33
Figure 20. Total Life Cycle Cost by Renewal Cycles
Figure 21. Life Cycle Phase Costs by Funding Model
Medium Term (OFM Standard)
Best Practice
Long Term (Washington Practice)
Total Life Cycle Cost
Cash
COP
GO Bond
Operating Lease
Life Cycle Costs per Phase
Total Acquisition $ Total Residual $ Total Warranty and Maintenance $
$0 $1M $2M $3M $4M $5M $6M
$0 $1M $2M $3M $4M $5M $6M
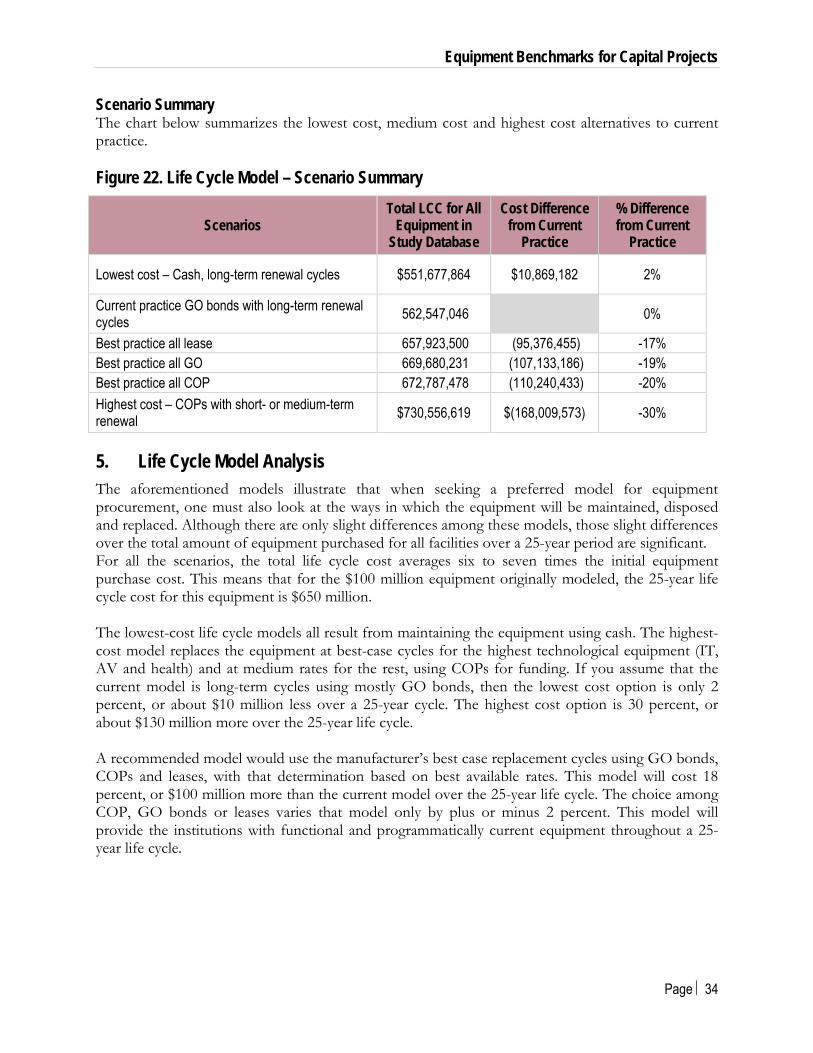
Equipment Benchmarks for Capital Projects
Page 34
Scenario Summary The chart below summarizes the lowest cost, medium cost and highest cost alternatives to current practice. Figure 22. Life Cycle Model – Scenario Summary
Scenarios Total LCC for All
Equipment in Study Database
Cost Difference from Current
Practice
% Difference from Current
Practice
Lowest cost – Cash, long-term renewal cycles $551,677,864 $10,869,182 2%
Current practice GO bonds with long-term renewal cycles 562,547,046 0%
Best practice all lease 657,923,500 (95,376,455) -17% Best practice all GO 669,680,231 (107,133,186) -19% Best practice all COP 672,787,478 (110,240,433) -20% Highest cost – COPs with short- or medium-term renewal $730,556,619 $(168,009,573) -30%
Life Cycle Model Analysis 5.
The aforementioned models illustrate that when seeking a preferred model for equipment procurement, one must also look at the ways in which the equipment will be maintained, disposed and replaced. Although there are only slight differences among these models, those slight differences over the total amount of equipment purchased for all facilities over a 25-year period are significant. For all the scenarios, the total life cycle cost averages six to seven times the initial equipment purchase cost. This means that for the $100 million equipment originally modeled, the 25-year life cycle cost for this equipment is $650 million. The lowest-cost life cycle models all result from maintaining the equipment using cash. The highest-cost model replaces the equipment at best-case cycles for the highest technological equipment (IT, AV and health) and at medium rates for the rest, using COPs for funding. If you assume that the current model is long-term cycles using mostly GO bonds, then the lowest cost option is only 2 percent, or about $10 million less over a 25-year cycle. The highest cost option is 30 percent, or about $130 million more over the 25-year life cycle. A recommended model would use the manufacturer’s best case replacement cycles using GO bonds, COPs and leases, with that determination based on best available rates. This model will cost 18 percent, or $100 million more than the current model over the 25-year life cycle. The choice among COP, GO bonds or leases varies that model only by plus or minus 2 percent. This model will provide the institutions with functional and programmatically current equipment throughout a 25-year life cycle.

Equipment Benchmarks for Capital Projects
Page 35
E. Study Findings and Conclusions
Study Findings 1.Inventory Study Findings From this inventory database, several observations become apparent: Isolated cases of permanently installed equipment are included in capital equipment requests,
but those represent a relatively small amount of total expenditures. By far the largest category and use type of equipment is general office and classroom furniture. IT equipment is the second-largest category, and in recent years, IT equipment constitutes an
increasing percentage of the total equipment costs. This category includes infrastructure and instructional program support. Much of the technical equipment includes stand-alone IT equipment (e.g., computers and peripherals) necessary for the use of the other technical equipment. This is a trend, especially in the science and health programs. This equipment is sometimes bundled and purchased with the technical equipment and in other instances shown in inventories as stand-alone IT equipment.
Accounting policy and practices do not require the tracking of loose equipment for items costing less than $5,000. State policies also allow the bundling or aggregation of individual equipment components needed for the performance of more complex system equipment. This study filtered the equipment lists in the original capital procurement database and found that more than 80 percent of the items representing more than 40 percent of the total cost fall below that $5,000 threshold.
Historical Equipment Cost Analysis Based on historical data, equipment cost per facility square foot can produce only a rough
order-of-magnitude benchmark for budgeting most project types. The ratio between spaces that require highly specialized (and therefore more costly) equipment and spaces that may contain more general office and classroom furniture varies widely among projects.
The above mix of technical and nontechnical spaces and varying ratio of these spaces represent an increasing trend as instruction gravitates toward more interdisciplinary programs.
The main exception to the above observation may be for general office and classroom furniture. This category still varies considerably across the inventory, but the narrower range of types of furniture may be more feasibly modeled than the other, more-technical specialized program equipment.
Using benchmarks for budgeting review will require more consistent definition and identification of initial cost components often included in the requests (e.g., delivery, setup, warranty, taxes, contingencies and even maintenance agreements).
Equipment Life Span Benchmarks The state adheres to national accounting standards for its equipment life span asset
management and accounting practices. These accounting standards are not representative of either recommended practice to
minimize obsolescence or of the typically much-longer periods that the equipment is retained in the inventory.
Equipment in the current inventory is typically retained for 1.5 to 2.5 times past the state’s accounting standard periods.

Equipment Benchmarks for Capital Projects
Page 36
Industry Standard Equipment Cost Benchmarks Although many states and education institutions have expressed the desire to have more
definitive equipment cost benchmarks, very few have been able to identify appropriate usable cost standards that can be applied to any significant number of cases.
Instead most have focused on improved procurement methods and management to attain the best prices for their equipment.
Washington has been paying industry standard prices for its equipment. For equipment procured as part of individual capital project packages, many opportunities
exist for better pricing with volume procurement and similar contracting mechanisms. Current Funding Practices and Policy Although the institutions depend heavily on state capital budget appropriations for equipment
funding, a significant volume of equipment is procured by cash from operating budgets and other sources.
COPs are an attractive and increasingly popular method for funding equipment. Nonappropriated funding methods are available to the research institutions for equipment
assets and may be available for a large amount of lower cost equipment that falls below the $5,000 accounting definition of depreciable assets.
Equipment Procurement and Funding Washington state institutions now take advantage of most funding options legally available to
them. A surprisingly large volume of equipment is purchased with noncapital appropriated funds. COPs are an increasingly popular funding mechanism for equipment, both nationally and in
Washington. Advantageous interest rates available to the state are competitive with most private industry
funding mechanisms. As a result, creative leasing and private funding options used in the private sector and not available to the state would not provide substantially better overall costs to the state.
The state and the institutions offer well-managed professional procurement services, competitive with many throughout the country. These include readily accessible online catalogs and procurement systems.
MEPs, particularly equity MEPs, are growing in popularity in private industry, but not used for the state’s educational institution equipment.
Life Cycle Analysis
The life cycle models, with today’s interest rates, show that the lowest costs are for the longest life span options, as would be expected.
It is important to note, however, the disproportionately smaller increase of total life cycle cost for the more frequent best-practices scenarios. There is an approximately 18 percent difference in total life cycle cost for the best-case scenario in which equipment is replaced prior to complete obsolescence (compared to the current practice of long-term renewals). This approach leads to a better user experience along with lower warranty and maintenance costs.

Equipment Benchmarks for Capital Projects
Page 37
Conclusions 2.Inventory Asset Management Today, the institutions maintain their own asset reporting and management systems with a fair amount of variation as to how they classify equipment types and names, and even more variation with their definition and aggregation of costs. Good definitions and policy do exist, but these can be better enforced and practiced at both the institution level and at the state data management level. This can be made a priority with either OFM taking the lead in its collection of data from the institutions, or with more standardized and rigorous implementation at the institution level. As a minimum, OFM could meet in workshops with the procurement officers from the institutions and identify better definition and standardization of these practices. Benchmarking Equipment Life Span The state adheres to national accounting standards for equipment life span in its accounting standards. These differ, however, in practice with all the institutions retaining equipment far longer (typically 2.5 times longer) than recommended for contemporary instructional programs. The state must continue to use its accounting standards due to federal mandate, but this study recommends the publication of a more responsive life span guideline that corresponds to industry standard recommendations. This standard is identified in this study life cycle model as the “best practice” option. Benchmarking Equipment Costs for Budget Review A primary intent for this study was to develop cost benchmarks that OFM could use when reviewing capital budget equipment requests. While some global benchmarks can be used to identify atypical project costs, further investigation will most likely find programmatic needs and circumstances supporting the variations. This study does recommend the tracking of equipment costs on both a cost-per-SF-of-facility as well as on a cost-as-a-percentage of total facility cost basis. Until now, these metrics have not been collected so they could be used for budgeting review or guidance. While necessarily a wide range, this study shows that costs for equipment for technical facilities should range from $25–$35 per SF for all except the advanced research facilities. As a percentage of total facility cost, they should range from 4–8 percent, again except for the most advanced research projects. For benchmarking to be useful, better cost data submitted with capital project requests will be necessary. In particular, initial equipment costs must clarify all cost components, including equipment, shipping, installation, tax, training and warranty costs, eligible for funding and do so in a standardized format. Second, for any facility, all the equipment as well as the facility construction to be funded beyond state appropriation need to be identified so the facility cost can be used in a benchmark formula. This study does not recommend benchmarking individual types of equipment. To do so, the state would need to narrow the available options and impose strict guidelines that apply to all facilities. These standards would need to be rewritten frequently to stay current with the increasingly changing technology that drives the need for much of this equipment. The state currently has some rough space utilization standards that have not been updated for several decades. These also would need to be updated and enforced since benchmarks for more common equipment — namely office and classroom furniture — very much depend on the definition and sizes of those spaces.

Equipment Benchmarks for Capital Projects
Page 38
Funding Mechanisms This study found that the state already uses most of the funding mechanism available for equipment procurement. It also found that from a life cycle cost basis, there is little difference from one mechanism to another. Given the current favorable interest rates for all the mechanisms, this study recommends that the institutions be given more latitude and flexibility to select funding mechanisms most advantageous at various phases of the facility life span. This will support the need to improve replacement cycles at all the institutions. To encourage the use of funding beyond initial capital bonds, the institutions need assurance that a steady, predictable source of funding is available for equipment replacement. This study highlights some revolving and trust fund programs employed in other states that accomplish this. In particular, the equipment funds used in Virginia are a good model that Washington could investigate. Equipment Procurement Practices This is an area where the state can see the largest cost improvements. Both the state and the intuitions employ contemporary procurement management programs that take advantage of bulk procurement, pre-negotiated contracts, online access, streamlined requisition and some warranty and maintenance support. These efforts, however, are not used to their fullest at each institution, with some institutions still relying most heavily on the initial capital appropriation. This study recommends that the more advanced procurements programs such as those at the University of Washington and DES work together to consolidate and cross reference some functions and to make these more readily available to other institutions. This study also recommends that the state investigate and offer commercially available MEPs for even more efficient life cycle cost management for technical equipment packages.
Equipment Benchmarks for Capital Projects
A1-1
APPENDIX 1: BIBLIOGRAPHY AND REFERENCES Angelides, Phil. California Debt Issuance Primer Handbook. California Debt and Investment Advisory Commission. November 2015
Armstrong, Lloyd Jr. and Dennis F. Dougherty. Equipment Policies & Procedures. 01 July 1999. University of Southern California. November 2015
ASTM International. “Table X1.1.” 13 Feb 2007. ASTM International. November 2015
Brown, Kathleen. Guidelines for Lease and Certificates of Participation. November 1993. California Debt Advisory Commission. November 2015
Chrappa, Carl. “What’s Hot, What’s Not in Equipment Leasing for 2015.” 2015. The Alta Group, LLC. November 2015
Equipment Index and Percent Good Factors. Jan 2009. California State Board of Equalization. November 2015
Finance & Facilities – Procurement Services. “eProcurement Catalog Suppliers.” 2015. University of Washington. November 2015
Finance & Facilities – Procurement Services. “Equipment.” 2015. University of Washington. November 2015
Fichtenbaum, Rudy. “Understanding College and University Financial Statements.” Wright State University – Department of Economics. November 2015
Gransberg, Douglas D. Major Equipment Cost Analysis. April 2015. Iowa State University Institute for Transportation. November 2015
Higher Education Equipment Trust Fund: Policies and Procedures Manual. July 2007. State Council of Higher Education for Virginia. November 2015
“Higher Education Equipment Trust Fund.” 2007. State Council of Higher Education for Virginia. November 2015
“IT Leasing and Financing: Financial and Operational Factors to Consider.” October 2008. IDC. November 2015
Jackson, Nancy Mann. “Higher Ed Procurement Co-ops Branch Out.” May 2014. University Business. November 2015
Kalavakunta, Hareesh Reddy. “Lab Equipment Procurement Models and Trends.” Sept. 3, 2013. Lab Manager. November 2015
Lawson, Ed. “Fixed Asset Policy.” Feb 18, 2015. Western Carolina University. November 2015

Equipment Benchmarks for Capital Projects
A1-2
“Medical Equipment Life Expectancy List.” November 2015
Office of Construction. Construction and Furniture Cost Benchmark Analysis. March 2009. New York University. November 2015
Office of Financial Management. Best Management Practices for Capital Projects. January 2008. Washington State. November 2015
Office of the Financial Vice President. “Capitalization and Depreciation of Property, Plant, and Equipment.” Boston College. November 2015
Office of the President. “Construction Services.” 2015. University of California. November 2015
OFM Directive 14B-02. 2015–25 Capital Budget Instructions. June 2014. Washington State. November 2015
“Program Procedures.” U. T. System Equipment Financing Program Procedures. November 2015
Research Study of Skills Center Access: Findings and Options. October 2006. CTE Services. November 2015
School Facilities and Organization. Skill Centers Capital Manual – For School Districts. September 2013. Office of Superintendent of Public Instruction. November 2015
Smith, Douglas C. “WA State RFQQ No. 15-1500 – Equipment Benchmarks for Capital Projects Study.” Sept. 15, 2015. MENG Analysis. November 2015
“State Administrative & Accounting Manual Chapter 30 – Capital Assets.” Office of Financial Management. November 2015
Taylor, Mac. The 2015–16 Budget: Higher Education Analysis. February 2015. Legislative Analyst. November 2015
The American Institute of Architects. “Masterspec – Table of Contents.” December 2014. Architectural Computer Services, Inc. November 2015
Treasury Board. Guidelines for Credit Purchases of Equipment and Energy Projects by State Agencies, Institutions, Boards & Authorities. May 1995. Commonwealth of Virginia. November 2015
Vincent, Dawn. “The ABC’s of School Debt Financing – Basic School Debt: Financing Mechanisms – Part 2.” January 2008. Stone & Youngberg. November 2015
“7.15.3 Useful Lives of Capitalized Assets.” June 16, 2010. Board of Regents of the System of Georgia. November 2015
“Benchmarking Cost Saving & Cost Avoidance.” September 2007. NASPO Benchmarking Workgroup Research Brief.

Equipment Benchmarks for Capital Projects
A1-3
“Unified Facilities Criteria (UFC).” March 2011. Department of Defense.
“Common Furniture, Fixture, Machine and Equipment Life Expectancies 2015 Property Value Study.” Texas Office of the Comptroller.
“Life Expectancy Guidelines, Attachment D.” Florida Department of Revenue.
“2010–2011 Personal Property Manual.” May 11, 2009. State of Nevada Department of Taxation.
“Stanford University Space and Furniture Planning Guidelines.” Updated April 2009. Department of Capital Planning and Space Management Land, Buildings & Real Estate, Stanford University.
Other Research Resources Society for College and University Planning (SCUP)
The Counsel of Educational Facility Planners International (CEFPI)
The Association of Physical Plant Administrators (APPA)
The National Association of College and University Business Officers (NACUBO)
The National Institute of Building Sciences (NIBS)
The U.S. General Accounting Office (GAO)
The Federal Facilities Counsel of the National Research Council
The Association of Higher Education Facilities Officers
The National School Plant Management Association (NSPMA)
U.S. Department of Education and its National Clearinghouse for Educational Facilities (NCEF) is the largest resource for both higher education and K-12 facilities management information.

Lifecycle Term Category Model Total Acquisition $Total Warranty and
Maintenance $ Total Residual $ Total Net $ Total Discount $ Cycles Total Acquisition $ / CycleTotal Warranty and
Maintenance $ / Cycle Total Residual $ / Cycle Total Net $ / Cycle Total Discount $ / CycleBest Practice 5 AV GO Bond 702,970.96$ 450,000.00$ 1,152,970.96$ 966,086.44$ 5.00 140,594.19$ 90,000.00$ 230,594.19$ 193,217.29$ Best Practice 5 AV COP 706,331.71$ 450,000.00$ 1,156,331.71$ 968,895.60$ 5.00 141,266.34$ 90,000.00$ 231,266.34$ 193,779.12$ Best Practice 5 AV Cash 691,675.14$ 450,000.00$ 1,141,675.14$ 956,644.59$ 5.00 138,335.03$ 90,000.00$ 228,335.03$ 191,328.92$ Best Practice 5 AV Operating Lease 696,247.86$ 450,000.00$ 1,146,247.86$ 960,466.79$ 5.00 139,249.57$ 90,000.00$ 229,249.57$ 192,093.36$ Medium Term (OFM Standard) 7 AV GO Bond 504,704.80$ 542,524.48$ 1,047,229.28$ 881,208.19$ 3.57 141,317.35$ 151,906.85$ 293,224.20$ 246,738.29$ Medium Term (OFM Standard) 7 AV COP 508,299.36$ 542,524.48$ 1,050,823.83$ 884,211.47$ 3.57 142,323.82$ 151,906.85$ 294,230.67$ 247,579.21$ Medium Term (OFM Standard) 7 AV Cash 492,662.50$ 542,524.48$ 1,035,186.98$ 871,146.75$ 3.57 137,945.50$ 151,906.85$ 289,852.36$ 243,921.09$ Medium Term (OFM Standard) 7 AV Operating Lease 497,530.02$ 542,524.48$ 1,040,054.50$ 875,213.60$ 3.57 139,308.41$ 151,906.85$ 291,215.26$ 245,059.81$ Long Term (Washington Practice) 10 AV GO Bond 354,727.11$ 645,685.48$ 1,000,412.58$ 842,107.56$ 2.50 141,890.84$ 258,274.19$ 400,165.03$ 336,843.02$ Long Term (Washington Practice) 10 AV COP 358,477.31$ 645,685.48$ 1,004,162.79$ 845,241.42$ 2.50 143,390.92$ 258,274.19$ 401,665.11$ 338,096.57$ Long Term (Washington Practice) 10 AV Cash 342,222.37$ 645,685.48$ 987,907.85$ 831,657.95$ 2.50 136,888.95$ 258,274.19$ 395,163.14$ 332,663.18$ Long Term (Washington Practice) 10 AV Operating Lease 347,265.67$ 645,685.48$ 992,951.14$ 835,872.39$ 2.50 138,906.27$ 258,274.19$ 397,180.46$ 334,348.96$ Best Practice 10 Culinary GO Bond 363,172.99$ 137,581.21$ 7,357.81$ 493,396.39$ 414,278.80$ 2.50 145,269.20$ 55,032.49$ 2,943.12$ 197,358.56$ 165,711.52$ Best Practice 10 Culinary COP 367,012.48$ 137,581.21$ 7,357.81$ 497,235.89$ 417,487.28$ 2.50 146,804.99$ 55,032.49$ 2,943.12$ 198,894.35$ 166,994.91$ Best Practice 10 Culinary Cash 350,370.52$ 137,581.21$ 7,357.81$ 480,593.93$ 403,580.40$ 2.50 140,148.21$ 55,032.49$ 2,943.12$ 192,237.57$ 161,432.16$ Best Practice 10 Culinary Operating Lease 344,324.87$ 137,581.21$ 481,906.08$ 404,541.84$ 2.50 137,729.95$ 55,032.49$ 192,762.43$ 161,816.74$ Medium Term (OFM Standard) 5 Culinary GO Bond 719,708.36$ 131,067.09$ 124,931.24$ 725,844.21$ 611,349.72$ 5.00 143,941.67$ 26,213.42$ 24,986.25$ 145,168.84$ 122,269.94$ Medium Term (OFM Standard) 5 Culinary COP 723,149.13$ 131,067.09$ 124,931.24$ 729,284.99$ 614,225.77$ 5.00 144,629.83$ 26,213.42$ 24,986.25$ 145,857.00$ 122,845.15$ Medium Term (OFM Standard) 5 Culinary Cash 708,143.60$ 131,067.09$ 124,931.24$ 714,279.45$ 601,683.06$ 5.00 141,628.72$ 26,213.42$ 24,986.25$ 142,855.89$ 120,336.61$ Medium Term (OFM Standard) 5 Culinary Operating Lease 565,765.56$ 131,067.09$ 696,832.65$ 584,196.17$ 5.00 113,153.11$ 26,213.42$ 139,366.53$ 116,839.23$ Long Term (Washington Practice) 15 Culinary GO Bond 243,492.35$ 144,500.03$ 387,992.38$ 326,275.89$ 1.67 146,095.41$ 86,700.02$ 232,795.43$ 195,765.54$ Long Term (Washington Practice) 15 Culinary COP 247,426.08$ 144,500.03$ 391,926.10$ 329,568.32$ 1.67 148,455.65$ 86,700.02$ 235,155.66$ 197,740.99$ Long Term (Washington Practice) 15 Culinary Cash 230,472.00$ 144,500.03$ 374,972.03$ 315,378.18$ 1.67 138,283.20$ 86,700.02$ 224,983.22$ 189,226.91$ Long Term (Washington Practice) 15 Culinary Operating Lease 235,704.94$ 144,500.03$ 380,204.97$ 319,758.02$ 1.67 141,422.96$ 86,700.02$ 228,122.98$ 191,854.81$ Best Practice 15 Furniture GO Bond 243,492.35$ 243,492.35$ 203,797.10$ 1.67 146,095.41$ 146,095.41$ 122,278.26$ Best Practice 15 Furniture COP 247,426.08$ 247,426.08$ 207,089.53$ 1.67 148,455.65$ 148,455.65$ 124,253.72$ Best Practice 15 Furniture Cash 230,472.00$ 230,472.00$ 192,899.39$ 1.67 138,283.20$ 138,283.20$ 115,739.63$ Best Practice 15 Furniture Operating Lease 235,704.94$ 235,704.94$ 197,279.23$ 1.67 141,422.96$ 141,422.96$ 118,367.54$ Medium Term (OFM Standard) 10 Furniture GO Bond 363,172.99$ 7,357.81$ 355,815.18$ 297,472.57$ 2.50 145,269.20$ 2,943.12$ 142,326.07$ 118,989.03$ Medium Term (OFM Standard) 10 Furniture COP 367,012.48$ 7,357.81$ 359,654.67$ 300,681.04$ 2.50 146,804.99$ 2,943.12$ 143,861.87$ 120,272.42$ Medium Term (OFM Standard) 10 Furniture Cash 350,370.52$ 7,357.81$ 343,012.71$ 286,774.16$ 2.50 140,148.21$ 2,943.12$ 137,205.08$ 114,709.67$ Medium Term (OFM Standard) 10 Furniture Operating Lease 344,324.87$ 344,324.87$ 287,735.61$ 2.50 137,729.95$ 137,729.95$ 115,094.24$ Long Term (Washington Practice) 25 Furniture GO Bond 138,609.26$ 138,609.26$ 117,769.88$ 1.00 138,609.26$ 138,609.26$ 117,769.88$ Long Term (Washington Practice) 25 Furniture COP 142,308.82$ 142,308.82$ 120,913.22$ 1.00 142,308.82$ 142,308.82$ 120,913.22$ Long Term (Washington Practice) 25 Furniture Cash 126,522.12$ 126,522.12$ 107,500.00$ 1.00 126,522.12$ 126,522.12$ 107,500.00$ Long Term (Washington Practice) 25 Furniture Operating Lease 131,349.46$ 131,349.46$ 111,601.56$ 1.00 131,349.46$ 131,349.46$ 111,601.56$ Best Practice 10 Health GO Bond 388,510.64$ 322,207.35$ 7,357.81$ 703,360.18$ 592,014.40$ 2.50 155,404.26$ 128,882.94$ 2,943.12$ 281,344.07$ 236,805.76$ Best Practice 10 Health COP 392,618.01$ 322,207.35$ 7,357.81$ 707,467.55$ 595,446.73$ 2.50 157,047.20$ 128,882.94$ 2,943.12$ 282,987.02$ 238,178.69$ Best Practice 10 Health Cash 374,814.98$ 322,207.35$ 7,357.81$ 689,664.52$ 580,569.60$ 2.50 149,925.99$ 128,882.94$ 2,943.12$ 275,865.81$ 232,227.84$ Best Practice 10 Health Operating Lease 368,347.53$ 322,207.35$ 690,554.88$ 581,178.57$ 2.50 147,339.01$ 128,882.94$ 276,221.95$ 232,471.43$ Medium Term (OFM Standard) 12 Health GO Bond 320,182.56$ 383,213.27$ 703,395.83$ 588,657.12$ 2.08 153,687.63$ 183,942.37$ 337,630.00$ 282,555.42$ Medium Term (OFM Standard) 12 Health COP 324,290.67$ 383,213.27$ 707,503.94$ 592,097.82$ 2.08 155,659.52$ 183,942.37$ 339,601.89$ 284,206.95$ Medium Term (OFM Standard) 12 Health Cash 306,525.72$ 383,213.27$ 689,738.99$ 577,218.97$ 2.08 147,132.35$ 183,942.37$ 331,074.72$ 277,065.11$ Medium Term (OFM Standard) 12 Health Operating Lease 312,025.83$ 383,213.27$ 695,239.10$ 581,825.54$ 2.08 149,772.40$ 183,942.37$ 333,714.77$ 279,276.26$ Long Term (Washington Practice) 14 Health GO Bond 276,721.97$ 400,380.70$ 677,102.67$ 566,741.09$ 1.79 154,964.30$ 224,213.19$ 379,177.49$ 317,375.01$ Long Term (Washington Practice) 14 Health COP 280,888.16$ 400,380.70$ 681,268.86$ 570,230.79$ 1.79 157,297.37$ 224,213.19$ 381,510.56$ 319,329.24$ Long Term (Washington Practice) 14 Health Cash 262,912.48$ 400,380.70$ 663,293.18$ 555,173.95$ 1.79 147,230.99$ 224,213.19$ 371,444.18$ 310,897.41$ Long Term (Washington Practice) 14 Health Operating Lease 268,466.35$ 400,380.70$ 668,847.05$ 559,826.00$ 1.79 150,341.16$ 224,213.19$ 374,554.35$ 313,502.56$ Best Practice 3 IT GO Bond 1,259,222.39$ 250,000.00$ 134,729.01$ 1,374,493.38$ 1,152,423.28$ 8.33 151,106.69$ 30,000.00$ 16,167.48$ 164,939.21$ 138,290.79$ Best Practice 3 IT COP 1,262,252.95$ 250,000.00$ 134,729.01$ 1,377,523.94$ 1,154,954.84$ 8.33 151,470.35$ 30,000.00$ 16,167.48$ 165,302.87$ 138,594.58$ Best Practice 3 IT Cash 1,249,002.17$ 250,000.00$ 134,729.01$ 1,364,273.16$ 1,143,885.84$ 8.33 149,880.26$ 30,000.00$ 16,167.48$ 163,712.78$ 137,266.30$ Best Practice 3 IT Operating Lease 1,074,706.96$ 250,000.00$ 1,324,706.96$ 1,110,167.43$ 8.33 128,964.83$ 30,000.00$ 158,964.83$ 133,220.09$ Medium Term (OFM Standard) 4 IT GO Bond 944,177.76$ 340,000.00$ 49,927.12$ 1,234,250.63$ 1,035,391.98$ 6.25 151,068.44$ 54,400.00$ 7,988.34$ 197,480.10$ 165,662.72$ Medium Term (OFM Standard) 4 IT COP 947,574.74$ 340,000.00$ 49,927.12$ 1,237,647.62$ 1,038,229.90$ 6.25 151,611.96$ 54,400.00$ 7,988.34$ 198,023.62$ 166,116.78$ Medium Term (OFM Standard) 4 IT Cash 932,741.13$ 340,000.00$ 49,927.12$ 1,222,814.01$ 1,025,837.56$ 6.25 149,238.58$ 54,400.00$ 7,988.34$ 195,650.24$ 164,134.01$ Medium Term (OFM Standard) 4 IT Operating Lease 871,784.57$ 340,000.00$ 1,211,784.57$ 1,016,088.70$ 6.25 139,485.53$ 54,400.00$ 193,885.53$ 162,574.19$ Long Term (Washington Practice) 8 IT GO Bond 471,247.83$ 610,168.31$ 1,081,416.14$ 907,046.46$ 3.13 150,799.30$ 195,253.86$ 346,053.16$ 290,254.87$ Long Term (Washington Practice) 8 IT COP 475,149.93$ 610,168.31$ 1,085,318.24$ 910,309.20$ 3.13 152,047.98$ 195,253.86$ 347,301.84$ 291,298.94$ Long Term (Washington Practice) 8 IT Cash 458,195.99$ 610,168.31$ 1,068,364.30$ 896,133.22$ 3.13 146,622.72$ 195,253.86$ 341,876.58$ 286,762.63$ Long Term (Washington Practice) 8 IT Operating Lease 463,467.64$ 610,168.31$ 1,073,635.95$ 900,541.09$ 3.13 148,309.64$ 195,253.86$ 343,563.50$ 288,173.15$
APPENDIX 2: LIFE CYCLE MODEL DETAIL
A2-1

Best Practice 5 IT Infrastructure GO Bond 753,183.17$ 450,000.00$ 1,203,183.17$ 1,008,057.42$ 5.00 150,636.63$ 90,000.00$ 240,636.63$ 201,611.48$ Best Practice 5 IT Infrastructure COP 756,783.98$ 450,000.00$ 1,206,783.98$ 1,011,067.23$ 5.00 151,356.80$ 90,000.00$ 241,356.80$ 202,213.45$ Best Practice 5 IT Infrastructure Cash 741,080.51$ 450,000.00$ 1,191,080.51$ 997,941.15$ 5.00 148,216.10$ 90,000.00$ 238,216.10$ 199,588.23$ Best Practice 5 IT Infrastructure Operating Lease 745,979.85$ 450,000.00$ 1,195,979.85$ 1,002,036.37$ 5.00 149,195.97$ 90,000.00$ 239,195.97$ 200,407.27$ Medium Term (OFM Standard) 6 IT Infrastructure GO Bond 628,987.58$ 513,318.00$ 1,142,305.58$ 958,031.58$ 4.17 150,957.02$ 123,196.32$ 274,153.34$ 229,927.58$ Medium Term (OFM Standard) 6 IT Infrastructure COP 632,733.55$ 513,318.00$ 1,146,051.55$ 961,162.09$ 4.17 151,856.05$ 123,196.32$ 275,052.37$ 230,678.90$ Medium Term (OFM Standard) 6 IT Infrastructure Cash 616,417.70$ 513,318.00$ 1,129,735.70$ 947,526.92$ 4.17 147,940.25$ 123,196.32$ 271,136.57$ 227,406.46$ Medium Term (OFM Standard) 6 IT Infrastructure Operating Lease 621,502.29$ 513,318.00$ 1,134,820.29$ 951,776.12$ 4.17 149,160.55$ 123,196.32$ 272,356.87$ 228,426.27$ Long Term (Washington Practice) 10 IT Infrastructure GO Bond 380,064.76$ 645,685.48$ 1,025,750.23$ 863,281.00$ 2.50 152,025.90$ 258,274.19$ 410,300.09$ 345,312.40$ Long Term (Washington Practice) 10 IT Infrastructure COP 384,082.83$ 645,685.48$ 1,029,768.31$ 866,638.71$ 2.50 153,633.13$ 258,274.19$ 411,907.32$ 346,655.48$ Long Term (Washington Practice) 10 IT Infrastructure Cash 366,666.83$ 645,685.48$ 1,012,352.30$ 852,085.00$ 2.50 146,666.73$ 258,274.19$ 404,940.92$ 340,834.00$ Long Term (Washington Practice) 10 IT Infrastructure Operating Lease 372,070.36$ 645,685.48$ 1,017,755.84$ 856,600.47$ 2.50 148,828.14$ 258,274.19$ 407,102.33$ 342,640.19$ Best Practice 10 Science GO Bond 371,618.87$ 322,207.35$ 693,826.23$ 583,912.28$ 2.50 148,647.55$ 128,882.94$ 277,530.49$ 233,564.91$ Best Practice 10 Science COP 375,547.66$ 322,207.35$ 697,755.01$ 587,195.37$ 2.50 150,219.06$ 128,882.94$ 279,102.00$ 234,878.15$ Best Practice 10 Science Cash 358,518.67$ 322,207.35$ 680,726.03$ 572,965.07$ 2.50 143,407.47$ 128,882.94$ 272,290.41$ 229,186.03$ Best Practice 10 Science Operating Lease 363,802.13$ 322,207.35$ 686,009.48$ 577,380.20$ 2.50 145,520.85$ 128,882.94$ 274,403.79$ 230,952.08$ Medium Term (OFM Standard) 5 Science GO Bond 736,445.76$ 187,500.00$ 83,287.49$ 840,658.27$ 707,202.46$ 5.00 147,289.15$ 37,500.00$ 16,657.50$ 168,131.65$ 141,440.49$ Medium Term (OFM Standard) 5 Science COP 739,966.56$ 187,500.00$ 83,287.49$ 844,179.06$ 710,145.40$ 5.00 147,993.31$ 37,500.00$ 16,657.50$ 168,835.81$ 142,029.08$ Medium Term (OFM Standard) 5 Science Cash 724,612.06$ 187,500.00$ 83,287.49$ 828,824.56$ 697,311.00$ 5.00 144,922.41$ 37,500.00$ 16,657.50$ 165,764.91$ 139,462.20$ Medium Term (OFM Standard) 5 Science Operating Lease 629,082.77$ 187,500.00$ 816,582.77$ 685,142.70$ 5.00 125,816.55$ 37,500.00$ 163,316.55$ 137,028.54$ Long Term (Washington Practice) 15 Science GO Bond 249,154.97$ 402,589.26$ 651,744.23$ 546,216.43$ 1.67 149,492.98$ 241,553.56$ 391,046.54$ 327,729.86$ Long Term (Washington Practice) 15 Science COP 253,180.17$ 402,589.26$ 655,769.43$ 549,585.43$ 1.67 151,908.10$ 241,553.56$ 393,461.66$ 329,751.26$ Long Term (Washington Practice) 15 Science Cash 235,831.82$ 402,589.26$ 638,421.08$ 535,065.28$ 1.67 141,499.09$ 241,553.56$ 383,052.65$ 321,039.17$ Long Term (Washington Practice) 15 Science Operating Lease 241,186.45$ 402,589.26$ 643,775.71$ 539,546.98$ 1.67 144,711.87$ 241,553.56$ 386,265.43$ 323,728.19$ Best Practice 12 Technology GO Bond 306,261.58$ 212,919.27$ 519,180.85$ 436,872.13$ 2.08 147,005.56$ 102,201.25$ 249,206.81$ 209,698.62$ Best Practice 12 Technology COP 310,191.07$ 212,919.27$ 523,110.34$ 440,163.24$ 2.08 148,891.71$ 102,201.25$ 251,092.97$ 211,278.35$ Best Practice 12 Technology Cash 293,198.52$ 212,919.27$ 506,117.79$ 425,931.30$ 2.08 140,735.29$ 102,201.25$ 242,936.54$ 204,447.02$ Best Practice 12 Technology Operating Lease 298,459.49$ 212,919.27$ 511,378.77$ 430,337.57$ 2.08 143,260.56$ 102,201.25$ 245,461.81$ 206,562.03$ Medium Term (OFM Standard) 10 Technology GO Bond 371,618.87$ 206,371.82$ 577,990.69$ 485,753.24$ 2.50 148,647.55$ 82,548.73$ 231,196.28$ 194,301.30$ Medium Term (OFM Standard) 10 Technology COP 375,547.66$ 206,371.82$ 581,919.48$ 489,036.33$ 2.50 150,219.06$ 82,548.73$ 232,767.79$ 195,614.53$ Medium Term (OFM Standard) 10 Technology Cash 358,518.67$ 206,371.82$ 564,890.49$ 474,806.04$ 2.50 143,407.47$ 82,548.73$ 225,956.20$ 189,922.41$ Medium Term (OFM Standard) 10 Technology Operating Lease 363,802.13$ 206,371.82$ 570,173.95$ 479,221.16$ 2.50 145,520.85$ 82,548.73$ 228,069.58$ 191,688.47$ Long Term (Washington Practice) 25 Technology GO Bond 141,832.73$ 251,913.46$ 393,746.19$ 330,938.04$ 1.00 141,832.73$ 251,913.46$ 393,746.19$ 330,938.04$ Long Term (Washington Practice) 25 Technology COP 145,618.32$ 251,913.46$ 397,531.78$ 334,154.48$ 1.00 145,618.32$ 251,913.46$ 397,531.78$ 334,154.48$ Long Term (Washington Practice) 25 Technology Cash 129,464.50$ 251,913.46$ 381,377.95$ 320,429.32$ 1.00 129,464.50$ 251,913.46$ 381,377.95$ 320,429.32$ Long Term (Washington Practice) 25 Technology Operating Lease 134,404.10$ 251,913.46$ 386,317.55$ 324,626.27$ 1.00 134,404.10$ 251,913.46$ 386,317.55$ 324,626.27$ Best Practice 0 Unused 1 GO Bond 0.00Best Practice 0 Unused 1 COP 0.00Best Practice 0 Unused 1 Cash 0.00Best Practice 0 Unused 1 Operating Lease 0.00Medium Term (OFM Standard) 0 Unused 1 GO Bond 0.00Medium Term (OFM Standard) 0 Unused 1 COP 0.00Medium Term (OFM Standard) 0 Unused 1 Cash 0.00Medium Term (OFM Standard) 0 Unused 1 Operating Lease 0.00Long Term (Washington Practice) 0 Unused 1 GO Bond 0.00Long Term (Washington Practice) 0 Unused 1 COP 0.00Long Term (Washington Practice) 0 Unused 1 Cash 0.00Long Term (Washington Practice) 0 Unused 1 Operating Lease 0.00Best Practice 0 Unused 2 GO Bond 0.00Best Practice 0 Unused 2 COP 0.00Best Practice 0 Unused 2 Cash 0.00Best Practice 0 Unused 2 Operating Lease 0.00Medium Term (OFM Standard) 0 Unused 2 GO Bond 0.00Medium Term (OFM Standard) 0 Unused 2 COP 0.00Medium Term (OFM Standard) 0 Unused 2 Cash 0.00Medium Term (OFM Standard) 0 Unused 2 Operating Lease 0.00Long Term (Washington Practice) 0 Unused 2 GO Bond 0.00Long Term (Washington Practice) 0 Unused 2 COP 0.00Long Term (Washington Practice) 0 Unused 2 Cash 0.00Long Term (Washington Practice) 0 Unused 2 Operating Lease 0.00
APPENDIX 2: LIFE CYCLE MODEL DETAIL
A2-2

A3-1
APPENDIX 3: STUDY PARTICIPANTS AND CONTRIBUTORS The following state employees, and institution representatives, out of state experts, and equipment vendors/distributors/consultants contributed valuable data and feedback for this report. Washington State Gene Emmans – OFM Capital Budget Assistant to the Governor Nona Snell – OFM Senior Budget Assistant to the Governor Wendy Kancianich Debt Program Administrator, Office of the State Treasurer Christine Thomas House Office of Program Research K-12 and Higher Education Capital Analyst Higher Education Institutions Western Washington University Rick Benner Director of Facilities and Capital Budget Western Washington University Dianna Rosen Assistant Director, Capital Budget Eastern Washington University Shawn King Associate Vice President for Facilities Central Washington University Bill Yarwood Executive Director for Capital Planning and Projects
Washington State University Deborah Carlson Capital Budget Director University of Washington Alan Nygaard Director of Capital Projects University of Washington Lauri Hunt Director of eProcurement The Evergreen State College Jeanne Rynne Director of Facilities Oregon State University Kelly Kozisek Chief Procurement Officer State Board for Community and Technical Colleges Wayne Doty Capital Budget Director Office of Superintendent of Public Instruction Thomas Carver Program Administrator Randy Newman Business Manager

A3-2
Out-of-State Experts Michael Maul Virginia Department of Planning and Budget Janet Aylor Director of Debt Management Virginia Department of the Treasury Judy Heiman California Legislative Analyst’s Office Paul Golaszewski California Legislative Analyst’s Office Deborah Wylie California Legislative Analyst’s Office
Enterprise Lease Solutions Louis Centolella III President
MENG Analysis Eric Meng President Sarah Partap Project Manager Doug Smith Director of Engineering Jeffrey Mitchell Project Technician John Boatman Cost Manager Adrianne Larsen Project Coordinator
Vendor/Supplier Name Representative
Graybar Ed Davidson BiNw Todd Cunningham KCDA Dave Mahalco Coi Toni Stinneta Electrocom Dan Crabtree Alden Associates Jordan Dell Charlene Merritt and Brett Hansen Thermo Fisher Mac Pinski Labconco Tyler Nysoe Scientific Supply Cliff Laerdal Danielle Bassani Bargreen-Ellingson Lindsay Smith Clevenger Tony Clevenger Aramark Steve Wadsworth Peterson Hydraulics Dan Peterson NJPA Paul Drange

APPENDIX 4: DATA TABLES Figure A1. SBCTC Inventory Cost of Equipment by Facility Use Categories – Top Categories by Cost of Equipment
Desktop ComputersServers
Data Communications Equipment (Multiplexers,…Laptops and Notebook Computers
Vehicles, Medium and Heavy DutyPhotographic Projection Equipment
Equipment, Instruments, Devices, LaboratoryOther IT Accessorial Equipment and Components…
Misc. Training Aids and DevicesMilling Machines
Main Frame Computer SystemsMotor Vehicle Maintenance and Repair Shop Equipment
Telephone and Telegraph Equipment, Cell PhonesTraining Aids, Medical
Medical and Surgical Instruments, EquipmentAircraft, Fixed Wing
Lathes, MetalworkingVehicle/Passenger Vessels (Ferry Boats)
X-ray Equipment, Medical, Dental, VeterinaryCommunications Equipment, Industrial and Commercial
Misc. Aircraft Accessories and ComponentsDental Instruments and Equipment
Laser PrintersInput/Output and Storage Devices - Other
Sound Recording and Reproduction Equipment,…Hospital Equipment
Kitchen Equipment and Appliances, Commercial
$0 $10,000,000 $20,000,000 $30,000,000
A4-1

Figure A2. Highest Cost Items on Capital Equipment Request Lists
Equipment Cost Quantity
Lab casework & specialties $2,043,648 2 T734475, Knoll and Watson Products 1,363,305 2 Furniture 1,123,995 24 ATUS CLASSROOM MEDIATION EQUIPMENT 849,269 2 Ultrasound Machines 769,237 2 Scanning Electron Microscope (SEM) 754,000 1 AV systems for GLA per RFP CCC-28 734,394 1 Furniture Package 720,494 4 Supply, install and provide post installation training of equipment for audio visual systems in the new Science and Allied Health Building per RFP 04-01-209-C and all addendum.
645,797 1
AC/DC Motor Controls Bench, 630,763 1 Polytec 3-D Scanning Laser Vibrometer w/accessories 613,000 1 ATUS MEDIA PURCHASE AND INSTALL 557,628 2 Allentown Vent Racks 140 550,151 1 Classroom Tablet PC's 536,193 1 PSYCH, CONFOCAL, RESEARCH, STEREO, AND INVERTED MICROSCOPES 512,452 1 Interior furnishings 508,137 1 T645453, Steelcase furniture 468,960 1 Torsion Chairs 465,268 1 CH-2: KI- Product:Piretti Xylon Chair, 423,911 1 PSYCH VENTILATED CAGE RACKS FOR RODENTS 421,000 1 Cage & Rack Washers 374,087 1 Chair $370,579 13
A4-2

Figure A3. Life Cycle Model Metrics
Figure A4. Acquisition Costs by Equipment Types Category Freight Cost % Install Cost % Tax Cost % GO Bond COP Cash Operating Lease
AV 2.50% 2.50% 0.00% 5.00% 5.00% 5.00% 5.00%
Culinary 2.50% 5.00% 0.00% 7.50% 7.50% 7.50% 7.50%
Furniture 5.00% 2.50% 0.00% 7.50% 7.50% 7.50% 7.50%
Health 5.00% 10.00% 0.00% 15.00% 15.00% 15.00% 15.00%
IT 2.50% 10.00% 0.00% 12.50% 12.50% 12.50% 12.50%
IT Infrastructure 2.50% 10.00% 0.00% 12.50% 12.50% 12.50% 12.50%
Science 5.00% 5.00% 0.00% 10.00% 10.00% 10.00% 10.00%
Technology 5.00% 5.00% 0.00% 10.00% 10.00% 10.00% 1.00%
Metrics Category 1
Category 2
Category 3
Category 4
Category 5 Category 6 Category
7 Category 8
Category Name AV Culinary Furniture Health IT IT
Infrastructure Science Technology
OEC $100,000 $100,000 $100,000 $100,000 $100,000 $100,000 $100,000 $100,000 Best Practice 5 10 15 10 3 5 10 12
Medium Term (OFM Standard)
7 5 10 12 4 6 5 10
A4-3

Figure A5. Usage, Warranty, and Maintenance Costs by Equipment Types
Category 1 2 3 4 5 6 7 8 9 10
AV 10.00% 10.00% 10.00% 25.00% 35.00% 35.83% 36.68% 37.55% 38.44% 39.35%
Culinary 5.00% 5.12% 5.24% 5.36% 5.49% 5.62% 5.75% 5.89% 6.03% 6.17%
Furniture 0.00% 0.00% 0.00% 0.00% 0.00% 0.00% 0.00% 0.00% 0.00% 0.00%
Health 7.50% 7.50% 7.50% 7.50% 7.50% 20.00% 20.47% 20.96% 21.46% 21.96%
IT 10.00% 10.00% 10.00% 25.00% 35.00% 35.83% 36.68% 37.55% 38.44% 39.35% IT Infrastructure 10.00% 10.00% 10.00% 25.00% 35.00% 35.83% 36.68% 37.55% 38.44% 39.35%
Science 7.50% 7.50% 7.50% 7.50% 7.50% 20.00% 20.47% 20.60% 21.46% 21.96%
Technology 7.50% 7.68% 7.86% 8.05% 8.24% 8.43% 8.63% 8.84% 9.05% 9.26%
Category 11 12 13 14 15 16 17 18 19 20
AV 40.28% 41.24% 42.21% 43.21% 44.24% 45.29% 46.36% 47.46% 48.58% 49.73%
Culinary 6.32% 6.47% 6.62% 6.78% 6.94% 7.10% 7.27% 7.45% 7.62% 7.80%
Furniture 0.00% 0.00% 0.00% 0.00% 0.00% 0.00% 0.00% 0.00% 0.00% 0.00%
Health 22.49% 23.02% 23.56% 24.12% 24.69% 25.28% 25.88% 26.49% 27.12% 27.76%
IT 40.28% 41.24% 42.21% 43.21% 44.24% 45.29% 46.36% 47.46% 48.58% 49.73% IT Infrastructure 40.28% 41.24% 42.21% 43.21% 44.24% 45.29% 46.36% 47.46% 48.58% 49.73%
Science 22.49% 23.02% 23.56% 24.12% 24.69% 25.28% 25.88% 26.49% 27.12% 27.76%
Technology 9.48% 9.70% 9.93% 10.17% 10.41% 10.66% 10.91% 11.17% 11.43% 11.70%
A4-4

Figure A6. Residual Costs by Equipment Types
Category 1 2 3 4 5 6 7 8 9 10
AV 40.00% 30.00% 20.00% 10.00% 0.00% 0.00% 0.00% 0.00% 0.00% 0.00%
Culinary 50.00% 45.00% 40.00% 35.00% 30.00% 25.00% 20.00% 15.00% 10.00% 5.00%
Furniture 50.00% 45.00% 40.00% 35.00% 30.00% 25.00% 20.00% 15.00% 10.00% 5.00%
Health 50.00% 45.00% 40.00% 35.00% 30.00% 25.00% 20.00% 15.00% 10.00% 5.00%
IT 40.00% 30.00% 20.00% 10.00% 0.00% 0.00% 0.00% 0.00% 0.00% 0.00% IT Infrastructure 40.00% 30.00% 20.00% 10.00% 0.00% 0.00% 0.00% 0.00% 0.00% 0.00%
Science 60.00% 50.00% 40.00% 30.00% 20.00% 10.00% 0.00% 0.00% 0.00% 0.00%
Technology 60.00% 50.00% 40.00% 30.00% 25.00% 20.00% 15.00% 10.00% 5.00% 0.00%
Category 11 12 13 14 15 16 17 18 19 20
AV 0.00% 0.00% 0.00% 0.00% 0.00% 0.00% 0.00% 0.00% 0.00% 0.00%
Culinary 0.00% 0.00% 0.00% 0.00% 0.00% 0.00% 0.00% 0.00% 0.00% 0.00%
Furniture 0.00% 0.00% 0.00% 0.00% 0.00% 0.00% 0.00% 0.00% 0.00% 0.00%
Health 0.00% 0.00% 0.00% 0.00% 0.00% 0.00% 0.00% 0.00% 0.00% 0.00%
IT 0.00% 0.00% 0.00% 0.00% 0.00% 0.00% 0.00% 0.00% 0.00% 0.00% IT Infrastructure 0.00% 0.00% 0.00% 0.00% 0.00% 0.00% 0.00% 0.00% 0.00% 0.00%
Science 0.00% 0.00% 0.00% 0.00% 0.00% 0.00% 0.00% 0.00% 0.00% 0.00%
Technology 0.00% 0.00% 0.00% 0.00% 0.00% 0.00% 0.00% 0.00% 0.00% 0.00%
A4-5

Figure A7. Life Cycle Model – All Scenarios for Four Equipment Types
0 200,000 400,000 600,000 800,000 1,000,000 1,200,000 1,400,000
Cash
COP
GO Bond
Operating Lease
Cash
COP
GO Bond
Operating Lease
Cash
COP
GO Bond
Operating Lease
Cash
COP
GO Bond
Operating Lease
Furn
iture
Healt
hIT
Scien
ce
Complete LCCA Model - Representative
Long Term (Washington Practice) Medium Term (OFM Standard) Best Practice
A4-6