Equilibrium Moisture and Drying Kinetics Modelling of ...
15
clean technologies Article Equilibrium Moisture and Drying Kinetics Modelling of Macroalgae Species Ulva ohnoi and Oedogonium intermedium Craig Walker 1 , Andrew Cole 2 , Elsa Antunes 1 and Madoc Sheehan 1, * 1 College of Science and Engineering, James Cook University, Townsville 4811, Australia; [email protected] (C.W.); [email protected] (E.A.) 2 MACRO—The Centre for Macroalgal Resources and Biotechnology, College of Science and Engineering, James Cook University, Townsville 4811, Australia; [email protected] * Correspondence: [email protected]; Tel.: +61-747-814-153 Received: 27 February 2020; Accepted: 15 June 2020; Published: 22 June 2020 Abstract: Algae-based products have applications in the food and pharmaceutical industries, bioremediation of waste streams and biofuel production. Drying has been recognised to constitute the largest energy cost in algae processing, yet there is limited data or modelling characterising the drying kinetics of macroalgae. This research modelled the equilibrium moisture content of two macroalgae species, Ulva ohnoi, a saltwater alga and Oedogonium intermedium, a freshwater alga. The Guggenheim–Anderson–de Boer model was found to best represent experimental equilibrium moisture contents. Drying rate curves obtained under both convective and radiative conditions were fitted to an analytical solution of Fick’s second law, including the modelled equilibrium moisture values. Effective diffusivity values for the two species are presented. Keywords: macroalgae; drying rates; equilibrium moisture; diffusion modelling 1. Introduction Algae have been identified as a renewable resource that can be utilised for a range of products such as fertilisers and animal feeds, human food supplements, nutraceuticals, specialty chemicals, and bioenergy [1–3]. Historically the majority of research has focused on the development of microalgae, which are small single-celled algae. However, the commercial development of microalgae has been limited to high-value niche applications due to the technical difficulties and cost of large-scale cultivation and dewatering [4]. More recently, research effort in bioprocessing has broadened to include macroalgae, which are large multicellular alga found in both marine and freshwater environments. Due to their larger size and ease of harvesting, macroalgae are well suited to large-scale outdoor cultivation. Macroalgae have the capacity to complement existing industries and drive sustainability and circular economy objectives by utilising their waste nutrients and water, effectively creating a sustainable source of high-protein biomass from waste inputs [5,6]. Neveux et al. [7] found that a freshwater species of macroalgae, Oedogonium intermedium (Chlorophyta), had the highest biocrude yield of a range of species, using hydrothermal liquefaction. Zeraatkar et al. [8] performed a review of algae in bioremediation of heavy metals from wastewater, which concluded both macro- and micro-algae were suitable candidates. Castine et al. [9] considered the use of macroalgae to treat wastewater from aquaculture, including added value from algae products. An assessment of the potential for algae in bioremediation was performed by Lawton et al. [10], where the saltwater macroalga Ulva ohnoi (Chlorophyta) was found to have the highest growth rates of a range of local species. Several macroalgae species including O. intermedium and Asparagopsis taxiformis (Rhodophyta) have potential Clean Technol. 2020, 2, 225–239; doi:10.3390/cleantechnol2020015 www.mdpi.com/journal/cleantechnol
Transcript of Equilibrium Moisture and Drying Kinetics Modelling of ...
clean technologies
Article
Equilibrium Moisture and Drying Kinetics Modellingof Macroalgae Species Ulva ohnoi andOedogonium intermedium
Craig Walker 1, Andrew Cole 2, Elsa Antunes 1 and Madoc Sheehan 1,*1 College of Science and Engineering, James Cook University, Townsville 4811, Australia;
[email protected] (C.W.); [email protected] (E.A.)2 MACRO—The Centre for Macroalgal Resources and Biotechnology, College of Science and Engineering,
James Cook University, Townsville 4811, Australia; [email protected]* Correspondence: [email protected]; Tel.: +61-747-814-153
Received: 27 February 2020; Accepted: 15 June 2020; Published: 22 June 2020�����������������
Abstract: Algae-based products have applications in the food and pharmaceutical industries,bioremediation of waste streams and biofuel production. Drying has been recognised to constitutethe largest energy cost in algae processing, yet there is limited data or modelling characterising thedrying kinetics of macroalgae. This research modelled the equilibrium moisture content of twomacroalgae species, Ulva ohnoi, a saltwater alga and Oedogonium intermedium, a freshwater alga.The Guggenheim–Anderson–de Boer model was found to best represent experimental equilibriummoisture contents. Drying rate curves obtained under both convective and radiative conditions werefitted to an analytical solution of Fick’s second law, including the modelled equilibrium moisturevalues. Effective diffusivity values for the two species are presented.
Keywords: macroalgae; drying rates; equilibrium moisture; diffusion modelling
1. Introduction
Algae have been identified as a renewable resource that can be utilised for a range of productssuch as fertilisers and animal feeds, human food supplements, nutraceuticals, specialty chemicals,and bioenergy [1–3]. Historically the majority of research has focused on the development of microalgae,which are small single-celled algae. However, the commercial development of microalgae has beenlimited to high-value niche applications due to the technical difficulties and cost of large-scalecultivation and dewatering [4]. More recently, research effort in bioprocessing has broadened to includemacroalgae, which are large multicellular alga found in both marine and freshwater environments. Dueto their larger size and ease of harvesting, macroalgae are well suited to large-scale outdoor cultivation.
Macroalgae have the capacity to complement existing industries and drive sustainability andcircular economy objectives by utilising their waste nutrients and water, effectively creating a sustainablesource of high-protein biomass from waste inputs [5,6]. Neveux et al. [7] found that a freshwaterspecies of macroalgae, Oedogonium intermedium (Chlorophyta), had the highest biocrude yield of arange of species, using hydrothermal liquefaction. Zeraatkar et al. [8] performed a review of algaein bioremediation of heavy metals from wastewater, which concluded both macro- and micro-algaewere suitable candidates. Castine et al. [9] considered the use of macroalgae to treat wastewaterfrom aquaculture, including added value from algae products. An assessment of the potential foralgae in bioremediation was performed by Lawton et al. [10], where the saltwater macroalga Ulvaohnoi (Chlorophyta) was found to have the highest growth rates of a range of local species. Severalmacroalgae species including O. intermedium and Asparagopsis taxiformis (Rhodophyta) have potential
Clean Technol. 2020, 2, 225–239; doi:10.3390/cleantechnol2020015 www.mdpi.com/journal/cleantechnol
Clean Technol. 2020, 2 226
for use as a supplement to livestock feed, leading to improved growth rates and lower livestockmethane emissions [11,12].
A significant barrier to the development of industry based around macroalgal production is thedesign of energy efficient and well-controlled drying systems that can transition freshly harvestedbiomass into a product suitable for storage and transport. The drying step of a process was recognisedas the single biggest energy usage for the processing of algal biomass, due to the large amounts ofmoisture requiring removal [13]. The drying step can constitute up to 70–75% of processing costsin some cases. As such, optimisation of this step would lead to the largest gain in efficiency for theoverall process.
Drying models are an effective way to understand and define the drying process and designdrying equipment for industry. Industrial drying equipment can be broadly divided into drying viaradiative and convective heating methods, with convective drying typically faster. Diffusion-basedmodelling has been extensively used in literature to describe both convective and radiative drying offood and biomaterials. This has been through the fitting of theoretical models based on Fick’s lawof diffusion, or fitting moisture data to empirical models with mathematical formulations that areidentical to the first term in the analytical solution to Fick’s law of diffusion, such as the Hendersonand Pabis model [14].
Many studies in the literature have used diffusion modelling approaches to successfully representmacroalgae drying [15–19]. Other drying studies utilising diffusion-based modelling of algae includeseveral covering the drying kinetics of the microalga Arthrospira platensis (Cyanobacteria) [20,21].The use of diffusion modelling of other materials such as fibre, fruit, and vegetables is widespread inthe literature.
The theoretical method of modelling diffusion-based drying kinetics is based on Fick’s second lawof diffusion [22]. A commonly used analytical series solution to Fick’s second law, adapted to apply tothe drying of an infinite slab of constant thickness, was derived by Sherwood [23] and is shown inEquation (1).
MR =M−Me
M0 −Me=
8π2
∞∑n = 0
1
(2n + 1)2 exp(−(2n + 1)2π2Det
4L2
)(1)
In the equation MR is the dimensionless moisture ratio, M, Me, and M0 are moisture contents (%dry basis) at current, equilibrium, and initial times respectively. L is the material thickness (m), De iseffective diffusivity (m2/s), and t is drying time (s).
Me is another important parameter in modelling drying kinetics as it defines the limits to which amaterial can be dried, given the conditions of the surroundings. Its value is important for productpreservation, packaging, and storage. The equilibrium moisture content depends on the material as wellas the relative humidity and temperature of the surroundings. It is typically modelled using adaptionsof gas surface adsorption models. Lemus et al. [24] studied the equilibrium moisture content of thered alga Agarophyton chilense (Rhodophyta) between 5 and 40 ◦C and between 10% and 95% relativehumidity. Other equilibrium moisture studies of macroalgae include the brown alga Fucus vesiculosusand Macrocystis pyrifera (Ochrophyta, Phaeophyceae) [15,16]. The best-fit equations in equilibriummoisture studies are typically the Guggenheim–Anderson–de Boer (GAB) or Bruenauer–Emmett–Tellermodels [25]. In the GAB model (Equation (2)) A, B, and C are model constants, ERH is the relativehumidity as decimal and Me is the equilibrium moisture content in % dry basis. As an equilibriummoisture model, the GAB model has been shown to well represent Me values over relative humiditiesbetween 5% and 90% for a range of different biomaterials [26].
Me =ABCERH
(1− BERH)(1− BERH + BCERH)(2)
The aim of this work is to model experimentally determined equilibrium moisture contents over arange of temperature and relative humidity conditions for two previously undescribed but commercially

Clean Technol. 2020, 2 227
important macroalgae species, U. ohnoi and O. intermedium. In this work, diffusion modelling andcritical model parameters (effective diffusivities and activation energy) are experimentally determinedand used to compare radiative and convective drying. These values are essential to determine safestorage moisture content limits and for obtaining accurate drying rate models. These model parametersare compared to results for other macroalgae.
2. Experiments
The algal biomass used in this study was obtained from stock cultures sourced from the Marineand Aquaculture Research Facilities Unit (MARFU) at James Cook University in Townsville, Australia.The two species used in the study were U. ohnoi and O. intermedium. U. ohnoi is a saltwater alga thatforms thin, roughly rectangular blades up to 10 cm wide, with the thickness of each blade being twocells wide. It was selected from a range of saltwater species based on its high growth rates and highbiocrude yield as well as high resistance to bacterial ingress [27,28]. O. intermedium is a freshwateralga that forms single filaments one cell wide, which can significantly clump together when harvested.Both species have potential for use as livestock feed supplement [11,29].
In both kinetic and equilibrium tests, surface moisture was removed from the algae samples viause of lab-scale centrifuge (Koh-I-Noor Engineering Works, Punjab, Pakistan) at 2800 RPM. Algaesamples were dewatered in the centrifuge until outlet moisture flow completely stopped, whichprovided a consistent starting point for the drying and equilibrium moisture trials. Nine dewateredsubsamples of the algae were used to determine the initial moisture content (M0) and to evaluateconsistency in the determination of moisture content following the dewatering step. Dry weights wereobtained using a moisture analyser (MA-45, Sartorius AG, 37075 Goettingen, Germany) drying at 110◦C to ensure complete moisture removal. Average initial moisture content (following dewatering)and 95% confidence interval for U. onhoi was 81.73% weight ± 1.4% (relative), and 83.54% weight± 1.1% (relative) for O. intermedium. The low variance in these starting-point (dewatered) moisturecontents demonstrated both consistency in the dewatering process and in the use of the MA-45 toobtain moisture content and dry basis algae mass values.
2.1. Equilibrium Moisture Content
The setup used for the equilibrium moisture experiments consists of twelve sealed containersfully immersed in a hot water bath to control internal temperature. Each container was 500 ml involume and had a mesh platform suspended above a saturated salt solution filling a third of thecontainer volume. At a given temperature, a saturated salt solution will achieve equilibrium with theair inside the container, giving a fixed humidity [30]. Temperature (T) and humidity (ERH) inside thesample containers were measured using a humidity probe (Center 313, Center Technology Corporation,Taipei, Taiwan). Fresh centrifuged algae samples weighing approximately 4 g each were placed on themesh platforms inside each container. Excess salts were used as a visual indicator to ensure saturatedsolutions during each experiment. The solutions used (and their respective relative humidities) atequilibrium were lithium chloride (11%); sodium acetate (20%); magnesium chloride (31%); sodiumcarbonate (43%); and sodium bromide (52%). Three containers of each solution were used to obtaintriplicate results for each temperature and humidity.
The mass of the algae samples was measured daily after being left for a week to reach equilibrium.Three consecutive and constant measurements were obtained to ensure equilibrium. The measuredequilibrium masses were converted to moisture content in % dry basis via Equation (3);
Me(%db) =
(Me,g −D
D
)(3)
where Me,g is the equilibrium mass of the algae in grams, and D is the dry weight of the algae in grams.Algae dry weight was determined using the Sartorius MA-45.
Clean Technol. 2020, 2 228
2.2. Drying Kinetics
Freshly centrifuged algae was used to experimentally investigate drying kinetics. Given proteins inalgae are prone to denaturation at high temperature, and characteristics such as colour also deteriorate(changing from green to brown) at high temperature, temperatures used for the experimental runs were40, 50, and 60 ◦C. Three repeats were performed for each temperature. The initial material thickness(L = 0.01 m) and the initial fresh mass were kept constant between runs.
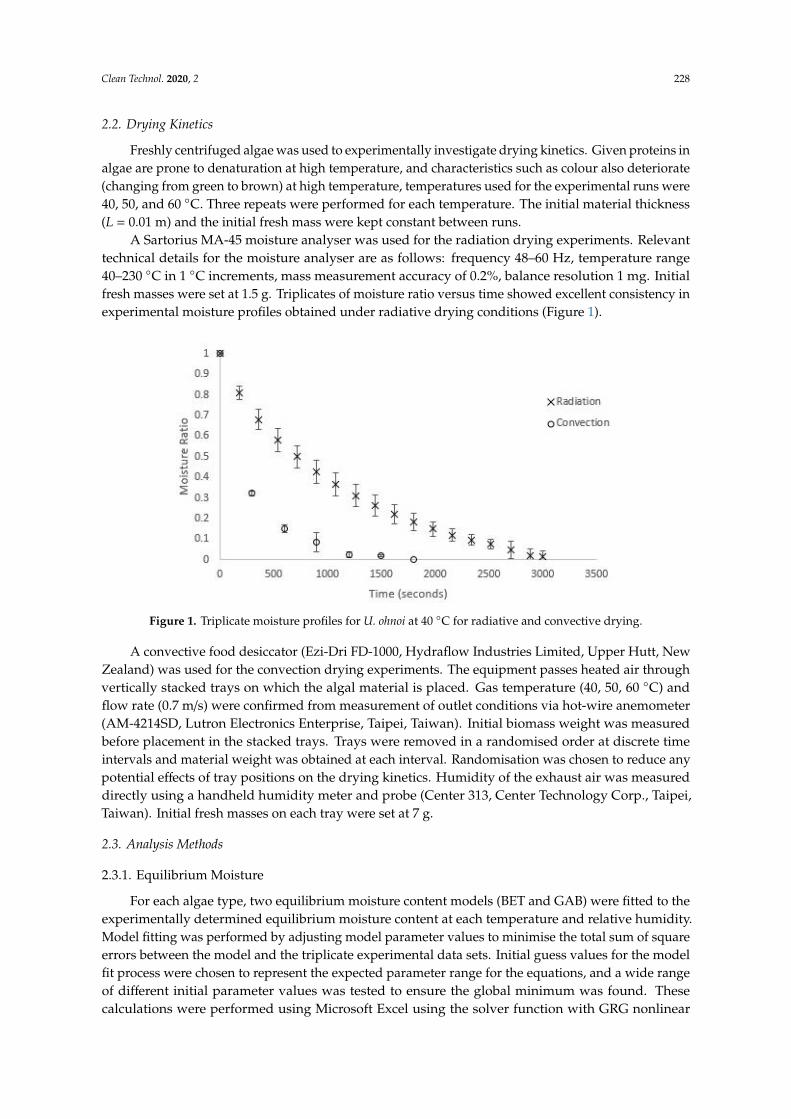
A Sartorius MA-45 moisture analyser was used for the radiation drying experiments. Relevanttechnical details for the moisture analyser are as follows: frequency 48–60 Hz, temperature range40–230 ◦C in 1 ◦C increments, mass measurement accuracy of 0.2%, balance resolution 1 mg. Initialfresh masses were set at 1.5 g. Triplicates of moisture ratio versus time showed excellent consistency inexperimental moisture profiles obtained under radiative drying conditions (Figure 1).
Clean Technol. 2020, 2 4
deteriorate (changing from green to brown) at high temperature, temperatures used for the
experimental runs were 40, 50, and 60 °C. Three repeats were performed for each temperature. The
initial material thickness (L = 0.01 m) and the initial fresh mass were kept constant between runs.
A Sartorius MA-45 moisture analyser was used for the radiation drying experiments. Relevant
technical details for the moisture analyser are as follows: frequency 48–60 Hz, temperature range 40–
230 °C in 1 °C increments, mass measurement accuracy of 0.2%, balance resolution 1 mg. Initial fresh
masses were set at 1.5 g. Triplicates of moisture ratio versus time showed excellent consistency in
experimental moisture profiles obtained under radiative drying conditions (Figure 1).
Figure 1. Triplicate moisture profiles for U. ohnoi at 40 °C for radiative and convective drying.
A convective food desiccator (Ezi-Dri FD-1000, Hydraflow Industries Limited, Upper Hutt, New
Zealand) was used for the convection drying experiments. The equipment passes heated air through
vertically stacked trays on which the algal material is placed. Gas temperature (40, 50, 60 °C) and flow
rate (0.7 m/s) were confirmed from measurement of outlet conditions via hot-wire anemometer (AM-
4214SD, Lutron Electronics Enterprise, Taipei, Taiwan). Initial biomass weight was measured before
placement in the stacked trays. Trays were removed in a randomised order at discrete time intervals
and material weight was obtained at each interval. Randomisation was chosen to reduce any
potential effects of tray positions on the drying kinetics. Humidity of the exhaust air was measured
directly using a handheld humidity meter and probe (Center 313, Center Technology Corp., Taipei,
Taiwan). Initial fresh masses on each tray were set at 7 g.
2.3. Analysis Methods
2.3.1. Equilibrium Moisture
For each algae type, two equilibrium moisture content models (BET and GAB) were fitted to the
experimentally determined equilibrium moisture content at each temperature and relative humidity.
Model fitting was performed by adjusting model parameter values to minimise the total sum of
square errors between the model and the triplicate experimental data sets. Initial guess values for the
model fit process were chosen to represent the expected parameter range for the equations, and a
wide range of different initial parameter values was tested to ensure the global minimum was found.
These calculations were performed using Microsoft Excel using the solver function with GRG
nonlinear solver method. The objective function is summarised in Equation (4), where m corresponds
to a given data set, and the objective function (Obj) is minimised by varying the model constants.
𝑂𝑏𝑗 = ∑ (∑(𝑀𝑒,𝑚 −𝑀𝑒,𝑒𝑥𝑝)2)
3
𝑚=1
(4)
Figure 1. Triplicate moisture profiles for U. ohnoi at 40 ◦C for radiative and convective drying.
A convective food desiccator (Ezi-Dri FD-1000, Hydraflow Industries Limited, Upper Hutt, NewZealand) was used for the convection drying experiments. The equipment passes heated air throughvertically stacked trays on which the algal material is placed. Gas temperature (40, 50, 60 ◦C) andflow rate (0.7 m/s) were confirmed from measurement of outlet conditions via hot-wire anemometer(AM-4214SD, Lutron Electronics Enterprise, Taipei, Taiwan). Initial biomass weight was measuredbefore placement in the stacked trays. Trays were removed in a randomised order at discrete timeintervals and material weight was obtained at each interval. Randomisation was chosen to reduce anypotential effects of tray positions on the drying kinetics. Humidity of the exhaust air was measureddirectly using a handheld humidity meter and probe (Center 313, Center Technology Corp., Taipei,Taiwan). Initial fresh masses on each tray were set at 7 g.
2.3. Analysis Methods
2.3.1. Equilibrium Moisture
For each algae type, two equilibrium moisture content models (BET and GAB) were fitted to theexperimentally determined equilibrium moisture content at each temperature and relative humidity.Model fitting was performed by adjusting model parameter values to minimise the total sum of squareerrors between the model and the triplicate experimental data sets. Initial guess values for the modelfit process were chosen to represent the expected parameter range for the equations, and a wide rangeof different initial parameter values was tested to ensure the global minimum was found. Thesecalculations were performed using Microsoft Excel using the solver function with GRG nonlinear
Clean Technol. 2020, 2 229
solver method. The objective function is summarised in Equation (4), where m corresponds to a givendata set, and the objective function (Obj) is minimised by varying the model constants.
Obj =3∑
m = 1
(∑(Me,m −Me,exp)
2)
(4)
2.3.2. Drying Kinetics
The raw experimental data of mass against time in the convective and radiative drying experimentswere converted to moisture ratio versus time. An analytical solution to the Fick’s second law model(Equation (1)) was fitted to moisture ratio versus time data sets. Model fitting was performed byminimisation of the total sum of square errors between the model and experimental data, with themodel representing the best fit to all three sets of data at a given condition. Ten terms of the infinite serieswere used in modelling to ensure convergence in the infinite series solution [31]. These calculationswere performed using Microsoft Excel with the solver function and GRG nonlinear solver method,assuming constant relative variance in the experimental data. The objective function is summarisedin Equation (5), where m corresponds to the number of data sets. The objective function (Obj) wasminimised by varying the magnitude of the effective diffusivity parameter (De).
Obj =3∑
m = 1
(∑(MRm −MRe)
2)
(5)
3. Results
3.1. Equilibrium Moisture Modelling
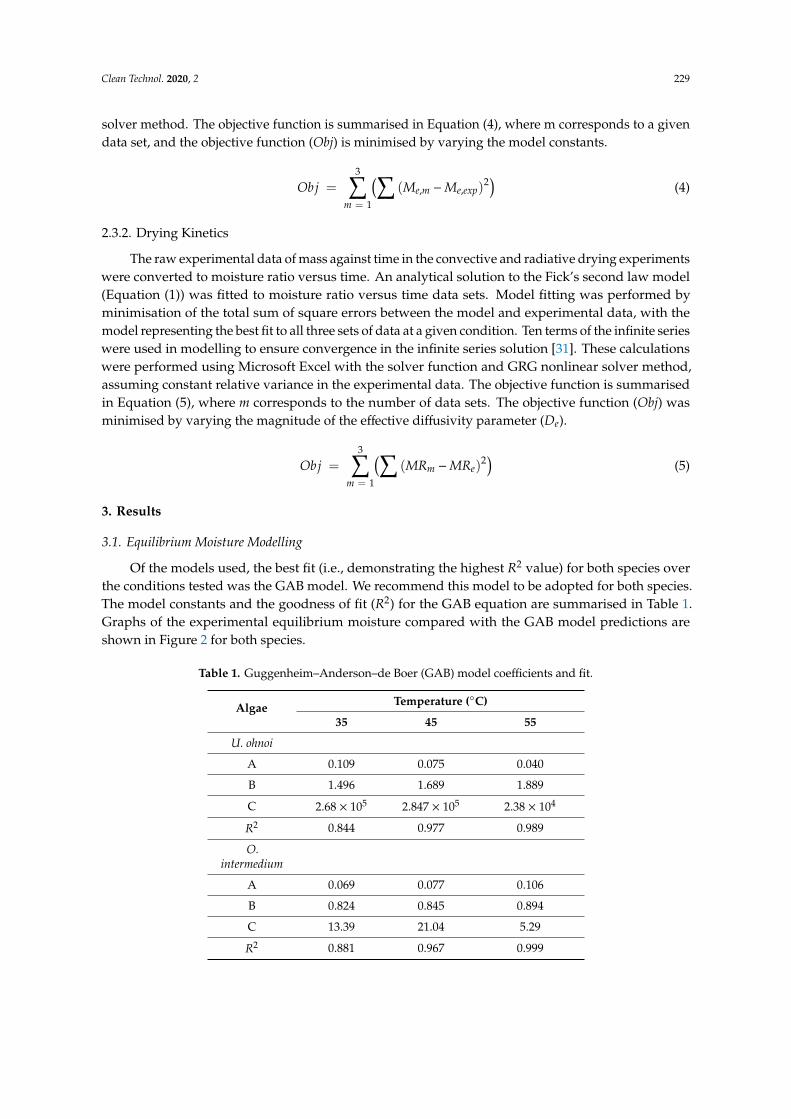
Of the models used, the best fit (i.e., demonstrating the highest R2 value) for both species overthe conditions tested was the GAB model. We recommend this model to be adopted for both species.The model constants and the goodness of fit (R2) for the GAB equation are summarised in Table 1.Graphs of the experimental equilibrium moisture compared with the GAB model predictions areshown in Figure 2 for both species.
Table 1. Guggenheim–Anderson–de Boer (GAB) model coefficients and fit.
Algae Temperature (◦C)
35 45 55
U. ohnoi
A 0.109 0.075 0.040
B 1.496 1.689 1.889
C 2.68 × 10⁵ 2.847 × 10⁵ 2.38 × 10⁴
R2 0.844 0.977 0.989
O.intermedium
A 0.069 0.077 0.106
B 0.824 0.845 0.894
C 13.39 21.04 5.29
R2 0.881 0.967 0.999
Clean Technol. 2020, 2 230Clean Technol. 2020, 2 6
Figure 2. GAB model and experimental data for (a) U. ohnoi and (b) O. intermedium (Exp =
experimental; model = modelling outcome).
At around 50% humidity for Ulva and 30% humidity for O. intermedium, there was a crossover
point where higher temperatures resulted in higher equilibrium moisture than those observed at
lower temperatures. Lemus et al. [24] had a similar crossover effect at higher humidities in a study of
the red macroalga Agarophyton chilense, as did Moreira [15] for Fucus vesiculosus. They reasoned that
this was due to solubility effects of polysaccharides and proteins that make up the majority of the
alga solids mass. The crossover point would then be where these solubility effects on the equilibrium
point become larger than effects of the surrounding atmospheric conditions. Similar results have been
shown for other algae biomass, including Gelidium corneum (Rhodophyta), as well as other
biomaterial with soluble components [32,33]. Both U. ohnoi and O. intermedium have polysaccharide
Figure 2. GAB model and experimental data for (a) U. ohnoi and (b) O. intermedium (Exp = experimental;model = modelling outcome).
A statistical analysis was performed using SPSS software to determine the significance oftemperature and relative humidity for determining the equilibrium moisture. A general linearunivariate model analysis was used, which provided regression and variance analysis of the equilibriummoisture as the dependent variable against temperature and relative humidity. The analysis showedthat both temperature and relative humidity were statistically significant in their ability to predictchanges in the equilibrium value for both species (significance < 0.05 for all variables for both species).F–tests (a measure of the relative predictive ability) showed that, of the two variables, relative humiditywas the best single predictor of the equilibrium moisture content. Comparing between the two types
Clean Technol. 2020, 2 231
of algae, U. ohnoi exhibited a significantly higher equilibrium moisture content than O. intermedium.It is assumed that this was because U. ohnoi has reduced surface area (algal sheets are two cells thickrather than the single cell strings of O. intermedium) and is a saltwater alga.
At around 50% humidity for Ulva and 30% humidity for O. intermedium, there was a crossoverpoint where higher temperatures resulted in higher equilibrium moisture than those observed at lowertemperatures. Lemus et al. [24] had a similar crossover effect at higher humidities in a study of thered macroalga Agarophyton chilense, as did Moreira [15] for Fucus vesiculosus. They reasoned that thiswas due to solubility effects of polysaccharides and proteins that make up the majority of the algasolids mass. The crossover point would then be where these solubility effects on the equilibriumpoint become larger than effects of the surrounding atmospheric conditions. Similar results havebeen shown for other algae biomass, including Gelidium corneum (Rhodophyta), as well as otherbiomaterial with soluble components [32,33]. Both U. ohnoi and O. intermedium have polysaccharideand protein content totalling about 60% of dry mass [7]. It should be noted that the GAB equationis not designed to represent these interactions. As such, it follows that the parameters of the GABequation are semi-empirical or empirical in this application, reinforcing the importance of experimentalcharacterisation of algal species.
In general, equilibrium moisture isotherms and equilibrium moisture magnitudes for both specieswere similar to those for other macroalgae and biomaterials. Table 2 provides equilibrium moisturecontent values for this work and also for a variety of biomass types.
Table 2. Examples of equilibrium moisture contents for various biomaterials and algae.
Material Temperature(◦C) Relative Humidity (%) Me (%db)
Apple [34] 45 20–90 4–81
Pear [34] 45 19–93 2–73
Argan (leaves) [35] 40 7–90 3–30
Canola [36] 40 10–90 4–10
O. intermedium [this study] 45 10–50 6–12
U. ohnoi [this study] 45 10–50 10–60
Arthrospira platensis [20] 30 5–90 4–40
Fucus vesiculosus [15] 45 10–70 2–70
Macrocystis pyrifera [16] 50 10–70 5–200
Agarophyton chilense [24] 40 10–80 0.5–100
Gelidium corneum [32] 40 10–90 5–40
3.2. Drying Kinetics Modelling
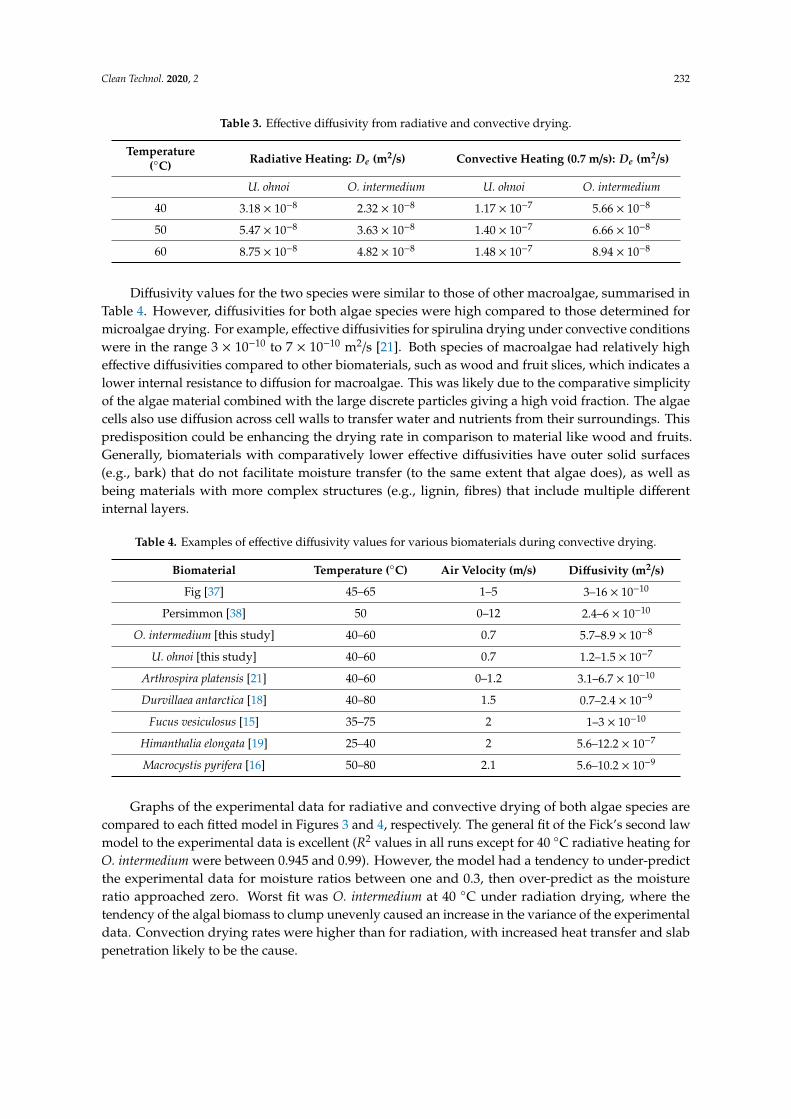
The model-predicted effective diffusivities for both Ulva and O. intermedium at eachtemperature were determined by including the GAB-modelled equilibrium moisture contents (Me).The parameter-estimated effective diffusivities are shown in Table 3 for both species. The effectivediffusivity was lower for O. intermedium than U. ohnoi and this is likely due to the tendency for O.intermedium to clump together when harvested, which reduces overall contact area for drying comparedwith individual blades of U. ohnoi.
Clean Technol. 2020, 2 232
Table 3. Effective diffusivity from radiative and convective drying.
Temperature(◦C) Radiative Heating: De (m2/s) Convective Heating (0.7 m/s): De (m2/s)
U. ohnoi O. intermedium U. ohnoi O. intermedium
40 3.18 × 10⁻⁸ 2.32 × 10⁻⁸ 1.17 × 10⁻⁷ 5.66 × 10⁻⁸
50 5.47 × 10⁻⁸ 3.63 × 10⁻⁸ 1.40 × 10⁻⁷ 6.66 × 10⁻⁸
60 8.75 × 10⁻⁸ 4.82 × 10⁻⁸ 1.48 × 10⁻⁷ 8.94 × 10⁻⁸
Diffusivity values for the two species were similar to those of other macroalgae, summarised inTable 4. However, diffusivities for both algae species were high compared to those determined formicroalgae drying. For example, effective diffusivities for spirulina drying under convective conditionswere in the range 3 × 10⁻¹⁰ to 7 × 10⁻¹⁰ m2/s [21]. Both species of macroalgae had relatively higheffective diffusivities compared to other biomaterials, such as wood and fruit slices, which indicates alower internal resistance to diffusion for macroalgae. This was likely due to the comparative simplicityof the algae material combined with the large discrete particles giving a high void fraction. The algaecells also use diffusion across cell walls to transfer water and nutrients from their surroundings. Thispredisposition could be enhancing the drying rate in comparison to material like wood and fruits.Generally, biomaterials with comparatively lower effective diffusivities have outer solid surfaces(e.g., bark) that do not facilitate moisture transfer (to the same extent that algae does), as well asbeing materials with more complex structures (e.g., lignin, fibres) that include multiple differentinternal layers.
Table 4. Examples of effective diffusivity values for various biomaterials during convective drying.
Biomaterial Temperature (◦C) Air Velocity (m/s) Diffusivity (m2/s)
Fig [37] 45–65 1–5 3–16 × 10−10
Persimmon [38] 50 0–12 2.4–6 × 10⁻¹⁰
O. intermedium [this study] 40–60 0.7 5.7–8.9 × 10⁻⁸
U. ohnoi [this study] 40–60 0.7 1.2–1.5 × 10⁻⁷
Arthrospira platensis [21] 40–60 0–1.2 3.1–6.7 × 10⁻¹⁰
Durvillaea antarctica [18] 40–80 1.5 0.7–2.4 × 10⁻⁹
Fucus vesiculosus [15] 35–75 2 1–3 × 10⁻¹⁰
Himanthalia elongata [19] 25–40 2 5.6–12.2 × 10⁻⁷
Macrocystis pyrifera [16] 50–80 2.1 5.6–10.2 × 10⁻⁹
Graphs of the experimental data for radiative and convective drying of both algae species arecompared to each fitted model in Figures 3 and 4, respectively. The general fit of the Fick’s second lawmodel to the experimental data is excellent (R2 values in all runs except for 40 ◦C radiative heating forO. intermedium were between 0.945 and 0.99). However, the model had a tendency to under-predictthe experimental data for moisture ratios between one and 0.3, then over-predict as the moistureratio approached zero. Worst fit was O. intermedium at 40 ◦C under radiation drying, where thetendency of the algal biomass to clump unevenly caused an increase in the variance of the experimentaldata. Convection drying rates were higher than for radiation, with increased heat transfer and slabpenetration likely to be the cause.

Clean Technol. 2020, 2 233Clean Technol. 2020, 2 9
Figure 3. Comparison of radiation drying results and models for (a) U. ohnoi and (b) O. intermedium
(Exp = experimental; model = modelling outcome).
Figure 3. Comparison of radiation drying results and models for (a) U. ohnoi and (b) O. intermedium(Exp = experimental; model = modelling outcome).
The assumptions made in the derivation of this analytical solution are: initial moisture distributionis even; internal moisture transport is by diffusion only; drying gas volumes are large enough thatsurrounding environmental conditions are not changed by moisture transfer; slab thickness is constantthroughout the drying process; temperature of the slab is isothermal and equal to the temperature ofthe surroundings; and bulk transfer of moisture (by convection) to the surroundings is sufficiently fastthat drying is only limited by the internal rate of diffusion. These conditions are rarely if ever fullysatisfied, and De is used in drying kinetics to pragmatically represent a global effective diffusivity,which accounts for these deviations. In this way, the diffusion coefficient consolidates the effects ofdeviations from these assumptions into a single (lumped) parameter model. This covers internaleffects such as resistance to diffusion from material layers and a biomaterial’s binding strength holdingmoisture internally, as well as external effects of temperature gradients, drying gas velocity andhumidity. The effective diffusivity approach requires new experimental results for new materials, dueto the influence of material properties. In the case of biomaterial drying there is typically some volumeloss or material shrinkage that occurs, and there is also an initial heating period required to bring thebiomaterial up to the gas temperature. Despite these physical and mechanistic deviations from ideal
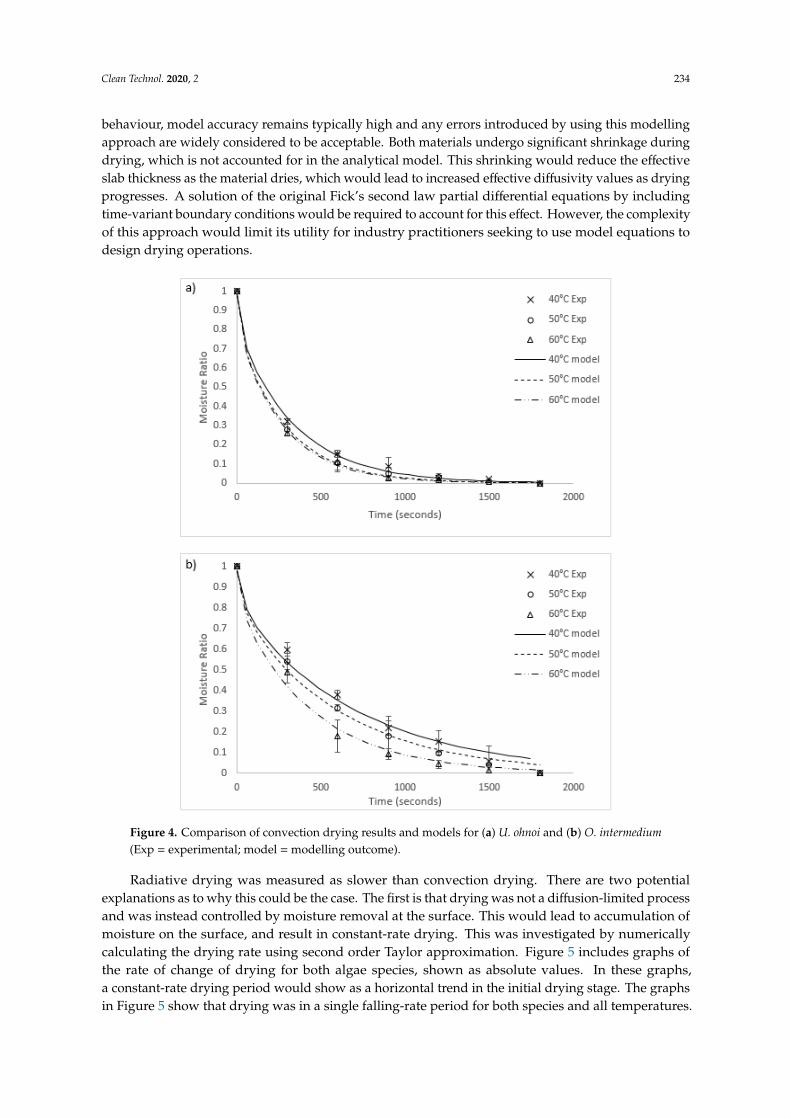
Clean Technol. 2020, 2 234
behaviour, model accuracy remains typically high and any errors introduced by using this modellingapproach are widely considered to be acceptable. Both materials undergo significant shrinkage duringdrying, which is not accounted for in the analytical model. This shrinking would reduce the effectiveslab thickness as the material dries, which would lead to increased effective diffusivity values as dryingprogresses. A solution of the original Fick’s second law partial differential equations by includingtime-variant boundary conditions would be required to account for this effect. However, the complexityof this approach would limit its utility for industry practitioners seeking to use model equations todesign drying operations.Clean Technol. 2020, 2 10
Figure 4. Comparison of convection drying results and models for (a) U. ohnoi and (b) O. intermedium
(Exp = experimental; model = modelling outcome).
Radiative drying was measured as slower than convection drying. There are two potential
explanations as to why this could be the case. The first is that drying was not a diffusion-limited
process and was instead controlled by moisture removal at the surface. This would lead to
accumulation of moisture on the surface, and result in constant-rate drying. This was investigated by
numerically calculating the drying rate using second order Taylor approximation. Figure 5 includes
graphs of the rate of change of drying for both algae species, shown as absolute values. In these
graphs, a constant-rate drying period would show as a horizontal trend in the initial drying stage.
The graphs in Figure 5 show that drying was in a single falling-rate period for both species and all
temperatures. The shape is the same as the expected rate of change from the Fick’s law model. This
shows the assumption of diffusion-limited drying is correct.
Figure 4. Comparison of convection drying results and models for (a) U. ohnoi and (b) O. intermedium(Exp = experimental; model = modelling outcome).
Radiative drying was measured as slower than convection drying. There are two potentialexplanations as to why this could be the case. The first is that drying was not a diffusion-limited processand was instead controlled by moisture removal at the surface. This would lead to accumulation ofmoisture on the surface, and result in constant-rate drying. This was investigated by numericallycalculating the drying rate using second order Taylor approximation. Figure 5 includes graphs ofthe rate of change of drying for both algae species, shown as absolute values. In these graphs,a constant-rate drying period would show as a horizontal trend in the initial drying stage. The graphsin Figure 5 show that drying was in a single falling-rate period for both species and all temperatures.
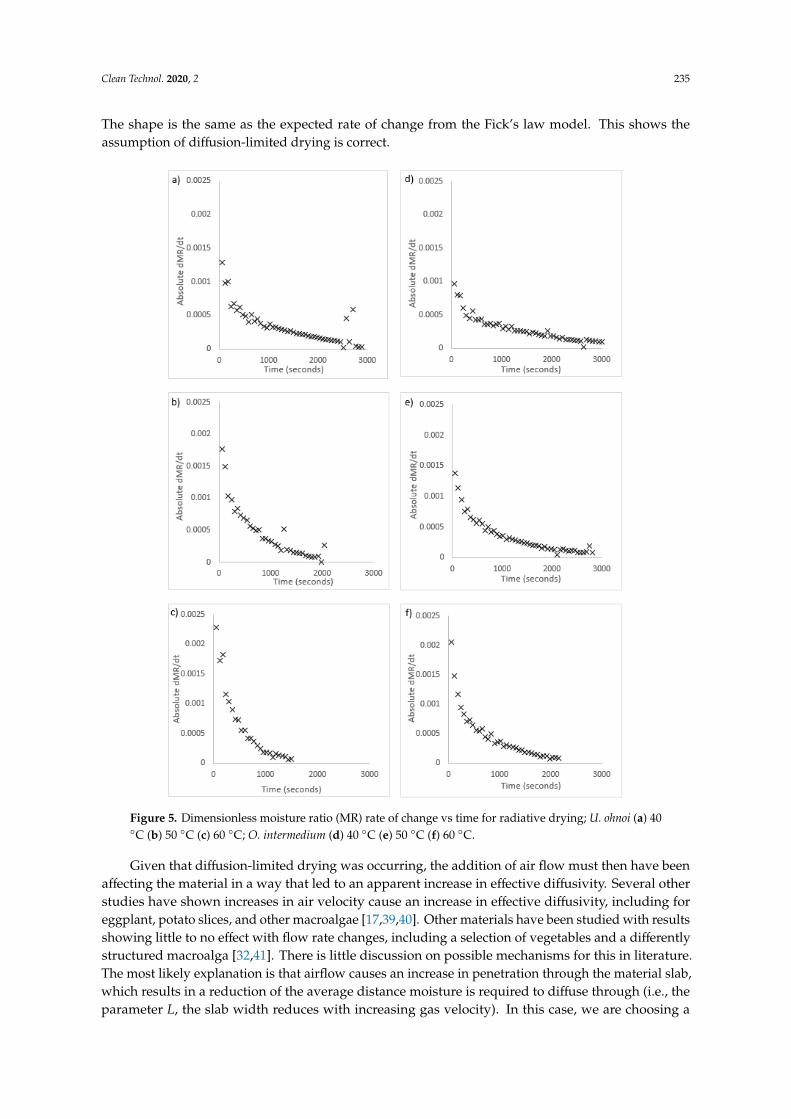
Clean Technol. 2020, 2 235
The shape is the same as the expected rate of change from the Fick’s law model. This shows theassumption of diffusion-limited drying is correct.Clean Technol. 2020, 2 11
Figure 5. Dimensionless moisture ratio (MR) rate of change vs time for radiative drying; U. ohnoi (a)
40 °C (b) 50 °C (c) 60 °C; O. intermedium (d) 40 °C (e) 50 °C (f) 60 °C.
Given that diffusion-limited drying was occurring, the addition of air flow must then have been
affecting the material in a way that led to an apparent increase in effective diffusivity. Several other
studies have shown increases in air velocity cause an increase in effective diffusivity, including for
eggplant, potato slices, and other macroalgae [17,39,40]. Other materials have been studied with
results showing little to no effect with flow rate changes, including a selection of vegetables and a
differently structured macroalga [32,41]. There is little discussion on possible mechanisms for this in
literature. The most likely explanation is that airflow causes an increase in penetration through the
material slab, which results in a reduction of the average distance moisture is required to diffuse
through (i.e., the parameter L, the slab width reduces with increasing gas velocity). In this case, we
are choosing a pragmatic approach, leaving L as the initial slab width and representing the effect as
an increase in the effective diffusivity. Comparing this work with other observations of the effect of
convection indicates that materials composed of particulates or with porous structure show increased
diffusivity with air flow, while those closer to solid slabs of material do not.
Figure 5. Dimensionless moisture ratio (MR) rate of change vs time for radiative drying; U. ohnoi (a) 40◦C (b) 50 ◦C (c) 60 ◦C; O. intermedium (d) 40 ◦C (e) 50 ◦C (f) 60 ◦C.
Given that diffusion-limited drying was occurring, the addition of air flow must then have beenaffecting the material in a way that led to an apparent increase in effective diffusivity. Several otherstudies have shown increases in air velocity cause an increase in effective diffusivity, including foreggplant, potato slices, and other macroalgae [17,39,40]. Other materials have been studied with resultsshowing little to no effect with flow rate changes, including a selection of vegetables and a differentlystructured macroalga [32,41]. There is little discussion on possible mechanisms for this in literature.The most likely explanation is that airflow causes an increase in penetration through the material slab,which results in a reduction of the average distance moisture is required to diffuse through (i.e., theparameter L, the slab width reduces with increasing gas velocity). In this case, we are choosing a
Clean Technol. 2020, 2 236
pragmatic approach, leaving L as the initial slab width and representing the effect as an increase in theeffective diffusivity. Comparing this work with other observations of the effect of convection indicatesthat materials composed of particulates or with porous structure show increased diffusivity with airflow, while those closer to solid slabs of material do not.
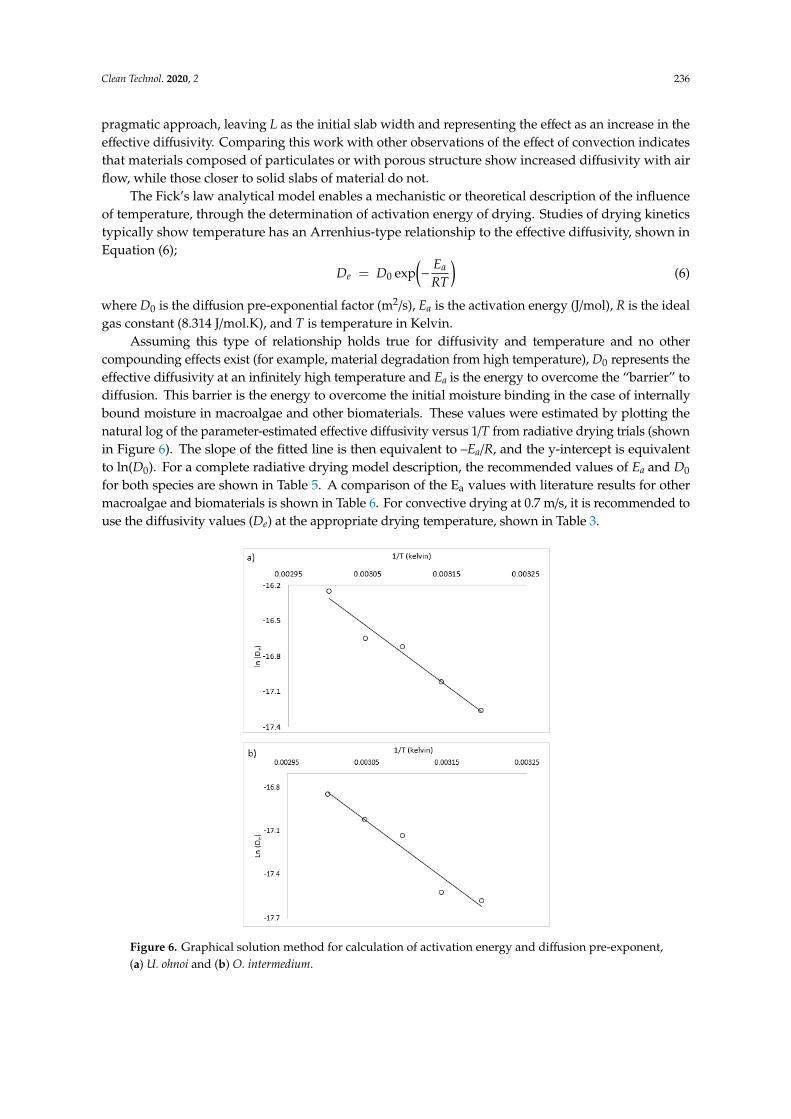
The Fick’s law analytical model enables a mechanistic or theoretical description of the influenceof temperature, through the determination of activation energy of drying. Studies of drying kineticstypically show temperature has an Arrenhius-type relationship to the effective diffusivity, shown inEquation (6);
De = D0 exp(−
Ea
RT
)(6)
where D0 is the diffusion pre-exponential factor (m2/s), Ea is the activation energy (J/mol), R is the idealgas constant (8.314 J/mol.K), and T is temperature in Kelvin.
Assuming this type of relationship holds true for diffusivity and temperature and no othercompounding effects exist (for example, material degradation from high temperature), D0 represents theeffective diffusivity at an infinitely high temperature and Ea is the energy to overcome the “barrier” todiffusion. This barrier is the energy to overcome the initial moisture binding in the case of internallybound moisture in macroalgae and other biomaterials. These values were estimated by plotting thenatural log of the parameter-estimated effective diffusivity versus 1/T from radiative drying trials (shownin Figure 6). The slope of the fitted line is then equivalent to –Ea/R, and the y-intercept is equivalentto ln(D0). For a complete radiative drying model description, the recommended values of Ea and D0
for both species are shown in Table 5. A comparison of the Ea values with literature results for othermacroalgae and biomaterials is shown in Table 6. For convective drying at 0.7 m/s, it is recommended touse the diffusivity values (De) at the appropriate drying temperature, shown in Table 3.
Clean Technol. 2020, 2 12
The Fick’s law analytical model enables a mechanistic or theoretical description of the influence
of temperature, through the determination of activation energy of drying. Studies of drying kinetics
typically show temperature has an Arrenhius-type relationship to the effective diffusivity, shown in
Equation (6);
𝐷𝑒 = 𝐷0exp(−𝐸𝑎𝑅𝑇
) (6)
where D0 is the diffusion pre-exponential factor (m2/s), Ea is the activation energy (J/mol), R is the
ideal gas constant (8.314 J/mol.K), and T is temperature in Kelvin.
Assuming this type of relationship holds true for diffusivity and temperature and no other
compounding effects exist (for example, material degradation from high temperature), D0 represents
the effective diffusivity at an infinitely high temperature and Ea is the energy to overcome the
“barrier” to diffusion. This barrier is the energy to overcome the initial moisture binding in the case
of internally bound moisture in macroalgae and other biomaterials. These values were estimated by
plotting the natural log of the parameter-estimated effective diffusivity versus 1/T from radiative
drying trials (shown in Figure 6). The slope of the fitted line is then equivalent to –Ea/R, and the y-
intercept is equivalent to ln(D0). For a complete radiative drying model description, the
recommended values of Ea and D0 for both species are shown in Table 5. A comparison of the Ea
values with literature results for other macroalgae and biomaterials is shown in Table 6. For
convective drying at 0.7 m/s, it is recommended to use the diffusivity values (De) at the appropriate
drying temperature, shown in Table 3.
Figure 6. Graphical solution method for calculation of activation energy and diffusion pre-exponent,
(a) U. ohnoi and (b) O. intermedium.
Table 5. Activation energy and diffusion pre-exponent for radiative drying. D0O
Algae Ea (kJ/mol) D0 (m2/s) R2
U. ohnoi 41.3 0.24 0.968
O. intermedium 34.1 0.011 0.948
Figure 6. Graphical solution method for calculation of activation energy and diffusion pre-exponent,(a) U. ohnoi and (b) O. intermedium.
Clean Technol. 2020, 2 237
Table 5. Activation energy and diffusion pre-exponent for radiative drying.
Algae Ea (kJ/mol) D0 (m2/s) R2
U. ohnoi 41.3 0.24 0.968
O. intermedium 34.1 0.011 0.948
Table 6. Comparison of D0 and Ea for other biomaterials.
Material Activation Energy (kJ/mol)
Red pepper [42] 23.35
Orange seeds [43] 16.5
Fucus vesiculosus [15] 22.1
Himanthalia elongata [19] 37.2
Macrocystis pyrifera [16] 25.31
Agarophyton chilense [24] 39.9
4. Conclusions
Important drying and moisture equilibrium properties of two commercially important macroalgaespecies were characterised in lab-based trials. The GAB moisture sorption model showed the best fitto experimentally determined equilibrium moisture contents for both U. ohnoi and O. intermediummacroalgae over industry-relevant temperature and relative humidity ranges (35–55 ◦C and 10–60%RH). Relative humidity was found to be the most significant variable in predicting equilibrium moisturecontent for both types of algae, and environmental limits for safe algae storage were clearly identified.An analytical solution to Fick’s second law of diffusion was used to model both convective and radiativedrying kinetics for both algae species with a high degree of correlation. Moisture ratio versus timedata showed that drying for both species occurs in a falling-rate period at all times and temperatures(40–60 ◦C), indicating diffusion-limited drying and reinforcing the validity of the analytical model forthese biomaterials. Convective drying at 0.7 m/s demonstrated an increased drying rate compared toradiative drying at the same temperature, reinforcing the value in gas-assisted drying technologies.Diffusion coefficients under both radiative and convective conditions, as well as activation energies,were determined for both species. These model parameters were compared to literature values for otherbiomaterials and showed consistency. Increased rates of diffusion under convective conditions wereattributed to the drying gas flow penetrating into the material “slab” and reducing diffusion distance(i.e., slab thickness). Given the significant influence of gas velocity on the drying rates observed in thisstudy, the effects of both gas velocity and material thickness should be more extensively investigatedfor both macro- and microalgae.
Author Contributions: Conceptualization, M.S.; methodology, C.W. and M.S.; formal analysis, C.W.;writing—original draft preparation, M.S. and C.W.; writing—review and editing, M.S., E.A., A.C.; supervision,M.S. and A.C. All authors have read and agreed to the published version of the manuscript.
Funding: This research received no external funding.
Acknowledgments: The algal biomass used in this research was supplied by Pacific Bio Pty Ltd. as part of theirresearch and development program on algal bioremediation and bio-products.
Conflicts of Interest: The authors declare no conflict of interest.
References
1. Angell, A.; Angell, S.; de Nys, R.; Paul, N. Seaweed as a protein source for mono-gastric livestock. Trends Food Sci.Technol. 2016, 54, 74–84. [CrossRef]
2. Mabeau, S.; Fleurence, J. Seaweed in food products: Biochemical and nutritional aspects. Trends Food Sci. Technol.1993, 4, 103–107. [CrossRef]
Clean Technol. 2020, 2 238
3. Garcia-Vaquero, M.; Hayes, M. Red and green macroalgae for fish and animal feed and human functionalfood development. Food Rev. Int. 2016, 32, 15–45. [CrossRef]
4. Rawat, I.; Ranjith Kumar, R.; Mutanda, T.; Bux, F. Biodiesel from microalgae: A critical evaluation fromlaboratory to large scale production. Appl. Energy 2013, 103, 444–467. [CrossRef]
5. Cole, A.J.; Neveux, N.; Whelan, A.; Morton, J.; Vis, M.; de Nys, R.; Paul, N.A. Adding value to the treatmentof municipal wastewater through the intensive production of freshwater macroalgae. Algal Res. 2016,20, 100–109. [CrossRef]
6. Lawton, R.J.; Cole, A.J.; Roberts, D.A.; Paul, N.A.; de Nys, R. The industrial ecology of freshwater macroalgaefor biomass applications. Algal Res. 2017, 24, 486–491. [CrossRef]
7. Neveux, N.; Magnusson, M.; Maschmeyer, T.; de Nys, R.; Paul, N.A. Comparing the potential productionand value of high-energy liquid fuels and protein from marine and freshwater macroalgae. GCB Bioenergy2014, 7, 673–689. [CrossRef]
8. Zeraatkar, A.K.; Ahmadzadeh, H.; Talebi, A.F.; Moheimani, N.R.; McHenry, M.P. Potential use of algae forheavy metal bioremediation, a critical review. J. Env. Manag. 2016, 181, 817–831. [CrossRef]
9. Castine, S.A.; Paul, N.A.; Magnusson, M.; Bird, I.; de Nys, R. Algal bioproducts derived from suspendedsolids in intensive land-based aquaculture. Bioresour. Technol. 2013, 131, 113–120. [CrossRef]
10. Lawton, R.J.; Mata, L.; de Nys, R.; Paul, N.A. Algal bioremediation of waste waters from land-basedaquaculture using Ulva; selecting target species and strains. PLoS ONE 2013, 8, e77344. [CrossRef]
11. Machado, L.; Kinley, R.; Magnusson, M.; de Nys, R.; Tomkins, N. The potential of macroalgae for beefproduction systems in Northern Australia. J. Appl. Phycol. 2015, 27, 2001–2005. [CrossRef]
12. Machado, L.; Magnusson, M.; Paul, N.; Kinley, R.; de Nys, R.; Tomkins, N. Dose-response effects of asparagopsistaxiformis and oedogonium sp. on in vitro fermentation and methane production. J. Appl. Phycol. 2016,28, 1443–1452. [CrossRef]
13. Show, K.; Lee, D.; Chang, J. Algal biomass dehydration. Bioresour. Technol. 2013, 135, 720–729. [CrossRef][PubMed]
14. Henderson, S.M.; Pabis, S. Grain drying theory I: Temperature effects on drying coefficients. J. Agric. Eng. Res.1961, 6, 169–174.
15. Moreira, R.; Chenlo, F.; Sineiro, J.; Arufe, S.; Sexto, S. Water sorption isotherms and air drying kinetics offucus vesiculosus brown seaweed. J. Food Process. Preserv. 2017, 41, e12997. [CrossRef]
16. Vega-Gálvez, A.; Ayala-Aponte, A.; Notte, E.; Fuente, L.; Lemus-Mondaca, R. Mathematical Modeling ofMass Transfer during Convective Dehydration of Brown Algae Macrocystis Pyrifera. Dry. Technol. 2008, 26,1610–1616. [CrossRef]
17. Djaeni, M.; Sari, D.A. Low temperature seaweed drying using dehumidified air. Procedia Env. Sci. 2015,23, 2–10. [CrossRef]
18. Uribe, E.; Vega-Gálvez, A.; Vásquez, V.; Lemus-Mondaca, R.; Callejas, L.; Pastén, A. Hot-air drying characteristicsand energetic requirement of the edible brown seaweed Durvillaea antarctica. J. Food Process. Preserv. 2017,41, e13313. [CrossRef]
19. Gupta, S.; Cox, S.; Abu-Ghannam, N. Effect of different drying temperatures on the moisture andphytochemical constituents of edible Irish brown seaweed. Food Sci. Technol. 2011, 44, 1266–1272. [CrossRef]
20. Oliveira, E.; Rosa, G.; Moraes, M.; Pinto, L. Characterization of thin layer drying of spirulina platensisutilizing perpendicular air flow. Bioresour. Technol. 2009, 100, 1297–1303. [CrossRef]
21. Dissa, O.; Compaore, A.; Tiendrebeogo, E.; Koulidiati, J. An effective moisture diffusivity model deducedfrom experiment and numerical solution of mass transfer equations for a shrinkable drying slab of microalgaespirulina. Dry. Technol. 2014, 32, 1231–1244. [CrossRef]
22. Fick, A.V. On liquid diffusion. Philos. Mag. 1855, 10, 30–39. [CrossRef]23. Sherwood, T.K. The drying of solids–I. Ind. Eng. Chem. 1932, 24, 307–310. [CrossRef]24. Lemus, R.A.; Pérez, M.; Andrés, A.; Roco, T.; Tello, C.M.; Vega, A. Kinetic study of dehydration and
desorption isotherms of red alga Gracilaria. Food Sci. Technol. 2008, 41, 1592–1599. [CrossRef]25. Anderson, R.B. Modifications of the Brunauer, Emmett and Teller equation. J. Am. Chem. Soc. 1946,
68, 686–691. [CrossRef]26. Guillard, V.; Bourlieu, C.; Gontard, N. Food Structure and Moisture Transfer: A Modelling Approach; Springer:
New York, NY, USA, 2013. [CrossRef]
Clean Technol. 2020, 2 239
27. Neveux, N.; Yuen, A.K.L.; Jazrawi, C.; Magnusson, M.; Haynes, B.S.; Masters, A.F.; Montoya, A.; Paul, N.A.;Maschmeyer, T.; de Nys, R. Biocrude yield and productivity from the hydrothermal liquefaction of marineand freshwater green macroalgae. Bioresour. Technol. 2014, 155, 334–341. [CrossRef]
28. Lawton, R.J.; de Nys, R.; Paul, N.A. Selecting reliable and robust freshwater macroalgae for biomassapplications. PLoS ONE 2013, 8, e64168. [CrossRef]
29. Vucko, M.; Cole, A.; Moorhead, J.; Pit, J.; de Nys, R. The freshwater macroalga Oedogonium intermediumcan meet the nutritional requirements of the herbivorous fish Ancistrus cirrhosus. Algal Res. 2017, 27, 21–31.[CrossRef]
30. Greenspan, L. Humidity set points of binary aqueous solutions. J. Res. Natl. Inst. Stand. Technol. 1976,81, 89–96. [CrossRef]
31. Walker, C.; Cole, A.; Sheehan, M. Modelling of thin layer drying of macroalgae. Presetend at the Asia PacificConfederation of Chemical Engineering Congress 2015, Melbourne, Australia, 27 September–1 October 2015.
32. Mohamed, L.A.; Kouhila, M.; Lahsasni, S.; Jamali, A.; Idlimam, A.; Rhazi, M.; Aghfir, M.; Mahrouz, M.Equilibrium moisture content and heat of sorption of Gelidium sesquipedale. J. Stored Prod. Res. 2005,41, 199–209. [CrossRef]
33. Al–Muhtaseb, A.H.; McMinn, W.A.M.; Magee, T.R.A. Moisture sorption isotherm characteristics of foodproducts: A review. Food Bioprod. Process. 2002, 80, 118–128. [CrossRef]
34. Kiranoudis, C.; Tsami, E.; Maroulis, Z.; Marinos-Kouris, D. Drying kinetics of some fruits. Dry. Technol. 1997,15, 1399–1418. [CrossRef]
35. Moussaoui, H.; Bahammou, Y.; Idlimam, A.; Lamharrar, A.; Abdenouri, N. Investigation of hygroscopicequilibrium and modeling sorption isotherms of the argan products: A comparative study of leaves, pulps,and fruits. Food Bioprod. Process. 2019, 114, 12–22. [CrossRef]
36. Zomorodian, A.; Kavoosi, Z.; Momenzadeh, L. Determination of EMC isotherms and appropriatemathematical models for canola. Food Bioprod. Process. 2011, 89, 407–413. [CrossRef]
37. Xanthopoulos, G.; Yanniotis, S.; Lambrinos, G.R. Water diffusivity and drying kinetics of air drying of figs.Dry. Technol. 2009, 27, 502–512. [CrossRef]
38. Cárcel, J.; García-Pérez, J.; Riera, E.; Mulet, A. Influence of high intensity ultrasound on drying kinetics ofpersimmon. Dry. Technol. 2007, 25, 185–193. [CrossRef]
39. Santacatalina, J.; Soriano, J.; Cárcel, J.; Garcia-Perez, J. Influence of air velocity and temperature onultrasonically assisted low temperature drying of eggplant. Food Bioprod. Process. 2016, 100, 282–291.[CrossRef]
40. Hassini, L.; Azzouz, S.; Peczalski, R.; Belghith, A. Estimation of potato moisture diffusivity from convectivedrying kinetics with correction for shrinkage. J. Food Eng. 2007, 79, 47–56. [CrossRef]
41. Krokida, M.; Karathanos, V.; Maroulis, Z.; Marinos-Kouris, D. Drying kinetics of some vegetables. J. Food Eng.2003, 59, 391–403. [CrossRef]
42. Scala, K.; Crapiste, G. Drying kinetics and quality changes during drying of red pepper. Food Sci. Technol.2008, 41, 789–795. [CrossRef]
43. Rosa, D.; Cantú-Lozano, D.; Luna-Solano, G.; Polachini, T.; Telis-Romero, J. Mathematical modeling of orangeseed drying kinetics. Ciênc. Agrotecnol. 2015, 39, 291–300. [CrossRef]
© 2020 by the authors. Licensee MDPI, Basel, Switzerland. This article is an open accessarticle distributed under the terms and conditions of the Creative Commons Attribution(CC BY) license (http://creativecommons.org/licenses/by/4.0/).