Equations and Inequalities: Making Mathematics Accessible ...
224
P rogramme for I nternational S tudent A ssessment PISA Equations and Inequalities MAKING MATHEMATICS ACCESSIBLE TO ALL
Transcript of Equations and Inequalities: Making Mathematics Accessible ...

PISA
Equations and InequalitiesMAKING MATHEMATICS ACCESSIBLE TO ALL
More than ever, students need to engage with mathematics concepts, think quantitatively and analytically, and communicate using mathematics. All these skills are central to a young person’s preparedness to tackle problems that arise at work and in life beyond the classroom. But the reality is that many students are not familiar with basic mathematics concepts and, at school, only practice routine tasks that do not improve their ability to think quantitatively and solve real-life, complex problems.
How can we break this pattern? This report, based on results from PISA 2012, shows that one way forward is to ensure that all students spend more “engaged” time learning core mathematics concepts and solving challenging mathematics tasks. The opportunity to learn mathematics content – the time students spend learning mathematics topics and practising maths tasks at school – can accurately predict mathematics literacy. Differences in students’ familiarity with mathematics concepts explain a substantial share of performance disparities in PISA between socio-economically advantaged and disadvantaged students. Widening access to mathematics content can raise average levels of achievement and, at the same time, reduce inequalities in education and in society at large.
Contents
Chapter 1. Why access to mathematics matters and how it can be measured
Chapter 2. Variations in students’ exposure to and familiarity with mathematics
Chapter 3. Exposure to mathematics in school and performance in PISA
Chapter 4. Opportunity to learn and students’ attitudes towards mathematics
Chapter 5. A policy strategy to widen opportunities to learn mathematics
Consult this publication on line at: http://dx.doi.org/10.1787/9789264258495-en
This work is published on the OECD iLibrary, which gathers all OECD books, periodicals and statistical databases. Visit www.oecd-ilibrary.org and do not hesitate to contact us for more information.
Programme for International Student Assessment
ISBN 978-92-64-25848-8 98 2016 04 1P
Co-funded by the European Union
PIS
A E
quatio
ns and Ineq
ualities MA
KIN
G M
AT
HE
MA
TIC
S A
CC
ES
SIB
LE T
O A
LL
PISA Equations and InequalitiesMAKING MATHEMATICS ACCESSIBLE TO ALL


PISA
Equations and Inequalities
MAkIng MAtheMAtIcS AcceSSIble to All
This work is published under the responsibility of the Secretary-General of the OECD. The opinions expressed and the arguments employed herein do not necessarily reflect the official views of the OECD member countries.
This document and any map included herein are without prejudice to the status of or sovereignty over any territory, to the delimitation of international frontiers and boundaries and to the name of any territory, city or area.
Please cite this publication as:
OECD (2016), Equations and Inequalities: Making Mathematics Accessible to All, PISA, OECD Publishing, Paris, http://dx.doi.org/10.1787/9789264258495-en.
ISBN 978-92-64-25848-8 (print)ISBN 978-92-64-25849-5 (PDF)
Series: PISAISSN 1990-8539 (print)ISSN 1996-3777 (online)
The statistical data for Israel are supplied by and under the responsibility of the relevant Israeli authorities. The use of such data by the OECD is without prejudice to the status of the Golan Heights, East Jerusalem and Israeli settlements in the West Bank under the terms of international law.
Photo credits:
© Flying Colours Ltd /Getty Images
© Jacobs Stock Photography /Kzenon
© khoa vu /Flickr /Getty Images
© Mel Curtis /Corbis
© Shutterstock /Kzenon
© Simon Jarratt /Corbis
Corrigenda to OECD publications may be found on line at: www.oecd.org/publishing/corrigenda.
© OECD 2016
You can copy, download or print OECD content for your own use, and you can include excerpts from OECD publications,
databases and multimedia products in your own documents, presentations, blogs, websites and teaching materials, provided
that suitable acknowledgement of OECD as source and copyright owner is given. All requests for public or commercial use
and translation rights should be submitted to [email protected]. Requests for permission to photocopy portions of this material
for public or commercial use shall be addressed directly to the Copyright Clearance Center (CCC) at [email protected] or the
Centre français d’exploitation du droit de copie (CFC) at [email protected].

equations and inequalities: making mathematics accessible to all © OECD 2016 3
Foreword
Pisa has long established that disadvantaged students tend to trail behind their privileged peers in their mathematics achievement – even if the achievement gap varies widely across countries. but that left open the question: to what extent can teachers and schools do something about this?
the Pisa report, Equations and Inequalities: Making Mathematics Accessible to All, sheds light on this. While education systems have generally done well in providing equitable access to the quantity of mathematics education – in the sense that disadvantaged students spend about the same time in mathematics classes in school as their advantaged peers – the data show large differences in the quality of learning experiences between social groups. these inequalities result in a waste of talent.
While disadvantaged students tend to learn simple facts and figures and are exposed to simple applied mathematics problems, their privileged counterparts experience mathematics instruction that help them think like a mathematician, develop deep conceptual understanding and advanced mathematical reasoning skills.
these differences matter, because greater exposure to pure mathematics tasks and concepts has a strong relationship with higher performance in Pisa, and the data suggest that exposing all students to challenging problems and conceptual knowledge in mathematics classes can have a large impact on performance. in addition, the relationship between the content covered during mathematics instruction at school and the socio-economic profile of students and schools is stronger in countries that track students early into different study programmes, that have larger percentages of students in selective schools, and that transfer less-able students to other schools.
on the one hand, the findings from this report are disappointing, in the sense that they show that mathematics education often reinforces, rather than moderates, inequalities in education. on the other hand, they show that high-quality mathematics education, and thus education policy and practice, are an essential part of the solution to redressing social inequality. Policy makers can develop more ambitious and coherent mathematics standards that cover core mathematical ideas in depth, increase connections between topics and align instructional systems with these standards. they can also reduce tracking and stratification and/or moderate their effects. teachers can help students acquire higher-order mathematics knowledge and skills by replacing routine tasks with challenging open problems, support positive attitudes towards

© OECD 2016 equations and inequalities: making mathematics accessible to all4
FOREWORD
mathematics, provide students with multiple opportunities to learn key concepts at different levels of difficulty, and offer tailored support to struggling students. Parents’ expectations and attitudes towards mathematics matter too. and we can all do much better in monitoring and analysing not just students’ learning outcomes, but students’ opportunity to learn.
Andreas Schleicherdirector for education and skills
equations and inequalities: making mathematics accessible to all © OECD 2016 5
Acknowledgements
this report is the product of a collaboration among the countries participating in Pisa and the oecd secretariat. the report was prepared by mario Piacentini and chiara monticone, with contributions from Judit Pál and bonaventura Pacileo, and edited by marilyn achiron. andreas schleicher, montserrat gomendio, Yuri belfali, miyako ikeda, Francesco avvisati, Francesca borgonovi, alfonso echazarra, tue halgreen, Richard lee, daniel salinas, Javier suarez-alvarez and Pablo Zoido from the oecd secretariat, as well as William schmidt, provided valuable feedback at various stages of the report. marika boiron, Rose bolognini, claire chetcuti, Juliet evans, hélène guillou, dario laudati and giannina Rech provided statistical, editorial and administrative support. the development of the report was steered by the Pisa governing board, which is chaired by lorna bertrand (united kingdom). the report was generously supported by the european commission.1
1. this document has been co-funded by the european union. the opinions expressed and arguments employed herein do not necessarily reflect the official views of the european union.


equations and inequalities: making mathematics accessible to all © OECD 2016 7
Table of Contents
ExEcutivE Summary .............................................................................................................................................................. 13
rEadEr’S GuidE ........................................................................................................................................................................... 31
ChApTEr 1 Why accESS to mathEmaticS mattErS and hoW it can bE mEaSurEd.................................................................................................................................... 35
the importance of mathematics skills in everyday life ......................................................................................... 38
the relationship between mathematics knowledge and mathematical literacy ................................. 42
the concept of opportunity to learn ................................................................................................................................. 44
measuring opportunity to learn in PiSa ......................................................................................................................... 47
Questions used to measure opportunity to learn in PiSa 2012 ................................................................... 62
Exposure to pure and applied mathematics ................................................................................................................. 62
Familiarity with mathematics ................................................................................................................................................. 63
Students’ exposure to different kinds of mathematics problems ................................................................... 63
ChApTEr 2 variationS in StudEntS’ ExPoSurE to and Familiarity With mathEmaticS ................................................................................................................................. 71
variations in access to mathematics content within countries ...................................................................... 73
individual student characteristics and access to mathematics content .................................................... 81 gender differences in opportunity to learn mathematics ...................................................................... 81 immigrant students’ familiarity with mathematics concepts ................................................................. 83 attendance at pre-primary education and familiarity with mathematics ..................................... 85
Parents’ preferences, school selectivity and opportunity to learn mathematics .................................................................................................................................................................... 87
Equity in opportunity to learn and sorting students ............................................................................................. 90 Vertical stratification through grade repetition ............................................................................................... 92 horizontal stratification between and within schools and programmes ..................................... 94 selection through transfers ........................................................................................................................................ 104
how equity in opportunity to learn is related to teaching resources and practices ................... 108

© OECD 2016 equations and inequalities: making mathematics accessible to all8
Table of ConTenTs
ChaptEr 3 ExposurE to MathEMatics in school and pErforMancE in pisa �������123
Mathematics curricula and performance on different content areas of pisa �����������������������������������125
Variations in opportunity to learn and performance in mathematics �����������������������������������������������������133 Variations in time spent learning ��������������������������������������������������������������������������������������������������������������������������133 Variations in exposure to and familiarity with mathematics ���������������������������������������������������������������136
the links between opportunity to learn, mathematics literacy and socio-economic status ����������������������������������������������������������������������������������������������������������������������������������151
Examples of pisa mathematics units�������������������������������������������������������������������������������������������������������������������������������158
ChaptEr 4 opportunity to lEarn and studEnts’ attitudEs towards MathEMatics �����������������������������������������������������������������������������������������������������������������������165
how students’ motivation and self-beliefs vary across countries and subgroups of students �����������������������������������������������������������������������������������������������������������������������������169
relationships between opportunity to learn and attitudes towards mathematics ��������������������������175 exposure to pure mathematics, familiarity with mathematics and students’ attitudes
towards mathematics ������������������������������������������������������������������������������������������������������������������������������������������������������175 exposure to applied mathematics and students’ attitudes towards mathematics �����������������180 mathematics assessments and anxiety ��������������������������������������������������������������������������������������������������������������180
Mediating factors between exposure to mathematics and attitudes towards mathematics ����������182 the benefits and possible shortcomings of hard-working
and well-prepared peers ����������������������������������������������������������������������������������������������������������������������������������������������182 Parental involvement and children’s mathematics anxiety �������������������������������������������������������������������186 teachers’ practices and attitudes towards mathematics �������������������������������������������������������������������������190
developing knowledge of and engagement with mathematics at the same time����������������������������195
ChaptEr 5 a policy stratEgy to widEn opportunitiEs to lEarn MathEMatics �����������������������������������������������������������������������������������������������������������201
develop coherent standards, frameworks and instruction material for all students ��������������������202
help students acquire mathematics skills beyond content knowledge �������������������������������������������������205
reduce the impact of tracking on equity in exposure to mathematics �������������������������������������������������������������������������������������������������������������������������������������������������������������������������������207
learn how to handle heterogeneity in the classroom ����������������������������������������������������������������������������������������208 teach heterogeneous classes effectively �����������������������������������������������������������������������������������������������������������209 offer greater and individualised support to struggling students ������������������������������������������������������209
support positive attitudes towards mathematics through innovations in curricula and teaching �������������������������������������������������������������������������������������������������������������������������������������������������������210
Monitor and analyse opportunities to learn ������������������������������������������������������������������������������������������������������������211
aNNEX a list of tablEs aVailablE on linE ��������������������������������������������������������������������������������������������������217

equations and inequalities: making mathematics accessible to all © OECD 2016 9
TablE OF COnTEnTs
TABLE
table 5.1 Policy recommendations to widen opportunities to learn ..............................................................................203
BOXEs
box 1.1 the survey of adult skills (Piaac) ............................................................................................................................ 39
box 1.2 measures of opportunity to learn in Pisa 2012 ................................................................................................. 48
box 1.3 advantages and possible costs of contextualised mathematics ...................................................................... 58
box 2.1 What is socio-economic status and how it is measured in Pisa? ................................................................... 74
box 2.2 trends in between-school and within-school selection ................................................................................... 96
box 3.1 analysis of performance in Pisa at the task level ..............................................................................................147
box 3.2 integrating higher-order thinking skills in the mathematics curriculum .....................................................153
box 3.3 Fundamental mathematical competencies ..........................................................................................................156
box 4.1 students’ attitudes towards mathematics analysed in this chapter ...............................................................168
box 4.2 developing positive mathematics attitudes as a curriculum objective .......................................................175
FigurEs
Figure 1.1 the analytical framework ............................................................................................................................................ 38
Figure 1.2 numeracy skills used at work .................................................................................................................................... 40
Figure 1.3 Relationship between years of education and numeracy, and economic and social outcomes ........... 41
Figure 1.4 the Pisa model of mathematical literacy .............................................................................................................. 43
Figure 1.5 use of standardised practices for curriculum and teaching.............................................................................. 46
Figure 1.6 change between 2003 and 2012 in the time spent per week in mathematics classes ............................ 49
Figure 1.7 students’ familiarity with algebra and geometry .................................................................................................. 51
Figure 1.8 Relationship between exposure to applied mathematics and exposure to pure mathematics .............. 52
Figure 1.9 exposure to mathematics content in class, by grade .......................................................................................... 54
Figure 1.10a exposure to algebraic word problems during mathematics lessons ............................................................... 55
Figure 1.10b exposure to contextualised mathematics problems during mathematics lessons ...................................... 57
Figure 1.10c exposure to procedural mathematics tasks during mathematics lessons ...................................................... 59
Figure 1.10d exposure to pure mathematics problems during mathematics lessons ......................................................... 60
Figure 2.1 Variation in familiarity with mathematics, within and between schools ..................................................... 75
Figure 2.2 Variation in familiarity with mathematics explained by students’ and schools’ socio-economic profile ....................................................................................................................... 76
Figure 2.3 Familiarity with mathematics concepts, by parents’ highest level of education ........................................ 77
Figure 2.4 mathematics learning time at school, by students’ socio-economic status ................................................. 78
Figure 2.5a exposure to applied mathematics, by students’ socio-economic status ....................................................... 79
Figure 2.5b exposure to pure mathematics, by students’ socio-economic status ............................................................. 80
Figure 2.6 Familiarity with mathematics concepts, by gender ............................................................................................. 82

© OECD 2016 equations and inequalities: making mathematics accessible to all10
TablE OF COnTEnTs
Figure 2.7 Percentage of immigrants in schools, by school-level familiarity with mathematics .................................84
Figure 2.8 Familiarity with mathematics and attendance at pre-primary education ......................................................86
Figure 2.9 Parents’ preferences for schools, by socio-economic status ..............................................................................88
Figure 2.10 academic selectivity and equity in familiarity with mathematics ...................................................................89
Figure 2.11 Residency requirements and equity in familiarity with mathematics .............................................................91
Figure 2.12 selecting and grouping students .................................................................................................................................92
Figure 2.13 Familiarity with mathematics and students’ socio-economic status, by level of education ....................93
Figure 2.14 grade repetition and equity in familiarity with mathematics ...........................................................................95
Figure 2.15 age at first tracking and equity in familiarity with mathematics ......................................................................97
Figure 2.16 concentration in vocational schools of disadvantaged students and students with less familiarity with mathematics ............................................................................................98
Figure 2.17 effects of ability differences on the learning environment ..............................................................................100
Figure 2.18a Prevalence of ability grouping, by schools’ socio-economic profile ...........................................................102
Figure 2.18b ability grouping and students’ familiarity with mathematics .........................................................................103
Figure 2.19 teachers’ beliefs about the need to adapt academic standards to ability ..................................................105
Figure 2.20 teachers assigning different tasks to students based on ability, by schools’ socio-economic profile ..............................................................................................................................................106
Figure 2.21 school transfers and equity in familiarity with mathematics ..........................................................................107
Figure 2.22a number of students per teacher, by schools’ socio-economic profile ........................................................109
Figure 2.22b Percentage of qualified mathematics teachers, by schools’ socio-economic profile ..............................110
Figure 2.23a teachers’ use of cognitive-activation strategies and students’ performance in mathematics, by schools’ socio-economic profile........................................................................................................................112
Figure 2.23b teachers’ use of cognitive-activation strategies and students’ familiarity with mathematics, by schools’ socio-economic profile........................................................................................................................113
Figure 2.24 disciplinary climate and familiarity with mathematics, by students’ socio-economic status ..............115
Figure 3.1 Performance on the different mathematics content subscales .......................................................................127
Figure 3.2 difficulty of Pisa tasks, by content area ...............................................................................................................128
Figure 3.3a change between 2003 and 2012 in mathematics performance across content area change and relationships ..................................................................................................................129
Figure 3.3b change between 2003 and 2012 in mathematics performance across content area quantity............130
Figure 3.3c change between 2003 and 2012 in mathematics performance across content area space and shape ....................................................................................................................131
Figure 3.3d change between 2003 and 2012 in mathematics performance across content area uncertainty and data ..........................................................................................................................132
Figure 3.4 Relationship between performance and time spent in school lessons ........................................................134
Figure 3.5 mathematics performance and instruction time, after accounting for school characteristics ..............135
Figure 3.6 time spent in mathematics lessons, performance in mathematics and disciplinary climate ...............137
Figure 3.7 Relationship between performance and time spent in after-school lessons ..............................................138
Figure 3.8a Relationship between exposure to pure mathematics and mathematics performance ..........................139
Figure 3.8b Relationship between exposure to applied mathematics and mathematics performance ....................140
Figure 3.8c Relationship between familiarity with mathematics and mathematics performance .............................142
Figure 3.9 Performance in mathematics, by exposure to applied and pure mathematics .........................................143

equations and inequalities: making mathematics accessible to all © OECD 2016 11
TablE OF COnTEnTs
Figure 3.10 exposure to pure mathematics and the likelihood of top and low performance .....................................144
Figure 3.11 difference in mathematics performance across grades related to exposure to pure mathematics ....146
Figure 3.12 Familiarity with mathematics and success on Pisa items, by items’ difficulty .........................................149
Figure 3.13 Familiarity with mathematics and performance on a difficult mathematics task .....................................150
Figure 3.14 Familiarity with mathematics and performance on the most difficult mathematics task .......................152
Figure 3.15 differences in performance related to familiarity with mathematics, by socio-economic status .......154
Figure 3.16 socio-economic status and mathematics performance, by item difficulty ................................................156
Figure 3.17 socio-economic status and success on Pisa mathematics tasks, by required mathematics competencies ................................................................................................................................................................157
Figure 4.1 direct and indirect relationship between opportunity to learn and attitudes towards mathematics ................................................................................................................................169
Figure 4.2 change between 2003 and 2012 in the percentage of students who enjoy mathematics ....................170
Figure 4.3 mathematics self-concept, by students’ socio-economic status ....................................................................172
Figure 4.4 mathematics anxiety, by gender ..............................................................................................................................173
Figure 4.5 students’ intentions, motivation and expected careers in stem fields, by gender and socio-economic status ...................................................................................................................174
Figure 4.6 exposure to pure mathematics and students’ self-concept .............................................................................176
Figure 4.7 Relationship between familiarity with mathematics and students’ self-concept ......................................178
Figure 4.8 Familiarity with mathematics and mathematics anxiety, by students’ performance in mathematics ....................................................................................................................................179
Figure 4.9 Relationship between exposure to mathematics tasks during mathematics lessons and students’ self-concept ..........................................................................................................................181
Figure 4.10 mathematics anxiety and the mismatch between what is taught and what is tested ..............................182
Figure 4.11 motivation to learn mathematics and peers’ attitudes, by schools’ level of familiarity with mathematics .....................................................................................................................183
Figure 4.12 mathematics self-concept and relative familiarity with mathematics compared with schoolmates .....................................................................................................................................185
Figure 4.13 after-school study time with parents, by students’ level of familiarity with mathematics .....................187
Figure 4.14 Parents’ attitudes towards mathematics and students’ anxiety, by performance in mathematics ..............................................................................................................................189
Figure 4.15 teaching practices and students’ mathematics anxiety, by students’ level of familiarity with mathematics .....................................................................................................................191
Figure 4.16 teaching practices and students’ mathematics self-concept, by students’ level of familiarity with mathematics .....................................................................................................................192
Figure 4.17 students’ interest in mathematics and their use of computers in mathematics lessons .........................193
Figure 4.18 Performance gap between disadvantaged and other students, by context of task ...................................196
Figure 4.19 Relationship between exposure to pure mathematics and mathematics performance, by students’ interest in mathematics ...........................................................................................197

© OECD 2016 equations and inequalities: making mathematics accessible to all12
TablE OF COnTEnTs
Look for the StatLinks2at the bottom of the tables or graphs in this book. To download the matching Excel® spreadsheet, just type the link into your Internet browser, starting with the http://dx.doi.org pre�x, or click on the link from the e-book edition.
Follow OECD Publications on:
This book has... StatLinks2A service that delivers Excel �les from the printed page! ®
http://twitter.com/OECD_Pubs
http://www.facebook.com/OECDPublications
http://www.linkedin.com/groups/OECD-Publications-4645871
http://www.youtube.com/oecdilibrary
http://www.oecd.org/oecddirect/ OECD
Alerts

equations and inequalities: making mathematics accessible to all © OECD 2016 13
Executive Summary
With numeracy skills needed more than ever in the work place, today’s students must be able to compute fluently, engage in logical reasoning and use mathematics to tackle novel problems. however, Pisa 2012 results show that only a minority of 15-year-old students in most countries grasp and can work with core mathematics concepts. on average, less than 30% of students across oecd countries understand the concept of an arithmetic mean, while less than 50% of students can work with the concept of a polygon.
“opportunity to learn” refers to the content taught in the classroom and the time a student spends learning this content. not all students, not even those in the same school, experience equal opportunities to learn. Reducing inequalities in access to mathematics is not an impossible task. Pisa results show that performance disparities between socio-economically advantaged and disadvantaged students are largely linked to differences in students’ familiarity with mathematics. thus, raising disadvantaged students’ opportunities to learn mathematics concepts and processes may help reduce inequalities and improve the average level of performance. this objective can be achieved through a more focused and coherent curriculum, a thorough evaluation of the effects of policies and practices that sort students by ability, and stronger support for teachers who teach heterogeneous classes.
Tracking and ability grouping affect students’ exposure to mathematics and teachers’ practices across oecd countries, socio-economic differences among students and schools account for around 9% – and in some countries, as much as 20% – of the variation in familiarity with mathematics concepts. certain system-level policies, such as between-school tracking, academic selectivity or transferring students from one school to another because of low achievement or poor behaviour, are also associated with more unequal access to mathematics content. Pisa 2012 results show that, across oecd countries, around 54% of the international differences in the impact of students’ and schools’ socio-economic status on students’ familiarity with mathematics are explained by system-level differences in the age at which students are tracked into vocational or academic programmes.

© OECD 2016 equations and inequalities: making mathematics accessible to all14
ExECuTivE summaRy
some countries have replaced between-school tracking with ability grouping within schools. across oecd countries, more than 70% of students attend schools whose principal reported that students are grouped by ability for mathematics classes. but this type of ability grouping can reduce opportunities to learn for disadvantaged students just as much as between-school tracking does.
Postponing between-school tracking and reducing ability-grouping can reduce the influence of socio-economic status on students’ opportunities to learn but it has an impact on teachers: they must be prepared to teach more heterogeneous classes. teachers are generally committed to providing equal education opportunities: across oecd countries, about 70% of students attend schools where teachers believe it is best to adapt academic standards to the students’ levels and needs. however, adapting instruction to each student’s skills and needs while advancing learning for all students in the classroom is not easy. teachers need more support to use pedagogies, such as flexible grouping or co-operative learning strategies, that increase learning opportunities for all students in mixed-ability classes.
Exposure to mathematics concepts and procedures matters for performance, but is not sufficient for higher-order thinking skills Pisa data confirm previous evidence that the effectiveness of instruction time closely depends on the quality of the disciplinary climate in the classroom. but, more than the amount of time, the content of instruction matters for performance.
greater exposure to pure mathematics tasks and concepts (such as linear and quadratic equations) has a strong relationship with higher performance in Pisa, even after accounting for the fact that better-performing students may attend schools that offer more mathematics instruction. in contrast, exposure to simple applied mathematics problems (such as working out from a train timetable how long it would take to get from one place to another) has a weaker relationship with student performance. this suggests that simply including some references to the real-world in mathematics instruction does not automatically transform a routine task into a good problem. using well-designed, challenging problems in mathematics classes can have a large impact on students’ performance.
the mastery of core concepts and procedures is a necessary component of mathematics learning, but is hardly sufficient for solving the most complex problems. Pisa data show that frequent exposure to equations and formulas can make a difference to students tackling tasks that state the main terms of the problem and that require students to apply procedures they learned at school. but exposure to these procedures does not necessarily teach students how to think and reason mathematically. introducing problem-solving strategies – such as teaching students how to question, make connections and predictions, conceptualise and model complex problems – requires time and is more challenging in disadvantaged schools. Restructured textbooks, teaching materials and dedicated training can help minimise the time needed to incorporate these teaching practices into an already full schedule.

equations and inequalities: making mathematics accessible to all © OECD 2016 15
ExECuTivE summaRy
Exposure to complex mathematics can influence students’ attitudes exposure to relatively complex mathematics topics may undermine the self-beliefs of students who do not feel up to the task, while at the same time improving the attitudes and self-beliefs of those who are relatively well-prepared and ready to be challenged. on average across oecd countries, exposure to more complex mathematics concepts is associated with lower self-concept/higher anxiety among low-performing students, and with higher self-concept/lower anxiety among high-performing students. Pisa finds that practices such as encouraging students to work in small groups, providing extra help to students when they need it, or reducing the mismatch between what is taught and what is assessed can improve students’ self-beliefs and problem-solving skills. the data also show that students become more engaged with mathematics when they use computers in class. moreover teachers can work with parents to improve students’ attitudes towards mathematics, as Pisa data suggest that parents can unknowingly transmit mathematics anxiety to their children.
the statistical data for israel are supplied by and under the responsibility of the relevant israeli authorities. the use of such data by the oecd is without prejudice to the status of the golan heights, east Jerusalem and israeli settlements in the West bank under the terms of international law.

© OECD 2016 equations and inequalities: making mathematics accessible to all16
ExECuTivE summaRy
countries/economies where instruction time/exposure is above the oecd averagecountries/economies where instruction time/exposure is not statistically different from the oecd averagecountries/economies where instruction time/exposure is below the oecd average
Table 0.1 [Part 1/2] snapshOT OF OppORTuniTiEs TO lEaRn maThEmaTiCs
time spent per week in regular school lessons in mathematics
(minutes) Exposure to applied mathematics Exposure to pure mathematics
2012
Change between
2003 and 2012
Percentage of students who reported that they frequently
encounter, at school, problems like “Working out from a train
timetable how long it would take to get from one place to another” Index
Percentage of students who reported that they frequently
encounter, at school, equations like “6x2 + 5 = 29” Index
minutes dif. % mean index % mean indexoEcd average 218 13 17.1 0.00 61.6 0.00
Chile 398 m 28.1 -0.03 55.4 -0.10Canada 314 91 13.7 -0.10 59.5 -0.09United Arab Emirates
311 m 18.1 0.07 58.4 -0.10
Portugal 288 93 7.3 -0.37 48.0 -0.35Singapore 288 m 12.4 0.31 74.8 0.33Peru 287 m 20.9 0.13 62.9 0.11Tunisia 276 26 14.3 -0.20 46.7 -0.30Macao-China 275 3 11.9 -0.11 68.3 0.21Shanghai-China 269 m 14.2 0.18 67.0 0.06Argentina 269 m 15.7 -0.16 50.4 -0.25Hong Kong-China 268 -2 6.5 -0.14 64.4 0.15Colombia 263 m 21.5 -0.16 42.5 -0.39Qatar 259 m 26.1 0.09 50.1 -0.28Israel 254 m 15.2 -0.39 65.4 0.03United States 254 33 11.4 -0.08 65.5 0.09Mexico 253 18 17.7 0.18 56.7 -0.03Iceland 244 -10 23.6 0.20 72.3 0.23Chinese Taipei 243 m 8.7 -0.11 59.6 -0.04New Zealand 241 1 13.4 -0.05 48.4 -0.27Australia 236 6 15.7 -0.10 51.1 -0.17Japan 235 18 17.5 -0.18 69.4 0.19Italy 232 19 11.7 -0.42 71.7 0.22United Kingdom 230 m 18.8 0.03 62.0 0.02Jordan 227 m 24.6 0.30 55.2 -0.22Viet Nam 227 m 8.7 -0.23 68.0 0.17Denmark 224 18 25.0 0.27 46.3 -0.37Latvia 224 10 11.2 0.02 59.9 -0.01Estonia 223 m 18.1 0.07 62.5 0.03Russian Federation 222 15 25.4 0.18 75.0 0.29Belgium 217 21 12.6 -0.23 62.6 -0.09Brazil 215 4 25.8 0.05 38.1 -0.56Korea 213 -33 24.3 0.40 79.4 0.43
notes: the index of exposure to applied mathematics refers to student-reported experience with applied tasks at school, such as working out from a train timetable how long it would take to get from one place to another.the index of exposure to pure mathematics measures student-reported experience with mathematics tasks at school requiring knowledge of algebra (linear and quadratic equations).the oecd average of the time spent per week in regular school lessons in mathematics in 2012 is based on all oecd countries. the corresponding oecd average reported in table 1.6 is based on the oecd countries that participated in both Pisa 2003 and Pisa 2012.statistically significant values are indicated in bold.Countries/economies are ranked in descending order of the time spent in regular mathematics lessons.Source: oecd, Pisa 2012 database, tables 1.6, 1.9a and 1.9b.1 2 http://dx.doi.org/10.1787/888933377644

equations and inequalities: making mathematics accessible to all © OECD 2016 17
ExECuTivE summaRy
countries/economies where instruction time/exposure is above the oecd averagecountries/economies where instruction time/exposure is not statistically different from the oecd averagecountries/economies where instruction time/exposure is below the oecd average
time spent per week in regular school lessons in mathematics
(minutes) Exposure to applied mathematics Exposure to pure mathematics
2012
Change between
2003 and 2012
Percentage of students who reported that they frequently
encounter, at school, problems like “Working out from a train
timetable how long it would take to get from one place to another” Index
Percentage of students who reported that they frequently
encounter, at school, equations like “6x2 + 5 = 29” Index
minutes dif. % mean index % mean indexoEcd average 218 13 17.1 0.00 61.6 0.00
Liechtenstein 211 -5 13.8 0.01 76.2 0.22Spain 210 34 17.7 0.17 74.1 0.27Indonesia 209 -23 20.2 0.05 53.5 -0.15Greece 209 22 12.8 -0.41 67.5 0.05Costa Rica 208 m 23.3 -0.37 57.1 -0.06France 207 -1 15.9 -0.05 64.9 0.02Switzerland 207 8 17.7 -0.02 62.7 0.01Thailand 206 -18 11.6 0.40 53.0 -0.09Luxembourg 205 4 20.0 -0.28 52.8 -0.25Malaysia 201 m 10.7 0.00 59.8 -0.02Norway 199 33 17.8 0.18 57.8 0.00Poland 198 -7 21.2 0.48 61.8 0.09Germany 197 14 15.4 0.06 68.9 0.13Cyprus1 189 m 22.5 -0.17 60.4 -0.04Ireland 189 -2 20.0 0.14 68.1 0.14Kazakhstan 183 m 35.9 0.51 68.6 0.16Czech Republic 182 14 11.0 -0.25 54.2 -0.09Sweden 182 17 22.1 0.33 45.0 -0.25Slovak Republic 181 -18 15.4 0.05 57.1 -0.11Finland 175 19 21.1 0.23 61.3 0.00Turkey 172 -28 17.0 -0.17 58.8 -0.10Lithuania 172 m 16.6 0.19 65.3 0.13Albania 171 m 16.6 0.22 69.5 0.15Netherlands 171 21 6.8 0.22 64.6 -0.01Romania 169 m 19.1 0.10 60.6 -0.07Slovenia 160 m 17.7 0.04 67.2 0.20Austria 156 -10 19.0 -0.03 63.8 -0.03Uruguay 156 -27 12.5 -0.51 58.0 -0.06Serbia 154 m 19.9 -0.24 60.5 -0.08Hungary 150 -13 19.9 0.11 67.4 0.14Croatia 147 m 17.6 -0.04 67.8 0.19Montenegro 142 m 30.1 0.06 59.8 -0.09Bulgaria 134 m 19.3 0.00 65.4 0.06
Table 0.1 [Part 2/2] snapshOT OF OppORTuniTiEs TO lEaRn maThEmaTiCs
1. note by turkey: the information in this document with reference to “cyprus” relates to the southern part of the island. there is no single authority representing both turkish and greek cypriot people on the island. turkey recognises the turkish Republic of northern cyprus (tRnc). until a lasting and equitable solution is found within the context of the united nations, turkey shall preserve its position concerning the “cyprus issue”.note by all the european union member states of the oecd and the european union: the Republic of cyprus is recognised by all members of the united nations with the exception of turkey. the information in this document relates to the area under the effective control of the government of the Republic of cyprus.notes: the index of exposure to applied mathematics refers to student-reported experience with applied tasks at school, such as working out from a train timetable how long it would take to get from one place to another.the index of exposure to pure mathematics measures student-reported experience with mathematics tasks at school requiring knowledge of algebra (linear and quadratic equations).the oecd average of the time spent per week in regular school lessons in mathematics in 2012 is based on all oecd countries. the corresponding oecd average reported in table 1.6 is based on the oecd countries that participated in both Pisa 2003 and Pisa 2012.statistically significant values are indicated in bold.Countries/economies are ranked in descending order of the time spent in regular mathematics lessons.Source: oecd, Pisa 2012 database, tables 1.6, 1.9a and 1.9b.1 2 http://dx.doi.org/10.1787/888933377644

© OECD 2016 equations and inequalities: making mathematics accessible to all18
ExECuTivE summaRy
countries/economies where familiarity with mathematics is above the oecd averagecountries/economies where familiarity with mathematics is not statistically different from the oecd averagecountries/economies where familiarity with mathematics is below the oecd average
Table 0.2 [Part 1/2] snapshOT OF FamiliaRiTy WiTh maThEmaTiCs
Familiarity with mathematics
index
arithmetic mean linear equation vectors
Percentage of students who
have never heard the concept
Percentage of students who know well/understand the concept
Percentage of students who
have never heard the concept
Percentage of students who know well/understand the concept
Percentage of students who
have never heard the concept
Percentage of students who know well/
understand the concept
mean index % % % % % %
oEcd average 0.00 30.8 29.4 12.8 41.8 34.9 20.3
Korea 1.34 52.4 13.2 0.9 69.0 34.4 2.7
Shanghai-China 1.12 7.4 68.3 50.1 8.5 7.1 74.7
Chinese Taipei 0.95 9.6 46.2 21.1 23.9 19.6 19.4
Spain 0.82 20.0 34.9 12.3 41.8 31.3 28.5
Japan 0.79 1.2 76.1 1.6 69.1 31.6 9.6
Macao-China 0.52 22.7 35.7 1.3 72.3 33.3 20.8
Hong Kong-China 0.50 15.8 44.7 31.7 28.4 45.1 13.0
Viet Nam 0.43 20.1 25.6 64.9 4.2 5.1 60.4
Latvia 0.41 5.2 62.9 3.3 49.1 43.4 8.9
Estonia 0.35 4.8 59.2 1.0 63.7 39.7 6.3
Hungary 0.33 33.4 19.4 5.4 52.8 7.2 45.6
Cyprus1 0.31 15.0 38.1 26.5 23.0 7.6 41.0
Greece 0.31 9.5 44.5 18.4 23.4 5.6 46.4
Czech Republic 0.26 8.7 52.3 2.7 59.5 48.6 11.8
Belgium 0.11 33.2 28.5 29.7 21.9 25.2 36.6
Finland 0.11 67.0 3.3 7.9 33.4 60.1 2.6
Turkey 0.10 4.7 49.3 6.4 26.4 4.6 42.1
Israel 0.10 20.6 46.0 16.4 53.9 65.7 10.0
France 0.09 38.0 21.3 10.5 44.3 24.8 48.9
Germany 0.09 50.4 17.3 6.2 63.6 42.0 14.4
Austria 0.05 53.4 14.8 10.9 51.3 28.5 30.1
Liechtenstein 0.04 60.0 10.8 16.2 50.7 38.3 27.3
United States 0.03 42.5 18.7 3.2 56.8 31.5 12.7
Singapore 0.02 35.8 26.0 2.4 62.6 15.1 44.0
Iceland 0.02 30.1 32.5 53.0 8.2 73.6 2.8
Slovak Republic -0.04 11.7 47.1 4.5 57.0 51.1 12.3
Italy -0.04 10.3 56.6 19.5 36.8 17.9 36.2
Slovenia -0.06 15.5 39.6 2.2 64.2 17.1 28.9
Russian Federation -0.07 2.3 74.2 1.5 70.8 2.8 65.1
Uruguay -0.07 54.8 6.4 18.7 26.4 14.9 35.0
United Arab Emirates -0.08 13.7 52.9 8.1 55.0 29.9 27.1
Canada -0.10 45.3 14.6 5.8 55.6 32.4 13.2
Lithuania -0.12 17.7 36.8 15.1 35.1 57.9 3.0
1. see note 1 under snapshot table 0.1 [Part 2/2].note: the index of familiarity with mathematics is based on students’ responses to 13 items measuring students’ self-reported familiarity with mathematics concepts (such as exponential function, divisor, quadratic function, etc.). Countries/economies are ranked in descending order of the index of familiarity with mathematics.Source: oecd, Pisa 2012 database, tables 1.7 and 1.8. 1 2 http://dx.doi.org/10.1787/888933377650

equations and inequalities: making mathematics accessible to all © OECD 2016 19
ExECuTivE summaRy
countries/economies where familiarity with mathematics is above the oecd averagecountries/economies where familiarity with mathematics is not statistically different from the oecd averagecountries/economies where familiarity with mathematics is below the oecd average
Table 0.2 [Part 2/2] snapshOT OF FamiliaRiTy WiTh maThEmaTiCs
Familiarity with mathematics
index
arithmetic mean linear equation vectors
Percentage of students who
have never heard the concept
Percentage of students who know well/understand the concept
Percentage of students who
have never heard the concept
Percentage of students who know well/understand the concept
Percentage of students who
have never heard the concept
Percentage of students who know well/
understand the concept
mean index % % % % % %
oEcd average 0.00 30.8 29.4 12.8 41.8 34.9 20.3
Croatia -0.14 9.8 49.3 1.4 72.0 3.5 55.9
Switzerland -0.18 51.0 11.1 21.1 31.2 45.5 17.3
Portugal -0.18 30.9 20.9 16.8 24.5 8.4 47.3
Bulgaria -0.19 9.7 53.7 5.4 57.5 9.7 40.7
Serbia -0.26 12.6 38.0 1.6 64.2 3.2 58.0
Poland -0.27 1.8 65.7 20.0 15.8 16.3 21.6
Chile -0.27 28.8 17.4 4.9 49.7 16.5 30.4
Denmark -0.31 10.4 42.1 11.0 38.8 54.1 3.3
United Kingdom -0.32 40.3 18.6 11.3 35.9 18.4 27.0
Australia -0.34 43.2 15.5 9.2 47.1 31.1 12.9
Ireland -0.34 38.6 22.1 11.8 38.0 58.1 4.0
Romania -0.34 5.6 54.3 5.3 52.7 7.4 39.8
Jordan -0.38 7.8 66.1 9.2 60.3 33.1 18.7
Costa Rica -0.39 46.4 12.3 27.3 23.7 39.7 25.2
Tunisia -0.40 12.2 46.3 47.6 12.3 33.2 19.6
Colombia -0.42 21.9 18.2 12.6 28.4 25.5 26.4
Netherlands -0.43 27.5 25.0 10.2 42.5 58.0 8.2
Montenegro -0.47 24.9 22.4 3.9 59.5 9.0 44.6
Kazakhstan -0.48 5.8 53.6 6.9 47.8 5.5 54.4
Mexico -0.48 18.7 17.9 9.0 30.0 27.2 10.5
Sweden -0.49 65.3 3.8 39.0 8.6 71.5 3.4
New Zealand -0.53 49.2 10.2 13.0 36.7 34.0 13.0
Peru -0.56 15.2 25.1 7.1 35.4 29.6 18.8
Brazil -0.57 29.1 17.5 28.5 12.9 36.8 11.4
Luxembourg -0.58 56.7 10.4 27.8 27.7 39.0 28.3
Argentina -0.60 58.7 7.5 27.6 23.8 38.6 19.0
Albania -0.62 5.6 52.7 6.6 42.6 3.1 58.3
Thailand -0.72 5.4 31.0 3.4 34.9 16.3 22.8
Qatar -0.83 19.1 35.9 15.3 44.3 27.8 24.5
Malaysia -0.85 54.3 3.9 9.1 35.7 30.1 10.2
Indonesia -0.90 5.0 27.2 8.6 19.6 20.2 11.1
Norway m m m m m m m
note: the index of familiarity with mathematics is based on students’ responses to 13 items measuring students’ self-reported familiarity with mathematics concepts (such as exponential function, divisor, quadratic function, etc.).Countries/economies are ranked in descending order of the index of familiarity with mathematics.Source: oecd, Pisa 2012 database, tables 1.7 and 1.8. 1 2 http://dx.doi.org/10.1787/888933377650

© OECD 2016 equations and inequalities: making mathematics accessible to all20
ExECuTivE summaRy
countries/economies where the strength of the relationship between socio-economic status and familiarity with mathematics is below the oecd average
countries/economies where the strength of the relationship between socio-economic status and familiarity with mathematics is not statistically different from the oecd average
countries/economies where the strength of the relationship between socio-economic status and familiarity with mathematics is above the oecd average
Table 0.3 [Part 1/2] snapshOT OF vaRiaTiOn in OppORTuniTiEs TO lEaRn maThEmaTiCs,
by ChaRaCTERisTiCs OF sTuDEnTs anD sChOOls
Percentage of variation in
familiarity with mathematics explained by students’ and
schools’ socio-economic profile
difference between socio-economically advantaged and disadvantaged students Familiarity with mathematics (index)
Time spent per week in regular school lessons in mathematics
(minutes)
Exposure to applied
mathematics (index)
Exposure to pure
mathematics (index)
Familiarity with
mathematics (index)
Difference (boys-girls)
Difference (non-
immigrant - immigrant)
Difference (attended
pre-primary education -
not attended)
% dif. dif. dif. dif. dif. dif. dif.
oEcd average 8.5 7 0.23 0.44 0.45 -0.15 0.17 0.29
Liechtenstein 24.5 -15 0.36 0.28 0.60 0.06 0.48 cHungary 21.4 3 0.07 0.41 0.85 -0.25 -0.07 cAustria 18.6 -3 0.11 0.51 0.77 -0.07 0.30 0.23Germany 16.3 -11 0.11 0.44 0.61 -0.12 0.29 0.37Slovenia 15.3 19 0.22 0.35 0.43 -0.15 0.13 0.11Belgium 14.4 31 0.19 0.69 0.76 -0.09 0.33 0.51Chinese Taipei 13.7 57 0.50 0.59 0.74 -0.17 c 0.34Netherlands 12.6 -10 0.06 0.63 0.42 -0.08 0.25 0.26Korea 12.5 24 0.55 0.42 0.63 -0.11 c 0.05Chile 12.4 -20 0.22 0.50 0.59 -0.06 -0.01 0.32Slovak Republic 11.8 6 -0.10 0.36 0.50 -0.22 c 0.51Brazil 11.6 18 0.19 0.19 0.46 -0.12 0.08 0.18Switzerland 11.4 -15 0.15 0.50 0.61 -0.04 0.31 0.44Croatia 11.2 31 0.08 0.32 0.45 -0.16 0.11 0.17Japan 10.7 53 0.33 0.40 0.33 0.00 c 0.94Italy 10.5 4 0.04 0.38 0.40 -0.08 0.42 0.38Portugal 10.5 20 0.36 0.66 0.74 -0.24 0.15 0.22Turkey 10.3 37 -0.01 0.48 0.45 -0.37 c 0.25Thailand 10.2 34 0.28 0.42 0.35 -0.26 c 0.16Serbia 10.1 16 -0.02 0.26 0.43 -0.21 -0.14 0.14Uruguay 9.8 6 -0.05 0.39 0.54 -0.18 c 0.30Bulgaria 9.2 16 0.17 0.52 0.58 -0.34 c 0.22Singapore 8.7 30 0.11 0.33 0.54 -0.20 0.00 0.58Luxembourg 8.4 3 0.34 0.58 0.50 -0.03 0.03 0.05Czech Republic 7.9 4 0.04 0.40 0.27 -0.12 0.16 0.30Spain 7.8 -4 0.07 0.31 0.79 -0.21 0.44 0.48Romania 7.6 9 0.22 0.50 0.59 -0.16 c 0.26Montenegro 7.6 21 0.14 0.25 0.39 -0.15 -0.04 0.14Colombia 7.5 17 0.27 0.18 0.39 -0.03 c 0.14Shanghai-China 7.4 11 0.13 0.09 0.55 -0.15 c 0.85Peru 7.3 23 0.43 0.51 0.47 -0.11 c 0.16United States 6.6 24 0.31 0.36 0.60 -0.24 -0.02 0.15Australia 5.5 3 0.37 0.62 0.34 -0.09 -0.22 0.19
notes: the index of familiarity with mathematics is based on students’ responses to 13 items measuring students’ self-reported familiarity with mathematics concepts (such as exponential function, divisor, quadratic function, etc.). the index of exposure to applied mathematics measures student-reported experience with applied mathematics tasks at school, such as working out from a train timetable how long it would take to get from one place to another.the index of exposure to pure mathematics measures student-reported experience with mathematics tasks at school requiring knowledge of algebra (linear and quadratic equations).statistically significant values are indicated in bold.Countries/economies are ranked in descending order of the percentage of variation in familiarity with mathematics explained by students’ and schools’ socio-economic profile.Source: oecd, Pisa 2012 database, tables 2.2, 2.3, 2.4a and 2.10. 1 2 http://dx.doi.org/10.1787/888933377666

equations and inequalities: making mathematics accessible to all © OECD 2016 21
ExECuTivE summaRy
Percentage of variation in
familiarity with mathematics explained by students’ and
schools’ socio-economic profile
difference between socio-economically advantaged and disadvantaged students Familiarity with mathematics (index)
Time spent per week in regular school lessons in mathematics
(minutes)
Exposure to applied
mathematics (index)
Exposure to pure
mathematics (index)
Familiarity with
mathematics (index)
Difference (boys-girls)
Difference (non-
immigrant - immigrant)
Difference (attended
pre-primary education -
not attended)
% dif. dif. dif. dif. dif. dif. dif.
oEcd average 8.5 7 0.23 0.44 0.45 -0.15 0.17 0.29
Lithuania 5.4 5 0.20 0.28 0.23 -0.33 0.11 0.13Ireland 5.1 1 0.28 0.44 0.35 -0.15 0.03 0.05United Kingdom 5.0 -8 0.26 0.36 0.32 -0.15 0.04 0.33New Zealand 4.9 3 0.56 0.72 0.33 -0.12 -0.10 0.21Russian Federation 4.8 20 0.22 0.35 0.36 -0.20 0.19 0.21Poland 4.7 9 0.24 0.30 0.41 -0.21 c 0.21Argentina 4.7 65 0.24 0.35 0.31 -0.17 0.28 0.26Indonesia 4.4 27 0.33 0.27 0.18 -0.04 c 0.14Costa Rica 4.2 22 0.19 0.42 0.32 -0.09 0.23 0.16United Arab Emirates 4.1 -5 0.42 0.55 0.28 -0.35 -0.42 0.33
Qatar 3.9 -5 0.24 0.48 0.32 0.02 -0.48 0.32Greece 3.7 10 -0.04 0.48 0.41 -0.32 0.36 0.34Iceland 3.5 3 0.53 0.40 0.33 -0.32 0.46 0.38Latvia 3.3 13 0.20 0.43 0.31 -0.36 0.29 -0.06Kazakhstan 3.2 37 0.18 0.25 0.22 -0.10 0.11 0.18Macao-China 2.8 8 0.14 0.05 -0.27 0.00 -0.24 0.46Israel 2.7 18 0.13 0.44 0.32 -0.16 0.07 0.66Sweden 2.7 -6 0.45 0.40 0.26 -0.17 0.16 0.23Canada 2.6 11 0.41 0.43 0.29 -0.18 -0.04 0.07Viet Nam 2.6 21 -0.02 0.40 0.24 -0.19 c 0.22Tunisia 2.2 21 0.30 0.50 0.12 -0.12 c 0.12Mexico 1.9 11 0.15 0.23 0.18 -0.10 0.22 0.14Jordan 1.6 3 0.55 0.54 0.33 -0.53 -0.04 0.25Finland 1.4 5 0.36 0.40 0.23 -0.24 0.29 0.10Denmark 1.2 -1 0.16 0.16 0.20 -0.03 0.21 0.42Hong Kong-China 1.2 8 0.23 0.23 -0.24 0.05 -0.11 0.33Malaysia 0.6 33 0.50 0.59 0.11 -0.07 0.02 0.03Estonia 0.6 4 0.29 0.29 0.13 -0.21 0.23 -0.15Cyprus1 0.2 6 0.41 0.54 0.11 -0.43 0.32 0.24Albania m m m m m -0.01 c 0.14France w 18 0.32 0.54 0.64 -0.16 0.21 0.62Norway m 2 0.27 0.28 m m m m
countries/economies where the strength of the relationship between socio-economic status and familiarity with mathematics is below the oecd average
countries/economies where the strength of the relationship between socio-economic status and familiarity with mathematics is not statistically different from the oecd average
countries/economies where the strength of the relationship between socio-economic status and familiarity with mathematics is above the oecd average
Table 0.3 [Part 2/2] snapshOT OF vaRiaTiOn in OppORTuniTiEs TO lEaRn maThEmaTiCs,
by ChaRaCTERisTiCs OF sTuDEnTs anD sChOOls
1. see note 1 under snapshot table 0.1 [Part 2/2].notes: the index of familiarity with mathematics is based on students’ responses to 13 items measuring students’ self-reported familiarity with mathematics concepts (such as exponential function, divisor, quadratic function, etc.). the index of exposure to applied mathematics measures student-reported experience with applied mathematics tasks at school, such as working out from a train timetable how long it would take to get from one place to another.the index of exposure to pure mathematics measures student-reported experience with mathematics tasks at school requiring knowledge of algebra (linear and quadratic equations).statistically significant values are indicated in bold.Countries/economies are ranked in descending order of the percentage of variation in familiarity with mathematics explained by students’ and schools’ socio-economic profile.Source: oecd, Pisa 2012 database, tables 2.2, 2.3, 2.4a and 2.10. 1 2 http://dx.doi.org/10.1787/888933377666

© OECD 2016 equations and inequalities: making mathematics accessible to all22
ExECuTivE summaRy
Percentage of students who know well/understand the concept
arithmetic mean linear equation vectors
Socio-economi-
cally disadvan-
taged students
Socio-economi-
cally advan-taged
students
Difference (advantaged -
disadvan taged)
Socio-economi-
cally disadvan-
taged students
Socio-economi-
cally advantaged
students
Difference (advantaged -
disadvantaged)
Socio-economi-
cally disadvan-
taged students
Socio-economi-
cally advantaged
students
Difference (advantaged -
disadvantaged)
% % % dif. % % % dif. % % % dif.
oEcd average 20.4 39.9 19.5 29.9 54.3 24.5 12.1 29.8 17.7
Bulgaria 31.7 72.5 40.8 35.8 75.3 39.5 19.7 60.7 41.0
Romania 36.9 74.7 37.8 37.8 72.6 34.7 28.5 54.3 25.8
Slovak Republic 28.9 63.0 34.1 41.7 72.0 30.4 5.3 21.6 16.3
Poland 48.8 82.1 33.4 10.0 22.0 12.0 12.1 33.4 21.3
Chinese Taipei 31.4 62.5 31.1 10.9 41.1 30.1 11.4 28.5 17.1
Croatia 35.3 66.1 30.8 61.6 83.1 21.5 45.3 67.7 22.5
Greece 30.5 60.3 29.8 16.6 33.2 16.6 31.6 63.4 31.8
Cyprus1 24.6 54.2 29.7 10.3 41.6 31.2 25.8 60.2 34.4
Serbia 24.0 53.6 29.6 53.4 77.2 23.8 47.2 70.7 23.5
Estonia 46.4 75.0 28.6 54.6 73.6 19.0 4.2 9.1 4.9
Russian Federation 57.3 85.9 28.6 55.8 84.2 28.4 51.6 78.8 27.3
Israel 29.8 58.4 28.5 41.1 67.2 26.1 6.0 16.6 10.6
Portugal 8.7 37.0 28.4 16.9 34.7 17.8 28.3 65.8 37.4
Czech Republic 39.4 66.9 27.5 46.5 70.8 24.3 4.7 21.7 17.1
Turkey 38.1 65.6 27.5 22.1 34.7 12.6 31.4 56.7 25.3
Spain 21.7 49.1 27.5 27.5 56.2 28.7 15.8 42.3 26.5
Kazakhstan 38.7 66.0 27.3 34.8 60.3 25.6 41.7 66.7 25.0
Shanghai-China 54.3 81.3 27.0 5.3 12.8 7.5 57.7 87.1 29.4
Slovenia 26.3 53.2 26.9 50.0 76.9 27.0 11.2 47.4 36.2
Denmark 29.1 55.9 26.8 26.6 52.8 26.2 1.7 6.6 4.8
Tunisia 34.5 59.4 24.9 9.1 17.7 8.7 16.6 23.2 6.6
Latvia 49.1 73.8 24.8 38.9 59.7 20.8 3.7 13.1 9.5
Lithuania 25.0 48.3 23.3 25.4 46.4 20.9 0.8 5.4 4.6
Singapore 14.9 37.9 23.0 45.3 78.4 33.1 27.6 57.7 30.1
Korea 3.9 26.5 22.6 51.0 84.5 33.4 0.7 5.6 4.9
Italy 45.2 67.4 22.2 25.0 49.6 24.6 25.9 47.3 21.4
Hungary 9.3 31.4 22.1 32.7 72.7 40.0 29.9 60.6 30.7
United States 9.8 31.6 21.7 42.6 71.4 28.7 7.5 17.7 10.3
Peru 15.0 36.6 21.6 23.6 50.5 26.9 9.6 30.0 20.4
Viet Nam 15.9 37.5 21.6 2.6 6.1 3.5 45.6 73.1 27.5
Brazil 10.3 30.6 20.3 7.7 21.0 13.3 5.7 23.2 17.5
Austria 5.5 25.5 20.0 30.1 71.2 41.1 15.2 49.7 34.5
countries/economies where familiarity with mathematics is above the oecd average
countries/economies where familiarity with mathematics is not statistically different from the oecd average
countries/economies where familiarity with mathematics is below the oecd average
Table 0.4 [Part 1/2] snapshOT OF vaRiaTiOn in FamiliaRiTy WiTh maThEmaTiCs,
by sTuDEnTs’ sOCiO-ECOnOmiC sTaTus
1. see note 1 under snapshot table 0.1 [Part 2/2].note: statistically significant values are indicated in bold.Countries/economies are ranked in descending order of the difference in the percentage of students who know well/understand the concept of arithmetic mean between socio-economically advantaged and disadvantaged students.Source: oecd, Pisa 2012 database, table 2.4b. 1 2 http://dx.doi.org/10.1787/888933377670

equations and inequalities: making mathematics accessible to all © OECD 2016 23
ExECuTivE summaRy
Percentage of students who know well/understand the concept
arithmetic mean linear equation vectors
Socio-economi-
cally disadvan-
taged students
Socio-economi-
cally advan-taged
students
Difference (advantaged -
disadvan taged)
Socio-economi-
cally disadvan-
taged students
Socio-economi-
cally advantaged
students
Difference (advantaged -
disadvantaged)
Socio-economi-
cally disadvan-
taged students
Socio-economi-
cally advantaged
students
Difference (advantaged -
disadvantaged)
% % % dif. % % % dif. % % % dif.
oecd average 20.4 39.9 19.5 29.9 54.3 24.5 12.1 29.8 17.7
Indonesia 20.4 40.2 19.9 14.9 26.9 11.9 8.2 15.4 7.2
Thailand 23.6 43.2 19.7 27.8 47.0 19.2 13.4 37.7 24.3
Ireland 12.3 31.9 19.6 25.7 51.4 25.7 3.3 5.1 1.8
Belgium 19.7 39.1 19.3 16.2 27.3 11.1 24.9 47.9 23.0
Japan 66.6 84.3 17.8 57.1 77.7 20.6 4.3 14.8 10.5
Iceland 26.3 42.7 16.3 5.3 13.9 8.6 2.0 5.4 3.4
United Kingdom 11.2 27.6 16.3 24.2 51.1 26.9 17.2 38.4 21.2
Jordan 57.6 72.6 15.0 48.5 68.7 20.2 14.2 23.7 9.6
Liechtenstein 4.0 18.8 14.8 34.6 62.6 28.0 18.2 36.3 18.0
Australia 8.4 23.1 14.6 30.1 63.9 33.8 8.7 18.1 9.3
New Zealand 3.5 17.9 14.5 20.5 54.3 33.8 5.8 22.6 16.7
Netherlands 19.3 32.9 13.7 29.8 59.1 29.3 5.4 12.5 7.2
Chile 12.1 25.3 13.2 31.3 70.4 39.1 15.0 46.9 32.0
France 17.0 30.1 13.2 36.3 54.8 18.5 27.3 72.1 44.7
Colombia 13.7 26.1 12.4 19.5 41.8 22.3 16.9 38.9 22.0
Luxembourg 6.0 17.8 11.8 16.7 37.4 20.7 12.6 45.3 32.7
Switzerland 6.4 17.7 11.2 19.3 46.7 27.5 11.8 26.1 14.3
Montenegro 17.0 28.1 11.1 47.0 69.4 22.3 33.8 55.2 21.4
Costa Rica 7.7 18.1 10.4 12.5 38.4 25.9 15.1 36.7 21.6
Canada 9.8 19.8 10.0 41.1 69.5 28.5 8.4 17.9 9.5
Mexico 14.4 23.9 9.5 21.2 42.6 21.4 5.6 17.4 11.8
Germany 13.5 22.2 8.8 48.0 72.9 24.8 11.6 17.4 5.9
Hong Kong-China 40.8 49.0 8.2 18.3 40.8 22.5 8.0 21.3 13.4
Macao-China 32.1 39.5 7.4 71.7 72.0 0.3 14.1 28.6 14.5
Qatar 29.0 35.8 6.7 30.0 49.1 19.2 15.6 30.4 14.7
Finland 1.8 6.4 4.6 22.3 45.0 22.7 1.3 4.3 3.1
Uruguay 3.9 8.2 4.3 16.3 38.5 22.2 20.8 51.4 30.6
United Arab Emirates 48.5 51.9 3.4 42.3 62.2 19.9 16.0 36.4 20.4
Argentina 5.8 8.9 3.0 17.3 32.4 15.1 11.2 27.0 15.8
Sweden 2.8 5.5 2.8 5.6 12.0 6.4 2.2 4.8 2.6
Malaysia 3.8 4.5 0.7 21.8 54.1 32.4 6.2 17.2 11.0
Norway m m m m m m m m m
countries/economies where familiarity with mathematics is above the oecd average
countries/economies where familiarity with mathematics is not statistically different from the oecd average
countries/economies where familiarity with mathematics is below the oecd average
Table 0.4 [Part 2/2] snapshOT OF vaRiaTiOn in FamiliaRiTy WiTh maThEmaTiCs,
by sTuDEnTs’ sOCiO-ECOnOmiC sTaTus
note: statistically significant values are indicated in bold.Countries/economies are ranked in descending order of the difference in the percentage of students who know well/understand the concept of arithmetic mean between socio-economically advantaged and disadvantaged students.Source: oecd, Pisa 2012 database, table 2.4b. 1 2 http://dx.doi.org/10.1787/888933377670

© OECD 2016 equations and inequalities: making mathematics accessible to all24
ExECuTivE summaRy
Table 0.5 [Part 1/2] snapshOT OF ThE RElaTiOnship bETWEEn OppORTuniTy
TO lEaRn anD hORizOnTal sTRaTiFiCaTiOn
age at first
tracking
Percentage of students in vocational schoolsPercentage of students in schools with ability
grouping for some or all classes
All students
Socio-economically disadvantaged
students
Students who are less familiar with mathematics All students
Students in socio-
economically disadvantaged
schools
Students in schools with overall less
familiarity with mathematics
Years % % % % % %
oEcd average 15 14.5 19.8 21.3 74.1 78.2 79.1
Serbia m 74.4 87.9 86.9 94.8 98.3 97.9
Croatia 14 70.1 89.7 90.4 92.0 99.1 100.0
Austria 10 69.3 79.2 89.5 28.1 62.9 57.9
Montenegro 15 66.0 81.5 76.6 93.1 95.6 92.9
Slovenia 14 53.2 74.9 74.7 49.5 50.6 38.9
Italy 14 49.6 68.1 65.6 75.9 80.8 80.1
Belgium 12 44.0 64.0 69.6 79.4 87.9 78.3
Bulgaria 13 40.8 55.2 48.6 93.1 91.9 92.9
Turkey 11 38.1 43.5 55.1 75.8 74.1 88.4
Chinese Taipei 15 34.5 49.9 41.7 80.5 83.6 75.9
Czech Republic 11 31.0 33.7 33.7 41.2 44.6 35.2
Colombia 15 25.2 19.3 17.6 93.6 89.4 94.4
Mexico 15 25.2 19.3 21.5 73.7 78.4 82.7
Japan 15 24.2 36.3 30.6 63.1 64.5 73.7
Netherlands 12 22.2 38.5 37.7 93.6 94.5 95.0
Shanghai-China 15 21.2 29.5 36.4 94.1 94.2 87.3
Indonesia 15 20.2 18.6 17.1 75.4 75.1 86.4
Korea 14 19.9 37.7 34.2 90.1 83.7 77.2
Thailand 15 19.6 21.4 26.0 76.3 69.7 77.7
Portugal 15 16.7 27.9 29.4 61.7 80.4 74.3
France 15 15.3 23.2 27.4 56.2 68.7 74.4
Luxembourg 13 14.5 16.0 14.3 67.9 80.6 86.0
Argentina 15 14.5 16.7 16.0 85.5 87.3 84.1
Hungary 11 14.3 30.4 31.7 76.7 72.6 73.9
Greece 15 13.5 22.5 24.8 18.6 32.0 34.1
Malaysia 15 13.3 13.4 13.8 95.9 97.7 100.0
Australia 16 10.9 14.1 14.1 98.4 99.5 99.4
Cyprus1 15 10.8 20.3 19.7 50.9 60.8 66.7
Switzerland 12 10.7 10.6 13.4 85.0 92.4 98.8
Costa Rica m 9.1 8.1 5.7 60.4 50.9 47.6
Albania 15 8.4 m 8.3 99.9 m 100.0
Slovak Republic 11 8.2 13.2 14.6 71.6 70.4 77.7
Kazakhstan m 7.7 8.1 7.6 97.6 100.0 100.0
Russian Federation 15.5 4.1 6.2 4.8 96.0 92.7 100.0
1. see note 1 under snapshot table 0.1 [Part 2/2].Countries/economies are ranked in descending order of the percentage of students in vocational programmes.Source: oecd, Pisa 2012 database, tables 2.16, 2.17 and 2.19a.1 2 http://dx.doi.org/10.1787/888933377680

equations and inequalities: making mathematics accessible to all © OECD 2016 25
ExECuTivE summaRy
Table 0.5 [Part 2/2] snapshOT OF ThE RElaTiOnship bETWEEn OppORTuniTy
TO lEaRn anD hORizOnTal sTRaTiFiCaTiOn
age at first
tracking
Percentage of students in vocational schoolsPercentage of students in schools with ability
grouping for some or all classes
All students
Socio-economically disadvantaged
students
Students who are less familiar with mathematics All students
Students in socio-
economically disadvantaged
schools
Students in schools with overall less
familiarity with mathematics
Years % % % % % %
oecd average 15 14.5 19.8 21.3 74.1 78.2 79.1
Israel 15 3.1 5.2 7.1 98.3 98.5 100.0
Chile 16 2.8 4.3 3.7 64.3 77.1 77.8
United Arab Emirates 15 2.7 1.6 4.4 86.2 91.9 81.7
Germany 10 2.0 3.3 4.9 68.1 82.5 84.2
Macao-China 15 1.6 3.0 1.8 66.1 56.8 77.1
Uruguay 11 1.4 2.0 1.9 91.1 93.3 97.0
United Kingdom 16 1.1 1.5 1.4 99.3 99.5 99.6
Latvia 16 0.9 1.2 0.7 82.2 88.4 88.2
Ireland 15 0.8 2.1 1.3 99.2 100.0 100.0
Spain 16 0.7 1.6 1.5 92.4 96.0 94.0
Lithuania 16 0.6 1.3 1.3 84.1 83.8 96.2
Estonia 15 0.4 1.0 0.0 89.1 82.1 91.5
Sweden 16 0.4 0.1 0.4 84.3 79.0 87.5
Poland 16 0.1 0.0 0.0 57.6 51.6 30.2
Brazil 15 0.0 0.0 0.0 81.6 80.2 83.2
New Zealand 16 0.0 0.0 0.0 98.7 99.4 100.0
Finland 16 0.0 0.0 0.0 64.5 51.6 60.2
Canada 16 0.0 0.0 0.0 92.9 94.6 94.9
Norway 16 0.0 0.0 m 45.8 59.5 m
Romania 14 0.0 0.0 0.0 90.3 86.7 91.7
Iceland 16 0.0 0.0 0.0 87.1 98.2 100.0
Qatar 15 0.0 0.0 0.0 91.6 92.8 93.5
Denmark 16 0.0 0.0 0.0 75.9 77.2 85.9
Liechtenstein 15 0.0 0.0 0.0 59.9 c 100.0
Jordan 16 0.0 0.0 0.0 81.7 85.3 92.2
Viet Nam 15 0.0 0.0 0.0 93.1 87.9 88.3
United States 16 0.0 0.0 0.0 93.9 94.9 79.9
Singapore 12 0.0 0.0 0.0 97.2 97.9 100.0
Tunisia m 0.0 0.0 0.0 82.3 80.2 100.0
Hong Kong-China 15 0.0 0.0 0.0 91.0 97.7 100.0
Peru 16 0.0 0.0 0.0 86.8 84.4 83.8
Countries/economies are ranked in descending order of the percentage of students in vocational programmes.Source: oecd, Pisa 2012 database, tables 2.16, 2.17 and 2.19a.1 2 http://dx.doi.org/10.1787/888933377680

© OECD 2016 equations and inequalities: making mathematics accessible to all26
ExECuTivE summaRy
Performance in mathematics, by content area
Score-point difference in mathematics performance associated with a one-unit
increase in the index of:
Percentage of the difference
in mathematics performance between
socio-economically disadvantaged and
advantaged students associated with
different levels of familiarity with mathematics
Change and relationships Quantity
Space and shape
Uncertainty and data
Exposure to applied
mathematics
Exposure to pure
mathematics
Familiarity with
mathematics
mean score mean score mean score mean score
score-point change
score-point change
score-point change %
OECD average 493 495 490 493 9 30 41 18.8
Korea 559 537 573 538 28 61 55 33.7New Zealand 501 499 491 506 26 42 55 14.4Australia 509 500 497 508 21 37 55 20.7Chinese Taipei 561 543 592 549 27 47 51 22.2Switzerland 530 531 544 522 10 36 50 29.5Liechtenstein 542 538 539 526 15 33 49 33.9Hungary 481 476 474 476 2 28 48 29.0Singapore 580 569 580 559 8 44 48 19.1Germany 516 517 507 509 3 35 48 29.9Slovenia 499 504 503 496 4 28 48 19.2France 497 496 489 492 20 33 47 22.3Italy 477 491 487 482 1 31 47 21.6Portugal 486 481 491 486 8 29 47 26.3Netherlands 518 532 507 532 2 44 46 22.5Croatia 468 480 460 468 10 26 45 23.3United States 488 478 463 488 13 31 44 27.4Slovak Republic 474 486 490 472 -10 30 43 13.6United Kingdom 496 494 475 502 20 32 43 15.3Sweden 469 482 469 483 10 20 43 14.9Belgium 513 519 509 508 12 38 42 28.2Austria 506 510 501 499 8 31 41 31.3Brazil 368 389 378 400 4 9 40 26.5Peru 349 365 370 373 5 33 40 19.3Poland 509 519 524 517 12 26 40 14.9Canada 525 515 510 516 15 28 40 16.4Luxembourg 488 495 486 483 10 27 40 17.6Ireland 501 505 478 509 16 28 40 12.2Qatar 363 371 380 382 2 38 40 19.3Chile 411 421 419 430 10 24 39 22.7Czech Republic 499 505 499 488 -4 26 39 13.6Thailand 414 419 432 433 12 30 39 25.9Serbia 442 456 446 448 -3 17 38 18.7Uruguay 401 411 413 407 -8 20 38 15.5
countries/economies where performance in the mathematics subscale is above the oecd averagecountries/economies where performance in the mathematics subscale is not statistically different from the oecd averagecountries/economies where performance in the mathematics subscale is below the oecd average
Table 0.6 [Part 1/2] snapshOT OF ThE RElaTiOnship bETWEEn OppORTuniTy
TO lEaRn anD maThEmaTiCs pERFORmanCE
notes: the index of exposure to applied mathematics measures student-reported experience with applied mathematics tasks at school, such as working out from a train timetable how long it would take to get from one place to another.the index of exposure to pure mathematics measures student-reported experience with mathematics tasks at school requiring knowledge of algebra (linear and quadratic equations).the index of familiarity with mathematics is based on students’ responses to 13 items measuring students’ self-reported familiarity with mathematics concepts (such as exponential function, divisor, quadratic function, etc.). macao-china and hong-kong china are the only two economies where disadvantaged students report a higher familiarity with mathematics than advantaged students. in these two economies, eliminating the difference in familiarity between advantaged and disadvantaged students would increase the performance gap of disadvantaged students. this explains why the graph reports negative percentages for these two economies.statistically significant values are indicated in bold.Countries/economies are ranked in descending order of the score-point difference in mathematics performance associated with a one-unit increase in familiarity with mathematics.Source: oecd, Pisa 2012 database, tables 3.2a, 3.7 and 3.16. 1 2 http://dx.doi.org/10.1787/888933377691

equations and inequalities: making mathematics accessible to all © OECD 2016 27
ExECuTivE summaRy
Performance in mathematics, by content area
Score-point difference in mathematics performance associated with a one-unit
increase in the index of:
Percentage of the difference
in mathematics performance between
socio-economically disadvantaged and
advantaged students associated with
different levels of familiarity with mathematics
Change and relationships Quantity
Space and shape
Uncertainty and data
Exposure to applied
mathematics
Exposure to pure
mathematics
Familiarity with
mathematics
mean score mean score mean score mean score
score-point change
score-point change
score-point change %
OECD average 493 495 490 493 9 30 41 18.8
Turkey 448 442 443 447 -4 29 38 19.6Lithuania 479 483 472 474 8 33 36 9.7Japan 542 518 558 528 24 34 36 13.2Indonesia 364 362 383 384 6 13 36 14.9United Arab Emirates
442 431 425 432 10 36 36 12.9
Bulgaria 434 443 442 432 -3 28 35 13.7Shanghai-China 624 591 649 592 -5 2 35 11.0Iceland 487 496 489 496 12 31 34 18.6Spain 482 491 477 487 -4 24 34 23.1Finland 520 527 507 519 24 31 34 11.3Colombia 357 375 369 388 7 15 34 19.8Israel 462 480 449 465 -4 29 32 7.4Russian Federation
491 478 496 463 4 29 32 14.4
Montenegro 399 409 412 415 5 24 30 15.8Greece 446 455 436 460 -10 25 29 9.4Viet Nam 509 509 507 519 -2 25 29 7.9Latvia 496 487 497 478 7 29 28 8.7Estonia 530 525 513 510 7 16 28 5.1Malaysia 401 409 434 422 16 40 27 3.6Denmark 494 502 497 505 2 7 26 7.1Mexico 405 414 413 413 5 21 26 7.0Jordan 387 367 385 394 8 28 24 15.8Cyprus1 440 439 436 442 8 32 24 2.1Macao-China 542 531 558 525 -3 17 23 -21.0Costa Rica 402 406 397 414 -3 16 23 7.6Romania 446 443 447 437 4 21 23 11.1Argentina 379 391 385 389 2 17 21 8.2Kazakhstan 433 428 450 414 -2 19 20 7.9Hong Kong-China 564 566 567 553 5 38 18 -6.0Tunisia 379 378 382 399 1 26 16 3.1Albania 388 386 418 386 -1 -3 -2 mNorway 478 492 480 497 15 30 m m
countries/economies where performance in the mathematics subscale is above the oecd averagecountries/economies where performance in the mathematics subscale is not statistically different from the oecd averagecountries/economies where performance in the mathematics subscale is below the oecd average
Table 0.6 [Part 2/2] snapshOT OF ThE RElaTiOnship bETWEEn OppORTuniTy
TO lEaRn anD maThEmaTiCs pERFORmanCE
1. see note 1 under snapshot table 0.1 [Part 2/2].notes: the index of exposure to applied mathematics measures student-reported experience with applied mathematics tasks at school, such as working out from a train timetable how long it would take to get from one place to another.the index of exposure to pure mathematics measures student-reported experience with mathematics tasks at school requiring knowledge of algebra (linear and quadratic equations).the index of familiarity with mathematics is based on students’ responses to 13 items measuring students’ self-reported familiarity with mathematics concepts (such as exponential function, divisor, quadratic function, etc.). macao-china and hong-kong china are the only two economies where disadvantaged students report a higher familiarity with mathematics than advantaged students. in these two economies, eliminating the difference in familiarity between advantaged and disadvantaged students would increase the performance gap of disadvantaged students. this explains why the graph reports negative percentages for these two economies.statistically significant values are indicated in bold.Countries/economies are ranked in descending order of the score-point difference in mathematics performance associated with a one-unit increase in familiarity with mathematics.Source: oecd, Pisa 2012 database, tables 3.2a, 3.7 and 3.16. 1 2 http://dx.doi.org/10.1787/888933377691

© OECD 2016 equations and inequalities: making mathematics accessible to all28
ExECuTivE summaRy
Percentage of students
who agreed or strongly agreed
with the statement “i do
mathematics because i enjoy it”
Percentage of students
who disagreed or strongly
disagreed with the statement
“i am just not good at
mathematics”
Percentage of students who
agreed or strongly agreed with the
statement “i often worry that it will
be difficult for me in mathematics
classes”
change in the index of mathematics self-concept/anxiety associated with a one-unit increase in the index of familiarity
with mathematicsmathematics self-concept mathematics anxiety
Before accounting for performance in
mathematics
After accounting for performance
in mathematics
Before accounting for performance in mathematics
After accounting for performance in mathematics
% % % index change index change index change index change oEcd average 38.1 57.3 59.5 0.10 -0.10 -0.12 0.07
Albania 70.3 39.4 66.8 0.11 0.11 -0.26 -0.26Korea 30.7 42.6 76.9 0.29 0.04 -0.14 -0.04Serbia 26.8 52.1 62.6 0.19 0.03 -0.24 -0.09Jordan 64.9 48.9 77.5 0.13 0.03 -0.09 -0.05Singapore 72.2 62.3 60.7 0.17 0.03 -0.22 -0.06Chinese Taipei 40.3 39.9 71.5 0.25 0.02 -0.12 0.03Turkey 52.7 47.6 66.7 0.12 0.01 -0.18 -0.04United Arab Emirates 63.9 62.7 68.1 0.11 0.01 -0.21 -0.05Viet Nam 67.4 75.5 72.1 0.07 0.00 -0.08 -0.01Hong Kong-China 54.9 50.1 68.9 0.06 0.00 -0.10 -0.05Peru 62.7 51.2 72.9 0.09 0.00 -0.12 -0.03Israel 39.8 73.5 66.6 0.08 0.00 -0.07 0.02Malaysia 73.4 48.3 76.6 0.05 -0.01 -0.08 -0.01Romania 57.8 48.9 76.8 0.03 -0.02 -0.14 -0.07Russian Federation 42.9 57.7 57.8 0.09 -0.02 -0.11 0.01Colombia 51.3 56.5 64.4 0.09 -0.03 -0.14 -0.01Montenegro 34.0 51.8 65.0 0.10 -0.03 -0.13 0.01Spain 37.0 50.5 68.0 0.14 -0.03 -0.08 0.04Italy 45.8 52.8 73.2 0.16 -0.03 -0.10 0.06Mexico 52.8 47.0 77.5 0.07 -0.04 -0.07 0.03Iceland 47.7 63.8 45.2 0.18 -0.04 -0.24 -0.04Cyprus1 47.1 59.1 68.0 0.08 -0.04 -0.11 0.01Shanghai-China 49.3 53.1 53.4 0.06 -0.04 -0.11 0.00Bulgaria 39.2 43.7 70.2 0.04 -0.04 -0.15 0.01Tunisia 58.0 45.2 79.4 0.02 -0.05 0.01 0.05Costa Rica 47.5 55.8 72.4 0.07 -0.05 -0.05 0.05Macao-China 42.3 51.6 70.4 0.04 -0.05 -0.08 0.01Portugal 45.5 51.5 69.7 0.17 -0.05 -0.11 0.04Brazil 56.4 44.0 71.4 0.05 -0.06 -0.14 0.01Greece 51.7 56.5 72.7 0.07 -0.06 -0.10 0.03Thailand 70.6 24.2 73.0 -0.03 -0.07 -0.04 0.01Kazakhstan 72.6 63.0 55.2 -0.02 -0.07 -0.05 0.01
Table 0.7 [Part 1/2] snapshOT OF ThE RElaTiOnship bETWEEn OppORTuniTy
TO lEaRn anD sTuDEnTs’ aTTiTuDEs TOWaRDs maThEmaTiCs
countries/economies where the percentage of students with positive attitudes towards mathematics is above the oecd average
countries/economies where the percentage of students with positive attitudes towards mathematics is not statistically different from the oecd average
countries/economies where the percentage of students with positive attitudes towards mathematics is below the oecd average
1. see note 1 under snapshot table 0.1 [Part 2/2].notes: the index of familiarity with mathematics is based on students’ responses to 13 items measuring students’ self-reported familiarity with mathematics concepts (such as exponential functions, divisor, quadratic function, etc.).the index of mathematics self-concept is based on the degree to which students agreed with the statements: “i’m just not good in mathematics”; “i get good grades in mathematics”; “i learn mathematics quickly”; “i have always believed that mathematics is one of my best subjects”; and “in my mathematics class, i understand even the most difficult work”.the index of mathematics anxiety is based on the degree to which students agreed with the statements: “i often worry that it will be difficult for me in mathematics classes”; “i get very tense when i have to do mathematics homework”; “i get very nervous doing mathematics problems”; “i feel helpless when doing a mathematics problem”; and “i worry that i will get poor marks in mathematics”.the oecd average of the percentage of students who agreed or strongly agreed with the statement “i do mathematics because i enjoy it” is based on all oecd countries. the corresponding oecd average reported in table 4.1 is based on the oecd countries that participated in both Pisa 2003 and Pisa 2012.statistically significant values are indicated in bold.Countries/economies are ranked in descending order of the change in mathematics self-concept associated with a one-unit increase in familiarity with mathematics after accounting for performance in mathematics.Source: oecd, Pisa 2012 database, tables 4.1, 4.2, 4.3, 4.6 and 4.9. 1 2 http://dx.doi.org/10.1787/888933377700

equations and inequalities: making mathematics accessible to all © OECD 2016 29
ExECuTivE summaRy
Percentage of students
who agreed or strongly agreed
with the statement “i do
mathematics because i enjoy it”
Percentage of students
who disagreed or strongly
disagreed with the statement
“i am just not good at
mathematics”
Percentage of students who
agreed or strongly agreed with the
statement “i often worry that it will
be difficult for me in mathematics
classes”
change in the index of mathematics self-concept/anxiety associated with a one-unit increase in the index of familiarity
with mathematicsmathematics self-concept mathematics anxiety
Before accounting for performance in
mathematics
After accounting for performance
in mathematics
Before accounting for performance in mathematics
After accounting for performance in mathematics
% % % index change index change index change index change oEcd average 38.1 57.3 59.5 0.10 -0.10 -0.12 0.07
Hungary 27.5 53.7 62.0 0.12 -0.08 -0.20 0.03Slovenia 27.1 54.7 61.3 0.14 -0.08 -0.13 0.03Qatar 60.6 53.2 68.6 0.02 -0.08 -0.15 0.00Latvia 38.6 59.1 57.1 0.06 -0.08 -0.13 -0.02Indonesia 78.3 39.0 76.7 -0.08 -0.08 -0.05 0.01Japan 30.8 45.9 70.4 0.02 -0.09 -0.02 0.07Ireland 37.0 60.1 69.8 0.11 -0.09 -0.14 0.06Australia 39.0 63.4 59.7 0.19 -0.11 -0.18 0.08Canada 36.6 63.4 59.6 0.15 -0.11 -0.17 0.06Croatia 20.9 55.1 66.4 0.12 -0.11 -0.14 0.09United States 36.6 66.7 57.3 0.12 -0.11 -0.16 0.08Poland 36.1 46.3 57.4 0.19 -0.11 -0.22 0.08Finland 28.8 58.6 51.7 0.14 -0.12 -0.11 0.07Chile 42.3 40.1 72.3 0.10 -0.12 -0.09 0.04Estonia 38.1 50.5 53.8 0.07 -0.12 -0.18 0.01France 41.5 57.7 64.5 0.14 -0.12 -0.06 0.12Netherlands 32.4 62.6 36.9 0.01 -0.12 -0.05 0.08Belgium 28.8 61.3 58.2 0.04 -0.12 -0.02 0.14New Zealand 38.2 59.0 62.1 0.11 -0.12 -0.16 0.09United Kingdom 40.8 67.5 47.3 0.12 -0.13 -0.14 0.09Denmark 56.9 71.0 38.6 0.09 -0.13 -0.14 0.07Slovak Republic 27.9 46.8 57.6 0.05 -0.13 -0.10 0.11Uruguay 50.6 47.2 76.7 0.06 -0.13 -0.12 0.07Czech Republic 30.3 57.6 55.3 0.10 -0.13 -0.08 0.12Sweden 37.0 64.9 42.3 0.09 -0.13 -0.11 0.09Argentina 37.9 37.8 80.0 -0.06 -0.14 -0.08 0.00Lithuania 47.6 53.4 57.4 0.07 -0.14 -0.17 0.01Luxembourg 35.3 61.3 55.9 0.00 -0.15 -0.09 0.09Switzerland 48.5 65.8 49.2 0.05 -0.16 -0.09 0.13Germany 39.0 64.9 53.2 0.04 -0.24 -0.11 0.17Austria 23.8 63.1 55.4 -0.01 -0.25 -0.02 0.22Liechtenstein 56.2 65.6 49.8 -0.10 -0.32 0.02 0.25Norway 32.2 57.0 53.5 m m m m
Table 0.7 [Part 2/2] snapshOT OF ThE RElaTiOnship bETWEEn OppORTuniTy
TO lEaRn anD sTuDEnTs’ aTTiTuDEs TOWaRDs maThEmaTiCs
countries/economies where the percentage of students with positive attitudes towards mathematics is above the oecd average
countries/economies where the percentage of students with positive attitudes towards mathematics is not statistically different from the oecd average
countries/economies where the percentage of students with positive attitudes towards mathematics is below the oecd average
notes: the index of familiarity with mathematics is based on students’ responses to 13 items measuring students’ self-reported familiarity with mathematics concepts (such as exponential functions, divisor, quadratic function, etc.).the index of mathematics self-concept is based on the degree to which students agreed with the statements: “i’m just not good in mathematics”; “i get good grades in mathematics”; “i learn mathematics quickly”; “i have always believed that mathematics is one of my best subjects”; and “in my mathematics class, i understand even the most difficult work”.the index of mathematics anxiety is based on the degree to which students agreed with the statements: “i often worry that it will be difficult for me in mathematics classes”; “i get very tense when i have to do mathematics homework”; “i get very nervous doing mathematics problems”; “i feel helpless when doing a mathematics problem”; and “i worry that i will get poor marks in mathematics”.the oecd average of the percentage of students who agreed or strongly agreed with the statement “i do mathematics because i enjoy it” is based on all oecd countries. the corresponding oecd average reported in table 4.1 is based on the oecd countries that participated in both Pisa 2003 and Pisa 2012.statistically significant values are indicated in bold.Countries/economies are ranked in descending order of the change in mathematics self-concept associated with a one-unit increase in familiarity with mathematics after accounting for performance in mathematics.Source: oecd, Pisa 2012 database, tables 4.1, 4.2, 4.3, 4.6 and 4.9. 1 2 http://dx.doi.org/10.1787/888933377700


equations and inequalities: making mathematics accessible to all © OECD 2016 31
reader’s Guide
Data underlying the figuresthe data tables are listed in annex a and available on line at www.oecd.org/pisa.
Four symbols are used to denote missing data:
a the category does not apply in the country concerned. data are therefore missing.
c there are too few observations or no observation to provide reliable estimates (i.e. there are fewer than 30 students or less than five schools with valid data).
m data are not available. these data were not submitted by the country or were collected but subsequently removed from the publication for technical reasons.
w data have been withdrawn or have not been collected at the request of the country concerned.
Country coveragethis publication features data on 64 countries and economies: 34 oecd countries (indicated in black in the figures) and 30 partner countries and economies (indicated in blue in the figures).
Calculating international averagesan oecd average was calculated for most indicators presented in this report. in most tables, the oecd average corresponds to the arithmetic mean of the respective country estimates. in cases where the oecd average is computed so as to be consistent across different categories within a table, this is indicated in a note at the bottom of the table.
Rounding figuresbecause of rounding, some figures in tables may not exactly add up to the totals. totals, differences and averages are always calculated on the basis of exact numbers and are rounded only after calculation. all standard errors in this publication have been rounded to one or two decimal places (i.e. the value 0.00 does not imply that the standard error is zero, but that it is smaller than 0.005).
Bolding of estimatesthis report discusses only statistically significant differences or changes (statistical significance at the 5% level). these are denoted in darker colours in figures and in bold in tables.

© OECD 2016 equations and inequalities: making mathematics accessible to all32
REaDER’s GuiDE
Reporting student datathe report uses “15-year-olds” as shorthand for the Pisa target population. Pisa covers students who are aged between 15 years 3 months and 16 years 2 months at the time of assessment and who have completed at least 6 years of formal schooling, regardless of: the type of institution in which they are enrolled; whether they are in full-time or part-time education; whether they attend academic or vocational programmes; and whether they attend public, private or foreign schools within the country.
Reporting school datathe principals of the schools in which students were assessed provided information on their schools’ characteristics by completing a school questionnaire. Where responses from school principals are presented in this publication, they are weighted so that they are proportionate to the number of 15-year-olds enrolled in the school.
Indices used in this reportsome analyses in this report are based on synthetic indices. indices from student and school questionnaires summarise information from several related questionnaire responses into a single global measure. the construction of the following indices is detailed in the PISA 2012 Technical Report (oecd, 2014):
Index of exposure to applied mathematics
Index of exposure to pure mathematics
Index of familiarity with mathematics
Index of instrumental motivation
Index of intrinsic motivation
Index of mathematics anxiety
Index of mathematics self-concept
Index of disciplinary climate
PISA index of economic, social and cultural status (ESCS)
Categorising student performancethis report uses a shorthand to describe students’ levels of proficiency in the subjects assessed by Pisa:
top performers are those students proficient at Level 5 or 6 of the assessment.
low performers are those students proficient at or below Level 1 of the assessment.
highest achievers are those students who perform at or above the 90th percentile in their own country/economy.
lowest achievers are those students who perform below the 10th percentile in their own country/economy.

equations and inequalities: making mathematics accessible to all © OECD 2016 33
REaDER’s GuiDE
Categorising students and schools according to their socio-economic profileSocio-economically advantaged students are those students whose value of the PISA index of economic, social and cultural status (escs) is at or above the 75th percentile in their own country/economy.
Socio-economically disadvantaged students are those students whose value of the PISA index of economic, social and cultural status (escs) is below the 25th percentile in their own country/economy.
Socio-economically advantaged schools are those schools whose average value of the PISA index of economic, social and cultural status (escs) is significantly higher than the average in their own country/economy.
Socio-economically disadvantaged schools are those schools whose average value of the PISA index of economic, social and cultural status (escs) is significantly lower than the average in their own country/economy.
Categorising students and schools according to their familiarity with mathematics
Students who are more familiar with mathematics are those students whose value of the index of familiarity with mathematics is at or above the 75th percentile in their own country/economy.
Students who are less familiar with mathematics are those students whose value of the index of familiarity with mathematics is below the 25th percentile in their own country/economy.
Schools where students are more familiar with mathematics are those schools whose average value of the index of familiarity with mathematics is significantly higher than the average in their own country/economy.
Schools where students are less familiar with mathematics are those schools whose average value of the index of familiarity with mathematics is significantly lower than the average in their own country/economy.
Abbreviations used in this report
% dif. Percentage-point difference s.e. standard error
dif. difference otl opportunity to learn
escs Pisa index of economic, social and cultural status
isced international standard classification of education

© OECD 2016 equations and inequalities: making mathematics accessible to all34
REaDER’s GuiDE
Further documentationFor further information on the Pisa assessment instruments and the methods used in Pisa, see the PISA 2012 Technical Report (oecd, 2014).
StatLinksthis report uses the oecd statlinks service. below each table and chart is a url leading to a corresponding exceltm workbook containing the underlying data. these urls are stable and will remain unchanged over time. in addition, readers of the e-books will be able to click directly on these links and the workbook will open in a separate window, if their internet browser is open and running.
Note regarding Israelthe statistical data for israel are supplied by and under the responsibility of the relevant israeli authorities. the use of such data by the oecd is without prejudice to the status of the golan heights, east Jerusalem and israeli settlements in the West bank under the terms of international law.
ReferenceOECD (2014), PISA 2012 Technical Report, Pisa, oecd, Paris, www.oecd.org/pisa/pisaproducts/Pisa-2012-technical-report-final.pdf.

1
equations and inequalities: making mathematics accessible to all © OECD 2016 35
1
35
This chapter discusses the importance of mathematics knowledge for acquiring numeracy skills and developing problem-solving abilities. It presents the concept of “opportunity to learn” and argues that measuring opportunity to learn is of critical importance for international comparisons of curricula and student performance. An overview of the data on opportunity to learn in PISA 2012 shows that education systems differ greatly in the degree to which students are exposed to mathematics concepts and also in the way mathematics problems are formulated and presented to students.
Why Access to Mathematics Matters and How it Can
be Measured
the statistical data for israel are supplied by and under the responsibility of the relevant israeli authorities. the use of such data by the oecd is without prejudice to the status of the golan heights, east Jerusalem and israeli settlements in the West bank under the terms of international law.

© OECD 2016 equations and inequalities: making mathematics accessible to all36
1Why access to mathematics matters and hoW it can be measured
The teacher of mathematics has a great opportunity. If he fills his allotted time with drilling his students with routine operations he kills their interest, hampers their intellectual development, and misuses his opportunity. But if he challenges the curiosity of his students by setting them problems proportionate to their knowledge, and helps them to solve their problems with stimulating questions, he may give them a taste for, and some means of, independent thinking (Polya, 1973).
countries repeatedly reform their mathematics curricula to make sure they are relevant to students and societies (cai and ni, 2011; usiskin and Willmore, 2008). over time, reforms have been based on various factors, including on two observations: both national and international assessments proved that too many students were completing compulsory schooling without being able to use basic mathematics; and the evidence often showed that disadvantaged students were relegated to mathematics courses that were poorer in content and quality – a violation of the principle that all students should be exposed to high-quality instruction.
What the data tell us
numeracy skills are used daily in many jobs and are important for a wide range of outcomes in adult life, from successful employment to good health and civic participation.
in 2012, the average 15-year-old student in an oecd country spent 3 hours and 32 minutes per week in regular mathematics lessons at school; 13 minutes more per week than the average student did in 2003.
on average across oecd countries, less than 30% of students reported to know well the concept of arithmetic mean; less than 50% of students reported to know well the concepts of polygon and divisor.
there are large international differences in students’ average familiarity with algebraic and geometric concepts. students in macao-china reported the most familiarity with algebraic concepts, while students in shanghai-china had the most familiarity with geometric concepts.
there is only a weak correlation between students’ exposure to applied mathematics and to pure mathematics at the system level, suggesting that the two methods of instruction rarely complement each other.
international data on students’ classroom experiences with mathematics are illuminating because they show that policy makers and experts in charge of reform tend to think about mathematics differently than students do (schoenfeld, 1983; brown et al., 2008). For the skilled mathematician, solving a mathematics problem is an exciting process of discovery and mental training; for many students towards the end of compulsory education, mathematics is a well-defined set of facts that must be rehearsed until it is learned (echazarra et al., 2016).
notwithstanding the good intentions of mathematics teachers, weaker students who are underexposed to the practice of mathematics problem-solving – in many cases, these are students from disadvantaged families – never get an opportunity to develop a “taste for, and some means

equations and inequalities: making mathematics accessible to all © OECD 2016 37
1Why access to mathematics matters and hoW it can be measured
of, independent thinking” (Polya, 1973). given the importance of mathematics reasoning for life, mathematics curricula need to be enriching and challenging also for those students who do not plan to continue their formal education after compulsory schooling and for those who have fallen behind, in knowledge and self-confidence, since primary school.
achieving equitable opportunities to learn involves not only the content and flexibility of the curriculum, but also how students from different socio-economic backgrounds progress through the system, how well learning materials match students’ skills, and how teachers understand and manage the learning needs of diverse students. no matter how detailed and flexible the curriculum might be, mathematics teachers need to make difficult trade-offs to design mathematics lessons that are both accessible to weak students and challenging to bright ones.
this report uses data from Pisa 2012 to describe students’ opportunity to learn mathematics, including mathematics instruction time and the mathematics content to which students are exposed. it illustrates how students’, schools’ and systems’ characteristics interact in affecting students’ capacity to use the mathematics knowledge they acquire at school to solve real-world problems. Figure 1.1 shows the analytical framework of the report. this chapter introduces the concept of opportunity to learn, describes the metrics on content coverage and exposure developed for Pisa 2012, and discusses how these metrics capture international differences in mathematics curricula. the second chapter takes one step back to examine student-, school- and system-level variables that can explain how these differences arise. the third chapter looks at how time spent on pure and applied mathematics tasks affects student performance in Pisa, while the fourth chapter focuses on the relationship between content exposure and students’ attitudes towards mathematics, such as mathematics self-concept and anxiety, which are closely related to mathematics performance. the fifth chapter discusses the policy implications of the preceding analyses.
What these results mean for policy
all students need mathematics for their adult life. Reducing socio-economic inequalities in access to mathematics content is thus an important policy lever for increasing social mobility.
in many countries, the small share of students who reported that they know well and understand basic concepts signals the need to increase the effectiveness of mathematics teaching by focusing on key mathematics ideas and making more connections across topics.
the large differences between the intended, the implemented and the achieved curriculum suggest the importance of regularly collecting data on students’ exposure to mathematics content.
international comparisons of curriculum standards, frameworks and teaching material can help countries to design reforms that increase the coherence of the mathematics curriculum.

© OECD 2016 equations and inequalities: making mathematics accessible to all38
1Why access to mathematics matters and hoW it can be measured
Students’ background(socio-economic status,gender, migration status)
Schools’ background(socio-economic profile)
School/system policies andpractices (curriculum focus,
horizontal and verticalstratification...)
Conditioning Factors Exposure to Mathematics
Exposure to mathematicstasks
Familiarity withmathematics concepts
Learning time inmathematics
Outcomes
Mathematicsperformance
Attitudes towardsmathematics
Chapter 1
Chapter 5
Chapter 2Chapter 3
Chapter 4
Policy Implications
Figure 1.1 The analytical framework
the importance of mathematics skills in everyday life
mathematics teachers are accustomed to answering questions about the usefulness of what they teach. not only students, but also parents and policy makers often worry about a mismatch between what is taught at school and the quantitative skills needed in everyday life. While it might be difficult to explain why students spend so much time learning algebra and geometry, mathematics is a core part of the curriculum for virtually every secondary student in the world. is this justified? should all students learn a significant amount of mathematics beyond what is needed to make simple calculations?
one of the rationales used to explain the central role of mathematics in global education curricula is the idea, dating back to Plato, that mathematics education enhances higher-order thinking skills. those who are good at mathematics tend to be good thinkers, and those who are trained in mathematics learn to be good thinkers. according to this view, mathematics should be taught for its own sake, rather than to serve more concrete and practical aims.
beyond the effects of mathematics training on some abstract mental faculties, there is a more intuitive and practical benefit from mastering mathematics at a reasonably good level: mathematics is a gatekeeper. the mathematics studied at school is the main entry point to quantitative literacy, and without solid quantitative skills a person cannot do many jobs. exam scores in mathematics are, in fact, important factors in determining acceptance into higher education programmes leading to scientific and professional careers.

equations and inequalities: making mathematics accessible to all © OECD 2016 39
1Why access to mathematics matters and hoW it can be measured
the demand for stem (science, technology, engineering and mathematics) professionals has been continuously rising over recent years. For example, employment of stem professionals across the european union was approximately 12% higher in 2013 than it was in 2000, notwithstanding the effects of the economic crisis (european Parliament, 2015). moreover, organisations compete for talent, and many of them now use rigorous quantitative assessments that test both verbal and mathematical ability when selecting employees (schmitt, 2013).
the value of having quantitative skills has risen over recent years. our societies are “drenched with data” (steen, 2001), and the level of number skills needed to carry on daily life activities has increased. understanding concepts such as “exponential growth” or “line of best fit”, assessing the rate at which a variable is changing or knowing what to expect from the flip of a coin have become important for making informed judgements and choices. computers have reduced the need for mechanical calculations, but the importance of understanding numbers has become even greater in the digital age. in fact, the more people can do with information technology in mathematics, the greater the need for their understanding of and their ability to critically analyse what they are doing (oecd, 2015).
data from the survey of adult skills, a product of the oecd Programme for the international assessment of adult competencies (Piaac), provide some tools for assessing the value of quantitative skills at work and in everyday life (box 1.1). the survey assesses numeracy skills, defined as “the ability to access, use, interpret, and communicate mathematical information and ideas, in order to engage in and manage the mathematical demands of a range of situations in adult life” (oecd, 2013a). numeracy thus refers not just to the ability to perform basic calculations, but to a wide range of skills, such as being able to measure, use and interpret statistical information; understand and use shape, design, location and direction; and think critically about quantitative and mathematical information (gal and tout, 2014). the survey measures numeracy from adults’ answers to a set of carefully designed and contextualised problems.
box 1.1. the survey of adult skills (piaac)
the survey of adult skills is an international survey conducted as part of the Programme for the international assessment of adult competencies (Piaac). it measures the key cognitive and workplace skills needed for individuals to participate in society and for economies to prosper. the survey is conducted among adults aged 16 to 65. it assesses their literacy and numeracy skills, as well as their ability to solve problems in technology-rich environments, and collects a broad range of information, including how skills are used at work, at home and in the community.
the first round was conducted in 2011-2012 in 24 countries and subnational regions. Results of the second round, released in June 2016, include 9 additional countries.
Source:http://www.oecd.org/site/piaac/

© OECD 2016 equations and inequalities: making mathematics accessible to all40
1Why access to mathematics matters and hoW it can be measured
Figure 1.2 shows the extent to which various numeracy skills are used at work, as assessed in the survey of adult skills. on average across participating oecd countries, 38% of workers aged 16 to 65 use or calculate fractions, decimals or percentages, 29% use simple algebra or formulas, and 4% use advanced mathematics at work at least once a week. more than one in three workers in estonia, germany, norway and Poland use algebra at work weekly or daily, as do more than one in two workers in the czech Republic and Finland. the use of mathematics at work is not limited to the top-paying occupations. on average across oecd countries, 36% of workers in the highest earnings quartile use algebra at work, compared to 18% of workers in the bottom earnings quartile (table 1.1b).
0
10
20
30
40
50
60
70
80%
Use simple algebra or formulaeUse or calculate fractions or percentages
Use advanced mathematics or statistics
Note: The OECD countries included in the analysis are: Australia, Austria, Flanders (Belgium), Canada, the Czech Republic, Denmark, Estonia, Finland, France, Germany, Ireland, Italy, Japan, Korea, the Netherlands, Norway, Poland, the Slovak Republic, Spain, Sweden, England/Northern Ireland (UK) and the United States.Countries and economies are ranked in ascending order of the percentage of workers who reported that they use or calculate fractions or percentages at work.Source: OECD, Survey of Adult Skills (PIAAC) (2012), Table 1.1a.
Numeracy skills used at workPercentage of workers who reported that they use these numerical skills
at work at least once a week
Figure 1.2
Jap
an
No
rway
Ital
y
Flan
der
s (B
elgi
um)
Ko
rea
Slo
vak
Rep
ublic
Fran
ce
Den
mar
k
Esto
nia
Net
herl
and
s
Aus
tria
Spai
n
Swed
en
Ger
man
y
OEC
D a
vera
ge
Cze
ch R
epub
lic
Irel
and
Pola
nd
Engl
and
/No
rthe
rn Ir
elan
d (U
K)
Finl
and
Aus
tral
ia
Can
ada
Uni
ted
Sta
tes
12 http://dx.doi.org/10.1787/888933376861

equations and inequalities: making mathematics accessible to all © OECD 2016 41
1Why access to mathematics matters and hoW it can be measured
important decisions in one’s personal life, on the job, and in matters of public interest call for sophisticated quantitative reasoning (schoenfeld, 2002). For example, perceptions about the levels of health risks are less accurate among individuals with low numeracy (carman and kooreman, 2014), and low numeracy constrains informed patient choice, reduces medication compliance and limits access to treatments (nelson et al., 2008). data from the survey of adult skills show that higher numeracy skills are strongly correlated with other outcomes, such as participation in the labour market, income, good health, participation in volunteer activities, feeling that one has an influence on political life, and the level of trust in others (Figure 1.3). adults performing 50 points higher than the mean on the survey’s numeracy scale are 27% more likely to have a job and 55% more likely to earn high wages than adults performing at the mean. a numeracy score 50 points above the mean raises the odds of being employed to the same level as completing two additional years of education would do.
Years of education Numeracy
1.00 1.20 1.40 1.60 1.80 2.00 2.20 2.40 2.60Odds ratio
Trusts others
Thinks he/she can influence the political system
Participates in voluntary activities
Is in good general health
Is in the top quarter of earnings
Has a job
Relationship between years of education and numeracy,and economic and social outcomes
Increase in the likelihood of the outcome related to an increase of one standarddeviation in years of education or in numeracy; OECD average (22 countries)
How to read the chart: An odds ratio of 1.27 corresponding to the outcome “has a job” and “numeracy” means that an individual who scored one standard deviation higher than another on the Survey of Adult Skills (PIAAC) numeracy scale is 27% more likely to be employed. Notes: “Years of education” has an average standard deviation of 3.7 years; “numeracy” has an average standard deviation of 51 points.The OECD countries included in the analyses are: Australia, Austria, Flanders (Belgium), Canada, the Czech Republic, Denmark, Estonia, Finland, France, Germany, Ireland, Italy, Japan, Korea, the Netherlands, Norway, Poland, the Slovak Republic, Spain, Sweden, England/Northern Ireland (UK), and the United States.Source: OECD, Survey of Adult Skills (PIAAC) (2012), Table 1.2.
Figure 1.3
12 http://dx.doi.org/10.1787/888933376878

© OECD 2016 equations and inequalities: making mathematics accessible to all42
1Why access to mathematics matters and hoW it can be measured
these results from the survey of adult skills show relationships, and cannot be interpreted as the causal effect of mathematics instruction on life outcome. however, the findings are consistent with a large literature showing that attending more advanced mathematics courses has an impact on labour market outcomes (Joensen and nielsen, 2009; levine and Zimmerman, 1995). in a study on students’ earnings a decade after graduation in the united states, Rose and betts (2004) find that the math curriculum is responsible for around 27% of the earnings gap experienced by students from lowest-income families relative to middle-income families.
the relationship betWeen mathematics knoWledge and mathematical literacy
many argue that the traditional mathematics curriculum fails students because it emphasises a type of mathematics that is radically different from the one used at the workplace (steen, 2001). Problem solving at work is characterised by pragmatic approaches and techniques that are quick and efficient for specific types of tasks, while the formal mathematics taught at school strives for consistency and generality (hoyles et al., 2010). this argument has gained popularity because it is not easy to define which mathematics content in the curriculum is most likely to help develop numeracy. Workplace mathematics is also a moving target: changes in society, in technology and in the practice of mathematics also shift the priorities among the many mathematics topics that can be useful for solving problems at work.
are the differences between school mathematics and the numeracy skills used in life really so large? a look at the Pisa performance of students with different levels of exposure to mathematics at school can help to answer this question. Pisa assesses the mathematical literacy of students. mathematical literacy is closely related to the concept of numeracy used in the survey of adult skills,1 even if it has a stronger connection with the mathematics knowledge acquired at school.
the mathematics framework of Pisa defines mathematical literacy as:
“an individual’s capacity to formulate, employ, and interpret mathematics in a variety of contexts. It includes reasoning mathematically and using mathematical concepts, procedures, facts, and tools to describe, explain, and predict phenomena. It assists individuals to recognise the role that mathematics plays in the world and to make the well-founded judgments and decisions needed by constructive, engaged and reflective citizens” (oecd, 2013b).
the focus of Pisa has been less about what students know after studying a particular curriculum, and more on students’ ability to use what they have learned at school to address authentic, real-life challenges and problems (oecd, 2013b; cogan and schmidt, 2015). in the description of what students should know and be able to do at different levels of achievement, the Pisa mathematics framework refers to “big ideas” (core concepts); it does not specify algebra or geometry or any other specific facet of mathematics. but this does not mean that the structure of the mathematics curriculum, the mastery of concepts and the time spent on mathematics exercises do not matter for developing students’ mathematical literacy.

equations and inequalities: making mathematics accessible to all © OECD 2016 43
1Why access to mathematics matters and hoW it can be measured
mathematical literacy and mathematics knowledge – defined as familiarity with mathematics concepts and procedures – are, in fact, not separate but intertwined. mathematics content areas and concepts have been developed over time as a means to understand and interpret natural and social phenomena (oecd, 2013b). exposure to this codified content helps students to understand the underlying structure of real problems, shaping what they see and how they behave when they encounter new situations related to those they have previously abstracted and codified (Roterham and Willingham, 2010).
Figure 1.4 shows a simplified version of the stages through which students use the mathematics they learn at school to solve real-life problems. in the first stage, the student takes advantage of his or her knowledge of mathematics first to recognise the mathematical nature of a problem and then to formulate the problem in mathematical terms. the downward-pointing arrow in Figure 1.4 depicts the work undertaken as the problem-solver uses mathematical concepts, procedures, facts and tools to obtain the results. this stage typically involves mathematical reasoning, manipulation, transformation and computation. next, the results need to be interpreted in terms of the original problem. these processes of formulating, employing and interpreting mathematics draw on the problem-solver’s knowledge about individual topics and on a range of fundamental mathematics capabilities.
Challenge in real world contextMathematical content categories: Quantity; Uncertainty and data; Change and relationships; Space and shapeReal world context categories: Personal; Societal; Occupational; Scienti�c
Mathematical thought and actionMathematical concepts, knowledge and skillsFundamental mathematical capabilities: Communication; Representation; Devising strategies;Mathematisation; Reasoning and argument; Using symbolic, formal and technical language andoperations; Using mathematical toolsProcesses: Formulate; Employ; Interpret/Evaluate
Problem in contextMathematical
problem
Results in context
Formulate
Eval
uate
Mathematicalresults
Emp
loy
Interpret
Figure 1.4 The PISA model of mathematical literacy

© OECD 2016 equations and inequalities: making mathematics accessible to all44
1Why access to mathematics matters and hoW it can be measured
exposure to mathematics content helps students to navigate through the processes of formulating, employing and interpreting mathematics. however, becoming mathematically literate requires more than just acquiring knowledge and practicing. students have to learn to recognise how mathematics can help them deal with situations, solve problems and make sound judgements. the challenge for schools, beyond selecting which fundamentals to teach, is how to teach these fundamentals in a way that improves students’ problem-solving abilities. teachers not only have to carefully select the content of their lessons, but they also have to tailor the delivery of this content to suit the different capacities of students.
Pisa 2012 included detailed information on the types of mathematics students had the opportunity to learn. in an assessment focusing on mathematics skills for life, this information provides a unique opportunity to better understand the relationship between the mathematics taught in school and that used outside of school.
the concept of opportunity to learn
the opportunity to learn (otl) concept refers to the notion that what a student learns at school is related to the content taught in the classroom and the time a student spends learning this content (cogan and schmidt, 2015; schmidt and maier, 2009). the most quoted definition of otl comes from husen’s report of the 1964 First international mathematics study (Fims): “whether or not students have had the opportunity to study a particular topic or learn how to solve a particular type of problem presented by the test” (husen, 1967, pp. 162-163, cited in burstein, 1993). Research on opportunity to learn started as an afterthought in Fims when analysts became concerned that not all the tested students had the same opportunities to study a particular topic or to learn how to solve a particular type of problem presented in the assessment (Floden, 2002).
carroll’s (1963) model of school learning provides a strong theoretical basis for the analysis of otl. the model expresses key factors of learning, including aptitude and ability, in the metric of time, so that the crucial question is no longer “What can this student learn?” but “How long will it take this student to learn?”. the following relationship describes the elements of the model:
Learning = f
Opportunity to learn or
Time allocated for learninng*
or
Percentage of time actually spent
Perseverance
engaged in learning
or
Time actually neede
Aptitude
dd to learn*
* to underQu of
Ability sstand⎛
⎝
⎜⎜
⎞
⎠
⎟⎟
⎡
⎣
⎢⎢⎢⎢⎢⎢⎢⎢
⎤
⎦
⎥⎥⎥⎥⎥⎥⎥⎥
aptitude, ability and perseverance are student characteristics, while opportunity to learn and the quality of instruction are mainly controlled by teachers within the conditions established by the education system. after carroll, several authoritative reviews of research concluded that time spent on content and the way in which time is organised are primary factors influencing student achievement (carroll, 1989; scheerens and bosker, 1997; marzano, 2003). Within a short period of time, otl had a profound impact on the thinking of researchers and practitioners alike (marzano, 2003).

equations and inequalities: making mathematics accessible to all © OECD 2016 45
1Why access to mathematics matters and hoW it can be measured
the school curriculum defines the intended objectives of the education system in terms of content coverage and time allocated to topics. beyond the intended curriculum, what matters for students’ learning is the implemented curriculum, or the content actually delivered by the teachers. the existence of a single coherent mathematics curriculum delivered by all teachers is nothing more than a myth: discrepancies between the intended and the delivered curriculum exist across all education systems (Floden, 2002; schmidt et al., 1997; schmidt et al., 2001). even when highly structured textbooks are used, teachers make independent choices regarding which topics will be covered and to what extent (doyle, 1992; Valverde et al., 2002). teachers might depart from the intended curriculum because some of their students are not sufficiently prepared to absorb the content of overly ambitious and lengthy textbooks, or because the curriculum itself dissuades teachers from sticking closely to its plans. For example, teachers might omit some material because they know that the students’ future teachers will have to cover the same material again. starting from what is taught in classrooms and how it is taught, the achieved curriculum – what students actually learn – is, in turn, related to students’ ability, aptitude and attitudes towards learning.
students’ opportunity to learn depends on both the intended and the implemented curriculum. students may not be exposed to certain mathematics concepts because these concepts are not included in the curriculum or because teachers may not cover them. data collected as part of the 2011 trends in international mathematics and science study (timss) (mullis et al., 2012) show that a core set of topics is covered in the intended curriculum of most countries. however, large differences across countries exist in the allocation of these topics to different grades, and in the percentage of teachers who actually teach the topic in each grade (table 1.3). the percentage of students who are taught basic topics, like fractions, in grade 8 is relatively low (less than 50% in most participating countries), consistent with the fact that fractions are supposed to be covered in the early grades (in most countries, fractions are not expected to be covered after grade 7). in contrast, linear equations and formulas for perimeters, areas and volumes are expected to be covered in the eighth grade in almost all participating countries. but in hong kong-china, Japan, norway, slovenia, sweden, chinese taipei and ukraine – where linear equations are part of the eighth-grade curriculum – less than 50% of students in grade 8 are taught them. teachers may decide not to cover a certain topic with some students or to cover it in earlier or later grades, especially when the curriculum allows for such flexibility.
standardisation policies – such as using a common curriculum across all classes in a school – can limit the freedom of teachers to define the content of their instruction. Figure 1.5 shows that there are large differences across countries in the level of standardisation of mathematics teaching. around 60% of students in oecd countries are in schools that adopt standardised mathematics policies with shared instructional materials accompanied by staff development and training. these policies are relatively rare in the nordic countries, but relatively common in several asian countries and economies. in all countries and economies but denmark, luxembourg and sweden, the majority of students attends schools where teachers are required to follow a mathematics curriculum that specifies the content to be covered each month.
textbooks are a key link between the intended and the implemented curriculum. textbooks influence which topics are likely to be covered by teachers, in which order and through

© OECD 2016 equations and inequalities: making mathematics accessible to all46
1Why access to mathematics matters and hoW it can be measured
20 30 40 50 60 70 80 90 100 %
DenmarkNorwayUruguaySweden
LithuaniaJapanSpain
ArgentinaSerbia
BelgiumFrance
PeruIceland
NetherlandsChile
ColombiaCosta Rica
LatviaBulgaria
SwitzerlandGermany
ItalyLiechtensteinMacao-China
Chinese TaipeiLuxembourg
TunisiaSlovak Republic
AustriaOECD average
FinlandKorea
SloveniaMexico
HungaryGreece
BrazilRomania
United KingdomTurkey
PortugalJordan
AustraliaCroatiaCanada
New ZealandIreland
IndonesiaPoland
United Arab EmiratesHong Kong-China
ThailandRussian Federation
IsraelEstonia
United StatesMontenegro
Czech RepublicAlbania
SingaporeKazakhstan
MalaysiaViet Nam
Shanghai-ChinaQatar
Standardised mathematics textbooksStandardised mathematics policies Standardised mathematics curriculum
Figure 1.5 Use of standardised practices for curriculum and teaching
Percentage of students in schools that practice standardised policiesfor mathematics teaching, curriculum and textbooks
Note: A standardised policy for mathematics consists of a school curriculum with shared instructional materials accompanied by staff development and training. A standardised curriculum speci�es content that mathematics teachers should follow at least monthly. All measures are reported by the school's principal.Countries and economies are ranked in ascending order of the percentage of students in schools that use standardised mathematics policies.Source: OECD, PISA 2012 Database, Table 1.5. 12 http://dx.doi.org/10.1787/888933376885

equations and inequalities: making mathematics accessible to all © OECD 2016 47
1Why access to mathematics matters and hoW it can be measured
which pedagogical strategies (Freeman and Porter, 1989; grossman and thompson, 2008; Johansson, 2005; Reys et al., 2003; stathopoulou, gana and chaviaris, 2012). adopting a single textbook for all mathematics classes in a school is a common practice in most countries (Figure 1.5), but at the same time teachers have a major role in selecting textbooks. on average across oecd countries, 77% of students attend schools where teachers choose textbooks, while principals and school governing boards are less involved (table 1.4). only in greece, Jordan, luxembourg and malaysia over 80% of students attend schools where the national education authority chooses which textbooks are used in the school.
measuring opportunity to learn in pisa
For international comparisons, measures of otl are relevant in two ways: as a possible factor leading to international differences in achievement, and as indicators of cross-national and within-countries differences in the implemented curriculum. if otl is not taken into account in cross-national comparisons, its effects might be mistakenly attributed to other characteristics of students or education systems (schmidt et al., 2014). a clear international picture of the similarities and differences in the content students are given the opportunity to learn provides each country with a context for considering curriculum reforms and evaluating equity in access to learning opportunities.
there are two main approaches to measuring otl. the first, adopted in early studies, such as the First international mathematics study (Fims), measures students’ exposure to content at the classroom level through a teacher survey. the second, used in Pisa 2012, presents exemplar problems to test-takers, asking them whether they have seen anything similar during their school lessons. both approaches have advantages and shortcomings. teachers’ reports are generally more accurate descriptions of the delivered curriculum. students’ reports can provide more reliable measures of the time students are actually engaged in learning the topic, under the assumption that students can objectively establish the similarity between what they do in class and what they see in the problems presented in the questionnaire.
the student questionnaire in Pisa 2012 included several questions on the degree to which students encounter various types of mathematics problems in their courses, how familiar they are with certain formal mathematics content, and how frequently they are taught to solve specific mathematics tasks. Responses to these questions were used to construct a number of otl measures and indices, as detailed in box 1.2.
based on students’ self-reports, the data show substantial variation across education systems in students’ exposure to mathematics content. these international differences emerge clearly from the simplest measure of otl in Pisa – the time students reported spending in mathematics classes each week. in 2012, the average 15-year-old student in an oecd country spent 3 hours and 32 minutes per week in mathematics lessons (Figure 1.6). however, behind this average lie great variations among school systems. While 15-year-old students in canada spent more than 5 hours per week in mathematics lessons, students in hungary spent 2 hours and 30 minutes per week.

© OECD 2016 equations and inequalities: making mathematics accessible to all48
1Why access to mathematics matters and hoW it can be measured
box 1.2. measures of opportunity to learn in pisa 2012
Pisa 2012 assessed opportunity to learn mathematics through a number of measures:
Time spent per week in regular mathematics lessons, in minutes.
Exposure to different types of mathematics tasks during time in school (question 1 at the end of this chapter), which was scaled to derive two indices (both indices are normalised to have an oecd average of 0 and a standard deviation of 1):
the index of exposure to applied mathematics refers to student-reported experience with applied tasks at school, such as working out from a train timetable how long it would take to get from one place to another or calculating how much more expensive a computer would be after adding tax.
the index of exposure to pure mathematics measures student-reported experience with mathematics tasks at school that require knowledge of algebra (linear and quadratic equations).
Familiarity with mathematics concepts: question 2 (reproduced at the end of this chapter) asked students to judge how familiar they were with 13 mathematics concepts. Replies were used to create the index of familiarity with mathematics, which was normalised to have an oecd average of 0 and a standard deviation of 1. Part of the analysis contained in this report looks at familiarity with:
algebra, measured as the average student’s familiarity with the concepts of exponential function, quadratic function and linear equation.
geometry, measured as the average student’s familiarity with the concepts of vector, polygon, congruent figure and cosine.
the question about familiarity also included three foils, i.e. non-existing pseudo-concepts. Responses indicating that students heard of these concepts or knew them well were considered to indicate overclaiming. the index of familiarity with mathematics used in this report is corrected for overclaiming.
Frequency of experience with specific mathematics tasks in mathematics lessons and in tests, including the following:
algebraic word problems (question 3a, reported at the end of this chapter), such as: “ann is two years older than betty and betty is four years older than sam. When betty is 30, how old is sam?”.
Procedural tasks (question 3b), such as solving a linear equation or finding the volume of a box.
Pure mathematics problems (question 3c), such as determining the height of a pyramid using geometrical theorems, and solving a problem with prime numbers.
contextualised mathematics problems (question 3d), such as interpreting a trend in a chart.

equations and inequalities: making mathematics accessible to all © OECD 2016 49
1Why access to mathematics matters and hoW it can be measured
0 50 100 150 200 250 300 350 Minutes
Canada
Portugal
Tunisia
Macao-China
Hong Kong-China
United States
Mexico
Iceland
New Zealand
Australia
Japan
Italy
Denmark
Latvia
Russian Federation
Belgium
Brazil
Korea
OECD average
Liechtenstein
Spain
Indonesia
Greece
France
Switzerland
Thailand
Luxembourg
Norway
Poland
Germany
Ireland
Czech Republic
Sweden
Slovak Republic
Finland
Turkey
Netherlands
Austria
Uruguay
Hungary
91
93
26
33
18
-10
6
18
19
18
10
15
21
-33
13
34
-23
22
-18
4
33
-7
14
14
17
-18
19
-28
21
-10
-27
-13
Change in minutes spentper week in regularmathematics lessons
20122003
Figure 1.6 Change between 2003 and 2012 in the time spent
per week in mathematics classes
Notes: Statistically signi�cant changes between 2003 and 2012 in the time spent per week in regular mathematics lessons are shown next to the country/economy name.Only countries with comparable data for both PISA 2003 and PISA 2012 are included.Countries and economies are ranked in descending order of the time spent in mathematics classes per week in 2012.Source: OECD, PISA 2012 Database, Table 1.6. 12 http://dx.doi.org/10.1787/888933376897

© OECD 2016 equations and inequalities: making mathematics accessible to all50
1Why access to mathematics matters and hoW it can be measured
time spent in mathematics classes has increased over the past decade. across oecd countries, students in 2012 spent an average of 13 minutes more per week in mathematics classes than their counterparts did in 2003. in some countries, the average time spent in regular mathematics classes increased much more than that. in canada and Portugal, for example, students in 2012 spent 1.5 hours more in mathematics classes than their counterparts in 2003 did, and students in norway, spain and the united states spent at least 30 minutes more. the amount of time students spent in mathematics lessons increased by more than 15 minutes in another 11 countries and economies. only in korea, which had the fifth longest mathematics class time in 2003, did that class time shrink over the period – by more than 30 minutes.
education systems differ substantially not only in the time allocated to mathematics teaching, but also in how this time is allocated to different topics. Pisa asked students how familiar they are with certain formal mathematics content, including such topics as quadratic functions, radicals and the cosine of an angle (see box 1.2 for a description of the index of familiarity with mathematics). on average across oecd countries, less than 30% of 15-year-old students reported to know well and understand the concept of arithmetic mean; less than 50% of students reported to know well and understand the concepts of divisor and polygon (table 1.7).
students in hong kong-china, Japan, korea, macao-china, shanghai-china, spain and chinese taipei are most familiar with mathematics concepts in general (table 1.8). more specifically, Figure 1.7 shows that students in Japan, macao-china and singapore reported greater familiarity with the algebraic concepts of linear equation, quadratic function and exponential function. most students in shanghai-china reported frequent exposure to the geometric concepts of vector, polygon, congruent figure and cosine. the high levels of exposure to advanced mathematics concepts among asian students is partly due to the academically oriented mathematics curricula in those countries/economies (morris and Williamson, 2000), to the emphasis on advanced mathematics courses in teacher-training programmes (ding et al., 2013), and to a culture of high-stakes examinations that requires teachers to cover all the topics students will need to know for their future tests (Yang, 2014).
at the other end of the spectrum, the majority of students in sweden reported that they had either never encountered or had encountered only once or twice these algebraic and geometric concepts. in several countries, students reported greater familiarity with algebra than with geometry, or vice versa. For example, while 15-year-old students in greece were among the most frequently exposed to geometry, they lagged behind the oecd average in exposure to algebra.
another set of questions in Pisa 2012 was intended to determine whether the teaching of mathematics was more oriented towards pure or applied mathematics (see question 1 at the end of this chapter). students’ responses to these questions were used to derive the two indices of exposure to pure mathematics and exposure to applied mathematics (box 1.2).
students in korea, the Russian Federation, singapore and spain reported the most frequent exposure to pure mathematics at school. students in kazakhstan, korea, Poland and thailand reported the greatest exposure to applied mathematics (Figure 1.8). across education systems, there is only a weak relationship between average exposure to applied mathematics and average

equations and inequalities: making mathematics accessible to all © OECD 2016 51
1Why access to mathematics matters and hoW it can be measured
0 1 2 3 4 Mean index
Never heardthe concept
Heard the conceptonce or twice
Heard the concepta few times
Often heard ofthe concept
Know and understandthe concept well
SwedenTunisiaIceland
ArgentinaLuxembourg
BrazilCosta Rica
GreeceSwitzerland
BelgiumUnited Kingdom
PortugalUruguay
New ZealandIreland
ChileThailandAustralia
MexicoFrance
Slovak RepublicLiechtenstein
LithuaniaViet NamColombia
PolandItaly
OECD averageIndonesia
TurkeyFinland
MalaysiaDenmark
AustriaPeru
Czech RepublicKazakhstan
AlbaniaQatar
Hong Kong-ChinaLatviaIsrael
HungaryNetherlands
SerbiaSpain
RomaniaBulgariaEstonia
MontenegroGermany
Russian FederationCanada
Shanghai-ChinaChinese Taipei
CroatiaSlovenia
United StatesKorea
United Arab EmiratesJordanJapan
SingaporeMacao-China
Algebra Geometry
Figure 1.7 Students’ familiarity with algebra and geometry
Self-reported knowledge of mathematics concepts
Notes: Familiarity with geometry is measured as the average student’s familiarity with the concepts of vector, polygon, congruent figure and cosine. Familiarity with algebra is measured as the average student’s familiarity with the concepts of exponential function, quadratic function and linear equation.Countries and economies are ranked in ascending order of average familiarity with algebra.Source: OECD, PISA 2012 Database, Table 1.8. 12 http://dx.doi.org/10.1787/888933376907

© OECD 2016 equations and inequalities: making mathematics accessible to all52
1Why access to mathematics matters and hoW it can be measured
exposure to pure mathematics. several education systems, including those in greece, hong kong-china, italy, Japan, macao-china, the united states and Viet nam, devote more time to pure mathematics problems than to applied problems, while the opposite is observed in brazil, denmark, Jordan, mexico, montenegro, qatar, Romania, the slovak Republic, sweden, thailand and the united arab emirates (table 1.9a).
R2 = 0.05Brazil
Colombia
Tunisia
New Zealand
Sweden
Jordan
Belgium
Thailand
21
Serbia
20
Uruguay
Costa Rica
11
Mexico
Netherlands
22
Israel
Greece
Poland
13
18
151617
12
Kazakhstan
14
Slovenia
Macao-China
Italy
Spain
Korea
19
-0.80
-0.60
-0.40
-0.20
0.00
0.20
0.40
0.60
0.80
-0.60 -0.40 -0.20 0.00 0.20 0.40 0.60
Inde
x of
exp
osur
e to
appl
ied
mat
hem
atic
s
Index of exposure to pure mathematics
OECD average
1.2.3.4.5.6.7.
AustriaMalaysiaLatviaSwitzerlandFranceUnited KingdomBulgaria
8.9.
10.11.12.13.
EstoniaChileCanadaChinese TaipeiHong Kong-ChinaUnited States
14.15.16.17.18.19.20.21.22.
CroatiaGermanyHungaryIrelandPeruNorwayRomaniaMontenegroFinland
Exposure to pure mathematicsabove OECD average
1
23
4
5
6 8
910
7
Exposure to pure mathematicsbelow OECD average
Exposure to app
lied mathem
aticsabove O
ECD
averageExposure to ap
plied
mathem
aticsbelow
OEC
D average
Russian Federation
Iceland
Singapore
Shanghai-China
Lithuania
Albania
Luxembourg
Portugal
Czech Republic
Argentina
AustraliaViet Nam
Japan
Liechtenstein
Turkey
United Arab Emirates
IndonesiaSlovak Republic
Denmark
Qatar
OEC
D a
vera
ge
Figure 1.8 Relationship between exposure to applied mathematics
and exposure to pure mathematics
Notes: The index of exposure to pure mathematics measures student-reported experience with mathematics tasks requiring knowledge of algebra (linear and quadratic equations).The index of exposure to applied mathematics measures student-reported experience with applied mathematics tasks at school, such as working out from a train timetable how long it would take to get from one place to another or calculating how much more expensive a computer would be after adding tax.Source: OECD, PISA 2012 Database, Table 1.9a. 12 http://dx.doi.org/10.1787/888933376914

equations and inequalities: making mathematics accessible to all © OECD 2016 53
1Why access to mathematics matters and hoW it can be measured
a suitable balance between formal and applied content has been one of the most contentious issues in the public debate on mathematics education. “maths wars” have raged between those who think that “underlying ideas must be elevated above the examples that illustrate them” (munson, 2010) and those who believe that “algorithms are harmful” and children should be left free “to invent their own arithmetic without the instruction they are now receiving from textbooks and workbooks” (kamii and dominick, 1998: 132). this debate has focused on the structure, presentation and type of problems included in mathematics textbooks; on the extent to which all students should learn mathematics, the type of mathematics they should learn, and the types of problems that are suitable for them to work on as they learn it; and on the type of representations emphasised for student learning and problem solving (goldin, 2008; schoenfeld, 2004).
the alternating fortunes of the advocates of “traditional” and “reform” mathematics have influenced curriculum changes, the direction of pedagogical innovations and the content of in-service or pre-service teacher training (klein, 2003; schoenfeld, 2004). some mathematics curricula have tried to reach a middle ground between the two extremes, emphasising the importance of both a high level of mathematics rigour and of opportunities to use mathematics in real-life contexts. in germany, for instance, the ability to construct models to interpret and understand real problems is one of six compulsory competencies in the new national “educational standards” for mathematics (oecd, 2011).
exposure to mathematics tends to increase as students move to higher grades in schools, but this progression varies across different mathematics content (Figure 1.9). the indices of exposure to pure mathematics and familiarity with mathematics show clear progressions as students advance through the school system. the progression is steeper for familiarity with mathematics because the 13 mathematics concepts included in the measure cover an exhaustive range of material at different levels of difficulty, while the index of exposure to pure mathematics is based on a set of algebraic concepts (linear and quadratic equation) of average difficulty for 15-year-old students.
by contrast, students in lower and higher grades reported similar levels of exposure to applied mathematics. this may be because the index of applied mathematics in Pisa is based on students’ reports of exposure to relatively simple contextualised tasks that require basic numeric skills. different patterns of exposure to applied mathematics, depending on the students’ grade level, are observed across countries. students in the netherlands are relatively frequently exposed to applied mathematics, and this exposure increases among older students. by contrast, in the czech Republic and the slovak Republic, teachers in higher grades tend to focus less on the types of applied mathematics tasks that are presented in the Pisa questionnaire (table 1.10).
it is difficult to teach mathematics as both general and concrete. Research suggests that, to achieve this, several different representations (e.g. numerical, verbal, symbolic and graphical) of concepts and phenomena are essential, as are the links and transitions between these representations (e.g. Janvier, 1987). the questions on opportunity to learn in Pisa 2012 tried to illustrate international differences in the way mathematics problems are presented to students (box 1.2).

© OECD 2016 equations and inequalities: making mathematics accessible to all54
1Why access to mathematics matters and hoW it can be measured
Word problems are used consistently throughout the mathematics curriculum. they are often developed by teachers who wish to connect the mathematics tasks to students’ experiences more directly, and to provide contexts to which students can more easily relate (see question 3a at the end of the chapter). on average across oecd countries, 87% of students see this type of problem at least sometimes in their mathematics lessons, and 79% see these problems at least sometimes in their assessments (table 1.11a). in the east asian economies of hong kong-china, macao-china, shanghai-china and Viet nam, less than 20% of students are frequently exposed to algebraic word problems (Figure 1.10a).
another question asked students to describe the extent to which they encounter contextualised mathematical problems, similar to those used in Pisa, during their mathematics lessons and assessments (see question 3d at the end of this chapter). this type of problem requires students to apply mathematics knowledge to find a solution to a problem that arises in everyday life or
-0.60
-0.50
-0.40
-0.30
-0.20
0.10
0.00
0.10
0.20
0.30
One grade belowthe modal grade
Modal grade One grade abovethe modal grade
Indi
ces
of e
xpos
ure
to m
athe
mat
ics
cont
ent
Exposure to applied mathematicsExposure to pure mathematicsFamiliarity with mathematics
Notes: The modal grade is defined in each country as the grade with the largest number of students tested in PISA.The index of exposure to pure mathematics measures student-reported experience with mathematics tasks at school that require knowledge of algebra (linear and quadratic equations).The index of exposure to applied mathematics measures student-reported experience with applied mathematics tasks, such as working out from a train timetable how long it would take to get from one place to another or calculating how much more expensive a computer would be after adding tax.The index of familiarity with mathematics is based on students’ responses to 13 items measuring students’ self-reported familiarity with mathematics concepts (such as exponential function, divisor, quadratic function, etc.).The OECD average for exposure to pure, applied and familiarity with mathematics is calculated only for countries with a valid number of students in the three grades (one grade below the modal grade, the modal grade and one grade above the modal grade).Source: OECD, PISA 2012 Database, Table 1.10.
Figure 1.9 Exposure to mathematics content in class, by grade
OECD average (23 countries)
12 http://dx.doi.org/10.1787/888933376925

equations and inequalities: making mathematics accessible to all © OECD 2016 55
1Why access to mathematics matters and hoW it can be measured
0 10 20 30 40 50 60 70 %
Macao-ChinaViet Nam
Hong Kong-ChinaShanghai-China
UruguayGreeceTurkey
Chinese TaipeiPortugal
BrazilBulgaria
SingaporeSerbia
NetherlandsJapan
LithuaniaArgentina
Costa RicaNew Zealand
Czech RepublicTunisia
IsraelKoreaLatvia
United StatesQatar
ItalyEstoniaIreland
AustraliaNorwayMexico
United Arab EmiratesMalaysia
United KingdomKazakhstan
OECD averageRomania
ColombiaIndonesia
AlbaniaSweden
DenmarkThailandBelgium
PeruRussian Federation
CanadaSlovak Republic
GermanyHungary
CroatiaLuxembourg
PolandChile
FinlandMontenegro
AustriaSlovenia
FranceSwitzerland
LiechtensteinSpain
JordanIceland
Figure 1.10a Exposure to algebraic word problems during mathematics lessons
Percentage of students who reported that they are frequently exposedto algebraic word problems during their mathematics lessons
Note: An example of an algebraic word problem is the following: “Ann is two years older than Betty and Betty is four years older than Sam. When Betty is 30, how old is Sam?”Countries and economies are ranked in ascending order of the percentage of students who reported that they are frequently exposed to algebraic word problems during mathematics lessons.Source: OECD, PISA 2012 Database, Table 1.11a. 12 http://dx.doi.org/10.1787/888933376935

© OECD 2016 equations and inequalities: making mathematics accessible to all56
1Why access to mathematics matters and hoW it can be measured
work, such as interpreting a trend in a chart. most mathematics teachers make limited use of Pisa-type mathematics problems in their lessons. only 21% of students reported seeing this type of problem frequently at school (Figure 1.10b), and 45% reported seeing these problems only sometimes (table 1.11b). applied mathematics problems requiring interpretation and reasoning in a real-life context are even more rarely used in assessments.
Pisa-type mathematics problems often require a skill in “mathematics modelling” – making connections between the real world and mathematics. mathematics modelling has been discussed and recommended most intensely during the past few decades (blum and borromeo Ferri, 2009); however, it is rarely applied in everyday school practice, possibly because it is more difficult both for students and teachers than the replication of routine exercises. several high-performing countries and economies are among those where students are less likely to report exposure to the kinds of contextualised mathematics problems like those included in the Pisa test (Figure 1.10b). this does not mean that exposure to contextualised tasks has a negative effect on performance: rather, it is more likely that contextualisation is used to facilitate access to complex mathematics concepts of students with a weaker knowledge base (see also table 3.8b on the relationship between exposure to contextualised tasks and performance within countries). teaching mathematics is complex, and there are other factors that influence performance more than the amount of real-life connections students make during a task (mosvold, 2008). moreover, effectively applying contextualised problems in the classroom significantly depends on teachers’ ability to support students’ capacity to transfer what they learned in a specific context to similar problems in different contexts (see box 1.3).
Formalised tasks that require applying procedural knowledge (such as those presented in question 3b at the end of this chapter) are most commonly used in mathematics instruction. Pisa shows that around 68% of students in oecd countries see this type of problem frequently in their mathematics lessons (Figure 1.10c), and another 25% of students are sometimes exposed to these problems (table 1.11c). almost 90% of students reported solving these problems as part of their assessments at least sometimes (table 1.11c). at the system level, countries and economies whose students reported frequent exposure to procedural mathematics problems also frequently use algebraic word problems in mathematics classes (table 1.12).
the dominance of procedural mathematics compared with modelling is problematic if students fail to establish the connection between procedures and concepts. For example, students often look at the operational side of equations arriving at the solution with no real understanding of the concept of the equation (niss, 1987). in the long-standing debate about the relationship between procedural and conceptual knowledge, there is a prevalent view that instruction should develop conceptual knowledge before focusing on procedural knowledge (grouws and cebulla, 2000; nctm, 2000, 2014). a recent analysis of the evidence further suggests that conceptual understanding and procedural fluency are equally important as interdependent strands of mathematical proficiency (Rittle-Johnson et al., 2015). both contribute to the long-term development of problem-solving skills.
Pure mathematics problems are also examined in the Pisa student questionnaire (see question 3c at the end of this chapter). these problems require a foundation of conceptual knowledge

equations and inequalities: making mathematics accessible to all © OECD 2016 57
1Why access to mathematics matters and hoW it can be measured
0 5 10 15 25 3020 35 40 45 %
JapanCzech Republic
Macao-ChinaHong Kong-China
Viet NamEstonia
KoreaFinlandCroatiaAustria
Chinese TaipeiSerbiaLatvia
Slovak RepublicSwitzerland
UruguayItaly
SloveniaPoland
LithuaniaBulgariaGreece
MontenegroGermany
SingaporeNorway
Costa RicaLuxembourg
SwedenTurkey
Shanghai-ChinaHungaryBelgium
United KingdomOECD average
RomaniaMalaysia
SpainFrance
New ZealandRussian Federation
DenmarkArgentina
IrelandQatar
AustraliaPeru
United StatesIsrael
AlbaniaKazakhstan
BrazilUnited Arab Emirates
ChilePortugalCanadaTunisia
NetherlandsIcelandMexico
ColombiaJordan
ThailandIndonesia
Figure 1.10b Exposure to contextualised mathematics problems during mathematics lessons
Percentage of students who reported that they are frequently exposed to contextualisedmathematics problems during their mathematics lessons
Note: Contextualised mathematics problems require the application of mathematics knowledge to �nd an answer to a problem that arises in everyday life or work, such as interpreting a trend in a chart.Countries and economies are ranked in ascending order of the percentage of students who reported that they are frequently exposed to contextualised mathematics problems during mathematics lessons.Source: OECD, PISA 2012 Database, Table 1.11b. 12 http://dx.doi.org/10.1787/888933376946

© OECD 2016 equations and inequalities: making mathematics accessible to all58
1Why access to mathematics matters and hoW it can be measured
and the use of procedures that are not automatised, but rather require conscious selection, reflection and sequencing of steps. three out of four students across oecd countries see this type of problem either frequently or sometimes in their mathematics lessons (table 1.11d), and two out of three students solve these problems at least sometimes in the tests they take at school. students in Finland, norway and sweden are less exposed to this type of task than students in other countries and economies.
box 1.3. advantages and possible costs of contextualised mathematics
mathematics and science teachers at all levels are frequently encouraged to incorporate concrete, meaningful, real-world examples into their lessons when teaching new material (Rivet and krajcik, 2008). First, concrete examples are easier to process than more abstract representations and connect the learner’s existing knowledge with new, to-be-learned knowledge. For instance, a mathematics instructor teaching simple probability theory may present probabilities by rolling a six-sided die. second, tasks embedded in real-life contexts have high motivational power; students are most easily engaged with problems that are taken from their everyday lives (hiebert et al., 1996). Well-designed real-life tasks can also encourage the idea that mathematics is a useful discipline (trafton et al., 2001).
despite these advantages, research suggests that concrete examples may also come with a cost. For example, any information presented that is not essential tends to distract learners from the relevant content, leading to poorer recall for that material (the “seductive details effect”; day et al., 2015; harp and mayer, 1998). grounding mathematics using concrete contexts can thus potentially limit its applicability to similar situations in which just the surface details are changed, particularly for low-performers. in a series of experiments with undergraduate and high school students, kaminski et al. (2008) found that learning one, two or three concrete examples resulted in little or no transfer, whereas learning one generic example resulted in significant transfer. on these grounds, the benefits of contextualised problems exceed their costs only if the tasks are very well designed (e.g. minimising unnecessary distractions) and if teachers address the transfer problem, for instance by presenting a concrete example and then a generic example for the same topic.
mathematics teaching in the netherlands has traditionally had the highest amount of connections to real-life (hiebert et al., 2003); most textbook problems present some kind of real-life context (mosvold, 2008). several other countries have taken initiatives to increase the frequency and to improve the quality of real-life mathematics tasks students tackle in class. For example, the singapore mathematics assessment and Pedagogy Project (smaPP) developed a new assessment system that includes real-life mathematics, producing contextualised tasks that teachers can use in their lessons. according to the smaPP framework, a good task should: include links to real life using relevant data; connect to the curriculum; assess multiple competencies and content knowledge; enrich student experiences; and include scaled levels of difficulty. the tasks were developed by a team of mathematicians, reviewed by teachers, and then revised after testing in real lessons. Japan recently revised its “course of study” and introduced mathematical activities with stronger connections with real-life problems.

equations and inequalities: making mathematics accessible to all © OECD 2016 59
1Why access to mathematics matters and hoW it can be measured
0 10 20 30 40 50 60 70 80 90 %
BrazilShanghai-China
Chinese TaipeiMacao-China
ArgentinaUruguayPortugal
Hong Kong-ChinaQatar
Viet NamTunisiaSerbiaIsrael
New ZealandCosta Rica
PeruSingaporeColombia
NorwayKorea
MexicoTurkey
SwedenBulgaria
ItalyBelgiumMalaysiaAlbaniaGreece
KazakhstanLithuania
IndonesiaPoland
ThailandLatvia
AustraliaNetherlandsMontenegro
RomaniaCzech RepublicOECD average
LuxembourgUnited Arab Emirates
ChileSlovenia
EstoniaAustriaFrance
United StatesHungary
SpainUnited Kingdom
JordanRussian Federation
CanadaSlovak Republic
SwitzerlandIreland
GermanyLiechtenstein
FinlandCroatia
DenmarkJapan
Iceland
Figure 1.10c Exposure to procedural mathematics tasks during mathematics lessons
Percentage of students who reported that they are frequently exposedto procedural mathematics tasks during their mathematics lessons
Note: Solving a linear equation or finding the volume of a box are examples of procedural mathematics tasks.Countries and economies are ranked in ascending order of the percentage of students who reported that they are frequently exposed to procedural mathematics tasks during mathematics lessons.Source: OECD, PISA 2012 Database, Table 1.11c. 12 http://dx.doi.org/10.1787/888933376953

© OECD 2016 equations and inequalities: making mathematics accessible to all60
1Why access to mathematics matters and hoW it can be measured
0 10 20 30 40 50 60 70
SwedenNorwayFinland
Costa RicaCzech Republic
New ZealandUnited Kingdom
DenmarkUruguay
ArgentinaIreland
Shanghai-ChinaIceland
Chinese TaipeiMacao-China
IsraelViet NamAustralia
United StatesItaly
Hong Kong-ChinaSlovenia
LuxembourgOECD average
CanadaBrazilChile
LatviaSlovak Republic
SerbiaHungary
SpainKorea
EstoniaBelgium
QatarCroatiaAustria
LithuaniaNetherlands
PeruPortugal
United Arab EmiratesColombia
MexicoGermany
FranceGreece
MontenegroSingapore
SwitzerlandMalaysia
Russian FederationBulgaria
JordanPoland
JapanTunisiaTurkey
ThailandLiechtenstein
AlbaniaRomania
IndonesiaKazakhstan
%
Figure 1.10d Exposure to pure mathematics problems during mathematics lessons
Percentage of students who reported that they are frequently exposedto pure mathematics problems during mathematics lessons
Note: Pure mathematics problems require the use of mathematics knowledge to draw conclusions, without referring to any practical application (e.g. determining the height of a pyramid using geometrical theorems).Countries and economies are ranked in ascending order of the percentage of students who reported that they are frequently exposed to pure mathematics problems during mathematics lessons.Source: OECD, PISA 2012 Database, Table 1.11d. 12 http://dx.doi.org/10.1787/888933376962

equations and inequalities: making mathematics accessible to all © OECD 2016 61
1Why access to mathematics matters and hoW it can be measured
Pisa provides substantial data on the international variation in the intensity, topic coverage and representation of mathematics instruction. these data show remarkable differences between education systems in the opportunity to learn mathematics. the value of these data for education policy emerges when they are used in combination with information on student performance on the Pisa assessment of mathematics (chapter 3), and when the analysis moves beyond country means to look at how opportunity to learn is distributed among students of different socio-economic status (chapter 2). if a solid knowledge of mathematical concepts is necessary to solve non-routine mathematics problems and to apply mathematics in complex contexts outside the classroom, then socio-economic differences in access to mathematics knowledge will perpetuate differences in student performance – and in later social and economic outcomes – that are linked to socio-economic status.

© OECD 2016 equations and inequalities: making mathematics accessible to all62
1Why access to mathematics matters and hoW it can be measured
Questions used to measure opportunity to learn in pisa 2012
the Pisa 2012 student questionnaire contains six questions on opportunity to learn mathematics. box 1.2 explains how responses were scaled and combined into several indices. these questions are shown below.
exposure to pure and applied mathematics
this question asks students to report on the frequency with which they have encountered specific applied and pure mathematics tasks during mathematics lessons. students’ responses to the items a) through f) in this question were scaled to produce the index of exposure to applied mathematics and responses to the items g) through i) were used for the index of exposure to pure mathematics.
Question 1
How often have you encountered the following types of mathematics tasks during your time at school?(Please tick only one box in each row.)
Frequently Sometimes Rarely NeverApplied mathematics tasks
a) Working out from a <train timetable> how long it would take to get from one place to another.
1 2 3 4
b) calculating how much more expensive a computer would be after adding tax.
1 2 3 4
c) calculating how many square metres of tiles you need to cover a floor.
1 2 3 4
d) understanding scientific tables presented in an article.
1 2 3 4
e) Finding the actual distance between two places on a map with a 1:10,000 scale.
1 2 3 4
f) calculating the power consumption of an electronic appliance per week.
1 2 3 4
Pure mathematics tasks
g) solving an equation like: 6x2 + 5 = 29 1 2 3 4
h) solving an equation like: 2(x + 3) = (x + 3)(x - 3)
1 2 3 4
i) solving an equation like: 3x + 5 = 17 1 2 3 4
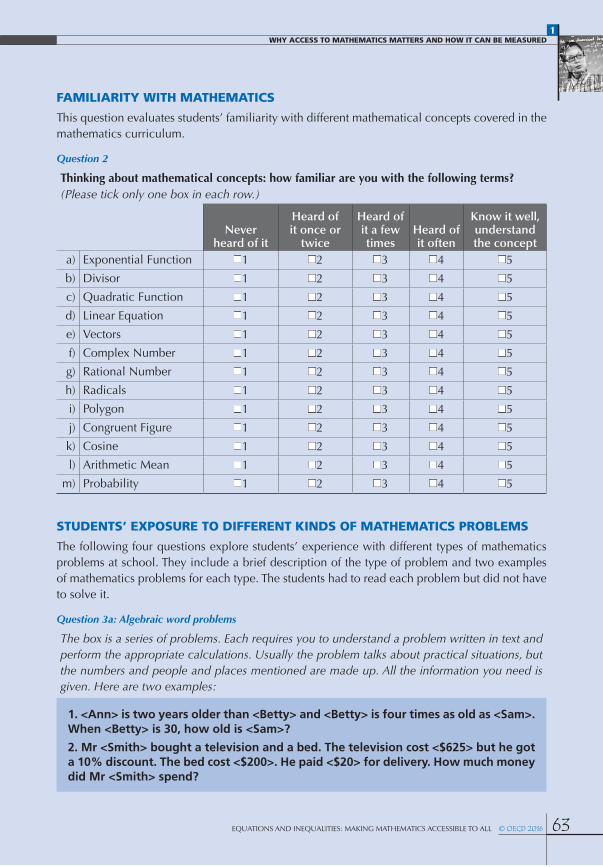
1Why access to mathematics matters and hoW it can be measured
equations and inequalities: making mathematics accessible to all © OECD 2016 63
familiarity With mathematics
this question evaluates students’ familiarity with different mathematical concepts covered in the mathematics curriculum.
Question 2
Thinking about mathematical concepts: how familiar are you with the following terms?(Please tick only one box in each row.)
Never heard of it
Heard of it once or
twice
Heard of it a few times
Heard of it often
Know it well, understand the concept
a) exponential Function 1 2 3 4 5
b) divisor 1 2 3 4 5
c) quadratic Function 1 2 3 4 5
d) linear equation 1 2 3 4 5
e) Vectors 1 2 3 4 5
f) complex number 1 2 3 4 5
g) Rational number 1 2 3 4 5
h) Radicals 1 2 3 4 5
i) Polygon 1 2 3 4 5
j) congruent Figure 1 2 3 4 5
k) cosine 1 2 3 4 5
l) arithmetic mean 1 2 3 4 5
m) Probability 1 2 3 4 5
students’ exposure to different kinds of mathematics problems
the following four questions explore students’ experience with different types of mathematics problems at school. they include a brief description of the type of problem and two examples of mathematics problems for each type. the students had to read each problem but did not have to solve it.
Question 3a: Algebraic word problems
The box is a series of problems. Each requires you to understand a problem written in text and perform the appropriate calculations. Usually the problem talks about practical situations, but the numbers and people and places mentioned are made up. All the information you need is given. Here are two examples:
1. <Ann> is two years older than <Betty> and <Betty> is four times as old as <Sam>. When <Betty> is 30, how old is <Sam>?
2. Mr <Smith> bought a television and a bed. The television cost <$625> but he got a 10% discount. The bed cost <$200>. He paid <$20> for delivery. How much money did Mr <Smith> spend?

1Why access to mathematics matters and hoW it can be measured
© OECD 2016 equations and inequalities: making mathematics accessible to all64
We want to know about your experience with these types of word problems at school. Do not solve them!(Please tick only one box in each row.)
Frequently Sometimes Rarely Never a) how often have you encountered these types
of problems in your mathematics lessons? 1 2 3 4
b) how often have you encountered these types of problems in the tests you have taken at school?
1 2 3 4
Question 3b: Procedural mathematics problems
Below are examples of another set of mathematical skills.
1) Solve 2x + 3 = 7.
2) Find the volume of a box with sides 3m, 4m and 5m.
We want to know about your experience with these types of problems at school. Do not solve them!(Please tick only one box in each row.)
Frequently Sometimes Rarely Never a) how often have you encountered these types
of problems in your mathematics lessons? 1 2 3 4
b) how often have you encountered these types of problems in the tests you have taken at school?
1 2 3 4
Question 3c: Pure mathematics problems
In the next type of problem, you have to use mathematical knowledge and draw conclusions. There is no practical application provided. Here are two examples.
1) Here you need to use geometrical theorems:
12 cm
C
A
S
D
B
12 cm
12 cm
determine the height of the pyramid.
2) Here you have to know what a prime number is:
If n is any number: can (n+1)² be a prime number?

1Why access to mathematics matters and hoW it can be measured
equations and inequalities: making mathematics accessible to all © OECD 2016 65
We want to know about your experience with these types of problems at school. Do not solve them!(Please tick only one box in each row.)
Frequently Sometimes Rarely Never a) how often have you encountered these types
of problems in your mathematics lessons?1 2 3 4
b) how often have you encountered these types of problems in the tests you have taken at school?
1 2 3 4
Question 3d: Contextualised mathematics problems
In this type of problem, you have to apply suitable mathematical knowledge to find a useful answer to a problem that arises in everyday life or work. The data and information are about real situations. Here are two examples.
Example 1 a tV reporter says “this graph shows that there is a huge increase in the number of robberies from 1998 to 1999.”
Year 1998
520
515
510
505
Number of robberies
per year
Year 1999
Do you consider the reporter’s statement to be a reasonable interpretation of the graph?
give an explanation to support your answer.
Example 2 For years the relationship between a person’s recommended maximum heart rate and the person’s age was described by the following formula:
Recommended maximum heart rate = 220 – age
Recent research showed that this formula should be modified slightly. the new formula is as follows:
Recommended maximum heart rate = 208 – (0.7 × age)
From which age onwards does the recommended maximum heart rate increase as a result of the introduction of the new formula? show your work.

1Why access to mathematics matters and hoW it can be measured
© OECD 2016 equations and inequalities: making mathematics accessible to all66
We want to know about your experience with these types of problems at school. Do not solve them!(Please check only one box in each row.)
Frequently Sometimes Rarely Never a) how often have you encountered these types
of problems in your mathematics lessons? 1 2 3 4
b) how often have you encountered these types of problems in the tests you have taken at school?
1 2 3 4

equations and inequalities: making mathematics accessible to all © OECD 2016 67
1Why access to mathematics matters and hoW it can be measured
Note
1. the oecd survey of adult skills defines numeracy as the ability to access, use, interpret and communicate mathematical information and ideas, in order to engage in and manage the mathematical demands of a range of situations in adult life (oecd, 2012).
References
Blum, W. and R. Borromeo Ferri (2009), “mathematical modelling: can it be taught and learnt?”, Journal of Mathematical Modelling and Application, Vol. 1/1, pp. 45-58.
Brown, M., P. Brown, and T. Bibby (2008), ‘“i Would Rather die”: Reasons given by 16-Year-olds for not continuing their study of mathematics’. Research in Mathematics Education, Vol. 10/1, pp. 3-18, http://dx.doi.org/10.1080/14794800801915814.
Burstein, L. (1993), “Prologue: studying learning, growth, and instruction cross-nationally: lessons learned about why and why not engage in cross-national studies”, in l. burstein (ed.), The IEA Study of Mathematics III: Student Growth and Classroom Processes, Pergamon Press, new York, nY, pp. 27-49.
Cai, J. and Y. Ni (2011), “investigating curricular effect on the teaching and learning of mathematics in a cultural context: theoretical and methodological considerations”, International Journal of Educational Research, Vol. 50, pp. 65-70.
Carman, K.G. and P. Kooreman (2014), “Probability perceptions and preventive health care”, Journal of Risk and Uncertainty, Vol. 49/1, pp. 43-71.
Carroll, J.B. (1963), “a model of school learning”, Teachers College Record, Vol. 64, pp. 723-733.
Carroll, J.B. (1989), “the carroll model: a 25-year retrospective and prospective view, Educational Researcher, Vol. 18/1, pp. 26-31.
Cogan, L.S. and W.H. Schmidt (2015), “the concept of opportunity to learn (otl) in international comparisons of education”, in k. stacey and R. turner (eds.), Assessing Mathematical Literacy, springer international Publishing, cham, switzerland, pp. 207-216.
Day, S.B., B.A. Motz, and R.L. Goldstone (2015), “the cognitive costs of context: the effects of concreteness and immersiveness in instructional examples”, Frontiers in Psychology, 6 (december), http://dx.doi.org/ 10.3389/fpsyg.2015.01876.
Ding, M., Y. Li, X. Li and J. Gu (2013), “knowing and understanding instructional mathematics content through intensive studies of textbooks”, in Y. li and R. huang (eds.), How Chinese Teach Mathematics and Improve Teaching, Routledge, new York, nY, pp. 66-82.
Doyle, W. (1992), “curriculum and pedagogy”, in P.W. Jackson (ed.), Handbook of Research on Curriculum, macmillan, new York, nY, pp. 486-516.
Echazarra, A., et al. (2016), ‘how teachers teach and students learn’. oecd education Working Papers. Paris: organisation for economic co-operation and development. http://www.oecd-ilibrary.org/content/workingpaper/5jm29kpt0xxx-en.
European Parliament (2015), “encouraging stem studies for the labour market”, study for the emPl committee, Policy department economic and scientific Policy, brussels.
Floden, R.E. (2002), “the measurement of opportunity to learn”, in a.c. Porter and a. gamoran (eds.), Methodological Advances in Cross-National Surveys of Educational Achievement, board on international comparative studies in education, national academy Press, Washington, dc, pp. 231-266.

© OECD 2016 equations and inequalities: making mathematics accessible to all68
1Why access to mathematics matters and hoW it can be measured
Freeman, D.J. and A.C. Porter (1989), ‘do textbooks dictate the content of mathematics instruction in elementary schools?’ American Educational Research Journal, Vol. 26/3, pp. 403-21.
Gal, I. and D. Tout (2014), ”comparison of Piaac and Pisa frameworks for numeracy and mathematical literacy”, OECD Education Working Papers, no. 102, oecd Publishing, Paris, http://dx.doi.org/10.1787/ 5jz3wl63cs6f-en.
Goldin, G.A. (2008), “Perspectives on representation in mathematical learning and problem solving”, in l.d. english (ed.), Handbook of International Research in Mathematics Education (2nd ed.), Routledge, new York, nY, pp. 176-201.
Grossman, P. and C. Thompson (2008), ‘learning from curriculum materials: scaffolds for new teachers?’ Teaching and Teacher Education, Vol. 24/8, pp. 2014-26, http://dx.doi.org/10.1016/j.tate.2008.05.002.
Grouws, D.A. and K.J. Cebulla (2000), Improving Student Achievement in Mathematics, international bureau of education (ibe), geneva, switzerland.
Harp, S.F. and R.E. Mayer (1998), ”how seductive details do their damage: a theory of cognitive interest in science learning”, Journal of Educational Psychology, Vol. 90/3, pp. 414-34, http://dx.doi.org/10.1037/0022-0663.90.3.414.
Hiebert, J., et al. (2003), ”teaching mathematics in seven countries: Results from the timss 1999 Video study”, march 26, https://nces.ed.gov/pubsearch/pubsinfo.asp?pubid=2003013.
Hiebert, J., et al. (1996), ”Problem solving as a basis for Reform in curriculum and instruction: the case of mathematics”, Educational Researcher, Vol. 25/4, pp. 12-21, http://dx.doi.org/10.2307/1176776.
Houang, R.T., and W.H. Schmidt (2008), timss international curriculum analysis and measuring educational opportunities, Retrieved from www.iea.nl/fileadmin/user_upload/iRc2008/Papers/timss_mathematics/houang_schmidt.pdf.
Hoyles, C., et al. (2010), Improving mathematics at work: The need for techno-mathematical literacies, Routledge, london.
Husen, T. (ed.) (1967), International Study of Achievement in Mathematics: A Comparison of Twelve Countries (Vol. i), Wiley and sons, new York, nY.
Jacob, B. (1999), “instructional materials for k-8 mathematics classrooms: the california adoption”, in e. gavosto, s. krantz and W. mccallum (eds.), Contemporary Issues in Mathematics Education, mathematical sciences Research institute Publications, cambridge university Press, cambridge, uk, pp. 109-122.
Janvier, C. (ed.) (1987), Problems of Representations in the Teaching and Learning of Mathematics, lawrence erlbaum associates, hillsdale, nJ.
Joensen, J.S. and H.S. Nielsen (2009). “is there a causal effect of high school math on labor market outcomes?” Journal of Human Resources, Vol. 44/1, pp. 171-198.
Johansson, M. (2005), Mathematics Textbooks-the Link between the Intended and the Implemented Curriculum, Paper Presented to ‘the Mathematics Education into the 21st Century Project’ Universiti Teknologi, Malaysia.
Kamii, C. and A. Dominick (1998), “the harmful effects of algorithms in grades 1- 4”, in l.J. morrow and m.J. kenney (eds.), The Teaching and Learning of Algorithms in School Mathematics, 1998 Yearbook, national council of teachers of mathematics, Reston, Va, pp. 131-140.
Kaminski, J.A., V.M. Sloutsky, and A.F. Heckler (2008), ‘the advantage of abstract examples in learning math’, Science, Vol. 320/5875, pp. 454-55, http://dx.doi.org/10.1126/science.1154659.

equations and inequalities: making mathematics accessible to all © OECD 2016 69
1Why access to mathematics matters and hoW it can be measured
Klein, D. (2003), “a brief history of american k-12 mathematics education in the 20th century”, in J.m. Royer (ed.), Mathematical Cognition, information age Publishing, greenwich, ct, pp. 175-225.
Levine, P. B. and D.J. Zimmerman (1995), “the benefit of additional high-school math and science classes for Young men and Women”, Journal of Business and Economic Statistics, Vol. 13/2, pp. 137-149.
Marzano, R. (2003), What Works in Schools: Translating Research into Action, association for supervision and curriculum development, alexandria, Va.
Morris, P. and J. Williamson (eds.) (2000), Teacher Education in the Asia-Pacific Region: A Comparative Study, Falmer Press, new York, nY.
Mosvold, R. (2008), “Real-life connections in Japan and the netherlands : national teaching Patterns and cultural beliefs”, pp. 1-18, https://brage.bibsys.no/xmlui/handle/11250/185486.
Mullis, I.V.S., et al. (2012), TIMSS 2011 Encyclopedia: Education Policy and Curriculum in Mathematics and Science, Volumes 1 and 2, chestnut hill, ma: timss & PiRls international study center, boston college, http://timssandpirls.bc.edu/timss2011/encyclopedia-timss.html.
Munson, A. (2010), “bourbaki at seventy-five: its influence in France and beyond”, Journal of Mathematics Education at Teachers College, Vol. 1/2, pp. 18-21.
NCTM (ed.) (2000), Principles and Standards for School Mathematics, national council of teachers of mathematics, Reston, Va.
NCTM (ed.) (2014), Principles to Actions: Ensuring Mathematical Success for All, national council of teachers of mathematics, Reston, Va.
Nelson, W.L., et al. (2008), clinical implications of numeracy: theory and practice, Annals of Behavioral Medicine, Vol. 35, pp. 261-274.
Niss, M. (1987), “application and modelling in mathematics curricula – state and trends”, International Journal for Mathematical Education in Science and Technology, Vol. 18/4, pp. 487-505.
OECD (2015), Students, Computers and Learning: Making the Connection, Pisa, oecd Publishing, Paris, http://dx.doi.org/10.1787/9789264239555-en.
OECD (2013a), Technical Report of the Survey of Adult Skills, oecd Publishing, Paris, http://www.oecd.org/site/piaac/_technical%20Report_17oct13.pdf.
OECD (2013b), PISA 2012 Assessment and Analytical Framework: Mathematics, Reading, Science, Problem Solving and Financial Literacy, Pisa, oecd Publishing, Paris, http://dx.doi.org/10.1787/9789264190511-en.
OECD (2012), Literacy, Numeracy and Problem Solving in Technology-Rich Environments. Paris: organisation for economic co-operation and development, http://www.oecd-ilibrary.org/content/book/9789264128859-en.
OECD (2011), Lessons from PISA for the United States: Strong Performers and Successful Reformers in Education, oecd Publishing, Paris, http://dx.doi.org/10.1787/9789264096660-en.
Polya, G. (1973), How to solve it: A new aspect of mathematical method, Princeton university Press, Princeton, new Jersey.
Reys, R., et al. (2003), ‘assessing the impact of“ standards”-based middle grades mathematics curriculum materials on student achievement’, Journal for Research in Mathematics Education, pp. 74-95.
Rittle-Johnson, B., M. Schneider and J.R. Star (2015), “not a one-way street: bidirectional relations between procedural and conceptual knowledge of mathematics”, Educational Psychology Review, Vol. 27/4, pp. 587-597.

© OECD 2016 equations and inequalities: making mathematics accessible to all70
1Why access to mathematics matters and hoW it can be measured
Rivet, A.E. and J.S. Krajcik (2008), “contextualizing instruction: leveraging students’ Prior knowledge and experiences to Foster understanding of middle school science”, Journal of Research in Science Teaching, 45(1): 79-100, http://dx.doi.org/10.1002/tea.20203.
Rose, H. and J.R. Betts (2004), “the effect of high school courses on earnings”, The Review of Economics and Statistics, 86(2): 497-513.
Roterham, A.J. and D.T. Willingham (2010), ”’21st-century’ skills: not new, but a worthy challenge”, American Educator, Vol. 34/1, pp. 17-20.
Scheerens, J. and R. Bosker (1997), The Foundations of Educational Effectiveness, elsevier, new York, nY.
Schmidt, W.H. and A. Maier (2009), “opportunity to learn”, in g. sykes, b. schneider and d.n. Plank (eds.), Handbook of Education Policy Research, Routledge, new York, nY.
Schmidt, W.H., C.C. McKnight, R.T. Houang, H. Wang, D.E. Wiley, L.S. Cogan, R.G. Wolfe (2001), Why Schools Matter: A Cross-National Comparison of Curriculum and Learning, Jossey-bass, san Francisco, ca.
Schmidt, W.H., C.C. McKnight, G. Valverde, R.T. Houang and D.E. Wiley (eds.) (1997), Many Visions, Many Aims: A Cross-National Investigation of Curricular Intentions in School Mathematics, springer, berlin.
Schmidt,W., P. Zoido and L. Cogan (2014), “schooling matters: opportunity to learn in Pisa 2012”, OECD Education Working Papers, no. 95, oecd Publishing, Paris, http://dx.doi.org/10.1787/5k3v0hldmchl-en.
Schmitt, N. (ed) (2013), The Oxford Handbook of Personnel Assessment and Selection, oxford university Press, oxford, england.
Schoenfeld, A. (1983), Problem solving in the mathematics curriculum: a report, recommendations, and an annotated bibliography, mathematical association of america, Washington, dc.
Schoenfeld, A. (2002), “making mathematics work for all children: issues of standards, testing, and equity”, Educational Researcher, Vol. 31/1, pp. 13-2.
Schoenfeld, A. (2004), “the math wars”, Educational Policy, Vol. 18/1, pp. 253-286.
Stathopoulou, C., E. Gana, and P. Chaviaris (2012), “curriculum, textbooks, mathematics teaching: What Really happens in the classroom?“, quaderni di Ricerca in didattica (mathematics), Vol. 22/1, http://www.academia.edu/download/30869446/cieaem_63_Pproceedings_qRdm_issue_22__suppl.pdf#page=252.
Stedøy, I.M. (ed.) (2004), Mathematics Education - The Nordic Way, ntnu-trykk, trondheim, norway.
Steen, L.A. (ed.) (2001), Mathematics and Democracy: The Case for Quantitative Literacy, national council on education and the disciplines, Princeton, nJ.
Trafton, P.R., B.J. Reys, and D.G. Wasman (2001), “standards-based mathematics curriculum materials: a Phrase in search of a definition“, The Phi Delta Kappan, Vol. 83/3, pp. 259-64.
Usiskin, Z. and E. Willmore (eds.) (2008), Mathematics curriculum in Pacific Rim countries — China, Japan, Korea, and Singapore, charlotte, nc: information age Publishing.
Valverde, G., L.J. Bianchi, R. Wolfe, W.H. Schmidt and R.T. Houang (2002), According to the Book: Using TIMSS to Investigate the Translation of Policy Into Practice Through the World of Textbooks, springer, berlin.
Yang, X. (2014), “conception and characteristics of expert mathematics teachers in china”, Perspektiven der Mathematikdidaktik Series, springer spektrum, Wiesbaden, germany.

2
equations and inequalities: making mathematics accessible to all © OECD 2016 71
2
71
Students’ exposure to mathematics varies within countries even more than between countries. This chapter first explores how access to mathematics content varies by socio-economic status and other student characteristics, such as gender, immigrant background and attendance at pre-primary school. It then analyses the extent to which school- and system-level factors – including student sorting and teaching resources and practices – can produce segregation in opportunities to learn mathematics based on students’ socio-economic status.
Variations in Students’ Exposure to and Familiarity
with Mathematics
the statistical data for israel are supplied by and under the responsibility of the relevant israeli authorities. the use of such data by the oecd is without prejudice to the status of the golan heights, east Jerusalem and israeli settlements in the West bank under the terms of international law.

© OECD 2016 equations and inequalities: making mathematics accessible to all72
2Variations in students’ exposure to and familiarity with mathematics
lack of access to mathematics content at school can leave young people socially and economically disadvantaged for life. Who gets to learn mathematics, and the nature of the mathematics that is learned, have an impact on education systems, social cohesion and productivity. education systems that fail to provide the same opportunities to all students can end up reinforcing, rather than beginning to dismantle, social inequalities. When education is no longer a pathway to individual fulfilment and social mobility, talent is wasted and feelings of injustice grow. Failing disadvantaged youth at school can also pave the way for a wide range of social problems later on, including poverty, poor health and crime (schoenfeld, 2002; oecd, 2012).
this chapter focuses on how opportunities to learn mathematics vary within countries. across all education systems, socio-economically disadvantaged young people have less access to mathematics content. the results confirm the findings of extensive research on the strong links between socio-economic advantage, mastery of mathematics and perseverance in secondary school mathematics (crosnoe and schneider, 2010).
students of higher socio-economic status have an advantage from the beginning: they tend to have access to high-quality learning opportunities, both formal and informal. at an early age, they often attend better resourced and better organised elementary schools, and they have access to after-school programmes that enrich their learning experience as they approach high school (downey, von hippel and broh, 2004; entwisle, alexander and olson, 2005; lareau, 2011; nichd early child care network, 2005). the parents of these students tend to have greater experience navigating through the education system, which makes it more likely that their children will pursue higher education and succeed in the labour market (morgan, 2005).
what the data tell us
across oecd countries, around 9% of the variation in familiarity with mathematics within countries is explained by students’ socio-economic status and by the concentration of socio-economic advantage in certain schools. socio-economic differences among students and schools account for less than 1% of the variation in estonia and malaysia and for more than 20% of the variation in hungary and liechtenstein.
around 70% of the students who have at least one tertiary-educated parent reported that they know well or have often heard of the concept of linear equation; only 52% of students whose parents have only primary education as their highest level of attainment so reported.
around 54% of the variation among oecd countries in the impact of students’ and schools’ socio-economic status on students’ familiarity with mathematics is explained by system-level differences in the age at which students are tracked into vocational or general/academic programmes or schools.
ability grouping is more prevalent in disadvantaged schools than in advantaged schools, on average across oecd countries.
on average across oecd countries, teachers’ use of cognitive-activation strategies is associated with greater familiarity with mathematics among students in socio-economically advantaged schools; but this is not the case in disadvantaged schools.

equations and inequalities: making mathematics accessible to all © OECD 2016 73
2Variations in students’ exposure to and familiarity with mathematics
Pisa data show large variations across countries in the association between socio-economic status (box 2.1) and students’ familiarity with mathematics, suggesting that the organisation of education systems can either mitigate or reinforce inequalities in access to knowledge.1 the mechanisms in place for selecting students in schools according to their perceived ability and preparation seem to play a significant role in reducing opportunities to learn mathematics among disadvantaged students.
Variations in access to mathematics content within countries
catering to the needs of a diverse student body and ensuring consistently high standards across schools represent formidable challenges for any school system (oecd, 2004). Variations in opportunity to learn mathematics within countries can be related to a variety of factors, including regional differences in the socio-economic and cultural characteristics of the communities that are served by schools; the quality of the school staff or the education policies implemented in some schools and not in others; the distribution of human and financial resources available to schools; and system-level factors, such as the way students are grouped, according to their academic potential and interests, in specific programmes (oecd, 2013a).
Figure 2.1 shows large international differences in the extent to which students’ self-reported knowledge of mathematics varies within each country. the total length of the bars indicates the observed variation in the index of familiarity with mathematics. the variation in familiarity with mathematics is more than four times greater in liechtenstein and spain than in indonesia. across oecd countries, around 86% of the country-level variation in familiarity with mathematics can be traced to differences across students who attend the same school, while around 14% can be ascribed to differences across students who attend different schools. in austria, germany, hungary, liechtenstein and qatar, at or over a quarter of the variation is due to differences across schools. denmark, Finland, malaysia, sweden and tunisia are the most comprehensive
what these results mean for policy
as exposure to, and familiarity with, mathematics are strongly correlated with students’ socio-economic status, education systems and policies should be designed with the aim of giving all students equal opportunity to learn mathematics concepts and to practice challenging mathematics tasks.
in order to give all students equal opportunity to learn mathematics, tracking should be delayed and/or struggling students should be offered individualised instruction tailored to their needs.
more professional training in teaching in multicultural settings should be provided to teachers, particularly to those who work in disadvantaged schools.
all students would benefit from teaching practices that emphasise mathematics reasoning and problem solving; but policy makers, school authorities and teachers should ensure that such practices do not take time away from covering key mathematics concepts, especially for socio-economically disadvantaged students.

© OECD 2016 equations and inequalities: making mathematics accessible to all74
2Variations in students’ exposure to and familiarity with mathematics
systems, where there is less than 5% variation in students’ familiarity with mathematics observed among schools.2
across oecd countries, around 4% of the variation in students’ familiarity with mathematics within countries is explained by the socio-economic status of students; this percentage more than doubles when also taking into account the socio-economic composition of the schools – that is, the concentration of students with a similar socio-economic status who attend the same schools (Figure 2.2).3 the cumulative effect of a student’s socio-economic status and the concentration of socio-economic advantage in a school is particularly large in austria, hungary and liechtenstein. in Portugal and spain, the socio-economic profile of a school adds little to the effect related to an individual student’s socio-economic status, suggesting that disadvantaged students lag behind other students in access to mathematics no matter which school they attend. the opposite pattern is observed in the czech Republic, the netherlands and Japan, where segregation by socio-economic status occurs mostly between schools.
box 2.1. what is socio-economic status and how it is measured in pisa?
socio-economic status in Pisa is a broad concept that summarises many different aspects of a student, school or system. a student’s socio-economic status is estimated by an index, the PISA index of economic, social and cultural status (escs), which is based on such indicators as parents’ education and occupation, the number and type of home possessions that are considered proxies for wealth, and the educational resources available at home. the index is built to be internationally comparable (see the PISA 2012 Technical Report, oecd, 2014a). students are considered socio-economically advantaged if they are among the 25% of students with the highest escs in their country or economy; socio-economically disadvantaged students are those among the 25% of students with the lowest escs. schools are defined as socio-economically advantaged (disadvantaged) if the average escs of students in the school is statistically significantly above (below) that of the average school.
Pisa consistently finds that socio-economic status is associated with performance at system, school and student levels. these patterns reflect, in part, the inherent advantages in resources that relatively high socio-economic status provides. however, they also reflect other characteristics that are associated with socio-economic status but that are not measured by the Pisa index. For example, at the system level, high socio-economic status is related to greater wealth and higher spending on education. at the school level, higher socio-economic status is associated with a range of characteristics of a community that might be related to student performance, such as a safe environment and the availability of quality educational resources, such as public libraries or museums. at the individual level, socio-economic status may be related to parents’ attitudes towards education, in general, and to their involvement in their child’s education, in particular.
Source: oecd (2013a).

equations and inequalities: making mathematics accessible to all © OECD 2016 75
2Variations in students’ exposure to and familiarity with mathematics
Within school variation Between school variation
12
Percentage of the variationthat is between schools
IndonesiaMalaysia
New ZealandSwedenIreland
DenmarkUnited Kingdom
MexicoAustralia
ArgentinaThailand
FinlandPeru
PolandBrazilChile
ColombiaEstoniaCroatia
SloveniaCzech Republic
LithuaniaIceland
ItalyCanada
NetherlandsKazakhstan
LuxembourgSerbia
Costa RicaUruguay
JapanViet Nam
SingaporeOECD average
Russian FederationSlovak Republic
MontenegroPortugal
SwitzerlandQatar
TunisiaRomania
United StatesMacao-China
GreeceGermany
KoreaIsrael
TurkeyUnited Arab Emirates
AustriaBulgariaHungary
Hong Kong-ChinaJordan
Shanghai-ChinaLatvia
BelgiumChinese Taipei
SpainLiechtenstein
0.00 0.20 0.40 0.60 0.80 1.20 1.401.00 1.60 Variation
421521211211128
261431172310242910141321
325211010176
141110
55487
139
154
137
1917146
162017126
249
19161016111718
64
Figure 2.1 Variation in familiarity with mathematics, within and between schools
Note: The index of familiarity with mathematics is based on students' responses to 13 items measuring students’ self-reported familiarity with mathematics concepts (such as exponential function, divisor, quadratic function, etc.).Countries and economies are ranked in ascending order of the total variation (within and between) in the index of familiarity with mathematics.Source: OECD, PISA 2012 Database, Table 2.1. 12 http://dx.doi.org/10.1787/888933376973

© OECD 2016 equations and inequalities: making mathematics accessible to all76
2Variations in students’ exposure to and familiarity with mathematics
0 5 10 15 20 25 30Percentage of variation
EstoniaMalaysia
Hong Kong-ChinaDenmark
FinlandJordan
MexicoTunisia
Viet NamCanadaSweden
IsraelMacao-China
KazakhstanLatvia
IcelandGreece
QatarUnited Arab Emirates
Costa RicaIndonesiaArgentina
PolandRussian Federation
New ZealandUnited Kingdom
IrelandLithuaniaAustralia
United StatesPeru
Shanghai-ChinaColombia
MontenegroRomania
SpainCzech Republic
LuxembourgOECD average
SingaporeBulgariaUruguay
SerbiaThailand
TurkeyPortugal
ItalyJapan
CroatiaSwitzerland
BrazilSlovak Republic
ChileKorea
NetherlandsChinese Taipei
BelgiumSlovenia
GermanyAustria
HungaryLiechtenstein
Variation explained by students’ socio-economic status and schools’ socio-economic profileVariation explained by students’ socio-economic status
Figure 2.2Variation in familiarity with mathematics explained
by students’ and schools’ socio-economic profile
Notes: The percentage of total variation explained by the PISA index of economic, social and cultural status (ESCS) is estimated through a linear model. The relationship between familiarity with mathematics and ESCS is statistically significant in all countries and economies.The index of familiarity with mathematics is based on students’ responses to 13 items measuring students’ self-reported familiarity with mathematics concepts (such as exponential function, divisor, quadratic function, etc.).Estimates for France based on the schools’ socio-economic pro�le were deleted at the request of the country. Students’ socio-economic status explains 6.7% of the variation in familiarity with mathematics within the country. Countries and economies are ranked in ascending order of the percentage of variation in familiarity with mathematics explained by students’ socio-economic status and by schools’ socio-economic profile.Source: OECD, PISA 2012 Database, Table 2.2. 12 http://dx.doi.org/10.1787/888933376988
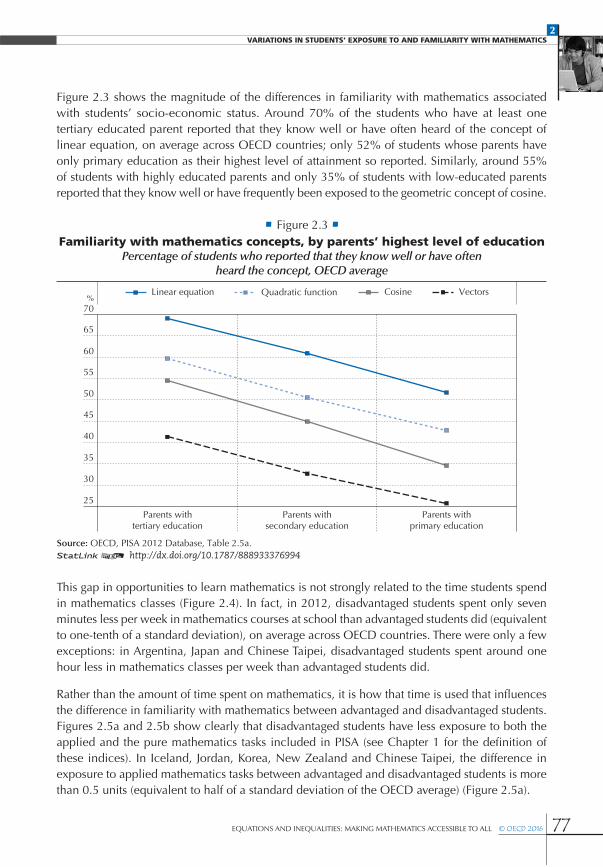
equations and inequalities: making mathematics accessible to all © OECD 2016 77
2Variations in students’ exposure to and familiarity with mathematics
Figure 2.3 shows the magnitude of the differences in familiarity with mathematics associated with students’ socio-economic status. around 70% of the students who have at least one tertiary educated parent reported that they know well or have often heard of the concept of linear equation, on average across oecd countries; only 52% of students whose parents have only primary education as their highest level of attainment so reported. similarly, around 55% of students with highly educated parents and only 35% of students with low-educated parents reported that they know well or have frequently been exposed to the geometric concept of cosine.
this gap in opportunities to learn mathematics is not strongly related to the time students spend in mathematics classes (Figure 2.4). in fact, in 2012, disadvantaged students spent only seven minutes less per week in mathematics courses at school than advantaged students did (equivalent to one-tenth of a standard deviation), on average across oecd countries. there were only a few exceptions: in argentina, Japan and chinese taipei, disadvantaged students spent around one hour less in mathematics classes per week than advantaged students did.
Rather than the amount of time spent on mathematics, it is how that time is used that influences the difference in familiarity with mathematics between advantaged and disadvantaged students. Figures 2.5a and 2.5b show clearly that disadvantaged students have less exposure to both the applied and the pure mathematics tasks included in Pisa (see chapter 1 for the definition of these indices). in iceland, Jordan, korea, new Zealand and chinese taipei, the difference in exposure to applied mathematics tasks between advantaged and disadvantaged students is more than 0.5 units (equivalent to half of a standard deviation of the oecd average) (Figure 2.5a).
25
30
35
40
45
50
55
60
65
70
Parents withtertiary education
Parents withsecondary education
Parents withprimary education
Linear equation Quadratic function Cosine Vectors%
Source: OECD, PISA 2012 Database, Table 2.5a.
Figure 2.3 Familiarity with mathematics concepts, by parents’ highest level of education
Percentage of students who reported that they know well or have oftenheard the concept, OECD average
12 http://dx.doi.org/10.1787/888933376994
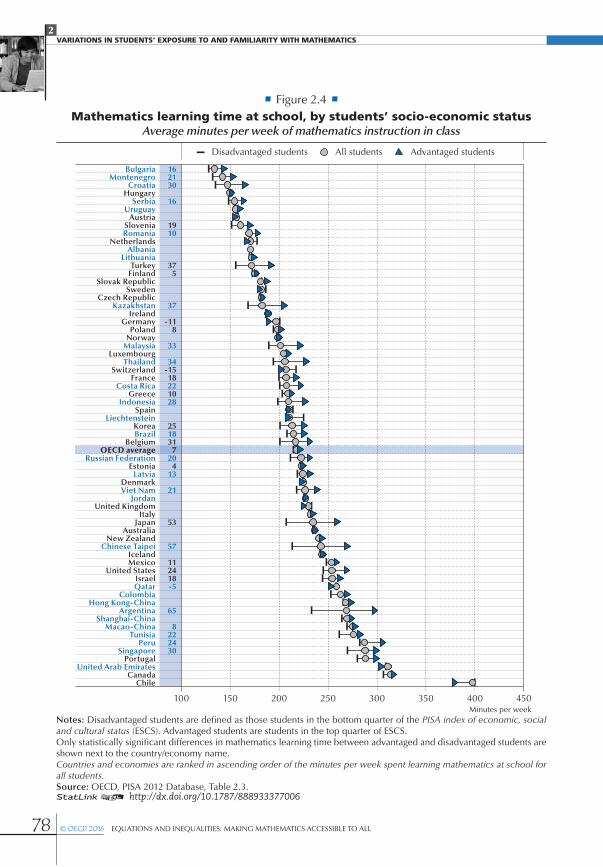
© OECD 2016 equations and inequalities: making mathematics accessible to all78
2Variations in students’ exposure to and familiarity with mathematics
Minutes per week100 150 200 250 300 350 400 450
Advantaged students
BulgariaMontenegro
CroatiaHungary
SerbiaUruguay
AustriaSloveniaRomania
NetherlandsAlbania
LithuaniaTurkey
FinlandSlovak Republic
SwedenCzech Republic
KazakhstanIreland
GermanyPoland
NorwayMalaysia
LuxembourgThailand
SwitzerlandFrance
Costa RicaGreece
IndonesiaSpain
LiechtensteinKoreaBrazil
BelgiumOECD average
Russian FederationEstonia
LatviaDenmarkViet Nam
JordanUnited Kingdom
ItalyJapan
AustraliaNew Zealand
Chinese TaipeiIcelandMexico
United StatesIsraelQatar
ColombiaHong Kong-China
ArgentinaShanghai-China
Macao-ChinaTunisia
PeruSingapore
PortugalUnited Arab Emirates
ChileCanada
All studentsDisadvantaged students
162130
16
1910
375
37
-118
33
34-1518221028
251831
7204
13
21
53
57
112418-5
65
8222430
Figure 2.4 Mathematics learning time at school, by students’ socio-economic status
Average minutes per week of mathematics instruction in class
Notes: Disadvantaged students are defined as those students in the bottom quarter of the PISA index of economic, social and cultural status (ESCS). Advantaged students are students in the top quarter of ESCS.Only statistically signi�cant differences in mathematics learning time between advantaged and disadvantaged students are shown next to the country/economy name.Countries and economies are ranked in ascending order of the minutes per week spent learning mathematics at school for all students.Source: OECD, PISA 2012 Database, Table 2.3. 12 http://dx.doi.org/10.1787/888933377006

equations and inequalities: making mathematics accessible to all © OECD 2016 79
2Variations in students’ exposure to and familiarity with mathematics
Index of exposure to applied mathematics
The PISA index of economic, social and cultural status (ESCS)
-0.80 -0.60 -0.40 -0.20 0.00 0.20 0.40 0.60 0.80
PortugalCosta Rica
Uruguay1
Italy1
LuxembourgGreece1
Israel1
Chinese TaipeiJapan
TunisiaNew Zealand
Czech Republic1
BelgiumCanada
Viet Nam1
AustraliaColombia
Serbia1
Hong Kong-ChinaMalaysia
ArgentinaUnited States
Turkey1
LiechtensteinMacao-China
FranceUnited Arab Emirates
ChileBulgaria
OECD averageCroatia1
IndonesiaSwitzerland
IcelandAustria
PeruLatvia
United KingdomSlovenia
EstoniaQatarBrazil
RomaniaMontenegro1
GermanyIrelandJordan
NorwayFinland
Russian FederationSweden
Slovak Republic1
MexicoShanghai-China
KoreaHungary1
LithuaniaSpain1
Netherlands1
SingaporeDenmarkThailand
PolandKazakhstan
Bottom quarter (disadvantaged students) Second quarterThird quarter Top quarter (advantaged students)
Figure 2.5a
1. The difference between the top and the bottom quarters of the PISA index of economic, social and cultural status (ESCS) is not statistically significant.Note: The index of exposure to applied mathematics measures student-reported experience with applied mathematics tasks at school, such as working out from a train timetable how long it would take to get from one place to another or calculating how much more expensive a computer would be after adding tax.Countries and economies are ranked in ascending order of the average index of exposure to applied mathematics of students in the bottom quarter of ESCS.Source: OECD, PISA 2012 Database, Table 2.4a.
Exposure to applied mathematics, by students’ socio-economic status
12 http://dx.doi.org/10.1787/888933377010

© OECD 2016 equations and inequalities: making mathematics accessible to all80
2Variations in students’ exposure to and familiarity with mathematics
Index of exposure to pure mathematics
The PISA index of economic, social and cultural status (ESCS)
-0.80 -0.60 -0.40 -0.20 0.00 0.20 0.40 0.60 0.80
Bottom quarter (disadvantaged students) Second quarterThird quarter Top quarter (advantaged students)
New ZealandPortugal
BrazilQatar
LuxembourgTunisiaJordan
AustraliaSwedenBelgium
DenmarkUnited Arab Emirates
ColombiaArgentina
Chinese TaipeiChile
Czech RepublicTurkey
NetherlandsMalaysiaCanada
Slovak RepublicAustria
IndonesiaRomania
Costa RicaThailand
SwitzerlandUruguayBulgaria
LatviaMontenegro
OECD averageSerbiaIsrael
FranceGreeceFinland
PeruMexico
GermanyUnited Kingdom
NorwayEstonia
United StatesHungary
IrelandPoland
Viet NamJapan
Shanghai-China1
IcelandLithuania
ItalyCroatia
KazakhstanSlovenia
Hong Kong-ChinaRussian Federation
SpainLiechtenstein1
SingaporeMacao-China1
Korea
Figure 2.5b
1. The difference between the top and the bottom quarters of ESCS is not statistically significant.Note: The index of exposure to pure mathematics measures student-reported experience with mathematics tasks at school requiring knowledge of algebra (linear and quadratic equations).Countries and economies are ranked in ascending order of the average index of exposure to pure mathematics of students in the bottom quarter of ESCS.Source: OECD, PISA 2012 Database, Table 2.4a.
Exposure to pure mathematics, by students’ socio-economic status
12 http://dx.doi.org/10.1787/888933377022

equations and inequalities: making mathematics accessible to all © OECD 2016 81
2Variations in students’ exposure to and familiarity with mathematics
the difference in exposure to pure mathematics tasks (functions and equations) is even larger and is statistically significant in all countries and economies except macao-china, liechtenstein and shanghai-china (Figure 2.5b). on average across oecd countries, there is a difference of 0.44 of a standard deviation in the index of exposure to pure mathematics between advantaged and disadvantaged students. to put this magnitude in perspective, the average difference between students in the modal grade and students one grade below is 0.29 of a standard deviation (chapter 1, table 1.10). in belgium and new Zealand, the difference in the index of exposure to pure mathematics between advantaged and disadvantaged students is over two-thirds of a standard deviation. in 49 of 63 countries and economies with available data, socio-economically disadvantaged students had less than the oecd average exposure to pure mathematics (Figure 2.5b).
these data raise questions about the effectiveness of the time disadvantaged students spend studying mathematics at school. given a similar investment of time, disadvantaged students still reported having less knowledge about key mathematics concepts, spending less time solving equations and engaging less in relatively simple applied mathematics tasks. What do these students do and learn during the many hours they spend in mathematics classes? can the knowledge gap be traced to other student characteristics, or is it more strongly linked to how schools and school systems are organised and how they teach mathematics?
indiVidual student characteristics and access to mathematics content
Gender differences in opportunity to learn mathematics in most countries, mathematics and mathematics-related fields are indisputably male-dominated. there is no innate reason why girls should not be able to do as well as boys in mathematics; most empirical studies find no gender difference in standardised mathematics scores upon entry to school (Fryer and levitt, 2010). however, in most of the countries and economies that participate in Pisa, girls do worse than boys in mathematics, on average, particularly among high-performing students (oecd, 2014b). differences in perceived ability in mathematics and mathematics anxiety are major factors behind the gender gap in mathematics performance, and have been shown to predict later achievement and occupational choices (chapter 4, [bandura et al., 2001; dweck, 2007; eccles, 2007; häussler and hoffmann, 2002]).
gender disparities in mathematics achievement might also result from differences in the opportunities boys and girls have to practice their mathematics skills. Pisa data show that boys and girls have different opportunities to develop mathematics skills outside of school. For example, girls are less likely than boys to play chess, program computers, take part in mathematics competitions, or do mathematics as an extracurricular activity (oecd, 2015a).
What about opportunities to learn mathematics during school time? Figure 2.6 shows that girls were more likely than boys to report that they often heard of and/or know well most mathematics concepts, even though gender differences are not large in most countries. girls are more likely than boys to report being familiar with mathematics, particularly with concepts to which most 15-year-olds have been exposed. For example, on average across oecd

© OECD 2016 equations and inequalities: making mathematics accessible to all82
2Variations in students’ exposure to and familiarity with mathematics
countries, 75% of girls and 71% of boys reported a high level of familiarity with the concept of probability. this difference in favour of girls is over 15 percentage points in Jordan, thailand and the united arab emirates (table 2.5b). by contrast, 30% of boys and 26% of girls are familiar with the more advanced concept of complex numbers. boys’ advantage in familiarity with this concept is over 10 percentage points in germany, liechtenstein and luxembourg. these patterns of exposure reflect the broader picture of gender differences in mathematics, with boys excelling at the top and struggling at the bottom of the performance distribution.
While girls appear to be more likely than boys to have encountered pure mathematics tasks, such as solving quadratic and linear equations, gender differences in self-reported experience with applied mathematics tasks are generally small; in fact, in the large majority of countries and economies there is no difference in boys’ and girls’ exposure to such tasks (oecd, 2015a). differences in girls’ and boys’ likelihood to repeat grade or be enrolled in a vocational rather than an academic programme explain only a small part of the gender differences in students’ familiarity with mathematics concepts and with pure mathematics tasks (oecd, 2015a).
Figure 2.6 Familiarity with mathematics concepts, by genderPercentage of students who reported that they know well
or have often heard the concept, OECD average
0
10
20
30
40
50
60
70
80
Prob
abili
ty
Div
isor
Line
ar e
quat
ion
Poly
gon
Rad
ical
s
Rat
iona
l num
ber
Qua
drat
ic fu
nctio
n
Cos
ine
Con
grue
nt �
gure
Ari
thm
etic
mea
n
Vec
tors
Com
plex
num
ber
Expo
nent
ial f
unct
ion
Note: Statistically signi�cant gender differences are marked in a darker tone.Countries and economies are ranked in descending order of boys' familiarity with the concept.Source: OECD, PISA 2012 Database, Table 2.5b.
% Girls Boys
12 http://dx.doi.org/10.1787/888933377036

equations and inequalities: making mathematics accessible to all © OECD 2016 83
2Variations in students’ exposure to and familiarity with mathematics
Immigrant students’ familiarity with mathematics conceptsin most Pisa-participating countries and economies, foreign-born students score lower in mathematics than students without an immigrant background, and students who were born in the country in which they sat the Pisa test, but whose parents were born outside the country, perform somewhere between the two (oecd, 2015b). on average across oecd countries, immigrant students are 1.7 times more likely than students without an immigrant background to perform in the bottom quarter of the mathematics performance distribution (oecd, 2013a). the performance gap between the two groups of students tends to be smaller in mathematics than in reading, suggesting that language comprehension is one of the most serious hurdles for immigrant students.
immigrant students are much less familiar with the mathematics concepts that they are expected to learn in secondary school (linear equations, exponential functions, divisors and quadratic functions) than students without an immigrant background. the gap in the self-reported familiarity with mathematics concepts between foreign-born students and students without an immigrant background is particularly large (more than half a standard deviation) in italy and spain, two of the oecd countries that saw the largest increase in immigration over the past decade (table 2.7). in most countries, students who were born in the country in which they sat the Pisa test, but whose parents weren’t, reported greater familiarity with mathematics than students who were not born in the country. this suggests that late arrival might reduce the opportunities to learn mathematics content, or increase the mismatch between what was learned in the country of origin and what is learned in the destination country.
differences in the quality of instruction and in the depth and coverage of curricula across countries of origin and destination can lead to gaps in students’ readiness to learn advanced mathematics material. immigrant students, and particularly refugees, are also likely to have spent considerable time out of school as they were making their way from their country of origin to their host country. at least one in six immigrant students who attend school in an oecd country lost more than two months of school at least once in his or her life (oecd, 2015b). but apart from these differences, the high concentration of immigrant students in disadvantaged schools in host countries might explain why these students are not familiar with certain mathematics concepts. immigrant students are often concentrated in schools that suffer from high turnover rates among teachers, less effective learning time, and low-quality educational resources (oecd, 2013a). in these contexts, immigrant students are less likely to overcome their initial learning disadvantages.
Figure 2.7 shows that immigrant students tend to be concentrated in schools where students reported less exposure to mathematics concepts. on average across oecd countries, 14% of students in schools whose students reported relatively less familiarity with mathematics are immigrant students, as are 10% of the students in schools with greater average familiarity with mathematics. in greece, almost 1 in 4 students in schools where the reported familiarity with mathematics concepts is low is an immigrant student, as is only 1 in 16 students in schools with greater average familiarity with mathematics.
a strong relationship between the concentration of immigrant students in a school and the school’s average familiarity with mathematics concepts is also observed in estonia, liechtenstein,

© OECD 2016 equations and inequalities: making mathematics accessible to all84
2Variations in students’ exposure to and familiarity with mathematics
%
Schools where students are less familiar with mathematics All schoolsSchools where students are more familiar with mathematics
0 10 20 30 40 50 60 70 80 90 100
KoreaViet NamRomania
IndonesiaPoland
JapanColombia
TunisiaUruguay
Chinese TaipeiPeru
BulgariaThailand
Slovak RepublicBrazil
Shanghai-ChinaChile
TurkeyMexico
LithuaniaHungaryMalaysia
Czech RepublicFinlandIceland
ArgentinaLatvia
Costa RicaMontenegro
PortugalItaly
EstoniaSerbia
SloveniaDenmark
SpainIrelandGreece
Russian FederationNetherlands
OECD averageCroatia
United KingdomJordan
GermanySweden
FranceBelgium
KazakhstanAustria
SingaporeIsrael
United StatesAustralia
SwitzerlandNew Zealand
CanadaLiechtenstein
Hong Kong-ChinaLuxembourg
QatarUnited Arab Emirates
Macao-China
Figure 2.7
Notes: Schools where students are less (more) familiar with mathematics are defined as those where the students’ average level on the index of familiarity with mathematics is statistically significantly below (above) the average across all schools in the country/economy.The index of familiarity with mathematics is based on students’ responses to 13 items measuring students’ self-reported familiarity with mathematics concepts (e.g. exponential function, divisor, quadratic function, etc.).Countries and economies are ranked in ascending order of the percentage of students with an immigrant background in all schools.Source: OECD, PISA 2012 Database, Table 2.6.
Percentage of immigrants in schools,by school-level familiarity with mathematics
12 http://dx.doi.org/10.1787/888933377049

equations and inequalities: making mathematics accessible to all © OECD 2016 85
2Variations in students’ exposure to and familiarity with mathematics
luxembourg and switzerland. in these countries, the difference in the percentage of immigrant students between schools with less and more familiarity with mathematics is larger than 15 percentage points. these differences reflect both the level of skills among immigrant students in their respective host countries and the concentration of students with knowledge deficits who attend the same school (Figure 2.7).
teachers and school administrators face the challenge of teaching increasingly multiethnic and multilingual classes. many of them recognise that handling cultural diversity in class is difficult and requires preparation. on average across the 21 oecd countries that participated in the oecd teaching and learning international survey (talis) in 2013,4
12% of teachers reported they needed professional development for teaching in multicultural settings (oecd, 2015b). this feeling of unpreparedness was shared by 27% of teachers in italy and 33% of teachers in mexico.
many believe that mathematics is a subject free of the influence of culture, beliefs and values, and it can be taught even in the absence of a common language, because it is, in itself, a universal language. in reality, cultural beliefs about mathematics affect teaching practices and influence immigrant students’ participation in the classroom and learning (gorgorió and Planas, 2005). immigrant students might differ not only in their background knowledge, but also in the strategies they use to solve problems. For example, mathematics teachers can choose among many different representations of the algorithm of division, and this choice is often culture-specific. teachers who are not fully aware of these differences in approaches to mathematics problems or who “play down” cultural differences, arguing for general notions of ability and equity (abreu, 2005), are ill-equipped to build on their students’ knowledge and experience with mathematics.
on average across oecd countries, only 4% of students are in schools whose principal reported that ethnic heterogeneity is a serious obstacle to learning (table 2.8). not surprisingly, principals of socio-economically disadvantaged schools (that is, schools where the average socio-economic status of students is statistically significantly below that of the average school in the country/economy) are much more likely than principals of advantaged schools to report that ethnic diversity hinders learning very much. this is particularly the case in belgium, where ethnic heterogeneity is perceived as a serious obstacle to learning by principals in 20% of disadvantaged schools. these perceptions reflect the fact that immigrant students, who have, arguably, the largest learning and linguistic deficits, tend to be concentrated in disadvantaged schools. they also make it clear that disadvantaged schools need more support so they can start regarding ethnic differences as a resource for learning, rather than an obstacle to learning (oecd, 2015b).
Attendance at pre-primary education and familiarity with mathematicsVery young children have the potential to learn mathematics that is complex and sophisticated (sarama and clements, 2010), and pre-primary education can help children with their first steps towards mathematical literacy. identifying the relationship between pre-primary education and later performance in school is challenging, because attendance at pre-school is often correlated with socio-economic advantage. When disadvantaged children enter pre-school, they already lag behind advantaged children because they are likely to have had fewer play opportunities at home to explore patterns, shapes and spatial relations; compare magnitudes; and count objects.

© OECD 2016 equations and inequalities: making mathematics accessible to all86
2Variations in students’ exposure to and familiarity with mathematics
Index change-1.30 -1.00 -0.70 -0.40 -0.10 0.20 0.50 0.80 1.10
LiechtensteinEstonia
LatviaMalaysia
LuxembourgKorea
IrelandCanadaFinland
SloveniaTunisia
LithuaniaSerbia
IndonesiaMontenegro
ColombiaMexico
ThailandUnited States
PeruCosta Rica
CroatiaBrazil
KazakhstanAustralia
Russian FederationBulgaria
New ZealandViet Nam
PolandPortugalSweden
RomaniaAustriaTurkeyJordan
ArgentinaNetherlands
OECD averageUruguay
Czech RepublicChile
United KingdomQatar
United Arab EmiratesHong Kong-China
GreeceChinese Taipei
IcelandHungary
ItalyGermanyDenmark
BelgiumMacao-China
SwitzerlandSpain
Slovak RepublicSingapore
IsraelFrance
Shanghai-ChinaJapan
After accounting for students’ characteristicsBefore accounting for students’ characteristics
Figure 2.8
Notes: The index of familiarity with mathematics is based on students’ responses to 13 items measuring students’ self-reported familiarity with mathematics concepts (e.g. exponential function, divisor, quadratic function, etc.).“Students’ characteristics” include students’ gender, socio-economic status, immigrant background and language spoken at home.Statistically signi�cant values are marked in a darker tone.Countries and economies are ranked in ascending order of the change in the index of familiarity with mathematics associated with attendance at pre-primary education before accounting for students’ characteristics.Source: OECD, PISA 2012 Database, Table 2.9b.
Familiarity with mathematics and attendance at pre-primary educationChange in the index of familiarity with mathematics associated
with attendance at pre-primary education
12 http://dx.doi.org/10.1787/888933377056
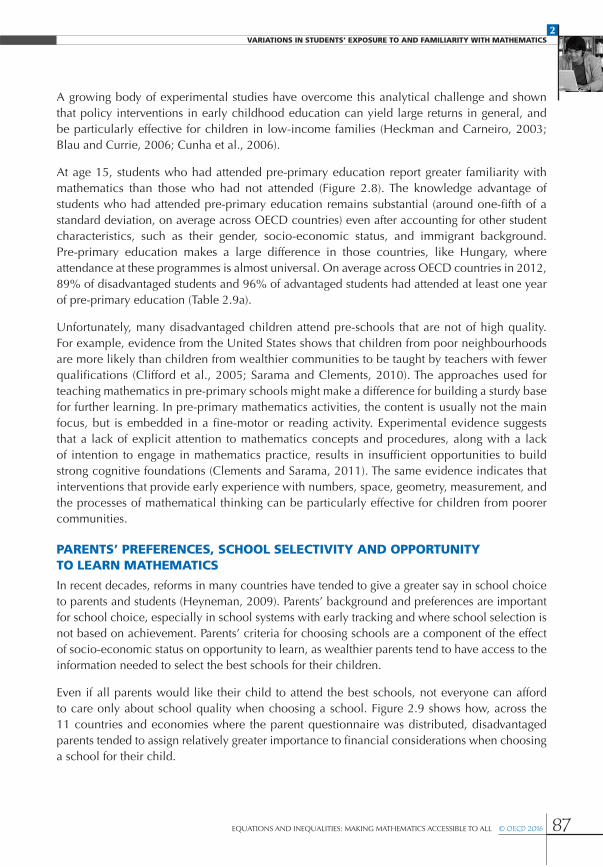
equations and inequalities: making mathematics accessible to all © OECD 2016 87
2Variations in students’ exposure to and familiarity with mathematics
a growing body of experimental studies have overcome this analytical challenge and shown that policy interventions in early childhood education can yield large returns in general, and be particularly effective for children in low-income families (heckman and carneiro, 2003; blau and currie, 2006; cunha et al., 2006).
at age 15, students who had attended pre-primary education report greater familiarity with mathematics than those who had not attended (Figure 2.8). the knowledge advantage of students who had attended pre-primary education remains substantial (around one-fifth of a standard deviation, on average across oecd countries) even after accounting for other student characteristics, such as their gender, socio-economic status, and immigrant background. Pre-primary education makes a large difference in those countries, like hungary, where attendance at these programmes is almost universal. on average across oecd countries in 2012, 89% of disadvantaged students and 96% of advantaged students had attended at least one year of pre-primary education (table 2.9a).
unfortunately, many disadvantaged children attend pre-schools that are not of high quality. For example, evidence from the united states shows that children from poor neighbourhoods are more likely than children from wealthier communities to be taught by teachers with fewer qualifications (clifford et al., 2005; sarama and clements, 2010). the approaches used for teaching mathematics in pre-primary schools might make a difference for building a sturdy base for further learning. in pre-primary mathematics activities, the content is usually not the main focus, but is embedded in a fine-motor or reading activity. experimental evidence suggests that a lack of explicit attention to mathematics concepts and procedures, along with a lack of intention to engage in mathematics practice, results in insufficient opportunities to build strong cognitive foundations (clements and sarama, 2011). the same evidence indicates that interventions that provide early experience with numbers, space, geometry, measurement, and the processes of mathematical thinking can be particularly effective for children from poorer communities.
parents’ preferences, school selectiVity and opportunity to learn mathematics
in recent decades, reforms in many countries have tended to give a greater say in school choice to parents and students (heyneman, 2009). Parents’ background and preferences are important for school choice, especially in school systems with early tracking and where school selection is not based on achievement. Parents’ criteria for choosing schools are a component of the effect of socio-economic status on opportunity to learn, as wealthier parents tend to have access to the information needed to select the best schools for their children.
even if all parents would like their child to attend the best schools, not everyone can afford to care only about school quality when choosing a school. Figure 2.9 shows how, across the 11 countries and economies where the parent questionnaire was distributed, disadvantaged parents tended to assign relatively greater importance to financial considerations when choosing a school for their child.

© OECD 2016 equations and inequalities: making mathematics accessible to all88
2Variations in students’ exposure to and familiarity with mathematics
schools’ practices of selecting students by academic achievement have a similar effect of reinforcing inequalities. schools that select students for admittance based on their academic performance tend to show better average performance; but in systems with more academically selective schools, the impact of students’ and schools’ socio-economic profile on student performance is stronger (oecd, 2013b). moreover, selective education systems are also linked with greater inequality in social outcomes later in life (burgess, dickson and macmillan, 2014).
school selectivity is also associated with more unequal opportunities to learn mathematics. as shown in Figure 2.10, in croatia, hong kong-china, Japan and the netherlands, over 90% of students attend selective schools, i.e. schools where student academic performance and/or recommendations from feeder schools are always considered for admission.
Bottom quarter (disadvantaged students) Second quarterThird quarter Top quarter (advantaged students)
Figure 2.9 Parents’ preferences for schools, by socio-economic status
Percentage of students whose parents reported that the following criteria are “veryimportant” in choosing a school for their child; average across 11 countries/economies
0
10
20
30
40
50
60
70
Expe
nses
are
low
(e.g
. tui
tion,
book
s)
The
scho
ol h
as fi
nanc
ial
aid
avai
labl
e
The
scho
ol h
as a
n ac
tive
and
plea
sant
sch
ool c
limat
e
The
acad
emic
ach
ieve
men
tsof
stu
dent
s in
the
scho
ol a
re h
igh
Ther
e is
a s
afe
scho
ol e
nviro
nmen
t
Notes: Parents’ reports on their criteria for choosing schools for their children, by students’ socio-economic status.Only the following countries and economies with available data from the parent questionnaire are shown: Belgium (Flemish community), Chile, Croatia, Germany, Hong Kong-China, Hungary, Italy, Korea, Macao-China, Mexico and Portugal. Source: OECD, PISA 2012 Database, Table 2.11.
%
PISA index of economic, social and cultural status (ESCS)
12 http://dx.doi.org/10.1787/888933377063

equations and inequalities: making mathematics accessible to all © OECD 2016 89
2Variations in students’ exposure to and familiarity with mathematics
12 http://dx.doi.org/10.1787/888933377079
Percentage of students in selective schools
Austria
Canada
Chile
DenmarkEstonia
Finland
Germany
Greece
Hungary
Iceland
Ireland
Japan
Korea
Luxembourg
Mexico
Netherlands
Poland
Portugal
Slovak Republic
Slovenia
Spain
Sweden
Switzerland
United Kingdom
United States
Argentina
Brazil
Bulgaria
Chinese Taipei
Croatia
Hong Kong-China
Indonesia
Latvia
Liechtenstein
Lithuania
Macao-China
Malaysia
Peru
Qatar
Romania
Russian Federation
Singapore
Tunisia
United Arab Emirates
Uruguay
Viet Nam
0
5
10
15
20
25
0 10 20 30 40 50 60 70 80 90 100
Perc
enta
ge o
f var
iatio
n in
fam
iliar
ity
with
mat
hem
atic
sex
plai
ned
by s
tude
nts’
and
sch
ools
’ soc
io-e
cono
mic
pro
file
OEC
D a
vera
ge
OECD average
Moreequal
Moreunequal
R² = 0.12(All countries
and economies)
Colombia
Acc
ess
to m
athe
mat
ics
Belgium
Turkey Italy
Thailand
Serbia
Montenegro
Shanghai-China
New ZealandAustralia
R² = 0.31(OECD
countries)
Jordan
Costa Rica
Kazakhstan
Czech Republic
Israel
Figure 2.10
Notes: The index of familiarity with mathematics is based on students’ responses to 13 items measuring students’ self-reported familiarity with mathematics concepts (such as exponential function, divisor, quadratic function, etc.).Selective schools are defined as those schools where student academic performance and/or recommendations of feeder schools are always considered for admission.The vertical axis reports the percentage of variation in the index of familiarity with mathematics explained by students’ and schools’ socio-economic profile. A higher percentage indicates a stronger impact of socio-economic status on students’ familiarity with mathematics.Source: OECD, PISA 2012 Database, Table 2.12.
Academic selectivity and equity in familiarity with mathematics

© OECD 2016 equations and inequalities: making mathematics accessible to all90
2Variations in students’ exposure to and familiarity with mathematics
across oecd countries, 31% of the variation in the association between students’ socio-economic status and their familiarity with mathematics concepts is explained by the percentage of students in selective schools. (across all participating countries and economies, 12% of the variation is so explained).
admission requirements based on residence make school choice less dependent on families’ socio-economic status, particularly if residential segregation is not pervasive. Figure 2.11 shows that over 70% of students in greece, Poland and the united states attend schools that always consider residence for admission. across oecd countries, a higher percentage of students in schools that always consider residence for admission is related to a weaker impact of socio-economic status on familiarity with mathematics. schools’ admission requirements account for around 28% of the between-country differences in equity in access to mathematics (defined as the within-country variation in the index of familiarity with mathematics explained by the students’ and school’s socio-economic profile). again, the relationship between admission requirements based on residence and equity in opportunities to learn mathematics is weaker when looking at all countries and economies, possibly because, in partner countries and economies, people with similar backgrounds tend to live in the same areas to a greater extent than do people in oecd countries.
equity in opportunity to learn and sorting students
most school systems aim to improve the effectiveness of teaching by sorting students into relatively homogeneous groups according to their level of achievement. Pisa gathers information on how schools and school systems group and select students, known as vertical and horizontal stratification (Figure 2.12). Vertical stratification describes the ways in which students progress through the school system. it is affected by policies governing the age at entry into the school system and grade repetition. horizontal stratification refers to differences in instruction within a grade or education level, between or within schools, according to students’ interests and performance.
Vertical and horizontal stratification are two sides of the same coin: they create opportunities to choose which type of education should be provided to which students. these decisions are based on various factors, not purely on students’ abilities. When students are young, they are still in the process of developing their academic potential. these choices are also driven by subjective beliefs: the beliefs that students and their parents hold about their education needs, and the beliefs that teachers, school administrators and regulators hold about the costs of mixing students with different abilities and levels of preparedness in the same classroom. as students navigate this complex system, they face points at which decisions must be made – actively or passively, by the students, their parents or the school – about the next move, with each move affecting the subsequent one (crosnoe and schneider, 2010; morgan, 2005).
in those school systems that sort students into different types of secondary schools or tracks (e.g. vocational or academic), a student’s socio-economic status tends to have a strong impact on which school or track is selected. other systems may have fewer of these distinct “branching points” of sorting, but differences in opportunity to learn related to socio-economic status are observed nonetheless. For example, disadvantaged students tend to select less academically challenging mathematics courses, especially when those courses are elective (csikszentmihalyi and schneider, 2000).

equations and inequalities: making mathematics accessible to all © OECD 2016 91
2Variations in students’ exposure to and familiarity with mathematics
the cumulative effect of socio-economic status on access to mathematics content throughout a student’s career can be easily illustrated through Pisa data. Pisa assesses students who are between the ages of 15 years 3 months and 16 years 2 months. in several education systems, it is thus possible to observe both students who are immediately before, and students who are
Percentage of schools that always consider residence in a particular area for admission
Australia
Austria
Belgium
Canada
Chile
DenmarkEstonia
Germany
Greece
Hungary
Israel
Japan
Korea
Mexico
Poland
Spain
Switzerland
Turkey
United States
Brazil
Colombia
Croatia
IndonesiaLatvia
Liechtenstein
Lithuania
Malaysia
Peru
Qatar
Romania
Serbia Thailand
0
5
10
15
20
25
0 10 20 30 40 50 60 70 80
Perc
enta
ge o
f var
iatio
n in
fam
iliar
ity w
ith m
athe
mat
ics
expl
aine
d by
stu
dent
s’ a
nd s
choo
ls’ s
ocio
-eco
nom
ic p
rofil
e
Moreequal
Moreunequal
Acc
ess
to m
athe
mat
ics
R2 = 0.28(OECD countries)
Slovenia
Chinese Taipei
Netherlands
Slovak Republic
Italy Portugal
RussianFederation
United Kingdom
Luxembourg
OECD averageUruguay
BulgariaSingapore
Czech Republic
MontenegroR2 = 0.09
(All countriesand economies)
United Arab EmiratesArgentina
Kazakhstan
Hong Kong-China
Macao-China
Viet Nam
Iceland
JordanTunisia
New ZealandCosta Rica
Sweden
Finland
IrelandShanghai-China
Figure 2.11
Notes: The index of familiarity with mathematics is based on students’ responses to 13 items measuring students’ self-reported familiarity with mathematics concepts (such as exponential function, divisor, quadratic function, etc.).The vertical axis reports the percentage of variation in the index of familiarity with mathematics explained by students’ and schools’ socio-economic profile. A higher percentage indicates a stronger impact of socio-economic status on students’ familiarity with mathematics.Source: OECD, PISA 2012 Database, Table 2.13.
Residency requirements and equity in familiarity with mathematics
12 http://dx.doi.org/10.1787/888933377086

© OECD 2016 equations and inequalities: making mathematics accessible to all92
2Variations in students’ exposure to and familiarity with mathematics
immediately after, one key branching point: the transition from lower secondary education (isced 2) to upper secondary education (isced 3).
as students progress from lower to upper secondary education, their familiarity with mathematics becomes more dispersed and more correlated with their socio-economic status (table 2.14). Figure 2.13 shows that the impact of students’ socio-economic status on their familiarity with mathematics concepts tends to be stronger among students in the first year of an upper secondary programme than among students in the last year of a lower secondary programme, after taking into account whether they had repeated a grade at least once in primary or secondary school.5 this result confirms that the more choices and “permanent” transitions are allowed in a school system, the stronger the impact of socio-economic status on opportunity to learn.
the solution to this dilemma cannot be a fully inflexible system, with no scope for horizontal shifts; this would limit incentives to excel at school and dramatically constrain the right to express preferences. Rather, education systems can weaken the link between socio-economic status and opportunity to learn by becoming more flexible (granting real opportunities to change tracks and courses) and more objective (making track and course placement more dependent on achievement and students’ interests rather than on parents’ preferences and background).
Vertical stratification through grade repetitiongrade repetition, a form of vertical stratification, is used in many systems to give low-performing students a second chance to master their coursework. on average across oecd countries,
Vertical stratification
Variation in the age atentry into primary school
+Grade repetition
=Variability in students’
grade levels
Horizontal stratification
Between schools orprogrammes
Number of educationaltracks
Prevalence of vocationaland pre-vocational
programmes
Age of first selectioninto tracks
Academic selectivity
Differential taskswithin classes
School transfer rates
Within schools
Ability groupingacross classes
Figure 2.12 Selecting and grouping students
Source: oecd (2013).

equations and inequalities: making mathematics accessible to all © OECD 2016 93
2Variations in students’ exposure to and familiarity with mathematics
Students in the last year of lower secondary school (ISCED 2)Students in the first year of upper secondary school (ISCED 3)
Index change-0.30 -0.20 -0.10 0.00 0.10 0.20 0.30 0.40 0.50
Hong Kong-China
TunisiaAustria
Costa Rica
EstoniaMexico
BulgariaChile
CanadaItaly
ThailandArgentina
Israel
NetherlandsKazakhstan
Portugal
SingaporeQatar
UruguaySweden
LatviaUnited Arab Emirates
Shanghai-ChinaSlovak Republic
Slovenia
IrelandGermany
Russian Federation
New ZealandChinese Taipei 0.1
Switzerland 0.1
Australia 0.1
OECD average 0.1
Czech Republic 0.1France 0.1
Colombia 0.1
United States 0.2
Indonesia 0.0Brazil 0.1
Korea 0.4Greece 0.2
Viet Nam 0.2
Macao-China 0.2
Luxembourg 0.1
Hungary
Students’ socio-economic status is more correlated with familiarity with mathematics concepts among students in the first year of an upper secondary programme than among students in the last year of a lower secondary programme
Figure 2.13
Notes: The index of familiarity with mathematics is based on students’ responses to 13 items measuring students’ self-reported familiarity with mathematics concepts (such as exponential function, divisor, quadratic function, etc.).The analysis takes into account grade repetition (i.e. whether students reported that they had repeated a grade at least once in primary, lower secondary or upper secondary school).Statistically significant values are marked in a darker tone.Only statistically signi�cant index change differences between students in upper secondary school (ISCED 3) and students in lower secondary school (ISCED 2) are shown next to the country/economy name.Countries with available data are shown.Countries and economies are ranked in ascending order of the index change of students in the last year of lower secondary school (ISCED 2).Source: OECD, PISA 2012 Database, Table 2.14.
Familiarity with mathematics and students’ socio-economicstatus, by level of education
Change in the index of familiarity with mathematics associated with a one-unit changein the PISA index of economic, social and cultural status (ESCS)
12 http://dx.doi.org/10.1787/888933377092

© OECD 2016 equations and inequalities: making mathematics accessible to all94
2Variations in students’ exposure to and familiarity with mathematics
13% of students reported that they had repeated a grade at least once in primary, lower secondary or upper secondary school (oecd, 2013c: Figure iV.2.2). grade repetition might be used not so much to help students who are lagging behind, but rather as a stigmatising, and possibly discriminatory, form of punishment for inappropriate behaviour in class (national Research council, 1999).
many studies have shown that grade repetition is not necessarily beneficial for students. in fact, it may increase the probability that students drop out, stay longer in the school system, or spend less time in the labour force (allen et al., 2009; alexander, entwisle and dauber, 2003; ikeda and garcía, 2014; Jacob and lefgren, 2009; manacorda, 2010). it is, moreover, costly to education systems, because of the expense of providing an additional year of education for a student, and to the wider society, as it delays a student’s entry into the labour market (oecd, 2011).
Previous Pisa analysis has shown that grade repetition is negatively related to equity in education. systems where more students repeat a grade tend to show a stronger impact of students’ socio-economic status on their performance (oecd, 2013c: Figure iV.1.4). at the same time, retention rates depend significantly on socio-economic factors (corman, 2003). on average across oecd countries, socio-economically disadvantaged students are 1.5 times more likely to have repeated a grade than advantaged students who perform at the same level (oecd, 2013c). immigrant students are almost twice as likely as students without an immigrant background to have repeated a grade, after accounting for both performance and socio-economic status (oecd, 2015b).
Figure 2.14 shows that, across oecd countries, grade repetition is negatively related to equity in access to mathematics. around 38% of the variation in the impact of students’ socio-economic status on their familiarity with mathematics concepts can be explained by differences in the proportion of students who had repeated a grade during their school career. (across all Pisa-participating countries and economies, the association is weaker).
the relationship between grade repetition and equity in opportunities to learn observed across oecd countries does not necessarily imply a causal link, as grade repetition might, in some systems, be a response to, rather than a cause of, differences in students’ level of preparedness related to socio-economic inequalities. but given the lack of any solid evidence that repeating a grade improves mastery of mathematics concepts, the economic and social costs of retention are hard to justify.
Horizontal stratification between and within schools and programmes Various forms of horizontal stratification have been associated with greater inequality in education, as the goal of differentiating curricula by students’ achievement level often translates into segregating students by their socio-economic status (hanushek and Woessmann, 2010; van de Werfhorst and mijs, 2010; see also box 2.2).
Selection through between-school trackingalthough tracking is widely used – either to sort students into vocational or academic programmes or to base entry into a school on achievement – there is little support for the idea that it positively affects learning (michaelowa and bourdon, 2006). in fact, there is considerable international

equations and inequalities: making mathematics accessible to all © OECD 2016 95
2Variations in students’ exposure to and familiarity with mathematics
Percentage of students who had repeated a grade
0
2
3
1
4
5
6
7
8
10
9
0 5 10 15 20 25 30 35 40 45
Perc
enta
ge o
f var
iatio
n in
fam
iliar
ity
with
mat
hem
atic
sex
plai
ned
by s
tude
nts’
soc
io-e
cono
mic
sta
tus
Moreequal
Moreunequal
Acc
ess
to m
ath
emat
ics
Figure 2.14
Notes: The index of familiarity with mathematics is based on students’ responses to 13 items measuring students’ self-reported familiarity with mathematics concepts (such as exponential function, divisor, quadratic function, etc.).The vertical axis reports the percentage of variation in the index of familiarity with mathematics explained by the students’ socio-economic status. A higher percentage indicates as a stronger impact of socio-economic status on students’ familiarity with mathematics.Source: OECD, PISA 2012 Database, Table 2.15.
Grade repetition and equity in familiarity with mathematics
Argentina
Bulgaria
Chinese Taipei
Colombia
Costa Rica
Croatia
Hong Kong-China
Indonesia
Kazakhstan
Liechtenstein
Peru
Serbia
Shanghai-China
Singapore
Tunisia
Australia
Chile
Finland
France
Hungary
Iceland
Ireland
Israel
Italy
Korea
Japan
Netherlands
Portugal
Slovenia
Spain
Sweden1 2
3
1. Montenegro
2. United Kingdom
3.Russian Federation
OECD average
R² = 0.38(OECD countries)
Belgium
Macao-ChinaMexico
Turkey
OEC
D a
vera
ge
Switzerland
GermanyUnited States
Slovak Republic
Austria
Romania
PolandThailand
New Zealand
Czech Republic
Latvia
Estonia
Lithuania
Canada
Greece
Viet NamDenmark
Qatar
United Arab Emirates
R² = 0.09(All countries
and economies)
Luxembourg
Brazil
Uruguay
Jordan
12 http://dx.doi.org/10.1787/888933377108

© OECD 2016 equations and inequalities: making mathematics accessible to all96
2Variations in students’ exposure to and familiarity with mathematics
evidence that tracking, especially early tracking, is associated with inequality in education, both in student performance (hanushek and Woessmann, 2006) and in the extent to which individual student achievement and other life outcomes, such as enrolment in tertiary education and earnings in the labour market, reflect family background (ammermüller, 2005; brunello and checchi, 2007; Ferreira and gignoux, 2014; horn, 2009; schütz, ursprung and Woessmann, 2008; Woessmann et al., 2009). Previous Pisa analysis has also shown a negative association between early tracking and equity in education at the system level (oecd, 2013c).
similarly, Pisa 2012 data show that early tracking is related to inequalities in opportunities to learn mathematics. the relationship between the age at which a student is tracked and equity in access to mathematics is strong: on average across oecd countries, 54% of the variation in the impact of students’ and schools’ socio-economic profile on students’ familiarity with mathematics is explained by system-level differences in the age at which students are first sorted into academic or vocational programmes (Figure 2.15). across all participating countries and economies, the relationship is somewhat weaker, but still 35% of the variation in equity in access to mathematics is explained by differences in the age at which students are first tracked. in countries like austria and germany that start tracking students very early, heterogeneity in overall opportunity to learn is also quite large (as measured by the total variation in familiarity with mathematics within the country, Figure 2.1).
box 2.2. trends in between-school and within-school selection
both between-school and within-school selection aim to differentiate curricula by students’ achievement levels and are widely practiced in oecd countries. in several countries, within-schools ability grouping has increased with the decline or the postponement of between-school tracking.
since the 1960s a number of developed countries have started reforming their systems by delaying the age of streaming into schools with different orientations or by creating comprehensive schools, including Finland, France, germany, norway, Poland, spain, sweden, the united kingdom and the united states (ariga et al., 2005; heidenheimer, 1974; lucas, 1999; Pischke and manning, 2006; Pekkarinen, uusitalo and kerr, 2009). at the same time, ability grouping or other forms of within-school tracking have become more common in some of the same countries, such as France, germany, the united kingdom and the united states (duru-bellat and suchaut, 2005; Feinstein and symons, 1999; lucas, 1999; kämmerer, köller and trautwein, 2002).
internationally, countries with the highest rates of course-by-course tracking are anglophone countries (australia, canada, new Zealand, the united kingdom and the united states), the countries with moderate rates are nordic and other comprehensive systems (iceland, norway, Poland, spain and sweden), and the countries with low rates are denmark and Finland, as well countries practicing primarily academic/vocational streaming (austria, germany, greece and Japan).
Source:
chmielewski (2014).
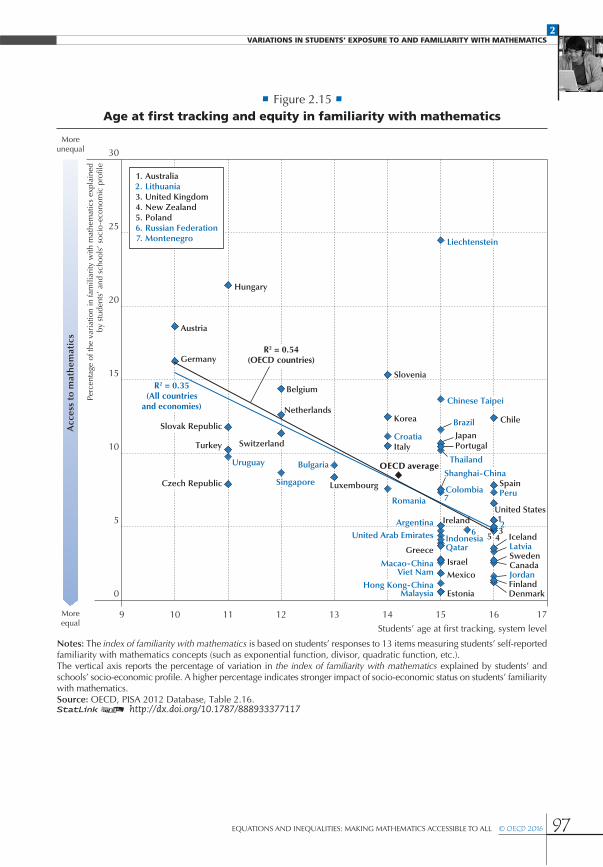
equations and inequalities: making mathematics accessible to all © OECD 2016 97
2Variations in students’ exposure to and familiarity with mathematics
Students’ age at �rst tracking, system level
0
5
10
15
20
30
25
9 10 11 12 13 14 15 16 17
Perc
enta
ge o
f the
var
iatio
n in
fam
iliar
ity w
ith m
athe
mat
ics
expl
aine
dby
stu
dent
s’ a
nd s
choo
ls’ s
ocio
-eco
nom
ic p
rofil
e
Moreequal
Moreunequal
Acc
ess
to m
ath
emat
ics
Austria
Belgium
Canada
Chile
DenmarkEstoniaFinland
Germany
Greece
Hungary
Iceland
Ireland
Israel
ItalyJapan
Korea
Mexico
Netherlands
Portugal
Slovenia
Spain
Sweden
Turkey
United States
Argentina
Brazil
Bulgaria
Colombia
Croatia
Indonesia
Jordan
Latvia
7 Peru
Qatar
Romania
ThailandUruguay
1
456
R2 = 0.54(OECD countries)
Chinese Taipei
Shanghai-ChinaLuxembourgSingapore
OECD average
R2 = 0.35(All countries
and economies)
Switzerland
Liechtenstein
1.2.3.4.5.6.7.
AustraliaLithuaniaUnited KingdomNew ZealandPolandRussian FederationMontenegro
Slovak Republic
Czech Republic
23United Arab Emirates
Hong Kong-China
Macao-China
Malaysia
Viet Nam
Figure 2.15
Notes: The index of familiarity with mathematics is based on students’ responses to 13 items measuring students’ self-reported familiarity with mathematics concepts (such as exponential function, divisor, quadratic function, etc.).The vertical axis reports the percentage of variation in the index of familiarity with mathematics explained by students’ and schools’ socio-economic profile. A higher percentage indicates stronger impact of socio-economic status on students’ familiarity with mathematics.Source: OECD, PISA 2012 Database, Table 2.16.
Age at first tracking and equity in familiarity with mathematics
12 http://dx.doi.org/10.1787/888933377117

© OECD 2016 equations and inequalities: making mathematics accessible to all98
2Variations in students’ exposure to and familiarity with mathematics
Odds ratio0.00 1.00 2.00 3.00 4.00 5.00 6.00
Percentage of students enrolledin a vocational school
1
70141
20537422446650
217131435
324418
152
6943
2111
113815311520
8131120
92525
3
IrelandCroatia
HungarySpainKorea
SloveniaSerbia
NetherlandsBelgium
MontenegroItaly
Macao-ChinaPortugal
GreeceOECD averageChinese Taipei
IsraelJapan
BulgariaSlovak Republic
FranceGermany
AustriaRussian Federation
ChileShanghai-China
UruguayUnited Kingdom
AustraliaTurkey
ArgentinaCzech Republic
LuxembourgThailand
KazakhstanMalaysia
SwitzerlandIndonesia
Costa RicaMexico
ColombiaUnited Arab Emirates
Being socio-economically disadvantaged
Having less familiarity with mathematics
Students enrolled in avocational school aremore likely to besocio-economicallydisadvantaged or to have less familiaritywith mathematics
Figure 2.16 Concentration in vocational schools of disadvantaged students and students
with less familiarity with mathematicsRelationship between enrolment in vocational schools and likelihood of having less
familiarity with mathematics and/or being socio-economically disadvantaged
How to read the chart: An odds ratio of 2 for socio-economic status means that a student enrolled in a vocational school is twice as likely to be disadvantaged as a student who is not enrolled in a vocational school. Similarly, an odds ratio of 0.5 for socio-economic status means that a student enrolled in a vocational school is 50% less likely to be disadvantaged than a student who is not enrolled in a vocational school.Notes: The index of familiarity with mathematics is based on students’ responses to 13 items measuring students’ self-reported familiarity with mathematics concepts (e.g. exponential function, divisor, quadratic function, etc.).Students with less familiarity with mathematics are students in the bottom quartile of the index of familiarity with mathematics. Disadvantaged students are students in the bottom fourth of the PISA index of economic, social and cultural status (ESCS).Students enrolled in a modular programme are not considered to be enrolled in a vocational school. Statistically signi�cant values are marked in a darker tone.Countries and economies are ranked in descending order of the odds ratio for disadvantaged socio-economic status.Source: OECD, PISA 2012 Database, Table 2.17. 12 http://dx.doi.org/10.1787/888933377124

equations and inequalities: making mathematics accessible to all © OECD 2016 99
2Variations in students’ exposure to and familiarity with mathematics
the age at which a student is first tracked matters because younger students are more dependent upon their parents, and socio-economically advantaged parents might be in a better position to promote their children’s best interests. as students grow older, more information about their abilities is available for educators to make objective evaluations, and for students to know what type of education better suits their preferences and career expectations.
the effect of tracking on equity of opportunity to learn is also related to the share and composition of students attending different types of schools. almost one in seven students, on average across oecd countries, and more than one in two students in austria, croatia, montenegro, serbia and slovenia, attend vocational schools (table 2.17).
Figure 2.16 shows that, in most countries, students attending a vocational school are disproportionately more likely to be disadvantaged and to have less familiarity with mathematics than students attending an academic school. students in croatia, hungary, ireland, korea, the netherlands, serbia, slovenia and spain who attend vocational schools are more than three times as likely to come from a disadvantaged background as students attending academic schools. moreover, students in austria, belgium, croatia, germany, hungary and israel who attend a vocational school are over three times as likely to have less familiarity with mathematics as students who attend an academic school.
Ability grouping in different courses within the same schoolgrouping students by ability within schools is another way of addressing students’ differences in readiness to learn. in several countries, within-school ability grouping has increased with the decline or postponement of between-school tracking (box 2.2).
Pisa 2012 asked school principals to indicate the extent to which differences in students’ abilities within classes hinder learning. Figure 2.17 shows that disruption to learning related to differences in students’ abilities was reported more frequently by principals in disadvantaged schools than by those in advantaged schools. more than 30% of students in chile, croatia, greece, thailand and uruguay attend disadvantaged schools whose principals reported that differences in students’ abilities seriously hinder learning.
ability grouping is relatively widespread across oecd countries, with more than 70% of students attending schools whose principal reported that students are grouped by ability for mathematics classes (Figure 2.18a). over 95% of students in australia, ireland, israel, kazakhstan, malaysia, new Zealand, the Russian Federation, singapore and the united kingdom attend such schools.
the effect of ability grouping within schools on achievement is unclear. While most studies find positive effects on the performance of high-achieving students, the effects among low-achieving students are open to debate (argys, Rees and brewer, 1996; betts and shkolnik, 2000; collins and gan, 2013; Figlio and Page, 2002; Zimmer, 2003). moreover, ability grouping seems to reinforce socio-economic inequalities, as does between-school tracking: socio-economically disadvantaged students are disproportionally represented in less-able groups (braddock and dawkins, 1993; oakes, 2005). indeed, in a study of 20 education systems, chmielewski (2014) finds that

© OECD 2016 equations and inequalities: making mathematics accessible to all100
2Variations in students’ exposure to and familiarity with mathematics
0 10 20 30
Figure 2.17 Effects of ability differences on the learning environmentPercentage of students in schools whose principal reported that ability
differences within classes hinder learning a lot
Notes: Disadvantaged (advantaged) schools are those schools whose mean PISA index of economic, social and cultural status (ESCS) is statistically lower (higher) than the mean index across all schools in the country/economy.Only statistically signi�cant percentage-point differences between advantaged and disadvantaged schools are shown next to the country/economy name.Countries and economies are ranked in descending order of the percentage of students in disadvantaged schools whose principal reported that ability differences within classes hinder learning a lot.Source: OECD, PISA 2012 Database, Table 2.18.
All schools Advantaged schoolsDisadvantaged schools
40 %
-16
-19-23-15-15
-20
-12
-15
-4
-6
-6
-7
-2
-1
5
-6
Uruguay
France
ChileCroatiaGreece
ThailandJapan
HungaryPoland
IndonesiaMalaysiaSweden
ColombiaAustria
Shanghai-ChinaTunisiaTurkey
BelgiumJordanQatar
Viet NamCosta Rica
Hong Kong-ChinaSpain
SloveniaChinese Taipei
FinlandIceland
Russian FederationOECD average
LatviaSwitzerland
ArgentinaEstonia
Slovak RepublicBrazil
NorwaySingapore
PortugalGermany
United Arab EmiratesLithuania
IsraelIreland
United StatesBulgaria
New ZealandItaly
RomaniaPeru
AustraliaNetherlands
MexicoMacao-China
CanadaKazakhstan
MontenegroKorea
Czech RepublicDenmark
SerbiaUnited Kingdom
Luxembourg
AlbaniaLiechtenstein
12 http://dx.doi.org/10.1787/888933377131

equations and inequalities: making mathematics accessible to all © OECD 2016 101
2Variations in students’ exposure to and familiarity with mathematics
the relationship between students’ socio-economic status and mathematics achievement is even stronger with ability grouping than with tracking between vocational and academic schools.
data from Pisa 2003 show that the type of mathematics classes that students attend as part of their sorting by ability is also related to their socio-economic status. out of nine countries with available data, socio-economically advantaged students in australia, germany, greece, hungary, iceland, korea, the united kingdom and the united states were more likely to report that they were attending advanced mathematics classes than disadvantaged students (table 2.20a). after taking students’ mathematics performance into account, advantaged students in hungary, korea and the united states were more than 50% more likely to take advanced mathematics than disadvantaged students; advantaged students in greece and iceland were more than twice as likely to take advanced mathematics as disadvantaged students after accounting for mathematics performance (table 2.20b).
Figure 2.18a shows that, on average across oecd countries, ability grouping is more prevalent in disadvantaged than advantaged schools. in austria, chile, croatia, germany, iceland, luxembourg, mexico, Portugal and switzerland the difference in the percentage of students attending disadvantaged and advantaged schools that group students by ability is at least 10 percentage points.
moreover, Figure 2.18b shows that, on average across oecd countries, the practice of grouping students by ability is associated with less familiarity with mathematics. in austria and switzerland, students in schools that practice ability grouping in all or some classes are less familiar with mathematics by more than 40% of a standard deviation compared to students in schools that do not group students by ability.
it is unclear, however, whether ability grouping is segregating low-achieving students even further or whether it reflects the schools’ level of academic selectivity and is actually used to provide greater assistance to low-performing students in disadvantaged schools. Figure 2.18b also shows that, when comparing students of the same gender and socio-economic status who attend schools with similar socio-economic profiles, the negative association between ability grouping and familiarity becomes weaker or not statistically significant. these results suggest that the relationship between ability grouping and familiarity with mathematics is negative largely because ability grouping is used more often in disadvantaged schools, and because it may be used more as a way to give students who have less familiarity with mathematics more practice, rather than as a way to provide advanced education to gifted students.
Teaching heterogeneous classesteachers are generally committed to providing equal education opportunities; but adapting instruction to each student’s skills and needs while advancing learning for all students in the classroom is no small feat. the simplest strategy available to teachers is to use easier mathematics tasks whenever they teach weaker students. according to principals’ reports, in most countries and economies at least half of all students attend schools where teachers believe that it is

© OECD 2016 equations and inequalities: making mathematics accessible to all102
2Variations in students’ exposure to and familiarity with mathematics
0 10 20 30 40 50 60 70 80 90
Disadvantaged schools All schools Advantaged schools
100 %
GreeceAustria
Czech RepublicNorwaySlovenia
FrancePoland
LiechtensteinCosta Rica
PortugalJapanChile
FinlandMacao-ChinaLuxembourg
GermanySlovak Republic
MexicoOECD average
IndonesiaTurkey
DenmarkItaly
ThailandHungaryBelgium
Chinese TaipeiBrazil
JordanLatvia
TunisiaLithuaniaSweden
SwitzerlandArgentina
United Arab EmiratesPeru
IcelandEstoniaKorea
RomaniaHong Kong-China
UruguayQatar
CroatiaSpain
CanadaBulgaria
MontenegroViet Nam
NetherlandsColombia
United StatesShanghai-China
SerbiaMalaysia
Russian FederationSingapore
KazakhstanIsrael
AustraliaNew Zealand
Ireland
-63
8
-45
-29
14-41-35
-12-9
-36
-1113
-4-13
-4
-2
United Kingdom
Figure 2.18a Prevalence of ability grouping, by schools’ socio-economic profile
Percentage of students in schools whose principal reported that students are groupedby ability for mathematics classes
Notes: Disadvantaged (advantaged) schools are those schools whose mean PISA index of economic, social and cultural status (ESCS) is statistically lower (higher) than the mean index across all schools in the country/economy.Only statistically signi�cant percentage-point differences between advantaged and disadvantaged schools are shown next to the country/economy name.Countries and economies are ranked in ascending order of the percentage of students in all schools.Source: OECD, PISA 2012 Database, Table 2.19a. 12 http://dx.doi.org/10.1787/888933377148

equations and inequalities: making mathematics accessible to all © OECD 2016 103
2Variations in students’ exposure to and familiarity with mathematics
Change in the index of familiarity with mathematics associated with ability grouping-0.80 -0.60 -0.40 -0.20 0.00 0.20 0.40 0.60
AustriaSwitzerland
GermanyTurkey
Hong Kong-ChinaCroatia
PortugalMacao-China
GreeceFrance
ChileArgentina
LuxembourgIceland
MontenegroLatvia
AustraliaJordan
Russian FederationQatarSerbia
KazakhstanLithuania
ItalySingapore
OECD averageNetherlands
TunisiaBelgiumMexico
United Arab EmiratesUruguay
Czech RepublicCanadaEstonia
BrazilIndonesiaRomania
JapanSlovak Republic
FinlandSpain
DenmarkMalaysia
PeruSweden
Costa RicaSlovenia
ColombiaPoland
HungaryChinese Taipei
BulgariaThailand
Viet NamKorea
Shanghai-ChinaUnited States
Before accounting for gender, students’ socio-economic status, and schools’ socio-economic profileAfter accounting for gender, students’ socio-economic status, and schools’ socio-economic profile
Figure 2.18b Ability grouping and students’ familiarity with mathematics
Change in students’ familiarity with mathematics associated with theschool’s practice of grouping students by ability in some or all classes
Notes: The index of familiarity with mathematics is based on students’ responses to 13 items measuring students’ self-reported familiarity with mathematics concepts (e.g. exponential function, divisor, quadratic function, etc.).For each student, the school’s average familiarity with mathematics is calculated as the average value on the index for all the other students in the school.Statistically signi�cant values are marked in a darker tone.Countries and economies are ranked in ascending order of the change in familiarity with mathematics associated with the school’s practice of grouping students by ability, before accounting for gender, students’ socio-economic status, and schools’ socio-economic profile.Source: OECD PISA 2012 Database, Table 2.19b. 12 http://dx.doi.org/10.1787/888933377150

© OECD 2016 equations and inequalities: making mathematics accessible to all104
2Variations in students’ exposure to and familiarity with mathematics
best to adapt academic standards to the students’ levels and needs (on average across oecd countries, about 70% of students attend such schools [Figure 2.19]). differences in teaching cultures and heterogeneity within classes probably explain why teachers in montenegro, the Russian Federation and most asian economies are more open to the idea of adapting academic standards than teachers in austria, germany and luxembourg. but teachers’ beliefs are also shaped by the environment in which they work, and in the large majority of countries, teachers in disadvantaged schools are much more willing to adjust their academic standards than teachers in advantaged schools.
another way of teaching students of different abilities within the same class is to assign them different tasks. about 30% of students, on average across oecd countries, reported that teachers in their school differentiate between students when assigning tasks (Figure 2.20). again, task differentiation is more frequently practiced in disadvantaged than advantaged schools. in austria, bulgaria, germany, the netherlands, Portugal, Romania, serbia, the slovak Republic, slovenia and the united arab emirates, the difference between students in advantaged and disadvantaged schools who reported that their mathematics teacher differentiates tasks according to students’ abilities is at least 20 percentage points (Figure 2.20). assigning different tasks based on students’ abilities can better address the needs of low performers, but might, at the same time, prevent low-achieving students from having the same opportunities to learn as higher-achieving students.
Selection through transfersa much more radical way of separating students by ability consists in transferring low-achieving students to other schools (oecd, 2013c: Figure iV.2.6). this highly segregating practice is used more frequently than what might be expected. over 70% of students in austria, macao-china, slovenia and chinese taipei attend schools whose principals reported that they would transfer low-achieving students to another school (table 2.23). the objectives of this policy might be either to preserve the learning environment of schools already struggling with low performers and poor results on standardised tests, or to assign students with special needs to specially equipped schools.
at the system level, the extent to which students’ and schools’ socio-economic profile affects familiarity with mathematics is positively related to the practice of transferring low-achieving students. as shown in Figure 2.21, across oecd countries, 42% of the variation in the impact of students’ and schools’ socio-economic status on students’ familiarity with mathematics concepts is explained by the percentage of students in schools that are likely to transfer low-performing students (across all participating countries and economies, 16% of the variation is so explained). this association is fairly easy to explain: young people who are pushed out of a school (or strongly encouraged to leave) are disproportionately poor. the fewer learning opportunities and the social stigma that come from a forced transfer to another school can lead to early dropout and social exclusion (books, 2010).

equations and inequalities: making mathematics accessible to all © OECD 2016 105
2Variations in students’ exposure to and familiarity with mathematics
0 10 20 30 40 706050 80 90
All schools Advantaged schoolsDisadvantaged schools
100 %
-8-38
-21
-31
-30
-25
-9
-22-22
-17-22
-1016
-23-17-13
-15
-5-13
-13
-15
-12
-8
-11
-12
LuxembourgGermany
AustriaBelgium
FranceSwitzerland
CanadaCzech Republic
ItalyUruguaySlovenia
ChileAustralia
OECD averageSlovak Republic
PortugalUnited States
ArgentinaNew Zealand
GreeceUnited Kingdom
JapanSpain
HungaryBrazil
Costa RicaNetherlands
IrelandMexicoIcelandCroatia
PeruSingapore
FinlandColombia
TunisiaKazakhstan
SwedenQatarIsrael
TurkeySerbia
Hong Kong-ChinaLatvia
Viet NamLithuania
EstoniaShanghai-China
JordanDenmark
BulgariaRomania
United Arab EmiratesIndonesia
Chinese TaipeiMacao-China
ThailandKorea
PolandMontenegro
MalaysiaRussian Federation
Figure 2.19 Teachers’ beliefs about the need to adapt academic standards to ability
Percentage of students in schools where teachers reported that they believethat it is best to adapt academic standards to the students’ levels and needs
Notes: The figure reports the percentage of students in schools whose principal agreed or strongly agreed that there is consensus among mathematics teachers that it is best to adapt academic standards to students’ levels and needs.Disadvantaged (advantaged) schools are those schools whose mean PISA index of economic, social and cultural status (ESCS) is statistically lower (higher) than the mean index across all schools in the country/economy.Only statistically signi�cant percentage-point differences between advantaged and disadvantaged schools are shown next to the country/economy name.Countries and economies are ranked in ascending order of the percentage of students in all schools whose principal agreed or strongly agreed that there is consensus among mathematics teachers that it is best to adapt academic standards to students’ levels and needs.Source: OECD, PISA 2012 Database, Table 2.21. 12 http://dx.doi.org/10.1787/888933377168

© OECD 2016 equations and inequalities: making mathematics accessible to all106
2Variations in students’ exposure to and familiarity with mathematics
0 10 20 30 40 706050
All schools Advantaged schoolsDisadvantaged schools
80 %
FranceItaly
Hong Kong-ChinaKorea
IrelandGreece
Shanghai-ChinaUnited States
BelgiumAustria
Chinese TaipeiHungaryCanada
SpainLuxembourg
UruguayMalaysia
CroatiaGermanySlovenia
NetherlandsChile
Macao-ChinaCzech Republic
Viet NamAustralia
ArgentinaPoland
SingaporePeru
Costa RicaDenmark
OECD averageMexico
IndonesiaJapan
EstoniaSlovak RepublicUnited Kingdom
SwitzerlandLiechtenstein
BrazilColombia
PortugalNew Zealand
TurkeyRomania
LatviaIsrael
LithuaniaSerbia
TunisiaIceland
MontenegroThailandBulgaria
United Arab EmiratesQatar
FinlandJordan
AlbaniaSweden
KazakhstanRussian Federation
-17
-6-17-17-9
-8-24-14-7-4-4-9
-10-10-17-23-22-20-12
-17-9-6
-11-14
-11-7-8
-31
-16
-15
-23-13-13-21
-18-18-24-15
-14-14-25-22-13
-13
Figure 2.20 Teachers assigning different tasks to students based
on ability, by schools’ socio-economic profilePercentage of students who reported that teachers in their school
differentiate between students when assigning tasks
Notes: Task differentiation by teachers is measured on the basis of students’ self-reports.Disadvantaged (advantaged) schools are defined as those schools whose average level on the PISA index of economic, social and cultural status (ESCS) is statistically significantly below (above) the average across all schools in the country/economy.Only statistically signi�cant percentage-point differences between advantaged and disadvantaged schools are shown next to the country/economy name.Countries and economies are ranked in ascending order of the percentage of students in all schools where teachers differentiate between students when giving tasks.Source: OECD, PISA 2012 Database, Table 2.22. 12 http://dx.doi.org/10.1787/888933377173
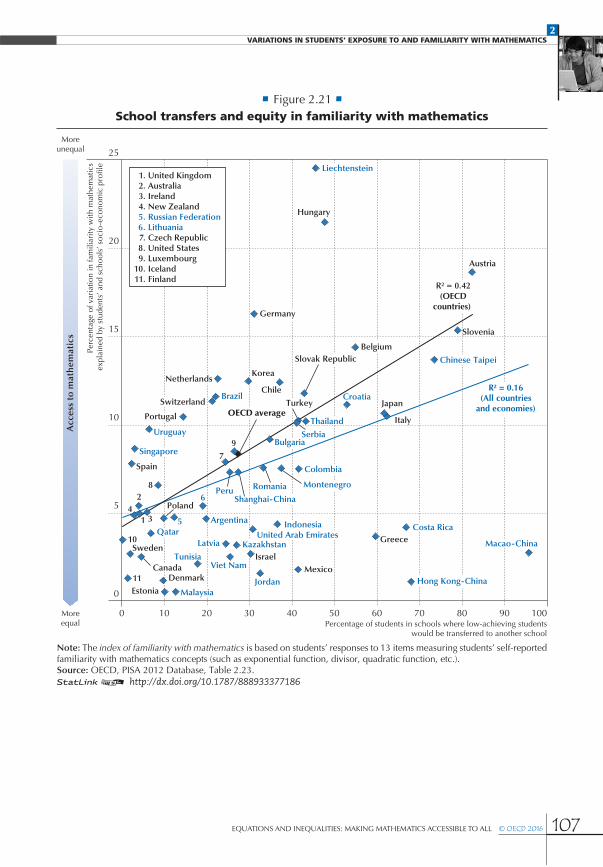
equations and inequalities: making mathematics accessible to all © OECD 2016 107
2Variations in students’ exposure to and familiarity with mathematics
Percentage of students in schools where low-achieving studentswould be transferred to another school
0
5
5
10
15
20
25
0 10 20 30 40 50 60 70 80 90 100
Perc
enta
ge o
f var
iatio
n in
fam
iliar
ity
with
mat
hem
atic
s e
xpla
ined
by
stud
ents
’ and
sch
ools
’ soc
io-e
cono
mic
pro
file
Moreequal
Moreunequal
Acc
ess
to m
ath
emat
ics
2
Austria
Chile
7
Denmark
Estonia11
Greece
Hungary
10
3
Israel
Italy
Japan
Korea
Mexico
4 Poland
Slovenia
Spain
Sweden
1 Argentina
Brazil Croatia
Jordan
6Peru Romania
Serbia
TunisiaViet Nam
Liechtenstein
Costa RicaIndonesia
Netherlands
Switzerland
Hong Kong-China
Qatar
1.2.3.4.5.6.7.8.9.
10.11.
United KingdomAustraliaIrelandNew ZealandRussian FederationLithuaniaCzech RepublicUnited StatesLuxembourgIcelandFinland
Macao-China
Colombia
Montenegro
Portugal
9
OECD averageTurkey
Shanghai-China
8
R² = 0.42(OECD
countries)
R² = 0.16(All countries
and economies)
Singapore
Uruguay
Chinese Taipei
BelgiumSlovak Republic
Germany
Thailand
Latvia Kazakhstan
Canada
Bulgaria
United Arab Emirates
Malaysia
Figure 2.21
Note: The index of familiarity with mathematics is based on students’ responses to 13 items measuring students’ self-reported familiarity with mathematics concepts (such as exponential function, divisor, quadratic function, etc.).Source: OECD, PISA 2012 Database, Table 2.23.
School transfers and equity in familiarity with mathematics
12 http://dx.doi.org/10.1787/888933377186

© OECD 2016 equations and inequalities: making mathematics accessible to all108
2Variations in students’ exposure to and familiarity with mathematics
how equity in opportunity to learn is related to teaching resources and practices
teachers can influence equity in access to mathematics content not only by grouping students of similar ability and by assigning different tasks to students, based on their ability, but also more directly: through the quantity and quality of the tasks, and by engaging in certain teaching practices. effective teaching is the most important in-school factor influencing strong academic performance (chetty, Friedman and Rockoff, 2014; Rivkin, hanushek and kain, 2005). low-achieving students and disadvantaged students stand to gain the most from highly qualified teachers (gamoran, 1993; nye, konstantopoulos and hedges, 2004), but they are often paired with the least-skilled teachers (lankford, loeb and Wyckoff, 2002).
historically, schools serving poor communities face staffing problems and high rates of teacher turnover. some teachers might quit because they prefer to work with more advantaged students (hanushek, kain and Rivkin, 2004), but most teachers in disadvantaged schools leave because of disciplinary problems, weaker collegial relationships, poor leadership, high student turnover, and general safety concerns that are more pervasive in disadvantaged schools (gregory, skiba and noguera, 2010). students in disadvantaged schools are thus more likely than their peers in wealthier schools to experience inconsistent staffing from one year to the next and to be taught by teachers who are new to their school and, often, new to the profession (simon and Johnson, 2015).
Figure 2.22a shows that most countries allocate an equal or larger number of teachers per student in disadvantaged schools than in advantaged schools, even though differences tend to be small. on average across oecd countries, there is one additional student per teacher in advantaged schools than in disadvantaged schools. the main exceptions are brazil and turkey, where there are about 7-8 more students per teacher in disadvantaged than in advantaged schools.
even though disadvantaged schools have a (slightly) lower student-to-teacher ratio, mathematics teachers in disadvantaged schools tend to be less qualified. Figure 2.22b shows that the percentage of students in schools whose teachers majored in mathematics is generally higher in advantaged schools than in disadvantaged schools. on average across oecd countries, the share of qualified mathematics teachers in advantaged schools is eight percentage points larger than in disadvantaged schools, potentially exacerbating inequalities in opportunities to learn. by contrast, in Finland, iceland, macao-china, spain and the united arab emirates, disadvantaged schools have a higher percentage of qualified teachers than advantaged schools.
teaching practices as well as teachers’ qualifications affect students’ opportunity to learn. Pisa asked students how often their mathematics teachers engage in cognitive-activation strategies, that is instructional practices involving challenging tasks, the activation of prior knowledge and higher-level thinking (lipowsky et al., 2009). in particular, Pisa asked students how often their mathematics teachers adopt the following practices:
ask questions that make students reflect on the problem
give problems that require students to think for an extended time

equations and inequalities: making mathematics accessible to all © OECD 2016 109
2Variations in students’ exposure to and familiarity with mathematics
0 5 10 15 20 3025
All schools Advantaged schoolsDisadvantaged schools
35Ratio
2.70.31.64.61.02.21.53.61.0
1.82.52.2
3.6
2.83.1
2.3-3.8
2.63.01.8
1.3
3.53.32.5
2.4
-2.12.32.2
-1.2-3.12.64.0
-6.73.1
-7.63.1
LiechtensteinPortugal
LuxembourgGreece
BelgiumPolandLatvia
KazakhstanItaly
NorwayArgentina
IcelandSloveniaFinland
IsraelAustriaEstonia
LithuaniaSerbiaJapan
FranceSwitzerland
DenmarkShanghai-China
United Arab EmiratesTunisia
HungarySweden
SpainCroatia
Czech RepublicAustralia
OECD averageSlovak Republic
MalaysiaQatar
Russian FederationIreland
SingaporeBulgaria
United KingdomGermany
New ZealandHong Kong-China
UruguayCanada
MontenegroMacao-China
RomaniaKorea
NetherlandsIndonesia
JordanChinese Taipei
United StatesTurkey
PeruViet NamThailand
Costa RicaChile
ColombiaBrazil
Mexico
Figure 2.22a Number of students per teacher, by schools’ socio-economic profile
Notes: Disadvantaged (advantaged) schools are defined as those schools whose average level on the PISA index of economic, social and cultural status (ESCS) is statistically significantly below (above) the average across all schools in the country/economy.Only statistically signi�cant differences in the ratio between advantaged and disadvantaged schools are shown next to the country/economy name.Countries and economies are ranked in ascending order of the number of students per teacher in all schools.Source: OECD, PISA 2012 Database, Table 2.24. 12 http://dx.doi.org/10.1787/888933377197

© OECD 2016 equations and inequalities: making mathematics accessible to all110
2Variations in students’ exposure to and familiarity with mathematics
0 10 20 30 40 70 80 906050
All schools Advantaged schoolsDisadvantaged schools
100 %
4-2
28171417
345
47-3929
826
-36
2110
-19
19
514
19
202612
11
24
12-14
UruguayIceland
ArgentinaTurkey
NetherlandsColombia
BelgiumMalaysia
PeruMexico
SwitzerlandQatarLatvia
LiechtensteinSlovak Republic
AustriaSpain
NorwayChile
Hong Kong-ChinaNew Zealand
OECD averageGermany
Macao-ChinaSweden
IsraelViet NamAustralia
FinlandCanada
United StatesMontenegro
IrelandSingapore
ItalyCosta Rica
SloveniaUnited Kingdom
BrazilDenmark
KoreaEstonia
PortugalChinese Taipei
LuxembourgIndonesiaLithuaniaThailand
CroatiaCzech Republic
FranceSerbia
HungaryShanghai-China
United Arab EmiratesBulgaria
PolandTunisia
KazakhstanRussian Federation
JordanRomania
Greece
Figure 2.22b Percentage of qualified mathematics teachers,
by schools’ socio-economic profilePercentage of students in schools whose principal reported
that mathematics teachers are qualified
Notes: Qualified mathematics teachers are those teachers with a major in mathematics (ISCED 5A). The percentage of qualified mathematics teachers are reported by the school’s principal.Disadvantaged (advantaged) schools are defined as those schools whose average level on the PISA index of economic, social and cultural status (ESCS) is statistically significantly below (above) the average across all schools in the country/economy.Only statistically signi�cant percentage-point differences between advantaged and disadvantaged schools are shown next to the country/economy name. Countries and economies are ranked in ascending order of the percentage of qualified mathematics teachers in all schools.Source: OECD, PISA 2012 Database, Table 2.24. 12 http://dx.doi.org/10.1787/888933377200

equations and inequalities: making mathematics accessible to all © OECD 2016 111
2Variations in students’ exposure to and familiarity with mathematics
ask students to decide on their own procedures for solving complex problems
present problems for which there is no immediately obvious method of solution
present problems in different contexts so that students know whether they have understood the concepts
help students to learn from mistakes they have made
ask students to explain how they have solved a problem
present problems that require students to apply what they have learned to new contexts
assign problems that can be solved in several different ways.
Previous analysis of Pisa data shows that students who indicated that their mathematics teacher uses cognitive-activation strategies reported particularly high levels of perseverance and openness to problem solving, were more likely to favour mathematics as a field of study over other subjects, and/or were more likely to regard mathematics as more necessary to their prospective careers than other subjects (oecd, 2013b).
cognitive-activation strategies tend to be used more often in socio-economically advantaged schools than in disadvantaged schools (table 2.25a). this is especially the case for strategies that require problem-solving skills and go beyond simple coverage of the curriculum. For instance, on average across oecd countries, the share of students whose teachers assign problems with no obvious solutions is seven percentage points larger in advantaged schools than in disadvantaged schools; and the share of students whose teachers require that they apply what they have learned to new contexts is five percentage points larger in advantaged than in disadvantaged schools. by contrast, “helping students to learn from mistakes they have made” is a strategy reported more often in disadvantaged schools than in advantaged schools, possibly because this strategy is more frequently used to help low-achieving students.
Previous research has shown a positive association between the use of cognitive-activation strategies and mathematics achievement (echazarra et al., 2016; lipowsky et al., 2009). What is the relationship between cognitive-activation strategies and opportunity to learn? and how does it vary according to schools’ socio-economic profile? Figure 2.23a shows the change in mathematics performance associated with exposure to these strategies, while Figure 2.23b shows the change in familiarity with mathematics associated with the strategies. on average across oecd countries, the use of cognitive-activation strategies is associated with higher scores, in both advantaged and disadvantaged schools. however, in disadvantaged schools, only four out of nine such strategies are associated with better mathematics performance, while all strategies are associated with better performance in advantaged schools. moreover, the effect on performance is larger in advantaged schools then in disadvantaged schools.6
differences in the effect of cognitive-activation strategies according to schools’ socio-economic profile are even more striking when looking at familiarity with mathematics. on average across oecd countries, the effect of cognitive-activation strategies on opportunity to learn mathematics is mixed in advantaged schools. some strategies are associated with greater familiarity while

© OECD 2016 equations and inequalities: making mathematics accessible to all112
2Variations in students’ exposure to and familiarity with mathematics
other strategies are related to less or no change in familiarity. however, on average across oecd countries, no cognitive-activation strategy is associated with greater familiarity with mathematics among students in disadvantaged schools. students in disadvantaged schools who are exposed to five out of nine of these strategies are less familiar with mathematics than students who are not exposed; and the remaining four strategies are not related to any significant change in familiarity with mathematics.
Figure 2.23a Teachers’ use of cognitive-activation strategies and students’
performance in mathematics, by schools’ socio-economic profileChange in mathematics score associated with mathematics teachers’ use
of cognitive-activation strategies, OECD average
-5
0
5
10
15
20
Notes: Disadvantaged (advantaged) schools are de�ned as those schools whose average level on the PISA index of economic, social and cultural status (ESCS) is statistically signi�cantly below (above) the average across all schools in the country/economy.Statistically signi�cant values for disadvantaged schools are marked in a darker tone. All values for advantaged schools are statistically signi�cant.Source: OECD, PISA 2012 Database, Table 2.25b.
The
teac
her
help
s st
uden
ts le
arn
from
mis
take
s
The
teac
her
give
s pr
oble
ms
that
req
uire
thin
king
for
anex
tend
ed ti
me
The
teac
her
lets
stu
dent
sde
cide
on
thei
r ow
n pr
oced
ures
The
teac
her
mak
es s
tude
nts
refle
ct o
n th
e pr
oble
m
The
teac
her
give
s pr
oble
ms
that
can
be s
olve
d in
dif
fere
nt w
ays
The
teac
her
pres
ents
pro
blem
sin
dif
fere
nt c
onte
xts
The
teac
her
asks
stu
dent
s to
expl
ain
how
they
sol
ved
a pr
oble
m
The
teac
her
give
s pr
oble
ms
with
no
imm
edia
te s
olut
ion
The
teac
her
asks
stu
dent
s to
appl
y w
hat t
hey
have
lear
ned
to n
ew c
onte
xts
Advantaged schoolsDisadvantaged schools
Scor
e-po
int c
hang
e
Cognitive-activation strategies used in mathematics lessons
Students whose teachers use cognitive-activationstrategies perform worse in mathematics
Students whose teachers use cognitive-activation strategiesperform better in mathematics
12 http://dx.doi.org/10.1787/888933377210

equations and inequalities: making mathematics accessible to all © OECD 2016 113
2Variations in students’ exposure to and familiarity with mathematics
overall, these results suggest that teachers use cognitive-activation strategies to deepen the curriculum content and support the development of problem-solving abilities among students in advantaged schools. by contrast, in disadvantaged schools, it appears that there might be a price to pay for using strategies that emphasise thinking and reasoning for an extended time: less material is covered.
-0.12
-0.10
-0.08
-0.06
-0.04
-0.02
0.00
0.02
0.04
0.06Advantaged schoolsDisadvantaged schools
Inde
x ch
ange
The
teac
her
help
s st
uden
ts le
arn
from
mis
take
s
The
teac
her
lets
stu
dent
s de
cide
on th
eir
own
proc
edur
es
The
teac
her
pres
ents
pro
blem
sin
dif
fere
nt c
onte
xts
The
teac
her
mak
es s
tude
nts
refle
ct o
n th
e pr
oble
m
The
teac
her
give
s pr
oble
ms
that
req
uire
thin
king
for
an e
xten
ded
time
The
teac
her
asks
stu
dent
sto
app
ly w
hat t
hey
have
lear
ned
to n
ew c
onte
xts
The
teac
her
give
s pr
oble
ms
that
can
be
solv
edin
dif
fere
nt w
ays
The
teac
her
give
s pr
oble
ms
with
no im
med
iate
sol
utio
n
The
teac
her
asks
stu
dent
sto
exp
lain
how
they
solv
ed a
pro
blem
Cognitive-activation strategies used in mathematics lessons
Students whose teachers use cognitive-activationstrategies are more familiar with mathematics
Students whose teachers use cognitive-activationstrategies are less familiar with mathematics
Figure 2.23b Teachers’ use of cognitive-activation strategies and students’ familiarity
with mathematics, by schools’ socio-economic profileChange in the index of familiarity with mathematics associated with mathematics
teachers' use of cognitive activation strategies, OECD average
Notes: Disadvantaged (advantaged) schools are defined as those schools whose average level on the PISA index of economic, social and cultural status (ESCS) is statistically significantly below (above) the average across all schools in the country/economy.Statistically significant values are marked in a darker tone.Source: OECD, PISA 2012 Database, Table 2.25c. 12 http://dx.doi.org/10.1787/888933377223

© OECD 2016 equations and inequalities: making mathematics accessible to all114
2Variations in students’ exposure to and familiarity with mathematics
Why is it so difficult to use cognitive-activation strategies in disadvantaged schools? one reason is that these strategies might be more effective with students who already have a sound background in conceptual and procedural mathematics. another reason might be that teachers may not be able to make students reflect on problems or assign problems that require thinking for an extended time in classrooms where there is noise and disorder. these difficulties should not discourage mathematics teachers in disadvantaged schools from adopting cognitive-activation strategies and problem solving. the time cost of these strategies can in fact be minimised by choosing well-framed problems and encouraging positive classroom behaviour.
Previous Pisa analysis showed that the disciplinary climate is positively correlated to a school’s socio-economic profile (oecd, 2013b). in most countries and economies, better disciplinary climate is related to greater familiarity with mathematics, even after comparing students and schools with similar socio-economic profiles (table 2.26). moreover, Figure 2.24 shows that, on average across oecd countries, the association between disciplinary climate and familiarity with mathematics is weaker among disadvantaged students than among students in general, possibly because students with more positive attitudes towards mathematics benefit more from a favourable learning environment.
the preceding analyses show that access to mathematics is unequally distributed across individuals, schools and systems. Familiarity with mathematics is strongly related to students’ socio-economic status, and the organisation of most education systems tends to reinforce socio-economic inequalities in access to mathematics. selecting students into more homogenous groups through grade repetition, between-school tracking, academic admission requirements and school transfers is associated not only with a more unequal achievement distribution, but also with more unequal access to mathematics content, on which mathematical literacy is based. this suggests that alternative and more individualised approaches should be considered to provide struggling students with instruction tailored to their ability and needs (see chapter 5).

equations and inequalities: making mathematics accessible to all © OECD 2016 115
2Variations in students’ exposure to and familiarity with mathematics
Index change-0.05 0.00 0.05 0.10 0.15 0.20 0.25
All students Disadvantaged students
LiechtensteinFinlandTunisia
IndonesiaKazakhstan
ChilePolandIcelandEstoniaMexico
SwedenHong Kong-China
MontenegroUnited Kingdom
DenmarkColombia
Macao-ChinaLatvia
SwitzerlandArgentina
Russian Federation1
New ZealandBrazil
Thailand1
Slovak RepublicUruguayMalaysiaPortugal1
LuxembourgCanadaIreland
PeruAustria
OECD average1
SerbiaAustraliaGermany
ItalyCosta Rica
Viet NamLithuania1
NetherlandsCzech Republic
AlbaniaGreece
JapanHungary
IsraelFrance
CroatiaJordan
United Arab EmiratesUnited States1
BulgariaShanghai-China
Chinese TaipeiRomania
TurkeySlovenia1
SingaporeBelgium
Qatar1
SpainKorea
(-0.29)
Figure 2.24 Disciplinary climate and familiarity with mathematics,
by students’ socio-economic statusChange in the index of familiarity with mathematics associated with a one-unit change
in the index of disciplinary climate
1. The difference between disadvantaged and all students is statistically significant.Notes: The index of disciplinary climate is based on students’ reports of the frequency with which interruptions occur in mathematics class. Higher values on the index indicate a better disciplinary climate. Statistically significant values are marked in a darker tone. Countries and economies are ranked in ascending order of the change in familiarity with mathematics associated with a one-unit change in the index of disciplinary climate for all students.Source: OECD, PISA 2012 Database, Table 2.26. 12 http://dx.doi.org/10.1787/888933377232

© OECD 2016 equations and inequalities: making mathematics accessible to all116
2Variations in students’ exposure to and familiarity with mathematics
Notes
1. as discussed in chapter 1, Pisa 2012 data offer various measures of exposure to mathematics and familiarity with mathematics. most of the analysis presented in chapter 2 focuses on familiarity with mathematics because it better reflects the effect of cumulative opportunities to learn over students’ school career – rather than just recent exposure – and because Pisa gauges familiarity over a larger set of items than exposure, offering more statistical robustness and variation.
2. the relatively large within-school variations in the index of familiarity with mathematics might be partly explained by a certain degree of subjectivity in the interpretation of the questions, for example in how students define what is frequent and what is rare.
3. equity in access to mathematics (the percentage of the variation in familiarity explained by students’ and schools’ socio-economic profile) is computed through a single-level linear regression for consistency with the definition of equity in education (the percentage of the variation in mathematics performance explained by students’ socio-economic status) used in previous analyses of Pisa 2012 data (oecd, 2013a). the correlation between equity in access to mathematics content and system-level indicators of stratification presented in this chapter is robust to an alternative definition of equity computed through a two-level model (as in Figure 2.1).
4. the oecd teaching and learning international survey (talis) is conducted among teachers and leaders of mainstream schools in representative samples of schools. in 2013, 34 countries surveyed teachers in their primary, lower secondary and upper secondary schools. talis asks teachers and schools about their working conditions and learning environments. it covers such themes as initial teacher education and professional development; what sort of appraisal and feedback teachers get; the school climate; school leadership; and teachers’ instructional beliefs and pedagogical practices. in 2013, some countries also chose to gain additional insights by conducting the survey in schools that participated in the 2012 Programme for international student assessment (Pisa).
5. the difference in the impact of socio-economic status as students progress through school is probably underestimated, because we cannot observe those students who drop out of school between lower and upper secondary school. dropout rates are generally much higher among relatively disadvantaged students.
6. these results need to be interpreted with some caution because it is not possible to distinguish whether the association is due to a genuine effect of teaching on achievement, or whether it is due to different uses of these teaching strategies according to students’ abilities.
References
Abreu, G. (2005), “cultural identities in the multiethnic mathematical classroom”, paper presented at ceRme 4 (Fourth congress of european Research in mathematics education) – Working group 10: mathematics education in multicultural settings.
Alexander, K.L., D.R. Entwisle and S.L. Dauber (2003), On the Success of Failure: A Reassessment of the Effects of Retention in the Primary School Grades, cambridge university Press, cambridge, uk.
Allen, C.S., Q. Chen, V.L. Willson and J.N. Hughes (2009), “quality of research design moderates effects of grade retention on achievement: a meta-analytic, multi-level analysis”, Educational Evaluation and Policy Analysis, Vol. 31/4, american educational Research association, Washington, dc, pp. 480–99, http://dx.doi.org/doi:10.3102/0162373709352239.
Ammermüller, A. (2005), “educational opportunities and the role of institutions”, ZEW Discussion Papers, no. 05-44, Zentrum für europäische Wirtschaftsforschung/centre for european economic Research, mannheim, http://ftp.zew.de/pub/zew-docs/dp/dp0544.pdf.

equations and inequalities: making mathematics accessible to all © OECD 2016 117
2Variations in students’ exposure to and familiarity with mathematics
Argys, L.M., D. I. Rees and D.J. Brewer (1996), “detracking america’s schools: equity at zero cost?” Journal of Policy Analysis and Management, Vol. 15/4, John Wiley & sons, inc., 623–45, http://dx.doi.org/doi:10.1002/(sici)1520-6688(199623)15:4<623::aid-Pam7>3.0.co;2-J.
Ariga, K., G. Brunello, R. Iwahashi and L. Rocco (2005), “Why is the timing of school tracking so heterogeneous?”, IZA Discussion Paper, no.1854, Forschungsinstitut zur Zukunft der arbeit /institute for the study of labor, bonn, http://ftp.iza.org/dp1854.pdf.
Bandura, A., C. Barbaranelli, G. Caprara and C. Pastorelli (2001), “self-efficacy beliefs as shapers of children’s aspirations and career trajectories”, Child Development, Vol. 72/1, John Wiley & sons, inc., pp. 187–206, http://dx.doi.org/doi:10.1111/1467-8624.00273.
Betts, J.R. and J.L. Shkolnik (2000), “the effects of ability grouping on student achievement and resource allocation in secondary schools”, Economics of Education Review, Vol. 19/1, elsevier, amsterdam, pp. 1–15, http://dx.doi.org/doi:10.1016/s0272-7757(98)00044-2.
Blau, D. and J. Currie (2006), “chapter 20. Pre-school, day care, and after-school care: Who’s minding the kids?” in e. hanushek and F. Welch (eds.), Handbook of the Economics of Education, Vol. 2, elsevier, amsterdam, pp. 1163–1278, http://dx.doi.org/doi:10.1016/s1574-0692(06)02020-4.
Braddock, J.H. and M.P. Dawkins (1993), “ability grouping, aspirations, and attainment: evidence from the national educational longitudinal study of 1988”, The Journal of Negro Education, Vol. 62/3, pp. 324, http://dx.doi.org/doi:10.2307/2295468.
Brunello, G. and D. Checchi (2007), “does school tracking affect equality of opportunity? new international evidence,” Economic Policy, Vol. 22/52, pp. 782–861, http://dx.doi.org/doi:10.1111/j.1468-0327.2007.00189.x.
Burgess, S., M. Dickson and L. Macmillan (2014), “selective schooling systems increase inequality”, IZA Discussion Papers, no. 8505, Forschungsinstitut zur Zukunft der arbeit /institute for the study of labor, bonn, http://ftp.iza.org/dp8505.pdf.
Chetty, R., J. Friedman and J. E. Rockoff (2014), “measuring the impacts of teachers ii: teacher value-added and student outcomes in adulthood,” American Economic Review, Vol. 104/9, pp. 2633–79, http://dx.doi.org/doi:10.1257/aer.104.9.2633.
Chmielewski, A.K. (2014), “an international comparison of achievement inequality in within- and between-school tracking systems”, American Journal of Education, Vol. 120/3, pp. 293–324, http://dx.doi.org/doi:10.1086/675529.
Claudia, B. and E.A. Parrado (2006), “educational achievement of immigrant-origin and native students: a comparative analysis informed by institutional theory”, in d.P. baker and a.W. Wiseman (eds.), The Impact of Comparative Education Research on Institutional Theory (International Perspectives on Education and Society, Vol. 7, emerald group Publishing limited, bingley, uk, pp. 335–366.
Clements, D.H. and J. Sarama (2011), “early childhood mathematics intervention.” Science, Vol. 333/6045, pp. 968–70, http://dx.doi.org/doi:10.1126/science.1204537.
Clifford, R.M., O. Barbarin, F. Chang, D. Early, D. Bryant, C. Howes, M. Burchinal and R. Pianta (2005), “What is pre-kindergarten? characteristics of public pre-kindergarten programs”, Applied Developmental Science, Vol. 9/3, pp. 126–43.
Collins, C.A. and L. Gan (2013), “does sorting students improve scores? an analysis of class composition.” NBER Working Paper, no. 18848. national bureau of economic Research, cambridge, ma, http://www.nber.org/papers/w18848.

© OECD 2016 equations and inequalities: making mathematics accessible to all118
2Variations in students’ exposure to and familiarity with mathematics
Corman, H. (2003), “the effects of state policies, individual characteristics, family characteristics, and neighbourhood characteristics on grade repetition in the united states.” Economics of Education Review, Vol. 22/4, pp. 409–20, http://dx.doi.org/doi:10.1016/s0272-7757(02)00070-5.
Crosnoe, R. and B. Schneider (2010), “social capital, information, and socioeconomic disparities in math coursework”, American Journal of Education, Vol. 117/1, pp. 79–107, http://dx.doi.org/doi:10.1086/656347.
Csikszentmihalyi, M. and B. Schneider (2000), Becoming Adult: How Teenagers Prepare for the World of Work, basic books, new York, nY.
Cunha, F., J.J. Heckman, L. Lochner and D.V. Masterov (2006), “chapter 12. interpreting the evidence on life cycle skill formation”, in e. hanushek and F. Welch (eds.), Handbook of the Economics of Education, Vol. 1, elsevier, amsterdam, pp. 697–812, http://dx.doi.org/doi:10.1016/s1574-0692(06)01012-9.
Downey, D.B., P.T. von Hippel and B.A. Broh (2004), “are schools the great equalizer? cognitive inequality during the summer months and the school year”, American Sociological Review, Vol. 69/5, pp. 613–35, http://www.jstor.org/stable/3593031.
Duru-Bellat, M. and B. Suchaut (2005), “organisation and context, efficiency and equity of educational systems: What Pisa tells us”, European Educational Research Journal, Vol. 4/3, pp. 181–94, http://dx.doi.org/doi:10.2304/eerj.2005.4.3.3.
Dweck, C.S. (2007), “is math a gift? beliefs that put females at risk”, in s.J. ceci and W.m. Williams (eds.), Why Aren’t More Women in Science?: Top Researchers Debate the Evidence, american Psychological association, Washington, dc, pp. 47–55.
Eccles, J.S. (2007), “Where are all the women? gender differences in participation in physical science and engineering”, in Why Aren’t More Women in Science?: Top Researchers Debate the Evidence, in s.J. ceci and W.m. Williams (eds.), Why Aren’t More Women in Science?: Top Researchers Debate the Evidence, american Psychological association, Washington, dc, pp. 199–210.
Echazarra, A., D. Salinas, I. Méndez, V. Denis and G. Rech (2016), “how teachers teach and students learn: successful strategies for school”, OECD Education Working Papers, no. 130, oecd Publishing, Paris, http://dx.doi.org/10.1787/5jm29kpt0xxx-en.
Entwisle, D.R., K.L. Alexander and L.S. Olson (2005), “First grade and educational attainment by age 22: a new story”, American Journal of Sociology, Vol.110/5, the university of chicago Press Journals, chicago, il, pp. 1458–1502, http://dx.doi.org/doi:10.1086/428444.
Feinstein, L. and J. Symons (1999), “attainment in secondary school.” Oxford Economic Papers, Vol. 51/2, oxford university Press, oxford, uk, 300–321, http://dx.doi.org/doi:10.1093/oep/51.2.300.
Ferreira, F.H.G. and J. Gignoux (2014), “the measurement of educational inequality: achievement and opportunity”, The World Bank Economic Review, Vol. 28/2, pp. 210–46, http://dx.doi.org/doi:10.1093/wber/lht004.
Figlio, D.N. and M.E. Page (2002), “school choice and the distributional effects of ability tracking: does separation increase inequality?”, Journal of Urban Economics, Vol. 51/3, pp. 497–514, http://dx.doi.org/doi:10.1006/juec.2001.2255.
Fryer, R.G. and S.D. Levitt (2010), “an empirical analysis of the gender gap in mathematics.” American Economic Journal: Applied Economics, Vol. 2/2, pp. 210–40, http://dx.doi.org/doi:10.1257/app.2.2.210.
Gamoran, A. (1993), “alternative uses of ability grouping in secondary schools: can we bring high-quality instruction to low-ability classes?” American Journal of Education, Vol. 102/1, pp. 1–22, http://dx.doi.org/doi:10.1086/444056.

equations and inequalities: making mathematics accessible to all © OECD 2016 119
2Variations in students’ exposure to and familiarity with mathematics
Gorgorió, N. and N. Planas (2005), “social representations as mediators of mathematics learning in multiethnic classrooms”, European Journal of Psychology of Education, Vol. 20/1, pp. 91–104, http://dx.doi.org/doi:10.1007/bF03173213.
Gregory, A., R.J. Skiba and P.A. Noguera (2010), “the achievement gap and the discipline gap: two sides of the same coin?”, Educational Researcher, Vol. 39/1, 59–68, http://dx.doi.org/doi:10.3102/0013189X09357621.
Hanushek, E.A., J.F. Kain and S.G. Rivkin (2004), “Why public schools lose teachers”, The Journal of Human Resources, 39 (2): 326–54, http://dx.doi.org/doi:10.2307/3559017.
Hanushek, E.A. and L. Woessmann (2010), “the economics of international differences in educational achievement”, NBER Working Paper, no. 15949, national bureau of economic Research, cambridge, ma, http://www.nber.org/papers/w15949.
Hanushek, E.A. and L. Woessmann (2006), “does educational tracking affect performance and inequality? differences-in-differences evidence across countries”, The Economic Journal, Vol. 116/510, pp. c63–76, http://dx.doi.org/doi:10.1111/j.1468-0297.2006.01076.x.
Häussler, P. and L. Hoffmann (2002), “an intervention study to enhance girls’ interest, self-concept, and achievement in physics classes”, Journal of Research in Science Teaching, Vol. 39/9, pp. 870–88, http://dx.doi.org/doi:10.1002/tea.10048.
Heckman, J. and P. Carneiro (2003), “human capital policy”, in J.J. heckman, a.b. krueger and b.m. Friedman (eds.), Inequality in America: What Role for Human Capital Policy?, mit Press, cambridge, ma.
Heidenheimer, A.J. (1974), “the Politics of educational reform: explaining different outcomes of school comprehensivization attempts in sweden and West germany”, Comparative Education Review, Vol. 18/3, 388–410, http://dx.doi.org/doi:10.1086/445795.
Heyneman, S.P. (2009), “international perspectives on school choice.” in m. berends, m.g. springer, d. ballou and h.J. Walberg (eds.), Handbook of Research on School Choice, Routledge, abingdon.
Horn, D. (2009), “age of selection counts: a cross-country analysis of educational institutions”, Educational Research and Evaluation, Vol. 15/4, pp. 343–66, http://dx.doi.org/doi:10.1080/13803610903087011.
Ikeda, M. and E. García (2014), “grade repetition: a comparative study of academic and non-academic consequences”, OECD Journal: Economic Studies, Vol. 2013/1, http://dx.doi.org/10.1787/eco_studies-2013-5k3w65mx3hnx.
Jacob, B.A. and L. Lefgren (2009), “the effect of grade retention on high school completion”, American Economic Journal: Applied Economics, Vol. 1/3, pp. 33–58, http://dx.doi.org/doi:10.1257/app.1.3.33.
Kämmerer, E., O. Köller and U. Trautwein (2002), “effekte innerer und äußerer leistungsdifferenzierung auf selbstbezogene Fähigkeitskognitionen, die Wahrgenommene unterrichtspartizipation und die Wahrgenommene soziale akzeptanz”, Psychologie in Erziehung Und Unterricht , Vol. 49/4, pp. 273–86.
Lankford, H., S. Loeb and J. Wyckoff (2002), “teacher sorting and the plight of urban schools: a descriptive analysis”, Educational Evaluation and Policy Analysis, Vol. 24/1, pp. 37–62, http://dx.doi.org/doi:10.3102/01623737024001037.
Lareau, A. (2011), Unequal Childhoods: Class, Race, and Family Life, 2nd ed., university of california Press, berkeley, http://www.jstor.org/stable/10.1525/j.ctt1ppgj4.
Lipowsky, F., K. Rakoczy, C. Pauli, B. Drollinger-Vetter, E. Klieme and Kurt R. (2009), “quality of geometry instruction and its short-term impact on students’ understanding of the Pythagorean theorem”, Learning and Instruction, Vol. 19/6, pp. 527–37, http://dx.doi.org/doi:10.1016/j.learninstruc.2008.11.001.

© OECD 2016 equations and inequalities: making mathematics accessible to all120
2Variations in students’ exposure to and familiarity with mathematics
Lucas, S.R. (1999), Tracking Inequality: Stratification and Mobility in American High Schools, Sociology of Education Series, teachers college Press, new York, nY.
Manacorda, M. (2010), “the cost of grade retention”, Review of Economics and Statistics, Vol. 94/2, pp. 596–606, http://dx.doi.org/doi:10.1162/Rest_a_00165.
Michaelowa, K. and J. Bourdon (2006), “the impact of student diversity in secondary schools: an analysis of the international Pisa data and implications for the german education system”, hWWi Research Paper, no. 3-2, hamburgisches Weltwirtschaftsinstitut, hamburg, http://www.hwwi.org/fileadmin/_migrated/tx_wilpubdb/hWWi_Research_Paper_3-2.pdf.
Morgan, S.L. (2005), On the Edge of Commitment: Educational Attainment and Race in the United States, stanford university Press, Palo alto, ca.
National Research Council (1999), High Stakes: Testing for Tracking, Promotion, and Graduation. national academies Press, Washington, dc, http://www.nap.edu/catalog/6336.
NICHD Early Child Care Network (2005), NICHD Study of Early Child Care and Youth Development (SECCYD). guilford Press, new York, nY, https://www.nichd.nih.gov/research/supported/Pages/seccyd.aspx.
Nye, B., S. Konstantopoulos and L.V. Hedges (2004), “how large are teacher effects?” Educational Evaluation and Policy Analysis, Vol. 26/3, pp. 237–57, http://dx.doi.org/doi:10.3102/01623737026003237.
Oakes, J. (2005), Keeping Track: How Schools Structure Inequality, 2nd ed., Yale university Press, new haven, ct/london.
OECD (2015a), The ABC of Gender Equality in Education: Aptitude, Behaviour, Confidence, Pisa, oecd Publishing, Paris, http://dx.doi.org/10.1787/9789264229945-en.
OECD (2015b), Immigrant Students at School: Easing the Journey towards Integration, oecd Reviews of migrant education, oecd Publishing, Paris, http://dx.doi.org/10.1787/9789264249509-en.
OECD (2014a), PISA 2012 Technical Report, Pisa, oecd Publishing, Paris, https://www.oecd.org/pisa/pisaproducts/Pisa-2012-technical-report-final.pdf.
OECD (2014b), PISA 2012 Results: What Students Know and Can Do (Volume I, Revised edition, February 2014): Student Performance in Mathematics, Reading and Science, Pisa, oecd Publishing, Paris, http://dx.doi.org/10.1787/9789264208780-en.
OECD (2013a), PISA 2012 Results: Excellence through Equity (Volume II): Giving Every Student the Chance to Succeed, Pisa, oecd Publishing, Paris, http://dx.doi.org/10.1787/9789264201132-en.
OECD (2013b), PISA 2012 Results: Ready to Learn (Volume III): Students’ Engagement, Drive and Self-Beliefs, Pisa, oecd Publishing, Paris, http://dx.doi.org/10.1787/9789264201170-en.
OECD (2013c), PISA 2012 Results: What Makes Schools Successful (Volume IV): Resources, Policies and Practices, Pisa, oecd Publishing, Paris, http://dx.doi.org/10.1787/9789264201156-en.
OECD (2012), Equity and Quality in Education: Supporting Disadvantaged Students and Schools, oecd Publishing, Paris, http://dx.doi.org/10.1787/9789264130852-en.
OECD (2011), “When students Repeat grades or are transferred out of school: What does it mean for education systems?”, PISA in Focus, no. 6, oecd Publishing, Paris, http://dx.doi.org/10.1787/5k9h362n5z45-en.
OECD (2004), Learning for Tomorrow’s World: First Results from PISA 2003, Pisa, oecd Publishing, Paris, http://dx.doi.org/10.1787/9789264006416-en.

equations and inequalities: making mathematics accessible to all © OECD 2016 121
2Variations in students’ exposure to and familiarity with mathematics
Pekkarinen, T., R. Uusitalo and S. Kerr (2009), “school tracking and intergenerational income mobility: evidence from the Finnish comprehensive school reform”, Journal of Public Economics, Vol. 93/7–8, pp. 965–73, http://dx.doi.org/doi:10.1016/j.jpubeco.2009.04.006.
Pischke, J. and A. Manning (2006), “comprehensive versus selective schooling in england in Wales: What do we know?” NBER Working Paper, no. 12176, national bureau of economic Research, cambridge, ma, http://www.nber.org/papers/w12176.
Rivkin, S.G., E.A. Hanushek and J.F. Kain (2005), “teachers, schools, and academic achievement”, Econometrica, Vol. 73/2, pp. 417–58, http://dx.doi.org/doi:10.1111/j.1468-0262.2005.00584.x.
Sarama, J. and D.H. Clements (2010), “Preschool mathematics curricula”, in b. Reys, R. Reys and R. Rubenstein (eds), Mathematics Curriculum: Issues, Trends, and Future Directions, national council of teachers of mathematics, Reston, Va, pp. 115–26.
Schoenfeld, A.H. (2002), “making mathematics work for all children: issues of standards, testing, and equity”, Educational Researcher, Vol. 31/1, pp. 13–25, http://dx.doi.org/doi:10.3102/0013189X031001013.
Schütz, G., H.W. Ursprung and L. Wößmann (2008), “education policy and equality of opportunity”, Kyklos Vol. 61/2, pp. 279–308, http://dx.doi.org/doi:10.1111/j.1467-6435.2008.00402.x.
Simon, N.S. and S.M. Johnson (2015), “teacher turnover in high-poverty schools: What we know and can do”, Teachers College Record, Vol. 117/3, https://www.tcrecord.org/library/abstract.asp?contentid=17810.
van de Werfhorst, H.G. and J.J.B. Mijs (2010), “achievement inequality and the institutional structure of educational systems: a comparative perspective”, Annual Review of Sociology, Vol. 36/1, pp. 407–28, http://dx.doi.org/doi:10.1146/annurev.soc.012809.102538.
Woessmann, L., E. Luedemann, G. Schuetz, and M.R. West (2009), School Accountability, Autonomy and Choice Around the World, edward elgar Publishing, cheltenham, uk/northampton, ma.
Zimmer, R. (2003), “a new twist in the educational tracking debate”, Economics of Education Review, Vol. 22/3, pp. 307–15, http://dx.doi.org/doi:10.1016/s0272-7757(02)00055-9.


equations and inequalities: making mathematics accessible to all © OECD 2016 123
Exposure to Mathematics in School and Performance
in PISA
3
This chapter analyses how opportunity to learn mathematics influences students’ performance in PISA and their capacity to solve the most challenging PISA tasks. The results show that exposure to pure mathematics has a strong association with performance that tends to increase as the difficulty of mathematics problems increases. Socio-economically disadvantaged students, who have fewer opportunities to learn how to use symbolic language, acquire fluency in procedures and build mathematic models, lack some of the essential skills needed to solve mathematics problems.
the statistical data for israel are supplied by and under the responsibility of the relevant israeli authorities. the use of such data by the oecd is without prejudice to the status of the golan heights, east Jerusalem and israeli settlements in the West bank under the terms of international law.

© OECD 2016 equations and inequalities: making mathematics accessible to all124
3ExposurE to mathEmatics in school and pErformancE in pisa
it is hard to find two scholars holding the same view of how mathematics should be taught, but there is a general agreement among practitioners about the final goal: mathematics should be taught “as to be useful” (Freudenthal, 1968; gardiner, 2004). in other words, mathematics should help students build competent and flexible performance on “demanding” tasks (schoenfeld, 1994; schoenfeld, 2004). competent performance implies that mathematical operations are fast and effortless; flexible performance means not just solving familiar problems, but also being able to tackle novel problems built on the same principles (Rosenberg-lee and lovett, 2006).
are mathematics curricula structured and implemented in ways that help students to develop competence and flexibility for demanding tasks? an analysis of Pisa data can help to answer this question. Pisa challenges students to solve a set of problems that might be encountered in real life, that are of greater or lesser difficulty and that do not look like those presented in mathematics classes at school. by analysing how students who have been exposed to mathematics to varying degrees perform on different Pisa tasks, this chapter provides new evidence on whether students can apply the mathematics they learn at school.
While Pisa data cannot establish cause and effect, the analysis shows a positive relationship between exposure to pure mathematics and performance. this is not only because “smarter” students may be concentrated in the same schools. Rather, students in the same school who are more frequently exposed to pure mathematics tend to do better in Pisa. the chapter also looks at the relative strengths and weaknesses of countries and students, particularly disadvantaged students, across different areas of mathematics.
What the data tell us
on average across oecd countries, student performance on mathematics tasks requiring familiarity with algebraic operations improved between 2003 and 2012, while performance on tasks with a focus on geometry deteriorated.
in austria, croatia, korea, Romania, shanghai-china and chinese taipei, re-allocating one hour of instruction from reading to mathematics is associated with an improvement in mathematics performance, compared with reading performance, of more than 10 score points. however, the effect of such changes in instruction time on performance is not statistically significant in the majority of the other countries and economies.
students’ exposure to pure mathematics tasks and concepts has a strong relationship with performance in Pisa; and the association is stronger for more challenging Pisa tasks. in contrast, exposure to simple applied mathematics problems has a weaker association with student performance.
around 19% of the performance difference between socio-economically advantaged and disadvantaged students can be attributed to disadvantaged students’ relative lack of familiarity with mathematics concepts, on average across oecd countries. disadvantaged students perform relatively worse on those tasks that require a mastery of symbolic and technical operations and on tasks that test their ability to build mathematic models of reality.

equations and inequalities: making mathematics accessible to all © OECD 2016 125
3ExposurE to mathEmatics in school and pErformancE in pisa
mathEmatics curricula and pErformancE on diffErEnt contEnt arEas of pisa
not only does Pisa assess students on their performance in mathematics, reading and science, but it can also describe students’ performance on four distinct mathematical content areas, the “big ideas” that nourish the growing branches of mathematics (steen, 1990; oecd, 2013a):
Change and relationships: tasks related to change and relationships require students to use suitable mathematical models to describe and predict change. they often require the application of algebra.
Space and shape: tasks related to space and shape entail understanding perspective, creating and reading maps, transforming shapes with and without technology, interpreting views of three-dimensional scenes from various perspectives, and constructing representations of shapes. Space and shape is the “big idea” most closely related to geometry.
Quantity: tasks related to quantity involve applying knowledge of numbers and number operations in a wide variety of settings.
Uncertainty and data: tasks related to uncertainty and data involve knowledge of variation in processes, uncertainty and error in measurement, and chance. this area has a strong connection to probability and statistics.
the Pisa test items are split almost evenly across the four content areas (oecd, 2013a).
the four content areas are related to broad parts of the mathematics curriculum found in all Pisa countries and economies. students typically do better on items in which underlying concepts, formats and contexts are familiar to them, than on items in which these aspects are not as familiar. as such, the relative performance of countries across the four content areas (the Pisa mathematics content subscales) reflects differences in course content available to 15-year-old
What these results mean for policy
students need to be exposed to mathematics content for a sufficient amount of time, but what matters the most is using instruction time effectively.
greater exposure to formal mathematics content improves performance – up to a point. all students should be exposed to a curriculum that is coherent across topics and over time, and focuses on key mathematics ideas, so that students can build solid foundations in mathematics.
greater familiarity with mathematics may not be sufficient for solving the most complex mathematics problems. students also need to be exposed to problems that stimulate their reasoning abilities and promote conceptual understanding, creativity and problem-solving skills.
disadvantaged students would benefit most from any policy that increases their opportunities to develop not only procedural mathematics skills, but also skills in mathematical modelling.

© OECD 2016 equations and inequalities: making mathematics accessible to all126
3ExposurE to mathEmatics in school and pErformancE in pisa
students, curriculum priorities, and item difficulty (oecd, 2014). among other factors, weaker relative performance in a content area might signal an imbalance in the curriculum, which could lead to curriculum reform (cosgrove et al., 2004).
shanghai-china significantly outperforms all other countries/economies on each of the mathematics content-area subscales. in relative terms, shanghai-china performs extraordinarily well on the space and shape subscale and less markedly so on the change and relationships subscale (Figure 3.1). several other asian countries are relatively strong in those tasks that require students to apply geometry.
there are greater international differences in contents and emphasis with geometry curricula than with arithmetic and algebra (French, 2004). curriculum descriptions collected for the 2011 trends in international mathematics and science study (timss) show that several asian economies expose students to advanced spatial mathematics at early grades. For example, in hong kong-china, the relationship between three-dimensional shapes and their two-dimensional representations are introduced to students in grade 7, when they are around 13 years old. in chinese taipei, students practice the “translation, reflection and rotation” of figures when they are taught the topic of “quadratic function” in grade 9, when they are around 15 years old1.
at the other end of the spectrum, ireland performs relatively worse on Pisa items in the space and shape content area (Figure 3.1). this relative weakness among irish students might reflect differences between the Pisa content area space and shape, which focuses more on visualisation skills, and the irish Junior certificate geometry, which emphasises traditional euclidian geometry (shiel, 2007).
differences in countries’ relative performance should not be solely attributed to variations in how curricula are organised across the different areas of algebra, geometry, quantity and statistics; they may also reflect other characteristics of the individual tasks, such as the task’s level of difficulty. an item’s difficulty can be described by the percentage of students who responded correctly to it. the analysis in the rest of the chapter and of the report will refer to a logarithmic transformation of this percentage (a logit), where positive logits mean that more than half respondents answered correctly and negative logits mean that fewer than half respondents answered correctly.2
Figure 3.2 shows that the items classified in the content areas space and shape and change and relationships are, on average, much more difficult than the items in the areas of quantity and uncertainty and data.3 the item ReVolVing dooR question 2 (see the full text of the question at the end of this chapter) is a space and shape item and is over 520 points more difficult on the Pisa scale than chaRts question 1 (see the end of this chapter), an uncertainty and data item. the relatively higher performance among asian countries and economies on tasks requiring greater knowledge of geometry and algebra can thus be explained by asian students’ greater capacities to solve more challenging problems, such as ReVolVing dooR.

equations and inequalities: making mathematics accessible to all © OECD 2016 127
3ExposurE to mathEmatics in school and pErformancE in pisa
12 http://dx.doi.org/10.1787/888933377248
Space and shape Change and relationships
Score-point difference
-30 -20 -10 0 10 20 30 40
Shanghai-ChinaChinese Taipei
AlbaniaJapan
Macao-ChinaKorea
KazakhstanMalaysia
Russian FederationSwitzerland
Slovak RepublicIndonesia
PolandLatvia
SingaporeHong Kong-China
ThailandLiechtenstein
PortugalQatar
UruguayBulgaria
RomaniaMontenegro
SloveniaItalyPeru
Czech RepublicJordan
MexicoSerbia
DenmarkArgentina
LuxembourgHungary
ChileIceland
Viet NamOECD average
AustriaTurkeyTunisia
BelgiumFrance
GermanyLithuania
SpainColombiaAustralia
CanadaEstonia
New ZealandUnited Arab Emirates
Costa RicaSwedenNorway
BrazilCroatiaFinland
NetherlandsGreece
IsraelUnited States
United KingdomIreland
Country’s/economy’sperformance on thesubscale is higherthan on the overallmathematics scale
Country’s/economy’sperformance on thesubscale is lowerthan on the overallmathematics scale
Figure 3.1 Performance on the different mathematics content subscales
Score-point difference between the overall mathematics scale and each content subscale
Countries and economies are ranked in descending order of the difference between the overall mathematics score and the score on the mathematics subscale space and shape.Source: OECD, PISA 2012 Database, Table 3.1.

© OECD 2016 equations and inequalities: making mathematics accessible to all128
3ExposurE to mathEmatics in school and pErformancE in pisa
looking at how the performance of countries has evolved across different content areas of mathematics reveals interesting trends, possibly related to changes in the focus of mathematics instruction. Figures 3.3a-d show trends in oecd countries’ performance on the 31 mathematics items that were used in both the 2003 the 2012 assessments. on average across oecd countries, the percentage of students who were able to answer correctly the questions related to change and relationships increased, remained virtually the same for the questions related to uncertainty and data, but decreased for questions related to quantity and, more significantly, space and shape.
Performance on items related to change and relationships improved substantially in italy, Poland and Portugal (over 0.4 logits in Poland, corresponding approximately to an increase of 7 points in the percentage of students answering correctly to those items, see tables 3.3a and 3.3b). the czech Republic, France, the slovak Republic, sweden and uruguay saw a large deterioration in their students’ performance on items related to space and shape that were tested in both 2003 and 2012 (0.5 logits in uruguay, corresponding approximately to a decrease of 7 points
12 http://dx.doi.org/10.1787/888933377254
-2.5
-2.0
-1.5
-1.0
-0.5
0.0
0.5
1.0
1.5
Change and relationships
Quantity Spaceand shape
Uncertaintyand data
Mathematics content areas
Ave
rage
logi
t
Jordan
IndonesiaIndonesia
Indonesia
Shanghai-China
Shanghai-China
Shanghai-China
Shanghai-China
lowerquartile
Fewercorrect
responses
Morecorrect
responses
maximum
medianCo
rrec
t re
spo
nses
50% of the students answered correctly, onaverage, across the items in the content area
minimum
30 countries/economies
upper quartile
Figure 3.2 Difficulty of PISA tasks, by content area
Variation across all countries and economies
How to read the chart: The figure is a box-and-whisker plot showing the distribution of average logit values in 62 participating countries and economies with available data. For example, in the content area change and relationships, Indonesia has the minimum logit value (-2.20), while Shanghai-China has the maximum logit value (0.72) across all countries and economies. A quarter of the countries and economies have logit values included betwen the minimum and the lower limit of the box (-1.13) and a quarter of countries and economies have logit values above the upper limit (-0.41). Half of the countries and economies have logit values included between the lower and upper limit of the box (between -1.13 and -0.41); the horizon-tal bar represents the median value across all countries and economies (-0.71).Note: A logit is the logarithm of the odds of answering correctly. A logit value of 0 means that 50% of respondents answered the question correctly. Higher/lower logits correspond to higher/lower rates of correct responses and to lesser/greater item difficulty. Source: OECD, PISA 2012 Database, Table 3.2b.

equations and inequalities: making mathematics accessible to all © OECD 2016 129
3ExposurE to mathEmatics in school and pErformancE in pisa
12 http://dx.doi.org/10.1787/888933377262
20122003
Logit-3.00 -2.50 -2.00 -1.50 -1.00 -0.50 0.00 0.50
Indonesia
Tunisia
Brazil
Mexico
Uruguay
Thailand
Greece
Turkey
Italy
Spain
Portugal
Luxembourg
Slovak Republic
Hungary
Latvia
United States
Sweden
Russian Federation
Iceland
Norway
OECD average
Ireland
France
Denmark
Czech Republic
Austria
Poland
New Zealand
Belgium
Germany
Australia
Switzerland
Macao-China
Canada
Finland
Netherlands
Japan
Korea
Hong Kong-China
0.28
0.33
0.32
0.05
0.41
-0.20
0.21
0.20
Figure 3.3a Change between 2003 and 2012 in mathematics performance
across content area change and relationships
Notes: A logit is the logarithm of the odds of answering correctly. A logit value of 0 means that 50% of respondents answered the question correctly. Higher/lower logits correspond to higher/lower rates of correct responses and to lesser/greater item difficulty.The logit coefficients are calculated over the 7 items in change and relationships assessed both in 2003 and in 2012.Only countries and economies with comparable data from PISA 2003 and PISA 2012 are shown.The OECD average is calculated as the average of 29 countries.Only statistically signi�cant average logit differences between 2012 and 2003 are shown next to the country/economy name.Countries and economies are ranked in ascending order of the average logit of questions in the content area change and relationships in 2012.Source: OECD, PISA 2012 Database, Table 3.3a.

© OECD 2016 equations and inequalities: making mathematics accessible to all130
3ExposurE to mathEmatics in school and pErformancE in pisa
12 http://dx.doi.org/10.1787/888933377278
20122003
Logit-1.50 -1.00 -0.50 0.00 0.50 1.00
Indonesia
Tunisia
Brazil
Mexico
Uruguay
Thailand
Turkey
Greece
Russian Federation
United States
Hungary
Slovak Republic
Sweden
Norway
Latvia
OECD average
Iceland
Spain
Luxembourg
New Zealand
Australia
Portugal
France
Ireland
Czech Republic
Denmark
Italy
Poland
Japan
Austria
Canada
Belgium
Germany
Netherlands
Macao-China
Switzerland
Korea
Finland
Hong Kong-China
0.17
-0.24
-0.23
-0.26
-0.26
-0.03
0.26
-0.20
0.18
0.25
Figure 3.3b Change between 2003 and 2012 in mathematics performance
across content area quantity
Notes: A logit is the logarithm of the odds of answering correctly. A logit value of 0 means that 50% of respondents answered the question correctly. Higher/lower logits correspond to higher/lower rates of correct responses and to lesser/greater item difficulty.The logit coefficients are calculated over the 8 items in quantity assessed both in 2003 and 2012.Only countries and economies with comparable data from PISA 2003 and PISA 2012 are shown.The OECD average is calculated as the average of 29 countries.Only statistically signi�cant average logit differences between 2012 and 2003 are shown next to the country/economy name.Countries and economies are ranked in ascending order of the average logit of questions in the content area quantity in 2012.Source: OECD, PISA 2012 Database, Table 3.3a.

equations and inequalities: making mathematics accessible to all © OECD 2016 131
3ExposurE to mathEmatics in school and pErformancE in pisa
12 http://dx.doi.org/10.1787/888933377284
20122003
Logit-2.50 -2.00 -1.50 -1.00 0.00-0.50 0.50
Indonesia
Brazil
Tunisia
Mexico
Uruguay
Thailand
Greece
Turkey
United States
Spain
Ireland
Hungary
Sweden
Russian Federation
Norway
Latvia
Iceland
Slovak Republic
Portugal
France
Luxembourg
OECD average
Italy
New Zealand
Denmark
Australia
Czech Republic
Canada
Netherlands
Austria
Germany
Poland
Belgium
Finland
Switzerland
Japan
Macao-China
Hong Kong-China
Korea
-0.49
0.34
-0.23
-0.31
-0.29
-0.31
0.43
-0.31
-0.08
-0.30
-0.29
-0.23
-0.35
-0.27
-0.24
Figure 3.3c Change between 2003 and 2012 in mathematics performance
across content area space and shape
Notes: A logit is the logarithm of the odds of answering correctly. A logit value of 0 means that 50% of respondents answered the question correctly. Higher/lower logits correspond to higher/lower rates of correct responses and to lesser/greater item difficulty.The logit coefficients are calculated over the 9 items in space and shape assessed both in 2003 and in 2012.Only countries and economies with comparable data from PISA 2003 and PISA 2012 are shown.The OECD average is calculated as the average of 29 countries.Only statistically signi�cant average logit differences between 2012 and 2003 are shown next to the country/economy name.Countries and economies are ranked in ascending order of the average logit of questions in the content area space and shape in 2012.Source: OECD, PISA 2012 Database, Table 3.3a.

© OECD 2016 equations and inequalities: making mathematics accessible to all132
3ExposurE to mathEmatics in school and pErformancE in pisa
12 http://dx.doi.org/10.1787/888933377292
20122003
Logit-2.00 -1.50 -1.00 0.00-0.50 1.000.50
Indonesia
Tunisia
Brazil
Thailand
Russian Federation
Turkey
Latvia
Greece
Hungary
Portugal
Luxembourg
Italy
France
United States
Spain
Sweden
Austria
OECD average
Denmark
Iceland
Norway
New Zealand
Ireland
Switzerland
Australia
Finland
Canada
Macao-China
Netherlands
Hong Kong-China
Mexico 0.22
Uruguay -0.24
Slovak Republic -0.21
Czech Republic -0.19
Poland 0.28
Korea 0.18
Belgium -0.13
Germany 0.22
Japan 0.19
0.19
Figure 3.3d Change between 2003 and 2012 in mathematics performance
across content area uncertainty and data
Notes: A logit is the logarithm of the odds of answering correctly. A logit value of 0 means that 50% of respondents answered the question correctly. Higher/lower logits correspond to higher/lower rates of correct responses and to lesser/greater item dif�culty.The logit coef�cients are calculated over the 7 items in uncertainty and data assessed both in 2003 and in 2012.Only countries and economies with comparable data from PISA 2003 and PISA 2012 are shown.The OECD average is calculated as the average of 29 countries.Only statisically signi�cant average logit differences between 2012 and 2003 are shown next to the country/economy name.Countries and economies are ranked in ascending order of the average logit of questions in the content area uncertainity and data in 2012.Source: OECD, PISA 2012 Database, Table 3.3a.

equations and inequalities: making mathematics accessible to all © OECD 2016 133
3ExposurE to mathEmatics in school and pErformancE in pisa
in the percentage of students answering those items correctly, see tables 3.3a and 3.3b). the deterioration in performance on tasks in the space and shape area is possibly a consequence of a de-emphasis on geometry in mathematics curricula in some countries (lehrer and chazan, 1998). this negative trend deserves further consideration, as geometry is often the only visually oriented mathematics that students are offered. students who receive training in the analysis of shapes develop their abilities to “see” the end product in their mind’s eye, inspect its individual elements, and make sufficiently good conjectures about their relationships. all of these skills are essential, not only for scientists but for everyone in their daily lives.
Variations in opportunity to lEarn and pErformancE in mathEmatics
Variations in time spent learning the amount of time that students spend learning is a basic component of their opportunity to learn (carroll, 1963; gromada and shewbridge, 2016). Pisa 2012 data based on students’ reports show that, on average across oecd countries, students spend about 3 hours and 38 minutes per week in mathematics class, 3 hours and 35 minutes in language-of-instruction class, and 3 hours and 20 minutes in science class, though the time varies considerably within countries (oecd, 2013b, table iV.3.21).
on average across oecd countries, learning time in regular mathematics lessons is positively correlated to student performance, even after accounting for various student and school characteristics, including socio-economic status (oecd, 2013b, table iV.1.12c). however, Figure 3.4 shows that this relationship is not linear. an increase in class time of up to four hours per week is associated with a large improvement in performance in the three Pisa subjects. after that threshold, longer instruction time is associated with smaller improvements in science performance and a deterioration in reading performance. more than six hours per week of class time is also associated with a slight deterioration in mathematics performance. Pisa 2006 data also show that performance in mathematics and reading starts deteriorating moderately after six or more hours of instruction per week (oecd, 2011). one possible explanation for the difference across the three subjects is that the students who spend a long time in regular school science lessons choose to do so in enrichment courses, because they are interested in science and attend schools with the resources and facilities to offer such courses, while students who spend a long time in regular school mathematics or language-of-instruction lessons are obliged to do so for remedial purposes.
besides remedial education, other school- and student-level differences can affect the time-achievement relationship. For instance, better performing students may be more likely to be enrolled in academic school tracks, to receive higher-quality instruction, and to be sorted into better classroom or school environments where they also receive longer instruction time, thus making it difficult to say whether longer time increases performance or whether better performing students receive longer instruction for other reasons. a number of studies have attempted to pin down the causal effect of instruction time on achievement by accounting for characteristics of students and schools (lavy, 2015; Rivkin and schiman, 2015) or by looking for variations in learning time not attributable to students’, parents’ or schools’ behaviour, such as those related to school reforms or to unscheduled school closing due to snow (bellei, 2009; lavy, 2012;

© OECD 2016 equations and inequalities: making mathematics accessible to all134
3ExposurE to mathEmatics in school and pErformancE in pisa
marcotte, 2007; marcotte and hemelt, 2008; Pischke, 2007). they have generally found a positive relationship between instruction time and performance.
Following an approach similar to that of Rivkin and schiman (2015), the analysis reflected in Figure 3.5 tries to isolate the link between instruction time and performance by showing how the score-point difference between mathematics and reading performance changes when the difference in instruction time for the two subjects increases by one hour.4 these estimates are based on differences in time and performance between subjects among students enrolled in the same school and grade, so as to reduce possible influences coming from the fact that better performing students get sorted into schools and grades providing longer instruction time in mathematics.
Figure 3.5 shows that mathematics performance improves compared with reading performance when the difference in instruction hours between mathematics and reading increases by one hour (that is, when students receive one hour more of instruction in mathematics per week than instruction in reading). this is observed in austria (an improvement of 12 score points), croatia (18 points), indonesia (4 points), italy (5 points), Japan (8 points), korea (15 points), malaysia (8 points), the netherlands (4 points), Romania (13 points), shanghai-china (17 points), singapore (7 points), chinese taipei (14 points), turkey (5 points) and Viet nam (10 points).
overall, this analysis of the relationship between instruction time and performance suggests that re-allocating time across subjects (moderately) increases students’ performance in Pisa only in a minority of countries and economies but that it does not automatically affect performance
Mathematics Reading Science
440
450
460
470
480
490
500
510
520
530
540
Less than 2 hours Between 2 and 4 hours Between 4 and 6 hours More than 6 hoursTime spent in school lessons
Mea
n sc
ore
Figure 3.4 Relationship between performance and time spent in school lessons
OECD average
Note: The OECD average performance in each subject is calculated only for countries with a valid score across all four time brackets.Source: OECD, PISA 2012 Database, Table 3.4a.12 http://dx.doi.org/10.1787/888933377309

equations and inequalities: making mathematics accessible to all © OECD 2016 135
3ExposurE to mathEmatics in school and pErformancE in pisa
12 http://dx.doi.org/10.1787/888933377313
Score-point difference-10 -5 0 5 10 15 20
IrelandIceland
Macao-ChinaLiechtenstein
NorwayBulgaria
New ZealandGreece
Costa RicaSwedenAlbania
SloveniaThailand
Slovak RepublicEstonia
BrazilUnited States
SpainChile
HungaryQatar
FinlandCanada
United Arab EmiratesPortugal
PeruUnited Kingdom
TunisiaLuxembourg
MexicoKazakhstan
Russian FederationDenmark
OECD averageUruguay
ArgentinaSwitzerland
ColombiaLithuania
Hong Kong-ChinaIsrael
AustraliaGermany
PolandBelgium
JordanFrance
NetherlandsIndonesia
TurkeyMontenegro
ItalyLatvia
SingaporeJapan
MalaysiaSerbia
Viet NamCzech Republic
AustriaRomania
Chinese TaipeiKorea
Shanghai-ChinaCroatia
Figure 3.5 Mathematics performance and instruction time, after accounting for school characteristics
Score-point difference between mathematics and reading performance associatedwith a one-hour difference between mathematics and reading instruction time
Notes: The chart shows how the score-point difference between mathematics and reading performance changes when the difference in the amount of time devoted to mathematics with respect to reading instruction increases by one hour. In the Netherlands, for example, student performance in mathematics improves by four points compared with reading performance if the difference between the hours of mathematics and the hours of reading classes increases by one hour. The differences in performance and instruction time are calculated as averages for students in the same school and grade, and account for the observable and unobservable characteristics of schools that might in�uence the relationship between hours of instruction and student performance.Statistically signi�cant score-point differences are marked in a darker tone.Countries and economies are ranked in ascending order of the effect of an additional hour of mathematics instruction on performance in mathematics compared with reading performance.Source: OECD, PISA 2012 Database, Table 3.5.

© OECD 2016 equations and inequalities: making mathematics accessible to all136
3ExposurE to mathEmatics in school and pErformancE in pisa
on a large scale. in other words, the relationship between instruction time and performance turns out to be relatively weak after taking into consideration that better schools provide more instruction time. these results are not surprising considering that the Pisa questionnaire provides information on the instruction time allocated to subjects, but not on the time that students spend engaged in learning.
if the quality of time spent learning in the classroom is poor, longer instruction time will not translate into greater opportunity to learn (gromada and shewbridge, 2016). more positive classroom environments – better student behaviour and good teacher-student relations – appear to augment the benefit of additional instruction time (Rivkin and schiman, 2015). Figure 3.6 shows the distribution of mathematics performance and of the index of disciplinary climate by the time per week students spend in mathematics class.5 in korea, students who are exposed to mathematics for a longer time score higher and enjoy a positive learning climate. this suggests that good class discipline allows long instruction hours to be more productive. by contrast, the longer the time students in switzerland spend in mathematics classes, the more they report poor performance and a poor classroom climate, suggesting that low-performing students spend more hours in the classroom, but these extra hours may fail to improve their performance because time is lost in noise and disorder.
in addition to regular classes, students are increasingly offered the opportunity to attend programmes providing additional instruction in school subjects outside of regular classes (kidron and lindsay, 2014). in Pisa 2012, students reported information about the time they spend in after-school lessons offered at their school, at their home or somewhere else. on average across oecd countries, 38% of students reported that they attend after-school lessons in mathematics, 27% attend after-school lessons in the language of instruction, and 26% attend such lessons in science (oecd, 2013b: table iV.3.25).
For all subjects, there is a negative correlation between performance and the time spent studying after school, on average across oecd countries (Figure 3.7). again, this relationship should not be interpreted as causal, as low-performing students are more likely to participate in after-school remedial courses or personal tutoring. Japan and korea are exceptions, as students in these countries who spend more hours in after-school mathematics lessons are also high performers in mathematics (table 3.4b). in these two countries, after-school supplementary courses are often intended to help students master academic subjects, improve their performance, and ultimately earn good scores on high-stake tests, such as the competitive college entrance examination (Park, 2013).
Variations in exposure to and familiarity with mathematicsopportunity to learn refers not only to the time a student spends learning given content, but also, and more importantly, to the content taught in the classroom. international and country-level research has highlighted a positive association between content coverage and achievement in mathematics (dumay and dupriez, 2007; Rowan, correnti, and miller, 2002; schmidt et al., 2001; schmidt et al., 2011) and science (sousa and armor, 2010). this section extends previous analyses of Pisa 2012 data investigating the link between exposure to and familiarity with mathematics on the one hand and mathematics performance on the other (oecd, 2014; schmidt, Zoido and cogan, 2014; schmidt et al., 2015).

equations and inequalities: making mathematics accessible to all © OECD 2016 137
3ExposurE to mathEmatics in school and pErformancE in pisa
Pisa data show that students’ mathematics performance is positively associated with their exposure to pure and applied mathematics as well as with their familiarity with mathematics concepts.
Mea
n sc
ore
Inde
x of
dis
cipl
inar
y cl
imat
e
Performance in mathematics Index of disciplinary climate
-0.60
-0.40
-0.20
0.00
0.20
0.40
0.60
300
350
400
450
500
550
600
650
700
Less than2 hours
Between2 and
4 hours
Between4 and
6 hours
More than6 hours
Korea
Mea
n sc
ore
Inde
x of
dis
cipl
inar
y cl
imat
e
-0.60
-0.40
-0.20
0.00
0.20
0.40
0.60
300
350
400
450
500
550
600
650
700
Less than2 hours
Between2 and
4 hours
Between4 and
6 hours
more than6 hours
OECD average
Mea
n sc
ore
Inde
x of
dis
cipl
inar
y cl
imat
e
-0.60
-0.40
-0.20
0.00
0.20
0.40
0.60
300
350
400
450
500
550
600
650
700
Less than2 hours
Between2 and
4 hours
Between4 and
6 hours
More than6 hours
Switzerland
Mea
n sc
ore
Inde
x of
dis
cipl
inar
y cl
imat
e
-0.60
-0.40
-0.20
0.00
0.20
0.40
0.60
300
350
400
450
500
550
600
650
700
Less than2 hours
Between2 and
4 hours
Between4 and
6 hours
More than6 hours
Netherlands
Figure 3.6 Time spent in mathematics lessons, performance in mathematics
and disciplinary climateIn hours per week
Notes: The index of disciplinary climate summarises students’ reports on the frequency of noise, disorder and inactivity in the classroom due to disciplinary issues.The OECD average of the index of disciplinary climate and of mathematics performance is calculated only for countries with a valid score across all four time brackets.Source: OECD, PISA 2012 Database, Tables 3.4a and 3.6. 12 http://dx.doi.org/10.1787/888933377320

© OECD 2016 equations and inequalities: making mathematics accessible to all138
3ExposurE to mathEmatics in school and pErformancE in pisa
First, Figure 3.8a shows that more frequent exposure to pure mathematics concepts is associated with better mathematics performance. on average across oecd countries, a one-unit increase in the index of exposure to pure mathematics is associated with an increase of 30 score points in mathematics performance. the link between exposure to pure mathematics and achievement is particularly strong in korea, the netherlands, new Zealand, singapore and chinese taipei, where a one-unit increase in exposure to pure mathematics is related to an increase of more than 40 score points in mathematics performance.
second, more frequent exposure to applied mathematics is also related to mathematics performance in most countries (Figure 3.8b), even though the effect is weaker than that linked to exposure to pure mathematics. on average across oecd countries, a one-unit increase in the index of exposure to applied mathematics is associated with an increase of about 9 score points in mathematics performance. the effect is strongest in australia, Finland, Japan, korea, new Zealand, chinese taipei and the united kingdom (more than 20 score points) while it is negative in greece, shanghai-china, the slovak Republic, spain, turkey and uruguay.
the association between exposure to applied mathematics and mathematics performance is weaker than that between pure mathematics and mathematics performance (or even negative). this may be due to reverse causality. the mathematics tasks Pisa uses to measure exposure to
430
440
450
460
470
480
490
500
510
520
530
520
No time Less than 2 hours Between 2and 4 hours
Between 4and 6 hours
Time per week spent in after-school lessons
Mea
n sc
ore
More than 6 hours
Mathematics ScienceReading
Figure 3.7 Relationship between performance and time spent in after-school lessons
In hours per week, OECD average
Notes: After-school lessons include lessons in subjects that students are also learning at school, on which they spend extra learning time outside of normal school hours. The lessons may be given at their school, at home or somewhere else.The OECD average performance in each subject is calculated only for countries with a valid score across all the �ve time brackets. Source: OECD, PISA 2012 Database, Table 3.4b.12 http://dx.doi.org/10.1787/888933377330

equations and inequalities: making mathematics accessible to all © OECD 2016 139
3ExposurE to mathEmatics in school and pErformancE in pisa
12 http://dx.doi.org/10.1787/888933377349
Score-point difference-20 -10 0 10 20 30 40 50 60 70
KoreaChinese Taipei
NetherlandsSingapore
New ZealandMalaysia
Hong Kong-ChinaBelgium
QatarAustralia
SwitzerlandUnited Arab Emirates
GermanyJapan
LiechtensteinFrance
PeruLithuania
United KingdomIceland
United StatesFinlandAustria
ItalyOECD average
Slovak RepublicNorway
ThailandRussian Federation
PortugalTurkey
IsraelLatvia
BulgariaHungary
JordanIrelandCanada
SloveniaLuxembourg
TunisiaCroatia
Czech RepublicPoland
Viet NamGreece
SpainChile
MontenegroMexico
RomaniaUruguaySweden
KazakhstanSerbia
Macao-ChinaArgentina
EstoniaCosta RicaColombiaIndonesia
BrazilDenmark
Shanghai-ChinaAlbania
Lowest-achieving students (10th percentile)Highest-achieving students (90th percentile)
Average students
Relationship between exposure to pure mathematics and mathematics performanceScore-point difference in mathematics performance associated with a one-unit increase
in the index of exposure to pure mathematics
Notes: The index of exposure to pure mathematics measures student-reported experience with mathematics tasks at school requiring knowledge of algebra (linear and quadratic equations).Statistically signi�cant values are marked in a darker tone.Countries and economies are ranked in descending order of the score-point difference associated with a one-unit change in the index of exposure to pure mathematics for the average students.Source: OECD, PISA 2012 Database, Table 3.7.
Figure 3.8a

© OECD 2016 equations and inequalities: making mathematics accessible to all140
3ExposurE to mathEmatics in school and pErformancE in pisa
Score-point difference-30 -20 -10 0 10 20 30 40
Lowest-achieving students (10th percentile)Highest-achieving students (90th percentile)
Average students
KoreaChinese Taipei
New ZealandJapan
FinlandAustralia
United KingdomFrance
MalaysiaIreland
NorwayCanada
LiechtensteinUnited States
IcelandPoland
ThailandBelgium
ChileUnited Arab Emirates
CroatiaLuxembourg
SwedenSwitzerland
OECD averageSingaporeLithuania
AustriaPortugal
JordanLatvia
ColombiaEstonia
IndonesiaHong Kong-China
PeruMontenegro
MexicoBrazil
SloveniaRomania
Russian FederationGermanyDenmarkArgentina
HungaryNetherlands
QatarTunisia
ItalyAlbania
KazakhstanViet Nam
BulgariaSerbia
Costa RicaMacao-China
SpainIsrael
Czech RepublicTurkey
Shanghai-ChinaUruguay
GreeceSlovak Republic
Relationship between exposure to applied mathematics and mathematics performanceScore-point difference in mathematics performance associated with a one-unit increase
in the index of exposure to applied mathematics
Notes: The index of exposure to applied mathematics measures student-reported experience with applied mathematics tasks at school, such as working out from a train timetable how long it would take to get from one place to another or calculating how much more expensive a computer would be after adding tax.Statistically signi�cant values are marked in a darker tone.Countries and economies are ranked in descending order of the score-point difference associated with a one-unit change in the index of exposure to applied mathematics for the average students.Source: OECD, PISA 2012 Database, Table 3.7.
Figure 3.8b
12 http://dx.doi.org/10.1787/888933377355

equations and inequalities: making mathematics accessible to all © OECD 2016 141
3ExposurE to mathEmatics in school and pErformancE in pisa
applied mathematics are relatively easy for 15-year-old students (e.g. working out from a train timetable how long it would take to get from one place to another), and low-performing students are more likely than higher-achieving students to have been exposed to this type of problem.
third, mathematics performance is also related to greater familiarity with mathematics concepts (Figure 3.8c), the measure that better captures the cumulative opportunity to learn mathematics content over a student’s career. on average across oecd countries, a one-unit increase in the index of familiarity with mathematics (equivalent to the difference between having heard of a series of mathematics concepts “often” and “a few times”; see chapter 1) corresponds to a 41 score-point increase in mathematics performance. this association is stronger (an increase of more than 50 score points) in australia, korea, new Zealand and chinese taipei.
Pisa asked students how frequently they are exposed to specific problems during mathematics lessons or assessments, including algebraic word problems, procedural tasks, contextualised mathematics problems, and pure mathematics problems (see box 1.2 in chapter 1 and questions at the end of chapter 1 for some examples). tables 3.8a-d show that students who are frequently exposed to these problems in mathematics classes perform better in mathematics than students who are never exposed to them. across the four types of tasks, the relationship between exposure and performance is strongest for procedural tasks and weakest for contextualised mathematics tasks, on average across oecd countries. this confirms that exposure to pure mathematics is more closely related to performance in Pisa than exposure to applied mathematics is. the results suggest that the use of real-life examples is not enough to transform routine problems into challenging mathematics problems that build mathematics literacy. students – and low-achieving students in particular – might also have problems in transferring what they learn in a specific context to other contexts (see box 1.3 in chapter 1). When interpreting these results, it is important to keep in mind that it is much easier to measure exposure to pure mathematics than to measure exposure to applied and contextualised mathematics, given that applied mathematics problems are, by nature, more ambiguous and diverse.
in most countries and economies, the association between opportunity to learn and mathematics performance is stronger among high-achieving students than among low-achieving students (Figures 3.8a, 3.8b and 3.8c). in brazil, new Zealand, Peru, thailand and turkey, the effect of familiarity with mathematics on performance is more than 20 score points larger for the 10% of students with the highest scores than for the 10% of students with the lowest scores. in these countries, it is possible that high-achieving students can better profit from what they are taught but it may also be that they are exposed to a more advanced curriculum (table 3.7).
but in a number of countries and economies, the reverse is true: the association between exposure to/familiarity with mathematics and mathematics performance is stronger among low achievers than among high achievers. For instance, in hong kong-china, liechtenstein, macao-china, shanghai-china, singapore and chinese taipei, the difference in performance related to frequent exposure to pure mathematics is at least 15 score points larger among low achievers than among high achievers (Figure 3.8a and table 3.7). Perhaps, in these countries and economies, mathematics concepts are taught in such an accessible way that low-performing students benefit even more than high-performing students do, thus suggesting that the organisation of curriculum and teaching

© OECD 2016 equations and inequalities: making mathematics accessible to all142
3ExposurE to mathEmatics in school and pErformancE in pisa
Score-point difference
Lowest-achieving students (10th percentile)Highest-achieving students (90th percentile)
Average students
-10 0 10 20 30 40 50 60 70
KoreaNew Zealand
AustraliaChinese Taipei
SwitzerlandLiechtenstein
HungarySingaporeGermanySlovenia
FranceItaly
PortugalNetherlands
CroatiaUnited States
Slovak RepublicUnited Kingdom
SwedenBelgiumAustria
OECD averageBrazilPeru
PolandCanada
LuxembourgIreland
QatarChile
Czech RepublicThailand
SerbiaUruguay
TurkeyLithuania
JapanIndonesia
United Arab EmiratesBulgaria
Shanghai-ChinaIceland
SpainFinland
ColombiaIsrael
Russian FederationMontenegro
GreeceViet Nam
LatviaEstonia
MalaysiaDenmark
MexicoJordan
Macao-ChinaCosta Rica
RomaniaArgentina
KazakhstanHong Kong-China
TunisiaAlbania
Relationship between familiarity with mathematics and mathematics performanceScore-point difference in mathematics performance associated with a one-unit increase
in the index of familiarity with mathematics
Notes: The index of familiarity with mathematics is based on students’ responses to 13 items measuring students’ self-reported familiarity with mathematics concepts (such as exponential functions, divisor, quadratic function, etc.).The OECD average for familiarity with mathematics concepts is thus calculated as the average of 33 countries.Statistically signi�cant values are marked in a darker tone.Countries and economies are ranked in descending order of the score-point difference associated with a one-unit change in the index of familiarity with mathematics for the average students.Source: OECD, PISA 2012 Database, Table 3.7.
Figure 3.8c
12 http://dx.doi.org/10.1787/888933377366

equations and inequalities: making mathematics accessible to all © OECD 2016 143
3ExposurE to mathEmatics in school and pErformancE in pisa
can help to narrow the achievement gap. chapter 5 will discuss these policies and provide more examples.
the link between exposure to mathematics content and performance varies by the frequency of exposure. Figure 3.9 shows that more frequent exposure to pure mathematics is associated with smaller improvements in performance than less frequent exposure is. Figure 3.9 also shows that mathematics performance improves slightly between the first and the third quintiles of exposure to applied mathematics and decreases slightly among students who reported more frequent exposure (the fourth and fifth quintiles). again, the slightly negative association between performance and a very frequent exposure to applied mathematics is unlikely to mean that greater exposure to applied mathematics reduces performance; it may rather come from the fact that the mathematics tasks Pisa uses to measure exposure to applied mathematics are relatively easy and may be used to make mathematics accessible to low-performing students.
not only is exposure to mathematics associated with average performance, it is also related to a student’s chances of being a low performer (that is, of performing at or below level 1 on the Pisa mathematics scale) or a top performer (that is, of performing at or above level 5). Figure 3.10 shows that, for an average student in an oecd country, a one-unit increase in the index of exposure to pure mathematics doubles the likelihood of being a top performer,
12 http://dx.doi.org/10.1787/888933377377
Exposure to applied mathematics Exposure to pure mathematics
440
450
460
470
480
490
500
510
520
530
First quintile Second quintile Third quintile Fourth quintile Fifth quintile
Mea
n sc
ore
Figure 3.9 Performance in mathematics, by exposure to applied and pure mathematics
OECD average
Notes: The index of exposure to applied mathematics measures student-reported experience with applied mathematics tasks at school, such as working out from a train timetable how long it would take to get from one place to another or calculating how much more expensive a computer would be after adding tax.The index of exposure to pure mathematics measures student-reported experience with mathematics tasks at school requiring knowledge of algebra (linear and quadratic equations).Source: OECD, PISA 2012 Database, Table 3.9.

© OECD 2016 equations and inequalities: making mathematics accessible to all144
3ExposurE to mathEmatics in school and pErformancE in pisa
12 http://dx.doi.org/10.1787/888933377389
Low performers Top performers
Odds ratio0.00 1.00 2.00 3.00 4.00 5.00 6.00 7.00 8.00 9.00
AlbaniaDenmark
BrazilEstoniaSerbia
IndonesiaUruguay
ArgentinaSweden
Costa RicaColombiaViet Nam
KazakhstanRomaniaPortugal
Macao-ChinaIsrael
MexicoShanghai-China
SloveniaGreece
LuxembourgSpain
CroatiaMontenegro
Czech RepublicPoland
ChileHungaryBulgariaCanadaTurkey
Slovak RepublicItaly
OECD averageFranceLatvia
AustriaRussian Federation
United StatesThailand
United KingdomIcelandIreland
NorwayAustraliaGermany
TunisiaLithuania
SwitzerlandFinland
New ZealandLiechtenstein
JapanJordan
BelgiumUnited Arab Emirates
NetherlandsQatar
Hong Kong-ChinaPeru
SingaporeChinese Taipei
MalaysiaKorea
How to read the chart: An odds ratio of two for top-performance means that a one-unit increase in the index of exposure to pure mathematics doubles the probability that the student is a top performer in mathematics. Similarly, an odds ratio of 0.5 for low performance means that a one-unit increase in the index of exposure to pure mathematics reduces the probability of low performance by half.Notes: Low performers are students who score below pro�ciency Level 2. Top performers are students who score at or above pro�ciency Level 5.Values that are statistically signi�cant are marked in a darker tone.Countries and economies are ranked in descending order of the effect of exposure to pure mathematics on the likelihood of low performance.Source: OECD, PISA 2012 Database, Table 3.10.
Figure 3.10 Exposure to pure mathematics and the likelihood of top and low performance
Change in the likelihood of low and top performance associated with a one-unit changein the index of exposure to pure mathematics

equations and inequalities: making mathematics accessible to all © OECD 2016 145
3ExposurE to mathEmatics in school and pErformancE in pisa
and reduces by half the probability that this student is a low performer. in colombia, korea, malaysia, the netherlands, qatar, thailand and the united arab emirates, a one-unit increase in the index of exposure to pure mathematics triples the likelihood that a student is a top performer.
the positive association between exposure to mathematics and performance in Pisa does not necessarily indicate a causal link, as the direction of causality is not clear. greater exposure to mathematics may improve performance, but at the same time, students with greater mathematical ability and motivation may choose – or be sorted into – schools that offer them greater exposure to mathematics.
this causality problem can be mitigated by analysing how different levels of exposure to mathematics influence the performance of students who attend the same school, as this excludes school factors that might influence the relationship. Pisa randomly selects students of a given age within each school, so for the majority of Pisa countries and economies it is possible to compare students who attend different grades within the same school. as shown in chapter 1 (Figure 1.9), students in higher grades are more frequently exposed to pure mathematics. to investigate the relationship between exposure to pure mathematics and performance, the analysis will look at differences in exposure between students who attend different grades within the same school. this method accounts for differences across schools that might have an influence on the results presented so far (such as the fact that better performing students may choose schools that offer them more mathematics instruction) but does not account for ways in which students may be sorted within schools (for example, through ability grouping within the school).
Figure 3.11 shows that, across oecd countries, students who attend a higher grade have higher mathematics performance by 29 score points than students in the same school who attend a lower grade because they are more exposed to pure mathematics (by one index point).6 across students in the same school, the improvement in performance associated with greater exposure is larger than 50 score points in korea, luxembourg, malaysia, qatar and spain. this implies that offering all students the opportunity to be exposed to a coherent curriculum does matter for mathematics performance.
Familiarity with mathematics and problem-solving skills in order to determine how familiarity with mathematics is related to performance on demanding tasks, another analysis focuses on student performance on Pisa tasks of various levels of difficulty or requiring different skills (box 3.1 provides more details on analysis at the task level). does greater exposure to and greater familiarity with mathematics mean that students will be equipped with all the skills they need to face complex mathematics problems?
Figure 3.12 shows that the greater students’ familiarity with mathematics concepts, the more mathematics items (on the paper-based Pisa assessment7) students answer correctly, on average across oecd countries. the association is stronger for more challenging tasks. For example, a one-unit increase in the index of familiarity with mathematics more than doubles (2.6 times) the likelihood that students answer correctly a difficult item like aRches question 2 (difficulty of 785 on the Pisa scale), but raises by only 1.5 times the likelihood of a correct response to an easy

© OECD 2016 equations and inequalities: making mathematics accessible to all146
3ExposurE to mathEmatics in school and pErformancE in pisa
12 http://dx.doi.org/10.1787/888933377391
Score-point difference-40 -20 0 20 40 60 80 100 120 140 160
Slovak RepublicShanghai-China
AlbaniaSerbia
SloveniaMacao-China
RomaniaPortugalBulgariaMexico
BrazilColombia
AustriaTunisia
IndonesiaEstonia
Costa RicaLiechtenstein
CroatiaAustraliaHungary
KazakhstanIsrael
MontenegroDenmark
IrelandArgentina
CanadaPeru
ThailandGermany
JordanNew Zealand
UruguayChile
LatviaOECD average
United Arab EmiratesHong Kong-China
Russian FederationChinese Taipei
Czech RepublicNetherlands
TurkeyItaly
United KingdomPoland
LithuaniaUnited States
BelgiumSweden
SingaporeFrance
FinlandNorway
SwitzerlandQatar
MalaysiaSpain
LuxembourgViet Nam
Korea
How to read the chart: On average across OECD countries, 15-year-old students in one grade score 29 points more in mathematics than students one grade below in the same school if the difference in the index of exposure to pure mathematics between the two grades is equal to one unit. The estimates can be interpreted as the effect of pure mathematics on perfomance after accounting for observable and unobservable differences across schools.Notes: Only students in the modal grade and one grade below or above the modal grade are included in the analysis.Statistically signi�cant values are marked in a darker tone.Countries and economies are ranked in ascending order of the score-point difference between grades.Source: OECD, PISA 2012 Database, Table 3.11.
Figure 3.11 Difference in mathematics performance across grades related
to exposure to pure mathematicsScore-point difference between grades in the same school associated
with a one-unit difference in the index of exposure to pure mathematics

equations and inequalities: making mathematics accessible to all © OECD 2016 147
3ExposurE to mathEmatics in school and pErformancE in pisa
box 3.1. analysis of performance in pisa at the task level
one of the key strengths of Pisa is that the assessment items (tasks) vary considerably in the type of response format, the contexts in which the problem sets are framed, and the type of content knowledge and cognitive processes that they aim to assess. the Pisa mathematics tasks can be classified according to what is required of students, including their:
knowledge of the mathematics content areas of change and relationships, space and shape, quantity and uncertainty and data. these overarching “big ideas” guide the conceptual understanding of traditional mathematics topics, such as algebra and functions, geometry and measurement.
capacity to address problems framed in contexts dealing with personal life, the social environment in which students live, the world of work, or the use of mathematics in science and technology.
capability to engage in the cognitive processes needed to cover the full cycle of mathematics modelling – formulate, employ and interpret.
Pisa items are ranked according to their level of difficulty. the difficulty of the items is calculated after the test is conducted, using a scaling approach known as item Response theory, which estimates the difficulty of items and students’ score on the test simultaneously. the lower the percentage of students who give the correct answer, the more difficult the item. For example, students with a score of 348 points have a 62% probability (this probability was chosen by the Pisa consortium as part of the scoring design) of solving chaRts question 1 (see examples at the end of the chapter).8 this item thus sits at 348 points on the Pisa scale of difficulty. analysing performance at the task level allows for identifying the relative strengths and weaknesses of countries or groups of students in particular areas and processes of mathematics. this section looks at how students perform across items at different levels of difficulty and focuses on four Pisa tasks:
Description Content ProcessPercentage of correct
responses at the international level
CHARTS Question 1
the students are shown a bar graph reporting the sales of cds from four music bands. they need to identify and extract a data value from the chart to answer a simple question.
uncertainty and data
Formulate 87%
DRIP RATE Question 1
the task’s stimulus explains a formula used by nurses to calculate the drip rate (in drops per minute) for infusions. the students need to interpret an equation linking four variables, and provide an explanation of the effect of a specified change to one variable on a second variable if all the other variables remain unchanged.
change and relationships
employ 22%
...

© OECD 2016 equations and inequalities: making mathematics accessible to all148
3ExposurE to mathEmatics in school and pErformancE in pisa
item like chaRts question 1 (difficulty of 348). students who solve aRches can interpret a text containing technical terms, and apply their procedural knowledge (trigonometry or Pythagorean theory) to calculate a length.
knowing mathematics terminology, facts and procedures has a positive impact on overall performance and is even more valuable for solving more challenging problems. it may seem that if you want to improve students’ ability to solve difficult mathematics problems, you may just extend the coverage of the mathematics curriculum and give students more time to practice their procedural skills. but that is only partly true. it takes more than content knowledge and practice to develop a good problem solver.
For example, compare the items dRiP Rate question 1 and ReVolVing dooR question 2, both of which show strong associations between familiarity and correct answers. both are difficult test questions (although not equally difficult) that require students to use their knowledge to solve new problems (see the full text of both tasks at the end of this chapter).
dRiP Rate question 1 is a task at difficulty level 5 that requires students to answer a question
using a formula Drip rate =dvn60
that is explicitly stated in the stimulus. ReVolVing dooR
question 2 is the most difficult task in the assessment, lying at the upper end of level 6. it asks students to engage in complex geometric reasoning and to perform calculations based on a formula that they should know but that is not recalled in the stimulus. the real problem of designing an efficient revolving door described in the item’s stimulus needs to be translated
Description Content ProcessPercentage of correct
responses at the international level
REVOLVING DOOR Question 2
the task describes a revolving door and presents diagrams that include information above the diameter and different positions of the door wings. the students are asked to calculate the maximum arc length that each door can have so that air never flows between entrance and exit. students not only have to apply their knowledge of circle geometry (the formula of the circumference) but also engage in sophisticated reasoning to formulate a mathematical model. the task gives students no suggested approaches so that they have to invent their own strategies.
space and shape
Formulate 3%
ARCHES Question 2
the problem contains technical terms that students need to interpret in relation to a diagram. the students are asked to formulate a geometric model and apply their procedural knowledge of trigonometry or of the Pythagorean theorem to calculate a length.
space and shape
Formulate 5%

equations and inequalities: making mathematics accessible to all © OECD 2016 149
3ExposurE to mathEmatics in school and pErformancE in pisa
into geometrical terms and back again at multiple points. only people who are highly skilled in mathematics have the capacity to model a real situation in a mathematical form.
the top panel of Figure 3.13 shows that students with greater familiarity with mathematics are more likely to complete correctly a relatively difficult task, like dRiP Rate question 1. between-country differences in familiarity explain 57% of the variation in the correct response rate. this strong relationship between familiarity and performance on dRiP Rate might be due to a causal effect of familiarity on students’ capacity to respond correctly, or to the fact that the countries where students perform better in Pisa (because of the quality of the teachers, the motivations of students or parents, or other possible reasons) are also the countries with a more challenging mathematics curriculum. looking at the relationship between solution rates to the dRiP Rate question 1 task and familiarity after accounting for countries’ performance on all the other mathematics tasks can help to clarify the direction of causality. even after taking into account students’ performance on all the other tasks in the Pisa test, familiarity with mathematics is still positively associated with completing the task dRiP Rate correctly, and explains 22% of the system-level variation in the solution rate (bottom panel of Figure 3.13).
12 http://dx.doi.org/10.1787/888933377406
Dif�culty of items on the PISA mathematics scale
Odd
s ra
tios
Lowerpositiveeffect
Higherpositiveeffect
Effe
ct o
f fam
iliar
ity
“DRIP RATE(Question 1)”
“CHARTS(Question 1)”
“ARCHES (Question 2)”
“REVOLVINGDOOR
(Question 2)”
R² = 0.39
1.00
1.20
1.40
1.60
1.80
2.00
2.20
2.40
2.60
2.80
300 350 400 450 500 550 600 650 700 750 800 850
Students with greater familiarity are morelikely to answer all items correctly
Figure 3.12 Familiarity with mathematics and success on PISA items, by items’ dif�culty
OECD average (31 countries)
How to read the chart: Values greater than 1 on the vertical axis mean that a one-unit increase in the index of familiarity with mathematics increases the probability of answering a given question correctly.Notes: The OECD countries included in the analysis are: Australia, Austria, Belgium, Canada, the Czech Republic, Denmark, Estonia, Finland, France, Germany, Greece, Hungary, Iceland, Ireland, Israel, Italy, Japan, Korea, Luxembourg, the Netherlands, New Zealand, Poland, Portugal, Slovenia, the Slovak Republic, Spain, Sweden, Switzerland, Turkey, the United Kingdom and the United States. The analysis only includes the items administered to those countries.The dif£culty of the item is set at a 0.62 threshold, meaning that a student who scores 600 in mathematics has a 62% chance of correctly answering an item with a dif£culty level of 600.Source: OECD, PISA 2012 Database, Table 3.12.

© OECD 2016 equations and inequalities: making mathematics accessible to all150
3ExposurE to mathEmatics in school and pErformancE in pisa
Australia
DenmarkEstonia
France
GreeceIcelandIreland
Japan
Korea
Luxembourg
Poland
Portugal
11
Hong Kong-China
Indonesia
Malaysia Montenegro
Qatar
Shanghai-China
Singapore
Chinese Taipei R2 = 0.57
-3.50
-3.00
-2.50
-2.00
-1.50
-1.00
-0.50
0.00
0.50
1.00
1.50
2.00
-1.00 -0.50 0.00 0.50 1.00 1.50
-1.00 -0.50 0.00 0.50 1.00 1.50
2 34 5
671
89
10
Austria
2
67
Estonia
4
1
Greece
IcelandIreland
Israel
Korea
Luxembourg
Netherlands
New Zealand
Poland
5
Spain
8
Switzerland
Turkey
Croatia
Indonesia
Latvia
Macao China
Malaysia
3
Russian Federation
Singapore
Thailand
-1.60
-1.40
-1.20
-1.00
-0.80
-0.60
-0.40
-0.20
0.00
Logi
t for
the
item
“D
RIP
RA
TE (Q
uest
ion
1)”
Logi
t for
the
item
“D
RIP
RA
TE (Q
uest
ion
1)”
Index of familiarity with mathematics
Before accounting for performance on all other tasks
After accounting for performance on all other tasks
Index of familiarity with mathematics
SwitzerlandCroatiaLithuaniaCanadaSloveniaRussian FederationAustriaGermanyBelgiumFinlandUnited StatesSlovak Republic
1.2.3.4.5.6.7.8.9.
10.11.12.
Israel
TurkeyHungary
Czech RepublicLatvia
Macao China
Netherlands
New Zealand
Thailand
Sweden12Italy
OECD average
GermanyBelgium QatarFinlandPortugalCanadaDenmarkSweden
1.2.3.4.5.6.7.8.
R2 = 0.22
HungaryItaly
OECD average
France
Lithuania
Slovenia
United Kingdom
AustriaJapanSlovak Republic
United States
Chinese Taipei
Montenegro
Shanghai-China
Spain
Hong Kong-China
United Kingdom
Czech Republic
Figure 3.13 Familiarity with mathematics and performance
on a difficult mathematics taskCountry average logit for the PISA Level 5 item ‘‘DRIP RATE (Question 1)”
Notes: The index of familiarity with mathematics is based on students’ responses to 13 items measuring students’ self-reported familiarity with mathematics concepts (such as exponential function, divisor, quadratic function, etc.).A logit is the logarithm of the odds of answering correctly. A logit value of 0 means that 50% of respondents answered the question correctly. Higher/lower logits correspond to higher/lower rates of correct responses and to lesser/greater item difficulty.The OECD average is based on 31 countries with available data.Source: OECD, PISA 2012 Database, Table 3.13. 12 http://dx.doi.org/10.1787/888933377412

equations and inequalities: making mathematics accessible to all © OECD 2016 151
3ExposurE to mathEmatics in school and pErformancE in pisa
this means that a higher familiarity with mathematics matters relatively more in explaining performance on a task that requires students to apply their procedural knowledge to a real setting than in other types of tasks.
similarly, the top panel of Figure 3.14 shows that students in countries with greater familiarity with mathematics are more likely to answer correctly ReVolVing dooR question 2. but after accounting for performance on all the other tasks, a country’s average level of familiarity with mathematics is not correlated with the percentage of students who answered correctly (bottom panel of Figure 3.14). after taking students’ overall mathematics ability into account, greater familiarity is positively associated with the ability to answer the task dRiP Rate correctly but not the item ReVolVing dooR question 2, which requires students to engage in more advanced reasoning.
the different relationship between familiarity and performance in the two tasks, before and after accounting for students’ overall performance, suggests that familiarity can improve performance in Pisa, but only up to a point. the same analysis gives similar results when performed at the student level. after accounting for performance on all the other tasks, familiarity with mathematics is positively related to correct answers to dRiP Rate in 13 of 31 oecd countries and to ReVolVing dooR in only in 4 of 31 oecd countries (table 3.15). Frequent exposure to mathematics can make a difference to students trying to tackle problems like dRiP Rate, which states the main terms of the problem and requires students to apply procedures they learned at school. but familiarity with mathematics alone may not be sufficient for solving problems that require the ability to think and reason mathematically, like ReVolVing dooR.
developing competence and flexibility to solve demanding problems thus requires both a solid knowledge of mathematics content and extensive practice in searching for creative solutions to mathematics problems. effective mathematics teachers cover the fundamental elements of the mathematics curriculum and still find the time to expose student to problems that promote conceptual understanding and activate students’ cognitive abilities. Recognising mathematics problem solving as one of the ultimate goals of mathematics education, many countries are making specific efforts to develop higher-order thinking skills through the mathematics curriculum: see box 3.2 for some examples.
thE links bEtWEEn opportunity to lEarn, mathEmatics litEracy and socio-Economic status
the analyses presented so far have shown a strong link between opportunity to learn and socio-economic status, and another strong link between opportunity to learn and performance in Pisa. Putting the two stories together, how much of the performance gap related to socio-economic status can be explained by the frequency of exposure to mathematics? Figure 3.15 shows that around 19% of the performance difference between socio-economically advantaged and disadvantaged students can be attributed to differences in their familiarity with mathematics, on average across oecd countries (16% after taking into account other student and school characteristics). in korea, the performance gap related to socio-economic status would be

© OECD 2016 equations and inequalities: making mathematics accessible to all152
3ExposurE to mathEmatics in school and pErformancE in pisa
-1.50 -0.50 0.00 0.50 1.00 1.50
-1.50
-1.00
-1.00 -0.50 0.00 0.50 1.00 1.50
Logi
t for
the
item
“R
EVO
LVIN
G D
OO
R (Q
uest
ion
2)”
Logi
t for
the
item
“R
EVO
LVIN
G D
OO
R (Q
uest
ion
2)”
Index of familiarity with mathematics
Before accounting for performance on all other tasks
After accounting for performance on all other tasks
Index of familiarity with mathematics
R2 = 0.18Australia Belgium
11
Finland
France
Greece
Ireland
Israel
Korea
Luxembourg
Spain
Switzerland
TurkeyCroatia
Macao China
Malaysia
Montenegro
Qatar
Shanghai-ChinaSingapore
Thailand
-5.50
-5.00
-4.50
-4.00
-3.50
-3.00
-2.50
-2.00
-1.50
-1.00
2
13
4
57
8
9
10
Austria
13
Denmark
14
Finland
12
Greece
Ireland
Israel
LuxembourgPoland
Spain
15
Macao ChinaMalaysia
Qatar
Shanghai-China
Singapore
Thailand
-5.00
-4.50
-4.00
-3.50
-3.00
-2.50
-2.00
-1.50
-1.00
1
5
3 4
2
67
8
9
11 10
7.8.9.
10.11.
OECD averageIcelandAustriaCzech RepublicDenmark
1.2.3.4.5.6.
PortugalLithuaniaRussian FederationSlovak RepublicSloveniaItaly
1.2.3.4.5.6.7.8.
PortugalSloveniaRussian FederationSlovak RepublicLithuaniaItalyOECD averageIceland
9.10.11.12.13.14.15.
AustriaCzech RepublicMontenegroGermanyBelgiumEstoniaSweden
Indonesia
Chinese Taipei
Japan
Korea
HungaryUnited States
TurkeyCroatia
United KingdomFrance
Netherlands
Switzerland CanadaNew Zealand
Latvia
Hong Kong-China
R2 = 0.02
Chinese TaipeiHong Kong-China
EstoniaPoland
CanadaNetherlands
New Zealand
Sweden
United Kingdom
HungaryUnited States
Germany
6
Japan
Indonesia
Latvia
Figure 3.14 Familiarity with mathematics and performance
on the most difficult mathematics taskCountry average logit for the PISA Level 6 item ‘‘REVOLVING DOOR (Question 2)”
Notes: The index of familiarity with mathematics is based on students’ responses to 13 items measuring students’ self-reported familiarity with mathematics concepts (such as exponential function, divisor, quadratic function, etc.).A logit is the logarithm of the odds of answering correctly. A logit value of 0 means that 50% of respondents answered the question correctly. Higher/lower logits correspond to higher/lower rates of correct responses and to lesser/greater item difficulty.The OECD average is based on 31 countries with available data.Source: OECD, PISA 2012 Database, Table 3.14. 12 http://dx.doi.org/10.1787/888933377428

equations and inequalities: making mathematics accessible to all © OECD 2016 153
3ExposurE to mathEmatics in school and pErformancE in pisa
reduced by 29 points (34% of the total) if disadvantaged students had the same familiarity with mathematics as advantaged students have (table 3.16).
box 3.2. integrating higher-order thinking skills in the mathematics curriculum
in addition to covering relevant mathematics contents, a number of countries have recently reformed their mathematics curricula with a view to fostering students’ higher-order thinking skills and problem-solving ability. a few examples are reported below.
the national curriculum for mathematics in England published in 2013 aims to ensure that all pupils not only become fluent in the fundamentals of mathematics, but also acquire the skills to reason mathematically and to solve problems by applying their mathematics to a variety of routine and non-routine problems with increasing sophistication (department for education, england, 2013). also the new curriculum for excellence (cfe) in Scotland emphasises the development of higher-order skills, such as thinking about complex issues, problem solving, analysis and evaluation; creativity; and critical-thinking skills – making judgements and decisions, developing arguments and solving complex problems (education scoltland, 2011).
in Korea, teaching and learning problem solving was part of the curriculum since the 1980s. the 2007 revision aimed at further engaging students in mathematical processes such as mathematical reasoning, problem solving, and communication. as a part of the 2007 revision of the lower secondary school curriculum, problem solving was integrated into all mathematics areas (kim et al., 2012).
mathematical problem solving is the central priority of Singapore’s mathematics framework introduced in the 1990s. the primary aim of the mathematics curriculum is to enable pupils to develop their ability in mathematical problem solving, which includes using and applying mathematics in practical tasks, in real life problems and within mathematics itself (ginsburg et al., 2005; ministry of education, singapore 2012). in addition, the teach less, learn more (tllm) initiative launched in 2003 aimed at reducing the curriculum content taught via direct teaching and engage students in more thinking and problem-solving tasks (berinderjeet et al., 2009).
again, looking at individual tasks in Pisa can provide a more fine-grained picture of how opportunity to learn mediates the relationship between socio-economic status and mathematical literacy. Figure 3.16 shows that disadvantaged students lag behind other students across all items, but more so on the most difficult items. on average across oecd countries, a disadvantaged student can be expected to be 23% less likely to solve the easy item chaRts question 1 than the average student, but he or she is more than 70% less likely to solve ReVolVing dooR question 2.
Figure 3.16 also shows that when disadvantaged students’ relative lack of familiarity with mathematics is taken into account, the performance gap related to socio-economic status narrows. but the effect varies, depending on the difficulty of the mathematics problem. For example, the effect is stronger on aRches question 2, a task that mostly requires students to

© OECD 2016 equations and inequalities: making mathematics accessible to all154
3ExposurE to mathEmatics in school and pErformancE in pisa
Before accounting for student and school characteristicsAfter accounting for student and school characteristics
Percentage of the score-point difference between advantaged and disadvantaged students-30 -20 -10 0 10 20 30 40
Macao-ChinaHong Kong-China
TunisiaMalaysia
EstoniaMexico
DenmarkIsrael
Costa RicaViet Nam
KazakhstanArgentina
LatviaGreece
LithuaniaShanghai-China
RomaniaFinlandIreland
United Arab EmiratesJapan
Slovak RepublicCzech Republic
BulgariaRussian Federation
New ZealandPoland
IndonesiaSweden
United KingdomUruguay
JordanMontenegro
CanadaLuxembourg
IcelandSerbia
OECD averageSingapore
SloveniaQatarPeru
TurkeyColombia
AustraliaItaly
Chinese TaipeiFrance
NetherlandsChileSpain
CroatiaThailandPortugal
BrazilUnited States
BelgiumHungary
SwitzerlandGermany
AustriaKorea
How to read the chart: The OECD average shows that across OECD countries, 19% of the difference in mathematics scores between advantaged and disadvantaged students is explained by disadvantaged students being less familiar with mathematics. This percentage decreases to 16% after accounting for student and school characteristics.Notes: “Student and school characteristics” include: student’s gender, mathematics learning time, whether student’s country of birth is different from that in which the test was conducted, rural location of the school, private or public ownership of the school, academic or vocational track, school’s selectivity, and indices of teacher support, use of cognitive-activation strategies and disciplinary climate. Socio-economically advantaged students are defined as those students in the top quarter of the PISA index of economic, social and cultural status (ESCS). Disadvantaged students are students in the bottom quarter of ESCS.In Hong Kong-China and Macao-China, the percentage is negative because disadvantaged students reported greater familiarity with mathematics than advantaged ones. In these economies, eliminating the difference in familiarity would increase the performance gap between advantaged/disadvantaged students.Countries and economies are ranked in ascending order of the percentage of the performance gap between advantaged and disadvantaged students explained by familiarity with mathematics, before accounting for school characteristics.Source: OECD, PISA 2012 Database, Table 3.16.
Figure 3.15 Differences in performance related to familiarity with mathematics,
by socio-economic statusPercentage of the score-point difference between advantaged and disadvantaged
students explained by different familiarity with mathematics
12 http://dx.doi.org/10.1787/888933377436

equations and inequalities: making mathematics accessible to all © OECD 2016 155
3ExposurE to mathEmatics in school and pErformancE in pisa
Dif�culty of item on the PISA mathematics scale
Lowergap
Highergap
Perf
orm
ance
gap
of d
isad
vant
aged
stu
dent
s
Odd
s ra
tio
After accounting for familiarity with mathematicsBefore accounting for familiarity with mathematics
0
0.10
0.20
0.30
0.40
0.50
0.60
0.70
0.80
0.90
1.00
300 350 400 450 500 550 600 650 700 750 800 850
Disadvantaged students are 50%less likely to answer correctlythan average students
“DRIP RATE(Question 1)”
“REVOLVINGDOOR (Question 2)”
“CHARTS(Question 1)”
ARCHES(Question 2)
R² = 0.57 (after accounting for
familiarity withmathematics)
R² = 0.54(before accounting for
familiarity with mathematics)
Figure 3.16 Socio-economic status and mathematics performance, by item dif�culty
Change in the probability of answering an item correctly associatedwith socio-economic disadvantage
How to read the chart: A value of 1 on the vertical axis means that disadvantaged students have the same likelihood of answering the item correctly as the average student, while a value of 0.5 means they are 50% less likely to answer correctly. For each item, the distance between the triangle and the diamond re�ects the effect of disadvantaged students' lesser familiarity with mathematics on the performance gap between disadvantaged and average students.Notes: The OECD countries included in the analysis are: Australia, Austria, Belgium, Canada, the Czech Republic, Denmark, Estonia, Finland, France, Germany, Greece, Hungary, Iceland, Ireland, Israel, Italy, Japan, Korea, Luxembourg, the Netherlands, New Zealand, Poland, Portugal, Slovenia, the Slovak Republic, Spain, Sweden, Switzerland, Turkey, the United Kingdom and the United States. The analysis only includes the items administered to those countries.The dif¤culty of the item is set at a 0.62 threshold, meaning that a student who scores 600 in PISA mathematics has a 62% chance of answering correctly an item with a dif¤culty level of 600.Source: OECD, PISA 2012 Database, Table 3.17. 12 http://dx.doi.org/10.1787/888933377448
apply procedural knowledge, than on ReVolVing dooR question 2, a task that requires students to use of a broader set of mathematics skills.
Which mathematics skills do disadvantaged students have fewer opportunities to develop at school? the Pisa mathematics framework defines a set of mathematics competencies that students need to have in order to make use of their knowledge in a variety of contexts (box 3.3; oecd, 2013a). there is a substantial overlap among these competencies; indeed it is usually necessary to draw on several of them at once to solve a challenging problem.

© OECD 2016 equations and inequalities: making mathematics accessible to all156
3ExposurE to mathEmatics in school and pErformancE in pisa
box 3.3. fundamental mathematical competencies
the mathematics assessment framework describes a set of fundamental mathematical competencies needed by individuals to make use of their mathematics knowledge and skills (oecd, 2013a). these capabilities are derived from the mathematical competencies described in previous research (niss and højgaard, 2011). the framework for the 2012 Pisa survey defines the following capabilities:
Communication: this capability involves reading, decoding and interpreting statements, questions, tasks or objects enabling the individual to form a mental model of the situation, as an important step in understanding, clarifying and formulating a problem. communication may also involve presenting and explaining one’s mathematical work or reasoning.
Mathematising: mathematical literacy can involve transforming a problem defined in the real world to a strictly mathematical form (which can include structuring, conceptualising, making assumptions, and/or formulating a model), or interpreting or evaluating a mathematical outcome or a mathematical model in relation to the original problem.
Representation: this can entail selecting, interpreting, translating between, and using a variety of representations to capture a situation, interact with a problem, or to present one’s work. Representations may include graphs, tables, diagrams, pictures, equations, formulae and concrete materials.
Reasoning and argument: this capability involves logically rooted thought processes that explore and link problem elements so as to make inferences from them, check a justification that is given or provide a justification of statements or solutions to problems.
Devising strategies for solving problems: this involves a set of critical control processes that guide an individual to effectively recognise, formulate and solve problems. this skill is characterised as selecting or devising a plan or strategy to use mathematics to solve problems, as well as guiding its implementation.
Using symbolic, formal and technical language and operations: this involves understanding, interpreting, manipulating, and making use of symbolic expressions within a mathematics context (including arithmetic expressions and operations), as well as understanding and using formal constructs based on definitions, rules and formal systems, and using algorithms with these entities.
experts involved in Pisa implementation analysed Pisa mathematics survey questions and judged the extent to which successfully answering those questions demanded the activation of six mathematical competencies mentioned in the Pisa framework. the study involved the operational definition of these competencies and the description of four levels of each competency, recognising some degree of overlapping and interaction across competencies (turner, 2012). an empirical validation of this classification found that the set of six competencies could predict more than 70% of the variability in item difficulty (turner and adams, 2012).

equations and inequalities: making mathematics accessible to all © OECD 2016 157
3ExposurE to mathEmatics in school and pErformancE in pisa
mathematics experts who were involved in the development of Pisa classified the mathematics items according to the type and level of competencies they require (turner, 2012). Figure 3.17 shows that the performance gap between advantaged and disadvantaged students is significantly wider for those tasks that require greater use of two fundamental competencies: “using symbolic, formal and technical language and operations”, and “mathematising”, defined as the ability to construct a mathematical model from a real situation, finding a mathematical solution, and interpreting and validating the solution. as chapter 5 will further discuss, these results suggest that, if the performance gap related to socio-economic status is to be fully closed, disadvantaged students would benefit not only from any policy that increases opportunities for them to develop technical and procedural mathematics skills, but also from more experience with mathematical modelling and using symbolic language.
Logitdifference
Level 2 (high use of the competency)Level 0 (low use of the competency)
Level 3 (very high use of the competency)Level 1 (moderate use of the competency)
Mathematics competencies
Diff
eren
ce in
per
form
ance
bet
wee
nad
vant
aged
and
dis
adva
ntag
ed s
tud
ents
0.60
0.70
0.80
0.90
1.00
1.10
1.20
1.30
1.40
1.50
Representation Communication Devisingstrategies
Reasoningand argument
Mathematising Using symboliclanguage
The performance gap related to socio-economicstatus is sligthly larger for tasks at level 3 of thiscompetency than for tasks at level 0
The performance gap related to socio-economicstatus is much larger for tasks at level 3 of thiscompetency than for tasks at level 0
Figure 3.17 Socio-economic status and success on PISA mathematics tasks,
by required mathematics competenciesLogit differences between advantaged and disadvantaged students according
to the level of competency required by the task, OECD average
Notes: Socio-economically advantaged students are de�ned as those in the top quarter of the PISA index of economic, social and cultural status (ESCS). Disadvantaged students are those in the bottom quarter of ESCS.The classi�cation of PISA mathematics items by type and level of competency required is drawn from Turner (2012).A logit is the logarithm of the odds of answering correctly. A logit value of 0 means that 50% of respondents answered the question correctly. Higher/lower logits correspond to higher/lower rates of correct responses and to lesser/greater item dif�culty.All values are statistically signi�cant.Source: OECD, PISA 2012 Database, Table 3.18. 12 http://dx.doi.org/10.1787/888933377455

3ExposurE to mathEmatics in school and pErformancE in pisa
© OECD 2016 equations and inequalities: making mathematics accessible to all158
charts
in January, the new cds of the bands 4U2Rock and The Kicking Kangaroos were released. in February, the cds of the bands No One’s Darling and The Metalfolkies followed. the following graph shows the sales of the bands’ cds from January to June.
Sales of CDs per month
Month
Num
ber
of C
Ds
sold
per
mon
th
2 250
2 000
1 750
1 500
1 250
1 000
750
500
250
0
May JunAprMarJan Feb
4U2Rock
The Kicking Kangaroos
No One’s Darling
The Metalfolkies
ExamplEs of pisa mathEmatics units
CHARTS – QUeSTiON 1
How many CDs did the band The Metalfolkies sell in April?A. 250B. 500C. 1 000D. 1 270
Scoring
Description: Read a bar chartMathematical content area: uncertainty and dataContext: societalProcess: interpret
Full Credit
b. 500
No Credit
other responses.missing.

3ExposurE to mathEmatics in school and pErformancE in pisa
equations and inequalities: making mathematics accessible to all © OECD 2016 159
drip ratE
infusions (or intravenous drips) are used to deliver fluids and drugs to patients.
nurses need to calculate the drip rate, D, in drops per minute for infusions.
they use the formula Ddv
n=
60 where
d is the drop factor measured in drops per millilitre (ml)
v is the volume in ml of the infusion
n is the number of hours the infusion is required to run.
DRIP RATE – QUeSTiON 1
A nurse wants to double the time an infusion runs for.Describe precisely how D changes if n is doubled but d and v do not change..............................................................................................................................................
.............................................................................................................................................
.............................................................................................................................................
Scoring
Description: explain the effect that doubling one variable in a formula has on the resulting value if other variables are held constantMathematical content area: change and relationshipsContext: occupationalProcess: employ
Full Credit
explanation describes both the direction of the effect and its size.
it halvesit is half d will be 50% smallerd will be half as big
Partial Credit
a response which correctly states eitheR the direction oR the size of the effect, but not both.
d gets smaller [no size]there’s a 50% change [no direction]d gets bigger by 50% [incorrect direction but correct size]
No Credit
other responses.d will also double [both the size and direction are incorrect.]
missing.

3ExposurE to mathEmatics in school and pErformancE in pisa
© OECD 2016 equations and inequalities: making mathematics accessible to all160
REVOLVING DOOR – QUeSTiON 2
The two door openings (the dotted arcs in the diagram) are the same size. If these openings are too wide the revolving wings cannot provide a sealed space and air could then flow freely between the entrance and the exit, causing unwanted heat loss or gain. This is shown in the diagram opposite.
What is the maximum arc length in centimetres (cm) that each door opening can have, so that air never flows freely between the entrance and the exit?
Maximum arc length: ..............................................cm
Scoring
Description: interpret a geometrical model of a real life situation to calculate the length of an arcMathematical content area: space and shapeContext: scientificProcess: Formulate
Full Credit
answers in the range from 103 to 105. [Accept answers calculated as 1/6th of the circumference (100 π/3). Also accept an answer of 100 only if it is clear that this response resulted from using π = 3. Note: Answer of 100 without supporting working could be obtained by a simple guess that it is the same as the radius (length of a single wing).]
No Credit
other responses.
209 [states the total size of the openings rather than the size of “each” opening]missing.
a revolving door includes three wings which rotate within a circular-shaped space. the inside diameter of this space is 2 metres (200 centimetres). the three door wings divide the space into three equal sectors. the plan below shows the door wings in three different positions viewed from the top.
rEVolVinG door
200 cm
EntranceWings
Exit
Possible air �owin this position

equations and inequalities: making mathematics accessible to all © OECD 2016 161
3ExposurE to mathEmatics in school and pErformancE in pisa
Notes
1. this information is reported by representatives of countries/economies who responded to the timss eight grade curriculum questionnaire. the full set of data is available at http://timss.bc.edu/timss2011/international-database.html.
2. the logit transformation of the percentage of students who responded correctly to the item takes into account the non-linear relationship between answering questions correctly and the items’ difficulty (oecd, 2013c). a logit value of 0 means that 50% of respondents answered the question correctly; positive logits mean higher rates of correct answers and negative logits mean lower rates of correct responses.
3. average difficulties by content area displayed in Figure 3.2 are based the following number of Pisa test items: change and relationships: 8 items; quantity: 10 items; space and shape: 9 items; uncertainty and data: 7 items.
4. to understand how the results in Figure 3.5 are derived, consider the following two equations relating Pisa average scores and learning time for students in each school and grade:
ScoreMg = b HoursMg + vg + uMg (1)
ScoreRg = b HoursRg + vg + uRg (2)
Where the subscripts R and M indicate students’ averages in Pisa reading and mathematics, respectively, the subscript g indicates the average for all students in the same grade within the same school, vg represents characteristics of schools and grades that do not vary across subjects of instruction, and u is an error term.
taking the difference of (1) and (2), gives:
DScoreMg - Rg = b̂ DHoursMg - Rg + DuMg - Rg (3)
as can be seen, the first-difference (fixed-effect) regression in (3) estimates the relation between learning time and Pisa scores (b̂)accounting for subject-invariant differences across schools and grades (the term vg gets cancelled out when differencing equations 1 and 2).
5. the index of disciplinary climate summarises students’ reports on the frequency of noise, disorder and inactivity due to disciplinary issues in the classroom.
6. the results in Figure 3.11 are derived similarly to those shown in Figure 3.5 (see previous endnote). consider the following two equations relating Pisa average scores and exposure to pure mathematics for students in two contiguous grades:
Score0S = b exposure0S + vS + u0S (1)
Score1S = b exposure1S + vS + u1S (2)
Where the subscripts 0 and 1 indicate averages for students attending school s in grades 0 and 1, respectively, the subscript vS represents characteristics of schools that do not vary across grades, and u is an error term.
taking the difference of (2) and (1), gives:
DScore1 - 0S = b̂ Dexposure1 - 0S + Du1 - 0S (3)
as can be seen, the first-difference (fixed-effect) regression in (3) estimates the relation between exposure to pure mathematics and Pisa scores (b̂) accounting for grade-invariant differences across schools (the term vS gets cancelled out when differencing equations 1 and 2).
7. the item-level analysis presented in this chapter is restricted to paper-based items because these are common to the largest number of countries.
8. the item, aRches question 2, is not included in the examples at the end of this chapter because it is not a released item.

© OECD 2016 equations and inequalities: making mathematics accessible to all162
3ExposurE to mathEmatics in school and pErformancE in pisa
References
Bellei, C. (2009), “does lengthening the school day increase students’ academic achievement? Results from a natural experiment in chile”, economics of education Review, Vol. 28/5, pp. 629-640, http://dx.doi.org/10.1016/j.econedurev.2009.01.008.
Berinderjeet, K., B.H. Yeap, M. Kapur and Y.B.H. Berinderjeet Kaur (2009), “Mathematical problem solving: Yearbook 2009”, association of mathematics educators (singapore).
Carroll, J.B. (1963), “a model of school learning”, Teachers College Record, Vol. 64/8, pp. 723-733.
Cosgrove, J., G. Shiel, N. Sofroniou, S. Zastrutzki and F. Shortt (2004), education for Life: The Achievements of 15-Year-Olds in ireland in the Second Cycle of PiSA, educational Research centre, dublin, ireland.
Department for Education, UK Government (2013), “national curriculum in england: mathematics programmes of study”, https://www.gov.uk/government/publications/national-curriculum-in-england-mathematics-programmes-of-study (accessed 31 march 2016).
Dumay, X. and V. Dupriez (2007), “accounting for class effect using the timss 2003 eighth-grade database: net effect of group composition, net effect of class process, and joint effect”, School effectiveness and School improvement, Vol. 18/4, pp. 383-408, http://dx.doi.org/10.1080/09243450601146371.
Education Scotland (2011), “curriculum for excellence factfile –overview of key terms and features”, http://www.educationscotland.gov.uk/images/cfeFactfileoverview_tcm4-665983.pdf (accessed 31 march 2016).
French, D. (2004), Teaching and Learning Geometry, continuum international Publishing group, london, uk.
Freudenthal, H. (1968), “Why to teach mathematics so as to be useful”, educational Studies in Mathematics, Vol. 1/1, pp. 3-8, http://dx.doi.org/10.1007/bF00426224.
Gardiner, A. (2004), “What is mathematical literacy?”, Paper presented at the 10th icme (international congress on mathematical education), copenhagen, denmark.
Ginsburg, A., S. Leinwand, T. Anstrom and E. Pollock (2005), “What the united states can learn from singapore’s world-class mathematics system (and what singapore can learn from the united states): an exploratory study”, American institutes for Research, retrieved from http://files.eric.ed.gov/ fulltext/ed491632.pdf.
Gromada, A. and C. Shewbridge (2016), “student learning time: a literature Review,” OeCD education Working Papers, no. 127, oecd Publishing, Paris, http://dx.doi.org/10.1787/5jm409kqqkjh-en.
Kidron, Y. and S. Lindsay (2014), The effects of increased Learning Time on Student Academic and Nonacademic Outcomes: Findings from a Meta-Analytic Review (ReL 2014–015), us department of education, institute of education sciences, national center for education evaluation and Regional assistance, Regional educational laboratory appalachia, Washington, dc, http://eric.ed.gov/?id=ed545233 (accessed 31 march 2015).
Kim, J., I. Han, M. Park and J. Lee (2013), Mathematics education in Korea, World scientific, singapore.
Lavy, V. (2015), “do differences in schools’ instruction time explain international achievement gaps? evidence from developed and developing countries”, The economic Journal, Vol. 125/588, pp. F397-F424, http://dx.doi.org/10.1111/ecoj.12233.
Lavy, V. (2012), “expanding school resources and increasing time on task: effects of a policy experiment in israel on student academic achievement and behavior”, Working Paper no. 18369, national bureau of economic Research, cambridge, ma.

equations and inequalities: making mathematics accessible to all © OECD 2016 163
3ExposurE to mathEmatics in school and pErformancE in pisa
Lehrer, R. and D. Chazan (1998), Designing Learning environments for Developing Understanding of Geometry and Space, lawrence erlbaum, mahwah, new Jersey.
Marcotte, D.E. (2007), “schooling and test scores: a mother-natural experiment”, economics of education Review, Vol. 26/5, pp. 629-640, http://dx.doi.org/10.1016/j.econedurev.2006.08.001.
Marcotte, D.E. and S.W. Hemelt (2008), “unscheduled school closings and student performance”, education Finance and Policy, Vol. 3/3, pp. 316-338, http://dx.doi.org/10.1162/edfp.2008.3.3.316.
Ministry of Education of Singapore (2012), “mathematics syllabus - secondary one to four”, ministry of education, singapore.
Niss, M. and T. Højgaard (eds.), (2011), Competencies and Mathematical Learning: ideas and inspiration for the Development of Teaching and Learning in Denmark (iMFUFA tekst), Roskilde university, Roskilde, denmark.
OECD (2014), PiSA 2012 Results: What Students Know and Can Do (Volume i, Revised edition, February 2014): Student Performance in Mathematics, Reading and Science, Pisa, oecd Publishing, Paris, http://dx.doi.org/10.1787/9789264208780-en.
OECD (2013a), “mathematics Framework”, in oecd, PiSA 2012 Assessment and Analytical Framework: Mathematics, Reading, Science, Problem Solving and Financial Literacy, oecd Publishing, Paris, http://dx.doi.org/10.1787/9789264190511-3-en.
OECD (2013b), PiSA 2012 Results: What Makes Schools Successful (Volume iV): Resources, Policies and Practices, Pisa, oecd Publishing, Paris, http://dx.doi.org/10.1787/9789264201156-en.
OECD (2013c), Lessons from PiSA 2012 for the United States, strong Performers and successful Reformers in education, oecd Publishing, Paris, http://dx.doi.org/10.1787/9789264207585-en.
OECD (2011), Quality Time for Students: Learning in and Out of School, Pisa, oecd Publishing, Paris, http://dx.doi.org/10.1787/9789264087057-en.
Park, H. (2013), Re-evaluating education in Japan and Korea, Routledge, new York, nY.
Pischke, J.-S. (2007), “the impact of length of the school year on student performance and earnings: evidence from the german short school years”, The economic Journal, Vol. 117/523, pp. 1216-1242, http://dx.doi.org/10.1111/j.1468-0297.2007.02080.x.
Rivkin, S.G. and J.C. Schiman (2015), “instruction time, classroom quality, and academic achievement”, The economic Journal, Vol. 125/588, pp. 425-448, http://dx.doi.org/10.1111/ecoj.12315.
Rosenberg-Lee, M. and M.C. Lovett (2006), “does practice and knowledge equal knowledge and practice?”, Unpublished manuscript, http://csjarchive.cogsci.rpi.edu/proceedings/2006/docs/p2053.pdf (accessed 31 march 2016).
Rowan, B., R. Correnti and R. Miller (2002), “What large-scale survey research tells us about teacher effects on student achievement: insights from the prospects study of elementary schools”, The Teachers College Record, Vol. 104/8, pp. 1525-1567.
Schmidt, W.H., N.A. Burroughs, P. Zoido and R.T. Houang (2015), “the role of schooling in perpetuating educational inequality an international perspective”, educational Researcher, Vol. 44/7, pp. 371-386, http://dx.doi.org/10.3102/0013189X15603982.
Schmidt, W.H., L.S. Cogan, R.T. Houang and C.C. McKnight (2011), “content coverage differences across districts/states: a persisting challenge for u.s. education policy”, American Journal of education, Vol. 117/3, pp. 399-427, http://dx.doi.org/10.1086/659213.
© OECD 2016 equations and inequalities: making mathematics accessible to all164
3ExposurE to mathEmatics in school and pErformancE in pisa
Schmidt, W.H., C.C. McKnight, R.T. Houang, H. Wang, D.E. Wiley, L.S. Cogan and R.G. Wolfe (2001), Why schools matter: A cross-national comparison of curriculum and learning, Jossey-bass, san Francisco, ca.
Schmidt, W.H., P. Zoido and L. Cogan (2014), “schooling matters”, OeCD education Working Papers, no. 95, oecd Publishing, Paris, http://dx.doi.org/10.1787/5k3v0hldmchl-en.
Schoenfeld, A.H. (2004), “the math wars”, educational Policy, Vol. 18/1, pp. 253-286, http://dx.doi.org/10.1177/0895904803260042.
Schoenfeld, A.H (1994), “special issue: What mathematics should students learn? What do we know about mathematics curricula?”, The Journal of Mathematical Behavior, Vol. 13/1, pp. 55-80, http://dx.doi.org/10.1016/0732-3123(94)90035-3.
Shiel, G. et al. (2007), PiSA Mathematics - A Teacher’s Guide, department of education and science, dublin, ireland.
Sousa, S. and D.J. Armor (2010), “impact of family vs. school factors on cross-national disparities in academic achievement: evidence from the 2006 Pisa survey”, Research Paper 2010-25, george mason university school of Public Policy, http://dx.doi.org/10.2139/ssrn.1688131.
Steen, L.A. (1990), On the Shoulders of Giants: New Approaches to Numeracy, national academy Press, Washington, dc.
Turner, R. (2012), “some drivers of test item difficulty in mathematics: an item analysis rubric”, Paper presented at aeRa annual meeting, april 2012, Vancouver, canada.
Turner, R. and R.J. Adams (2012), “some drivers of test item difficulty in mathematics: an analysis of the competency rubric”, Paper presented at aeRa annual meeting, april 2012, Vancouver, canada.

equations and inequalities: making mathematics accessible to all © OECD 2016 165
Opportunity to Learn and Students’ Attitudes Towards Mathematics
4
This chapter explores the relationship between opportunity to learn and students’ attitudes towards mathematics, including their interest in mathematics, mathematics self-concept and anxiety towards mathematics. Teaching practices that have an impact on students’ self-concept towards mathematics, peer effects and parents’ influence on their child’s attitudes towards mathematics are also examined.
the statistical data for israel are supplied by and under the responsibility of the relevant israeli authorities. the use of such data by the oecd is without prejudice to the status of the golan heights, east Jerusalem and israeli settlements in the West bank under the terms of international law.

© OECD 2016 equations and inequalities: making mathematics accessible to all166
4OppOrtunity tO learn and students’ attitudes tOwards mathematics
“I don’t expect, and I don’t want, all children to find mathematics an engrossing study, or one that they want to devote themselves to either in school or in their lives. Only a few will find mathematics seductive enough to sustain a long-term engagement. But I would hope that all children could experience at a few moments in their careers...the power and excitement of mathematics...so that at the end of their formal education they at least know what it is like and whether it is an activity that has a place in their future.” – David Wheeler (1975, quoted in Cross, 2004)
Positive feelings towards mathematics are closely linked to the ability to solve problems. in fact, it is highly unlikely that mathematical literacy can be acquired and put into practice by someone who does not have some degree of self-confidence, curiosity, interest in and desire to practice and understand mathematics (oecd, 2010; oecd, 2013b).
if not everyone is born to become a mathematician, everyone needs to be able to reason mathematically. Without the correct mindset, a primary school student who has had few opportunities to play with numbers at home might struggle to understand the meaning of arithmetic operations; without arithmetic skills, this same student will have a hard time making sense of algebra. stimulating positive emotions during mathematics lessons is key to helping students of all ages understand the reasoning behind mathematics, encouraging them to appreciate the value of mathematics, and allowing them to decide whether mathematics should have a central place in their future studies and careers.
what the data tell us
on average across oecd countries in 2012, 38% of students reported that they study mathematics because they enjoy it and 53% of students reported that they are interested in the mathematics they do at school. more girls (65%) than boys (54%) reported that they often worry about mathematics classes, and disadvantaged students were more likely than advantaged students to believe they are just not good at mathematics.
exposure to more complex mathematics concepts, as measured by the index of familiarity with mathematics, is associated with lower self-concept and higher anxiety among students in the bottom quarter of mathematics performance, and with higher self-concept/lower anxiety among students in the top quarter of mathematics performance, on average across oecd countries.
having hard-working friends can increase mathematics self-concept, but students can develop lower beliefs in their own ability when they compare themselves to higher-achieving peers.
on average across oecd countries, high-performing students whose parents do not like mathematics are 73% more likely to feel helpless when they face a mathematics problem than high-performing children of parents who like mathematics.
students whose mathematics teachers differentiate tasks according to students’ abilities and who encourage students to work in small groups have higher mathematics self-concept than students whose teachers do not engage in these practices.

equations and inequalities: making mathematics accessible to all © OECD 2016 167
4OppOrtunity tO learn and students’ attitudes tOwards mathematics
Previous Pisa analyses have shown that opportunity to learn mathematics (otl) is positively related not only to students’ performance, but also to positive attitudes towards mathematics. For example, students’ confidence in solving specific pure and applied mathematics problems is closely linked to their exposure to similar sets of problems in the classroom (oecd, 2013b). this chapter extends these analyses by focusing on the relationship between otl and three aspects of students’ attitudes towards mathematics (see box 4.1 for the definition and measurement of these constructs):
students’ intrinsic and instrumental motivation to learn mathematics
students’ mathematics self-concept
students’ mathematics anxiety.
Figure 4.1 illustrates this chapter’s analysis of the relationship among exposure to mathematics, performance in mathematics and students’ attitudes towards mathematics. opportunities to practice mathematics in class are positively associated with mathematics performance (chapter 3); through this channel, they also strengthen students’ interest in mathematics, support their self-confidence and reduce anxiety towards mathematics. the type and level of difficulty of mathematics tasks can also be directly associated with students’ attitudes, although the direction of the relationship is unclear. on the one hand, more exposure to challenging mathematics problems can stimulate the interest and raise the self-concept of students who are well-trained in mathematics reasoning. on the other hand, exposure to complex mathematics problems can increase pressure on students who have gaps in their learning.
this chapter also looks at other mediators of the relationship between otl and students’ attitudes towards mathematics. the characteristics of students’ peers, parents’ attitudes towards mathematics, and the quality of teachers and their teaching practices influence how exposure to mathematics in class affects students’ drive, self-beliefs and anxiety.
what these results mean for policy
mathematics curricula, and the teachers who follow them, should strike a balance between making the material more challenging and aiming to bolster students’ – especially low-performing students’ – confidence and reduce their anxiety towards mathematics.
school leaders and teachers should make a careful use of competition and rankings within the classroom, because students’ mathematics self-concept is strongly influenced by how their familiarity with mathematics compares with that of their peers.
Parents should be made aware of their role in transmitting mathematics anxiety to their children and should help motivate them.
specific communication training can help teachers to provide more effective feedback to the students who are least familiar with mathematics.

© OECD 2016 equations and inequalities: making mathematics accessible to all168
4OppOrtunity tO learn and students’ attitudes tOwards mathematics
box 4.1. students’ attitudes towards mathematics analysed in this chapter
the student questionnaire that was part of the Pisa 2012 assessment included 67 questions that allowed for the construction of ten indices about students’ attitudes towards mathematics. this chapter analyses the following indices and indicators:
1) Students’ intrinsic and instrumental motivation to learn mathematics
intrinsic motivation to learn mathematics (or mathematics interest) measures students’ drive to perform an activity purely for the joy gained from the activity itself. the index of mathematics interest is based on the degree to which students “strongly agree”, “agree”, “disagree” and “strongly disagree” with the statements: a) i enjoy reading about mathematics; b) i look forward to my mathematics lessons; c) i do mathematics because i enjoy it; d) i am interested in the things i learn in mathematics.
instrumental motivation to learn mathematics refers to students’ drive to learn mathematics because they perceive it to be useful to their future studies and careers. the index of instrumental motivation to learn mathematics is based on the degree to which students “strongly agree”, “agree”, “disagree” and “strongly disagree” with the statements: a) making an effort in mathematics is worth it because it will help me in the work that i want to do later on; b) learning mathematics is worthwhile for me because it will improve my career; c) mathematics is an important subject for me because i need it for what i want to study later on; d) i will learn many things in mathematics that will help me get a job.
2) Mathematics self-concept measures students’ beliefs in their own mathematics abilities. the index of mathematics self-concept is based on the degree to which students “strongly agree”, “agree”, “disagree” and “strongly disagree” with the statements: a) i am just not good at mathematics; b) i get good grades in mathematics; c) i learn mathematics quickly; d) i have always believed that mathematics is one of my best subjects; e) in my mathematics class, i understand even the most difficult work.
3) Mathematics anxiety measures the feelings of helplessness and stress that students can have when faced with a mathematics problem. the index of mathematics anxiety is based on the degree to which students “strongly agree”, “agree”, “disagree” and “strongly disagree” with the statements: a) i often worry that it will be difficult for me in mathematics classes; b) i get very tense when i have to do mathematics homework; c) i get very nervous doing mathematics problems; d) i feel helpless when doing a mathematics problem; e) i worry that i will get poor marks in mathematics.
Responses to all items were coded so that higher values correspond to a higher level of the construct. all indices were scaled so to have an oecd mean of zero and an oecd standard deviation of one.

equations and inequalities: making mathematics accessible to all © OECD 2016 169
4OppOrtunity tO learn and students’ attitudes tOwards mathematics
hOw students’ mOtivatiOn and self-beliefs vary acrOss cOuntries and subgrOups Of students
all countries and economies are trying to find ways to spark students’ interest in mathematics so that they are motivated to learn. Figure 4.2 shows that, on average across oecd countries in 2012, only 38% of students reported that they study mathematics because they enjoy it; in austria, only 24% of students reported that they enjoy studying mathematics. by contrast, more than 70% of students in indonesia and thailand reported that they enjoy studying mathematics.
the percentage of students who reported that they enjoy mathematics increased by 4 percentage points or more between 2003 and 2012 in Finland, greece, iceland, indonesia, Japan and mexico. students were more likely to report being interested in mathematics than enjoying mathematics when asked about the mathematics they do at school. on average across oecd countries in 2012, 53% of students reported that they are interested in the things they learn in mathematics, the same percentage observed in 2003 (table 4.1). between 2003 and 2012, the share of students who reported that they are interested in mathematics grew by 14 percentage points in greece, but shrunk by 22 percentage points in the slovak Republic.
how students feel about their mathematics ability (their mathematics self-concept) shapes their behaviour, especially when facing challenging problems (bandura, 1977). Pisa 2012 data show that, on average across oecd countries, 43% of students reported that they agree or strongly agree that they are not good at mathematics; 59% reported that they get good grades in mathematics; 37% reported that they understand even the most difficult work; 52% reported that they learn mathematics quickly; and 38% reported to have always believed that mathematics is one of their best subjects (table 4.5a). these responses vary markedly across countries and
Opportunity to learn
Exposure to appliedmathematics
Exposure to puremathematics
Familiarity withmathematics
Mathematics performance
Attitudes towards mathematics
Intrinsic and instrumentalmotivation to learn
mathematics
Mathematics self-concept
(Lower) mathematics anxiety
Peers
Teachers
Parents
Mediators
Positive relationship
Sign of the relationship depends on the type of tasksand on the performance of the student
Figure 4.1 Direct and indirect relationship between opportunity
to learn and attitudes towards mathematics

© OECD 2016 equations and inequalities: making mathematics accessible to all170
4OppOrtunity tO learn and students’ attitudes tOwards mathematics
20122003
%
AustriaHungary
Slovak RepublicFinland
BelgiumCzech Republic
KoreaJapan
NorwayNetherlandsLuxembourg
PolandCanada
United StatesSwedenIreland
SpainOECD average
New ZealandLatvia
AustraliaGermany
FranceMacao-China
Russian FederationPortugal
ItalyIceland
SwitzerlandUruguay
GreeceTurkey
MexicoHong Kong-China
LiechtensteinBrazil
DenmarkTunisia
ThailandIndonesia
20 30 40 50 60 70 80
-4.0
-4.64.0
-4.5
4.7
-4.3
3.8
3.2-4.2-5.4
9.9-3.2
7.5-5.47.63.2
-4.2
-9.2
4.5
Figure 4.2 Change between 2003 and 2012 in the percentage
of students who enjoy mathematicsPercentage of students who reported that they “agree” or “strongly agree”
with the statement “I do mathematics because I enjoy it”
Notes: Only countries and economies with comparable data from PISA 2003 and PISA 2012 are shown. The OECD average only accounts for countries that participated in both PISA 2003 and PISA 2012 assessments.Only statistically signi�cant differences between 2012 and 2003 are shown next to the country/economy name.Countries and economies are ranked in ascending order of the percentage of students in 2012 who agreed with the statement “I do mathematics because I enjoy it”.Source: OECD, PISA 2012 Database, Table 4.1. 12 http://dx.doi.org/10.1787/888933377468

equations and inequalities: making mathematics accessible to all © OECD 2016 171
4OppOrtunity tO learn and students’ attitudes tOwards mathematics
economies. over 60% of students in albania, argentina, indonesia, chinese taipei and thailand reported that they feel they are not good at mathematics, while these negative perceptions were shared by less than 30% of students in denmark, israel and Viet nam.
Particular groups of students are more likely to develop negative beliefs about their mathematics capacities. Figure 4.3 shows that, in 2012, socio-economically disadvantaged students were much more likely than advantaged students to report that they are not good at mathematics. the socio-economic gap in this measure of mathematics self-concept is larger than 25 percentage points in bulgaria, France, greece, liechtenstein, Portugal and tunisia. the lower self-confidence in academic ability among disadvantaged students is clearly related to their poorer performance at school. but the concentration within a school of students with a history of negative experiences with mathematics can generate “contagion effects” that reinforce the negative relationship between economic disadvantage and self-concept.
students who hold negative views about their academic abilities are more likely to suffer from mathematics anxiety. Feelings of anxiety can begin as early as elementary school, and are often prompted by social cues conveying the message that mathematics should be feared (beilock and Willingham, 2014). the consequences of mathematics anxiety are mild to severe: from minor frustration to overwhelming physical reactions, such as pain (ashcraft and moore, 2009). individuals with high mathematics anxiety perform worse because their worry over-rides their cognitive resources (maloney and beilock, 2012).
Pisa data show clearly that mathematics anxiety is not limited to a minority of individuals nor to one country. across oecd countries, around 59% of students often worry that it will be difficult for them in mathematics classes. girls are more likely to report mathematics anxiety than are boys: on average across oecd countries in 2012, 65% of girls and 54% of boys reported feeling worried about their mathematics classes (Figure 4.4). in denmark, Finland and liechtenstein, the difference in the percentage of girls and boys who are anxious towards mathematics is larger than 20 percentage points.
the fear of making mistakes often disrupts performance among gifted girls who “choke under pressure” (oecd, 2015a). the mathematics anxiety experienced by many girls and women has multiple roots. lower expectations for girls and/or stereotypical thinking that labels mathematics as a more “masculine” subject contribute to mathematics anxiety. indeed, they might be the greatest obstacles for talented girls and women to overcome on the way to high mathematics achievement (lavy and sand, 2015).
the importance of attitudes, beliefs and feelings about mathematics goes beyond the immediate learning context. students’ education pathways and careers might depend on the confidence they have in their abilities to solve mathematics tasks (hackett and betz, 1995). in 2012, girls and socio-economically disadvantaged students were less likely than the average student to report that they intended to take additional mathematics courses after the end of compulsory schooling (Figure 4.5).

© OECD 2016 equations and inequalities: making mathematics accessible to all172
4OppOrtunity tO learn and students’ attitudes tOwards mathematics
All students Advantaged studentsDisadvantaged students
20 30 40 50 60 70 80 90
Thailand 5Argentina 17Indonesia
Chinese Taipei 23Chile 20
Korea 22Bulgaria 28
Brazil 8Tunisia 26
Japan 6Poland 22
Slovak Republic 24Mexico 10
Uruguay 22Turkey 14
Malaysia 8Romania 18
Jordan 19Hong Kong-China 11
Estonia 17Spain 17Peru
Portugal 29Macao-China
Montenegro 16Serbia 21
Italy 13Shanghai-China 12
Qatar 14Lithuania 16Hungary 22Slovenia 14Croatia 16
Costa Rica 13Greece 33
Colombia 16Norway 21
OECD average 17Czech Republic 16
France 28Russian Federation 19
Finland 22New Zealand 19
Latvia 16Ireland 14
Belgium 11Luxembourg 12
Singapore 25Netherlands 12
United Arab Emirates 19Kazakhstan 17
Austria 16Australia 15
Canada 15Iceland 18
Sweden 13Germany 11
Liechtenstein 31Switzerland
United States 15United Kingdom 15
Denmark 23Israel 10
Viet Nam 14
%
Figure 4.3 Mathematics self-concept, by students’ socio-economic status
Percentage of students who reported that they “disagree” or “strongly disagree” with the statement “I am just not good at mathematics”
Notes: Disadvantaged students are defined as those students in the bottom quarter of the PISA index of economic, social and cultural status (ESCS). Advantaged students are students in the top quarter of ESCS.Only statistically signi�cant percentage-point differences between advantaged and disadvantaged students are shown next to the country/economy name.Countries and economies are ranked in ascending order of the percentage of all students who disagreed with the statement “I’m just not good at mathematics”.Source: OECD, PISA 2012 Database, Table 4.2. 12 http://dx.doi.org/10.1787/888933377470

equations and inequalities: making mathematics accessible to all © OECD 2016 173
4OppOrtunity tO learn and students’ attitudes tOwards mathematics
Boys GirlsAll students
%20 30 40 50 60 70 80 90
NetherlandsDenmark
SwedenIceland
United KingdomSwitzerland
LiechtensteinFinland
GermanyShanghai-China
NorwayEstonia
KazakhstanCzech Republic
AustriaLuxembourg
LatviaUnited States
PolandLithuania
Slovak RepublicRussian Federation
BelgiumOECD average
CanadaAustralia
SingaporeSloveniaHungary
New ZealandSerbia
ColombiaFrance
MontenegroCroatia
IsraelTurkeyAlbania
SpainUnited Arab Emirates
QatarHong Kong-China
PortugalIreland
BulgariaMacao-China
JapanBrazil
Chinese TaipeiViet Nam
ChileCosta Rica
GreecePeru
ThailandItaly
MalaysiaUruguay
IndonesiaRomania
KoreaMexicoJordanTunisia
Argentina
-13-20-13-10-17-17-23-22-15-20-14
-7
-8-10-15-5
-10-7-8
-11-5
-14-12-15-15-4-7-9
-15
-8-18
-6-9
-10
-15-5
-12-8
-17-14
-12-9-4
-11-10
-6-4-7
-6-5
-10-7
-3
Figure 4.4 Mathematics anxiety, by gender
Percentage of students who reported that they “agree” or “strongly agree”with the statement “I often worry that it will be difficult for me in mathematics classes”
Note: Only statistically signi�cant percentage-point differences between boys and girls are shown next to the country/economy name.Countries and economies are ranked in ascending order of the percentage of all students who agreed with the statement “I often worry that it will be difficult for me in mathematics classes”.Source: OECD, PISA 2012 Database, Table 4.3. 12 http://dx.doi.org/10.1787/888933377487

© OECD 2016 equations and inequalities: making mathematics accessible to all174
4OppOrtunity tO learn and students’ attitudes tOwards mathematics
data on career expectations in Pisa 2006 also show that the students more at risk of developing negative attitudes towards mathematics at school – namely girls and disadvantaged students – are also less likely to expect to pursue a scientific career. For example, on average across oecd countries, 19% of students expected to work as a stem (science, technology, engineering and mathematics) professional (table 4.4c). only 13% of disadvantaged students expected to work in one of these fields. these students might back away from the race to mathematics-intensive jobs at the starting line. similarly, persistent gender-biased expectations about mathematics ability perpetuate the under-representation of women in science and engineering professions (oecd, 2015a).
Girls Disadvantaged studentsAll students
%
0
10
20
30
40
50
60
I intend to takeadditional
mathematicscourses after
school finishesrather than <test
language> courses
I would liketo work in a
career involving<broad science>
I wouldlike to study
<broad science>after <secondary
school>
I wouldlike to workon <broadscience>
projects asan adult
I would liketo spend my
life doingadvanced
<broad science>
Expect tohave a STEMoccupation atthe age of 30
PISA 2006PISA 2012
Figure 4.5 Students’ intentions, motivation and expected careersin STEM fields, by gender and socio-economic status
Percentage of students who reported that they “agree” or “strongly agree”with the following statements, OECD average
Notes: Disadvantaged students are defined as those students in the bottom quarter of the PISA index of economic, social and cultural status (ESCS).STEM refers to science, technology, engineering and mathematics.Source: OECD, PISA 2006 and 2012 Databases,Tables 4.4a, b and c. 12 http://dx.doi.org/10.1787/888933377493

equations and inequalities: making mathematics accessible to all © OECD 2016 175
4OppOrtunity tO learn and students’ attitudes tOwards mathematics
relatiOnships between OppOrtunity tO learn and attitudes tOwards mathematics
Exposure to pure mathematics, familiarity with mathematics and students’ attitudes towards mathematicsexposure to relatively complex mathematics topics may increase the self-concept of students who are relatively well-prepared and ready to be challenged, but it may undermine the self-confidence of students who do not feel up to the task. Recognising the role of attitudes in mathematics performance, some countries and economies explicitly include activities to help students develop positive attitudes towards mathematics in their mathematics curricula (see box 4.2).
Figure 4.6 looks at how exposure to pure mathematics tasks (linear and quadratic equations) is associated with different measures of mathematics self-concept. on average across oecd countries, students who are more exposed to pure mathematics (by one additional unit on the index of exposure to pure mathematics) are over 30% more likely to disagree that they are just
box 4.2. developing positive mathematics attitudes as a curriculum objective
acknowledging the relationship between attitudes towards mathematics and exposure to mathematics, a number of countries and economies have included the development of positive attitudes towards mathematics as one of the goals of their mathematics curricula. For instance, the new Australian mathematics curriculum “encourages teachers to help students become self-motivated, confident learners [italics ours]” (acaRa, 2016).
the 2007 and 2011 revisions of the mathematics curriculum in Korea introduced a number of new objectives, including the need to develop positive attitudes towards mathematics among students. this idea stemmed from the recognition that previous korean curricula had fostered the cognitive aspects of mathematics teaching, while attitudes towards mathematics were considered as secondary, albeit instrumental, for developing students’ cognitive abilities. Results from the trends in international mathematics and science study (timss) and Pisa confirmed this, as they showed that korean students consistently displayed high performance in mathematics and problem solving, but had low interest and self-confidence in mathematics (li and lappan, 2014). as a part of the 2011 revision of the mathematics curriculum, some content was eliminated or rearranged to significantly reduce students’ study load, creating some time for creative and self-directed activities to foster interest in and motivation to learn mathematics (lew et al., 2012).
attitudes towards mathematics are one of the five key elements of the mathematics framework that is at the heart of Singapore’s mathematics curriculum (ministry of education of singapore, 2012). the framework considers that mathematics education should enable students to develop positive attitudes towards mathematics, including beliefs about the usefulness of mathematics, interest and enjoyment in learning mathematics, confidence in using mathematics and perseverance in solving problems. similarly, one of the goals of the mathematics curriculum in lower secondary schools in Hong Kong-China is to develop positive attitudes towards mathematics (mullis et al., 2012).

© OECD 2016 equations and inequalities: making mathematics accessible to all176
4OppOrtunity tO learn and students’ attitudes tOwards mathematics
not good at mathematics and they are more than 20% more likely to agree that they get good grades in mathematics, that they learn mathematics quickly, that they have always believed that mathematics is one of their best subjects, and that they understand even the most difficult work, compared to students who are less exposed to pure mathematics.
however, once students’ mathematics performance is taken into account, the relationship between exposure to mathematics tasks, such as equations, and self-concept becomes weaker. students of similar ability who are more exposed to pure mathematics are 6% more likely to disagree that they are not good at mathematics, 6% more likely to agree that they get good grades in mathematics, 4% more likely to agree that they learn mathematics quickly and just as likely to agree with the other statements as students who are less exposed (Figure 4.6). after accounting for performance in mathematics, exposure to pure mathematics is not associated with any of the statements about mathematics self-concept in almost half of the countries and economies (table 4.5b).
1.00
1.05
1.10
1.15
1.20
1.25
1.30
1.35
1.40
I am just not goodat mathematicsb
I get good <grades>in mathematicsa
I learn mathematicsquicklya
I have alwaysbelieved that
mathematics is oneof my best subjectsa
In my mathematicsclass, I understand
even the mostdif�cult worka
Indicators of mathematics self-concept
Odd
s ra
tio
After accounting for performance in mathematicsBefore accounting for performance in mathematics
Figure 4.6 Exposure to pure mathematics and students’ self-concept
Change in the likelihood of students reporting to "agree"/"strongly agree"(a) or "disagree"/"strongly disagree" (b) with the following statements on mathematics
self-concept associated with a one-unit increase in the index of exposure to pure mathematics
How to read the chart: An odds ratio of 1.26 corresponding to the statement “I learn mathematics quickly” means that a student who is one standard deviation more exposed to pure mathematics is 26% more likely to agree or strongly agree that he/she learns mathematics quickly compared with a student who is less exposed to pure mathematics.Notes: The index of exposure to pure mathematics measures student-reported experience with mathematics tasks at school requiring knowledge of algebra (linear and quadratic equations).Statistically signi�cant odds ratios are marked in a darker tone. All values before accounting for performance in mathematics are statistically significant.Source: OECD, PISA 2012 Database, Table 4.5b.12 http://dx.doi.org/10.1787/888933377507

equations and inequalities: making mathematics accessible to all © OECD 2016 177
4OppOrtunity tO learn and students’ attitudes tOwards mathematics
this finding suggests that mathematics performance explains the positive relationship between exposure to mathematics and mathematics self-beliefs (see Figure 4.1). high-performing students may be more likely to be exposed to pure mathematics and to express positive feelings towards mathematics. after accounting for mathematics ability, an increase in exposure to pure mathematics corresponds to an increase in mathematics self-concept by more than 0.2 units (equivalent to 20% of a standard deviation for the oecd average) in kazakhstan, Jordan and tunisia, but it corresponds to a decrease in mathematics self-concept in belgium, denmark, macao-china, the netherlands and switzerland (table 4.6).
the strong mediating role of mathematics performance is even more apparent when looking at the relationship between self-concept and the index of familiarity with mathematics. Figure 4.7 shows that, on average across oecd countries, a one-unit increase in the index of familiarity with mathematics corresponds to an increase in the index of mathematics self-concept by 10% of a standard deviation before taking mathematics performance into account; but it corresponds to a decrease in that index, by 10% of a standard deviation, when comparing students of similar ability. in austria, germany and liechtenstein, a one-unit increase in the index of familiarity with mathematics corresponds to a decrease in the index of mathematics self-concept by more than 20% of a standard deviation, after taking mathematics performance into account. as the index of familiarity with mathematics is measured on relatively difficult concepts for 15-year-old students, like vectors, complex numbers and congruent figures, it appears that, in most countries, exposure to advanced topics often challenges students’ beliefs in their own mathematics abilities.
exposure to relatively formal mathematics, as measured by the index of exposure to pure mathematics may also be associated with more anxiety towards mathematics among students who are not sufficiently prepared to learn. on average across oecd countries, students who are more exposed to pure mathematics are 14% more likely to say that they worry that they will get poor grades in mathematics, 8% more likely to worry that it will be difficult for them in mathematics classes, and 4% more likely to report that they get very nervous doing mathematics problems (but 2% less likely to report that they get very tense when they have to do mathematics homework), compared with students of similar mathematics ability who are less exposed to these tasks (table 4.8b).
moreover, Figure 4.8 shows that, on average across oecd countries, greater exposure to complex concepts, as measured by the index of familiarity with mathematics, is associated with higher anxiety among students in the bottom quarter of the mathematics performance distribution and with lower mathematics anxiety among students in the top quarter of the distribution. the increase in mathematics anxiety among low-performing students associated with a one-unit increase in the index of familiarity with mathematics is larger than 10% of a standard deviation in australia, austria, canada, the czech Republic, France and chinese taipei. a similar increase in familiarity with mathematics is associated with a decrease in anxiety by more than 10% of a standard deviation among high-performing students in albania, colombia, hong kong-china, hungary, malaysia, Peru, Romania, serbia and slovenia. similar patterns are found when looking at the effect of exposure to pure mathematics on anxiety along the performance distribution. in France, both high-performing and low-performing students reported

© OECD 2016 equations and inequalities: making mathematics accessible to all178
4OppOrtunity tO learn and students’ attitudes tOwards mathematics
Before accounting for performance in mathematics After accounting for performance in mathematics
-0.40 -0.30 -0.20 -0.10 0.00 0.10 0.20 0.30 0.40
LiechtensteinIndonesiaArgentina
ThailandKazakhstan
AustriaLuxembourgNetherlands
TunisiaQatarJapan
RomaniaMacao-China
BelgiumGermanyBulgaria
Slovak RepublicMalaysia
BrazilSwitzerland
Hong Kong-ChinaShanghai-China
LatviaUruguay
Viet NamEstonia
Costa RicaGreece
LithuaniaMexico
IsraelDenmark
Russian FederationPeru
SwedenColombia
Czech RepublicChile
MontenegroOECD average
New ZealandIreland
United Arab EmiratesAlbania
United KingdomTurkey
CroatiaUnited States
HungaryJordanSpain
FinlandFrance
SloveniaCanada
ItalySingapore
PortugalIcelandPoland
AustraliaSerbia
Chinese TaipeiKorea
Index change
Figure 4.7 Relationship between familiarity with mathematics and students’ self-concept
Change in the index of mathematics self-concept associated with a one-unit increasein the index of familiarity with mathematics
Notes: The index of mathematics self-concept is based on the degree to which students agree with the statements: I’m just not good in mathematics; I get good grades in mathematics; I learn mathematics quickly; I have always believed that mathematics is one of my best subjects and In my mathematics class, I understand even the most difficult work.The index of familiarity with mathematics is based on students’ responses to 13 items measuring students’ self-reported familiarity with mathematics concepts (such as exponential function, divisor, quadratic function, etc.).Statistically signi�cant values are marked in a darker tone.Countries and economies are ranked in ascending order of the relationship between familiarity with mathematics and students’ self-concept before accounting for performance in mathematics.Source: OECD, PISA 2012 Database, Table 4.6. 12 http://dx.doi.org/10.1787/888933377511

equations and inequalities: making mathematics accessible to all © OECD 2016 179
4OppOrtunity tO learn and students’ attitudes tOwards mathematics
Top quarter of performance in mathematicsBottom quarter of performance in mathematics
-0.40 -0.35 -0.30 -0.25 -0.20 -0.15 -0.10 -0.05 0.00 0.05 0.10 0.15 0.20 0.25
SerbiaAlbania
Malaysia -0.29RomaniaSlovenia -0.22
Hong Kong-ChinaHungary
PeruColombiaIndonesiaLithuania
IrelandJordanQatarBrazilIsraelKorea
United Arab EmiratesSpain -0.14
PolandRussian Federation
EstoniaShanghai-China
BulgariaLatvia
SingaporeArgentina
NetherlandsMexico -0.12
United StatesNew Zealand
Canada -0.18Chile -0.16
TurkeyIceland
Thailand -0.16Italy -0.12
Australia -0.17Macao-China
JapanUnited Kingdom
OECD average -0.09Croatia
PortugalCosta Rica
DenmarkLiechtenstein
Chinese TaipeiFrance
UruguayMontenegro
BelgiumKazakhstan
GreeceGermany
SwitzerlandViet Nam
FinlandTunisia
Slovak RepublicLuxembourg
AustriaCzech Republic
Sweden
Index change
Figure 4.8 Familiarity with mathematics and mathematics anxiety,
by students’ performance in mathematicsChange in the index of mathematics anxiety associated with a one-unit increase
in the index of familiarity with mathematics, among students in the topand bottom 25% of the mathematics performance distribution
Notes: The index of mathematics anxiety is based on the degree to which students agree with the statements: I often worry that it will be difficult for me in mathematics classes; I get very tense when I have to do mathematics homework; I get very nervous doing mathematics problems; I feel helpless when doing a mathematics problem; and I worry that I will get poor marks in mathematics.The index of familiarity with mathematics is based on students’ responses to 13 items measuring students’ self-reported familiarity with mathematics concepts (such as exponential functions, divisor, quadratic function, etc.).Statistically signi�cant differences between students in the top and bottom quarter of performance in mathematics are shown next to the country/economy name.Only countries and economies with available data are shown.Countries and economies are ranked in ascending order of the index change for the students in the top quarter of perform-ance in mathematics.Source: OECD, PISA 2012 Database, Table 4.10b. 12 http://dx.doi.org/10.1787/888933377524

© OECD 2016 equations and inequalities: making mathematics accessible to all180
4OppOrtunity tO learn and students’ attitudes tOwards mathematics
greater anxiety when they are more exposed to pure mathematics tasks, such as solving linear and quadratic equations (table 4.10b).
all in all, the analysis of the relationship between opportunities to learn mathematics, mathematics performance and attitudes towards mathematics suggests that exposure to challenging mathematics content can help improve performance (chapter 3). at the same time, such exposure could backfire if students, particularly low-achieving students, develop negative attitudes and self-beliefs towards mathematics as a result. chapter 5 discusses the implications of these results for policy, and suggests that mathematics curricula, and the teachers who follow those curricula, should strike a balance between making mathematics lessons challenging and aiming to bolster students’ self-confidence and reduce their anxiety towards mathematics.
Exposure to applied mathematics and students’ attitudes towards mathematics by contrast, exposing students to problems that ask them to apply mathematics in a real context seems to be a way to expand their opportunity to learn while, at the same time, reinforcing their self-beliefs. on average across oecd countries, students who reported that they are frequently exposed to contextualised mathematics problems (such as interpreting a trend in a chart; see chapter 1) tend to have higher values on the index of mathematics self-concept by 10% of a standard deviation compared with students who are less frequently exposed to these problems, after accounting for their mathematics performance (Figure 4.9). the increase in self-concept associated with being frequently exposed to contextualised mathematics problems is larger than 25% of a standard deviation in austria, bulgaria, croatia, luxembourg and montenegro (table 4.7a).
students’ practice with relatively simple applied mathematics tasks, as measured by the index of exposure to applied mathematics, seems to have a different effect on mathematics anxiety than exposure to more abstract content, once students’ performance is taken into account. on average across oecd countries, more frequent exposure to the relatively difficult mathematics concepts captured by the index of familiarity with mathematics and the index of exposure to pure mathematics increases students’ anxiety, after accounting for mathematics performance (table 4.9). by contrast, the association between more frequent exposure to applied mathematics and mathematics anxiety is not statistically significant, after accounting for mathematics performance.
Mathematics assessments and anxiety anxiety can be related not only to exposure to mathematics during lessons but also to mathematics assessments (Reys et al., 2014). mathematics anxiety causes greater deterioration in performance when mathematics knowledge and practice is tested under timed, high-stakes conditions (ashcraft and moore, 2009). on average across oecd countries, students tend to show higher values on the index of mathematics anxiety when they are more frequently exposed to pure mathematics problems during school tests (table 4.7d; see chapter 1 for examples of the various tasks).

equations and inequalities: making mathematics accessible to all © OECD 2016 181
4OppOrtunity tO learn and students’ attitudes tOwards mathematics
students are more likely to feel anxious if they are assessed on a topic that they have not practiced very often during classroom lessons. about 10% of students, on average across oecd countries, reported that they are more frequently exposed to algebraic word problems in tests than in lessons; 17% of students in the united kingdom reported that they are more frequently exposed to pure mathematic problems in tests than they are in mathematics classes (table 4.7e).
Figure 4.10 shows that, on average across oecd countries, students who are exposed more frequently to pure and contextualised mathematics tasks in tests than in lessons feel more anxious by at least 10% of a standard deviation than students who are exposed less or equally frequently during tests than during lessons, after accounting for their mathematics performance. students in austria who are exposed more frequently to pure and contextualised mathematics tasks in tests than in lessons feel more anxious by more than 30% of a standard deviation than students who are exposed less or equally frequently during tests than during lessons, after accounting for their mathematics performance (table 4.7f). more frequent use of contextualised problems in tests than in lessons is associated with a larger increase in mathematics anxiety than more frequent use of procedural tasks in tests than in lessons, possibly because contextualised problems are more unpredictable than procedural problems.
After accounting for performance in mathematicsBefore accounting for performance in mathematics
0.00
0.05
0.10
0.15
0.20
0.25
Algebraic wordproblems
Contextualisedmathematics problems
Procedural tasks Pure mathematicsproblems
Inde
x ch
ange
Figure 4.9 Relationship between exposure to mathematics tasks during
mathematics lessons and students’ self-conceptChange in the index of mathematics self-concept associated with frequent
exposure to mathematics tasks during during lessons, OECD average
Notes: The index of mathematics self-concept is based on the degree to which students agree with the statements: I’m just not good in mathematics; I get good grades in mathematics; I learn mathematics quickly; I have always believed that mathematics is one of my best subjects and In my mathematics class, I understand even the most difficult work.See Chapter 1 for examples of the various tasks. All values are statistically significant.Source: OECD, PISA 2012 Database, Table 4.7a. 12 http://dx.doi.org/10.1787/888933377533

© OECD 2016 equations and inequalities: making mathematics accessible to all182
4OppOrtunity tO learn and students’ attitudes tOwards mathematics
After accounting for performance in mathematicsBefore accounting for performance in mathematics
0.00
0.05
0.10
0.15
0.20
0.25
Algebraic wordproblems
Contextualisedmathematics problems
Procedural tasks Pure mathematicsproblems
Cha
nge
in th
e in
dex
of m
athe
mat
ics
anxi
ety Students who are more exposed to
algebraic word problems in tests thanin lessons are more anxious by 7% of a
standard deviation than students who are exposed less/as frequently during tests
than/as during lessons
Figure 4.10 Mathematics anxiety and the mismatch between
what is taught and what is tested Change in the index of mathematics anxiety associated with more frequent
exposure to mathematics tasks during tests than during lessons, OECD average
How to read the chart: This figure compares students who are exposed more frequently to mathematics tasks in tests than in lessons to students who are exposed to mathematics tasks less/as frequently in tests than/as in lessons.Notes: The index of mathematics anxiety is based on the degree to which students agree with the statements: I often worry that it will be difficult for me in mathematics classes; I get very tense when I have to do mathematics homework; I get very nervous doing mathematics problems; I feel helpless when doing a mathematics problem; and I worry that I will get poor marks in mathematics.All values are statistically significant.Source: OECD, PISA 2012 Database, Table 4.7f. 12 http://dx.doi.org/10.1787/888933377548
mediating factOrs between expOsure tO mathematics and attitudes tOwards mathematics
students learn mathematics in the context of their classroom and families, and the relationship between exposure to mathematics and self-beliefs is likely to be mediated by students’ peers, parents and teachers. this section considers how peers, parents and teachers can influence the relationship between exposure to mathematics and students’ intrinsic and instrumental motivation to learn mathematics, as well as their self-concept and anxiety towards mathematics.
The benefits and possible shortcomings of hard-working and well-prepared peersPeer quality and behaviour are important determinants of student outcomes (sacerdote, 2001; Jencks and mayer, 1990). Peer effects are central to many important policy issues in education, including the impact of ability tracking between and within schools, “mainstreaming” special education students, and programmes for racial and economic desegregation. the effect of grouping students in classrooms by ability, for example, affects students’ achievement not only by influencing

equations and inequalities: making mathematics accessible to all © OECD 2016 183
4OppOrtunity tO learn and students’ attitudes tOwards mathematics
the instruction they are exposed to, but also by limiting their classroom interactions to those with only high-achieving peers (for those in higher tracks) or to those with only low-achieving peers (for those in lower tracks [angrist and lang, 2004; cooley, 2007; Fryer and torelli, 2010]).
the characteristics of students’ peers are clearly related to the academic credentials of the schools they attend. Pisa 2012 data show that 56% of students in schools where the students’ level of familiarity with mathematics is above the country average and 49% of the students in schools where the students’ level of familiarity with mathematics is below the country average reported having friends who work hard on mathematics, on average across oecd countries (table 4.12a). in both types of schools, students of similar ability with hard-working friends have higher intrinsic and instrumental motivation to learn mathematics (Figure 4.11).
Schools where students are least familiar with mathematicsSchools where students are most familiar with mathematics
Odd
s ra
tio
1.00
1.10
1.20
1.30
1.40
1.50
1.60
1.70
1.80
1.90
2.00
2.10
2.20
2.30
2.40
2.50
I am interestedin the things I learn
in mathematics
I do mathematicsbecause I enjoy it
I look forwardto mathematics
lessons
Making an effortis worthwhile for
the work I want to do
Mathematicsis important for
what I want to studylater on
Indicators of motivation to learn mathematics
Students in schools where there is generally less familiarity with mathematics, but who have friendswho work hard in mathematics are 2.3 times more likely to look forward to mathematics lessons thanstudents who do not have hard-working friends
Students in schools where there is generally more familiarity with mathematics and whohave friends who work hard in mathematics are 1.5 times more likely to look forward tomathematics lessons than students who do not have hard-working friends
Figure 4.11 Motivation to learn mathematics and peers’ attitudes, by schools’
level of familiarity with mathematicsChange in the likelihood of students reporting that they “agree” or “strongly agree”with the following statements on the motivation to learn mathematics associated
with having friends who work hard in mathematics, OECD average
How to read the chart: An odds ratio of 2.22 corresponding to the statement “I am interested in the things I learn in mathematics” means that a student who has friends who work hard in mathematics is 2.22 times more likely to agree or strongly agree with the statement than a student who does not have friends who work hard in mathematics. Notes: Schools with less (more) familiarity with mathematics are defined as those schools where the average familiarity with mathematics is significantly lower (higher) than the country average familiarity with mathematics.All odds ratios are statistically significant.Source: OECD, PISA 2012 Database, Table 4.11. 12 http://dx.doi.org/10.1787/888933377553

© OECD 2016 equations and inequalities: making mathematics accessible to all184
4OppOrtunity tO learn and students’ attitudes tOwards mathematics
this relationship is not causal, as hard-working and motivated students are likely to self-select into groups of hard-working friends. but it is interesting to observe that the positive relationship between a student’s interest in mathematics and the attitudes towards mathematics of his or her peers are stronger in the schools that teach relatively less advanced mathematics, even after taking mathematics performance into account. the data thus suggest that students in schools that are not academically challenging would benefit even more than students in academically rigorous schools from having a network of friends who like mathematics. a possible explanation is that students in academically rigorous or socio-economically advantaged schools have more access to other resources (e.g. parental involvement) that are substitutes for peers who are interested in mathematics.
to the extent that attending a school with highly motivated peers creates incentives for students to work on mathematics, disadvantaged students can be expected to benefit from attending advantaged schools. however, desegregation policies that allow disadvantaged students to attend high-achieving schools do not always work as expected. as a result of a background of disadvantage and low achievement, a disadvantaged student attending an advantaged school may suffer from social isolation or even discrimination if he or she is not well-prepared to be among a minority in the school (montt, 2012). the disadvantaged student may also suffer from an “invidious comparison” with his/her higher-achieving peers, leading to lower self-concept and achievement (hoxby and Weingarth, 2005).
Figure 4.12 shows that students’ mathematics self-concept is associated with the students’ relative position in the school. in almost all countries and economies, students who reported less familiarity with mathematics than the average student in the school have lower mathematics self-concept. Particularly in korea and chinese taipei, students who reported a level of familiarity with mathematics below the average student in their school feel like “the small frogs of the pond” (marsh and hau, 2003), meaning that their self-concept is undermined by social comparisons with peers who have a greater familiarity with mathematics.
the research on the effects of school composition has often failed to integrate the impact of students’ relative social and academic standing on the psychological and competitive atmosphere in the school. this is problematic because this atmosphere affects students’ achievement, well-being, beliefs and expectations about their future studies and jobs. the organisation of school systems and teaching practices can have an effect on whether an academically or socio-economically disadvantaged student is pushed ahead through positive “contagion” from his or her higher-achieving peers, or pushed back by humiliating social comparisons.
For example, both positive and negative peer effects tend to be weaker in stratified school systems because these systems institutionalise the norms and information students consider when forming their expectations (montt, 2012). a closer look at the real-life experiences of poor and minority students in high-achieving schools can help to identify the psychological, pedagogical and instructional challenges of “detracking” and integration across achievement levels (Rosenbaum, 1999).

equations and inequalities: making mathematics accessible to all © OECD 2016 185
4OppOrtunity tO learn and students’ attitudes tOwards mathematics
Index change-0.30 -0.25 -0.20 -0.15 -0.10 -0.05 0.00 0.05 0.10
KoreaChinese Taipei
IcelandFinlandCanada
AustraliaUnited States
SingaporeSpain
SloveniaSerbia
New ZealandJordan
PortugalPolandFrance
United Arab EmiratesSweden
BrazilUnited Kingdom
PeruColombia
IrelandItaly
LithuaniaHungary
OECD averageMontenegro
EstoniaLatvia
Russian FederationCzech Republic
SwitzerlandHong Kong-China
UruguayChileIsrael
MalaysiaMexico
GermanyTurkey
DenmarkGreeceCroatia
Viet NamQatar
Slovak RepublicShanghai-China
BelgiumCosta Rica
ThailandKazakhstan
BulgariaMacao-China
RomaniaTunisia
NetherlandsJapan
LuxembourgArgentina
AustriaIndonesia
Students’ mathematics self-concept is lowerif they are less familiar with mathematicsthan the other students in their school
Students’mathematicsself-concept ishigher if theyare less familiarwith mathematicsthan the otherstudents in theirschool
Figure 4.12 Mathematics self-concept and relative familiarity
with mathematics compared with schoolmatesChange in the index of self-concept associated with a one-unit difference between
the school’s average familiarity and the student’s familiarity with mathematics
Notes: The index of mathematics self-concept is based on the degree to which students agree with the statements: I’m just not good in mathematics; I get good grades in mathematics; I learn mathematics quickly; I have always believed that mathematics is one of my best subjects and In my mathematics class, I understand even the most difficult work. The index of familiarity with mathematics is based on students’ responses to 13 items measuring students’ self-reported familiarity with mathematics concepts (such as exponential functions, divisor, quadratic function, etc.).The results are based on a multi-level model and account for the gender and socio-economic status of the student (at the student level) and for the percentage of girls, the socio-economic profile of the school and the average level of familiarity with mathematics in the school (at the school level).Statistically signi�cant values are marked in a darker tone.Countries and economies are ranked in ascending order of the index change in familiarity with mathematics associated with larger differences between the school’s and the student’s familiarity.Source: OECD, PISA 2012 Database, Table 4.12b. 12 http://dx.doi.org/10.1787/888933377566

© OECD 2016 equations and inequalities: making mathematics accessible to all186
4OppOrtunity tO learn and students’ attitudes tOwards mathematics
Parental involvement and children’s mathematics anxietyParents are their children’s first and longest-serving teachers (maloney et al., 2015). many of the basic ideas that support formal mathematics later in life are constructed during the first years of a child’s life, through interaction with the adults in their surrounding environment. over the course of these interactions, parents’ attitudes towards mathematics are often passed on to their child. What makes mathematics different from other subjects is that it is considered socially acceptable to say “i am not a maths person” or “i never liked maths”. unlike other weaknesses that are hidden, mathematical illiteracy is flaunted by many people (Paulos, 2011). When a parent does that in front of a child, he or she is suggesting that mathematics is not important or that only some people need to understand mathematics.
Pisa data show that parents participate actively in their child’s learning. on average across the 11 countries and economies where the Pisa Parent questionnaire was distributed, 81% of parents reported discussing how the child is doing at school at least once a week; 78% of parents reported eating the main meal with their child almost every day; 65% of parents reported spending time just talking to their child at least once a week; 19% of parents reported obtaining mathematics materials for their child at least once a week; and 32% of parents reported discussing with their child how mathematics can be applied to everyday life at least once a week (oecd, 2013b: table iii.6.1a).
on average, these activities are positively associated with students’ mathematics performance and with other indicators of students’ attitudes towards learning, such as the likelihood of arriving on time for classes (oecd, 2013b). however, research shows that the effects of parental involvement on a child’s achievement vary according to parents’ behaviour, the child’s grade level, and the racial, ethnic and socio-economic background of the family (Robinson and harris, 2014).
the major vehicle through which parents help their children with school subjects is homework. on average across oecd countries, 44% of 15-year-old students reported spending some time each week studying with a parent (table 4.13). studying with parents is much less common in east-asian countries and economies. less than 30% of students in hong kong-china, Japan, korea, macao-china, shanghai-china, singapore and chinese taipei study with their parents.
Parents are more likely to intervene when their children struggle with mathematics. Figure 4.13 shows that, on average, students in the lower quarter of the index of familiarity with mathematics spend 1 hour and 11 minutes studying with their parents, while students in the top quarter spend less than 1 hour.1 the difference in study time with parents between students who are less familiar with mathematics and students who are more familiar with mathematics is larger than 1 hour per week in the Russian Federation, turkey and the united arab emirates.
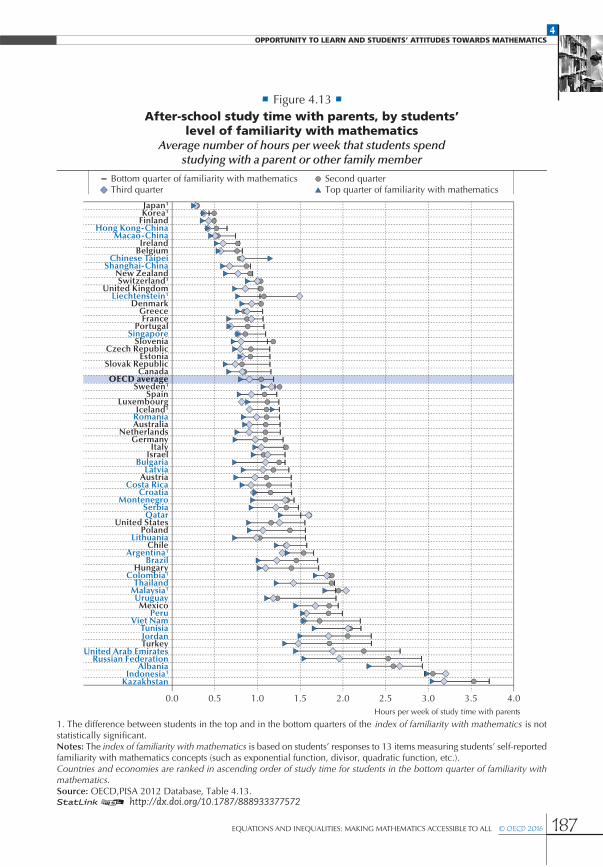
equations and inequalities: making mathematics accessible to all © OECD 2016 187
4OppOrtunity tO learn and students’ attitudes tOwards mathematics
Bottom quarter of familiarity with mathematics Second quarterThird quarter Top quarter of familiarity with mathematics
Hours per week of study time with parents
0.0 0.5 1.0 1.5 2.0 2.5 3.0 3.5 4.0
FinlandHong Kong-China
Macao-ChinaIreland
BelgiumChinese Taipei
Shanghai-ChinaNew ZealandSwitzerland1
United KingdomLiechtenstein1
DenmarkGreeceFrance
PortugalSingapore
SloveniaCzech Republic
EstoniaSlovak Republic
CanadaOECD average
Sweden1
SpainLuxembourg
Iceland1
RomaniaAustralia
NetherlandsGermany
ItalyIsrael
BulgariaLatvia
AustriaCosta Rica
CroatiaMontenegro
SerbiaQatar
United StatesPoland
LithuaniaChile
Argentina1
BrazilHungary
Colombia1
ThailandMalaysia1
UruguayMexico
PeruViet Nam
TunisiaJordanTurkey
United Arab EmiratesRussian Federation
AlbaniaIndonesia1
Kazakhstan
Korea1Japan1
Figure 4.13 After-school study time with parents, by students’
level of familiarity with mathematicsAverage number of hours per week that students spend
studying with a parent or other family member
1. The difference between students in the top and in the bottom quarters of the index of familiarity with mathematics is not statistically significant.Notes: The index of familiarity with mathematics is based on students’ responses to 13 items measuring students’ self-reported familiarity with mathematics concepts (such as exponential function, divisor, quadratic function, etc.).Countries and economies are ranked in ascending order of study time for students in the bottom quarter of familiarity with mathematics.Source: OECD,PISA 2012 Database, Table 4.13. 12 http://dx.doi.org/10.1787/888933377572

© OECD 2016 equations and inequalities: making mathematics accessible to all188
4OppOrtunity tO learn and students’ attitudes tOwards mathematics
What happens when a parent who dislikes mathematics, or is anxious about mathematics, tries to help his or her child with homework? Recent research has shown that when parents who are anxious towards mathematics frequently help their children with mathematics homework, their help can backfire, leading to greater mathematics anxiety and less mathematics learning for their children (maloney et al., 2015). in expressing their own dislike of and confusion about mathematics, these parents may be inadvertently transferring their own attitudes to their children.
mathematics anxiety is even evident among “smart” students. on average across oecd countries, 13% of the students in the top quarter of the mathematics performance distribution reported feeling helpless when doing mathematics problems (table 4.14a). this lack of self-confidence is more common among top-performing girls (16%) than among top-performing boys (10%).
Parents who send positive messages about mathematics can help dispel the anxiety that distorts students’ perceptions of their problem-solving abilities. Figure 4.14 shows that, on average across oecd countries, high-performing students who reported that their parents do not like mathematics are 73% more likely to feel helpless when they are doing mathematics problems than the high-performing children of parents who like mathematics. high-performing students in croatia, Finland, hungary and the netherlands whose parents dislike mathematics are more than 2.5 times more likely to feel helpless when doing mathematics than high-performing students whose parents like mathematics.
this finding confirms results from experimental research showing that mathematics success can be inherited, not only through genetics but also because children often believe that they cannot do much better than their parents. For example, an experiment examined students’ concern about their relative performance when completing a mathematics task on a computer (Jury, smeding and darnon, 2015). in the experiment, researchers noted how often students’ eyes moved towards an arrow on the screen showing how well they were doing compared with other students. students whose parents did not complete higher education were more worried about others’ performance than students from more-educated families. this concern explained their underperformance: when the arrow was not shown on the screen, there was no performance difference between the two groups of students. students from less-educated families, or whose parents have a poorer record in mathematics, might thus be more likely to believe in the received wisdom that they cannot succeed, and are more sensitive to signals that might confirm this failure.
one essential ingredient for children’s success is for parents to communicate that solving mathematics problems can be a pleasant and rewarding activity. this is a message that all parents should be sending early in their child’s lives and that needs to be reinforced over time (Robinson and harris, 2014).

equations and inequalities: making mathematics accessible to all © OECD 2016 189
4OppOrtunity tO learn and students’ attitudes tOwards mathematics
Odds ratio
Top quarter of performance in mathematics Bottom quarter of performance in mathematics
0.00 0.50 1.00 1.50 2.00 2.50 3.00 3.50 4.00
United Arab EmiratesMalaysia
PeruColombia
United StatesRussian Federation
IndonesiaNew Zealand
JordanMexico
KoreaHong Kong-China
TunisiaTurkeyLatvia
LithuaniaSloveniaPortugal
ChileUruguay
QatarRomaniaBulgaria
SingaporeBrazil
United KingdomArgentinaDenmark
NorwayIreland
ThailandMacao-China
SpainCanada
KazakhstanIceland
AustraliaItaly
GermanyViet Nam
JapanCosta Rica
LuxembourgAustria
OECD averageSlovak Republic
PolandBelgiumSweden
Shanghai-ChinaMontenegro
SerbiaGreece
Chinese TaipeiSwitzerland
IsraelFrance
Czech RepublicNetherlands
HungaryCroatiaFinlandEstonia
Less likely More likely to feel helpless
High-performing students whose parentsdo not like mathematics are 1.73 timesmore likely to feel helpless when doinga mathematics problem than studentswhose parents like mathematics
Figure 4.14
How to read the chart: An odds ratio of 2 means that students whose parents do not like mathematics are twice as likely as students whose parents like mathematics to feel helpless when doing a mathematics problem.Notes: The results take into account students’ gender and socio-economic status.Statistically signi�cant odds ratios are marked in a darker tone.Countries and economies are ranked in ascending order of the odds ratio for students in the top quarter of performance in mathematics.Source: OECD, PISA 2012 Database, Table 4.14b.
Parents’ attitudes towards mathematics and students’ anxiety,by performance in mathematics
Change in the probability that students feel helpless when doing mathematics problemsassociated with reporting that their parents do not like mathematics
12 http://dx.doi.org/10.1787/888933377584

© OECD 2016 equations and inequalities: making mathematics accessible to all190
4OppOrtunity tO learn and students’ attitudes tOwards mathematics
Teachers’ practices and attitudes towards mathematics
Teachers’ communication about mathematics and students’ anxietytogether with parents, teachers are major role models for students. the way teachers communicate and structure their teaching practices is likely to affect students’ attitudes towards mathematics. traditional practices in mathematics classes, such as imposed authority, public exposure and timed deadlines, may cause great anxiety in many students (curtain-Phillips, 1999). consequently, teaching methods that use competition judiciously, communicate clearly, de-emphasise speed tests or drills, and reduce the pressure from major tests and examinations could alleviate students’ mathematics anxiety (beilock and Willingham, 2014; Furner and berman, 2003; maloney and beilock, 2012; Rossnan, 2006).
in particular, communication about learning objectives and feedback on students’ performance can be ways of reducing students’ mathematics anxiety. a number of teachers’ communication strategies, such as telling students what they have to learn, what is expected of them in a test, quiz or assignment, and how well they are doing in mathematics class, are related to less mathematics anxiety among students (table 4.15).
however, such communication does not work in the same way (or is not expressed in the same way) for all students. Figure 4.15 shows that the communication practices listed above reduce anxiety among students who are more familiar with mathematics; but giving students feedback on their strengths and weaknesses in mathematics, and telling them what they need to do to become better in mathematics actually increase anxiety among students who are less familiar with mathematics. in interpreting the results, one has to keep in mind that this relationship may be mediated by the quality of the teachers: good teachers can provide greater exposure to mathematics content and communicate well with their students at the same time.
Teaching practices that build mathematics self-conceptclassroom practices that help students focus their attention and engage in the mathematics task at hand may also help reduce the incidence of poor performance that results from mathematics anxiety and low mathematics self-concept. a number of practices, such as differentiating tasks based on students’ abilities, splitting students into small groups, helping students understand, and using cognitive-activation strategies, are associated with higher mathematics self-concept (table 4.16). While the use of these teaching practices is associated with higher self-concept across students, regardless of how familiar they are with mathematics, the effect is not necessarily of the same magnitude for all students.
the use of teaching practices that differentiate tasks according to students’ ability and encourage students to work in small groups is associated with a greater increase in self-concept among students who are less familiar with mathematics than among students who are more familiar with mathematics (Figure 4.16 and table 4.16). students who are less familiar with mathematics are likely to feel less competition with peers when they work in small groups and when they receive relatively more individualised teaching (marsh, 1993; Pajares and schunk, 2001). giving students extra help, taking the time to explain the subject until students understand, and using

equations and inequalities: making mathematics accessible to all © OECD 2016 191
4OppOrtunity tO learn and students’ attitudes tOwards mathematics
cognitive-activation strategies, such as assigning problems that require students to think for an extended time, seem to benefit all students. students who are more familiar with mathematics benefit the most from these practices, possibly because students who do more advanced mathematics also tend to be paired with more effective teachers.
Students less familiar with mathematicsStudents more familiar with mathematics
Teachers’ communication
-0.25
-0.20
-0.15
-0.10
-0.05
0.00
0.05
0.10
0.15
The teachergives me feedback
on my strengthsand weaknessesin mathematics
The teachertells me what Ineed to do to
become better inmathematics
The teachertells us what isexpected of us
when we get a test,quiz or assignment
The teacher tellsme about how
well I am doing inmy mathematics
class
The teachertells us what we
have to learn
Mathematics anxiety increases among studentswho are less familiar with mathematics when
teachers provide feedback
Mathematics anxiety decreases among students who aremore familiar with mathematics when teachers specifylearning goals
Inde
x ch
ange
Figure 4.15 Teaching practices and students’ mathematics anxiety, by students’
level of familiarity with mathematicsChange in the index of mathematics anxiety associated with having mathematics teacherswho provide feedback or specify learning goals in every or most lessons, OECD average
Notes: The index of mathematics anxiety is based on the degree to which students agree with the statements: I often worry that it will be difficult for me in mathematics classes; I get very tense when I have to do mathematics homework; I get very nervous doing mathematics problems; I feel helpless when doing a mathematics problem; and I worry that I will get poor marks in mathematics.The index of familiarity with mathematics is based on students’ responses to 13 items measuring students’ self-reported familiarity with mathematics concepts (such as exponential function, divisor, quadratic function, etc.).Students with less (more) familiarity with mathematics are students in the bottom (top) quarter of the distribution of familiarity.The results take into account students’ gender and socio-economic status.The OECD average for students who are more/less familiar with mathematics is calculated only for countries with a valid index change across both categories and across countries with available data.Statistically signi�cant values are marked in a darker tone. All values for students who are more familiar with mathematics are statistically significant. Source: OECD PISA 2012 Database, Table 4.15. 12 http://dx.doi.org/10.1787/888933377594

© OECD 2016 equations and inequalities: making mathematics accessible to all192
4OppOrtunity tO learn and students’ attitudes tOwards mathematics
Teaching practices
0.00
0.05
0.10
0.15
0.20
0.25
0.30
0.35
0.40
0.45
The teacher givesdifferent work toclassmates whohave dif�culties
learning and/or tothose who canadvance faster
The teacherhas us work insmall groups tocome up with
joint solutions toa problem or task
The teachergives extra helpwhen students
need it
The teachercontinues
teaching untilthe studentsunderstand
The teacher asksquestions that
make us re�ecton the problem
The teachergives problemsthat require usto think for anextended time
Inde
x ch
ange
Students less familiar with mathematicsStudents more familiar with mathematics
Figure 4.16 Teaching practices and students’ mathematics self-concept, by students’
level of familiarity with mathematicsChange in the index of mathematics self-concept associated with having mathematics teachers
who provide feedback or specify learning goals in every or most lessons, OECD average
Notes: The index of mathematics self-concept is based on the degree to which students agree with the statements: I’m just not good in mathematics; I get good grades in mathematics; I learn mathematics quickly; I have always believed that mathematics is one of my best subjects and In my mathematics class, I understand even the most difficult work.The index of familiarity with mathematics is based on students’ responses to 13 items measuring students’ self-reported familiarity with mathematics concepts (such as exponential function, divisor, quadratic function, etc.).Students with less (more) familiarity with mathematics are students in the bottom (top) quarter of the distribution of familiarity with mathematics.The results take into account students’ gender and socio-economic status.The OECD average for students who are more/less familiar with mathematics is calculated only for countries with a valid index change across both categories and across countries with available data. Statistically signi�cant values are marked in a darker tone. All values for students who are less familiar with mathematics are statistically significant.Source: OECD PISA 2012 Database, Table 4.16.
Innovative teaching instruments that foster motivation to learn mathematics using innovative teaching instruments can also help to engage students and spark an interest in mathematics. in particular, using technology in teaching mathematics can encourage students to become active participants during class. Figure 4.17 shows that using a computer during mathematics lessons is associated with an increase in the index of intrinsic motivation for mathematics (mathematics interest) corresponding to 19% of a standard deviation, on average across oecd countries. even after taking into account students’ and schools’ characteristics,
12 http://dx.doi.org/10.1787/888933377601

equations and inequalities: making mathematics accessible to all © OECD 2016 193
4OppOrtunity tO learn and students’ attitudes tOwards mathematics
Before accounting for students’ and schools’ characteristicsAfter accounting for students’ and schools’ characteristics
Index change0.00 0.05 0.10 0.15 0.20 0.25 0.30 0.35 0.40 0.45
JapanLiechtensteinMacao-China
EstoniaHong Kong-China
Czech RepublicSpain
MexicoShanghai-China
GermanySerbia
IcelandRussian Federation
SingaporeNetherlands
PolandBelgiumAustriaLatvia
CroatiaIrelandFinland
SwedenDenmarkPortugal
OECD averageChile
SwitzerlandItaly
GreeceUruguay
TurkeyKorea
Costa RicaSloveniaAustralia
Slovak RepublicHungary
New ZealandNorway
JordanChinese Taipei
Israel
Figure 4.17 Students’ interest in mathematics and their use
of computers in mathematics lessonsChange in the index of intrinsic motivation for mathematics associated
with using a computer in mathematics class
Notes: Intrinsic motivation to learn mathematics (or interest in mathematics) measures students’ drive to perform an activity purely for the joy gained from the activity itself. The index of intrinsic motivation for mathematics is based on the degree to which students agree or disagree with the statements: I enjoy reading about mathematics; I look forward to my mathematics lessons; I do mathematics because I enjoy it; I am interested in the things I learn in mathematics.“Students’ and schools’ characteristics” include: student’s gender, socio-economic status and mathematics performance, and the school’s socio-economic profile.Statistically signi�cant values are marked in a darker tone.Countries and economies are ranked in ascending order of the change in the index of intrinsic motivation for mathematics before accounting for students’ characteristics.Source: OECD, PISA 2012 Database Table 4.17. 12 http://dx.doi.org/10.1787/888933377617

© OECD 2016 equations and inequalities: making mathematics accessible to all194
4OppOrtunity tO learn and students’ attitudes tOwards mathematics
students’ use of a computer in class is related to an increase in interest in mathematics of at least 30% of a standard deviation in greece, israel, Jordan, new Zealand and chinese taipei.
dynamic graphical, numerical and visual technological applications (e.g. the interactive whiteboard) can provide new opportunities for teachers and students to interact with, represent and explore mathematics concepts. however, teachers need to be well-trained and practice extensively with these tools if they are to be effective (oecd, 2015b).
The importance of choosing well-framed and engaging problems mathematics tasks are central to students’ learning because “tasks convey messages about what mathematics is and what doing mathematics entails” (national council of teachers of mathematics, 1991: p. 24). the mathematics problems to which many students are exposed are often nothing more than routine exercises organised to provide practice on a particular mathematics technique that, usually, has just been demonstrated to the student (schoenfeld,1992). the traditional mathematics class follows a linear structure: a task is used to introduce a technique; the technique is illustrated; more tasks are provided so that the student may practice the illustrated skills. Rather than being engaged in “real” problem solving, students only work on the tasks that have been set before them. this kind of routine, which assigns a passive role to students, might not stimulate interest and engagement.
solving problems and making up new ones is the essence of mathematics (boaler, 2015) and is what makes mathematics so intriguing to proficient practitioners. Presenting a problem and developing the skills needed to solve that problem can be more motivational for students than teaching students how to apply a procedure without a context. teaching through real problems allows students to see a reason for learning a specific topic or concept, and thus become more deeply involved in learning it. Working with open-ended and modelling tasks, in particular, provides students with opportunities not just to apply mathematics but also to learn new mathematics concepts and practice their computational skills (henningsen and stein, 1997).
teachers can more easily stimulate the interest of their students by posing problems that relate conceptual knowledge with a practical application that students find familiar. Research shows that students perform better when they are familiar with the context used to present a particular problem set – for example, when the context refers to an experience they personally lived through (chiesi, spilich and Voss, 1979; alexander and Judy 1988; alexander, kulikowich and schulze, 1994). using practical applications should thus be encouraged as long as students are helped to transfer what they learn on the tasks to other contexts (see box 1.3 in chapter 1).
the structure of Pisa assessments allows researchers to investigate how well students do in problems that are contextualised in different ways, as test items are cast in four different contexts: personal, occupational, societal and scientific. Problems classified in the personal context category focus on activities carried out by students, their families and their peers; problems in the occupational context are set in the world of work; problems in the societal context focus on the students’ community, whether local, national or global; and problems classified in the scientific category relate to the application of mathematics to the natural world and to issues and topics related to science and technology (oecd, 2013a).

equations and inequalities: making mathematics accessible to all © OECD 2016 195
4OppOrtunity tO learn and students’ attitudes tOwards mathematics
Figure 4.18 shows that socio-economically disadvantaged students perform relatively better on items framed in a personal context than on problems framed in the other contexts. on average across oecd countries, disadvantaged students were 39% less likely than other students to answer correctly test questions framed in a personal context, 45% less likely to answer correctly questions in a societal context, and about 50% less likely to answer correctly questions with an occupational or scientific context, after accounting for other characteristics of the tasks, such as their difficulty. a careful selection of the context of applied problem thus matters. collaborative efforts involving mathematics researchers, teachers and students should develop and share contextualised tasks that are both challenging and engaging, particularly for those students who have low familiarity with mathematics.
develOping knOwledge Of and engagement with mathematics at the same time
a coherent curriculum paired with well-structured instruction materials is a prerequisite for developing conceptual knowledge of mathematics. in turn, conceptual knowledge is important for mathematics problem solving (chapter 3). however, simply assigning challenging mathematics tasks to students will not automatically engage them. students cannot be expected to develop the capacity to think, reason and solve problems mathematically if teachers do not use the kinds of cognitive-activation teaching strategies that have been proven to be the most effective for student learning (henningsen and stein, 1997).
Figure 4.19 shows that students’ interest in mathematics can complement exposure to content in developing mathematical literacy. on average across oecd countries, the relationship between exposure to pure mathematics and performance in Pisa is stronger – by five score points – among students who are interested in what they study in class than among students who are not interested. in hungary and slovenia, the change in performance associated with more exposure to pure mathematics is more than 15 score points greater among students who reported that they are interested in what they learn at school than among students who reported that they are not interested.
mathematics is more than a static, structured system of facts, procedures and concepts (henningsen and stein, 1997); but large numbers of mathematics students only see the facts and do not get a sense of the questions behind the answers (boaler, 2015). moreover, many students have problems keeping up with fast-paced mathematics lessons, and thus develop ever-widening gaps in their knowledge and understanding, and lose some self-belief. it is possible, although not easy, to make mathematics concepts more engaging and more finely tuned to the capacities of the weakest students in the class without compromising the integrity of the activity (houssart, 2004). everyone involved in mathematics education – teachers, school leaders, teacher educators, researchers, parents, specialist support services, school boards and policy makers, as well as students themselves – has a role to play in changing the way mathematics is taught so that it becomes more intriguing and engaging for all students (anthony and Walshaw, 2009).
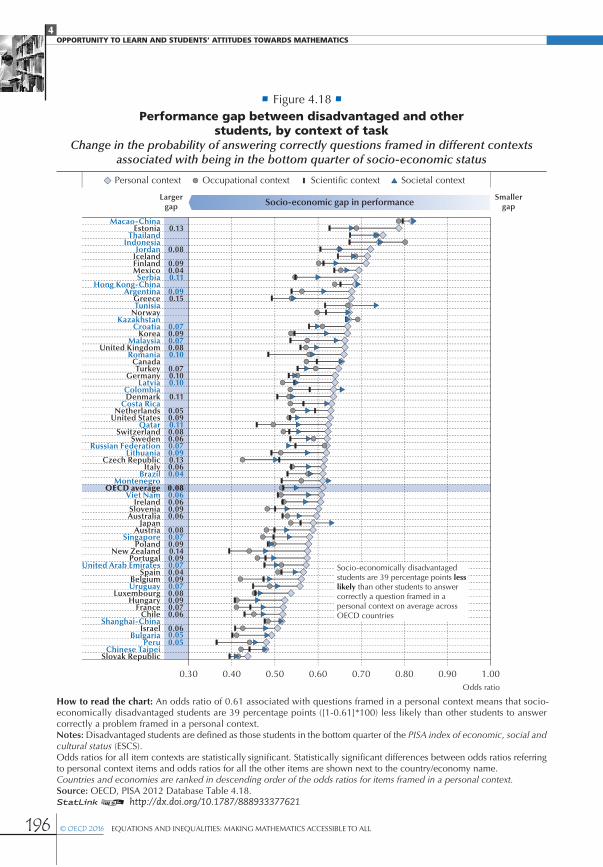
© OECD 2016 equations and inequalities: making mathematics accessible to all196
4OppOrtunity tO learn and students’ attitudes tOwards mathematics
Odds ratio
Personal context Occupational context Scientific context Societal context
Socio-economic gap in performance
0.30 0.40 0.50 0.60 0.70 0.80 0.90 1.00
Macao-ChinaEstonia
ThailandIndonesia
JordanIcelandFinlandMexicoSerbia
Hong Kong-ChinaArgentina
GreeceTunisia
NorwayKazakhstan
CroatiaKorea
MalaysiaUnited Kingdom
RomaniaCanadaTurkey
GermanyLatvia
ColombiaDenmark
Costa RicaNetherlands
United StatesQatar
SwitzerlandSweden
Russian FederationLithuania
Czech RepublicItaly
BrazilMontenegro
OECD averageViet Nam
IrelandSloveniaAustralia
JapanAustria
SingaporePoland
New ZealandPortugal
United Arab EmiratesSpain
BelgiumUruguay
LuxembourgHungary
FranceChile
Shanghai-ChinaIsrael
BulgariaPeru
Chinese TaipeiSlovak Republic
0.13
0.08
0.090.040.11
0.090.15
0.070.090.070.080.10
0.070.100.10
0.11
0.050.090.110.080.060.070.090.130.060.04
0.080.060.060.090.06
0.080.070.090.140.090.070.040.090.070.080.090.070.06
0.060.050.05
Largergap
Smallergap
Socio-economically disadvantagedstudents are 39 percentage points lesslikely than other students to answercorrectly a question framed in apersonal context on average acrossOECD countries
Figure 4.18 Performance gap between disadvantaged and other
students, by context of taskChange in the probability of answering correctly questions framed in different contexts
associated with being in the bottom quarter of socio-economic status
How to read the chart: An odds ratio of 0.61 associated with questions framed in a personal context means that socio-economically disadvantaged students are 39 percentage points ([1-0.61]*100) less likely than other students to answer correctly a problem framed in a personal context.Notes: Disadvantaged students are defined as those students in the bottom quarter of the PISA index of economic, social and cultural status (ESCS).Odds ratios for all item contexts are statistically significant. Statistically significant differences between odds ratios referring to personal context items and odds ratios for all the other items are shown next to the country/economy name. Countries and economies are ranked in descending order of the odds ratios for items framed in a personal context.Source: OECD, PISA 2012 Database Table 4.18. 12 http://dx.doi.org/10.1787/888933377621

equations and inequalities: making mathematics accessible to all © OECD 2016 197
4OppOrtunity tO learn and students’ attitudes tOwards mathematics
Score-point difference
-10 0 10 20 30 40 50 60
Shanghai-ChinaAlbania
DenmarkMacao-China
BrazilColombiaIndonesia
SwedenArgentina
EstoniaRomania
KazakhstanCosta Rica
MexicoUruguay
Czech RepublicLiechtenstein
SerbiaFinlandTunisia 15
LuxembourgJordan 11
NorwayPoland
Chile 9Russian Federation
SpainJapan
Hong Kong-ChinaIreland
Viet NamIceland
Montenegro Slovak Republic
PeruIsrael
AustriaOECD average 5
12
SwitzerlandPortugalCanada 10Greece 14
GermanyUnited States
ThailandBulgariaCroatia 14Turkey
Italy 10United Kingdom
Chinese TaipeiLithuania
FranceUnited Arab Emirates 8
Latvia 14Slovenia 16
NetherlandsQatar 12
Australia 11Hungary 19
SingaporeBelgium 12Malaysia 11
New ZealandKorea
Students interested in mathematics Students not interested in mathematics
Figure 4.19 Relationship between exposure to pure mathematics and mathematics
performance, by students' interest in mathematicsChange in mathematics performance associated with a one-unit change in the index of exposure
to pure mathematics, by students' interest in mathematics
Notes: The index of exposure to pure mathematics measures student-reported experience with mathematics tasks at school requiring knowledge of algebra (linear and quadratic equations).Statistically signi�cant differences between students who are interested and not interested in mathematics are shown next to the country/economy name.Statistically signi�cant values are marked in a darker tone.Countries and economies are ranked in ascending order of the change in mathematics performance among students interest-ed in mathematics.Source: OECD, PISA 2012 Database Table 4.19. 12 http://dx.doi.org/10.1787/888933377639

© OECD 2016 equations and inequalities: making mathematics accessible to all198
4OppOrtunity tO learn and students’ attitudes tOwards mathematics
Note
1. this result is robust to accounting for students’ performance in mathematics.
References
Alexander, P.A. and J.E. Judy (1988), “the interaction of domain-specific and strategic knowledge in academic performance”, Review of Educational Research, Vol. 58/4, pp. 375-404, http://dx.doi.org/10.2307/1170279.
Alexander, P.A., J.M. Kulikowich and S.K. Schulze (1994), ”how subject-matter knowledge affects recall and interest”, American Educational Research Journal, Vol. 31/2, pp. 313-337, http://dx.doi.org/10.3102/00028312031002313.
Angrist, J.D. and K. Lang (2004), “does school integration generate peer effects? evidence from boston’s metco program”, The American Economic Review, Vol. 94/5, pp. 1613-1634, http://dx.doi.org/10.1257/0002828043052169.
Anthony, G. and M. Walshaw (2009), “effective pedagogy in mathematics”, Vol. 19, international academy of education, belgium.
Ashcraft, M.H. and A.M. Moore (2009), “mathematics anxiety and the affective drop in performance”, Journal of Psychoeducational Assessment, Vol. 27/3, pp. 197-205, http://dx.doi.org/10.1177/0734282908330580.
Australian Curriculum, Assessment and Reporting Authority (ACARA) (2016), “F-10 curriculum: mathematics: Rationale - the australian curriculum v8.1”, Australian Curriculum Website http://www.australiancurriculum.edu.au/ (accessed 31 march 2016).
Bandura, A. (1977), Social Learning Theory, general learning Press, new York, nY.
Beilock, S.L. and D.T. Willingham (2014), “math anxiety: can teachers help students reduce it?”, American Educator, Vol. 38/2, pp. 28-32.
Boaler, J. (2015), Mathematical Mindsets: Unleashing Students’ Potential through Creative Math, Inspiring Messages and Innovative Teaching, Jossey bass, san Francisco, ca.
Chiesi, H.L., G.J. Spilich and J.F. Voss (1979), “acquisition of domain-related information in relation to high and low domain knowledge”, Journal of Verbal Learning and Verbal Behavior, Vol. 18/3, pp. 257-73, http://dx.doi.org/10.1016/s0022-5371(79)90146-4.
Cooley, J. (2007), “desegregation and the achievement gap: do diverse peers help?”, unpublished manuscript, university of Wisconsin-madison.
Cross, K. (2004), “engagement and excitement in mathematics”, Mathematics Teaching, Vol. 189, pp. 4-7.
Curtain-Phillips, M. (1999), Math Attack: How to Reduce Math Anxiety in the Classroom, at Work and in Everyday Personal Use, Paperback, new York, nY.
Eccles, J.S. and A. Wigfield (2002), “motivational beliefs, values, and goals”, Annual Review of Psychology, Vol. 53/1, pp. 109-132, http://dx.doi.org/10.1146/annurev.psych.53.100901.135153.
Fryer, R.G. and P. Torelli (2010), “an empirical analysis of ‘acting white’”, Journal of Public Economics, Vol. 94/5, pp. 380-396, http://dx.doi.org/10.1016/j.jpubeco.2009.10.011.
Furner, J.M. and B.T. Berman (2003), “Review of research: math anxiety: overcoming a major obstacle to the improvement of student math performance”, Childhood Education, Vol. 79/3, pp. 170-174, http://dx.doi.org/ 10.1080/00094056.2003.10522220.

equations and inequalities: making mathematics accessible to all © OECD 2016 199
4OppOrtunity tO learn and students’ attitudes tOwards mathematics
Hackett, G. and N.E. Betz (1995), “self-efficacy and career choice and development”, in J.e. maddux (ed.), Self-Efficacy, Adaptation, and Adjustment, springer us, pp. 249-280.
Hembree, R. (1990), ‘the nature, effects, and relief of mathematics anxiety”, Journal for Research in Mathematics Education, Vol. 21/1, pp. 33-46, http://dx.doi.org/10.2307/749455.
Henningsen, M. and M.K. Stein (1997), “mathematical tasks and student cognition: classroom-based factors that support and inhibit high-level mathematical thinking and reasoning”, Journal for Research in Mathematics Education, Vol. 28/5, pp. 524-549, http://dx.doi.org/10.2307/749690.
Houssart, J. (2004), Low attainers in primary mathematics: The whisperers and the maths fairy, RotuledgeFalmer, london, uk.
Hoxby, C.M. and G. Weingarth (2005), “taking race out of the equation: school reassignment and the structure of peer effects”, Working Paper no. 7867, national bureau of economic Research, cambridge, ma.
Jencks, C. and S.E. Mayer (1990), “the social consequences of growing up in a poor neighborhood: a review”, in l. lynn, Jr. and m.g.h. mcgeary (eds.), Inner City Poverty in the United States, national academy Press: Washington, dc, pp. 111-186.
Jury, M., A. Smeding and C. Darnon (2015), “First-generation students’ underperformance at university: the impact of the function of selection”, Frontiers in Psychology, Vol. 6/710, http://dx.doi.org/10.3389/fpsyg.2015.00710.
Lavy, V. and E. Sand (2015), “on the origins of gender human capital gaps: short and long term consequences of teachers’ stereotypical biases”, Working Paper no. 20909, national bureau of economic Research, cambridge, ma.
Lew, H.C. et al. (2012), “new challenges in the 2011 revised middle school curriculum of south korea: mathematical process and mathematical attitude”, ZDM, Vol. 44/2, pp. 109-119, http://dx.doi.org/10.1007/s11858-012-0392-3.
Li, Y. and G. Lappan (2014), “mathematics curriculum in school education: advancing research and practice from an international perspective”, in Y. li and g. lappan (eds.), Mathematics Curriculum in School Education, springer, dordrecht, the netherlands, pp. 3-12.
Maloney, E.A. and S.L. Beilock (2012), “math anxiety: Who has it, why it develops, and how to guard against it”, Trends in Cognitive Sciences, Vol. 16/8, pp. 404-406, http://dx.doi.org/10.1016/j.tics.2012.06.008.
Maloney, E.A. et al. (2015), “intergenerational effects of parents’ math anxiety on children’s math achievement and anxiety”, Psychological Science, Vol. 26/9, pp. 1480-1488, http://dx.doi.org/10.1177/0956797615592630.
Marsh, H.W (1993), “academic self-concept: theory, measurement, and research”, in J.m. suls (ed.), The Self in Social Perspective. Psychological Perspectives on the Self, Vol. 4., lawrence erlbaum associates, inc., hillsdale, nJ, england, pp. 59-98.
Marsh, H.W. and K.T. Hau (2003), “big-fish-little-pond effect on academic self-concept: a cross-cultural (26 country) test of the negative effects of academically selective schools”, American Psychologist, Vol. 58/5, pp. 364-376, http://dx.doi.org/10.1037/0003-066X.58.5.364.
Ministry of Education of Singapore (2012), “mathematics syllabus - secondary one to four”, ministry of education, singapore.
Montt, G. (2012), Socioeconomic School Composition Effects on Student Outcomes, unpublished Phd dissertation, the university of notre dame, in.

© OECD 2016 equations and inequalities: making mathematics accessible to all200
4OppOrtunity tO learn and students’ attitudes tOwards mathematics
Mullis, I.V. et al. (2012), TIMSS 2011 Encyclopedia: Education Policy and Curriculum in Mathematics and Science, Volume 1, ak, international association for the evaluation of educational achievement, amsterdam, the netherlands.
National Council of Teachers of Mathematics (1991), Professional Standards for Teaching Mathematics, national council of teachers of mathematics, Reston, Va.
OECD (2015a), The ABC of Gender Equality in Education: Aptitude, Behaviour, Confidence, Pisa, oecd Publishing, Paris, http://dx.doi.org/10.1787/9789264229945-en.
OECD (2015b), Students, Computers and Learning: Making the Connection, Pisa, oecd Publishing, Paris, http://dx.doi.org/10.1787/9789264239555-en.
OECD (2013a), “mathematics Framework”, in oecd, PISA 2012 Assessment and Analytical Framework: Mathematics, Reading, Science, Problem Solving and Financial Literacy, oecd Publishing, Paris, http://dx.doi.org/10.1787/9789264190511-3-en.
OECD (2013b), PISA 2012 Results: Ready to Learn (Volume III): Students’ Engagement, Drive and Self-Beliefs, Pisa, oecd Publishing, Paris, http://dx.doi.org/10.1787/9789264201170-en.
OECD (2010), Learning Mathematics for Life: A Perspective from PISA, Pisa, oecd Publishing, Paris, http://dx.doi.org/10.1787/9789264075009-en.
Pajares, F. and D. H. Schunk (2001), “self-beliefs and school success: self-efficacy, self-concept, and school achievement”, in R.J. Riding and s.g. Rayner (eds.), Self-Perception: International Perspectives on Individual Differences (Vol.2), ablex Publishing, new York, nY, pp. 239-266.
Pajares, F. and M. David (1994), “Role of self-efficacy and self-concept beliefs in mathematical problem solving: a path analysis”, Journal of Educational Psychology, Vol. 86/2, pp. 193-203, http://dx.doi.org/10.1037/0022-0663.86.2.193.
Paulos, J.A. (2011), Innumeracy: Mathematical Illiteracy and Its Consequences, (2nd ed.), hill and Wang, new York, nY.
Reys, R.E. et al. (2014), Helping Children Learn Mathematics, (11th ed.), Wiley, hoboken, nJ.
Robinson, K. and A.L. Harris (2014), The Broken Compass. Parental Involvement with Children’s Education, harvard university Press, cambridge, ma.
Rosenbaum, J.E. (1999), “if tracking is bad, is detracking better?”, American Educator, Vol. 23/4, pp. 24-29.
Rossnan, S. (2006), “overcoming math anxiety”, Mathitudes, Vol. 1/1, pp. 1-4.
Ryan, R.M. and E.L. Deci (2000), “intrinsic and extrinsic motivations: classic definitions and new directions”, Contemporary Educational Psychology, Vol. 25/1, pp. 54-67, http://dx.doi.org/10.1006/ceps.1999.1020.
Sacerdote, B. (2001), “Peer effects with random assignment: Results for dartmouth roommates”, The Quarterly Journal of Economics, Vol. 116/2, pp. 681-704, http://dx.doi.org/10.1162/00335530151144131.
Schoenfeld, A.H. (1992), “learning to think mathematically: Problem solving, metacognition, and sense-making in mathematics”, in d. grouws (ed.), Handbook for Research on Mathematics Teaching and Learning, macmillan, new York, nY.
Wigfield, A. and J.L. Meece (1988), “math anxiety in elementary and secondary school students”, Journal of Educational Psychology, Vol. 80/2, pp. 210-216, http://dx.doi.org/10.1037/0022-0663.80.2.210.

5
equations and inequalities: making mathematics accessible to all © OECD 2016 201
5
201
Only a minority of the 15-year-old students in most countries understand and know well the core mathematics concepts in the curriculum. This chapter discusses a policy strategy to give all students similar opportunities to learn mathematics. Policy makers, curriculum designers, teachers and parents have an important role to play in the implementation of this strategy.
A Policy Strategy to Widen Opportunities to Learn Mathematics

© OECD 2016 equations and inequalities: making mathematics accessible to all202
5A Policy strAtegy to widen oPPortunities to leArn mAthemAtics
more than ever before, today’s students need to understand mathematical ideas, compute fluently, engage in logical reasoning and communicate using mathematics. all these skills are central to a young person’s preparedness to tackle problems that arise at work and in life beyond the classroom. but the reality is that many students are not reaching baseline levels of proficiency in mathematics (oecd, 2014; oecd, 2016). large numbers of students also lack self-confidence in the subject, do not enjoy it and are unlikely to continue studying it voluntarily (chapter 4).
how can these patterns be changed? this report shows that one possible way forward is to ensure that more students spend more “engaged” time learning mathematics concepts and practising complex mathematics tasks. the opportunity to learn mathematics content – the time students spend learning mathematics topics and practising mathematics tasks at school – can accurately predict mathematics literacy (chapter 3). in the vast majority of countries, a substantial share of the performance disparities in Pisa between socio-economically advantaged and disadvantaged students can be attributed to differences in these students’ familiarity with mathematics concepts (Figure 3.16). Widening access to mathematics content can thus raise the average levels of achievement and, at the same time, reduce inequalities. While acquiring deep conceptual knowledge and procedural fluency, students should also have opportunities to practice their reasoning and modelling capabilities, and to develop positive attitudes and self-beliefs towards mathematics.
a policy strategy centred on giving all students similar opportunities to learn mathematics can reduce the number of students who lack the knowledge and understanding of mathematics expected of a 15-year-old. it can also encourage teachers to create and use engaging material to develop students’ interest in mathematics. ultimately, it can result in greater equity throughout the school system and thus in greater social mobility. table 5.1 presents six policy recommendations that are part of this strategy.
develoP coherent stAndArds, frAmeworks And instruction mAteriAl for All students
chapter 1 shows that only a minority of the 15-year-old students in most countries reported that they understand and know well the core mathematics concepts in the curriculum. For example, on average across oecd countries, less than 30% of students reported that they know well and understand the concept of arithmetic mean. some students were never taught the topics, and many more were exposed to the topics so superficially that they only remember bits and pieces. closing the gap between the expectations and the reality of mathematics learning is possible if education systems set the right objectives, and have the means to transform these objectives into everyday teaching and learning.
a first important step is to develop curriculum standards and frameworks that clearly define the mathematics content to be covered at each cycle of schooling and the targets to be reached by the end of compulsory schooling. standards represent potential opportunities to learn (schmidt and burroughs, 2013) and define what students are expected to understand and be able to do. a framework is a more detailed list of the content and performance standards, by

equations and inequalities: making mathematics accessible to all © OECD 2016 203
5A Policy strAtegy to widen oPPortunities to leArn mAthemAtics
grade level, that guides the development of the curriculum and the selection of instructional materials.
table 5.1 Policy recommendations to widen opportunities to learn
Policy recommendation Goal Who should be involved
Develop coherent standards, frameworks and instruction material for all students
Reduce the number of students who have only superficial knowledge of core mathematics ideas
set high expectations for all students
set accountability targets while preserving teachers' autonomy
education policy makers, curriculum designers, teachers and those involved in the development of textbooks, assessments and teaching material
Help students acquire mathematics skills beyond content knowledge
strengthen the connections between school mathematics and the mathematics skills students will need for their future
Reduce inequalities in quantitative skills
make school mathematics more engaging for all students
curriculum designers, teachers and those involved in the development of textbooks, assessments and teaching material
Reduce the impact of tracking on equity in exposure to mathematics
Reduce the impact of socio-economic status on students’ opportunities to learn
ensure that students in vocational tracks are exposed to a coherent curriculum
education policy makers
Learn how to handle heterogeneity in the classroom
give socio-economically disadvantaged students the same opportunities to learn as advantaged students
Provide high-performing students with more challenging material
education policy makers and teachers
Support positive attitudes towards mathematics through innovations in curriculum and teaching
improve students’ self-concept
Reduce students’ anxiety
Foster motivation to learn mathematics, also after school hours
education policy makers, curriculum designers, teachers and parents
Monitor and analyse opportunities to learn
better understand the obstacles teachers face in covering the curriculum
better understand the obstacles students face in learning specific material
identify the impact of curriculum changes on students’ acquisition of knowledge and skills
education policy makers, in collaboration with the research community
content standards and frameworks should set the stage for the development of a core mathematics curriculum that provides all students, no matter their ability or socio-economic status, with the mathematics foundation for quantitative literacy and for study at a higher level. giving all students equal opportunities to learn depends on how the curriculum is implemented (which will

© OECD 2016 equations and inequalities: making mathematics accessible to all204
5A Policy strAtegy to widen oPPortunities to leArn mAthemAtics
be discussed later); but applying the same standards to all students can be a first step to break the pattern of differentiation that is based on the false assumption that only some students will need a strong background in mathematics for their future. For example, policy efforts to standardise secondary school curricula in scotland in the 1980s improved average test scores and reduced socio-economic inequalities in education (gamoran, 1996). standards do not set upper bounds in content coverage and expected performance, so schools and teachers can adapt them to challenge high-performing students.
the standards should cover the full cycle of education to allow for the widest possible range of students to participate in a rigorous course of study from the outset. no standard can fully reflect the variety of abilities and needs among students in any given classroom. however, standards can provide clear signposts along the way to higher education and career readiness for all students, and can help identify early on those students who need special support.
What content should be specified in the standards and frameworks? international comparisons find that the same set of core mathematics ideas is covered in the curricula of most Pisa countries and economies (table 1.3). this suggests that some consensus about what mathematics content is important may already have been reached (mullis et al., 2012). What varies greatly across countries is how this core content is organised in the frameworks.
the curriculum can provide more productive exposure to mathematics content across all students if it is coherent, focused and not repetitive. coherence can be achieved by grouping the concepts into units that, in their logical sequence, reflect the hierarchical nature of mathematics and make it easier for students to build on the skills they acquired (schmidt et al., 2002).
When students understand the connections between the topics, they stop seeing mathematics as a laundry-list of formulas to memorise, and start to make sense of what they learn. a sequential or spiral curriculum framework is particularly useful for students who may not have been exposed to certain content. before starting a new unit, teachers can easily identify what prior knowledge is needed, whether their students have had the opportunity to acquire this knowledge, and whether it is useful to review or incorporate previously studied topics in the new unit.
coherence across topics and a strong focus on key mathematics ideas matter more than the quantity of topics covered. tightening the focus of the curriculum by addressing fewer topics each year can allow for much greater depth of learning. For example, in singapore the mathematics framework covers a relatively small number of topics in depth, following a spiral organisation in which topics introduced in one grade are covered in later grades, but at a more advanced level. students are expected to have mastered prior content, not repeat it (ginsburg et al., 2005). korea cut as much as 20% of the learning content in the 2011 revision of the curriculum in order to let teachers cover mathematics topics in greater depth (li and lappan, 2013).
curriculum frameworks that allocate sufficient time to a set of key topics can also leave more scope for teachers to choose how to cover the material and to adapt their teaching to their specific classroom context. standards are meant to support teachers in their choices, and not to unnecessarily limit their autonomy. teachers still have to use their professional judgement,

equations and inequalities: making mathematics accessible to all © OECD 2016 205
5A Policy strAtegy to widen oPPortunities to leArn mAthemAtics
creativity and autonomy individually and together with other teachers to find the best ways to help their students to learn. For example, teachers in singapore are not bound by the sequence of topics as long as they can ensure that the inherent hierarchy and linkages of mathematics are maintained (ginsburg et al., 2005).
the effectiveness of standards to promote innovative patterns of instruction is clearly related to the development of tools and training, including teachers’ guides, textbooks and pre-service education that prepare teachers to teach the curriculum and provide opportunities for professional development. textbooks, in particular, can disrupt the coherence of the standards if they introduce concepts too early or too late, if they superficially cover the same concepts year after year, or fail to show students explicitly how the new material connects to previous concepts. more efforts at the national and international levels should thus be devoted to defining and regularly updating the core criteria that mathematics textbooks should meet to be eligible for use in the classroom.
helP students Acquire mAthemAtics skills beyond content knowledge
the mastery of core concepts and procedures is a necessary component of mathematics learning and is needed to understand and solve novel problems. however, knowledge of concepts or formulas and procedural fluency alone are hardly sufficient for solving complex problems (chapter 3); several other skills are central to mathematics proficiency. these include the ability to use a wide range of mathematics strategies; the ability to reason using mathematical ideas and to communicate one’s reasoning effectively; the ability to use the knowledge and time at one’s disposal efficiently; and the disposition to see mathematics as sensible, useful and worthwhile, coupled with a belief in one’s own efficacy (schoenfeld, 2006; national Research council, 2001).
content, representations, tasks and teaching materials should be chosen and organised within and across grades to support the integrated and balanced development of all these abilities. mathematics frameworks should thus be explicit about how concepts and skills are interwoven within individual units, over a year, and during the course of education.
outside of their coursework, many students have difficulty doing what may be considered elementary mathematics for their level of attainment. For example, only 22% of the students tested in Pisa 2012 were able to interpret a simple equation and explain the effect of a change to one variable on a second variable (the dRiP Rate problem, see chapter 3). this probably happens because too many students spend too much time routinely and mechanically solving well-defined tasks that are very close to the ones they have been taught. these tasks do not involve exploration, conjecturing and thinking…in other words, they do not provide opportunities for deep learning. similarly, simple applied tasks that are commonly used at school, such as “calculate how many square metres of tiles you need to cover a floor” (see chapter 1), are routine mathematics tasks “dressed up” in the words of everyday life, and do not require any deep thinking and modelling skill (echazarra et al., 2016). chapter 3 shows that students’ exposure to this type of applied task has only a modest relationship with students’ capacity to solve Pisa problems (Figure 3.8b).

© OECD 2016 equations and inequalities: making mathematics accessible to all206
5A Policy strAtegy to widen oPPortunities to leArn mAthemAtics
Problem solving, as a method of teaching mathematics, can be used to introduce core mathematics concepts through lessons involving exploration and discovery (stein et al., 2008). For example, the Pisa 2012 ReVolVing dooR item (see chapter 3) describes a revolving door through diagrams. students are asked to calculate the maximum arc length that each door can have so that air never flows between entrance and exit. solving in class a problem like ReVolVing dooR can help students consolidate their understanding of circle geometry and, at the same time, show them how they can test multiple heuristic strategies, such as dividing the circled space of the revolving door into six equal parts or reworking the diagram to consider extreme cases. Whatever strategy students choose to use, in order to succeed they need to monitor how well they are progressing, and persevere or change direction accordingly. knowledge, effective reasoning, strategy formulation, self-regulation and perseverance can all be developed while working on problems of this type.
a greater emphasis on problem solving does not make traditional topics obsolete or irrelevant. the core mathematics topics in school curricula (fractions, functions, vectors…) are basic to all mathematics activities, including modelling and application. Whether one can solve mathematics problems depends in fundamental ways on the mathematics one knows. For example, students who do not know the formula for the circumference (π times diameter) would have a very difficult time solving complex, contextualised problems like ReVolVing dooR or aRches (chapter 3).
but introducing problem-solving strategies – such as teaching students how to question, make connections and predictions, conceptualise, and model complex problems – requires time and probably some adjustment to content coverage. chapter 2 shows that cognitive-activation teaching strategies, such as giving problems with no immediate solution, might be associated with less content coverage in disadvantaged learning environments (Figure 2.23b).
When teachers develop a routine that allows students to discover and work with mathematics, teachers also need to consider how students with different skills approach complex problems. chapter 3 shows that disadvantaged students perform more poorly than other students in those tasks requiring modelling skills (Figure 3.17). Problem solving, modelling and application make mathematics lessons more demanding, both for teachers and for students. Weaker students – and particularly those from a disadvantaged background – are less confident and tend to prefer more external direction (lubienski and stilwell, 1998). these students might need additional support in, for example, identifying the intended mathematical ideas embedded in contextualised problems, or describing those ideas to the rest of the class. that said, mathematics teachers should not be discouraged from integrating problem solving in their instruction when teaching weaker classes. students with less familiarity with mathematics can still participate if the teacher builds a supportive relationship with students, conducts individualised tutoring sessions, builds on what students know, preserves equity among students in the classroom and makes explicit the desired classroom norms (lester, 2007; boaler, 2002; lubienski, 2002). Formal and informal teacher networks can be useful platforms for sharing experiences and ideas.
Restructured textbooks, teaching materials and dedicated training can help minimise the time needed to incorporate these teaching practices into an already full schedule. For example, the new Zealand government’s website on mathematics education (http://nzmaths.co.nz/)
equations and inequalities: making mathematics accessible to all © OECD 2016 207
5A Policy strAtegy to widen oPPortunities to leArn mAthemAtics
provides teaching materials on problem solving, such as sample problems that fit into a given curriculum unit. the mathematics assessment Project, a collaboration between the university of california at berkeley and nottingham university, developed a series of “formative-assessment lessons” whose purpose is to help teachers improve students’ ability to apply their knowledge to non-routine problems. the lessons describe common patterns of student responses to the tasks and ways to deal with them; they also contain activities that help teachers assess students’ understanding and build on it.1
mathematics teachers would also find it easier to integrate problem solving in instruction if the assessment system reflected the value of this approach. in reality, few curricula make the ability to model and apply mathematics knowledge the object of systematic assessment and testing (Rosli et al., 2013). more efforts need to be invested in constructing, using and sharing new ways to assess mathematics problem-solving abilities.
reduce the imPAct of trAcking on equity in exPosure to mAthemAtics
access to mathematics is unequally distributed across individuals, schools and school systems, and familiarity with mathematics is strongly related to students’ socio-economic status (chapter 2). moreover, the organisation of most education systems tends to reinforce socio-economic inequalities in access to mathematics (chapter 2). selecting student into more homogenous groups through grade repetition, between-school tracking, academic admission requirements and school transfers is associated not only with a more unequal distribution of achievement, but also with more unequal access to mathematics content, which is the basis for improving mathematics literacy.
students who are enrolled in vocational tracks are much more likely to come from disadvantaged families and to have low levels of familiarity with mathematics (Figure 2.16). the concentration of disadvantaged students in less challenging tracks strengthens the link between socio-economic status and opportunities to learn, not only because students in vocational programmes are unlikely to receive the same exposure to mathematics as students in academic tracks, but also because students’ outcomes and attitudes towards mathematics are affected by their peers (chapter 4; Field, kuczera and Pont, 2007).
moreover, the starting age of between-school tracking at the system level is strongly related to equity in opportunities to learn mathematics (Figure 2.15). in systems that start sorting students into different tracks as early as 10 or 11, the relationship between students’ socio-economic status and their access to mathematics at age 15 is much stronger than in systems where students are first tracked at age 15 or 16.
Postponing the age at which students are first sorted into tracks can be difficult, given the costs involved in such a substantial reform, possible effects on drop-out rates, and the reluctance among teachers who may have to adjust their teaching methods to cater to a more heterogeneous group of students. but several countries have been successful in delaying the age at first tracking, and there is some evidence that this policy has reduced the gap in education and labour market outcomes related to socio-economic status (meghir and Palme, 2005; hanushek

© OECD 2016 equations and inequalities: making mathematics accessible to all208
5A Policy strAtegy to widen oPPortunities to leArn mAthemAtics
and Woessmann, 2006). in sweden and Finland, which reformed their education systems between the 1950s and the 1970s, a later age at tracking reduced inequalities in the labour market later on (meghir and Palme, 2005; Pekkarinen, uusitalo and kerr, 2009; Pekkala kerr, Pekkarinen and uusitalo, 2013). more recently, germany reformed its education structure to reduce the influence of socio-economic status on student achievement. some regions delayed the assignment of students to different tracks until they were 12 rather than 10 years old; some regions chose to combine tracks (going from a three- to a two-track lower secondary system); and some regions increased their system’s flexibility by allowing students in any of the three types of lower secondary school to go to any type of upper secondary school (oecd, 2011a). in 1999, Poland reformed the structure of its education system, deferring tracking in secondary education, embracing deep curriculum reform, and giving more autonomy to schools. Research has shown that the deferral of tracking contributed to the substantial improvement in international assessments (oecd, 2011b).
it may not be necessary to eliminate early tracking as long as the education system provides students with equal opportunities to learn. in the czech Republic and singapore, for example, where students are first tracked at age 11 or 12, students’ and schools’ socio-economic profile explains less than 10% of the variation in familiarity with mathematics, similar to the oecd average (Figure 2.15). in other words, students in vocational tracks should be exposed to the same core curriculum and to the same quality of mathematics teaching as other students, and the tracking system should be flexible enough to allow students to change tracks when and if they are ready to do so. moving towards equivalence in mathematics instruction between pathways would ensure that students can choose their preferred course of study and be confident they will acquire the core skills they need for their adult life.
leArn how to hAndle heterogeneity in the clAssroom
given the difficulty of delaying early tracking, some countries have replaced between-school tracking with ability grouping within schools or within classrooms. selection for within-school grouping may be better informed, since students’ abilities are more easily observed in individual schools; but within-school or within-class ability grouping reduces opportunities to learn for disadvantaged students just as tracking does. in fact, the relationship between socio-economic status and mathematics achievement is not necessarily weaker in systems that use ability grouping compared with systems that use between-school tracking (chmielewski, 2014). the negative impact of early tracking, streaming and grouping by ability on equity of education outcomes can be mitigated by limiting the number of subjects or the duration of ability grouping and by increasing opportunities to change tracks or classrooms (oecd, 2012).
the real alternative to streaming and ability grouping is heterogeneous classes. teaching these classes can be challenging, and education authorities may have to provide additional assistance, such as more personalised tutoring and/or more innovative teaching practices, to the students who would otherwise be placed in “low” tracks. schools with mixed-ability classes must also avoid lowering academic standards and must provide their high-achievers with challenging material (gamoran, 1996; gamoran, 2002).

equations and inequalities: making mathematics accessible to all © OECD 2016 209
5A Policy strAtegy to widen oPPortunities to leArn mAthemAtics
Teach heterogeneous classes effectivelyit is easier and more efficient for teachers to deal with a smaller range of abilities than to provide instruction that is sufficiently broad to address the needs of all students or to “teach to the middle” (darrow, 2003; evertson, sanford and emmer, 1981). according to Pisa results, many teachers believe that heterogeneous classes hinder learning, especially in socio-economically disadvantaged schools (Figure 2.17). clearly, teachers need to adapt their teaching strategies depending not only on the average ability of the class but also on the degree of ability heterogeneity. For instance, chapter 2 shows that some teaching practices, such as cognitive-activation strategies, are related in different ways to familiarity with mathematics and performance in mathematics across schools with different socio-economic profiles (Figure 2.23a and 2.23b).
nevertheless, there are ways to help teachers work with heterogeneous classes other than by sorting students. as was mentioned above, curricula can be organised in a spiral, so that they cover key ideas several times, in order to provide students with multiple opportunities to learn important concepts at varying levels of complexity. in addition, classes can be made smaller as a way to make it less difficult to teach heterogeneous groups (Finland did this in the 1980s when it discontinued ability grouping [kupari, 2008]).
moreover, specific teaching practices, such as using curricula and pedagogies with multiple points of entry that are challenging, relevant and engaging, can be adopted in the context of whole-class instruction. Various student-oriented practices also appear to be successful in heterogeneous class environments, such as having students work in small (heterogeneous) groups, co-operative learning, keeping students actively involved and giving students control over their learning (Freedman, delp and crawford, 2005; Rubin, 2006). in particular, flexible grouping can be frequently reconfigured based on content, project and ongoing evaluation, as a way to nurture the idea that ability is not fixed, and to reduce the segregation that often comes with more rigid forms of grouping (tomlinson, 2001). co-operative learning strategies are also used in heterogeneous classes (Rothenberg, mcdermott and martin, 1998). success for all, for example, is a programme for primary schools in the united states and the united kingdom that combines co-operative learning with small ability groups that are frequently reorganised to reflect student progress (loveless, 2016).
given the crucial role of teachers in implementing curricula in challenging contexts, teachers who shift from teaching classes grouped by ability to teaching heterogeneous classes, as well as teachers addressing students in multicultural and diverse environments, should receive support and training on how to teach such classes (oecd, 2010; Rubin and noguera, 2004).
Offer greater and individualised support to struggling students struggling students should receive instruction adapted to their ability and needs. For many low-performing students, this may include simply more time to learn. engaged learning time is a key aspect of opportunity to learn, in addition to the curriculum content to which students are exposed. longer instruction time is related to better performance – except when that learning time is wasted in a disruptive disciplinary climate (chapter 3). the so-called “no excuses” charter

© OECD 2016 equations and inequalities: making mathematics accessible to all210
5A Policy strAtegy to widen oPPortunities to leArn mAthemAtics
schools in the united states provide an example of how combining dramatically increased instructional time, strict behaviour norms and a strong student work ethic has improved student achievement in low-income, minority and disadvantaged schools (angrist et al., 2010; thernstrom and thernstrom, 2004).
in addition to more instruction, many disadvantaged students also need more tailored approaches and individualised support. in the context of the us debate on “de-tracking” (intended as the shift from ability grouping to mixed-ability, heterogeneous classes), targeted academic support is considered a key practice to be embedded in the regular organisation of the school year or day. support classes can help struggling students catch up on skills and concepts they may have missed in the classroom, and can support them in completing their daily work, without preventing them from being exposed to a more academically demanding curriculum (Rubin, 2006). high-dose, targeted tutoring is one of several practices that have been shown to improve achievement in low-performing us charter schools (dobbie and Fryer, 2013; Fryer, 2011). of course, the effectiveness of this remedial support depends on the quality of its implementation, and particularly on teachers’ preparedness.
Finland, for example, provides dedicated support to students in need. half of children with special education needs are mainstreamed, rather than being enrolled in special schools. these students are helped by “special teachers” assigned to each school, based on the idea that if schools focus on early diagnosis and intervention, most students can be helped to achieve success in regular classrooms. these specially trained teachers work closely with the class teachers to identify students in need of extra help and to work individually or in small groups with these students so that they get the support they need to keep up with their classmates (oecd, 2011a).
low-performing students in singapore are given extra help from well-trained teachers and follow an alternative mathematics framework that covers all the mathematics topics in the regular framework, but at a slower pace and with more repetition (ginsburg et al., 2005).
suPPort Positive Attitudes towArds mAthemAtics through innovAtions in curriculA And teAching
the types of mathematics that students are exposed to are related not only to their achievement but also to their attitudes and self-beliefs about mathematics (chapter 4). exposure to relatively complex mathematics topics may improve the attitudes and self-beliefs of students who are relatively well-prepared and ready to be challenged, but it may undermine the self-beliefs of students who do not feel up to the tasks. in belgium, denmark, macao-china, the netherlands and switzerland, students of similar ability who are more exposed to pure mathematic tasks tend to display lower mathematics self-concept than students who are less exposed (table 4.6). on average across oecd countries, greater exposure to complex concepts, as measured by familiarity with mathematics, is associated with less mathematics anxiety among high-performing students but with greater anxiety among low-performing students (Figure 4.8).
given the link between attitudes towards mathematics and performance (oecd, 2013), in designing or revising their mathematics curricula, countries should find ways of improving performance and problem-solving skills without undermining the self-confidence or raising

equations and inequalities: making mathematics accessible to all © OECD 2016 211
5A Policy strAtegy to widen oPPortunities to leArn mAthemAtics
the anxiety of low-performing students. box 4.2 offers some examples from australia, hong kong-china, korea and singapore of how the development of positive attitudes towards mathematics became an aim of the mathematics curriculum, and of how some of these countries and economies have reduced curriculum content to give more time to engaging activities that would improve students’ motivation.
teaching practices can play a big role in influencing students’ attitudes towards learning. chapter 4 discusses how various teaching practices – including feedback and communication, cognitive-activation strategies and student-oriented practices – are associated with students’ attitudes and self-beliefs towards mathematics, even though the extent of the relationship varies according to students’ familiarity with mathematics. Reinforcing basic numerical and spatial skills, reducing time pressure during tests, and bolstering teachers’ ability and confidence to teach mathematics can also be ways of reducing students’ mathematics anxiety (maloney and beilock, 2012; beilock and Willingham, 2014).
however, it is also important to take into account that teaching practices and curriculum coverage may interact in affecting students’ self-beliefs, especially among students who have had fewer opportunities to learn. teaching practices aimed to reinforce students’ self-beliefs and improve their attitudes towards learning may need to be adapted to students’ readiness to learn the mathematics specified in the curriculum.
teachers can also help to improve students’ attitudes towards mathematics by engaging parents. chapter 4 has also shown that parents are likely to transmit their mathematics anxiety to their children, especially through their involvement in homework. teachers can make parents aware of their influence and of the importance of communicating positive messages about mathematics, and can suggest alternative ways of supporting their children in learning mathematics (such as external tutors or after-school classes).
monitor And AnAlyse oPPortunities to leArn
the content of instruction, as defined in the curriculum, plays a fundamental role in students’ mathematics achievement (chapter 3; gamoran, 2007; schmidt et al., 2015). however, some would argue that what matters more is how a curriculum is implemented rather than the curriculum itself (chapter 1). in that case, data collection and analysis must try to determine how well teachers cover the curriculum and whether the implemented curriculum adheres to the objectives set in the standards.
measuring opportunities to learn involves more than a simple time metric. data need to be collected all along the progression from what educators and policy makers specify in the standards, through the content to which students are exposed, to the ideas and practices that students understand (Floden, 2002). an analysis of data at each step of the progression can help clarify how much time teachers spend teaching each topic in the curriculum, how many items in a national assessment are devoted to the topic, and the degree to which students engage in the corresponding instructional activities.

© OECD 2016 equations and inequalities: making mathematics accessible to all212
5A Policy strAtegy to widen oPPortunities to leArn mAthemAtics
monitoring opportunities to learn thus requires combining multiple data-collection instruments and analyses. a core set of information should be collected directly from teachers, using either surveys questions that ask teachers about the content covered in their classes (such as those used in the trends in international mathematics and science study [timss]), or teacher logs completed over the course of the school year. after comparing multiple indicators, gamoran et al. (1997) concluded that the measure of otl that more strongly correlates with students’ achievement is an index that combines teacher-reported information about the proportion of class time spent on topics with information on the extent to which the instruction engaged students’ problem-solving abilities. collecting and processing log data and questionnaires can be made less cumbersome and costly by adapting digital approaches from other types of data collections, such as time-use studies.
students’ self-reported knowledge and exposure to mathematics tasks, as collected in Pisa (see chapter 1), provides another piece of information about what students actually get out of mathematics instruction. collating the information on the intended curriculum (from official documents), on the implemented curriculum (from teachers’ reports and textbooks), and on what students know and can do in class (from students’ self-reports) can give a detailed picture of any missing steps in the progression from curriculum intentions to student outcomes.
all these data are of little value if they are not properly used to guide changes in the curriculum. in some countries and economies, including France, hong kong-china, the netherlands, singapore, the united kingdom and the united states, national centres conduct multi-year research and curriculum-development programmes in school mathematics. these institutes and universities should engage in rigorous statistical comparisons of student performance under “traditional” and “experimental” curricula (where performance is evaluated on the basis of carefully designed assessments of different mathematics skills). these evaluations help identify what innovative elements in the curriculum should be strengthened. ideally, results disaggregated by characteristics of the school (such as its socio-economic profile) could provide evidence of the effects of the curriculum and the kinds of support structures that are helpful in different implementation contexts (schoenfeld, 2006).
students’ learning depends not only on the content covered by the teacher but also on other dimensions of the learning environment, such as an orderly classroom climate and the pedagogical choices teachers make. For example, chapter 3 shows that long instruction time is related to high performance only in classrooms with a good disciplinary climate (Figure 3.6). Video studies can provide data directly from the classroom about how teachers structure and manage their classes, what types of support and student orientation they adopt, and whether they use teaching methods and tasks that challenge students’ cognitive abilities, self-beliefs and attitudes (tomáš and seidel, 2013). Video studies can also showcase how students acquire mathematics knowledge, skills and understanding, and thus inform the design and update of mathematics standards. the teaching and leaning international survey (talis) study is piloting an international video study of teaching practices. the objective of the study is to provide insights into effective teaching practices using classroom observations from countries with different teaching cultures. the pilot will also eventually produce a global video library showcasing a variety of teaching practices in a range of educational settings in participating countries.2

equations and inequalities: making mathematics accessible to all © OECD 2016 213
5A Policy strAtegy to widen oPPortunities to leArn mAthemAtics
Notes
1. the formative assessment tasks and more information on the mathematics assessment Project are available at: map.mathshell.org.
2. more information on the talis international video study is available at: https://www.oecd.org/edu/school/talis-2018-video-study-brochure-eng.pdf.
References
Angrist, J.D., et al. (2010), “inputs and impacts in charter schools: kiPP lynn”, American Economic Review, Vol. 100/2, pp. 239-43, http://dx.doi.org/10.1257/aer.100.2.239.
Beilock, S.L. and D.T. Willingham (2014), “math anxiety: can teachers help students reduce it?”, American Educator, Vol. 38/2, pp. 28-32.
Boaler, J. (2002), “learning from teaching: exploring the Relationship between Reform curriculum and equity”, Journal for Research in Mathematics Education, Vol. 33/4, pp. 239-258, http://dx.doi.org/10.2307/749740.
Chmielewski, A.K. (2014), “an international comparison of achievement inequality in within- and between-school tracking systems”, American Journal of Education, Vol. 120/3, pp. 293-324, http://dx.doi.org/doi:10.1086/675529.
Darrow, A.A. (2003), “dealing with diversity: the inclusion of students with disabilities in music”, Research Studies in Music Education, Vol. 21/1, pp. 45-57, http://dx.doi.org/10.1177/1321103X030210010401.
Dobbie, W. and R. Fryer (2013), “getting beneath the veil of effective schools: evidence from new York city”, American Economic Journal: Applied Economics, Vol. 5/4, pp. 28-60.
Echazarra, A., et al. (2016), “how teachers teach and students learn: successful strategies for school”, OECD Education Working Papers, no. 130, oecd Publishing, Paris, http://dx.doi.org/10.1787/5jm29kpt0xxx-en
Evertson, C.M., J.P. Sanford and E.T. Emmer (1981), “effects of class heterogeneity in junior high school”, American Educational Research Journal, Vol. 18/2, pp. 219-232, http://dx.doi.org/ 10.3102/00028312018002219.
Field, S., M. Kuczera and B. Pont (2007), No More Failures: Ten Steps to Equity in Education, education and training Policy, oecd Publishing, Paris, http://dx.doi.org/10.1787/9789264032606-en.
Floden, R.E. (2002), “the measurement of opportunity to learn”, in a.c. Porter and a. gamoran (eds.), Methodological Advances in Cross-National Surveys of Educational Achievement, the national academies Press, Washington, dc, http://www.nap.edu/read/10322/chapter/9.
Freedman, S.W., V. Delp and S.M. Crawford (2005), “teaching english in untracked classrooms”, Research in the Teaching of English, Vol. 40/1, pp. 62-126.
Fryer, R.G. (2011), “injecting successful charter school strategies into traditional public schools: a field experiment in houston”, NBER Working Paper, no. 17494. national bureau of economic Research, cambridge, ma.
Gamoran, A. (ed.) (2007), Standards-Based Reform and the Poverty Gap, brookings institution, Washington, dc.
Gamoran, A. (2002), “standards, inequality & ability grouping in schools”, ces briefings, no. 25, centre for educational sociology, university of edinburg, http://www.ces.ed.ac.uk/PdF%20Files/brief025.pdf.
Gamoran, A. (1996), “curriculum standardization and equality of opportunity in scottish secondary education: 1984-90”, Sociology of Education, Vol. 69/1, pp. 1-21, http://dx.doi.org/doi:10.2307/2112720.

© OECD 2016 equations and inequalities: making mathematics accessible to all214
5A Policy strAtegy to widen oPPortunities to leArn mAthemAtics
Gamoran, A., A.C. Porter, J. Smithson and P.A. White (1997), “upgrading high school mathematics instruction: improving learning opportunities for low-achieving, low-income youth”, Educational Evaluation and Policy Analysis, Vol. 19/4, pp. 325-38, http://dx.doi.org/doi:10.3102/01623737019004325.
Ginsburg, A., S. Leinwand, T. Anstrom and E. Pollock (2005), What the United States Can Learn From Singapore’s World-class Mathematics System (and What Singapore Can Learn from the United States): An Exploratory Study, american institutes for Research, Washington, dc, http://www.air.org/resource/what-united-states-can-learn-singapore%e2%80%99s-world-class-mathematics-system-exploratory-study.
Hanushek, E.A. and L. Woessmann (2006), “does educational tracking affect performance and inequality? differences-in-differences evidence across countries”, The Economic Journal, Vol. 116/510, pp. 63-76, http://dx.doi.org/doi:10.1111/j.1468-0297.2006.01076.x.
Kupari, P. (2008), “mathematics education in Finnish comprehensive school: characteristics contributing to student success”, Proceedings of the 11th international congress on mathematical education, monterrey, mexico, http://www.mathunion.org/fileadmin/icmi/files/about_icmi/Publications_about_icmi/icme_11/kupari.pdf.
Lester, F.K. (ed.) (2007), Second Handbook of Research on Mathematics Teaching and Learning: A Project of the National Council of Teachers of Mathematics, information age Publishing, charlotte, nc.
Li, Y. and G. Lappan (2013), Mathematics Curriculum in School Education, springer, berlin.
Loveless, T. (2016), “the resurgence of ability grouping and persistence of tracking”, http://www.brookings.edu/research/reports/2013/03/18-tracking-ability-grouping-loveless (accessed 01 June 2016).
Lubienski, S.T. (2002), “Research, reform, and equity in u.s. mathematics education”, Mathematical Thinking and Learning, Vol. 4/2-3, pp. 103-25, http://dx.doi.org/doi:10.1207/s15327833mtl04023_2.
Lubienski, S.T. and J. Stilwell (1998), “teaching low-ses students mathematics through problem solving: tough issues, promising strategies and lingering dilemmas”, in h. schoen and R.i. charles (eds.), Teaching Mathematics through Problem Solving: Grades 6-12, national council of teachers of mathematics, Reston, Va, pp. 207-218.
Maloney, E.A. and S.L. Beilock (2012), “math anxiety: Who has it, why it develops, and how to guard against it”, Trends in Cognitive Sciences, Vol. 16/8, pp. 404-406, http://dx.doi.org/doi:10.1016/j.tics.2012.06.008.
Meghir, C. and M. Palme (2005), “educational reform, ability, and family background”, American Economic Review, Vol. 95/1, pp. 414-24, http://dx.doi.org/doi:10.1257/0002828053828671.
Mullis, I.V.S. et al. (eds.) (2012), TIMSS 2011 Encyclopedia: Education Policy and Curriculum in Mathematics and Science, Volumes 1 and 2, timss & PiRls international study center, boston college, chestnut hill, ma, http://timssandpirls.bc.edu/timss2011/encyclopedia-timss.html.
National Research Council (2001), Adding It Up: Helping Children Learn Mathematics, national academies Press, Washington, dc, http://www.nap.edu/catalog/9822.
OECD (2016), Low-Performing Students: Why They Fall Behind and How To Help Them Succeed, Pisa, oecd Publishing, Paris, http://dx.doi.org/10.1787/9789264250246-en.
OECD (2014), PISA 2012 Results: What Students Know and Can Do (Volume I, Revised edition, February 2014): Student Performance in Mathematics, Reading and Science, Pisa, oecd Publishing, http://dx.doi.org/10.1787/9789264208780-en.
OECD (2013), PISA 2012 Results: Ready to Learn (Volume III): Students’ Engagement, Drive and Self-Beliefs, Pisa, oecd Publishing, Paris, http://dx.doi.org/10.1787/9789264201170-en.
OECD (2012), Equity and Quality in Education: Supporting Disadvantaged Students and Schools, oecd Publishing, Paris, http://dx.doi.org/10.1787/9789264130852-en.

equations and inequalities: making mathematics accessible to all © OECD 2016 215
5A Policy strAtegy to widen oPPortunities to leArn mAthemAtics
OECD (2011a), Lessons from PISA for the United States, strong Performers and successful Reformers in education, oecd Publishing, Paris, http://dx.doi.org/10.1787/9789264096660-en.
OECD (2011b), “the impact of the 1999 education reform in Poland”, OECD Education Working Papers, no. 49, oecd Publishing, Paris, http://dx.doi.org/10.1787/5kmbjgkm1m9x-en.
OECD (2010), Educating Teachers for Diversity: Meeting the Challenge, centre for educational Research and innovation, oecd Publishing, Paris, http://dx.doi.org/10.1787/9789264079731-en.
Pekkala Kerr, S., T. Pekkarinen and R. Uusitalo (2013), “school tracking and development of cognitive skills”, Journal of Labor Economics, Vol. 31/3, pp. 577-602, http://dx.doi.org/doi:10.1086/669493.
Pekkarinen, T., R. Uusitalo and S. Kerr (2009), “school tracking and intergenerational income mobility: evidence from the Finnish comprehensive school reform”, Journal of Public Economics, Vol. 93/7-8, pp. 965-73, http://dx.doi.org/doi:10.1016/j.jpubeco.2009.04.006.
Rosli, R., D. Goldsby and M.M. Capraro (2013), “assessing students’ mathematical problem-solving and problem-posing skills”, Asian Social Science, Vol. 9/16, pp. 54-60.
Rothenberg, J.J., P. Mcdermott and G. Martin (1998), “changes in pedagogy: a qualitative result of teaching heterogeneous classes”, Teaching and Teacher Education, Vol. 14/6, pp. 633-642, http://dx.doi.org/doi:10.1016/s0742-051X(98)00013-4.
Rubin, B.C. (2006), “tracking and detracking: debates, evidence, and best practices for a heterogeneous world”, Theory Into Practice, Vol. 45/1, pp. 4-14, http://dx.doi.org/doi:10.1207/s15430421tip4501_2.
Rubin, B.C. and P.A. Noguera (2004), “tracking detracking: sorting through the dilemmas and possibilities of detracking in practice”, Equity & Excellence in Education, Vol. 37/1, pp. 92-101, http://dx.doi.org/doi:10.1080/10665680490422142.
Schmidt, W.H. and N.A. Burroughs (2013), “springing to life: how greater educational equality could grow from the common core mathematics standards”, American Educator, Vol. 37/1, pp. 2-9.
Schmidt, W.H., N.A. Burroughs, P. Zoido and R.T. Houang (2015), “the role of schooling in perpetuating educational inequality an international perspective”, Educational Researcher, Vol. 44/7, pp. 371-386, http://dx.doi.org/doi:10.3102/0013189X15603982.
Schmidt, W.H., R. Houang and L. Cogan (2002), “a coherent curriculum: the case of mathematics”, American Educator, Vol. 26/2, pp. 10.
Schoenfeld, A.H. (2006), “What doesn’t work: the challenge and failure of the What Works clearinghouse to conduct meaningful reviews of studies of mathematics curricula”, Educational Researcher, Vol. 35/2, pp. 13-21.
Stein, M.K., R.A. Engle, M.S. Smith and E.K. Hughes (2008), “orchestrating productive mathematical discussions: Five practices for helping teachers move beyond show and tell”, Mathematical Thinking and Learning, Vol. 10/4, pp. 313-340, http://dx.doi.org/doi:10.1080/10986060802229675.
Thernstrom, A. and S. Thernstrom (2004), No Excuses: Closing the Racial Gap in Learning, simon and schuster, new York, nY.
Tomáš, J. and T. Seidel (2013), The Power of Video Studies in Investigating Teaching and Learning in the Classroom, Waxmann, munster, germany.
Tomlinson, C.A. (2001), How to Differentiate Instruction in Mixed-Ability Classrooms, association for supervision and curriculum development, alexandria, Va.

equations and inequalities: making mathematics accessible to all © OECD 2016 217
Annex AList of tabLes avaiLabLe on Line

© OECD 2016 equations and inequalities: making mathematics accessible to all218
Annex A: List of tAbLes AvAiLAbLe on Line
Chapter 1 Why access to mathematics matters and how it can be measuredhttp://dx.doi.org/10.1787/888933377718
Web table 1.1a numeracy skills used at work, all workers
Web table 1.1b numeracy skills used at work, by wage
Web table 1.2 Relationship between years of education and numeracy, and economic and social outcomes
Web table 1.3 coverage of selected mathematics topics in the intended and implemented curriculum
Web table 1.4 Responsibility for choosing textbooks, course content and courses availability
Web table 1.5 use of standardised practices for curriculum and teaching
Web table 1.6 change between 2003 and 2012 in the time spent in mathematics classes
Web table 1.7 students’ self-reported familiarity with mathematics concepts
Web table 1.8 students’ self-reported familiarity with algebraic and geometric concepts
Web table 1.9a indices of exposure to applied and pure mathematics
Web table 1.9b students’ self-reported exposure to applied and pure mathematics tasks at school
Web table 1.10 indices of exposure to applied and pure mathematics, and familiarity with mathematics concepts, by grade
Web table 1.11a exposure to algebraic word problems during mathematics lessons and assessments
Web table 1.11b exposure to contextualised mathematics problems during mathematics lessons and assesments
Web table 1.11c exposure to procedural mathematics tasks during mathematics lessons and assesments
Web table 1.11d exposure to pure mathematics problems during mathematics lessons and assessments
Web table 1.12 correlation among exposure to different types of mathematics problems during mathematics lessons
Chapter 2 Variations in exposure to and familiarity with mathematicshttp://dx.doi.org/10.1787/888933377728
Web table 2.1 Variation in familiarity with mathematics
Web table 2.2 Variation in familiarity with mathematics, explained by students’ and schools’ socio-economic profile
Web table 2.3 mathematics learning time at school, by students’ socio-economic status
Web table 2.4a exposure to applied and pure mathematics, by socio-economic status
Web table 2.4b Familiarity with mathematics, by socio-economic status
Web table 2.5a Familiarity with mathematics concepts, by parents’ highest level of education
Web table 2.5b Familiarity with mathematics concepts, by gender
Web table 2.6 Percentage of immigrants in schools, by school-level familiarity with mathematics
Web table 2.7 Familiarity with mathematics, by immigrant background
Web table 2.8 effects of ethnic diversity on the learning environment, by schools’ socio-economic profile
Web table 2.9a Percentage of students who attended at least one year of pre-primary education, by students’ socio-economic status
Web table 2.9b Familiarity with mathematics and attendance at pre-primary education
Web table 2.10 Familiarity with mathematics concepts and students’ characteristics
Web table 2.11 Parents’ preferences for schools, by socio-economic status
Web table 2.12 academic selectivity and equity in familiarity with mathematics
Web table 2.13 Residency requirements and equity in familiarity with mathematics
Web table 2.14 Familiarity with mathematics and students’ socio-economic status, by level of education
Web table 2.15 grade repetition and equity in familiarity with mathematics
Web table 2.16 age at first tracking and equity in familiarity with mathematicsWeb table 2.17 enrolment in vocational school and likelihood of socio-economic disadvantage and/or being less familiar
with mathematicsWeb table 2.18 effects of ability differences on the learning environment, by schools’ socio-economic status
Web table 2.19a Prevalence of ability grouping, by schools’ socio-economic profile
Web table 2.19b ability grouping and students’ familiarity with mathematics
Web table 2.20a Percentage of students attending advanced mathematics classes, by students’ socio-economic status
Web table 2.20b attendance of advanced mathematics classes and students’ socio-economic status
Web table 2.21 teachers’ beliefs about the need to adapt academic standards to ability
Annex A
List of tAbLes AvAiLAbLe on Line
the following tables are available in electronic form only.
…

equations and inequalities: making mathematics accessible to all © OECD 2016 219
List of tAbLes AvAiLAbLe on Line: Annex A
Web table 2.22 teachers assigning different tasks to students based on ability, by schools’ socio-economic profile
Web table 2.23 school transfers and equity in familiarity with mathematics
Web table 2.24 student-teacher ratio and the percentage of qualified mathematics teachers
Web table 2.25a teachers’ use of cognitive-activation strategies, by schools’ socio-economic profile
Web table 2.25b teachers’ use of cognitive-activation strategies and students’ performance in mathematics, by schools’ socio-economic profile
Web table 2.25c teachers’ use of cognitive-activation strategies and students’ familiarity with mathematics, by schools’ socio-economic profile
Web table 2.26 disciplinary climate and familiarity with mathematics, by students’ socio-economic status
Chapter 3 exposure to mathematics and performance in Pisa http://dx.doi.org/10.1787/888933377738
Web table 3.1 comparing countries/economies on the different mathematics content subscales
Web table 3.2a mean score on mathematics subscales
Web table 3.2b difficulty of Pisa tasks, by content area
Web table 3.3a change between 2003 and 2012 in mathematics performance across content areas
Web table 3.3b change between 2003 and 2012 in the percentage of students answering correctly to mathematics items across content areas
Web table 3.4a average performance in mathematics, reading and science, by time spent per week in school lessons
Web table 3.4b average performance in mathematics, reading and science, by time spent per week in after-school lessons
Web table 3.5 mathematics performance and instruction time, after accounting for school characteristics
Web table 3.6 disciplinary climate, by time spent per week in school lessons
Web table 3.7 Relationship between exposure to mathematics content and performance in mathematics
Web table 3.8a Performance in mathematics, by exposure to algebraic word problems during mathematics lessons
Web table 3.8b Performance in mathematics, by exposure to contextualised mathematics problems during mathematics lessons
Web table 3.8c Performance in mathematics, by exposure to procedural tasks during mathematics lessons
Web table 3.8d Performance in mathematics, by exposure to pure mathematics problems during mathematics lessons
Web table 3.9 average performance in mathematics, by levels of exposure to applied and pure mathematics
Web table 3.10 exposure to mathematics and the likelihood of top and low performance
Web table 3.11 difference in mathematics performance across grades related to exposure to pure mathematics
Web table 3.12 Familiarity with mathematics and success on Pisa items, by items’ difficulty
Web table 3.13 Familiarity with mathematics and performance on a very difficult mathematics task
Web table 3.14 Familiarity with mathematics and performance on the most difficult mathematics task
Web table 3.15 Familiarity with mathematics and success on complex items
Web table 3.16 differences in performance related to exposure to mathematics, by socio-economic status
Web table 3.17 socio-economic status and mathematics performance, by item difficulty
Web table 3.18 Relationship between socio-economic status and success on Pisa mathematics tasks, by required mathematics competencies
Chapter 4 opportunity to learn and students’ attitudes towards mathematics http://dx.doi.org/10.1787/888933377744
Web table 4.1 change between 2003 and 2012 in the percentage of students enjoying or interested in mathematicsWeb table 4.2 mathematics self-concept, by gender and students’ socio-economic status
Web table 4.3 mathematics anxiety, by gender and students’ socio-economic status
Web table 4.4a mathematics intentions, by gender and students’ socio-economic status
Web table 4.4b students’ motivation to learn science, by gender and socio-economic status
Web table 4.4c students’ career expectations, by gender and socio-economic status
Web table 4.5a students’ mathematics self-concept
Web table 4.5b Relationship between exposure to pure mathematics and mathematics self-concept
Web table 4.6 Relationship between exposure to mathematics and mathematics self-concept
Web table 4.7a Relationship between frequent exposure to mathematics tasks in lessons and mathematics self-concept
Web table 4.7b Relationship between frequent exposure to mathematics tasks in lessons and mathematics anxiety
Web table 4.7c Relationship between frequent exposure to mathematics tasks in tests and mathematics self-concept
Web table 4.7d Relationship between frequent exposure to mathematics tasks in tests and mathematics anxiety
Web table 4.7e Percentage of students who are more frequently exposed to mathematics tasks in tests than in lessons
Web table 4.7f Relationship between more frequent exposure to mathematics tasks in tests than in lessons and mathematics anxiety
Web table 4.8a students’ mathematics anxiety
Web table 4.8b Relationship between exposure to pure mathematics and mathematics anxiety
Web table 4.9 Relationship between exposure to mathematics and mathematics anxiety
…

© OECD 2016 equations and inequalities: making mathematics accessible to all220
Annex A: List of tAbLes AvAiLAbLe on Line
Web table 4.10a Relationship between exposure to and familiarity with mathematics and mathematics self-concept, by level of performance
Web table 4.10b Relationship between exposure to and familiarity with mathematics and mathematics anxiety, by level of performance
Web table 4.11 motivation to learn mathematics and peers’ attitudes, by schools’ average level of familiarity with mathematics
Web table 4.12a students who reported that their peers work hard in mathematics, by schools’ average level of familiarity with mathematics
Web table 4.12b mathematics self-concept and relative familiarity with mathematics compared with schoolmates
Web table 4.13 after-school study time with parents, by students’ familiarity with mathematics
Web table 4.14a students’ mathematics anxiety, by students’ performance
Web table 4.14b Relationship between parents’ attitudes towards mathematics and students’ anxiety, by performance
Web table 4.15 Relationship between teachers’ communication and students’ mathematics anxiety, by students’ familiarity with mathematics
Web table 4.16 Relationship between teaching practices and students’ mathematics self-concept, by students’ familiarity with mathematics
Web table 4.17 students’ interest in mathematics and their use of computers in mathematics lessons
Web table 4.18 Performance gap between disadvantaged and other students, by context of task
Web table 4.19 Relationship between exposure to pure mathematics and mathematics performance, by interest in mathematics

ORGANISATION FOR ECONOMIC CO-OPERATION AND DEVELOPMENT
The OECD is a unique forum where governments work together to address the economic, social and environmental challenges of globalisation. The OECD is also at the forefront of efforts to understand and to help governments respond to new developments and concerns, such as corporate governance, the information economy and the challenges of an ageing population. The Organisation provides a setting where governments can compare policy experiences, seek answers to common problems, identify good practice and work to co-ordinate domestic and international policies.
The OECD member countries are: Australia, Austria, Belgium, Canada, Chile, the Czech Republic, Denmark, Estonia, Finland, France, Germany, Greece, Hungary, Iceland, Ireland, Israel, Italy, Japan, Korea, Luxembourg, Mexico, the Netherlands, New Zealand, Norway, Poland, Portugal, the Slovak Republic, Slovenia, Spain, Sweden, Switzerland, Turkey, the United Kingdom and the United States. The European Union takes part in the work of the OECD.
OECD Publishing disseminates widely the results of the Organisation’s statistics gathering and research on economic, social and environmental issues, as well as the conventions, guidelines and standards agreed by its members.
OECD PUBLISHING, 2, rue André-Pascal, 75775 PARIS CEDEX 16
(98 2016 04 1P) ISBN 978-92-64-25848-8 – 2016

PISA
Equations and InequalitiesMAKING MATHEMATICS ACCESSIBLE TO ALL
More than ever, students need to engage with mathematics concepts, think quantitatively and analytically, and communicate using mathematics. All these skills are central to a young person’s preparedness to tackle problems that arise at work and in life beyond the classroom. But the reality is that many students are not familiar with basic mathematics concepts and, at school, only practice routine tasks that do not improve their ability to think quantitatively and solve real-life, complex problems.
How can we break this pattern? This report, based on results from PISA 2012, shows that one way forward is to ensure that all students spend more “engaged” time learning core mathematics concepts and solving challenging mathematics tasks. The opportunity to learn mathematics content – the time students spend learning mathematics topics and practising maths tasks at school – can accurately predict mathematics literacy. Differences in students’ familiarity with mathematics concepts explain a substantial share of performance disparities in PISA between socio-economically advantaged and disadvantaged students. Widening access to mathematics content can raise average levels of achievement and, at the same time, reduce inequalities in education and in society at large.
Contents
Chapter 1. Why access to mathematics matters and how it can be measured
Chapter 2. Variations in students’ exposure to and familiarity with mathematics
Chapter 3. Exposure to mathematics in school and performance in PISA
Chapter 4. Opportunity to learn and students’ attitudes towards mathematics
Chapter 5. A policy strategy to widen opportunities to learn mathematics
Consult this publication on line at: http://dx.doi.org/10.1787/9789264258495-en
This work is published on the OECD iLibrary, which gathers all OECD books, periodicals and statistical databases. Visit www.oecd-ilibrary.org and do not hesitate to contact us for more information.
Programme for International Student Assessment
ISBN 978-92-64-25848-8 98 2016 04 1P
Co-funded by the European Union
PIS
A E
quatio
ns and Ineq
ualities MA
KIN
G M
AT
HE
MA
TIC
S A
CC
ES
SIB
LE T
O A
LL
PISA Equations and InequalitiesMAKING MATHEMATICS ACCESSIBLE TO ALL