Equatingthe Scoresof the Prueba Aptitud Academica™ … WH & Cook LL (1988) Equating the... ·...
20
Equating the Scores of the Prueba de Aptitud Academica™ and the Scholastic Aptitude Test® William H. Angoff Linda L. Cook College Board Report No. 88-2 ETS RR No. 88-3 College Examination Board, New York, 1988
Transcript of Equatingthe Scoresof the Prueba Aptitud Academica™ … WH & Cook LL (1988) Equating the... ·...
-----------~-
Equating the Scores ofthe Prueba de AptitudAcademica™ and the
Scholastic Aptitude Test®William H. Angoff
Linda L. Cook
College Board Report No. 88-2ETS RR No. 88-3
College Entr~nce Examination Board, New York, 1988

William H. Angoff is distinguished research scientist at Educational Testing Service. Princeton. New Jersey.
Linda L. Cook is principal measurement specialist at Educational Testing Service. Princeton, New Jersey.
Acknowledgments
The authors express their deep appreciation for the fine work of many professionals who have contributed inimportant ways to the success of the study: Eugene Mohr, Rosemarie Cruz. Aileene Alvarez, EugeneFrancis, and Victor Garcia, professors at the University of Puerto Rico, and Winifred Melendez, professor atthe Inter American University of Puerto Rico. These able professionals carried out the important andsensitive work of translating test items that were available in their English form from English to Spanish,other items from Spanish to English, and all the items back again to their original languages. The authors alsowish to express their gratitude to Edward Curley, Nancy Anderson, and Protase Woodford of the TestDevelopment group at Educational Testing Service (ETS) , who coordinated the assembly of the specialequating items and test sections and worked with the translations, to Nancy Wright and Edwin Blew of theCollege Board Statistical Analysis staff at ETS for their coordination and production of the statistical analysesfor this study, and to Marilyn Wingersky for her technical assistance in this study. Finally, the authors wish toacknowledge the important contributions of Carlos J. Lopez-Nazario, deputy director, and the staff of theCollege Board Puerto Rico Office for their dedicated involvement and able support throughout the course ofthe study.
Researchers are encouraged to express freely their professionaljudgment. Therefore, points of view or opinions stated in CollegeBoard Reports do not necessarily represent official College Boardposition or policy.
The College Board is a nonprofit membership organization that provides tests and other educational servicesfor students, schools, and colleges. The membership is composed of more than 2,500 colleges, schools, schoolsystems, and education associations. Representatives of the members serve on the Board of Trustees andadvisory councils and committees that consider the programs of the College Board and participate in thedetermination of its policies and activities.
Additional copies of this report may be obtained from College Board Publications, Box 886, New York. NewYork 10101-0886. The price is $6.
Copyright © 1988 by College Entrance Examination Board. All rights reserved. College Board, ScholasticAptitude Test, SAT, and the acorn logo are registered trademarks of the College Entrance ExaminationBoard. Printed in the United States of America.
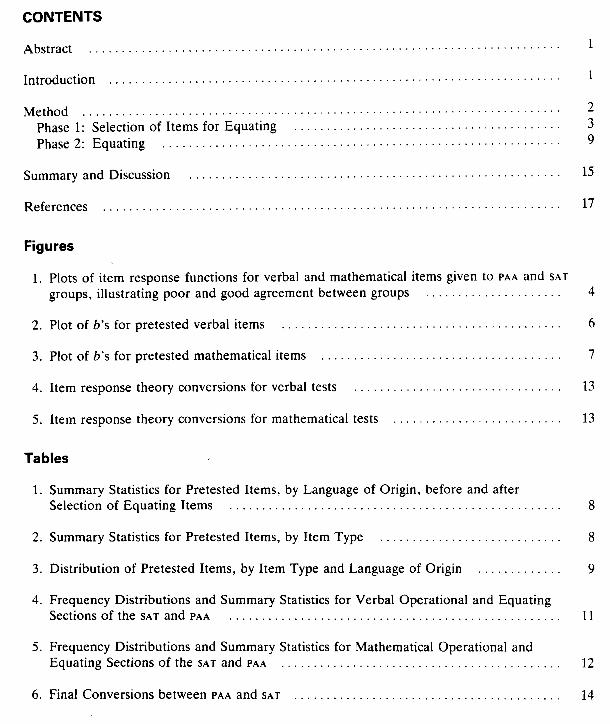
CONTENTS
Abstract .
Introduction .
1
Method 2Phase 1: Selection of Items for Equating . . . . . . . . . . . . . . . . . . . . . . . . . . . . . . . . . . . . . . . . . 3Phase 2: Equating ... . . . . . . . . . . . . . . . . . . . . . . . . . . . . . . . . . . . . . . . . . . . . . . . . . . . . . . . . . . 9
Summary and Discussion ~ . . . . . . 15
References
Figures
........................................... ' . 17
1. Plots of item response functions for verbal and mathematical items given to PAA and SAT
groups, illustrating poor and good agreement between groups 4
2. Plot of b's for pretested verbal items ............................................ 6
3. Plot of b's for pretested mathematical items ..................................... 7
4. Item response theory conversions for verbal tests
5. Item response theory conversions for mathematical tests
Tables
13
13
1. Summary Statistics for Pretested Items, by Language of Origin, before and afterSelection of Equating Items . . . . . . . . . . . . . . . . . . . . . . . . . . . . . . . . . . . . . . . . . . . . . . . . . . . 8
2. Summary Statistics for Pretested Items, by Item Type ............................ 8
3. Distribution of Pretested Items, by Item Type and Language of Origin 9
4. Frequency Distributions and Summary Statistics for Verbal Operational and EquatingSections of the SAT and PAA . . . . . . . . . . . . . . . . . . . . . . . . . . . . . . . . . . . . . . . . . . . . . . . . . . . 11
5. Frequency Distributions and Summary Statistics for Mathematical Operational andEquating Sections of the SAT and PAA 12
6. Final Conversions between PAA and SAT 14
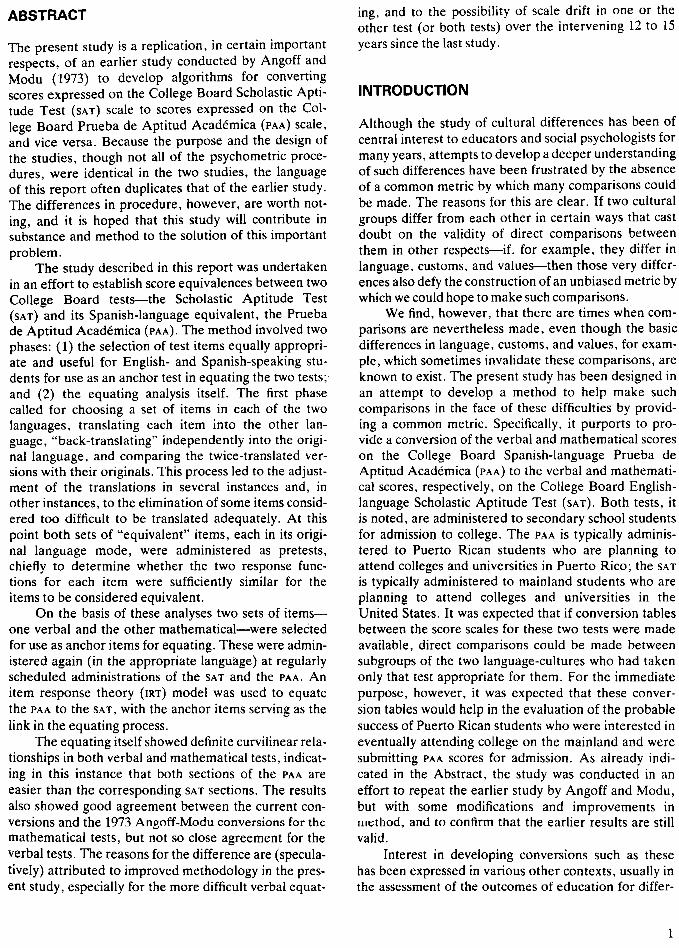
ABSTRACT
The present study is a replication, in certain importantrespects, of an earlier study conducted by Angoff andModu (1973) to develop algorithms for convertingscores expressed on the College Board Scholastic Aptitude Test (SAT) scale to scores expressed on the College Board Prueba de Aptitud Academica (PAA) scale,and vice versa. Because the purpose and the design ofthe studies, though not all of the psychometric procedures, were identical in the two studies, the languageof this report often duplicates that of the earlier study.The differences in procedure, however, are worth noting, and it is hoped that this study will contribute insubstance and method to the solution of this importantproblem.
The study described in this report was undertakenin an effort to establish score equivalences between twoCollege Board tests-the Scholastic Aptitude Test(SAT) and its Spanish-language equivalent, the Pruebade Aptitud Academica (PAA). The method involved twophases: (1) the selection of test items equally appropriate and useful for English- and Spanish-speaking students for use as an anchor test in equating the two tests;'and (2) the equating analysis itself. The first phasecalled for choosing a set of items in each of the twolanguages, translating each item into the other language, "back-translating" independently into the original language, and comparing the twice-translated versions with their originals. This process led to the adjustment of the translations in several· instances and, inother instances, to the elimination of some items considered too difficult to be translated adequately. At thispoint both sets of "equivalent" items, each in its original language mode, were administered as pretests,chiefly to determine whether the two response functions for each item were sufficiently similar for theitems to be considered equivalent.
On the basis of these analyses two sets of itemsone verbal and the other mathematical-were selectedfor use as anchor items for equating. These were administered again (in the appropriate language) at regularlyscheduled administrations of the SAT and the PAA. Anitem response theory (IRT) model was used to equatethe PAA to the SAT, with the anchor items serving as thelink in the equating process.
The equating itself showed definite curvilinear relationships in both verbal and mathematical tests, indicating in this instance that both sections of the PAA areeasier than the corresponding SAT sections. The resultsalso showed good agreement between the current conversions and the 1973 Angoff-Modu conversions for themathematical tests, but not so close agreement for theverbal tests. The reasons for the difference are (speculatively) attributed to improved methodology in the present study, especially for the more difficult verbal equat-
ing, and to the possibility of scale drift in one or theother test (or both tests) over the intervening 12 to 15years since the last study.
INTRODUCTION
Although the study of cultural differences has been ofcentral interest to educators and social psychologists formany years, attempts to develop a deeper understandingof such differences have been frustrated by the absenceof a common metric by which many comparisons couldbe made. The reasons for this are clear. If two culturalgroups differ from each other in certain ways that castdoubt on the validity of direct comparisons betweenthem in other respects-if, for example, they differ inlanguage, customs, and values-then those very differences also defy the construction of an unbiased metric bywhich we could hope to make such comparisons.
We find, however, that there are times when comparisons are nevertheless made, even though the basicdifferences in language, customs, and values, for example, which sometimes invalidate these comparisons, areknown to exist. The present study has been designed inan attempt to develop a method to help make suchcomparisons in the face of these difficulties by providing a common metric. Specifically, it purports to provide a conversion of the verbal and mathematical scoreson th~ College Board Spanish-language Prueba deAptitud Academica (PAA) to the verbal and mathematical scores, respectively, on the College Board Englishlanguage Scholastic Aptitude Test (SAT). Both tests, itis noted, are administered to secondary school studentsfor admission to college. The PAA is typically administered to Puerto Rican students who are planning toattend colleges and universities in Puerto Rico; the SAT
is typically administered to mainland students who areplanning to attend colleges and universities in theUnited States. It was expected that if conversion tablesbetween the score scales for these two tests were madeavailable, direct comparisons could be made betweensubgroups of the two language-cultures who had takenonly that test appropriate for them. For the immediatepurpose, however, it was expected that these conversion tables would help in the evaluation of the probablesuccess of Puerto Rican students who were interested ineventually attending college on the mainland and weresubmitting PAA scores for admission. As already indicated in the Abstract, the study was conducted in aneffort to repeat the earlier study by Angoff and Modu,but with some modifications and improvements inmethod, and to confirm that the earlier results are stillvalid.
Interest in developing conversions such as thesehas been expressed in various other contexts, usually inthe assessment of the outcomes of education for differ-
1

ent cultural groups living in close proximity: for example, for English- and French-speaking students in Canada, for English- and Afrikaans-speaking students inSouth Africa, for speakers of one or another of themany languages in India or in Africa. No satisfactorymethods to satisfy this interest have been available untilrecently, however, and the problems attendant on making comparisons among culturally different groups arefar more obvious and numerous than are the solutions.For example, to provide a measuring instrument tomake these comparisons, it is clearly insufficient simplyto translate the test constructed for one language groupinto the language of the other, even with adjustments inthe items to conform to the more obvious cultural requirements of the second group. It can hardly be expected, without careful and detailed checks, that thetranslated items will have the same meaning and relative difficulty for the second group as they had for theoriginal group before translation.
A method considerably superior to that of simpletranslation has been described by Boldt (1969). It requires the selection of a group of individuals judged tobe equally bilingual and bicultural and the administration of two tests to each individual, one test in each ofthe two languages. Scores on the two tests are thenequated as though they were parallel forms of the sametest, and a conversion table is developed relating scoreson each test to scores on the other.
One of the principal difficulties with the foregoingprocedure, however, is that the judgment Hequally bilingual and bicultural" is extremely difficult, perhaps evenimpossible, to make. More than likely, the individualmembers of the group, and even the group as a whole,will on average be more proficient in one of the twolanguages than in the other. This will be especially true,of course, if the group is small.
This study represents an attempt to overcome suchdifficulties. In brief, it calls for administering the PAA toPuerto Rican students and the SAT to mainland UnitedStates students, using a set of "common," or anchor,,items to calibrate and adjust for any differences be-tween the groups in the process of equating the twotests. It is noted that these items are common only interms of the operations used to develop and selectthem. By the very nature of things they had to be administered in Spanish to the Puerto Rican students and inEnglish to the mainland students. Therefore, to the extent that there is any validity in the notion that a set oftest items can represent the same psychological task toindividuals of two different languages and cultures, tothe extent that the sense of the operations is acceptable,and to the extent that the operations themselves wereadequate, the study will have achieved its purpose.There is also the concern that the Puerto Rican and themainland groups appear to differ so greatly in averageability that with the limited equating techniques avail-
2
able, it is not likely that any set of common items,however appropriate, can make adequate adjustmentsfor the differences, even if the two tests were designedfor students of the same language and culture.
There is, finally, the concern about the generalizability of a conversion between tests that are appropriatefor different cultural groups. In the usual equating problem, a conversion function is sought that will simplytranslate scores on one form of the test to the score scaleof a parallel form of the test-an operation analogous tothat of translating Fahrenheit units of temperature toCelsius units. When the two tests in question are measuring different types of abilities, however, or when one orboth of the tests may be unequally appropriate for different subgroups of the population, the conversion cannotbe unitary, as would be true of the temperature-scaleconversion, but would be different for different subgroups (Angoff 1966). In the present equating attempt,it is entirely possible that the use of different types ofsubgroups for the equating experiment-Mexicans andAustralians, for example, instead of Puerto Ricans andUnited States mainlanders-would yield. conversionfunctions quite different from those developed in thepresent study. For this reason the conversions developedhere should be considered to have limited applicabilityand should not be used without verification with groupsof individuals different from those studied here.
METHOD
In broad outline the method followed in this study forderiving conversions of scores from the verbal andmathematical scales of the PAA to the verbal and mathematical scales of the SAT was the same as that followedin the Angoff-Modu (1973) study referred to above. Ascarried out previously, this study was conducted in twophases: The first phase entailed the selection of appropriate anchor items for equating. This phase called forthe preparation of sets of items both in Spanish and inEnglish, the translation of each set into the other language by Puerto Rican educators proficient in both languages, and the administration of both sets in the appropriate language mode to Spanish- and English-speakingstudents. On the basis of an item analysis of the dataresulting from this administration, groups of verbal andmathematical items were chosen to fulfill the principalrequirement that they be equally appropriate, insofaras this could be determined, for both student groups.Beyond this requirement, the usual criteria for thechoice of equating items as to difficulty, discrimination,and content coverage were adhered to, to the extentpossible. In addition, care was taken, also where possible, to ,produce sets of anchor items reasonably balanced as to Spanish or English origin. Once the anchoritems were chosen, the second phase of the study was

undertaken, which called for a second test administration and an analysis for equating based on the dataresulting from that administration.
Phase 1: Selection of Items for Equating
In accordance with the foregoing plan, 105 Spanish verbal items, 110 English verbal items, 62 Spanish mathematical items, and 62 English mathematical items weredrawn from the file and submitted to bilingual expertsin Puerto Rico for translation. Two experts were assigned to translate the Spanish verbal items into English, and two other experts were assigned to translatethe English verbal items into Spanish. After this initialtranslation was completed, the two sets of experts independently back-translated each other's work into theoriginal language. All translations were then sent toEducational Testing Service, where Spanish-languageexperts compared the back-translated items with theoriginal items. Adjustments were made in the initialtranslations by the ETS staff and by the staff of the College Board Puerto Rico Office when the comparisonsrevealed inadequacies. In some instances it was judgedthat revisions could not be made adequately, and as aresult a number of items were dropped from furtheruse. The same process was carried out for the mathematical items. Because of the smaller number of mathematical items, however, only two translators wereused-one for translating items from Spanish to Englishand the other, items from English to Spanish. Eventually two complete sets of items were compiled, 160 verbal and 100 mathematical; each set appeared in bothlanguages and, to the extent that this could be observedat an editorial level, was equally meaningful in bothlanguages.
The 160 verbal items were of four types, paralleling the item types normally appearing in the operational forms of the PAA and the SAT: antonyms, analogies, sentence completion, and reading comprehension.The 100 mathematical items fell into four content categories: arithmetic, algebra, geometry, and miscellaneous. Detailed quantitative information on the pretested items is given later in this report.
The 160 verbal items and the 100 mathematicalitems were subdivided into four 40-item verbal sets andfour 25-item mathematical sets and administered to spiraled samples of regular College Board examinees. Thetest items in English were taken by candidates for theEnglish-language SAT at the January 1985 administration; the same test items, in Spanish, were taken bycandidates for the Spanish-language PAA at the October1984 administration. All of the foregoing sets of itemswere administered in 30-minute periods. All SAT andPAA examinee samples consisted of about 2,000 cases.
Item response theory (IRT) methods were used tocompare performance on the verbal and mathematical
items by the SAT and PAA groups. Items that functionedmost similarly for the two groups were selected to constitute the 40-item verbal and 25-item mathematicalequating tests.
Of all the methods currently available for selectingitems that function similarly for two groups ofexaminees, the three-parameter IRT method (Lord1977; Petersen 1977; Shepard, Camilli, and Williams1984) used in this study is most preferable. This is sobecause it minimizes effects related to differences ingroup performance that seriously confound the resultsof simpler procedures such as the delta-plot method(Angoff and Ford 1973) used in the previous study.
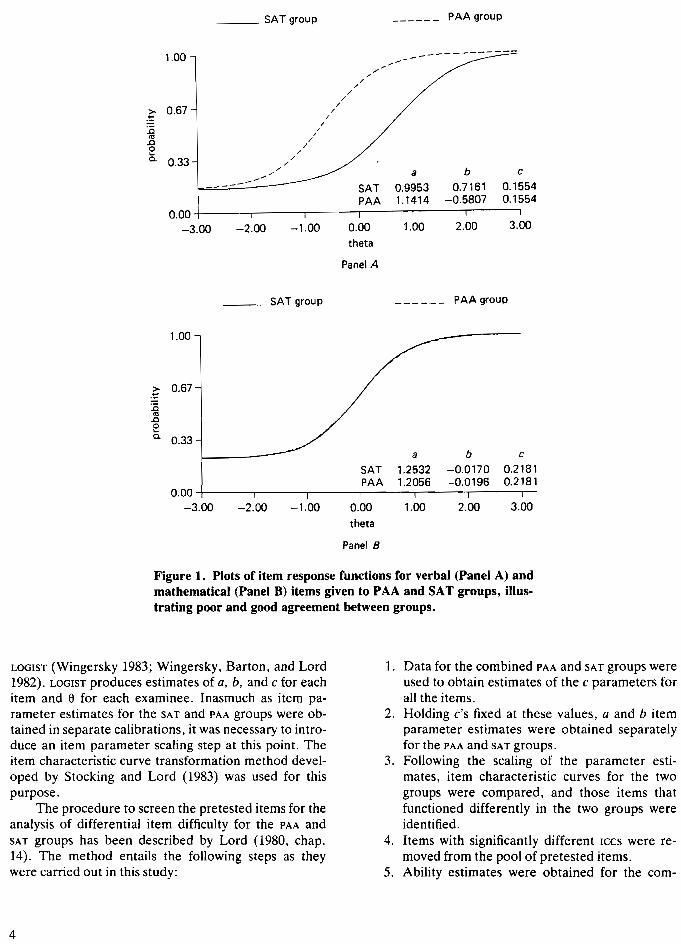
Item response theory methods may be used to compare two groups of examinees with respect to their responses to a particular item for the full ability (6) continuum. Item characteristic curves (ICCS), such as thoseshown in Figure 1, describe the relationship betweenthe probability of a correct response.to an item and thedegree of ability measured by the item. The curves inFigure 1 are described by the values of three item parameters: a, b, and c. These parameters have specificinterpretations: b is the point on the e metric at theinflection point of the ICC (where the slope of the curvereaches its maximum and begins to decrease) and istaken as a measure of item difficulty; a is proportionalto the slope of the ICC at the point of inflection andrepresents the degree to which the item provides usefuldiscriminations among individuals; c is the value of thelower asymptote of the ICC (where the slope is essentially zero) and represents the probability that anexaminee with very low ability will obtain a correctanswer to the item.
Studies of differential item difficulty were undertaken by estimating the ICCS of the pretested items separately for the PAA and SAT groups. Theoretically, if theitem has the same meaning for the two groups, theprobability of a correct response should be the same forexaminees of equal ability (Le., for any value of 8 alongthe continuum). Panel A of Figure 1 contains a comparison of item response functions obtained for a verbalitem given to the PAA and SAT groups. It can be seen,from examination of the ICCS in Panel A, that for alllevels of ability (8) the PAA group has a higher probability of obtaining a correct answer to the item; Le., theitem is seen to function in favor of the PAA group. PanelB of Figure 1 contains a comparison of ICCS obtained fora mathematical item given to the PAA and SAT groups. Incontrast to the curves shown in Panel A, the ICCS for themathematical item given to the two groups ofexaminees are almost identical; i.e., individuals at alllevels of ability in both groups have the same probability of obtaining a correct answer to the item. The itemfavors neither of the two groups.
For this study, item parameters and examinee abilities were estimated by use of .the computer program
3
___ SAT group PAA group
3.00
c0.15540.1554
2.00
b0.7161
-0.5807
1.00
SAT 0.9953PAA 1.1414
0.00theta
-1.00
.,..-./
/'/
//
//
//
//
//
//
//
// a-'"
-2.000.00 -L------r-----r------,.---.-----,---~
-3.00
0.33
1.00
.~ 0.67
:.c~
.coC.
Panel A
___ SAT group - PAA group
1.00
> 0.67.~
:.c~..coC. 0.33
a b cSAT 1.2532 -0.0170 0.2181PAA 1.2056 -0.0196 0.21810.00
-3.00 -2.00 -1.00 0.00 1.00 2.00 3.00theta
Panel B
Figure 1. Plots of item response functions for verbal (Panel A) andmathematical (Panel B).items given to PAA and SAT groups, illustrating poor and good agreement between groups.
LOGIST (Wingersky 1983; Wingersky, Barton, and Lord1982). LOGIST produces estimates of a, b, and c for eachitem and e for each examinee. Inasmuch as item parameter estimates for the SAT and PAA groups were obtained in separate calibrations, it was necessary to introduce an item parameter scaling step at this point. Theitem characteristic curve transformation method developed by Stocking and Lord (1983) was used for thispurpose.
The procedure to screen the pretested items for theanalysis of differential item difficulty for the PAA andSAT groups has been described by Lord (1980, chap.14). The method entails the following steps as theywere carried out in this study:
1. Data for the combined PAA and SAT groups wereused to obtain estimates of the c parameters forall the items.
2. Holding c's fixed at these values, a and b itemparameter estimates were obtained separatelyfor the PAA and SAT groups.
3. Following the scaling of the parameter estimates, item characteristic curves for the twogroups were compared, and those items thatfunctioned differently in the two groups wereidentified.
4. Items with significantly different ICCS were removed from the pool of pretested items.
5. Ability estimates were obtained for the com-
4
bined PAA and SAT groups, using the reduced setof items.
6. Holding ability estimates fixed at values obtained in step 5, a and b parameter estimateswere obtained for all pretested items (includingthose removed in step 4).
7. ICCS and estimates of item parameters were compared for the two groups, and the proposed setof 40 verbal and 25 mathematical equatingitems was chosen.
Step 1, it is noted, calls for combining the datafrom the two groups in the calculation of c-parameterestimates and' assuming that these estimates are thesame in both groups. The reason for this practice is thatc-parameter estimates are otherwise often poorlymade, are sometimes even indeterminate, and causedifficulties in comparing parameter estimates acrossgroups. The practice does not interfere with testing forsignificant differences among the a and b parameterestimates inasmuch as the null hypothesis of the IRT X2
test used here (Lord 1980, chap. 14) states that thevalues of a, b, and c are the same for the two groups ofinterest.
Steps 4 to 6 represent the IRT analogue to criterionpurification procedures used with conventional itembias techniques. Lord (1980, chap. 14) has cautionedthat the set of items of interest may not be measuring aunidimensional trait; thus, it is possible that ability estimates (a) as well as the ICCS obtained for the PAA groupmay not be strictly comparable to those obtained forthe SAT group. One possible solution is to "purify" thetest by removing the differentially functioning itemsand then to use the remaining set of unidimensionalitems to reestimate thea's. Finally, the "purified" set ofability estimates is used to obtain the set of item parameter estimates and ICCS (for the total pool of items) beingcompared.
Many indices are available for quantifying the differences between item characteristic curves or item parameter estimates for two groups of examinees. Thetwo indices chosen for use in this study were the previously mentioned IRT X2 (Lord 1980, chap. 14) and themean of the absolute difference between the Ices. (SeeCook, Eignor, and Petersen 1985 for a description ofthis statistic.) For each test, verbal and mathematicalitems were ranked according to their X2 values. Fromthe set of items with the smallest X2 values, those withthe smallest values of the mean absolute differencewere chosen. The verbal and mathematical equatingtests were constructed by use of this reduced pool ofitems.
Summary statistics for all pretested items and forthe items chosen to constitute the verbal and mathematical equating tests are presented in Figures 2 and 3 and
in Tables 1 to 3. Several points should be noted. First, 2verbal items and 1 mathematical item were eliminatedfrom scoring before the LOGIST calibration. Second, itwas not possible to obtain item parameter estimates for13 verbal items and 6 mathematical items. Finally, 3verbal and 2 mathematical items were found to be soeasy for both groups that stable r-biserial correlationcoefficients could not be assured. These items were removed from the study. As a result, the pretested itempools were reduced to 142 verbal an,d 91 mathematicalitems.
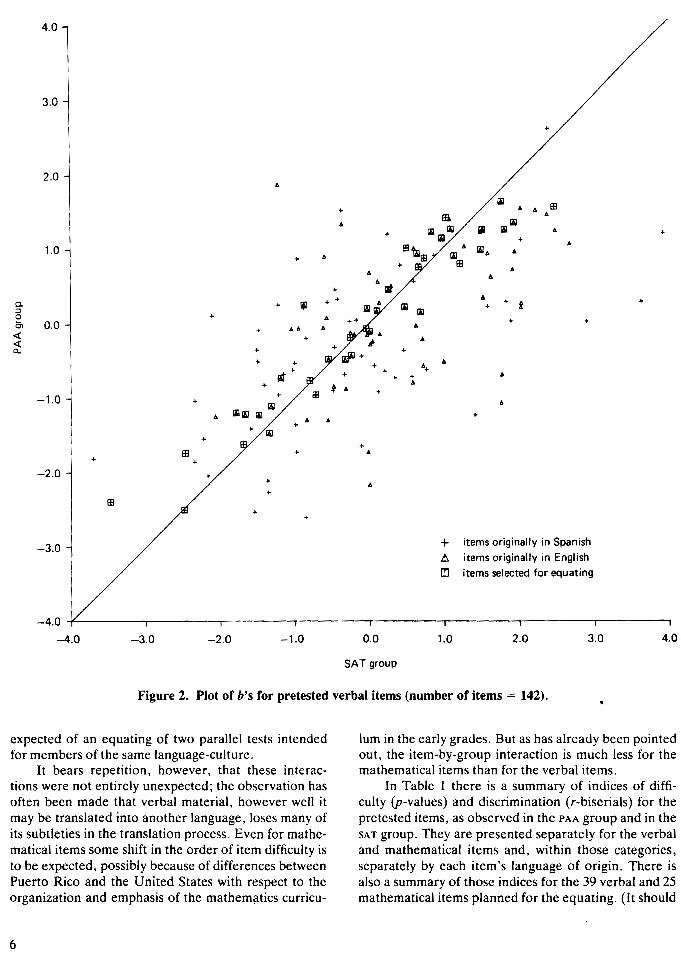
Figure 2 is a bivariate picture in which the 142 b's forthe Spanish verbal items are plotted against the corresponding b's for the same verbal items as they appearedin English. Figure 3 gives a similar plot for the mathematical items. As may be seen from these figures, theverbal plot is much more dispersed than the mathematical plot is, representing a much lower correlation forverbal items (r = .66) than for mathematical items (r =.90). In general, the correlation between the b's may beregarded as a measure of item-by-group interactioni.e., the degree to which the items represent, or fail torepresent, the same rank order of difficulty in the twolanguages. In those instances where the two groups aredrawn at random from the same general population, itis not unusual to see correlations between item difficulty indices in the neighborhood of .98 and evenhigher. That the correlation for the verbal items in thisstudy is as low as it is indicates that the verbal items donot have quite the same psychological meaning for themembers of the two language groups. Mathematics, onthe other hand, with its much higher correlation, appears to be a more nearly universal language. In asense, this is one of the more significant findings in thisstudy because it reflects the very nature of the difficulties that are likely to be encountered in cross-culturalstudies, especially when verbal tests are used. With respect to this study in particular, some doubt is cast onthe quality of any equating that could be carried outwith tests in these two languages and with groups asdifferent as these. Since the equating items are used tocalibrate for differences in the abilities of the PAA andSAT groups, a basic requirement for equating is that theitems have the same rank order of difficulty in the twogroups; for the verbal items, it is clear that this requirement is not met. Considerable improvement, in thesense of reducing the item-by-group interaction, wasachieved in the verbal items (as will be shown below) bydiscarding the most aberrant items among them andretaining those that showed the sm'allest differences between the two language groups in their item responsecurves. Nevertheless, with item-by-group interaction effects even as large as those observed here for the itemsthat were retained, the concern remains that the verbalequating might be much less trustworthy than would be
5
4.0
3.0
+
2.0
riJeI+ A A
Ell AA
(iJ iii li11i1
+ li11J1 A++
A1.0
EBtiJ A(iJA A+ If. EB riJ
+ EBIf.If.
If.
+ A~
+ + A+ +
0-+ '5J A
t:::J
IIJ fiIli1 +e +
A +++ +
~ 0.0+ AA A If.<{
+ AA
<{
+ i0..+-
WiJ++
+- ++ If.+
If.+
+at ++ + A+- t If.
If.
+ EB +-1.0+
til If.,-
A riJlI1 111++
A A+
111+
+EB + A++
-2.0+
+A
+EB
++
-3.0 + items originally in Spanish6 items originally in English[!] items selected for equating
-4.0
-4.0 -3.0 -2.0 -1.0 0.0 1.0 2.0 3.0 4.0
SAT group
Figure 2. Plot of b's for pretested verbal items (number of items = 142).
expected of an equating of two parallel tests intendedfor members of the same language-culture.
It bears repetition, however, that these interactions were not entirely unexpected; the observation hasoften been made that verbal material, however well itmay be translated into another language, loses many ofits subtleties in the translation process. Even for mathematical items some shift in the order of item difficulty isto be expected, possibly because of differences betweenPuerto Rico and the United States with respect to theorganization and emphasis of the mathematics curricu-
6
lum in the early grades. But as has already been pointedout, the item-by-group interaction is much less for themathematical items than for the verbal items.
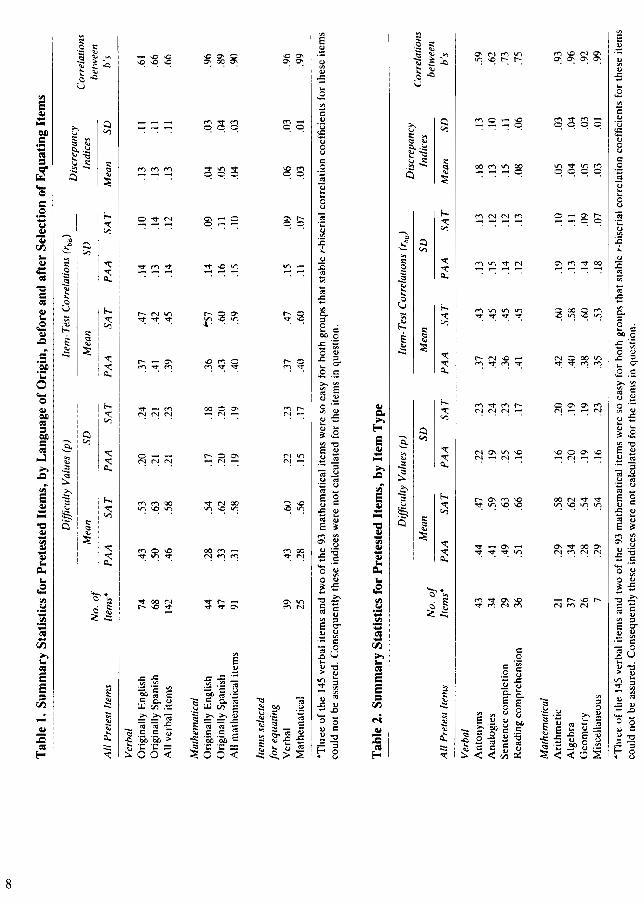
In Table 1 there is a summary of indices of difficulty (p-values) and discrimination (r-biserials) for thepretested items, as observed in the PAA group and in theSAT group. They are presented separately for the verbaland mathematical items and, within those categories,separately by each item's language of origin. There isalso a summary of those indices for the 39 verbal and 25mathematical items planned for the equating. (It should

2.0 iA
I
+j
+
J
6
+ 66 61.0
+
A
+ ++
A +c.
EIt:::J
+ 66
0~
0.06
C7)
E£)4fJ~
+~0-
6+6+ 6
+6
+ +
++ ~
++-1.0+
6
6 ++ +
A 6
-2.0I-3.0 i + items originally in Spanish
6 items originally in English[!] items selected for equating
-4.0
-4.0 -3.0 -2.0 -1.0 0.0 1.0 2.0 3.0 4.0SAT group
Figure 3. Plot of b's for pretested mathematical items (number of items = 91).
be mentioned here that the original plan was to select40 verbal items and 25 mathematical items. After. theselections were completed, however, it was felt necessary to revise one of the verbal items substantially. Instead it was dropped, reducing the number of verbalequating items from 40 to 39.) The tenth and eleventhcolumns in Table 1 give the means and standard deviations of the index of discrepancy (the mean absolutedifference) between the two item response curves, oneof the indices used as the basis for selecting the items.Finally, Table 1 gives the correlations between the bparameter estimates for the two language groups, againby category of item.
As can be seen in Table 1, the items are, on average, considerably more difficult for the PAA candidatesthan for the SAT candidates. The difference between themean p-values on the verbal items is more than one-halfof a standard deviation; the difference on the mathe-
matical items is considerably more than a full standarddeviation. For both the PAA and the SAT candidategroups and for both the verbal and the mathematicalitems, the items originating in Spanish appeared to berelatively easier than those originating in English.
The second set of Table 1 columns summarizes theitem-test correlations (r-biserials) for the items in theirSpanish and English forms. In general, both verbal andmathematical items appear to be less discriminating forthe PAA candidates than for the SAT candidates, particularly so for the mathematical items. This difference indiscrimination is also present in the group of selecteditems. It is observed that the mathematical items, atleast for the SAT group, have higher mean r-biserialcorrelations on average than do the verbal items, anobservation that is frequently made in other reviews ofthese two item types.
As can be seen in the column summarizing the
7
00
Tab
le1.
Sum
mar
yS
tati
stic
sfo
rP
rete
sted
Item
s,by
Lan
guag
eof
Ori
gin,
befo
rean
daf
ter
Sel
ecti
ono
fE
quat
ing
Item
s
Dif
ficu
lty
Val
ues
(p)
Item
-Tes
tC
orre
lati
ons
(rbi
s)D
iscr
epan
cyM
ean
SD
Mea
nS
DIn
dice
sC
orre
lati
ons
No.
of
betw
een
All
Pre
test
ltel
nsIt
enls
*P
AA
SA
TP
AA
SA
TP
AA
SA
TP
AA
SA
TM
ean
SD
b's
Ver
bal
Ori
gina
lly
Eng
lish
74.4
3.5
3.2
0.2
4.3
7.4
7.1
4.1
0.1
3.1
1.6
1O
rigi
nall
yS
pani
sh68
.50
.63
.21
.21
.41
.42
.13
.14
.13
.11
.66
All
verb
alit
ems
142
.46
.58
.21
.23
.39
.45
.14
.12
.13
.11
.66
Mat
hem
atic
alO
rigi
nall
yE
ngli
sh44
.28
.54
.17
.18
.36
~57
.14
.09
.(l4
.03
.96
Ori
gina
lly
Spa
nish
47.3
3.6
2.2
0.2
0.4
3.6
0.1
6.1
1.0
5.0
4.8
9A
llm
ath
emat
ical
item
s91
.31
.58
.19
.19
.40
.59
.15
.1()
.04
.en.9
0
Item
sse
lect
edfo
req
uati
ngV
erb
al39
.43
.60
.22
.23
.37
.47
.15
.09
.06
.03
.96
Mat
hem
atic
al25
.28
.56
.15
.17
.40
.60
.11
.07
.03
.01
.99
*Thr
eeo
fth
e14
5v
erb
alit
ems
and
two
of
the
93m
athe
mat
ical
item
sw
ere
soea
syfo
rb
oth
grou
psth
atst
able
r-bi
seri
alco
rrel
atio
nco
effi
cien
tsfo
rth
ese
item
sco
uld
not
beas
sure
d.C
on
seq
uen
tly
thes
ein
dice
sw
ere
no
tca
lcul
ated
for
the
item
sin
qu
esti
on
.
Tab
le2.
Sum
mar
yS
tati
stic
sfo
rP
rete
sted
Item
s,by
Item
Typ
e
Dif
ficu
lty
Val
ues
(p)
Item
-Tes
tC
orre
lati
ons
(rbi
s)D
iscr
epan
cyM
ean
SD
Mea
nS
DIn
dice
sC
orre
lati
ons
No.
of
betw
een
All
Pre
test
Item
sIt
ems*
PA
AS
AT
PA
AS
AT
PA
AS
AT
PA
AS
AT
Mea
nS
Db
's
Ver
bal
An
ton
ym
s43
.44
.47
.22
.23
.37
.43'
.13
.13
.18
.13
.59
Ana
logi
es34
.41
.59
.19
.24
.42
.45
.15
.12
.13
.10
.62
Sen
ten
ceco
mp
leti
on
29.4
9.6
3.2
5.2
3.3
6.4
5.1
4.1
2.1
5.1
1.7
3R
ead
ing
com
pre
hen
sio
n36
.51
.66
.16
.17
.41
.45
.12
.13
.08
.06
.75
Mat
hem
atic
alA
rith
met
ic21
.29
.58
.16
.20
.42
.60
.19
.10
.05
.03
.93
Alg
ebra
37.3
4.6
2.2
0.1
9.4
0.5
8.1
3.1
1.0
4.0
4.9
6G
eom
etry
26.2
8.5
4.1
9.1
9.3
8.6
0.1
4.0
9.0
5.0
3.9
2M
isce
llan
eous
7.2
9.5
4.1
6.2
3.3
5.5
3.1
8.0
7.0
3.0
1.9
9
*T
hre
eo
fth
e14
5ve
rbal
item
san
dtw
oo
fth
e93
mat
hem
atic
alit
ems
wer
eso
easy
for
bo
thg
rou
ps
that
stab
ler-
bise
rial
corr
elat
ion
coef
fici
ents
for
thes
eit
ems
coul
dn
ot
be
assu
red.
Co
nse
qu
entl
yth
ese
indi
ces
wer
eno
tca
lcul
ated
for
the
item
sin
qu
esti
on
.
discrepancies between the item response curves for thetwo groups, the discrepancies between the two curvesfor the verbal items are· far greater than for the mathematical items. Also, it is observed that the items selected for equating show smaller mean discrepanciesthan is 'observed in the entire groups of pretested items.This is to be expected, of course, since the items wereselect~d largely on the basis of the agreement betweenthe two item response curves.
The last column, giving the correlations betweenthe b's, expresses in correlational terms what has already been observed in Figures 2 and 3-namely" theitem-by-group interaction with respect to item difficulty. Here we see again that the correlation betweenthe b parameters is much lower for the verbal itemsthan for the mathematical items. And again, we seethat the correlations between the b-values for the selected items--especially the verbal items-are higherthan for the unselected items.
Table 2 is a summary of the same data as shown inTable 1 but classified by item type rather than by language of origin. The great difficulty of the items for thePAA group is readily observable in this table. It is alsoclear that the items in all four verbal and mathematicalcategories are more discriminating for the UnitedStates students than for the Puerto Rican students.
It is interesting that the four verbal types arrangethemselves into two distinct classes insofar as the correlations between their b-values are concerned: highercorrelations (smaller item-by-group interactions) arecharacteristic of the sentence completion and readingcomprehension items, and lower correlations (largeritem-by-group interactions) are characteristic of the antonyms and analogies. This result is intuitively reasonable since items with more context probably tend toretain their meaning, even in the face of translation intoanother language.
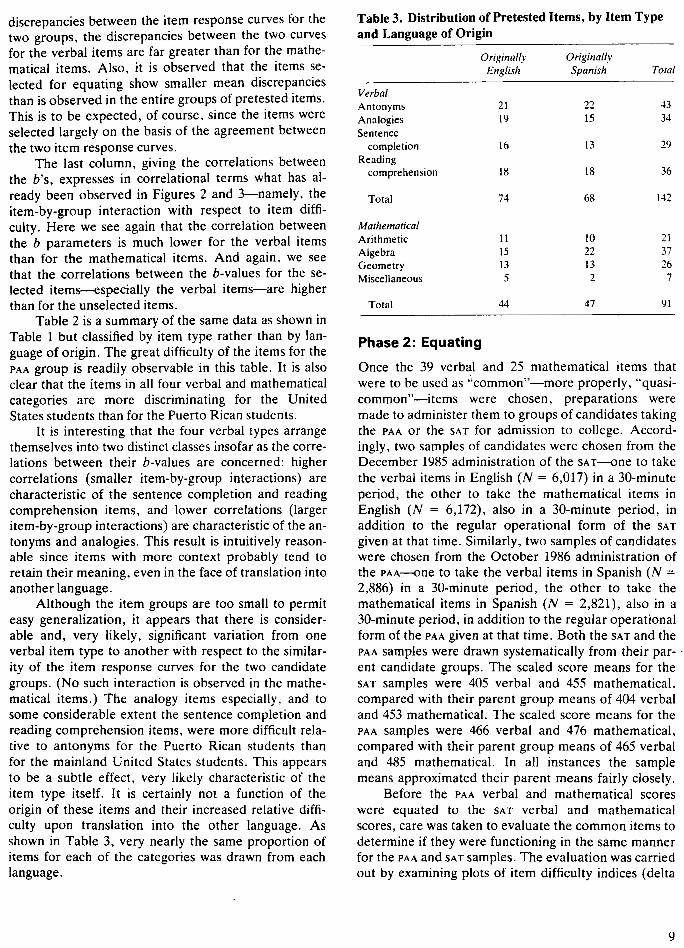
Although the item groups are too small to permiteasy generalization, it appears that there is considerable and, very likely, significant variation from oneverbal item type to another with respect to the similarity of the item response curves for the two candidategroups. (No such interaction is observed in the mathematical items.) The analogy items especially, and tosome considerable extent the sentence completion andreading comprehension items, were more difficult relative to antonyms for the Puerto· Rican students thanfor the mainland United States students. This appearsto be a subtle effect, very likely characteristic of theitem type itself. It is certainly not a function of theorigin of these items and their increased relative difficulty upon translation into the other language. Asshown in Table 3, very nearly the same proportion ofitems for each of the categories was drawn from eachlanguage.
Table 3. Distribution of Pretested Items, by Item Typeand Language of Origin
Originally OriginallyEnglish Spanish Total
VerbalAntonyms 21 22 43Analogies 19 15 34Sentence
completion 16 13 29
Readingcomprehension 18 18 36
Total 74 68 142
MathematicalArithmetic 11 10 21Algebra 15 22 37
Geometry 13 13 26Miscellaneous 5 2 7
Total 44 47 91
Phase 2: Equating
Once the 39 verbal and 25 mathematical items thatwere to be used as ,"common'''-more properly, Hquasicommon"-items were chosen, preparations weremade to administer them to groups of candidates takingthe PAA or the SAT for admission to college. Accordingly, two samples of candidates were chosen from theDecember 1985 administration of the SAT--one to takethe verbal items in English (N = 6,017) in a 30-minuteperiod, the other to take the mathematical items inEnglish (N = 6,172), also in a 30-minute period, inaddition to the regular operational form of the SATgiven at that time. Similarly, two samples of candidateswere chosen from the October 1986 administration ofthe PAA--one to take the verbal items in Spanish (N =2,886) in a 30-minute period, the other to take themathematical items in Spanish (N = 2,821), also in a3D-minute period, in addition to the regular operationalform of the PAA given at that time. Both the SAT and thePAA samples were drawn systematically from their par- .ent candidate groups. The scaled score means for theSAT samples were 405 verbal and 455 mathematical"compared with their parent group means of 404 verbaland 453 mathematical. The scaled score means for thePAA samples were 466 verbal and 476 mathematical,compared with their parent group means of 465 verbaland 485 mathematical. In all instances the samplemeans approximated their parent means fairly closely.
Before the PAA verbal and mathematical scoreswere equated to the SAT verbal and mathematicalscores, care was taken to evaluate the common items todetermine if they were functioning in the same mannerfor the PAA and SAT samples. The evaluation was carriedout by examining plots of item difficulty indices (delta
9
(1)
values t ). Common items in this study were defined as~'equally appropriate" to the Spanish- and Englishspeaking groups on the basis of the similarity of theirrank-order position among other items for the twogroups. Five verbal and two mathematical items thatwere considered "outliers" from this plot were deletedfrom the common-item sections.
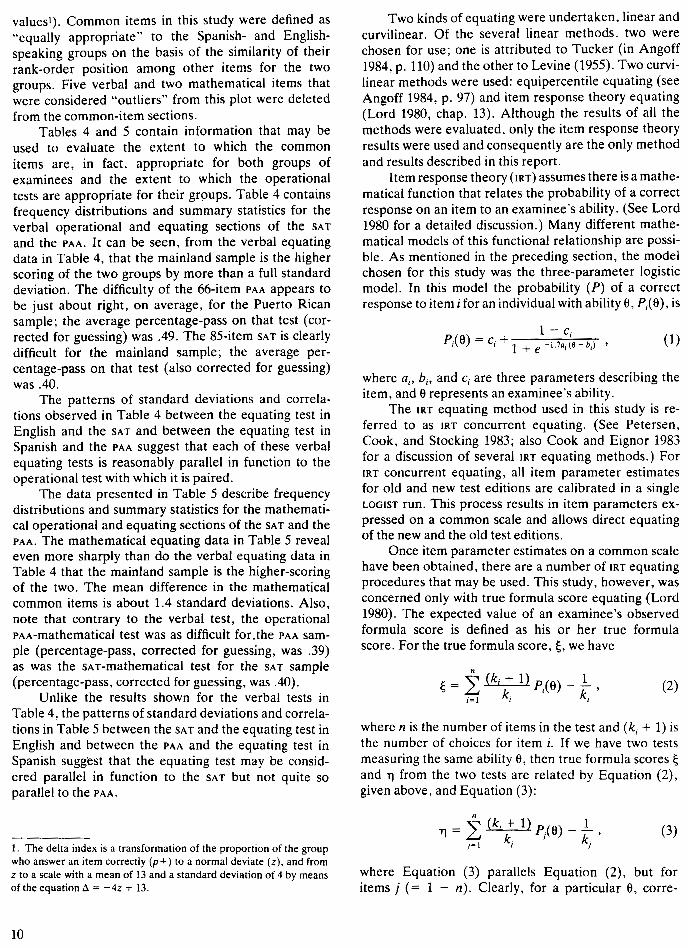
Tables 4 and 5 contain information that may beused to evaluate the extent to which the commonitems are, in fact, appropriate for both groups ofexaminees and the extent to which the operationaltests are appropriate for their grpups. Table 4 containsfrequency distributions and summary statistics for theverbal operational and equating sections of the SATand the PAA. It can be seen, from the verbal equatingdata in Table 4, that the mainland sample is the higherscoring of the two groups by more than a full standarddeviation. The difficulty of the 66-item PAA appears tobe just about right, on average, for the Puerto Ricansample; the average percentage-pass on that test (corrected for guessing) was .49. The 85-item SAT is clearlydifficult for the mainland sample; the average percentage-pass on that test (also corrected for guessing)was .40.
The patterns of standard deviations and correlations observed in Table 4 between the equating· test inEnglish and the SAT and between the equating test inSpanish and the PAA suggest that each of these verbalequating tests is reasonably parallel in function to theoperational test with which it is paired.
The data presented in Table 5 describe frequencydistributions and summary statistics for the mathematical operational and equating sections of the SAT and thePAA. The mathematical equating data in Table 5 revealeven more sharply than do the verbal equating data inTable 4 that the mainland sample is the higher-scoringof the two. The mean difference in the mathematicalcommon items is about 1.4 standard deviations. Also,note that contrary to the verbal test, the operationalPAA-mathematical test was as difficult for.the PAA sample (percentage-pass, corrected for guessing, was .39)as was the sAT-mathematical test for the SAT sample(percentage-pass, corrected for guessing, was .40).
Unlike the results shown for the verbal tests inTable 4, the patterns of standard deviations and correlations in Table 5 between the SAT and the equating test inEnglish and between the PAA and the equating test inSpanish suggest that the equating test may be considered parallel in function to the SAT but not quite soparallel to the PAA.
1. The delta index is a transformation of the proportion of the groupwho answer an item correctly (p +) to a normal deviate (z), and fromz to a scale with a mean of 13 and a standard deviation of 4 by meansof the equation ~ = -4z + 13.
10
Two kinds of equating were undertaken, linear andcurvilinear. Of the several linear methods, two werechosen for use; one is attributed to Tucker (in Angoff1984, p. 110) and the other to Levine (1955). Two curvilinear methods were used: equipercentile equating (seeAngoff 1984, p. 97) and item response theory equating(Lord 1980, chap. 13). Although the results of all themethods were evaluated, only the item response theoryresults were used and consequently are the only methodand results described in this report.
Item response theory (IRT) assumes there is a mathematical function that relates the probability of a correctresponse on an item to an examinee's ability. (See Lord1980 for a detailed discussion.) Many different mathematical models of this functionaJ relationship are possible. 'As mentioned in the preceding section, the modelchosen for this study was the three-parameter logisticmodel. In this model the probability (P) of a correctresponse to item i for an individual with ability 8, P;(8), is
P.(6) = c. + 1 - c;I I 1 + e -1.7a; (6 - bi)
where a;, b;, and c; are three parameters describing theitem, and 8 represents an examinee's ability.
The IRT equating method used in this study is referred to as IRT concurrent equating. (See Petersen,Cook, and Stocking 1983; also Cook and Eignor 1983for a discussion of several IRT equating methods.) ForIRT concurrent equating, all item parameter estimatesfor old and· new test editions are calibrated in a singleLOGIST run. This process results in item parameters expressed on a common scale and allows direct equatingof the new and the old test editions.
Once item parameter estimates on a common scalehave been obtained, there are a number of IRT equatingprocedures that may be used. This study, however, wasconcerned only with true formula score equating (Lord1980). The expected value of an examinee's observedformula score is defined as his or her true formulascore. For the true formula score, ~, we have
(2)
where n is the number of items in the test and (k; + 1) isthe number of choices for item i. If we have two testsmeasuring the same ability 8, then true formula scores ~
and 11 from the two tests are related by Equation (2),given above, and Equation (3):
(3)
where Equation (3) parallels Equation (2), but foritems j (= 1 - n). Clearly, for a particular e, corre-
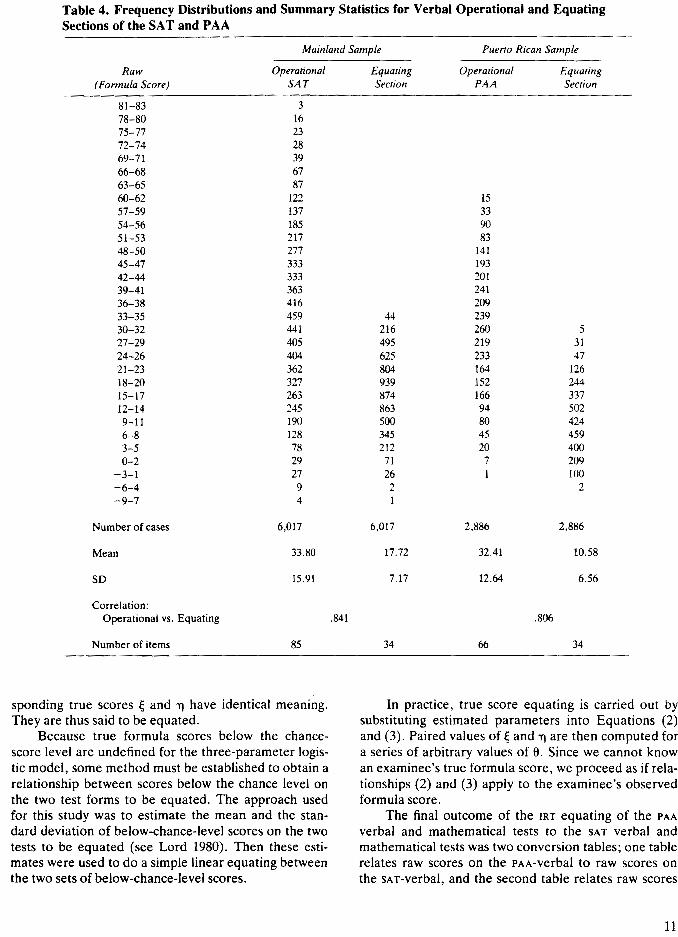
Table 4. Frequency Distributions and Summary Statistics for Verbal Operational and EquatingSections of the SAT and PAA
Mainland Salnple Puerto Rican Sa1npleRaw Operational Equating Operational Equating(Formula Score) SAT Section PAA Section
81-83 378-80 1675-77 2372-74 2869-71 3966-68 6763-65 8760-62 122 1557-59 137 3354-56 185 9051-53 217 8348-50 277 14145-47 333 19342-44 333 20139-41 363 24136-38 416 20933-35 459 44 23930-32 441 216 260 527-29 405 495 219 3124-26 404 625 233 4721-23 362 804 164 12618-20 327 939 152 24415-17 263 874 166 33712-14 245 863 94 5029-11 190 500 80 4246-8 128 345 45 4593-5 78 212 20 4000-2 29 71 7 209-3-1 27 26 1 100-6-4 9 2 2-9-7 4 1
Number of cases 6,017 6,017 2,886 2,886Mean 33.80 17.72 32.41 10.58SD 15.91 7.17 12.64 6.56Correlation:
Operational vs. Equating .841 .806Number of items 85 34 66 34
sponding true scores ~ and TJ have identical meaning.They are thus said to be equated.
Because true formula scores below the chancescore level are undefined for the three-parameter logistic model, some method must be established to obtain arelationship between scores below the chance level onthe two test forms to be equated. The approach usedfor this study was to estimate the mean and the standard deviation of below-chance-level scores on the twotests to be equated (see Lord 1980). Then these estimates were used to do a simple linear equating betweenthe two sets of below-chance-Ievel scores.
In practice, true score equating is carried out bysubstituting estimated parameters into Equations (2)and (3). Paired values of ~ and TJ are then computed fora series of arbitrary values of e. Since we cannot knowan examinee's true formula score, we proceed as if relationships (2) and (3) apply to the examinee's observedformula score.
The final outcome of the IRT equating of the PAA
verbal and mathematical tests to the SAT verbal andmathematical tests was two conversion tables; one tablerelates raw scores on the PAA-verbal to raw scores onthe sAT-verbal, and the second table relates raw scores
11
Table S. Frequency Distributions and Summary Statistics for Mathematical Operational andEquating Sections of the SAT and PAA
Mainland Sample Puerto Rican Sample
Raw Operational Equating Operational Equating(Formula Score) SAT Section PAA Section
59-60 1957-58 1455-56 2953-54 3351-52 5649-50 74 547-48 79 945-46 106 2443-44 101 2841-42 160 4939-40 160 4437-38 211 5135-36 248 9233-34 258 8031-32 300 11629-30 323 9227-28 366 15325-26 336 12123-24 416 206 159 221-22 369 486 190 1019-20 341 320 183 1017-18 370 505 201 2515-16 321 439 178 2713-14 320 511 229 4011-12 248 613 205 759-10 257 556 183 1197-8 200 677 165 1725-6 187 554 90 2953-4 136 571 90 4441-2 64 460 47 733
-1-0 47 188 29 550-3-2 15 82 4 272-5-4 7 4 2 45-7-6 1 2 2
Number of cases 6,172 6,172 2,821 2,821
Mean 24.17 10.82 19.56 2.92
SO 12.48 6.72 10.71 4.43
Correlation:Operational Ys. Equating .879 .740
Number of items 60 23 50 23
on the PAA-mathematical to raw scores on the SATmathematical. Conversion tables showing the relationship between scaled scores on the respective PAA andSAT tests were derived from the raw-to-raw conversiontables. Scaled score conversions for the verbal andmathematical tests are presented in Table 6. It is clearfrom the Table 6 list of verbal equivalences that thedifference between the two scales is as much as 180 to185 points at a PAA score of 500. The differences aresmaller at the extremes of the score scale.
12
The equivalences for the mathematical tests alsoshow striking differences between the PAA and the SATscales. In the vicinity of a PAA-mathematical score of500 there is also a difference of 180 to 185 points. As isthe case for the verbal equivalences, the differences aresmaller at the extremes of the score scale.
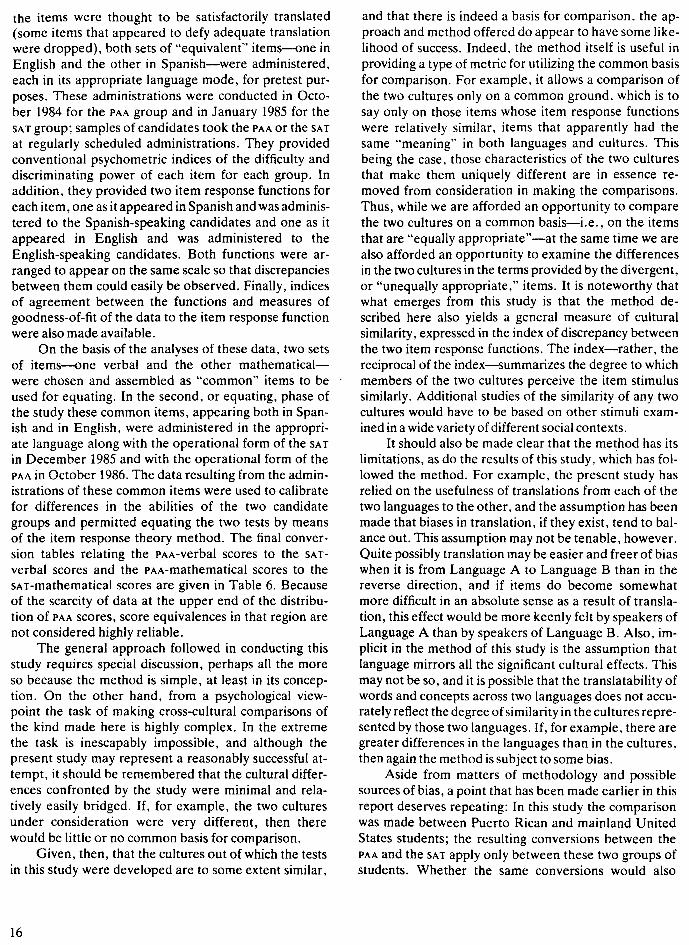
Graphs of the verbal and mathematical IRT equating results appear in Figures 4 and 5. It is evident, evenfrom a cursory glance at these figures that they suggestmarkedly curvilinear conversions between the PAA and

800700600500PAA scaled scores
800700600500
PAA scaled scores
800 800
700 700
600 600
enenQJ
500QJ 500
00(,Jen~
"C"CQJQJ
C;; 400C;; 400~
(,J
t-ent-
<t<tU)U) 300 300
200 200
100 100
Figure 4. Item response theory conversions for verbaltests. Figure S. Item response theory conversions for mathe
matical tests.
SAT, typical of the results of equating two tests thatdiffer pronouncedly in difficulty. Such conversions,which are likely to be very nearly the same irrespectiveof the particular method of equating employed in producing them, are seen to be concave upward when theeasier test is plotted on the horizontal axis and the moredifficult test on the vertical axis. In this instance the PAA
is clearly the easier test, and-inasmuch as the concavity is deeper for the mathematical test-it appears alsothat the mathematical tests are more different in difficulty than the verbal tests.
Some attention should be given to the meaning ofthe differences in the PAA and SAT scales. That a 500score on the PAA corresponds to a lower-than-500 scoreon the SAT simply says that if one can assume that theSAT and PAA values have been maintained preciselysince the time of their inception, it can be concludedthat the original scaling group for the SAT was generallymore able in the abilities measured by these aptitudetests than was the original scaling group for the PAA. Itdoes not by itself imply that the SAT candidate grouptoday is necessarily more able than the PAA group, although this appears, in fact, to be the case. Nor does itnecessarily suggest any generalization regarding thelarge populations from which these two examineegroups were self-selected-e.g., that the twelfth-gradestudents on the mainland score higher than do thetwelfth graders in Puerto Rico. We know that the SAT
examinee group is about one-third the size of the
twelfth-grade population on the mainland and is therefore a more selective group than is its PAA counterpart,which represents a substantial proportion (over 95 percent), of the twelfth-grade population in Puerto Rico.On the other hand, this is not to say that differencesbetween the two twelfth-grade populations do not alsoexist. There is some evidence, however crude, thatmarked differences do exist. But this evidence is outside the scope of this study.
In view of these and other possible misinterpretations of the data of this report, it will be useful torestate the limited purpose for which the present investigation was undertaken: to derive a set of conversionsbetween two similar-appearing scales of measurementone for tests of one language and culture, the other fortests of a different language and culture. Clearly, theaccuracy of these conversions is limited by the appropriateness of the method used to derive them and the dataassembled during the course of the study. It is hopedthat these conversions will be useful in a variety ofcontexts, but (as suggested by the examples cited here)to be useful, they will need in each instance to be supported by additional data peculiar to the context.
A natural question that would arise at this point is,How well do the equivalences developed in this studycompare with those developed in the 1973 AngoffModu study? In the earlier study, it is recalled, twolinear methods were used in addition to a curvilinearmethod. The final conversions reported there were
13

Table 6. Final Conversions between PAA and SAT
Verbal* Mathematical*
PAA Equivalent PAA EquivalentScaled Scores SA T Scaled Scores Scaled Scores SA T Scaled Scores
800 785 800 785787 757 790 743774 709 779 676761 660 768 629749 617 758 593736 584 747 564723 557 736 539710 535 726 518697 516 715 499684 500 704 482
672 485 694 467659 472 683 453646 460 672 440633 449 662 429625 438 651 418617 428 640 408609 419 630 399601 410 619 390592 401 608 382584 393 598 374
576 384 587 366568 376 576 359560 369 566 353552 361 555 346544 354 544 340535 347 534 334527 340 523 329519 333 512 323511 326 502 318503 319 491 313
*Scaled scores are not normally reported higher than 800 or lower than 200 on eitherthe PAA or the SAT. Some scores below 200 are reported here to show the nature ofthe conversions near the ends of the scale.
Note: Care should be exercised in the proper use and interpretation ofTable 6. See the text of this report, beginning with the second paragraphon page 16 and continuing through page 17, for a discussion of thelimitations ofTable 6 and for cautions regarding its possible misuses.
taken to be an average of the three, essentially weighting the curvilinear results equally with the average ofthe two linear results. In the present study, with thebenefit of improved (item response theory) techniquesfor equating and with somewhat greater understandingof equating theory, it was decided to base the entireoperation on the curvilinear equating as determined bythe IRT procedure. The results of this study yielded substantially lower conversions to the sAT-verbal scale thanwas the case in the earlier study, especially in the largemiddle range between about 450 and about 750. Theconversions to the SAT-mathematical scale showed better agreement with the earlier results. One can only ~
speculate regarding the reasons for the agreement in
14
the mathematical and the disagreement in the verbal.Part of it is undoubtedly attributable to a change inequating method. Another reason is the possibility ofdrift in the equating of either the PAA-verbal scale or thesAT-verbal scale, or both, over the intervening 12 to 15years, causing a difference between the present resultsand those found in the earlier study. Yet another reason, as has been discussed in other places in this report,is that verbal equating across two languages and cultures is so much more problematic than is true of mathematical equating. In any case, we suggest that for reasons of improved methodology, the present results areprobably more trustworthy than those given in the earlier, Angoff-Modu report.

Table 6. Continued
Verba/*Mathematical*
PAA Equivalent PAA EquivalentScaled Scores SA T Scaled Scores Scaled Scores SA T Scaled Scores495 313 480 308487 307 470 303478 301 459 299470 295 448 295462 289 438 290454 283 427 286446 278 416 282438 272 406 278430 267 395 274421 262 384 269
413 257 374 265405 252 363 261397 248 352 257389 243 342 253381 238 331 249373 234 320 245364 229 310 241356 225 299 237348 221 288 232340 216 278 228
332 212 267 224324 208 256 220316 204 246 216307 200 235 212299 196 224 209291 192 214 205283 188 203 197275 184 200 188267 180259 176
250 172242 168234 163226 158218 155210 152202 150200 148
Note: Care should be exercised in the proper use and interpretation ofTable 6. See the text of this report, beginning with the second paragraphon page 16 and continuing through page 17, for a discussion of thelimitations ofTable 6 and for cautions regarding its possible misuses.
SUMMARY AND DISCUSSION
The purpose of this study was to establish scoreequivalences between the College Board Scholastic Aptitude Test (SAT) and its Spanish-language equivalent, theCollege Board Prueba de Aptitud Academica (PAA).The method of the study involved two phases: (1) theselection of test items equally appropriate and useful forSpanish- and English-speaking students for use in equat-
ing the two tests and (2) the equating analysis itself. Themethod of the first phase was to choose two sets of items,one originally appearing in Spanish and the other originally appearing in English; to translate each set into theother language; to "back-translate" each set, independently of the first translation, into the original language;and to compare the original version of each item with itstwice-translated version and make adjustments in thetranslation where necessary and possible. Finally, after
15
the items were thought to be satisfactorily translated(some items that appeared to defy adequate translationwere dropped)., both sets of "equivalent"., items--one inEnglish and the other in Spanish-were administered,each in its appropriate language mode, for pretest purposes. These administrations were conducted in October 1984 for the PAA group and in January 1985 for theSAT group; samples of candidates took the PAA or the SATat regularly scheduled administrations. They providedconventional psychometric indices of the difficulty anddiscriminating power of each item for each group. Inaddition., they provided two item response functions foreach item, one as it appeared in Spanish and was administered to the Spanish-speaking candidates and one as itappeared in English and was administered to theEnglish-speaking candidates. Both functions were arranged to appear on the same scale so that discrepanciesbetween them could easily be observed. Finally, indicesof agreement between the functions and measures ofgoodness-of-fit of the data to the item response functionwere also made available.
On the basis of the analyses of these data, two setsof items-one verbal and the other mathematicalwere chosen and assembled as "common" items to be .used for equating. In the second, or equating, phase ofthe study these common items, appearing both in Spanish and in English, were administered in the appropriate language along with the operational form of the SATin December 1985 and with the operational form of thePAA in October 1986. The data resulting from the administrations of these common items were used to calibratefor differences in the abilities of the two candidategroups and permitted equating the two tests by meansof the item response theory method. The final conversion tables relating the PAA-verbal scores to the SATverbal scores and the PAA-mathematical scores to thesAT-mathematical scores are given in Table 6. Becauseof the scarcity of data at the upper end of the distribution of PAA scores, score equivalences in that region arenot considered highly reliable.
The general approach followed in conducting thisstudy requires special discussion, perhaps all the moreso because the method is simple, at least in its conception. On the other hand, from a psychological viewpoint the task of making cross-cultural comparisons ofthe kind made here is highly complex. In the extremethe task is inescapably impossible, and although thepresent study may represent a reasonably successful attempt, it should be remembered that the cultural differences confronted by the study were minimal and relatively easily bridged. If, for example, the two culturesunder consideration were very different, then therewould be little or no common basis for comparison.
Given, then, that the cultures out of which the testsin this study were developed are to some extent similar,
16
and that there is indeed a basis for comparison, the approach and method offered do appear to have some likelihood of success. Indeed., the method itself is useful inproviding a type of metric for utilizing the common basisfor comparison. For example, it allows a comparison ofthe two cultures only on a common ground., which is tosay only on those items whose item response functionswere relatively similar., items that apparently had thesame 'ltmeaning"" in both languages and cultures. This
'being the case, those characteristics of the two culturesthat make them uniquely different are in essence removed from consideration in making the comparisons.Thus, while we are afforded an opportunity to comparethe two cultures on a common basis-i.e., on the itemsthat are ~'equallyappropriate"-at the same time we arealso afforded an opportunity to examine the differencesin the two cultures in the terms provided by the divergent,or "unequally appropriate," items. It is noteworthy thatwhat emerges from this study is that the method described here also yields a general measure of culturalsimilarity, expressed in the index of discrepancy betweenthe two item response functions. The index-rather, thereciprocal of the index-summarizes the degree to whichmembers of the two cultures perceive the item stimulussimilarly. Additional studies of the similarity of any twocultures would have to be based on other stimuli examined in a wide variety of different social contexts.
It should also be made clear that the method has itslimitations, as do the results of this study, which has followed the method. For example, the pre.~ent study hasrelied on the usefulness of translations from each of thetwo languages to the other, and the assumption has beenmade that biases in translation, if they exist., tend to balance out. This assumption may not be tenable, however.Quite possibly translation may be easier and freer of biaswhen it is from Language A to Language B than in thereverse direction, and if items do become somewhatmore difficult in an absolute sense as a result of translation, this effect would be more keenly felt by speakers ofLanguage A than by speakers of Language B. Also, implicit in the method of this study is the assumption thatlanguage mirrors all the significant cultural effects. Thismay not be so, and it is possible that the translatability ofwords and concepts across two languages does not accurately reflect the degree ofsimilarity in the cultures represented by those two languages. If, for example, there aregreater differences in the languages than in the cultures,then again the method is subject to some bias.
Aside from matters of methodology and possiblesources of bias, a point that has been made earlier in thisreport deserves repeating: In this study the comparisonwas made between Puerto Rican and mainland UnitedStates students; the resulting conversions between thePAA and the SAT apply only between these two groups ofstudents. Whether the same conversions would also
have been found had the study been conducted betweenthe PAA and the SAT as taken by other Spanish speakersand other English speakers is an open question. Indeed,it is an open question whether the conversion obtainedhere also applies to variously defined subgroups of thePuerto Rican and mainland populations-liberal artswomen, engineering men, urban blacks, etc.
It is also to be hoped that the conversions betweenthe two types of tests will not be used without a clearrecognition of the realities: A Puerto Rican studentwith a PAA-verbal score of 503 has been found here tohave an sAT-verbal score "equivalent" of 319. This isnot to say that an sAT-verbal score of 319 would actuallybe earned were the student to take the SAT. The student might do better or might do worse, depending,obviously, on the student's facility in English. The conversions do offer away, however, of evaluating a general aptitude for verbal and mathematical materials interms familiar to users of SAT scores; depending on howwell the student can be expected to learn the Englishlanguage, the likelihood of success in competition withnative English speakers in the continental United Statescan be estimated. Continuing study of the comparativevalidity of the PAA and the SAT for predicting the performance of Puerto Rican students in mainland colleges isindispensable to the judicious use of these conversions.
It will be useful, finally, to describe the ways inwhich the conversions may and may not be used appropriately. A glaring misuse has already been alluded toabove: It would be entirely inappropriate to concludewithout further consideration that a student who hasearned a PAA-verbal score of 503 would therefore earnan sAT-verbal score of 319, were he or she to take it,simply because the table reads that these two scores arelisted as "equivalent." As already indicated above, thestudent might score lower than 319, depending on his orher facility in English. Thus, intelligent use of the tablerequires the additional knowledge of the student's facility in English. For this purpose scores on a test like theTest of English as a Foreign Language (TOEFL), measuring the student's understanding of written and spokenEnglish, would be useful. (Another possibility is a test,if one exists, that can accurately predict how rapidly astudent is likely to learn a foreign language.) If theSpanish-speaking student's TOEFL scores are high, indicating a level of facility in English equivalent to that ofa native speaker of English, these conversions may betaken at face value with appropriate cautions for theirgeneralizability, as described earlier. If, however, thestudent's English-language ability is not high, the conversions given here will be inapplicable to the degreethat English is an unfamiliar language to that student.Further, it would be expected that inasmuch as the SATverbal test depends more heavily on English languageability than does the sAT-mathematical test, the verbal
conversion for the PAA to the SAT will therefore be moresensitive to the inadequacies of the student's knOWledgeof English than will be true of the mathematical conversion. But these guidelines are at best based only oneducated intuition. As already indicated above, the continuing. conduct of validity studies will yield the bestguidance for the proper use of these scores.
REFERENCES
Angoff, W. H. 1966. Can useful general-purpose equivalencytables be prepared for different college admission tests? InTesting problems in perspective, ed. A. Anastasi. Washington, D.C.: American Council on Education, pp. 251-64.
Angoff, W. H. 1984. Scales, norms and equivalent scores.Princeton, N.J.: Educational Testing Service. Reprint ofchapter in Educational measurement, 2d ed., ed. R. L.Thorndike. Washington, D.C.: American Council on Education, 1971.
Angoff, W. H., and S. F. Ford. 1973. Item-rate interaction ona test of scholastic ability. Journal of Educational Measurement 10:95-106.
Angoff, W. H., and C. C. Modu. 1973. Equating the scales ofthe Prueba de Aptitud Academica and the Scholastic Aptitude Test. Research Report 3. New York: College Entrance Examination Board.
Boldt, R. F.1969. Concurrent validity of the PAA and SATfor bilingual Dade County high school volunteers. CollegeEntrance Examination Board Research and DevelopmentReport 68-69, No.3. Princeton, N.J.: Educational TestingService.
Cook, L. L., and D. R. Eignor. 1983. Practical considerationsregarding the use of item response theory to equate tests.In Applications of item response theory, ed. R. K.Hambleton. Vancouver: Educational Research Institute ofBritish Columbia.
Cook, L. L., D. R. Eignor, and N. S. Petersen. 1985. A studyof the temporal stability of item parameter estimates. ETSResearch Report 85-45. Princeton, N.J.: Educational Testing Service.
Levine, R. S. 1955. Equating the score scales of alternateforms administered to samples of different ability. Research Bulletin 23. Princeton, N.J.: Educational TestingService.
Lord, F. M. 1977. A study of item bias using item characteristic curve theory. In Basic problems in cross-culturalpsychology, ed. N. H. Poortinga. Amsterdam: Swits & Vitlinger.
Lord, F. M. 1980. Applications of item response theory topractical testing problems. Hillsdale, N.J.: Erlbaum.
Petersen, N. S. 1977. Bias in the selection rule: Biai in thetest. Paper presented at Third International Symposiumon Educational Testing, University of Leyden, The Netherlands.
Petersen, N. S., L. L. Cook, and M. L. Stocking. 1983. IRTversus conventional equating methods: A comparativestudy of scale stability. Journal of Educational Statistics8:137-56.
17