Equal Pay Review Report to the Executive April 2015 1 ... · PDF fileEqual Pay Review Report...
33
Equal Pay Report: Final May 2015 Page 1 Equal Pay Review Report to the Executive – April 2015 1. Context of the Equal Pay Review: 1.1 The University strives to ensure that it has a fair pay system that rewards staff with equal pay for carrying out equal work. 1.2 The equal pay review demonstrates the University’s continuing commitment to Gender Equality Duty as outlined in AU’s Gender Equality Scheme and subsequent single Equality Scheme. It is an important part of the University’s Strategic Equality Plan and our commitment to completing this work is identified in the Equalities Annual report 2014. It also forms part of the Framework Agreement and Joint Negotiating Committee for Higher Education (JNCHES) guidance for an EqPA to be carried out within 12 months of the introduction new pay and grading structure (see Equal Pay report May 2010), and periodically thereafter. 1.3 As part of this commitment, the university has carried out three equality pay audits since 2006. An initial equal pay review was carried out in January 2006 in order to highlight any significant problem areas in relation to pay that could be addressed in the short term and prior to or as part of introducing the Framework Agreement. The findings were that pay gaps greater than 5% in total pay were found in Lecturer B (current equivalent Hera Grade (HG) 8 and Clerical 6 (HG5). A further 5% pay gap was found in ‘Other Staff’. However, this pay gap was deemed to be unrepresentative as a range of posts and grades were used within this category. 1.4 The second equal pay review was conducted in May 2010 which followed the implementation of the Framework Agreement in April 2009. Its primary aim was to identify whether pay modernisation had successfully narrowed the gender pay gaps previously identified at the university. The work conducted through the Framework Agreement had a positive impact and the gaps identified in 2006 had been narrowed to within acceptable tolerances. However, the 2010 audit identified different areas of potential concern. These were in respect of staff on HERA Grade 1 (10.9 % gap), which was caused by pay enhancements for unsocial hours and overtime elements for males within the basic pay component, and Professors (9.0% gap). 1.5 The third equal pay review was part of the objectives in the HR Operational Action Plan for 2014/15 and an Equal Pay Audit Steering Group was established in February 2015 to oversee this work. This group comprised of Professor Kate Bullen, Director of Ethics & Equality (Chair), Heather Hinkin, Deputy Director of Human Resources, Rebecca Kularatne, HR Manager, Chris Swales, HR Data Manager, Hannah Jones, HR Officer (Project Team), Sam Morrison, HR Quality & Compliance Manager, Mererid Jones, Assistant Director of Finance and Trade Union representatives – Carol Parry, Lyndsey Roebuck and Diane Jones (i.e. Unite, UCU and Unison respectively). The outcomes of this review will be reported to the University Executive in April 2015, Professional Development, Staffing and Equalities Committee (PDSEC) in May 2015 and the Joint Consultative and Negotiating Committee (JCNC) in June 2015.
Transcript of Equal Pay Review Report to the Executive April 2015 1 ... · PDF fileEqual Pay Review Report...

V6: 01/03/10
Equal Pay Report: Final May 2015 Page 1
Equal Pay Review
Report to the Executive – April 2015
1. Context of the Equal Pay Review:
1.1 The University strives to ensure that it has a fair pay system that rewards staff with
equal pay for carrying out equal work.
1.2 The equal pay review demonstrates the University’s continuing commitment to Gender
Equality Duty as outlined in AU’s Gender Equality Scheme and subsequent single Equality
Scheme. It is an important part of the University’s Strategic Equality Plan and our
commitment to completing this work is identified in the Equalities Annual report 2014. It
also forms part of the Framework Agreement and Joint Negotiating Committee for Higher
Education (JNCHES) guidance for an EqPA to be carried out within 12 months of the
introduction new pay and grading structure (see Equal Pay report May 2010), and
periodically thereafter.
1.3 As part of this commitment, the university has carried out three equality pay audits since
2006. An initial equal pay review was carried out in January 2006 in order to highlight
any significant problem areas in relation to pay that could be addressed in the short term
and prior to or as part of introducing the Framework Agreement. The findings were that
pay gaps greater than 5% in total pay were found in Lecturer B (current equivalent Hera
Grade (HG) 8 and Clerical 6 (HG5). A further 5% pay gap was found in ‘Other Staff’.
However, this pay gap was deemed to be unrepresentative as a range of posts and
grades were used within this category.
1.4 The second equal pay review was conducted in May 2010 which followed the
implementation of the Framework Agreement in April 2009. Its primary aim was to
identify whether pay modernisation had successfully narrowed the gender pay gaps
previously identified at the university. The work conducted through the Framework
Agreement had a positive impact and the gaps identified in 2006 had been narrowed to
within acceptable tolerances. However, the 2010 audit identified different areas of
potential concern. These were in respect of staff on HERA Grade 1 (10.9 % gap), which
was caused by pay enhancements for unsocial hours and overtime elements for males
within the basic pay component, and Professors (9.0% gap).
1.5 The third equal pay review was part of the objectives in the HR Operational Action Plan
for 2014/15 and an Equal Pay Audit Steering Group was established in February 2015 to
oversee this work. This group comprised of Professor Kate Bullen, Director of Ethics &
Equality (Chair), Heather Hinkin, Deputy Director of Human Resources, Rebecca
Kularatne, HR Manager, Chris Swales, HR Data Manager, Hannah Jones, HR Officer
(Project Team), Sam Morrison, HR Quality & Compliance Manager, Mererid Jones,
Assistant Director of Finance and Trade Union representatives – Carol Parry, Lyndsey
Roebuck and Diane Jones (i.e. Unite, UCU and Unison respectively). The outcomes of
this review will be reported to the University Executive in April 2015, Professional
Development, Staffing and Equalities Committee (PDSEC) in May 2015 and the Joint
Consultative and Negotiating Committee (JCNC) in June 2015.

V6: 01/03/10
Equal Pay Report: Final May 2015 Page 2
2. Purpose of this Report
2.1 To outline the findings of the university’s third equal pay review;
2.2 To consider whether the measures taken by the university to close the pay gaps
identified in the 2010 review have been successful;
2.3 To identify any other potential pay issues and to benchmark the University’s progress
since May 2010;
2.4 To make recommendations to address any potential pay issues identified.
3. Methodology:
3.1 An equal pay review is an analysis of an organisation’s pay structure in order to identify
and eliminate any gaps that cannot satisfactorily be explained on grounds other than
gender. It involves five essential steps:
Comparing the pay of men and women doing equal work of equal value and identifying
any gender pay gaps in basic salary;
Comparing the pay of men and women doing equal work or work of equal value and
identifying any gender pay gaps in emoluments.
Carrying out similar analyses for other diversity strands where the institution has
sufficiently robust statistical data;
Explaining any significant equal pay gaps;
Developing an action plan to close any significant pay gaps.
3.2 Having reviewed the data set from the EqPA in 2010, it was established that, for a
number of reasons it was not possible to use the same data sets for the following
reasons: - A new Institute management structure was introduced in 2010; In 2012 a
new grade 10 Professorial grade was introduced; We now have a greater granularity of
data following the introduction of the HR/ Finance system, ABW in 2014. It is therefore
recommended that the data sets used for the EqPA 2015 are used as a benchmark for
future Equal pay audits; however the categorisation of staff within the University may
change as structures evolve.
3.3 The review also set out to consider any potential pay inequalities amongst Senior
Managers defined for the purpose of this audit as Heads of Professional Services, Heads
of Academic Institutes, Heads of Academic Departments and members of the Executive
Group. There are however a number of difficulties assessing gender pay gaps within
these sub groups:-
3.4 There is a fundamental difficulty in comparing the salaries of these groups on a ‘like for
like’ basis. Many of these managers are remunerated for their management role with a
standard honoraria paid on top of their salary which relates to their substantive post. The
level of salary will therefore differ depending on the nature and level of their substantive
post not their management role. This negates the purpose of the audit as it is
consequently not possible to accurately assess any pay gaps in respect of their
management role;
3.5 In respect of the Executive Group by virtue of their specialism it is not possible to make a
’like for like’ comparison for the purpose of identification of a gender pay gap i.e. they
are singleton posts. The salary levels of the members of the Executive group are
determined by the Remuneration Committee which uses UCEA sector benchmarking data
to determine salary levels which are in accordance with sector norms. Any meaningful

V6: 01/03/10
Equal Pay Report: Final May 2015 Page 3
audit of gender pay gaps of specialist posts at Executive level could only take place on a
sectoral basis.
3.6 For the reasons outlined in 3.4 and 3.5 it is not possible to include comparative data by
management group. Data has been assessed by salary grade i.e. 1-10 and data on
Institute Directors, Heads of Academic departments and Heads of Professional Services
Departments will be included in their respective pay grade.
3.7 It was decided to include Professors within the EqPA even though they are not included in
the pay modernisation structure, in order to ensure a fair and transparent process and in
recognition of the general employment issue of the lack of women in such senior
academic positions. The Vice-Chancellor who is a Professor has not been included in this
grouping because her salary is based on her substantive role as Vice-Chancellor.
3.8 The Equal Pay Report derives from the Equal Pay Act (EPA) and Code of Practice on Equal
Pay, but the same principles and techniques can be applied to other diversity strands
where sufficiently robust statistical data is available, for example, race, disability, age
and recorded Welsh language standards.
3.9 The Equalities & Human Rights Commission (EHRC) advises that differences of 5% or
more are indicative of potential systemic pay discrimination that should be investigated
as to their cause. The EHRC further advises that differences of between 3 - 5% should
also be further investigated, where they form part of a pattern (for example, all grade
pay gaps in favour of men, or of women), as such findings may also be indicative of
possible pay discrimination. Smaller differences below 3% do not need investigation
3.10 The equal pay audit (EqPA) data within the required format was provided by the HR Data
Manager and Finance.
4 Scope of the Review: Employees, Diversity Strands and Pay
Employees
4.1 Under the Equal Pay Act, an equal pay claim can be brought by an employee who seeks
to compare her/himself with any other employee undertaking equal or comparable work
of the opposite gender ‘in the same employment’. ‘Same employment’ generally refers to
employees within the same organisation. The EqPA should cover all employees of the
university, if it is to match the scope of the equal pay legislation and identify all risks.
4.2 In practice, ‘Work rated as equivalent’ is the most useful in carrying out an EqPA as it
allows evaluated grades to be used as the basis for statistical analysis. At AU, jobs
covered by pay modernisation were evaluated using the HERA evaluation system and
thus ‘Work rated as Equivalent’ was used, this term is adopted in contrast to the use of
‘like work’ within the first review conducted in 2006.
4.3 In 2010, the report omitted casual and hourly paid staff from the scope of the review,
mainly because they worked minimum hours, and were not always covered by the
central payroll system or the job evaluation exercise. However, due to the
implementation of the new HR/Payroll system (ABW), the current report was able to
analyse all staff data for those with contracted status employed on, or before, 1 January
2015 across each of the job families, which included non-HERA staff.

V6: 01/03/10
Equal Pay Report: Final May 2015 Page 4
4.4 On 1 January 2015 (the date of data extraction) there were 2046 active employment
contracts within the University. Of this number, 1028 were female staff and 1018 were
male staff.
4.5 For Aberystwyth EqPA, the parameters for the extraction of the data were primary and
secondary job records which included: (1) employees currently employed on a staff
contract on 1 January 2015 and (2) employees who had a payroll record full time
equivalent (FTE) hours and payroll record salary (per annum) both greater than zero.
5 Data Gathering
5.1 One of the primary concerns when conducting an EqPA is to ensure, as far as reasonably
practicable, the integrity of the data set being analysed. Since 2006, the university has
undertaken a number of exercises to validate data; for example, through the annual
HESA reporting, the introduction of Pobl Aber People in 2014 and the subsequent
verification of data exercise in January/February 2015 in readiness for this review have
greatly assisted the EqPA in this process.
5.2 The data used to form the EqPA was extracted from the ABW (HR/ Finance System).
5.3 The University will only request an employee to disclose their gender, ethnicity, recorded
disability, age and recorded Welsh language standard once they have applied for and
accepted a position at Aberystwyth University. The historical data extracted from the old
system (Cyborg) was both inaccurate and/ or out of date due to for example, lack of a
self-service function and limited capability of the system.
5.4 However, the new Pobl Aber People system allows employees to update their personal
information individually or via the HR Department.
5.5 To ensure the data was as accurate as possible and prior to extracting the data for this
report, staff were contacted via email and memos were advertised on departmental staff
notice boards to request that staff log on to Pobl Aber People to validate their ethnicity,
disability and Welsh language standard and to update all of their personal information in
readiness for this equal pay review. In addition, for those members of staff who did not
have access to a computer, or wanted some guidance on how to use the system to
update their record, drop in clinics were held by the HR Project Team across each of the
three campuses on the following dates:

V6: 01/03/10
Equal Pay Report: Final May 2015 Page 5
Date Time Location
Friday, 6th February 2015 11:00 –
12:00
Hugh Owen Training Room,
Hugh Owen Library (Penglais
Campus)
Monday, 9th February
2015
10:00 –
11:00
Computer Training Suite,
Stapledon Building
(Gogerddan Campus)
Wednesday, 11 February
2015
13:30 pm
14:30 pm
Room EM-B.12, Elystan
Morgan Building
(Llanbadarn Campus)
Friday, 13 February 2015 13:00 –
14:00
Hugh Owen Training Room,
Hugh Owen Library (Penglais
Campus)
6 Diversity Strands:
6.1 Ethnicity, disability, age and Welsh Language Standards were included in the EqPA as
Aberystwyth had sufficiently robust and comprehensive data to do so.
6.2 For the purposes of the EqPA, the categorisation used in relation to ethnicity was
essentially to distinguish ‘White’ from Black and Minority Ethnic (“BME”) employees.
Since 2010, the number of BME staff to disclose their ethnic status has risen from 3.3%
to 5.11% in January 2015.
6.3 In addition, the percentage number of staff to disclose a disability has risen from 3.8% in
2010 to 4.15% in January 2015.
6.4 The report also included data on Welsh language Standards as sufficient and robust data
was recorded for 74.4% of its employees. It was therefore possible to carry out the
analysis in exactly the same manner as for the other included diversity strands.
7 Reporting exemptions
7.1 In common with many other organisations in the UK, it was not possible to determine
whether inequalities exist because of sexual orientation, religion or belief as currently it
is not a requirement for staff to disclose such information.
7.2 For the purposes of this report it was not possible to include data that we could not
quantify or compare ‘like for like’. Therefore any miscellaneous payments that could not
be equated to in hours were not included in this report i.e. pay adjustments, non-
contractual payments, allowances etc. (please see Appendix A for a full list of pay
exemptions).
7.3 Whilst the report highlights pay comparisons between specific groups i.e. men and
women, the anonymity of staff included to identify such inequalities was upheld at all
times.

V6: 01/03/10
Equal Pay Report: Final May 2015 Page 6
8 Pay:
8.1 The Equal Pay Act applies to all contractual terms. Most equal pay claims relate to basic
pay, but can apply to any individual term, including pensions. The EqPA should therefore
cover basic pay plus any additional payments (for example, working pattern premium
payments, performance or merit payments, contractual benefits and pension
arrangements).
8.2 In higher education, the vast majority of the total pay bill relates to basic pay, unlike, for
instance, the health service where unsocial hour’s payments form a significant
percentage of the total. It was therefore agreed to focus the EqPA on basic pay, but to
collate data on other payments, to allow for further analysis.
9 Data Collation and Calculation:
9.1 The financial data required for this review included:
Basic pay details as at 1 January 2015
Total earnings as at 1 January 2015
Separate data on: Guaranteed overtime payments and allowances (excluding acting
up), working pattern payments, including shift pay, unsocial hours’ payments, on
call, standby or similar payments as at 1 January 2015.
9.2 The job and personal characteristics data needed included:
Payroll number
Gender, ethnicity, recorded disability, age and recorded Welsh language standards.
Job family
Hours of work
Job grade or pay scale
Contract type
9.3 In order to undertake the EqPA, it was necessary to compare ‘like with like’ and thus to
have all salary data using full time equivalent, basic salaries and total earnings.
9.4 In seeking to identify any gender pay gaps, the average pay of men and women in each
HERA evaluated grade, based on full-time equivalent annual salary, was calculated and
the difference between the two values identified.
10 Outcomes of the Gender Analysis:
10.1 Table 1: below summarises the gender profile of staff included within the EqPA, the
figures illustrate that there is an equal gender split across the University.
Female Male Total
Female %
of Total
Total
included in
the EqPA 1028 1018 2046 50.2%

V6: 01/03/10
Equal Pay Report: Final May 2015 Page 7
Table 2: Gender profile of the percentage of female and male staff within each grade:
Grade
% Female in
Grade
% Male in
Grade
NMW 57% 43%
NON1 60% 40%
Agricultural Wages
Board (AWB) Rates
AWB1 0% 100%
AWB2 50% 50%
AWB3 0% 100%
AWB4 0% 100%
AWB5 17% 83%
Legacy Staff Grades
BBSA 100% 0%
BBSB 29% 71%
BBSC 50% 50%
BBSD 52% 48%
BBSE 67% 33%
BBSF 50% 50%
Framework Agreement
using HERA
Grade 1 55% 45%
Grade 2 32% 68%
Grade 3 50% 50%
Grade 4 68% 32%
Grade 5 66% 34%
Grade 6 64% 36%
Grade 7 49% 51%
Grade 8 42% 58%
Grade 9 38% 62%
Grade 10 31% 69%
Professor 10% 90%
V6: 01/03/10
Equal Pay Report: Final May 2015 Page 8
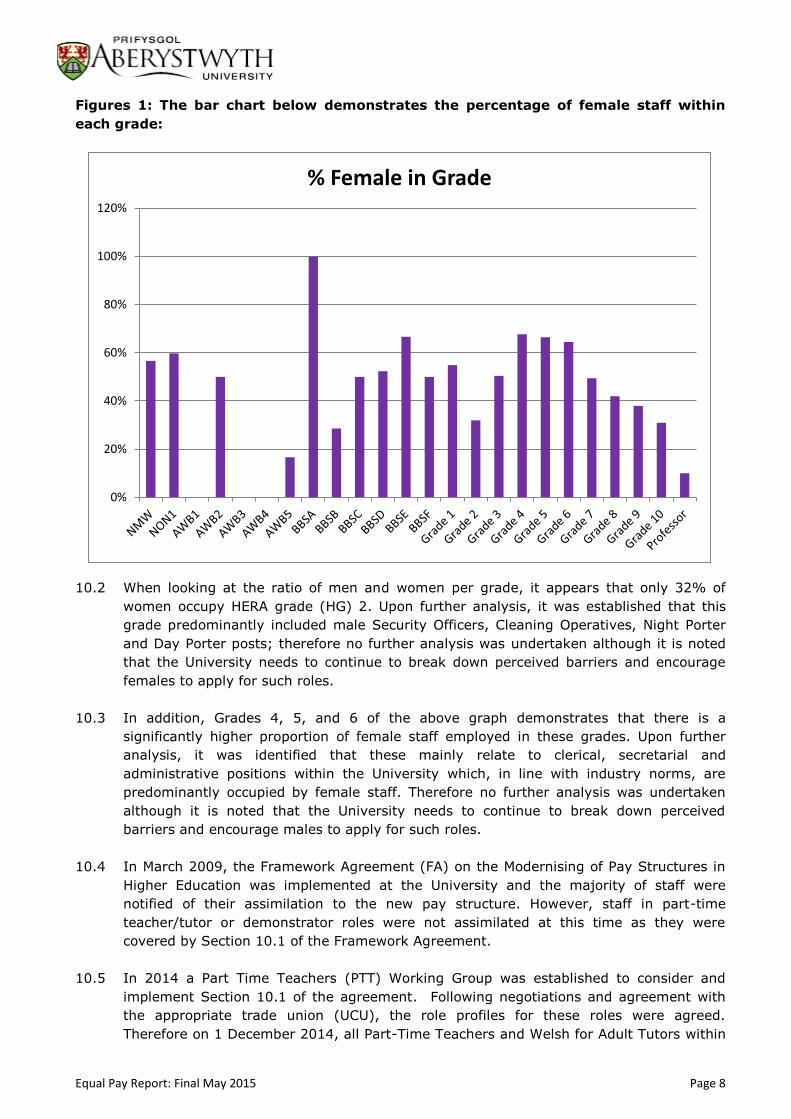
Figures 1: The bar chart below demonstrates the percentage of female staff within
each grade:
10.2 When looking at the ratio of men and women per grade, it appears that only 32% of
women occupy HERA grade (HG) 2. Upon further analysis, it was established that this
grade predominantly included male Security Officers, Cleaning Operatives, Night Porter
and Day Porter posts; therefore no further analysis was undertaken although it is noted
that the University needs to continue to break down perceived barriers and encourage
females to apply for such roles.
10.3 In addition, Grades 4, 5, and 6 of the above graph demonstrates that there is a
significantly higher proportion of female staff employed in these grades. Upon further
analysis, it was identified that these mainly relate to clerical, secretarial and
administrative positions within the University which, in line with industry norms, are
predominantly occupied by female staff. Therefore no further analysis was undertaken
although it is noted that the University needs to continue to break down perceived
barriers and encourage males to apply for such roles.
10.4 In March 2009, the Framework Agreement (FA) on the Modernising of Pay Structures in
Higher Education was implemented at the University and the majority of staff were
notified of their assimilation to the new pay structure. However, staff in part-time
teacher/tutor or demonstrator roles were not assimilated at this time as they were
covered by Section 10.1 of the Framework Agreement.
10.5 In 2014 a Part Time Teachers (PTT) Working Group was established to consider and
implement Section 10.1 of the agreement. Following negotiations and agreement with
the appropriate trade union (UCU), the role profiles for these roles were agreed.
Therefore on 1 December 2014, all Part-Time Teachers and Welsh for Adult Tutors within
0%
20%
40%
60%
80%
100%
120%
% Female in Grade

V6: 01/03/10
Equal Pay Report: Final May 2015 Page 9
the School of Education and Lifelong Learning (SELL) and Welsh for Adults (WfA) were
informed that they had been assimilated to a Teaching and Scholarship Level 1B role
profile. This equates to Hera Grade 6 on the University’s pay scale. A high proportion of
part-time teacher roles within SELL are occupied by females which could also contribute
to the higher percentage of females now identified in this grade. Phase 2 of the PTT
Working Group will entail the assimilation of PTT in other institutes and departments and
further analysis will be undertaken once this work has been completed.
10.6 Substantial efforts have been made by the University to promote gender equality at
professorial level; the percentage of female professors has risen from 9.4% to 10%
although clearly this level is still far too low. The University will continue to strive to
break down perceived barriers and encourage females to apply for such roles when
advertised. Greater efforts will be made to encourage more females to apply for
promotion to Professor through the University’s Academic Promotions process.
10.7 Biotechnology and Biological Sciences Research Council (BBSRC) Grade A contains a very
small pool of staff that are maintained as part of a TUPE transfer and therefore it is not
possible to influence the gender split in this particular pay grade.

V6: 01/03/10
Equal Pay Report: Final May 2015 Page 10
Table 3: Full Time & Part-Time Gender pay analysis by Grade:
Grade
Female FT as
% of Male FT
Female PT
as % of
Male PT
NMW - 1.44%
AWB1 - -
AWB2 - -
AWB3 - -
AWB4 - -
AWB5 - -
BBSA - -
BBSB 1.98% -
BBSC 5.00% -5.26%
BBSD 0.82% -9.52%
BBSE 2.03% -
BBSF -0.41% -
Grade 1 -0.47% 0.14%
Grade 2 -2.48% 1.39%
Grade 3 -1.32% 0.57%
Grade 4 0.78% 2.35%
Grade 5 0.21% -0.13%
Grade 6 -1.75% -1.40%
Grade 7 -0.41% 1.95%
Grade 8 -0.13% -0.67%
Grade 9 -1.93% -6.18%
Grade 10 0.27% -0.49%
Professor -8.68% -

V6: 01/03/10
Equal Pay Report: Final May 2015 Page 11
Figures 2: The bar chart below shows Female full-time average hourly pay as a
percentage of male full time average hourly pay by Grade:
11 Gender Data Conclusions:
11.1 The EqPA showed that there were no significant gender pay gaps within the evaluated
grades, i.e. no evidence of systemic pay discrimination, and that the overall gap was
primarily the result of the distribution of men and women across the grades.
11.2 In 2010, the equal pay review highlighted that there were two areas of pay gaps evident
at the top and bottom of the HERA pay scale, i.e. HG1 at -10.9% and professors at
-9.0%. Upon further investigation, it was established that those posts within HG1 mainly
included night porters, day porters and cleaners that received pay enhancements for
unsocial hours and overtime. In 2015, it is pleasing to report that the gender pay gap at
HG1 has narrowed to just 0.47%, therefore no further investigation was undertaken.
11.3 The gender pay gap amongst professorial staff decreased from 9% in 2010 to 8.68% in
2015. Upon further analysis, it was found that a large proportion of the female staff
within this group were either newly appointed or recently promoted via the Academic
Promotions process. In 2012 a new grade 10 professorial grade was introduced with
incremental points. Newly appointed professors normally commence at the lowest point
and therefore female professors in comparison to a higher proportion of male professors
will be on a lower point due to their respective lengths of service in post. It is more likely
that male Professors had progressed through the Professorial scale through the
Accelerated Increments and Contribution Points (AICP) policy or had been appointed
prior to the professorial scale being introduced in 2012.
11.4 The pay gap identified is similar to that identified in the latest data set issued as part of
the Joint Higher Education Trade Union Pay Equality Claim. This data shows that, in
2012/13, female professors were paid an average of 6% less than the average paid male
professor. This compares with 8.68% at Aberystwyth University. However among all
academic staff, including professors, the gap is much more pronounced, at 12.6%
difference per year. The gender pay gap amongst academic staff including professors at
-12.00%
-10.00%
-8.00%
-6.00%
-4.00%
-2.00%
0.00%
2.00%
4.00%
6.00%
Female FT Average Hourly Pay as a % of Male FT Average Hourly Pay By Grade

V6: 01/03/10
Equal Pay Report: Final May 2015 Page 12
Aberystwyth University is 7%; recognising that there is more work to be done to
eliminate the pay gap.
11.5 The remuneration of managers in Institute Director and Head of Academic Department
roles with an honorarium is problematic in determining the equitable remuneration of
managers who undertake such a role for the reasons outlined in para 3.4 and 3.5. It may
be a particular issue for women in an academic role who aspire to and are being
encouraged by the University to consider an academic management career as they may
be more likely to be in lecturer or senior lecturer position. An alternative approach to the
remuneration of these groups should be considered and this is referred to in the
Recommendations.
11.6 Although senior posts continue to be predominantly occupied by men, since 2012, the
University has made positive steps towards encouraging academic staff (both men and
women) to apply for promotion to Senior Lecturers, Readers or Chairs through the
University’s new academic promotions process. Over recent years it has been
encouraging to see a rise of successful female applications and it is hoped that this will
only continue each year. A detailed breakdown of the female success rate since 2012 can
be seen in the table 4 below:
2014 Applied Successful
Male 44 58.6% 31 70.4%
Female 31 41.3% 23 74%
Total 75 54 72%
2013 Applied Successful
Male 33 78.5% 23 69.6%
Female 9 21.4% 7 77.7%
Total 42 30 71.4%
2012 Applied Successful
Male 26 61.9% 16 61.5%
Female 16 38.9% 11 68.7%
42 27 64.2%
11.7 Also in 2012, the introduction of the Accelerated Increments and Contribution Points
(AICP) policy and procedure, highlighted that it would be difficult to apply to Professorial
staff in a transparent way under its historic arrangements, i.e. in the absence of a pay
progression process for Professorial staff. Therefore a professorial pay band was
introduced which drew on comparable data from the UCEA Remuneration Survey of
Higher Education Institutions. Progression through the points on this salary band
depends on excellent performance in accordance with the criteria detailed in the

V6: 01/03/10
Equal Pay Report: Final May 2015 Page 13
Accelerated Increments and Contribution Point policy and evidenced through the Staff
Development Performance Review process.
Figures 3: The bar chart below demonstrates Female part-time average hourly pay as
a percentage of male Part-time average hourly pay by Grade. The bars highlighted in
red indicate that there is a pay gap equal to or greater than 5%:
12.1 This report has highlighted that there are three significant pay gaps greater than 5%
within grades BBSC, BBSD and HG 9 for part time staff.
12.2 Grades BBSC and BBSD each contain a very small pool of staff that are maintained as
part of a TUPE transfer. The gender pay gaps within these grades are accounted for by
the distribution of males at the higher end of the salary band due to their length of
service in post therefore, any changes can alter the average pay gap of females
significantly. While starting dates have not been included for this review, it may be useful
to do so in the future.
12.3 The University is unable to influence the profile of Legacy staff as they are not on the
Aberystwyth University pay spine. However, a large number of BBRSC Legacy staff have
now transferred across to AU terms and conditions and thus the pool of staff is a
diminishing one.
12.4 The above audit showed that there is a -6.18% pay gap within HG 9. Further
investigation showed that a number of female staff employed within this grade were
newly promoted at the bottom point of grade 9, therefore it is anticipated that this pay
gap will erode with incremental progression.
-12.00%
-10.00%
-8.00%
-6.00%
-4.00%
-2.00%
0.00%
2.00%
4.00%
NMW BBSC BBSD Grade1
Grade2
Grade3
Grade4
Grade5
Grade6
Grade7
Grade8
Grade9
Grade10
Female PT Average Hourly Pay as % of Male PT Average Houlrly Pay By Grade

V6: 01/03/10
Equal Pay Report: Final May 2015 Page 14
Diversity Data Conclusions:
Ethnicity: Table 5: Percentage number of BME staff in grade:
Grade % of BME in
Grade
NMW 6.7%
NON1 4.6%
BBSE 10.0%
BBSF 16.7%
Grade 1 9.7%
Grade 2 6.4%
Grade 3 3.6%
Grade 4 3.2%
Grade 5 4.5%
Grade 6 4.0%
Grade 7 5.8%
Grade 8 5.9%
Grade 9 5.0%
Grade 10 2.4%
Professor 4.4%
Grand Total 5.1%

V6: 01/03/10
Equal Pay Report: Final May 2015 Page 15
Figures 4: The bar chart below illustrates the percentage number of BME’s in each
grade:
0.0%
2.0%
4.0%
6.0%
8.0%
10.0%
12.0%
14.0%
16.0%
18.0%
% of BME in Grade

V6: 01/03/10
Equal Pay Report: Final May 2015 Page 16
Table 6: BME average pay as a percentage of non-BME Average pay:
Grade BME Non BME BME Average as a % of Non-
BME Average
NMW £ 6.50 £ 6.37 2%
BBSE £ 18.85 £ 19.60 -4%
BBSF £ 23.40 £ 24.80 -6%
Grade 1 £ 7.46 £ 7.44 0%
Grade 3 £ 8.80 £ 8.75 1%
Grade 4 £ 10.12 £ 10.11 0%
Grade 5 £ 11.37 £ 12.08 -6%
Grade 6 £ 15.66 £ 15.95 -2%
Grade 7 £ 18.75 £ 18.50 1%
Grade 8 £ 22.06 £ 23.88 -8%
Grade 9 £ 26.93 £ 24.43 10%
Grade 10 £ 30.65 £ 30.48 1%
Professor £ 39.83 £ 38.76 3%
Grand Total £ 16.16 £ 15.13 7%
13.1 The above table highlights that there is a -6% pay gap within grade BBSF. As stated in
paragraph 12.3, the University is unable to influence the profile of Legacy staff as they
are not on the Aberystwyth University pay spine.
13.2 A -6% pay gap is also apparent within HG 5. Further investigation showed that this grade
contains a very small pool of disclosed BME staff; therefore any changes can alter the
average pay gap of this group significantly. Upon further analysis it was established that
a small number of staff within this group were new appointees and therefore had not
benefitted yet from incremental progression.
13.3 A 10 % positive pay gap is evident within the Grade 9 category. This is currently being
investigated further.
13.4 There were no other significant pay gaps or discrimination issues in relation to ethnicity.
This was the result of the relatively even distribution of black and minority ethnic staff
across academic as well as non-academic grades. Overall the analysis for all employees
was as follows:

V6: 01/03/10
Equal Pay Report: Final May 2015 Page 17
Figures 5: The bar chart below shows ‘BME’ Average Pay as percentage of Non-BME
Average pay:
-10%
-8%
-6%
-4%
-2%
0%
2%
4%
6%
8%
10%
12%
BME Average as a % of Non-BME Average Pay

V6: 01/03/10
Equal Pay Report: Final May 2015 Page 18
14 Welsh Language Standards:
14.1 For the purposes of this report, the definition of a Non-Welsh Language speaker falls
within standards A to B. The level of Welsh Language speakers fall within standards ‘C to E’.
Table 7: Percentage number of staff who have disclosed a Welsh Language Standard:
Grade A B C CH D DD E
No Standard Recorded
NMW 41.7% 8.3% 5.0% 3.3% 10.0% 31.7%
NON1 40.8% 12.1% 1.7% 0.6% 2.3% 8.6% 33.9%
AWB1 100.0%
AWB2 100.0%
AWB3 100.0%
AWB4 100.0%
AWB5 33.3% 66.7%
BBSA 33.3% 66.7%
BBSB 35.7% 7.1% 7.1% 7.1% 14.3% 28.6%
BBSC 16.7% 8.3% 8.3% 66.7%
BBSD 23.8% 28.6% 9.5% 28.6% 9.5%
BBSE 41.7% 16.7% 8.3% 8.3% 25.0%
BBSF 33.3% 16.7% 16.7% 33.3%
Grade 1 40.6% 10.3% 4.5% 0.6% 7.1% 36.8%
Grade 2 23.4% 16.3% 9.9% 1.4% 9.9% 39.0%
Grade 3 24.3% 17.1% 14.4% 3.6% 0.9% 21.6% 18.0%
Grade 4 25.2% 16.1% 15.5% 1.3% 0.6% 22.6% 18.7%
Grade 5 23.9% 11.0% 13.5% 0.0% 0.6% 1.9% 21.3% 27.7%
Grade 6 24.6% 12.3% 9.4% 1.8% 0.7% 26.1% 24.6%
Grade 7 35.1% 14.4% 6.9% 0.6% 21.8% 21.3%
Grade 8 36.0% 16.1% 8.5% 1.3% 18.6% 20.3%
Grade 9 49.0% 13.0% 7.0% 1.0% 18.0% 19.0%
Grade 10 69.0% 19.0% 2.4% 11.9% 19.0%
Professor 55.6% 14.4% 5.6% 2.2% 12.2% 27.8%

V6: 01/03/10
Equal Pay Report: Final May 2015 Page 19
Figures 6: This bar chart demonstrates the percentage number of staff who have
disclosed a Welsh Language Standard.
0.0%
10.0%
20.0%
30.0%
40.0%
50.0%
60.0%
70.0%
80.0%
90.0%
100.0%
A B C CH D DD E No Standard Recorded

V6: 01/03/10
Equal Pay Report: Final May 2015 Page 20
Table 8: Welsh Speakers - Standards (C-E) as a percentage of Non welsh speakers (A-
B) average hourly pay:
Grade
Welsh
Speakers (C
Ch D DD E)
as a % of
Non Welsh
Speakers
NMW -2%
AWB1 0%
AWB2 0%
AWB3 0%
AWB4 0%
AWB5 0%
BBSA 0%
BBSB 1%
BBSC 0%
BBSD 2%
BBSE -1%
BBSF -1%
Grade 1 0%
Grade 2 0%
Grade 3 0%
Grade 4 0%
Grade 5 0%
Grade 6 1%
Grade 7 0%
Grade 8 -1%
Grade 9 -1%
Grade 10 3%
Professor -2%
14.2 No significant pay gaps of -5% or more were identified within this category. The majority
pattern of pay gaps were in favour of Welsh speaking employees, and may result from
those with recorded Welsh Language standards C to E also having relatively long service
and thus being towards the top of the respective pay grades.

V6: 01/03/10
Equal Pay Report: Final May 2015 Page 21
Figures 7: The bar chart below demonstrates Welsh Speakers - Standards (C-E)
average hourly pay as a percentage of Non welsh speakers average hourly pay:
-3%
-2%
-1%
0%
1%
2%
3%
4%
Welsh Speakers (C Ch D DD E) as a % of Non Welsh Speakers

V6: 01/03/10
Equal Pay Report: Final May 2015 Page 22
15. Disability:
Table 9: Percentage number of staff with a disclosed disability per grade:
Grade
Disabled Average Pay as %
of Non Disabled Average
Pay
NMW 3.6%
BBSC -0.2%
BBSF 5.1%
Grade 1 -0.3%
Grade 2 1.0%
Grade 3 4.9%
Grade 4 1.8%
Grade 5 0.5%
Grade 6 0.3%
Grade 7 1.4%
Grade 8 -5.5%
Grade 9 0.2%
Grade 10 0.8%
Professor -0.9%

V6: 01/03/10
Equal Pay Report: Final May 2015 Page 23
Figures 8: The bar chart below demonstrates the percentage number of staff with a
disclosed disability per grade:
15.1 On 1 January 2015, 88 staff members were recorded as having a disclosed disability,
which represents 4% of the overall total staff figure. It is pleasing to report that there
has been a steady rise in the number of staff who have declared a disability (2.73% in
2007 and 3.8% in 2010).
0.0%
2.0%
4.0%
6.0%
8.0%
10.0%
12.0%
14.0%
16.0%
18.0%
% With a Disclosed Disability in the Grade

V6: 01/03/10
Equal Pay Report: Final May 2015 Page 24
Table 10: Disabled average pay as a percentage of Non-Disabled average pay:
Grade
Disabled Average Pay as % of Non Disabled
Average Pay
NMW 3.6%
AWB1 N/A
AWB2 N/A
AWB3 N/A
AWB4 N/A
AWB5 N/A
BBSA N/A
BBSB N/A
BBSC -0.2%
BBSD N/A
BBSE N/A
BBSF 5.1%
Grade 1 -0.3%
Grade 2 1.0%
Grade 3 4.9%
Grade 4 1.8%
Grade 5 0.5%
Grade 6 0.3%
Grade 7 1.4%
Grade 8 -5.5%
Grade 9 0.2%
Grade 10 0.8%
Professor -0.9%
15.2 There are no significant pay gaps or discrimination issues in relation to disability.

V6: 01/03/10
Equal Pay Report: Final May 2015 Page 25
Figures 9: The bar chart below shows the disabled average pay per grade as a
percentage of Non-Disabled average pay per grade:
Figures 10: Percentage number of staff with a disclosed disability per age group:
15.3 The above bar chart does not indicate that an aging population has any correlation to
higher disclosed disabilities. However it does suggest that staff within an older age
bracket may feel more confident to disclose such information.
-8.0%
-6.0%
-4.0%
-2.0%
0.0%
2.0%
4.0%
6.0%
Disabled Average Pay as % of Non Disabled Average Pay
0%
1%
2%
3%
4%
5%
6%
7%
Under 21 21-30 31-40 41-50 51-60 61-65 Over 65 GrandTotal
Disclosed Disability
Disclosed Disability

V6: 01/03/10
Equal Pay Report: Final May 2015 Page 26
16. Age:
Table 11: percentage number of employees per age/ grade:
Grade Under 21 21-30 31-40 41-50 51-60 61-65 Over 65
NMW 15.0% 63.3% 10.0% 5.0% 3.3% 0.0% 3.3%
NON1 7.5% 35.1% 16.7% 18.4% 14.4% 6.3% 1.7%
AWB1 0.0% 100.0% 0.0% 0.0% 0.0% 0.0% 0.0%
AWB2 0.0% 100.0% 0.0% 0.0% 0.0% 0.0% 0.0%
AWB3 0.0% 0.0% 0.0% 0.0% 100.0% 0.0% 0.0%
AWB4 0.0% 33.3% 0.0% 33.3% 33.3% 0.0% 0.0%
AWB5 0.0% 50.0% 0.0% 16.7% 33.3% 0.0% 0.0%
BBSA 0.0% 0.0% 0.0% 66.7% 0.0% 0.0% 33.3%
BBSB 0.0% 0.0% 14.3% 28.6% 35.7% 21.4% 0.0%
BBSC 0.0% 0.0% 16.7% 41.7% 33.3% 8.3% 0.0%
BBSD 0.0% 0.0% 4.8% 57.1% 28.6% 9.5% 0.0%
BBSE 0.0% 0.0% 8.3% 16.7% 75.0% 0.0% 0.0%
BBSF 0.0% 0.0% 0.0% 33.3% 50.0% 16.7% 0.0%
Grade 1 11.0% 28.4% 13.5% 18.7% 20.0% 6.5% 1.9%
Grade 2 5.7% 27.0% 15.6% 26.2% 17.7% 6.4% 1.4%
Grade 3 0.9% 44.1% 13.5% 21.6% 17.1% 1.8% 0.9%
Grade 4 1.3% 21.9% 25.8% 25.2% 20.6% 4.5% 0.6%
Grade 5 0.0% 20.6% 27.7% 23.9% 21.9% 3.2% 2.6%
Grade 6 0.0% 12.3% 26.1% 25.7% 23.2% 9.4% 3.3%
Grade 7 0.0% 13.8% 36.7% 24.9% 19.1% 4.1% 1.4%
Grade 8 0.0% 1.3% 29.4% 39.5% 23.1% 4.6% 2.1%
Grade 9 0.0% 1.0% 19.0% 53.0% 25.0% 7.0% 2.0%
Grade 10 0.0% 0.0% 17.6% 49.0% 27.5% 3.9% 2.0%
Professor 0.0% 0.0% 4.7% 34.0% 43.4% 11.3% 6.6%
Grand Total 2.3% 17.9% 22.5% 27.7% 21.9% 5.7% 2.1%

V6: 01/03/10
Equal Pay Report: Final May 2015 Page 27
Figures 11: The bar chart below demonstrates the percentage number of employees
per age/ grade:
-20.0%
-15.0%
-10.0%
-5.0%
0.0%
5.0%
10.0%
15.0%
Under 21 21-30 31-40 41-50 51-60 61-65 Over 65

V6: 01/03/10
Equal Pay Report: Final May 2015 Page 28
Table 12: Female (average pay) by age range as a percentage of Male (average pay)
by age range:
Female by age range as a % of Male by age range
Grade Under 21 21-30 31-40 41-50 51-60 61-65 Over 65
NMW 6.0% 0.2% 0.0% 0.0%
NON1
AWB1
AWB2 0.0%
AWB3
AWB4
AWB5 0.0%
BBSA
BBSB -3.1% 4.1% 3.4%
BBSC 1.2% 12.8%
BBSD -2.2% 0.2% -12.0%
BBSE 3.1%
BBSF
Grade 1 -0.4% -0.3% 0.3% 0.3% 0.1% -0.3% 0.0%
Grade 2 0.0% 0.3% 0.5% -0.3% -0.7% 0.0% -2.6%
Grade 3 0.2% -1.0% -0.1% -2.0% 8.7%
Grade 4 2.9% -2.7% 0.9% 1.3% 1.1% -0.5%
Grade 5 1.2% -0.5% 0.7% -2.3% -1.9% -1.9%
Grade 6 -1.3% -0.7% -3.7% -0.4% 3.1% -1.7%
Grade 7 -0.1% -0.4% -0.1% -0.2% -3.2% 9.0%
Grade 8 4.5% 1.2% 8.3% -1.4% -4.4%
Grade 9 -2.7% 1.8% 4.1% -8.6%
Grade 10 -1.0% -0.7% 6.9%
Professor -3.7% -9.9% -6.2% -15.7% 8.0%

V6: 01/03/10
Equal Pay Report: Final May 2015 Page 29
Figures 12: The Bar Chart below demonstrates Female (average pay) by age range as
a percentage of Male (average pay) by age range:
16.1 The above audit showed that there is a -12% pay gap in the (61-65) age bracket within
grade BBSD. Further analysis showed that this grade included a very small data set
which was skewed by the length of service of one individual within the grade. Therefore
no further analysis was undertaken. This group of staff TUPE transferred to Aberystwyth
University in 2009 on their pre-existing terms and conditions and grade structure
therefore the University is unable to influence the profile of this group of staff.
16.2 Grade 9 demonstrates that there is an -8.6% pay gap within the (61-65) age bracket.
Further investigation showed that there were a number of newly appointed employees
within this grade; therefore the average pay of female staff was lower due to the length
of service in post.
16.3 The findings of this report show a pay gap of -6.2% pay gap within the (51-60) age
bracket. The pay gap can be explained by a small number of females within this age
bracket that were newly promoted through the academic promotions process. It is
anticipated that this pay gap will erode with incremental progression through the AICP
process.
16.4 The above audit also shows that there is a -15.7% pay gap within the (61-65)
Professorial age bracket. This data set includes a very small cohort of staff with a very
small female population; therefore it is difficult to draw any meaningful conclusions from
this age bracket.
-20.0%
-15.0%
-10.0%
-5.0%
0.0%
5.0%
10.0%
15.0%
Under 21 21-30 31-40 41-50 51-60 61-65 Over 65

V6: 01/03/10
Equal Pay Report: Final May 2015 Page 30
16.5 It is pleasing to note that following the gender pay gap at Grade 10 is negligible.
17. Recommendations:
17.1 The EqPA had provided assurance that the HERA pay modernisation project has
continued to deliver greater pay equality and thus reduced risks of successful equal pay
claims within those covered by that exercise.
17.2 The 2015 EqPA has demonstrated that there were no significant gender pay gaps within
HERA grades 1 to 10, groups outside of the HERA Framework agreement such as BBRSC
legacy staff, and those paid on national minimum wage, i.e. there was no evidence of
systemic pay discrimination.
17.3 It was positive to conclude that the 5% pay gap found within HG 1 in 2010, has
narrowed, and is no longer an area of significant concern. However, to avoid future
gender inequalities in pay, the report has highlighted that that further work should be
carried out to break down perceived gender barriers across HERA grades 1 to 6 when
seeking to recruit to posts in these grades.
17.4 Pay gaps of 5% or more were identified within the protected characteristics – gender,
age, ethnicity, and disability. However, upon further investigation it was found that there
was no evidence of systemic pay discrimination as pay gaps were due to recent
appointees and length of service in grade.
17.5 Although the gender pay gap of full time Professors has decreased to -8.68%, this cohort
of staff remains a strong area of concern and strategies must be formed to reduce these
pay gaps. The report has highlighted that only a small number of professors have
disclosed a disability, Welsh language standard and ethnic origin therefore work should
be carried out to engage with staff to encourage them to disclose such information so
that realistic results may be produced when analysing inequalities in pay.
17.6 The report has highlighted a fundamental flaw in any assessment of those management
posts remunerated with honoraria. The level of the honoraria is the same for each
member of staff in their respective groups. However, the substantive salary – which does
not relate to the management post will differ, hence a meaningful comparison is not
possible. It is recommended that a report is submitted to Remuneration Committee to
highlight the issues arising from the equal pay audit and to request that consideration is
given to a review of the method of remuneration for management roles.
17.7 The report has highlighted a pay gap within the Professorial group; it is however
encouraging to see that this pay gap can be accounted for by newly promoted or recently
appointed female staff. The academic promotions process was introduced in 2012 and
since its re-launch we have seen a rise in successful female applications each year. It is
hoped that this revised process coupled with the number of successful female job
applicants will help to erode significant pay gaps by the next equal pay review.

V6: 01/03/10
Equal Pay Report: Final May 2015 Page 31
18. Action plan
18.1 A number of potential equality issues were identified in this report therefore strategies to
address these are incorporated within the following Action Plan:
Action Timescal
e
Lead
To encourage all staff to record their ethnic and disability
status as well as Welsh language Standard via Pobl Aber
People and attend training events on the system (see
section 5).
Ongoing-
Review in
January
2016
HR Project Team
via Pobl Aber
People Training
sessions.
To evaluate categories excluded from the HERA
Framework Agreement. To assimilate these categories in
line with new or existing HERA role profiles and pay
grades and to undertake EqPAs once this process has
concluded (See Section 10).
31
January
2016
Deputy Director
of HR & HR
Project Team.
Further work should be carried out to encourage BBRSC
legacy staff to join AU T&Cs i.e. greater emphasis should
be placed on positive promotion to HERA T&Cs through
AUs academic promotions process (See Section 12).
20
December
2015
Director of HR,
the Executive,
PDSEC, HR
Business Partner
IBERS.
The Athena Swann group with the Director of HR to
consider strategies to address the gap within professorial
and Senior grades (see section, 11, 13, 14, 15)
2015 Director of HR.
To monitor any pay anomalies identified in this report
through conducting an Equal Pay review in 3 years’ time
(see sections 12, 13 &16).
Annual
review of
progress
in January
2016 and
2017
Deputy Director
of HR, HR
Project Team,
the Executive,
PDSEC.
HERA analysis should continue for all new posts at
Aberystwyth University to avoid the potential for future
pay inequalities amongst staff to arise.
Ongoing HR Teams.
To review categories of reporting for future EqPA’s as
structures evolve (see section 3).
January
2017
EqPA steering
group
18.2 Many of these actions relate to wider equality issues than pay, for example, promotion
opportunities, recruitment policies. The EqPA has allowed the University to inform policy
development, in both pay and non-pay aspects of the organisation’s gender equality
agenda.

V6: 01/03/10
Equal Pay Report: Final May 2015 Page 32
18.3 Other ongoing tasks arising from this EqPA which could positively impact on gender
equality include the following:
Action Timescale Lead
To review re-grading and promotion processes in order to
identify and eliminate any gender bias that may exist and
ensure transparent and fair processes via unconscious bias
training.
2015
HR Director.
To restate the principles of access to training and career
development across the University.
2015 CDSAP.
To continue the monitoring of mandatory e-learning
diversity training for those involved in recruitment/selection
appointment processes and develop further recruitment and
selection training for all staff.
Ongoing HR Project Team/
HR Teams.
To consider new ways to promote and support family
friendly policies to all staff considering the outcomes of the
staff health and wellbeing survey 2015 and HR Enablers
Group. In particular to review the scope of flexible working
practices.
2015 Deputy Director of
HR, HR Project Team
in conjunction with
TU’s.
To ensure those staff with a protected characteristic
continue to receive support to develop their careers, e.g.
mentoring schemes, women’s roundtable activities,
training, Athena Swan (women in science, engineering and
technology) and LGBT group.
Ongoing HR Department and
PDSEC.

V6: 01/03/10
Equal Pay Report: Final May 2015 Page 33
Appendix A
List of pay exclusions
Pay scale Excluded
OPENDAY
Position Codes Excluded:-
One Off Open Day – Generic
One Off Payment – Generic
Payment & Deductions Excluded:-
Time Off In Lieu (Payment)
Pay in Lieu of Notice
Unpaid Leave Adjustment
Regular pay adjustment
Maternity Pay
Sick Pay
Plant & Animal Care
Travel Expenses
Acting Up/ Responsibility Allowance
Examiners Fees
Pensionable Uplift
Non- Pensionable Uplift
Friends and Family allowance
Part-Time Teaching Instalments
Arrears of pay
Back Pay
Dog Allowance
Miscellaneous Payments
CWPSI Payments
Industrial strike Action
Residential Support Co-ordinators
P1's
Generic One off Payments
Student Exam invigilators
Meeting Fees
Holiday pay
Lecturer fees


![[P.S. Bullen] Handbook of Means and Their Inequali(BookFi.org)](https://static.fdocuments.in/doc/165x107/55cf995c550346d0339cf932/ps-bullen-handbook-of-means-and-their-inequalibookfiorg.jpg)