EQAL PAY NEW 020613 - equalpayday.ch · 0 - 3 3 - 5 5 - 10 10 - 20 20 or more Annual Total...
44
MERCER TOTAL REMUNERATION SURVEYS 2012 A closer look at regional, industry-specific and gender pay differences in Switzerland Christa Zihlmann, Geneva
Transcript of EQAL PAY NEW 020613 - equalpayday.ch · 0 - 3 3 - 5 5 - 10 10 - 20 20 or more Annual Total...
MERCERTOTAL REMUNERATION SURVEYS 2012A closer look at regional, industry-specific and gender pay differences in Switzerland
Christa Zihlmann, Geneva
1MERCER 1
A global leader in human resource consulting and related services:
• $3.8 billion in revenue
• 65-year history
• 4 business segments
• Offices in more than 40 countries
• 20,000+ colleagues
Mercer
WHO WE ARE
2MERCER 2
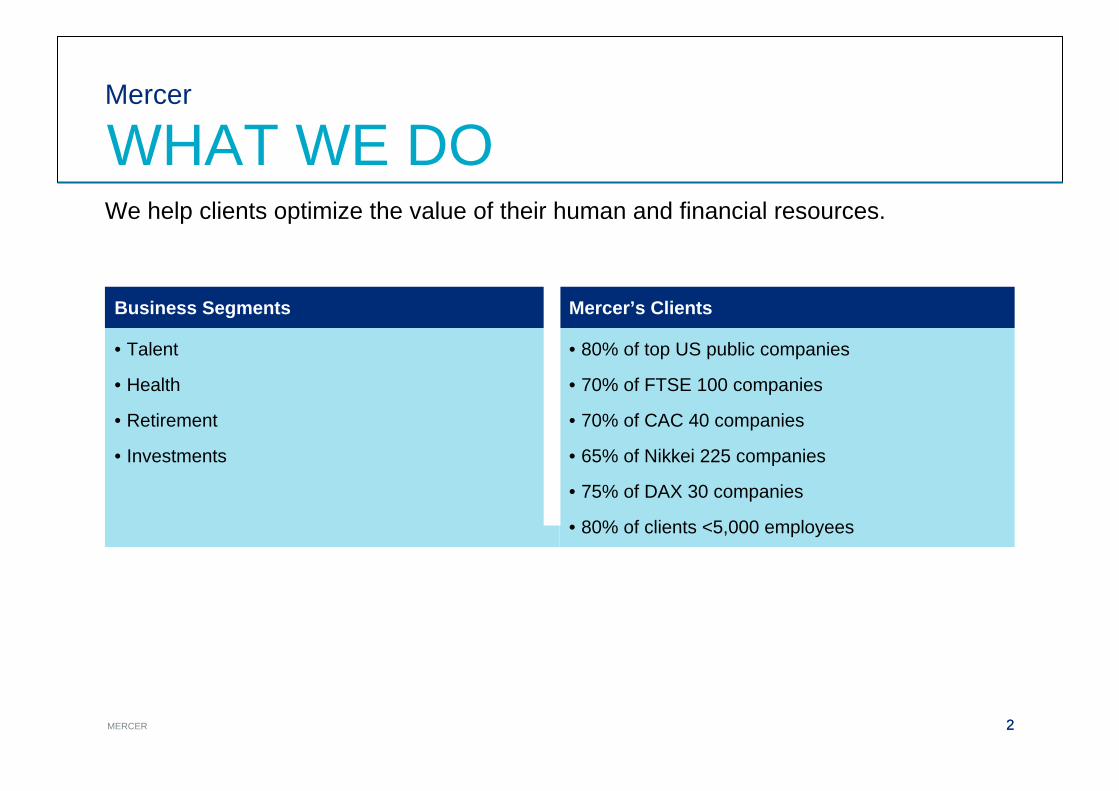
We help clients optimize the value of their human and financial resources.
Business Segments Mercer’s Clients
• Talent
• Health
• Retirement
• Investments
• 80% of top US public companies
• 70% of FTSE 100 companies
• 70% of CAC 40 companies
• 65% of Nikkei 225 companies
• 75% of DAX 30 companies
• 80% of clients <5,000 employees
Mercer
WHAT WE DO
3MERCER
Agenda
• Mercer’s Total Remuneration Surveys
• Worldwide Pay in 2012
• What is equal pay ?
• A closer look at salaries in Switzerland
4MERCER
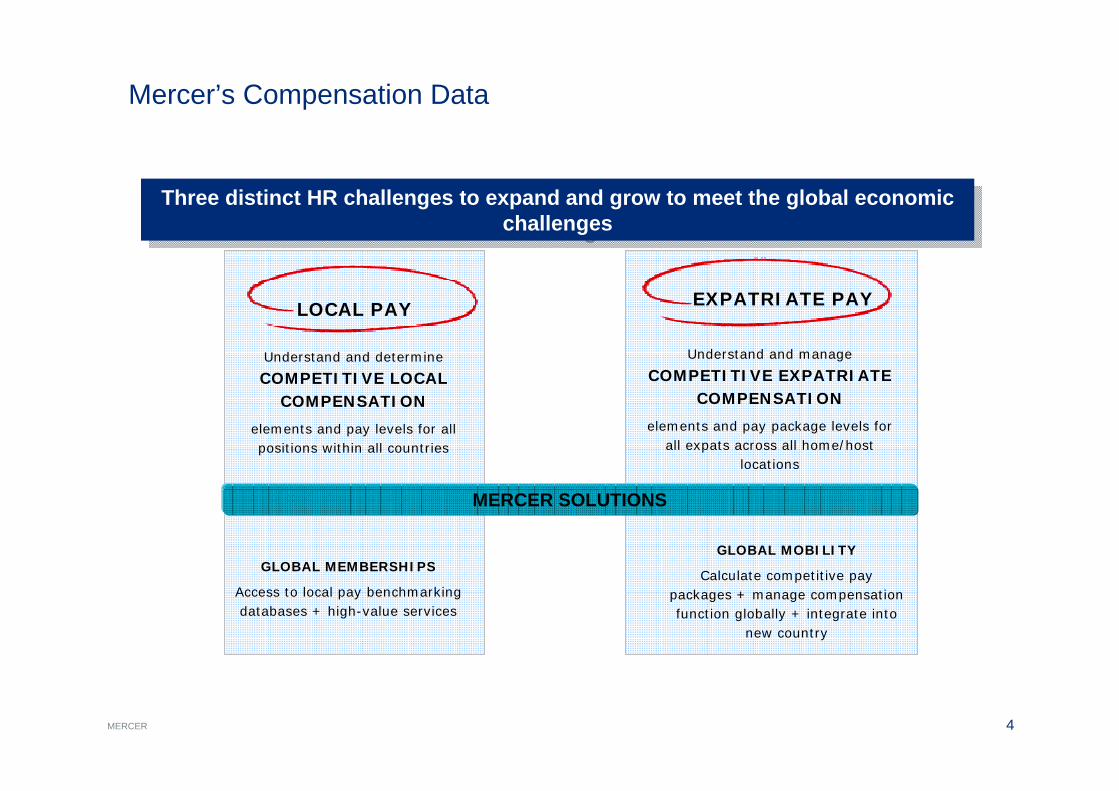
Mercer’s Compensation Data
MERCER SOLUTIONS
Three distinct HR challenges to expand and grow to meet the global economic challenges
Three distinct HR challenges to expand and grow to meet the global economic challenges
LOCAL PAY EXPATRIATE PAY
Understand and determine
COMPETITIVE LOCAL COMPENSATION
elements and pay levels for all positions within all countries
GLOBAL MEMBERSHIPS
Access to local pay benchmarking databases + high-value services
GLOBAL MOBILITY
Calculate competitive pay packages + manage compensation function globally + integrate into
new country
Understand and manage
COMPETITIVE EXPATRIATE COMPENSATION
elements and pay package levels for all expats across all home/host
locations
5MERCER
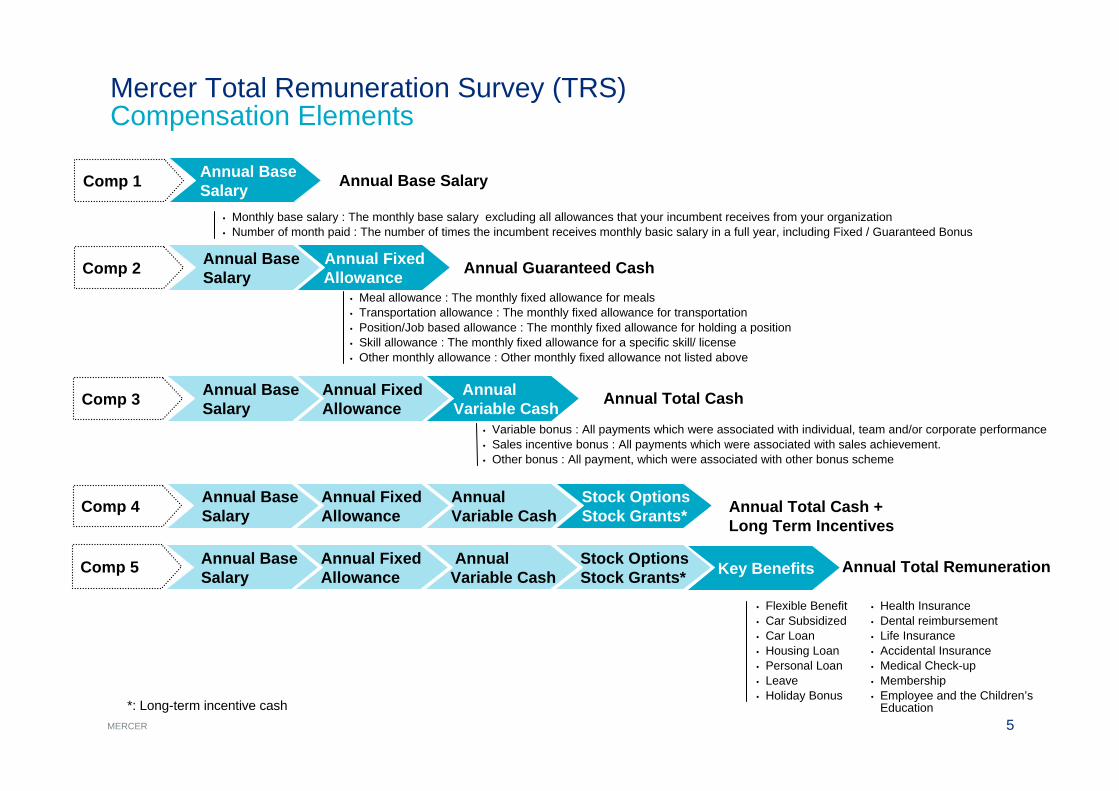
Annual Guaranteed Cash
Annual Total Cash
Annual Base Salary
• Meal allowance : The monthly fixed allowance for meals • Transportation allowance : The monthly fixed allowance for transportation• Position/Job based allowance : The monthly fixed allowance for holding a position• Skill allowance : The monthly fixed allowance for a specific skill/ license• Other monthly allowance : Other monthly fixed allowance not listed above
• Variable bonus : All payments which were associated with individual, team and/or corporate performance• Sales incentive bonus : All payments which were associated with sales achievement.• Other bonus : All payment, which were associated with other bonus scheme
• Monthly base salary : The monthly base salary excluding all allowances that your incumbent receives from your organization • Number of month paid : The number of times the incumbent receives monthly basic salary in a full year, including Fixed / Guaranteed Bonus
*: Long-term incentive cash
Annual Total Cash + Long Term Incentives
Annual Total Remuneration
• Flexible Benefit• Car Subsidized • Car Loan• Housing Loan• Personal Loan• Leave• Holiday Bonus
• Health Insurance• Dental reimbursement• Life Insurance• Accidental Insurance• Medical Check-up• Membership• Employee and the Children’s
Education
AnnualVariable Cash
Annual Fixed Allowance
Annual Base SalaryComp 5 Stock Options
Stock Grants* Key Benefits
AnnualVariable Cash
Annual Fixed Allowance
Annual Base SalaryComp 4 Stock Options
Stock Grants*
Annual Variable Cash
Annual Fixed Allowance
Annual Base SalaryComp 3
Annual Fixed Allowance
Annual Base SalaryComp 2
Annual BaseSalaryComp 1
Mercer Total Remuneration Survey (TRS)Compensation Elements
6MERCER
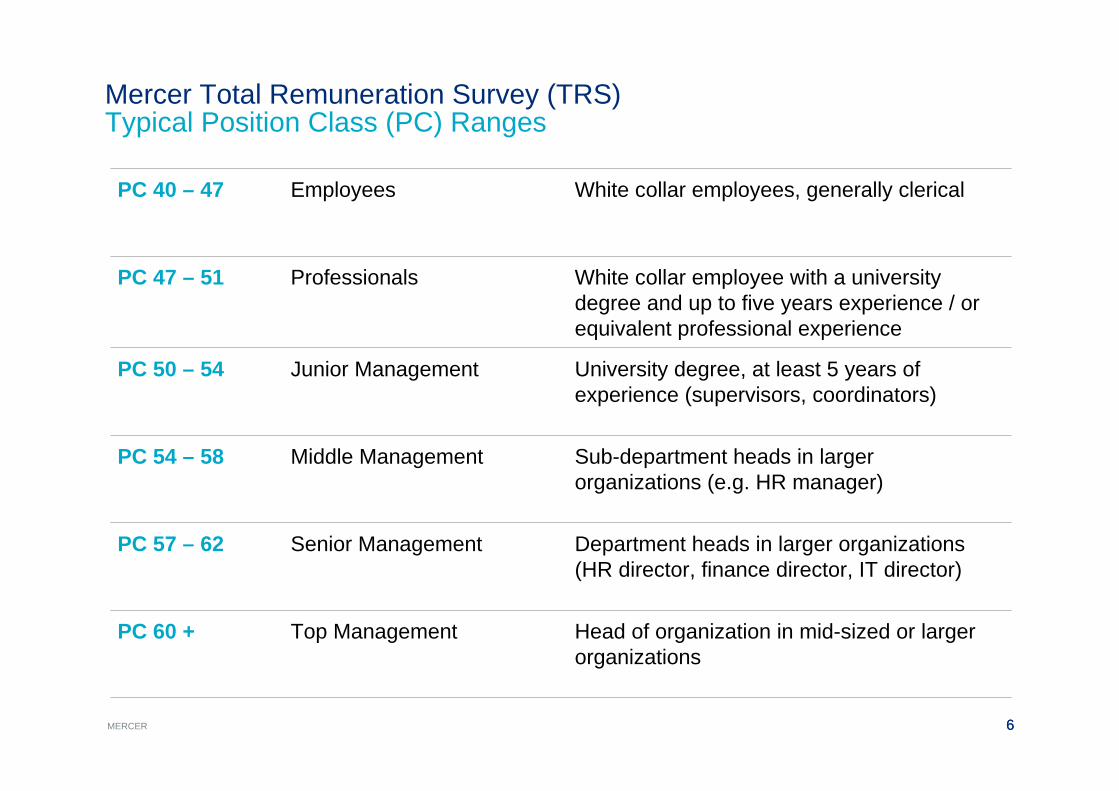
Mercer Total Remuneration Survey (TRS)Typical Position Class (PC) Ranges
White collar employee with a university degree and up to five years experience / or equivalent professional experience
Professionals PC 47 – 51
University degree, at least 5 years of experience (supervisors, coordinators)
Junior ManagementPC 50 – 54
Sub-department heads in larger organizations (e.g. HR manager)
Middle ManagementPC 54 – 58
Department heads in larger organizations (HR director, finance director, IT director)
Senior ManagementPC 57 – 62
Head of organization in mid-sized or larger organizations
Top Management PC 60 +
White collar employees, generally clerical EmployeesPC 40 – 47
6
7MERCER
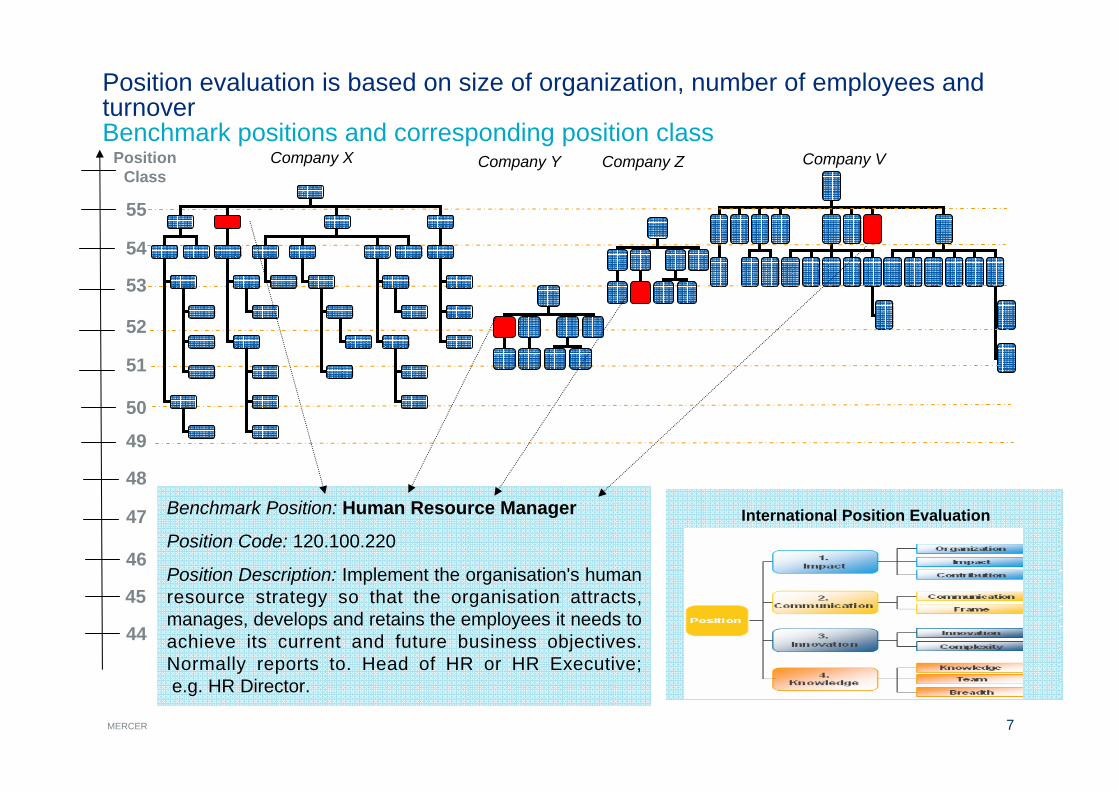
Position evaluation is based on size of organization, number of employees and turnoverBenchmark positions and corresponding position class
55
53
52
51
50
49
Benchmark Position: Human Resource Manager
Position Code: 120.100.220
Position Description: Implement the organisation's human resource strategy so that the organisation attracts, manages, develops and retains the employees it needs to achieve its current and future business objectives. Normally reports to. Head of HR or HR Executive;e.g. HR Director.
Position Class
54
Company X Company Y Company VCompany Z
48
47
46
45
44
International Position Evaluation
8MERCER 8
0
100'000
200'000
300'000
400'000
500'000
600'000
700'000
800'000
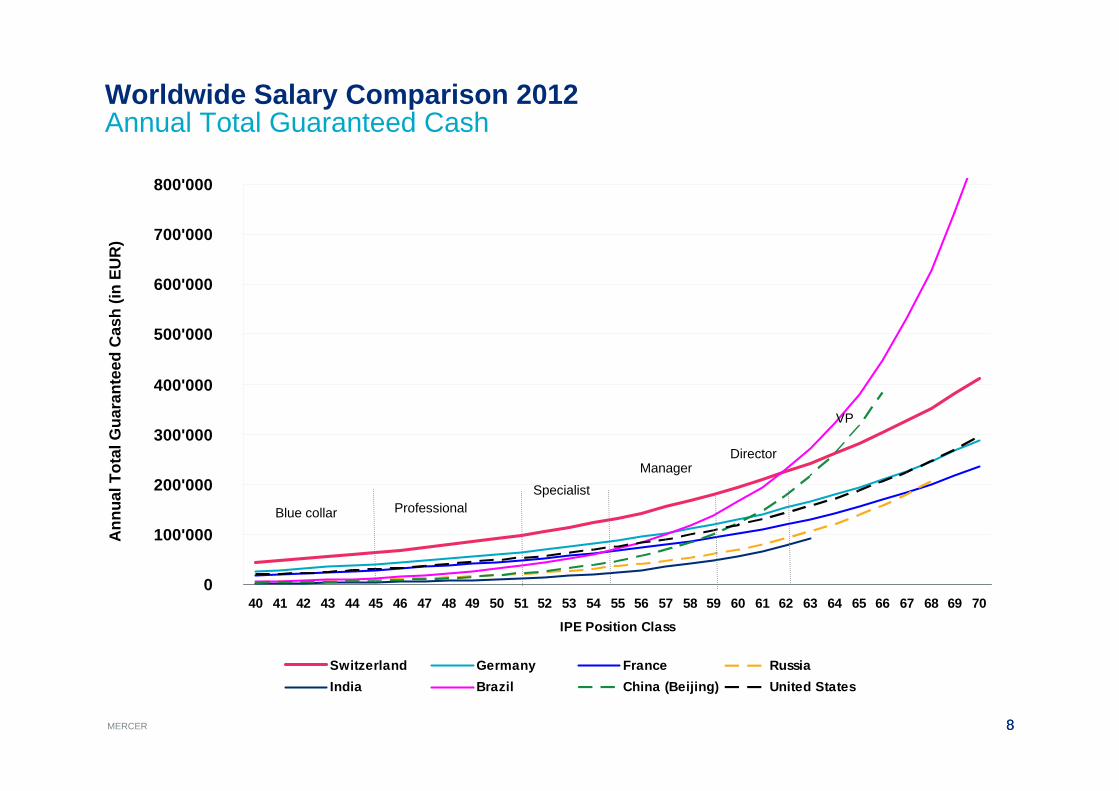
40 41 42 43 44 45 46 47 48 49 50 51 52 53 54 55 56 57 58 59 60 61 62 63 64 65 66 67 68 69 70
IPE Position Class
Switzerland Germany France RussiaIndia Brazil China (Beijing) United States
Worldwide Salary Comparison 2012 Annual Total Guaranteed Cash
Ann
ual T
otal
Gua
rant
eed
Cas
h(in
EU
R)
Blue collar ProfessionalSpecialist
ManagerDirector
VP
9MERCER 9
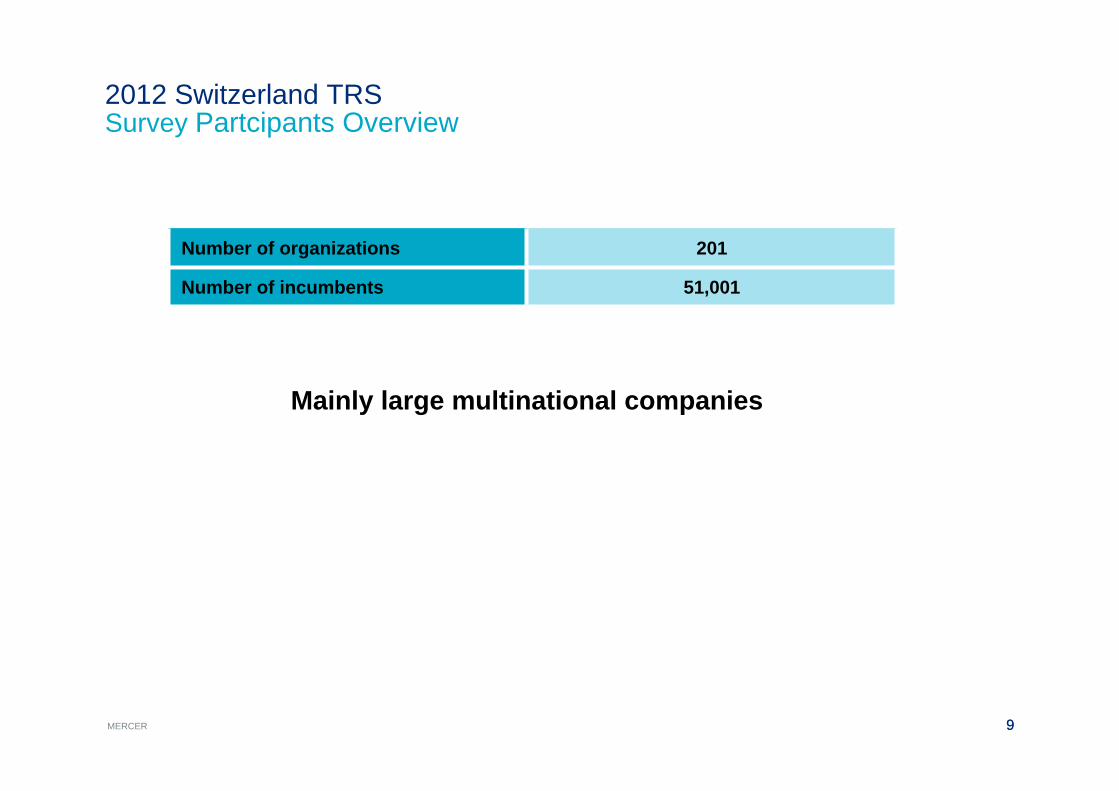
2012 Switzerland TRSSurvey Partcipants Overview
Number of organizations 201
Number of incumbents 51,001
Mainly large multinational companies
10MERCER 10
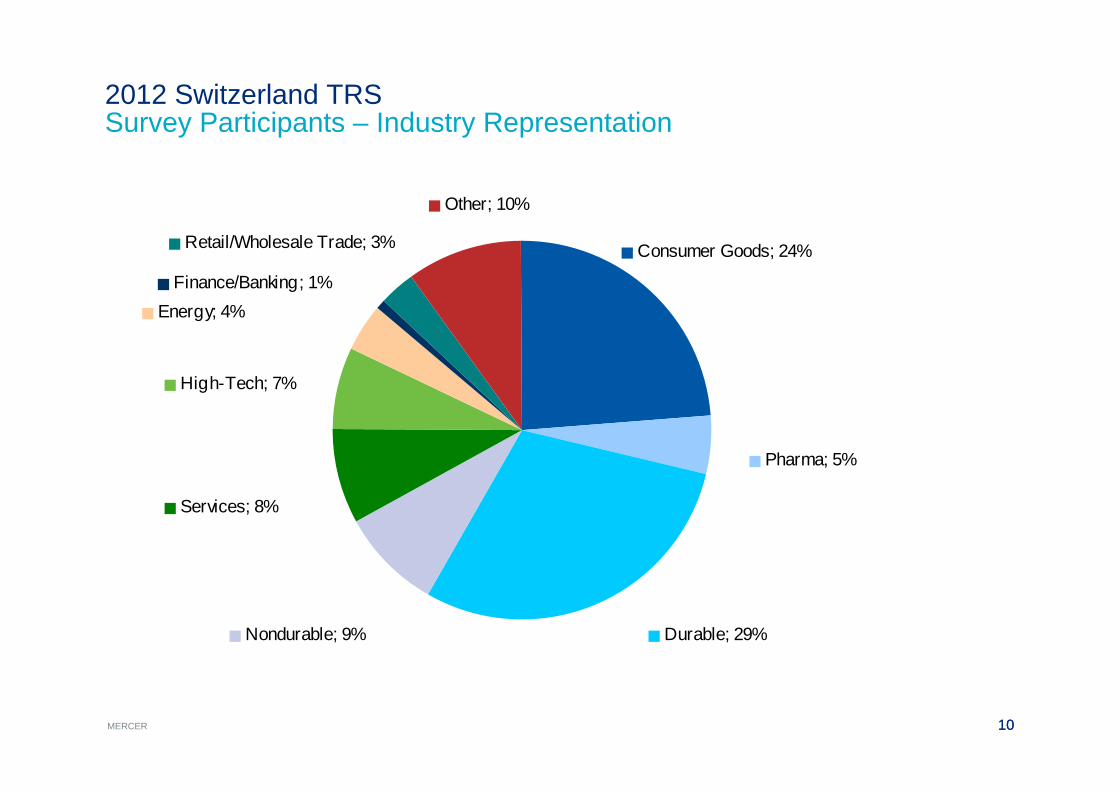
2012 Switzerland TRSSurvey Participants – Industry Representation
Consumer Goods; 24%
Pharma; 5%
Durable; 29%Nondurable; 9%
Services; 8%
High-Tech; 7%
Energy; 4%Finance/Banking; 1%
Retail/Wholesale Trade; 3%
Other; 10%
11MERCER
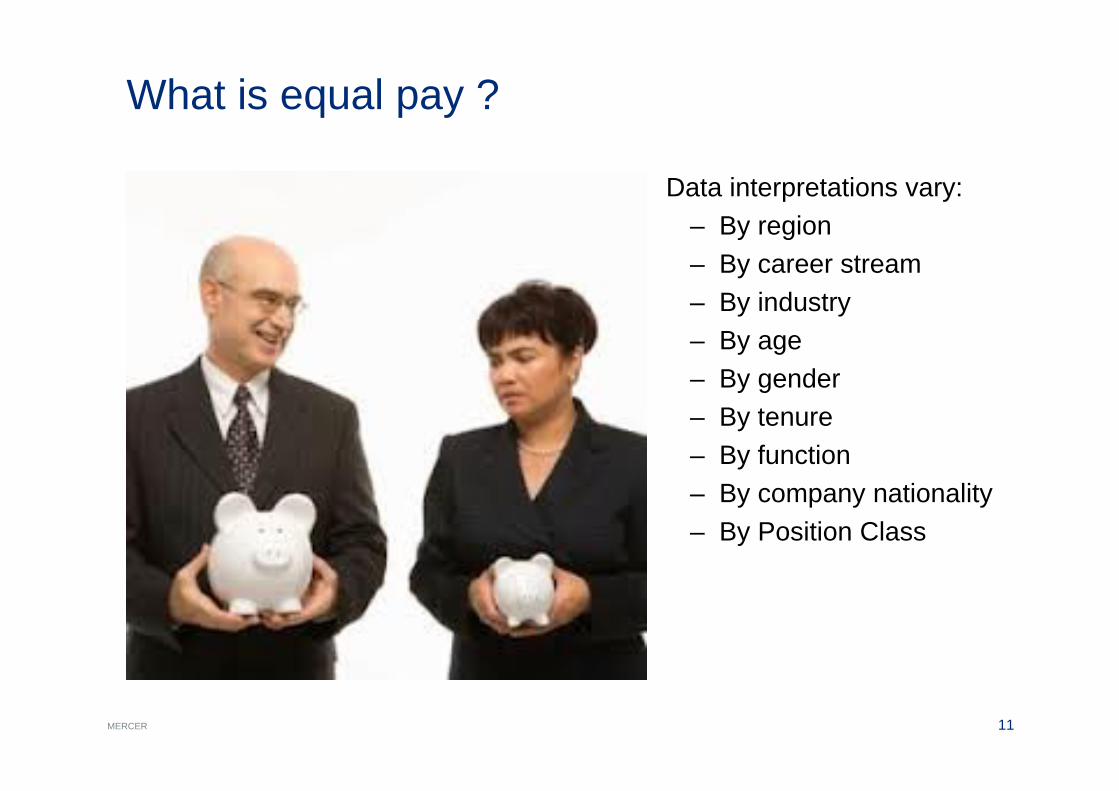
What is equal pay ?
Data interpretations vary:– By region– By career stream– By industry– By age– By gender– By tenure– By function– By company nationality– By Position Class
12MERCER 12
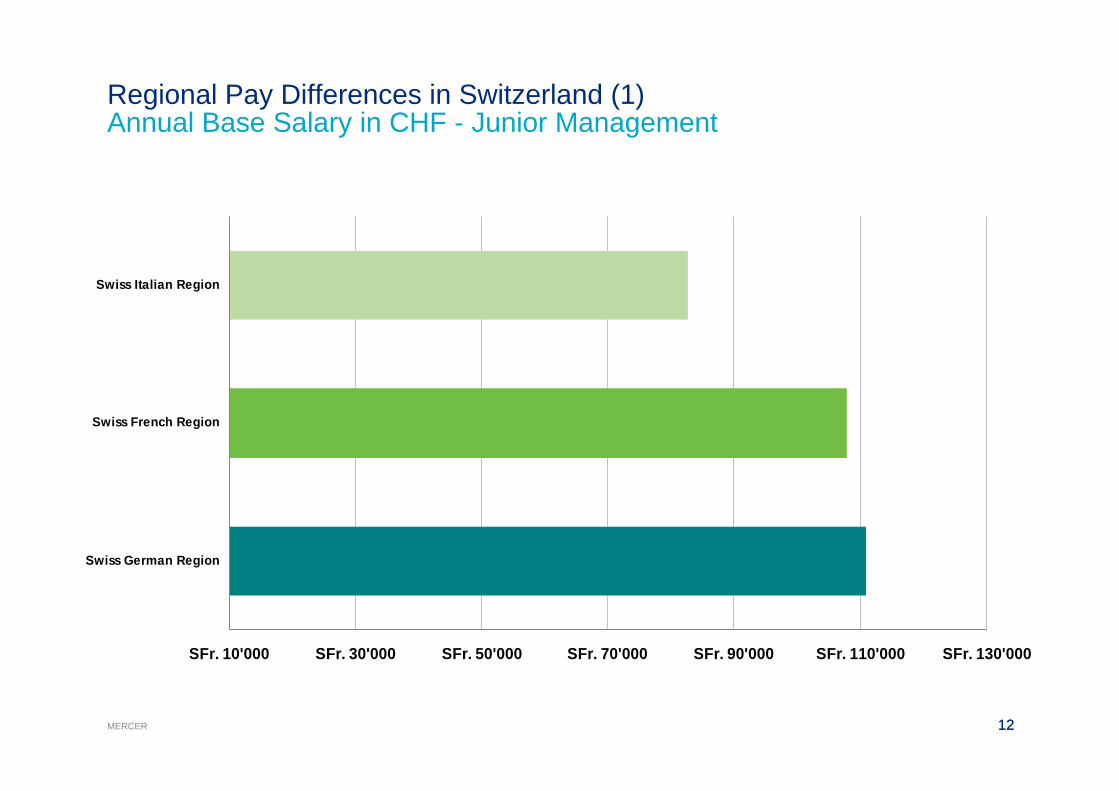
Regional Pay Differences in Switzerland (1)Annual Base Salary in CHF - Junior Management
SFr. 10'000 SFr. 30'000 SFr. 50'000 SFr. 70'000 SFr. 90'000 SFr. 110'000 SFr. 130'000
Swiss German Region
Swiss French Region
Swiss Italian Region
13MERCER
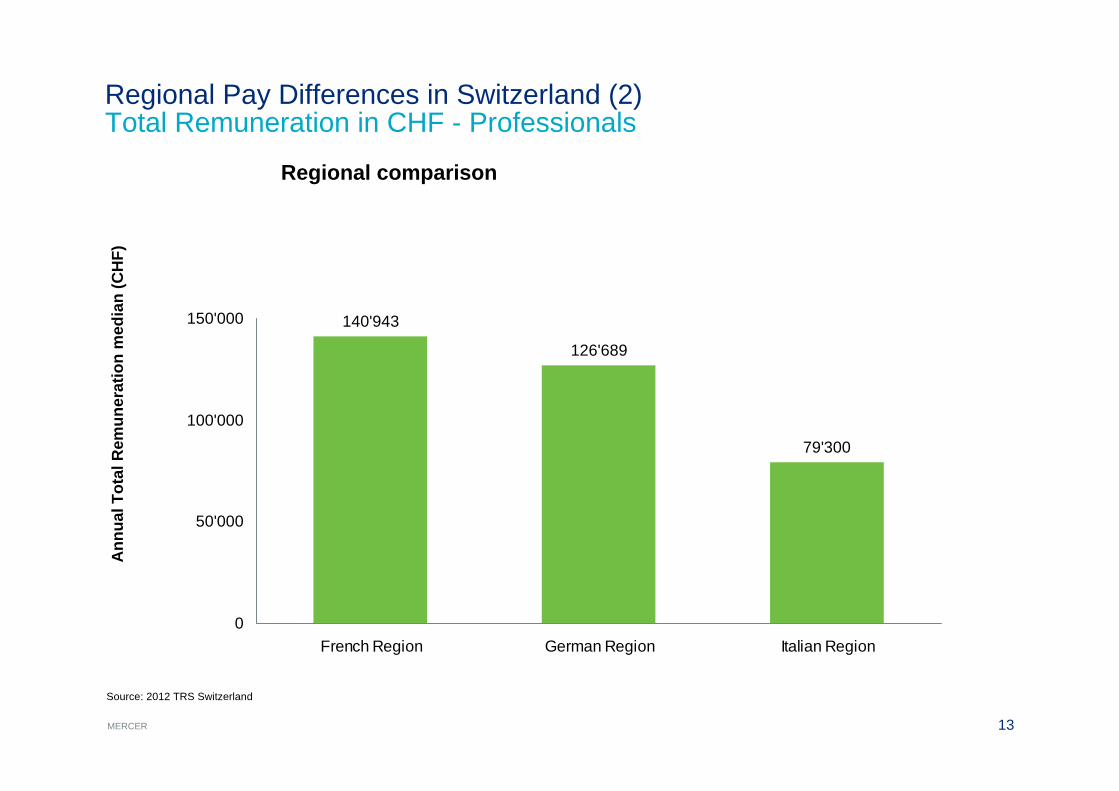
Regional Pay Differences in Switzerland (2)Total Remuneration in CHF - Professionals
140'943
126'689
79'300
0
50'000
100'000
150'000
French Region German Region Italian Region
Ann
ual T
otal
Rem
uner
atio
nm
edia
n (C
HF)
Regional comparison
Source: 2012 TRS Switzerland
14MERCER
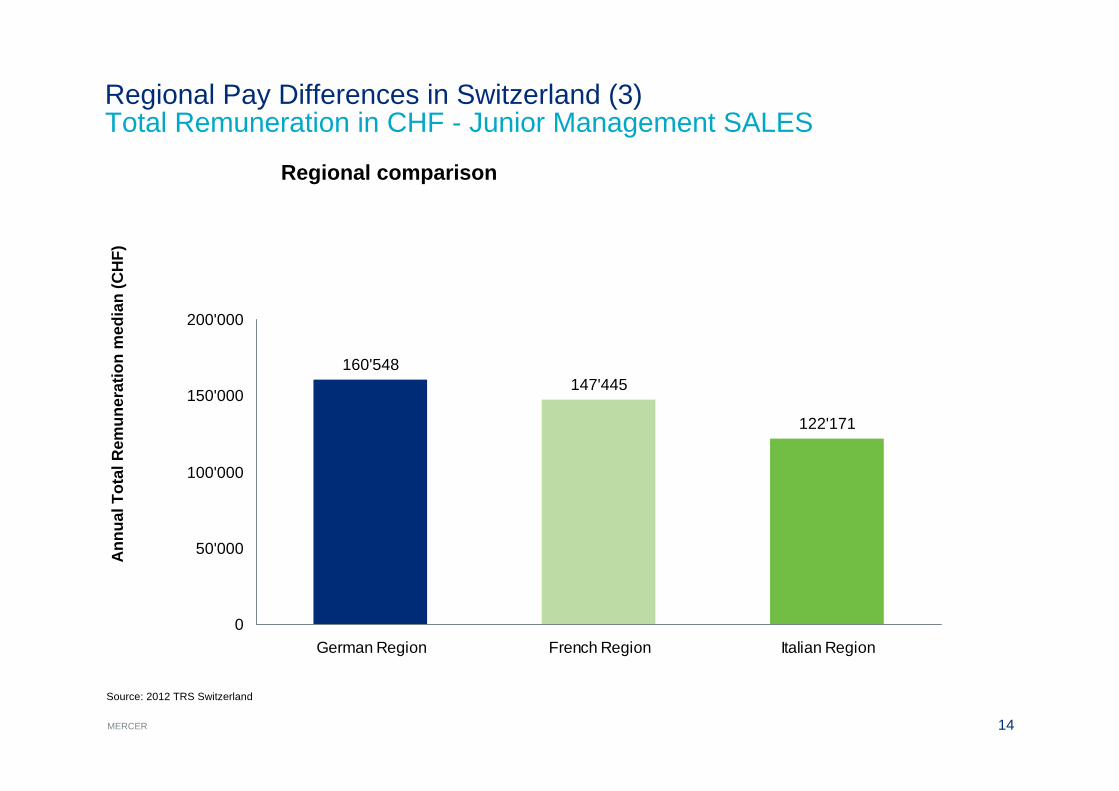
160'548147'445
122'171
0
50'000
100'000
150'000
200'000
German Region French Region Italian Region
Ann
ual T
otal
Rem
uner
atio
nm
edia
n (C
HF)
Regional comparison
Source: 2012 TRS Switzerland
Regional Pay Differences in Switzerland (3)Total Remuneration in CHF - Junior Management SALES
15MERCER 15
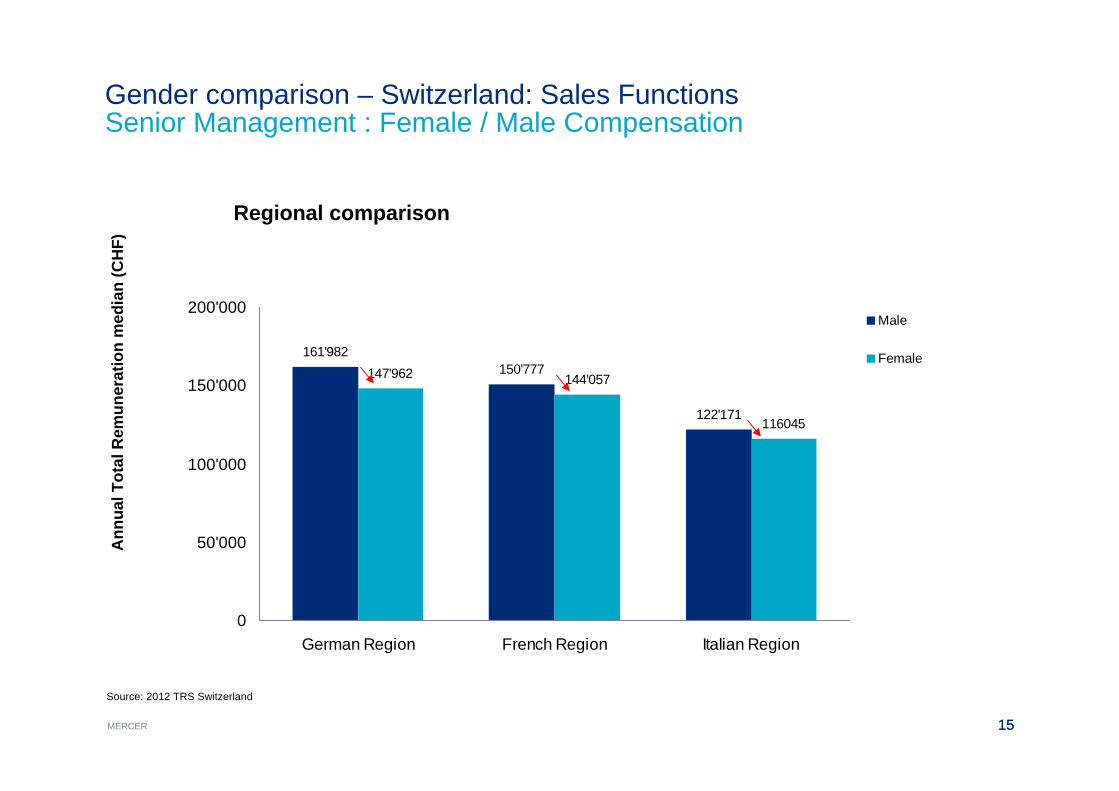
Gender comparison – Switzerland: Sales FunctionsSenior Management : Female / Male Compensation
161'982150'777
122'171
147'962 144'057
116045
0
50'000
100'000
150'000
200'000
German Region French Region Italian Region
Male
Female
Source: 2012 TRS Switzerland
Ann
ual T
otal
Rem
uner
atio
nm
edia
n (C
HF)
Regional comparison
16MERCER 16
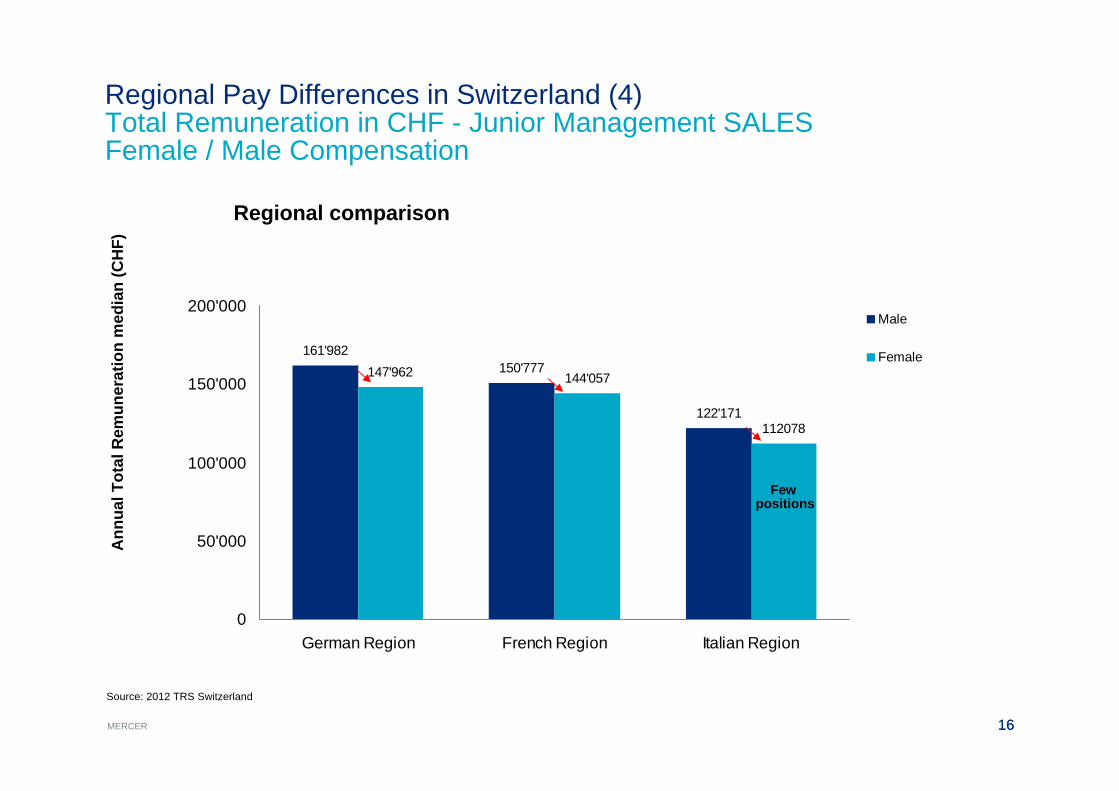
Regional Pay Differences in Switzerland (4)Total Remuneration in CHF - Junior Management SALESFemale / Male Compensation
161'982150'777
122'171
147'962 144'057
112078
0
50'000
100'000
150'000
200'000
German Region French Region Italian Region
Male
Female
Source: 2012 TRS Switzerland
Ann
ual T
otal
Rem
uner
atio
nm
edia
n (C
HF)
Regional comparison
Few positions
17MERCER 17
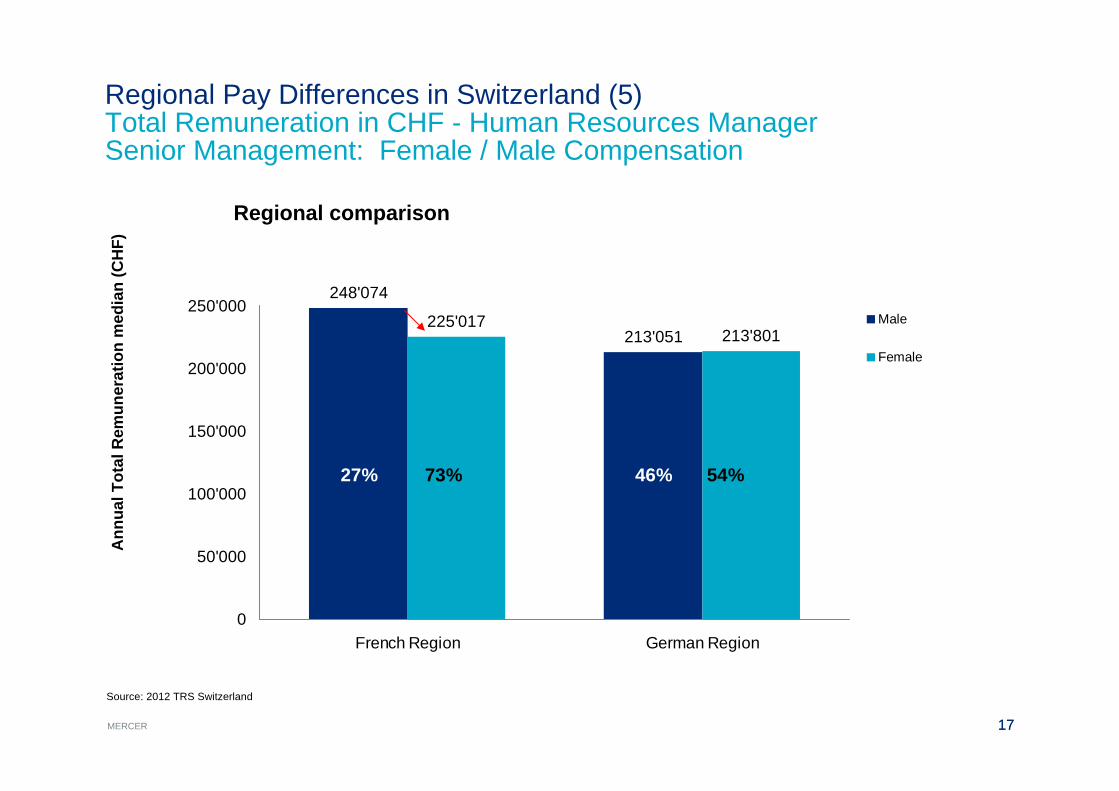
Regional Pay Differences in Switzerland (5)Total Remuneration in CHF - Human Resources Manager Senior Management: Female / Male Compensation
248'074
213'051225'017
213'801
0
50'000
100'000
150'000
200'000
250'000
French Region German Region
Male
Female
Source: 2012 TRS Switzerland
Ann
ual T
otal
Rem
uner
atio
nm
edia
n (C
HF)
Regional comparison
73% 54%27% 46%
18MERCER 18
0%
5%
10%
15%
20%
25%
30%
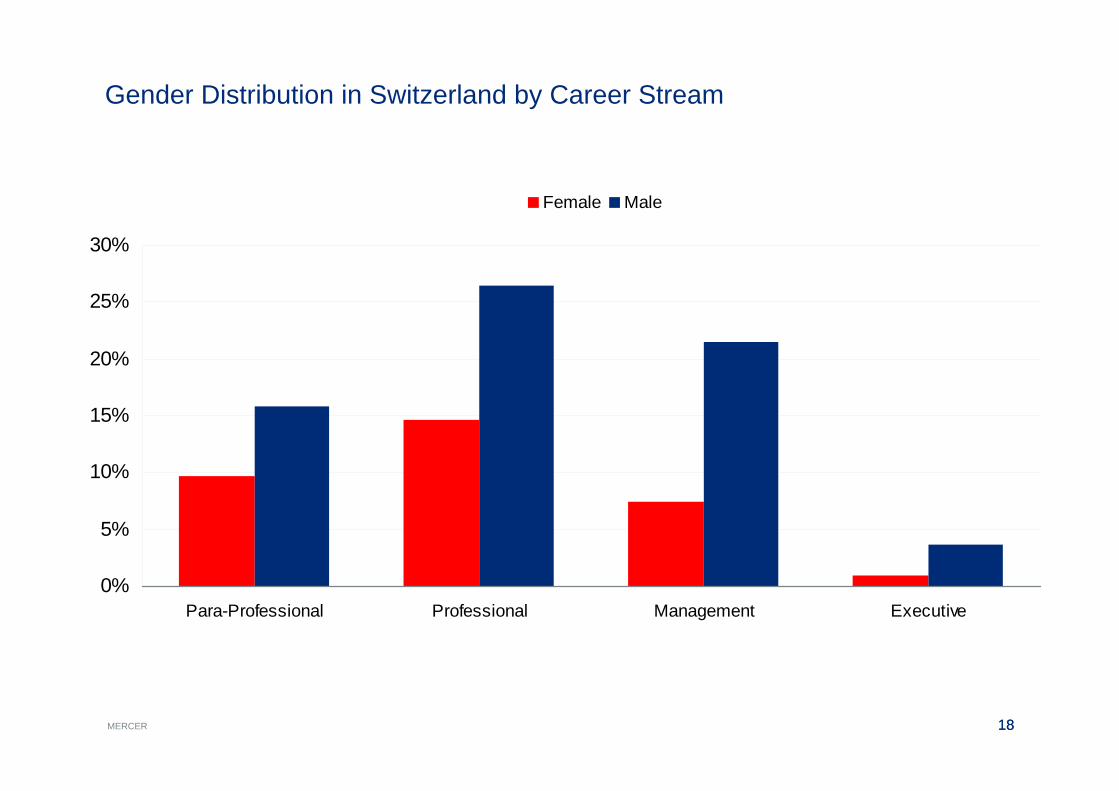
Para-Professional Professional Management Executive
Female Male
Gender Distribution in Switzerland by Career Stream
19MERCER 1906 March 2013
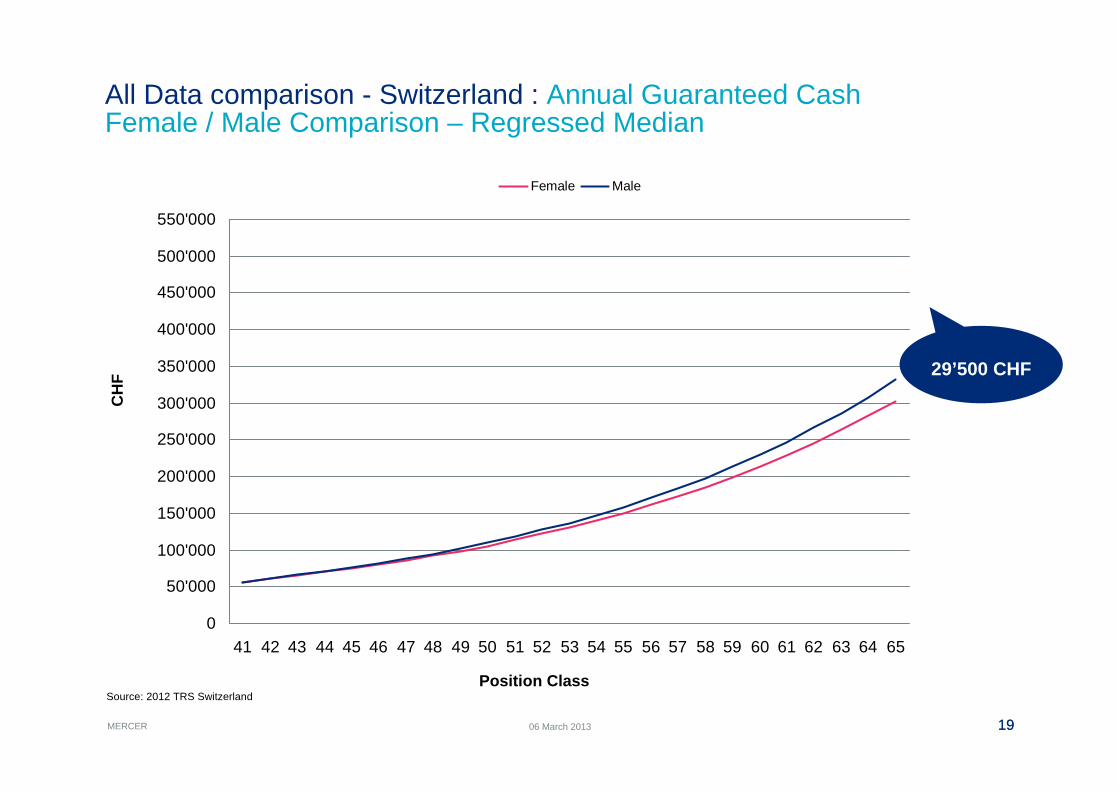
All Data comparison - Switzerland : Annual Guaranteed CashFemale / Male Comparison – Regressed Median
Source: 2012 TRS Switzerland
0
50'000
100'000
150'000
200'000
250'000
300'000
350'000
400'000
450'000
500'000
550'000
41 42 43 44 45 46 47 48 49 50 51 52 53 54 55 56 57 58 59 60 61 62 63 64 65
Female Male
Position Class
CH
F 29’500 CHF
20MERCER 2006 March 2013
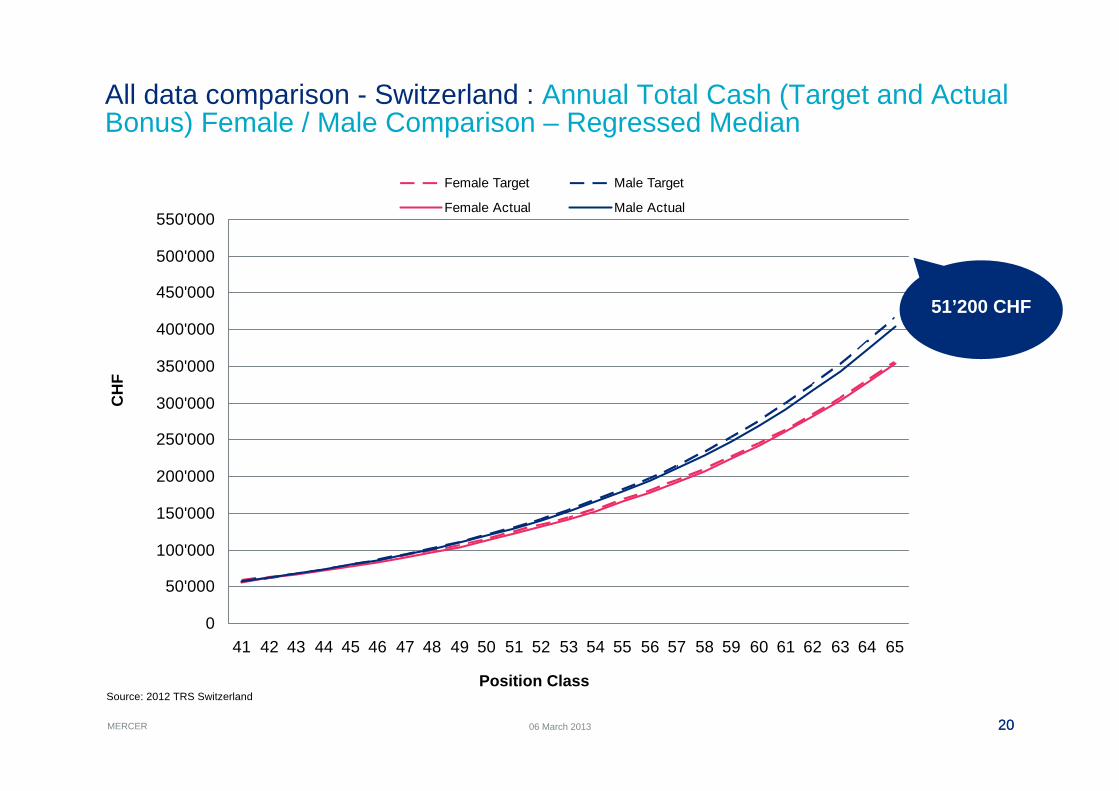
All data comparison - Switzerland : Annual Total Cash (Target and ActualBonus) Female / Male Comparison – Regressed Median
Source: 2012 TRS Switzerland
0
50'000
100'000
150'000
200'000
250'000
300'000
350'000
400'000
450'000
500'000
550'000
41 42 43 44 45 46 47 48 49 50 51 52 53 54 55 56 57 58 59 60 61 62 63 64 65
Female Target Male Target
Female Actual Male Actual
Position Class
CH
F
51’200 CHF
21MERCER 2106 March 2013
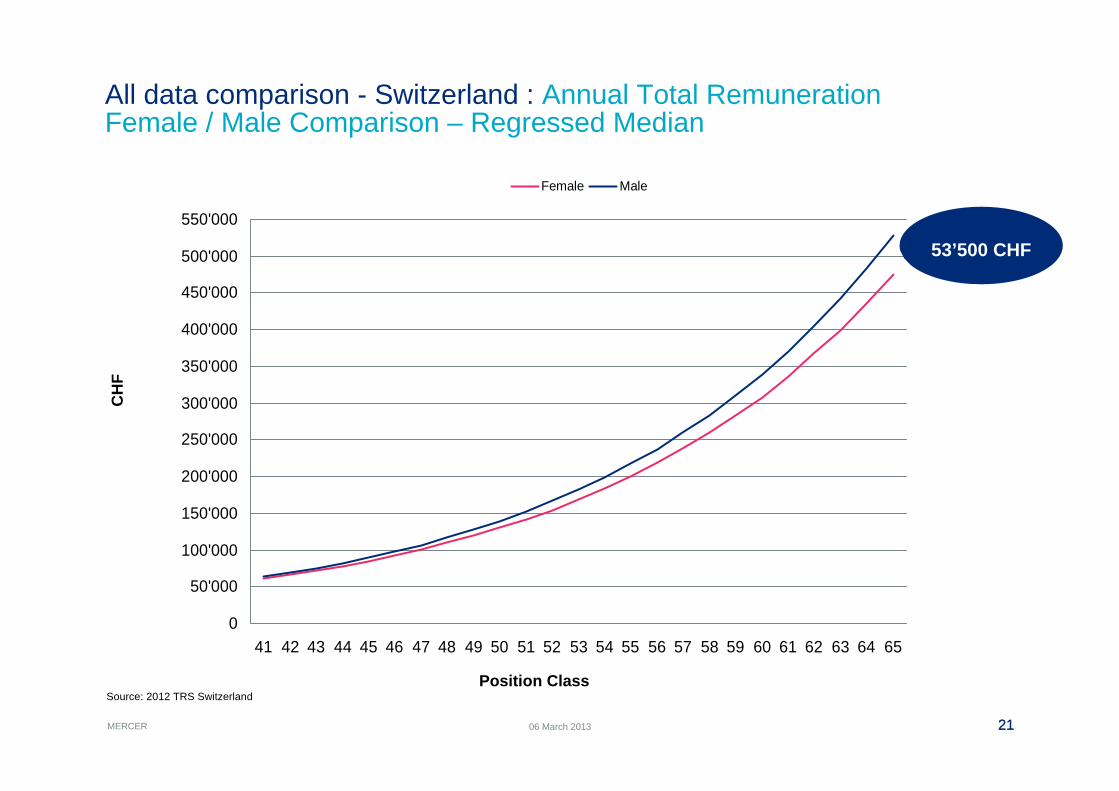
All data comparison - Switzerland : Annual Total RemunerationFemale / Male Comparison – Regressed Median
Source: 2012 TRS Switzerland
0
50'000
100'000
150'000
200'000
250'000
300'000
350'000
400'000
450'000
500'000
550'000
41 42 43 44 45 46 47 48 49 50 51 52 53 54 55 56 57 58 59 60 61 62 63 64 65
Female Male
Position Class
CH
F
53’500 CHF
22MERCER 22
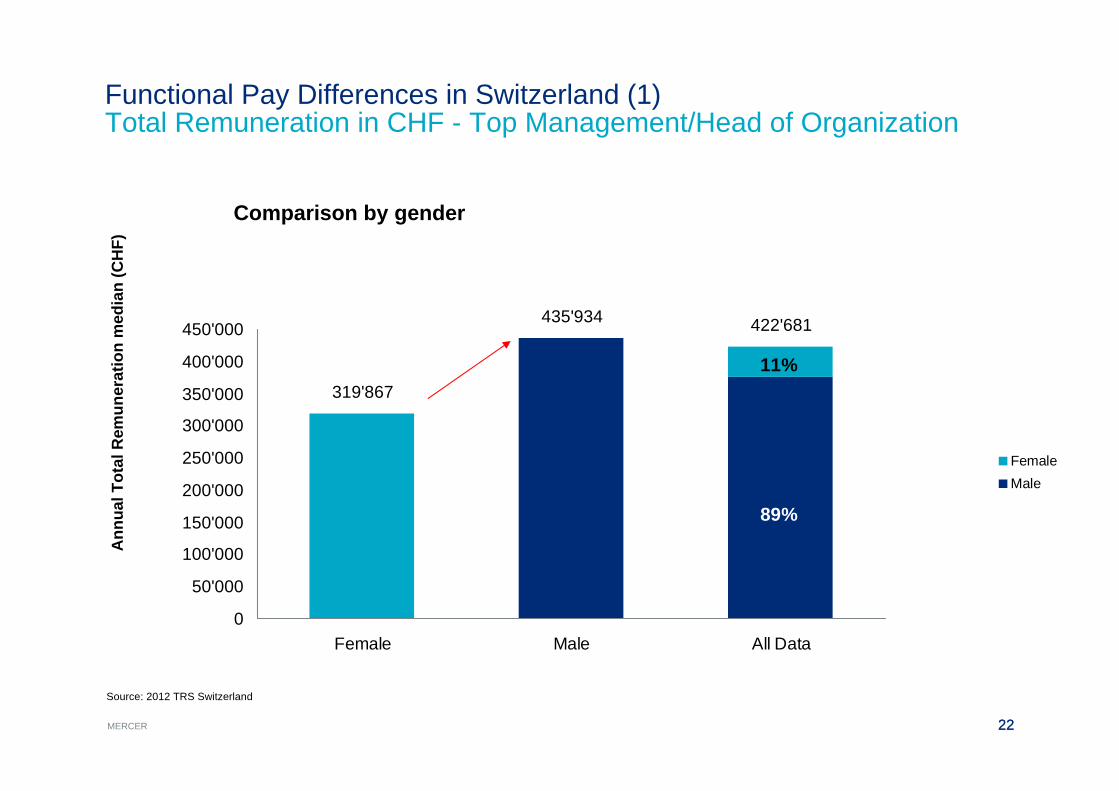
Functional Pay Differences in Switzerland (1)Total Remuneration in CHF - Top Management/Head of Organization
Source: 2012 TRS Switzerland
319'867
435'934 422'681
0
50'000
100'000
150'000
200'000
250'000
300'000
350'000
400'000
450'000
Female Male All Data
FemaleMale
Ann
ual T
otal
Rem
uner
atio
nm
edia
n (C
HF)
Comparison by gender
11%
89%
23MERCER 23
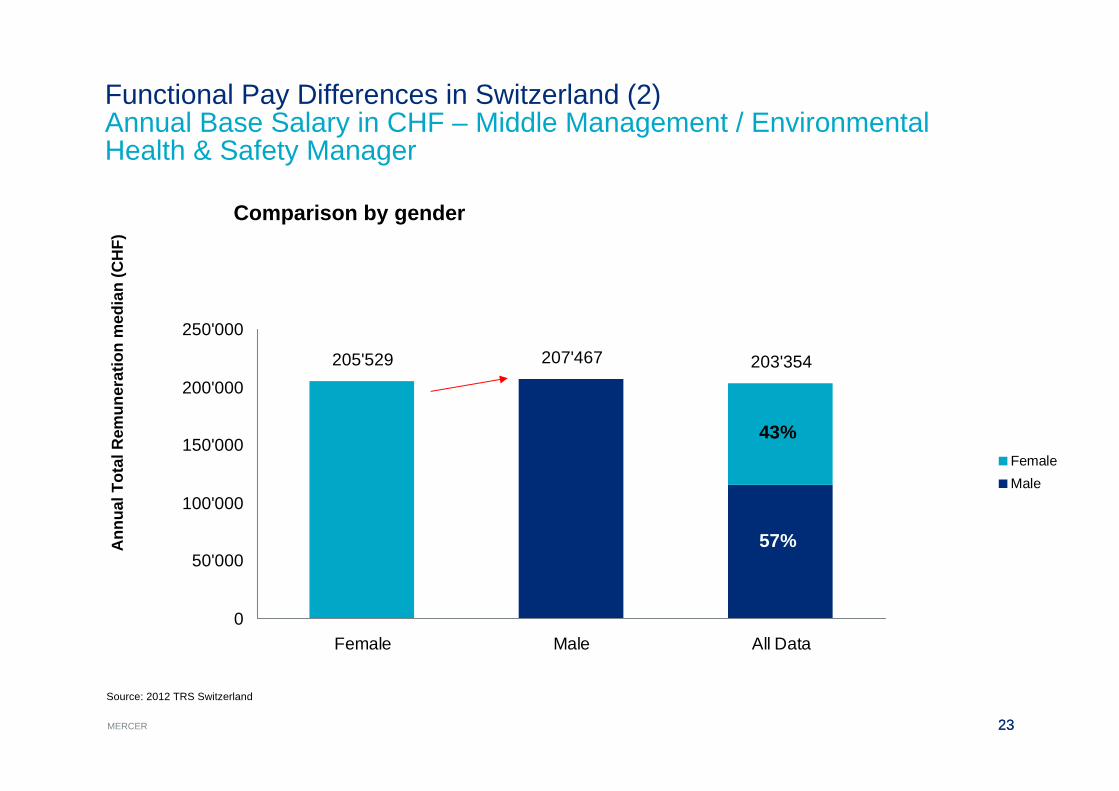
Functional Pay Differences in Switzerland (2)Annual Base Salary in CHF – Middle Management / Environmental Health & Safety Manager
Source: 2012 TRS Switzerland
205'529 207'467 203'354
0
50'000
100'000
150'000
200'000
250'000
Female Male All Data
FemaleMale
Ann
ual T
otal
Rem
uner
atio
nm
edia
n (C
HF)
Comparison by gender
43%
57%
24MERCER 24
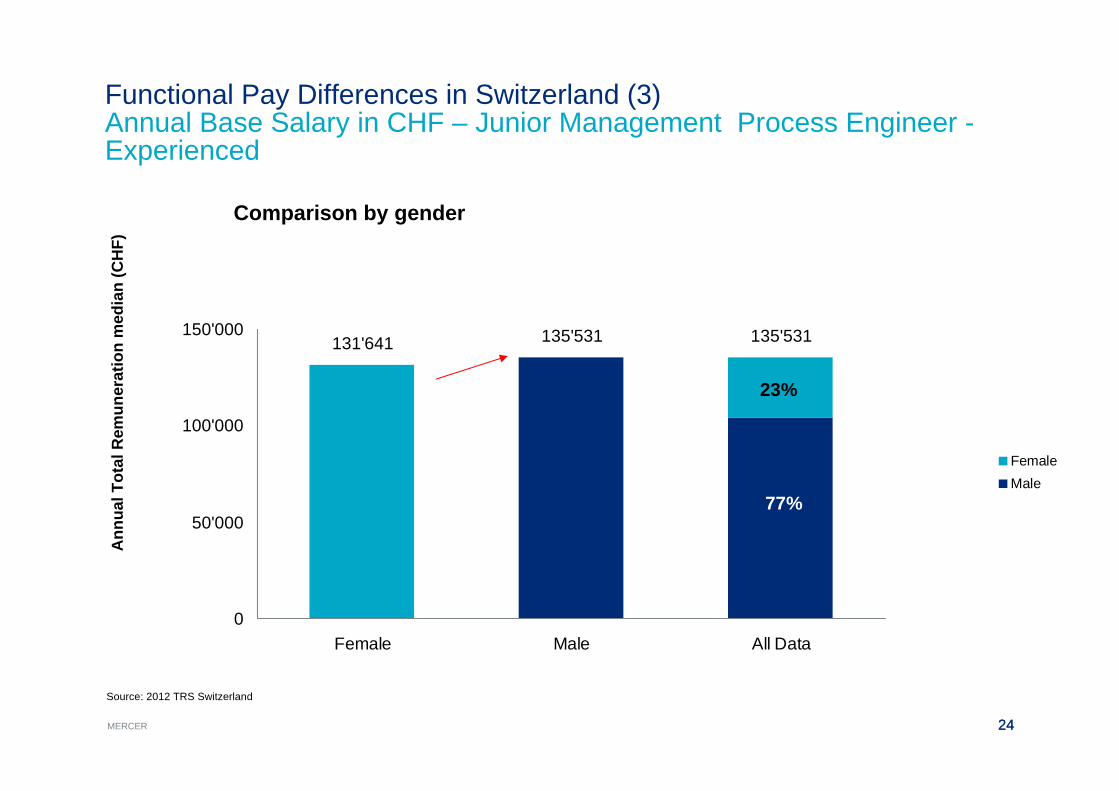
Functional Pay Differences in Switzerland (3)Annual Base Salary in CHF – Junior Management Process Engineer -Experienced
Source: 2012 TRS Switzerland
131'641 135'531 135'531
0
50'000
100'000
150'000
Female Male All Data
FemaleMale
Ann
ual T
otal
Rem
uner
atio
nm
edia
n (C
HF)
Comparison by gender
23%
77%
25MERCER 25
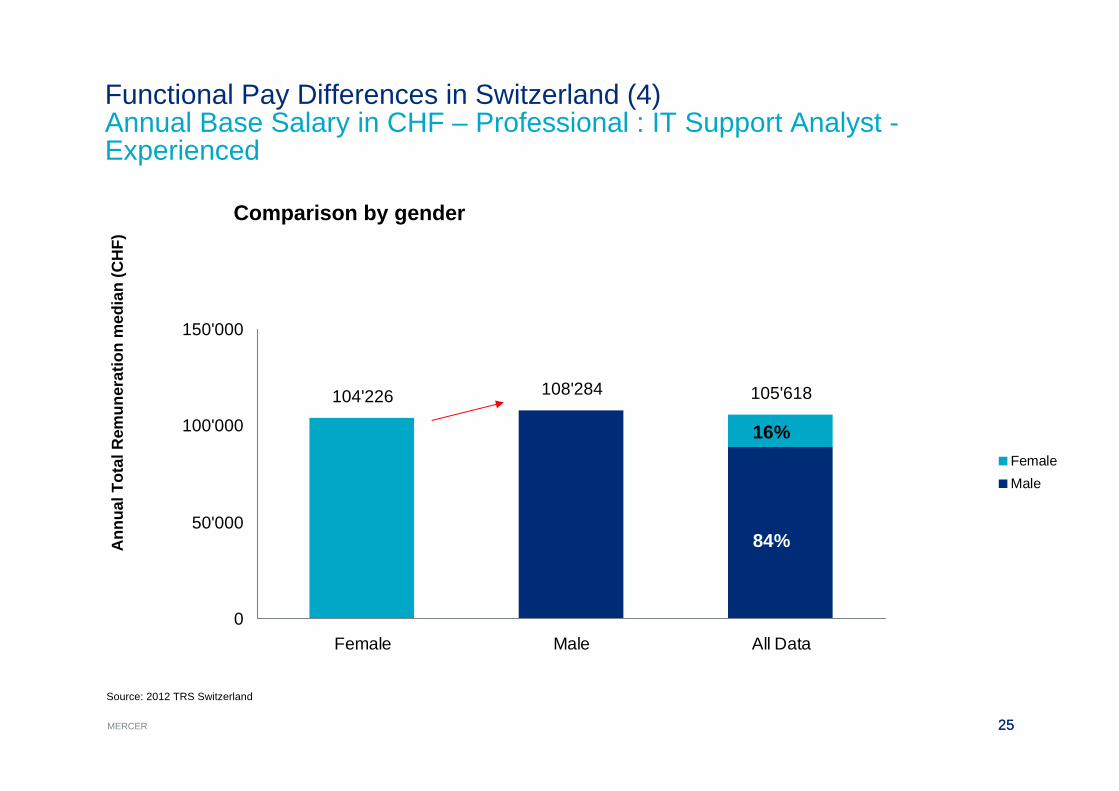
Functional Pay Differences in Switzerland (4)Annual Base Salary in CHF – Professional : IT Support Analyst -Experienced
Source: 2012 TRS Switzerland
104'226 108'284 105'618
0
50'000
100'000
150'000
Female Male All Data
FemaleMale
Ann
ual T
otal
Rem
uner
atio
nm
edia
n (C
HF)
Comparison by gender
16%
84%
26MERCER 26
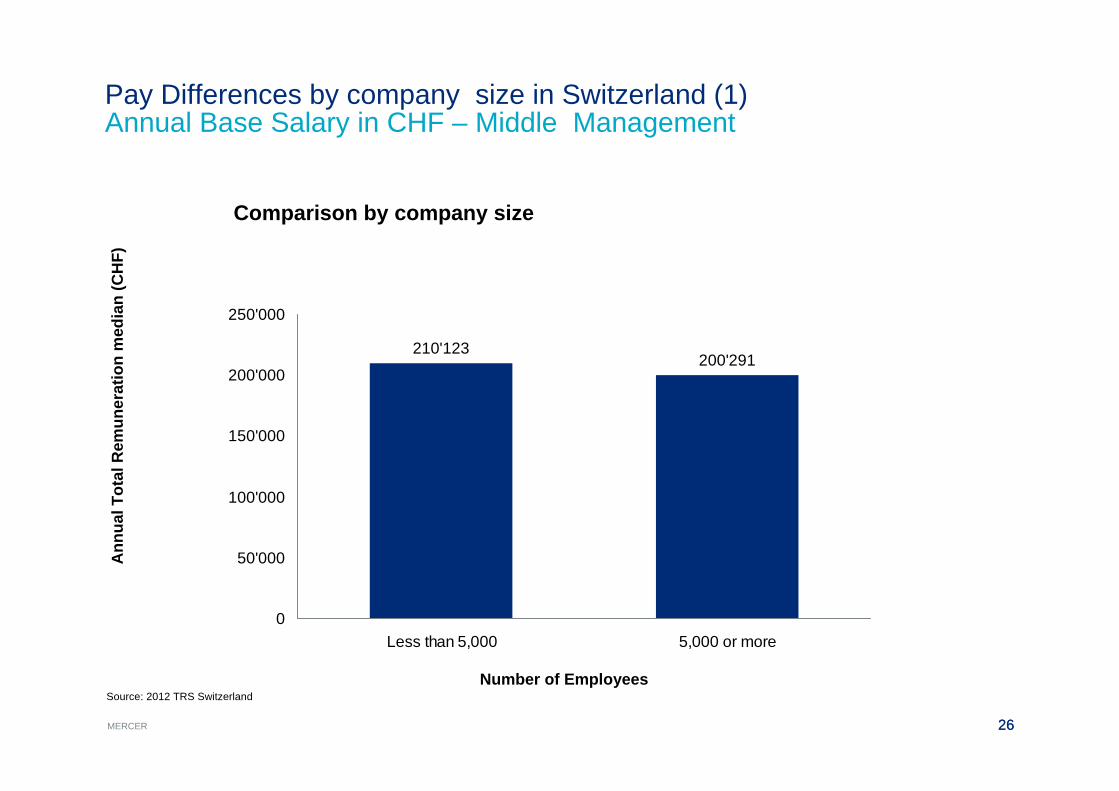
Pay Differences by company size in Switzerland (1)Annual Base Salary in CHF – Middle Management
210'123200'291
0
50'000
100'000
150'000
200'000
250'000
Less than 5,000 5,000 or more
Source: 2012 TRS Switzerland
Ann
ual T
otal
Rem
uner
atio
nm
edia
n (C
HF)
Comparison by company size
Number of Employees
27MERCER 27
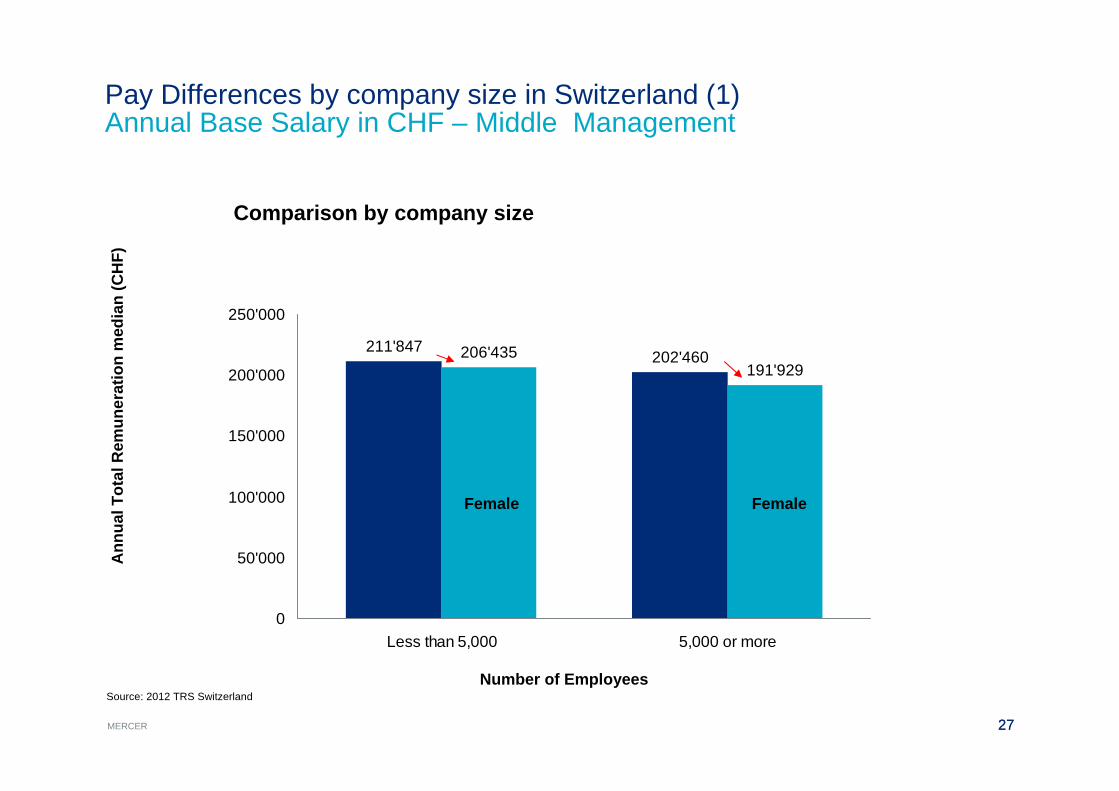
Pay Differences by company size in Switzerland (1)Annual Base Salary in CHF – Middle Management
211'847202'460206'435
191'929
0
50'000
100'000
150'000
200'000
250'000
Less than 5,000 5,000 or more
Source: 2012 TRS Switzerland
Ann
ual T
otal
Rem
uner
atio
nm
edia
n (C
HF)
Comparison by company size
Number of Employees
Female Female
28MERCER
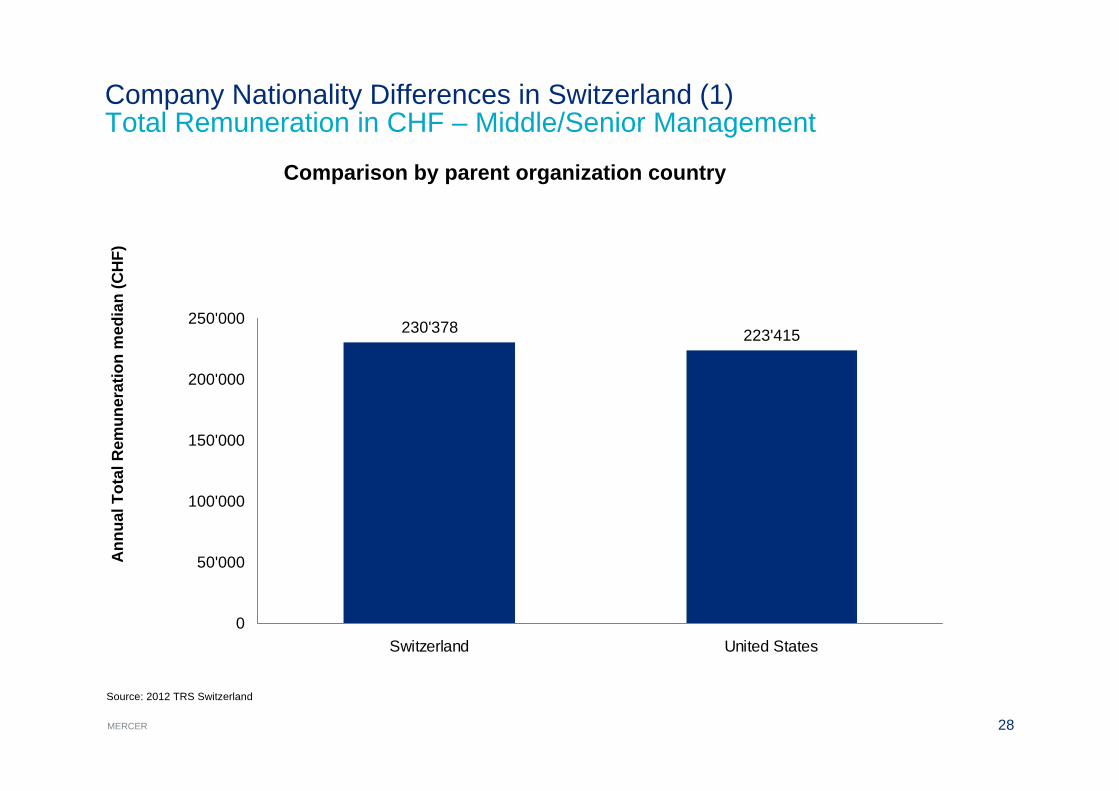
Company Nationality Differences in Switzerland (1)Total Remuneration in CHF – Middle/Senior Management
230'378 223'415
0
50'000
100'000
150'000
200'000
250'000
Switzerland United States
Ann
ual T
otal
Rem
uner
atio
n m
edia
n(C
HF)
Comparison by parent organization country
Source: 2012 TRS Switzerland
29MERCER 29
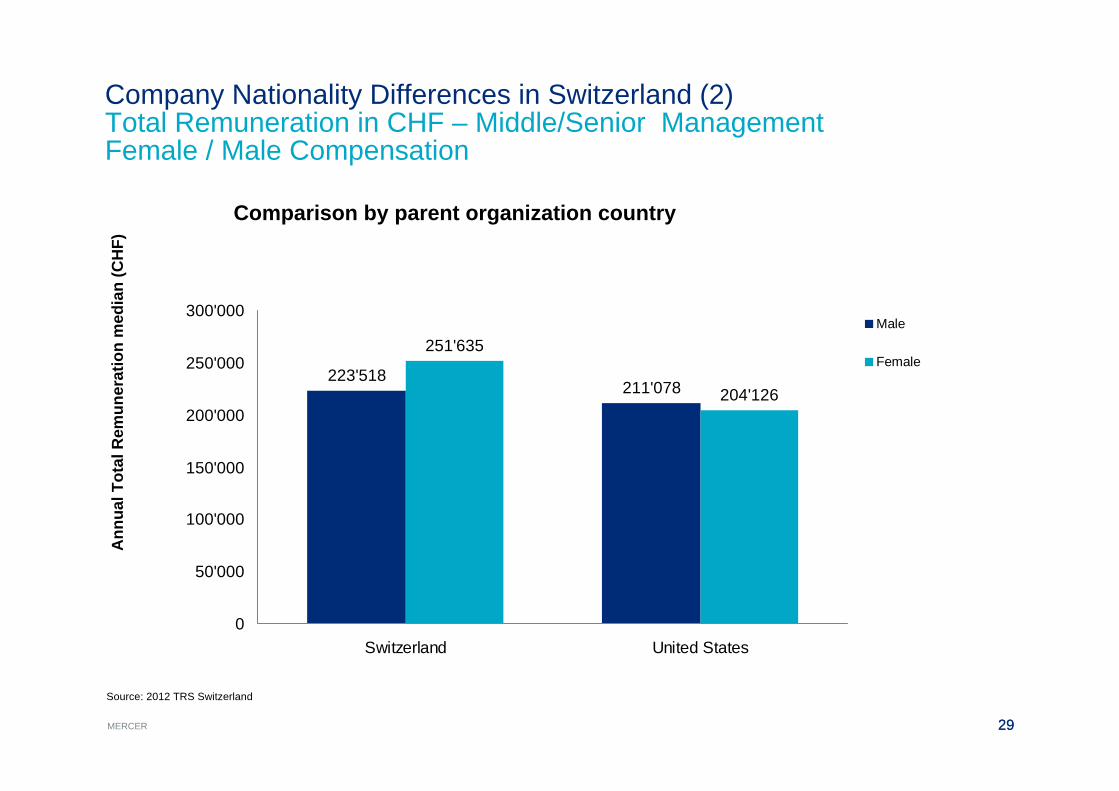
Company Nationality Differences in Switzerland (2)Total Remuneration in CHF – Middle/Senior ManagementFemale / Male Compensation
223'518211'078
251'635
204'126
0
50'000
100'000
150'000
200'000
250'000
300'000
Switzerland United States
Male
Female
Source: 2012 TRS Switzerland
Ann
ual T
otal
Rem
uner
atio
nm
edia
n (C
HF)
Comparison by parent organization country
30MERCER
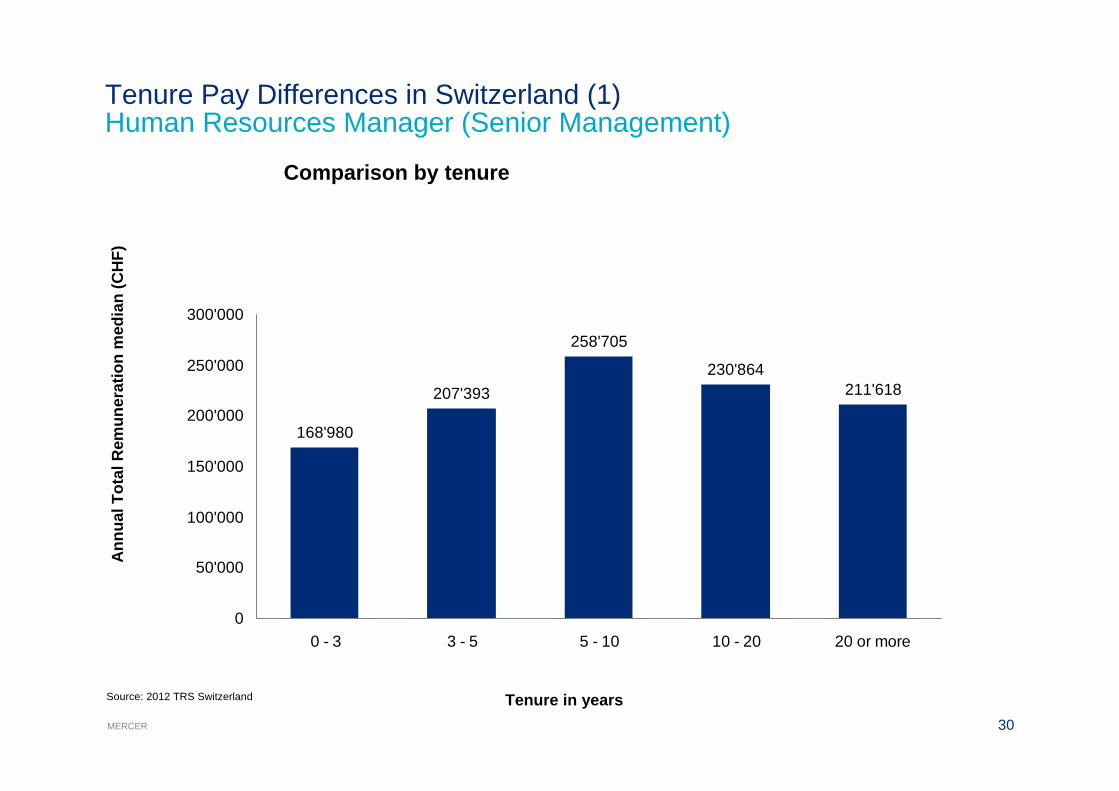
Tenure Pay Differences in Switzerland (1)Human Resources Manager (Senior Management)
168'980
207'393
258'705
230'864211'618
0
50'000
100'000
150'000
200'000
250'000
300'000
0 - 3 3 - 5 5 - 10 10 - 20 20 or more
Ann
ual T
otal
Rem
uner
atio
n m
edia
n(C
HF)
Comparison by tenure
Source: 2012 TRS Switzerland Tenure in years
31MERCER
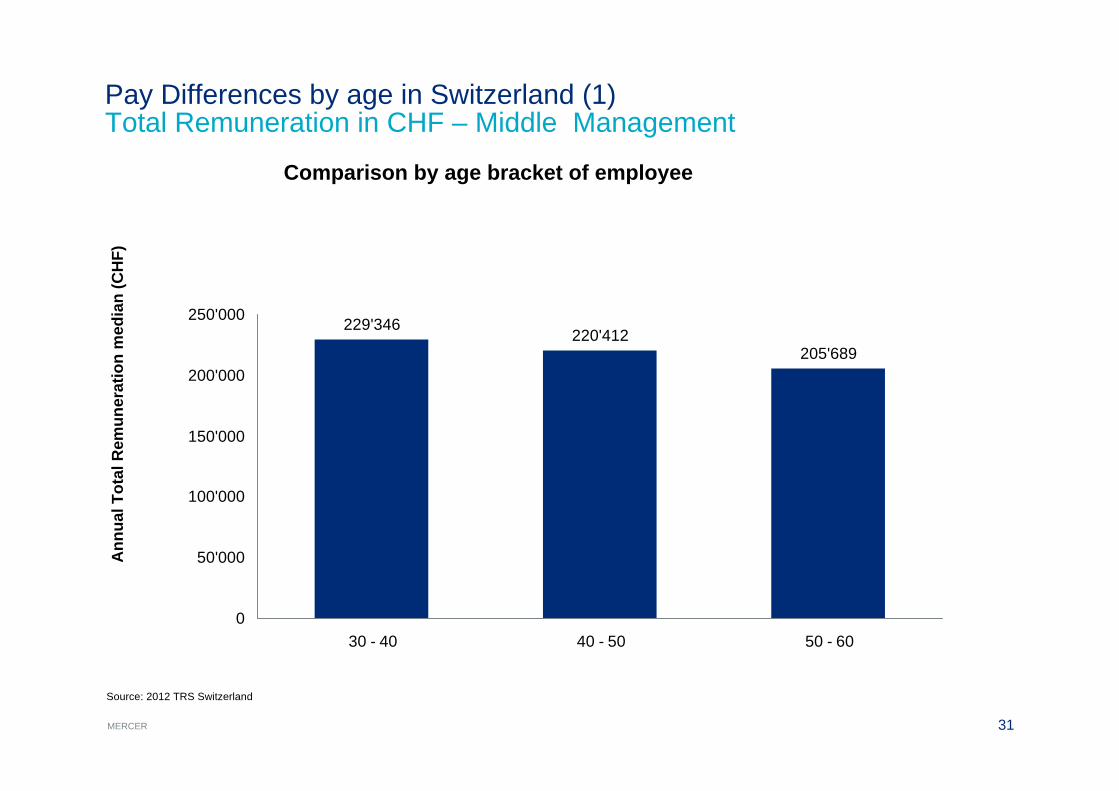
Pay Differences by age in Switzerland (1)Total Remuneration in CHF – Middle Management
229'346220'412
205'689
0
50'000
100'000
150'000
200'000
250'000
30 - 40 40 - 50 50 - 60
Ann
ual T
otal
Rem
uner
atio
n m
edia
n(C
HF)
Comparison by age bracket of employee
Source: 2012 TRS Switzerland
32MERCER
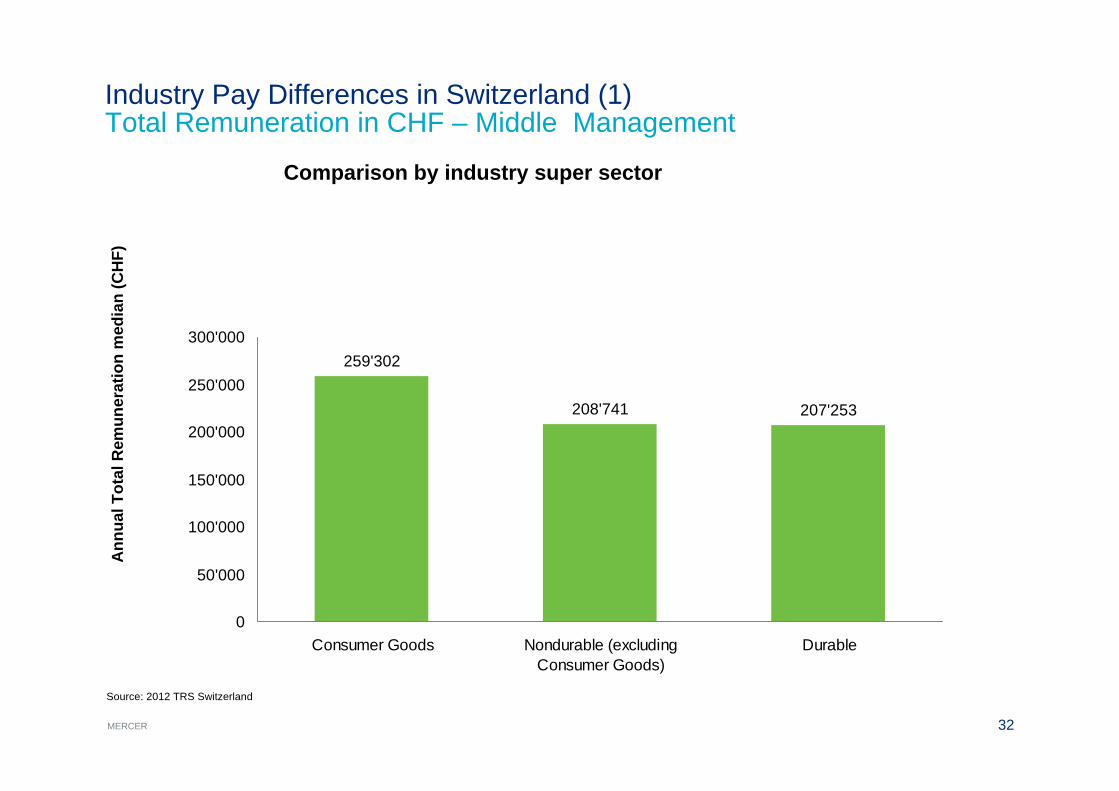
Industry Pay Differences in Switzerland (1)Total Remuneration in CHF – Middle Management
259'302
208'741 207'253
0
50'000
100'000
150'000
200'000
250'000
300'000
Consumer Goods Nondurable (excludingConsumer Goods)
Durable
Ann
ual T
otal
Rem
uner
atio
n m
edia
n(C
HF)
Comparison by industry super sector
Source: 2012 TRS Switzerland
33MERCER 33
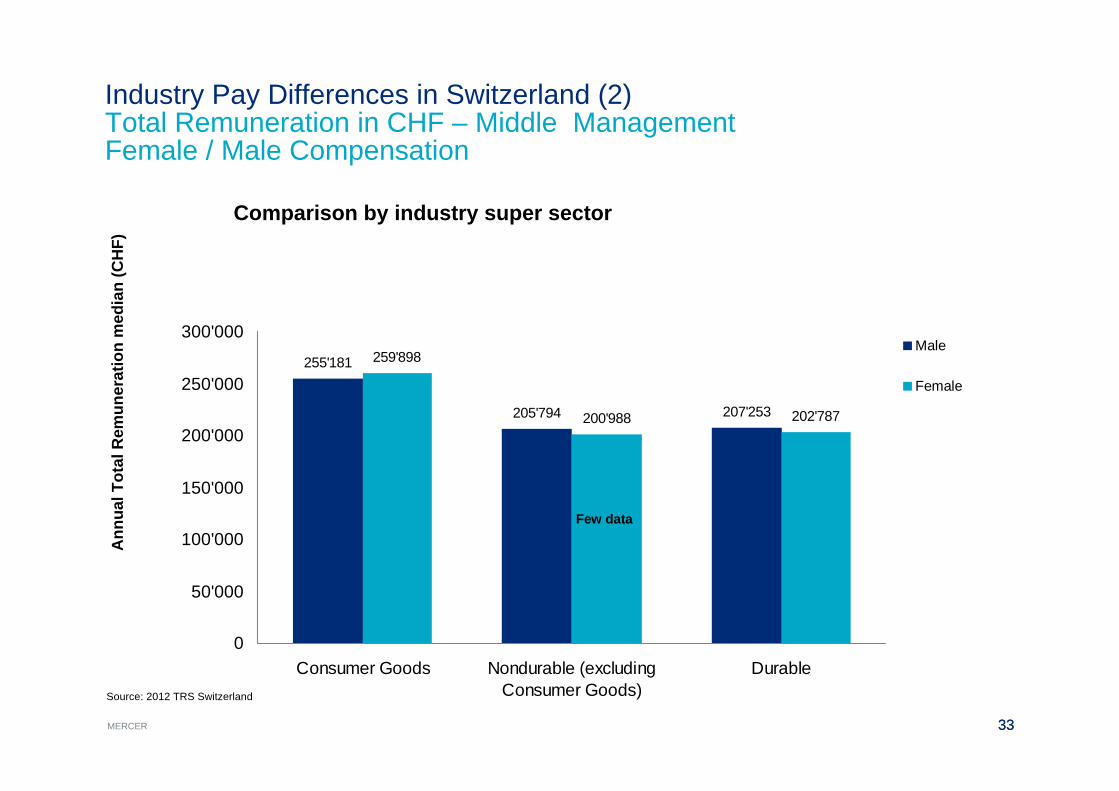
Industry Pay Differences in Switzerland (2)Total Remuneration in CHF – Middle ManagementFemale / Male Compensation
255'181
205'794 207'253200'988 202'787
259'898
0
50'000
100'000
150'000
200'000
250'000
300'000
Consumer Goods Nondurable (excludingConsumer Goods)
Durable
Male
Female
Source: 2012 TRS Switzerland
Ann
ual T
otal
Rem
uner
atio
nm
edia
n (C
HF)
Comparison by industry super sector
Few data
34MERCER 34
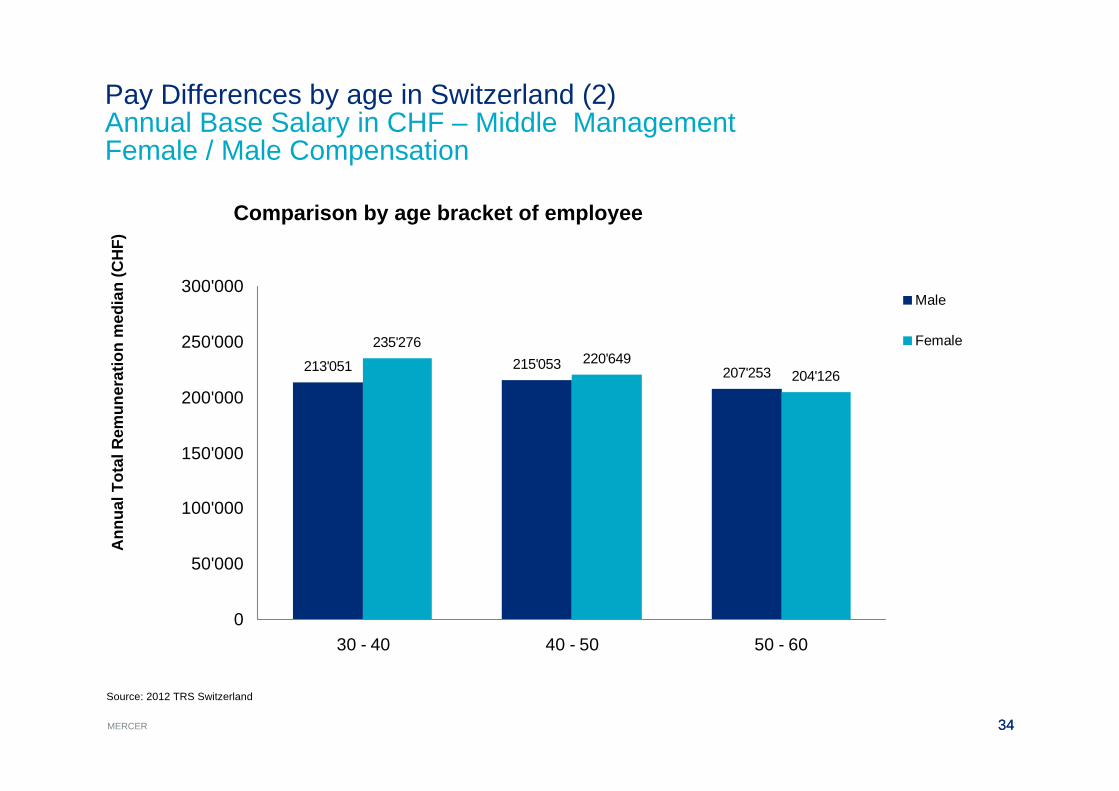
Pay Differences by age in Switzerland (2)Annual Base Salary in CHF – Middle ManagementFemale / Male Compensation
213'051 215'053 207'253
235'276220'649
204'126
0
50'000
100'000
150'000
200'000
250'000
300'000
30 - 40 40 - 50 50 - 60
Male
Female
Source: 2012 TRS Switzerland
Ann
ual T
otal
Rem
uner
atio
nm
edia
n (C
HF)
Comparison by age bracket of employee
35MERCER
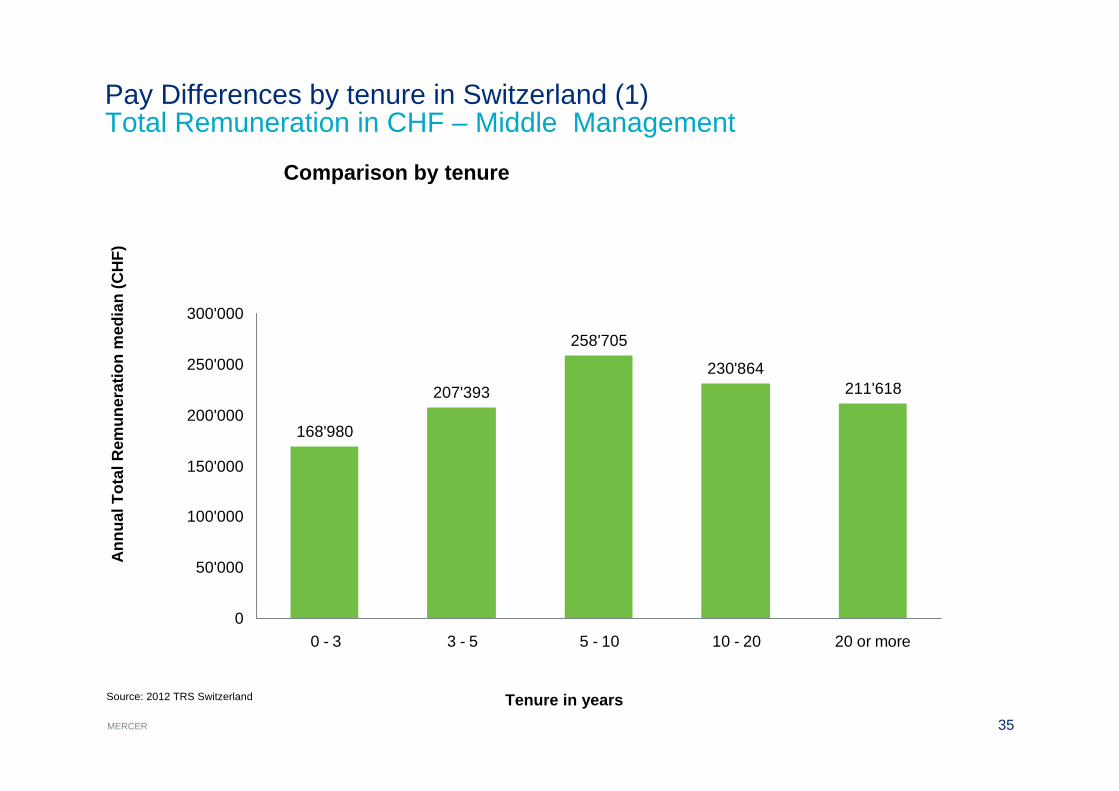
Pay Differences by tenure in Switzerland (1)Total Remuneration in CHF – Middle Management
168'980
207'393
258'705
230'864211'618
0
50'000
100'000
150'000
200'000
250'000
300'000
0 - 3 3 - 5 5 - 10 10 - 20 20 or more
Ann
ual T
otal
Rem
uner
atio
n m
edia
n(C
HF)
Comparison by tenure
Source: 2012 TRS Switzerland Tenure in years
36MERCER 36
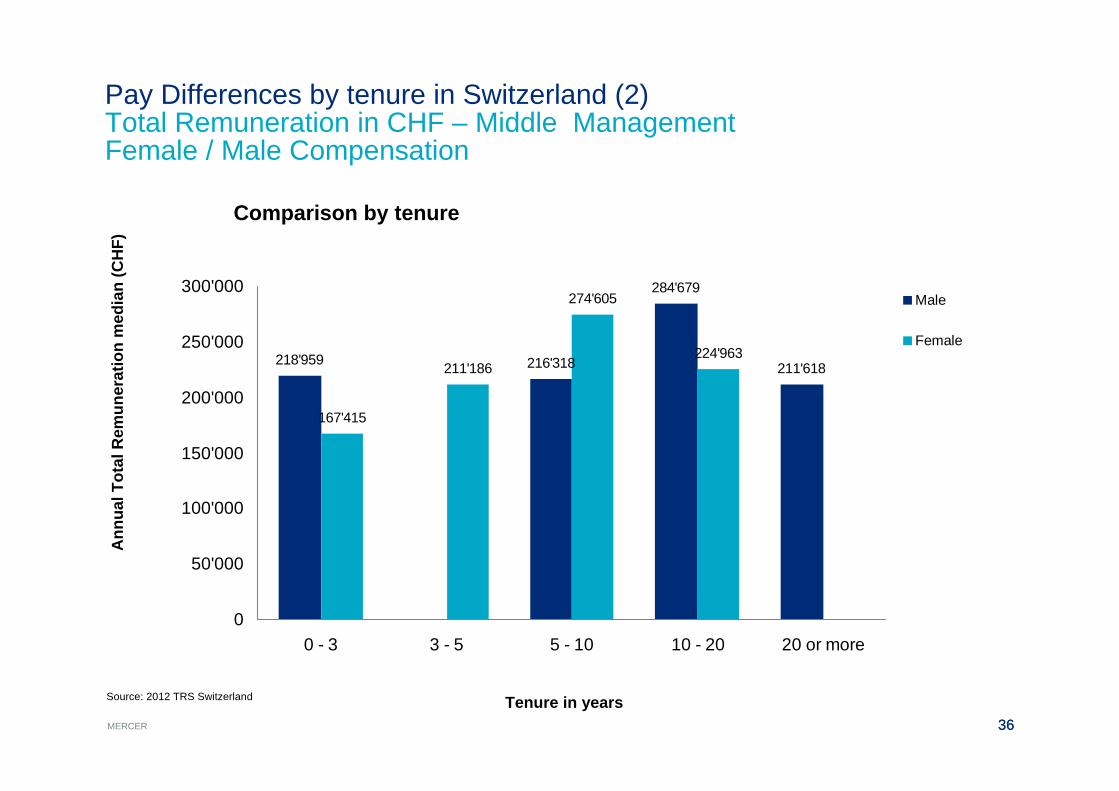
Pay Differences by tenure in Switzerland (2)Total Remuneration in CHF – Middle ManagementFemale / Male Compensation
218'959 216'318
284'679
211'618
167'415
211'186
274'605
224'963
0
50'000
100'000
150'000
200'000
250'000
300'000
0 - 3 3 - 5 5 - 10 10 - 20 20 or more
Male
Female
Source: 2012 TRS Switzerland
Ann
ual T
otal
Rem
uner
atio
nm
edia
n (C
HF)
Comparison by tenure
Tenure in years
37MERCER 37
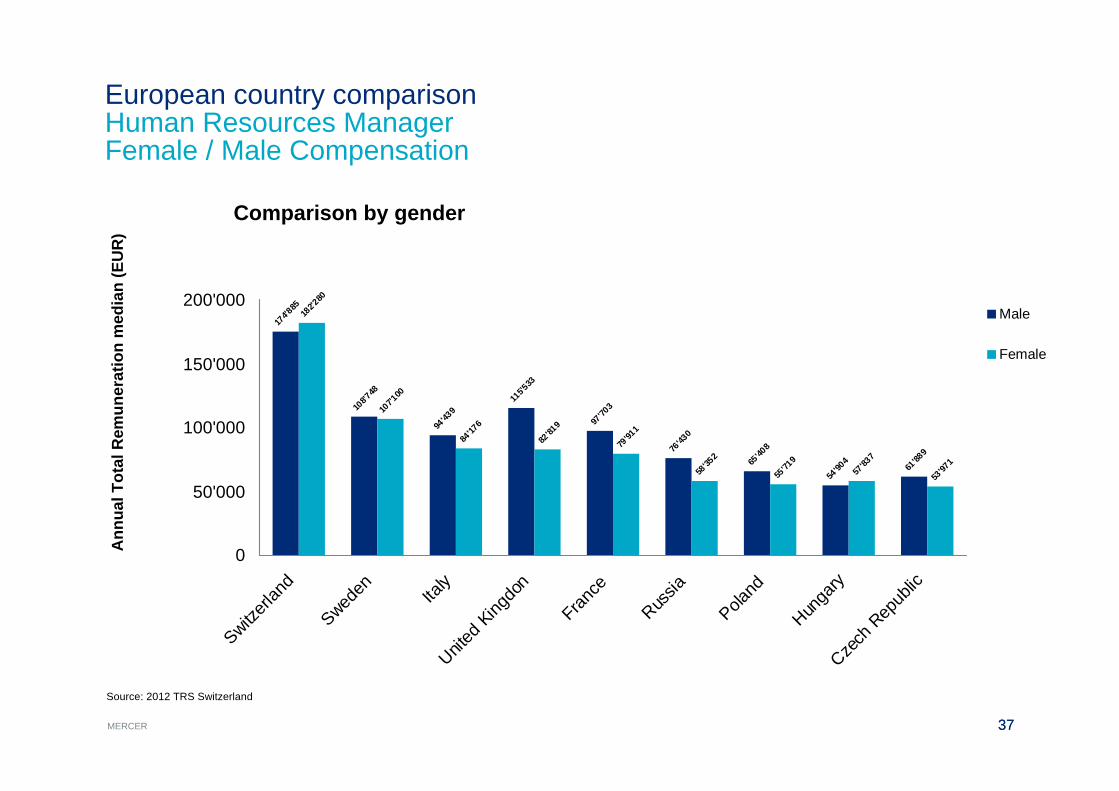
European country comparisonHuman Resources Manager Female / Male Compensation
174'8
85
108'7
48
94'43
9
115'5
33
97'70
3
76'43
0
65'40
8
54'90
4
61'88
9
182'2
80
107'1
00
84'17
6
82'81
9
79'91
1
58'35
2
55'71
9
57'83
7
53'97
1
0
50'000
100'000
150'000
200'000
Switzerl
and
Sweden Ita
lyUnit
ed King
don
France
Russia
Poland
Hunga
ryCze
ch R
epub
lic
Male
Female
Source: 2012 TRS Switzerland
Ann
ual T
otal
Rem
uner
atio
nm
edia
n (E
UR
)
Comparison by gender

38MERCER
78%59% 65%
39%29%
15%
12%
24%27%
36%
23%
22%
10% 18%25%
48%63%
0%
10%
20%
30%
40%
50%
60%
70%
80%
90%
100%
China
Sweden
Switzerl
and
Europ
e UK USSalary Short Term Incentives Long Term Incentives
2012 Pay Mix by Region
39MERCER
Conclusion
• Overall women still earn less than men
• The main difference is the bonus (variable part)
• There are far less women in Management and Top Management positions, their salary might sometimes be higher that their male peers
• Differentiation of data sources are also important such as age group, parent company nationality, industry sector, region and function
• Gender pay differences are omnipresent all over Europe
40MERCER
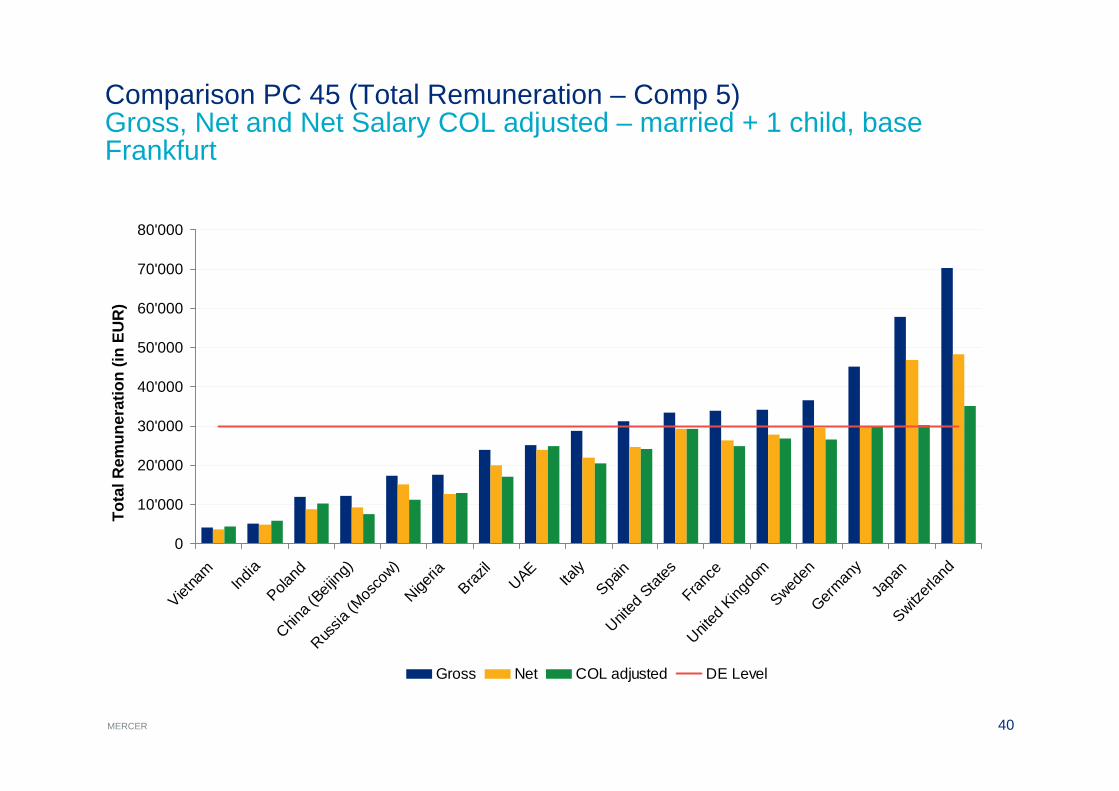
Comparison PC 45 (Total Remuneration – Comp 5) Gross, Net and Net Salary COL adjusted – married + 1 child, base Frankfurt
0
10'000
20'000
30'000
40'000
50'000
60'000
70'000
80'000
Vietna
m
India
Poland
China (
Beijing
)
Russia
(Mos
cow)
Nigeria
Brazil
UAE
Italy
Spain
United
States
France
United
Kingdo
mSwed
enGerm
any
Japa
nSwitz
erlan
d
Gross Net COL adjusted DE Level
Tota
l Rem
uner
atio
n (in
EU
R)
41MERCER
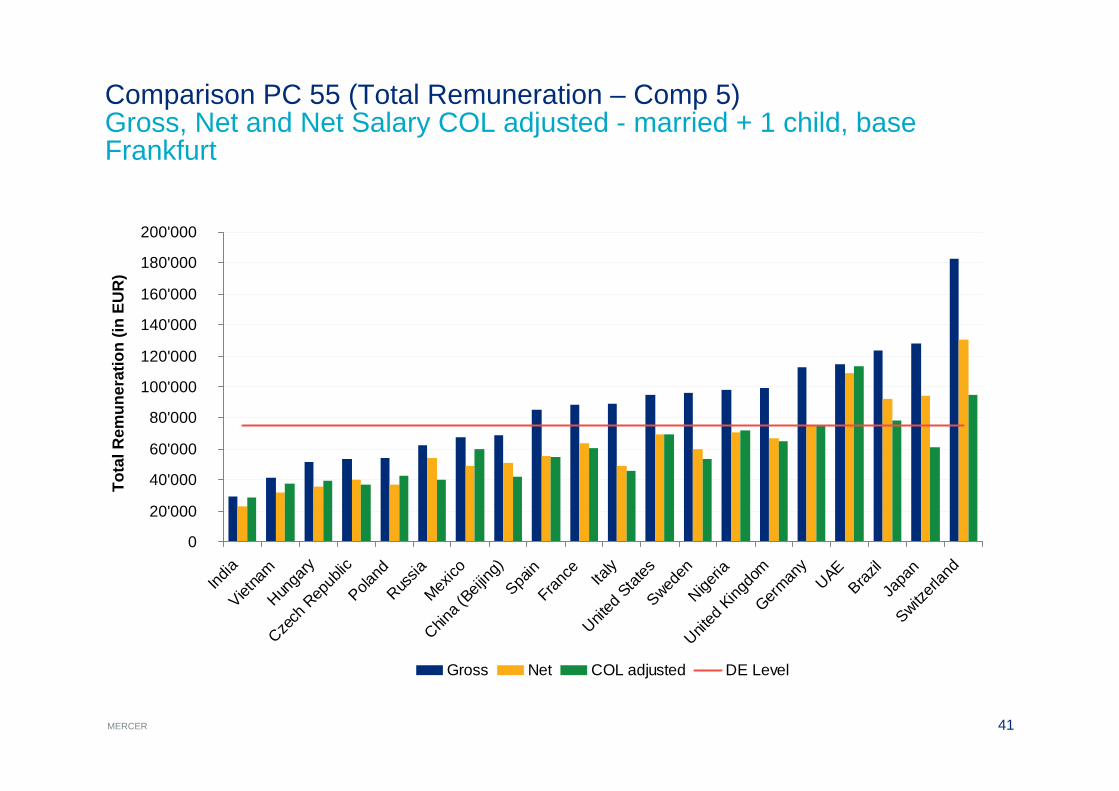
Comparison PC 55 (Total Remuneration – Comp 5) Gross, Net and Net Salary COL adjusted - married + 1 child, base Frankfurt
0
20'000
40'000
60'000
80'000
100'000
120'000
140'000
160'000
180'000
200'000
India
Vietna
mHun
gary
Czech
Rep
ublic
Poland
Russia
Mexico
China (
Beijing
)Spa
inFran
ce Italy
United
States
Sweden
Nigeria
United
Kingdo
mGerm
any
UAEBraz
ilJa
pan
Switzerl
and
Gross Net COL adjusted DE Level
Tota
l Rem
uner
atio
n (in
EU
R)
42MERCER
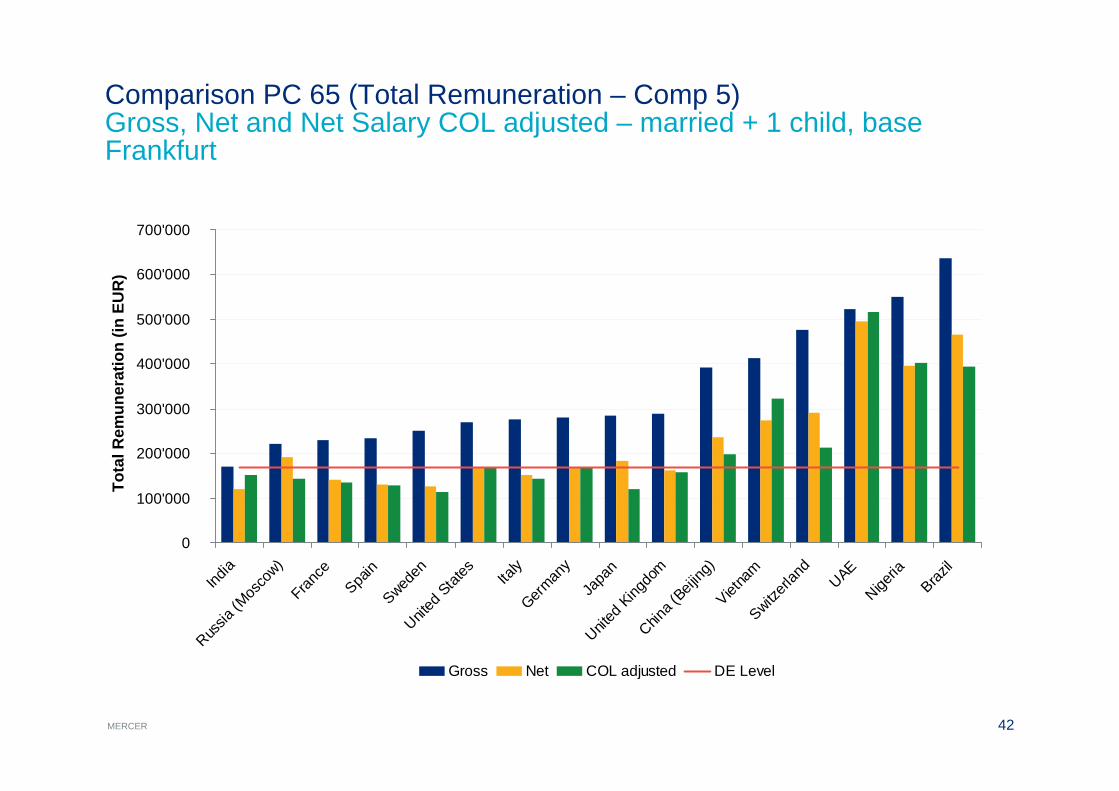
Comparison PC 65 (Total Remuneration – Comp 5) Gross, Net and Net Salary COL adjusted – married + 1 child, base Frankfurt
0
100'000
200'000
300'000
400'000
500'000
600'000
700'000
India
Russia
(Mos
cow)
France
Spain
Sweden
United
States Ita
lyGerm
any
Japa
nUnit
ed K
ingdo
mChin
a (Beij
ing)
Vietna
mSwitz
erlan
d
UAENige
ria
Brazil
Gross Net COL adjusted DE Level
Tota
l Rem
uner
atio
n (in
EU
R)

43MERCER