ePubWU Institutional Repositoryepub.wu.ac.at/3501/1/dusogugleryurtoglu_(2).pdf · Moreover, the...
50
ePub WU Institutional Repository Tomaso Duso and Klaus Gugler and Burcin B. Yurtoglu How Effective is European Merger Control? Article (Accepted for Publication) (Refereed) Original Citation: Duso, Tomaso and Gugler, Klaus and Yurtoglu, Burcin B. (2011) How Effective is European Merger Control? European Economic Review, 55 (7). pp. 980-1006. ISSN 0014-2921 This version is available at: Available in ePub WU : April 2012 ePub WU , the institutional repository of the WU Vienna University of Economics and Business, is provided by the University Library and the IT-Services. The aim is to enable open access to the scholarly output of the WU. This document is the version accepted for publication and — in case of peer review — incorporates referee comments. There are minor differences between this and the publisher version which could however affect a citation.
-
Upload
truongnhan -
Category
Documents
-
view
218 -
download
1
Transcript of ePubWU Institutional Repositoryepub.wu.ac.at/3501/1/dusogugleryurtoglu_(2).pdf · Moreover, the...

ePubWU Institutional Repository
Tomaso Duso and Klaus Gugler and Burcin B. Yurtoglu
How Effective is European Merger Control?
Article (Accepted for Publication)(Refereed)
Original Citation:Duso, Tomaso and Gugler, Klaus and Yurtoglu, Burcin B. (2011) How Effective is European MergerControl? European Economic Review, 55 (7). pp. 980-1006. ISSN 0014-2921
This version is available at: http://epub.wu.ac.at/3501/Available in ePubWU: April 2012
ePubWU, the institutional repository of the WU Vienna University of Economics and Business, isprovided by the University Library and the IT-Services. The aim is to enable open access to thescholarly output of the WU.
This document is the version accepted for publication and — in case of peer review — incorporatesreferee comments. There are minor differences between this and the publisher version which couldhowever affect a citation.
http://epub.wu.ac.at/

1
How Effective is European Merger Control?
Tomaso Duso
Humboldt University Berlin and WZB [email protected]
Klaus Gugler
Vienna University of Economics and Business [email protected]
Burcin B. Yurtoglu
University of Vienna [email protected]
Abstract This paper applies an intuitive approach based on stock market data to a unique dataset of large concentrations during the period 1990-2002 to assess the effectiveness of European merger control. The basic idea is to relate announcement and decision abnormal returns. Under a set of four maintained assumptions, merger control might be interpreted to be effective if rents accruing due to the increased market power observed around the merger announcement are reversed by the antitrust decision, i.e. if there is a negative relation between announcement and decision abnormal returns. To clearly identify the events’ competitive effects, we explicitly control for the market expectation about the outcome of the merger control procedure and run several robustness checks to assess the role of our maintained assumptions. We find that only outright prohibitions completely reverse the rents measured around a merger’s announcement. On average, remedies seem to be only partially capable of reverting announcement abnormal returns. Yet they seem to be more effective when applied during the first rather than the second investigation phase and in subsamples where our assumptions are more likely to hold. Moreover, the European Commission appears to learn over time. Keywords: Merger Control, Remedies, European Commission, Event Studies JEL Codes: L4, K21, G34, C2, L2
Corresponding author: Klaus Gugler, Department of Economics, Vienna University of Economics and Business (WU) Vienna, Austria . Tel.: 0043 1 427737467; Fax: 0043 1 427737498; e-mail: [email protected]. Acknowledgments: We would like to thank Jo Seldeslachts and Joe Clougherty for many useful discussions and for providing us with some data and Stephen Davies, Espen Eckbo, Lars-Hendrik Röller, Dennis Mueller, Paul Heidhues, Jennifer Rontganger, Giancarlo Spagnolo, Konrad Stahl, seminar participants at the WZB, University of Vienna, University of Amsterdam, University of Mannheim, LMU University of Munich, City University London, UK Competition Commission, ESMT, and conference participants at the CEPR conferences in Paris (2005) and Brussels (2005), EEA 2006, EARIE 2007, and ASSET 2007 for helpful comments. We very much benefited from the detailed comments of three anonymous referees, the editor Gerard Pfann, and an associate editor. Cinzia Alcidi, Claudia Baldermann and Constanze Quade provided excellent research assistance. Tomaso Duso gratefully acknowledges financial support from the Deutsche Forschungsgemeinschaft through SFB/TR 15. Klaus Gugler and Burcin Yurtoglu gratefully acknowledge support by the OeNB Jubilaeumsfonds and the Austrian FWF.

2
1. Introduction
This paper aims to provide econometric evidence on the effectiveness of merger control decisions
in the European Union (EU). This seems to be both necessary and timely. From an academic
perspective, there is a lively on-going discussion among antitrust scholars as to whether there is
any need for a competition policy at all, as witnessed by the discussion spurred by Crandall and
Winston’s (2003) and Baker’s (2003) papers. In particular, merger control institutions are
repeatedly under criticism: they are ineffective and do not deter anticompetitive conduct (Crandall
and Winston, 2003), they destroy synergistic efficiencies by unnecessarily intervening in the
market place (Aktas, et al. 2004), are protectionist (Aktas et al., 2007), are relatively open to
capture (Evans and Salinger, 2002), might not be the best instrument to prompt technological
progress (Carlton and Gertner, 2003), or they are too lenient and allow anticompetitive mergers to
go through (Kim and Singal, 1993).
From the policy standpoint, throughout the last decade there has been a clear shift in
merger control to consider remedies as a superior policy instrument if compared to outright
prohibitions. Remedies are supposed to function as a surgery treatment in that they effectively
tackle the market power concerns potentially raised by mergers without destroying efficiency
enhancing synergies.1 In this instance, the European experience is enlightening. The European
Commission cleared most of the over 4,200 notified mergers since 1990 without commitments
(around 90%), as they presumably do not pose a threat to competition. Nonetheless, few major
mergers have been completed without some conditions and obligations being offered by the parties
and implemented by the agency, such as divestitures, provision of access, termination of
agreements, or other behavioral requirements. More than 60% of phase 2 decisions were cleared
compatible only with commitments; yet only 20 mergers were blocked between 1990 and 2009.2
Moreover, significantly fewer proposed mergers have been blocked in recent years, following the
overruling of three of the Commission’s prohibitions by the European Court of Justice
(Airtours/First Choice; Schneider/Legrand; and Tetra Laval/Sidel), which were under the media
spotlight and triggered major institutional changes in European antitrust.3 A similar evolution of
merger policy is reflected in the American experience. The Federal Trade Commission (FTC) and
the Department of Justice (DOJ) have also been increasingly making use of remedies in merger
1 This tendency in the policy arena is reflected by several recent reports on remedies by the world’s major antitrust jurisdictions (FTC, 1999; OFT, 2005; DG COMP, 2005) and international organizations (OECD, 2004), as well as the issuing of remedy guidelines (FTC, 1999; EC, 2001; DOJ, 2003). See Davies and Lyons (2007) for an excellent overview of the topic. 2 See http://ec.europa.eu/competition/mergers/statistics.pdf for constantly updated statistics on EU merger control. 3 These events made it very difficult for the Commission to block further mergers. Indeed, no merger was blocked in 2002, 2003, 2005, 2006, and 2009 and only one was blocked in 2004 and 2007, respectively.
3
control decisions during our sample period (see figure 1).4 However, unlike the European
Commission, prohibitions have been intensively employed in the U.S., especially during the last
three years of our sample.
[figure 1 about here]
Despite the economic importance and intense policy debate, there is almost no systematic
econometric evidence on whether merger policy achieves what it is supposed to achieve, namely to
“protect and restore effective competition”, nor on whether remedies are indeed the most
appropriate instrument. We analyze the effects of merger control decisions using a sample of 151
mergers scrutinized by the European Commission between 1990 and 2002. We use evidence from
the stock markets as an independent and ex-ante assessment of the competitive consequences of
the mergers and the EU Commission’s decisions. In the first step, we use a standard event study
methodology to compute cumulative average abnormal returns (CAARs) around relevant events
for both merging firms and for their rivals, which have been identified by the Commission itself
and retrieved from its published files. Our starting point is that CAARs around the merger
announcement should capture the merger’s competitive impact, while CAARs around the
announcement of the Commission’s decision should measure the merger policy’s effects (e.g.
Eckbo and Wier, 1985).
Clearly, in order to make this inference, one has to account for the market expectations
regarding the merger control procedure’s outcome. This is one of the first novelties of our
approach, which we believe increases the reliability of CAARs as a measure of the competitive
effect of a merger and a merger decision. We propose using the observable characteristics of a
merger to estimate the probability of a particular antitrust intervention, and correct our profitability
measures (i.e. CAARs) accordingly. In doing so, we must rely on the assumption that, on average,
the market does not perfectly foresee the Commission’s decisions.5
The final step constitutes the major innovation of our approach and lies in relating these
expectation-corrected stock market reactions by using regression analysis to assess the
effectiveness of merger control. The intuitive basic idea is that, under a set of assumptions that we
thoroughly discuss, anticompetitive rents generated by the merger and measured around its 4 We thank Joe Clougherty and Jo Seldeslachts for providing us with the U.S. data. While it seems that frequency of an action is higher in the EU than in the U.S., this is surely due to the kinds of mergers under scrutiny in the two jurisdictions. In the EU, only large mergers are notified to the Commission, the smaller ones being under the jurisdiction of the national authorities. Instead, the DOJ and FTC are in charge of all U.S. mergers which are above specific thresholds. 5 This seems a reasonable assumption supported by anecdotal evidence. On February 17, 2010, the DOJ approved the alliance between British Airways (BA) and American Airlines (AA), provided that the parties make four pairs of London Heathrow takeoff and landing slots available for up to 10 years to transatlantic competitors. The companies’ share price as well as that of their partners (Iberia and Finair) sharply increased. Reuters news agency stated: “Four daily slot pairs is better than analyst expectation of six and significantly better than the 32 that the alliance was asked to give up back in 2001, the last time BA/AA applied for immunity.” The market updated its belief about the profitability effect of the antitrust decision.
4
announcement should be dissipated by the antitrust authority decision, if this is effective. Hence,
we expect a negative relation between decision CAARs and announcement CAARs. Additionally,
the design of our test gives us a potential benchmark for a remedy’s effectiveness and,
simultaneously, a robustness check for our approach: outright prohibitions should dissipate all
rents that would have been generated by the merger and restore effective competition. Thus, we
expect a coefficient of minus one in this case.
Reassuringly, in all regressions and specifications, we get a negative coefficient in the case
of prohibitions, which is almost never significantly different from minus one. Furthermore, our
findings also suggest that remedies are on average only partially capable of reverting the rents
generated around the merger announcement. According to our framework, we interpret this result
as remedies not being able to solve anticompetitive concerns on average. Yet, we can qualify this
finding. Remedies seem to be more effective when the anticompetitive concerns are not too severe,
and when applied during the first rather than the second investigation phase. Moreover, the
European Commission appears to learn over time, since remedies seem to be more effective when
applied in “remedy-intensive” industries, i.e. industries where many remedies have been applied
before.
A set of four maintained assumptions are the foundation of our theoretical framework. To
verify the validity of our inference, we present a large number of robustness checks, which should
account for the potential failing of each of these assumptions. In particular, we assume that after
correcting for the market expectations about the merger control procedure, rivals’ abnormal returns
around the first rumor about the specific merger can be taken as an indication of the merger’s
competitive effects.6 Being conscious that it might be restrictive to ignore that announcement
effects intermingle other information, we are very careful to provide several pieces of evidence to
6 The casual reading of the daily business press provides several examples in line with this main assumption. On November 12, 2009, two large mergers were announced of which commentators viewed one as clearly anticompetitive and the other as clearly pro-competitive. British Airways (BA) and Iberia announced a merger, whereby BA shareholders should end up with 55% and Iberia shareholders with 45% of the new company. The two companies would create the world's third largest airline by revenue after Air France-KLM and Lufthansa. The share prices of the involved companies and their rivals increased the days surrounding the announcement: BA's and Iberia's share prices rose by around 10% and 15%, respectively. Likewise, their main rivals shares' rose by around 7% (Lufthansa) and 6% (Air France-KLM), while the peer market indexes only rose by around 1% in that time period. Many commentators viewed this merger as being anticompetitive, mainly on the grounds that the Oneworld alliance (i.e. BA's alliance) already had a "tight grip" on the Heathrow airport, and the merger would make matters worse particularly concerning take-off and landing slots (see e.g. AFX News, November 13, 2009). The observed announcement “abnormal returns” are consistent with this interpretation. The same day, Hewlett-Packard (HP) announced the takeover of 3Com, paying a 40% premium over the pre-announcement share price. Despite that, HP shares also rose by around 2%, whereas the Dow Jones approximately remained flat. The deal was widely seen as being aimed at Cisco Systems, the leader in computer networking (see e.g. Jordan Robertson, November 12, 2009, AP Technology, "HP's 3Com takeover marks a shot at Cisco"), since the biggest companies that provide corporate computing infrastructure try to become "one-stop technology shops". Thus, 3Com assets are complementary to HP's and allow HP to offer more integrated solutions to customers. Cisco lost 2% in value on the day of the announcement of the deal, precisely in line with the idea that the stock market believed it to be a pro-competitive takeover.
5
support our results. Our main results are confirmed and reinforced in those subsamples, where our
assumptions are more likely to hold.
The approach based on stock market data, despite its difficulties, has several major
advantages if compared to the use of other data sources. First and most notably, it allows one to
disentangle the merger from the decision effects, whereas looking at the effects on firms’
accounting profits just allows one to measure the net effect. Second, it does not require one to
define the time span along which the merger effects should be observed. Finally, it allows one to
analyze blocking decisions and avoid a potential censoring problem due to the fact that the impact
of a merger is only observed if the merger takes place.
The paper proceeds as follows. Section 2 presents a short overview of the literature on the
assessment of competition policy. Section 3 briefly presents the institutional background of EU
merger control. Section 4 discusses our main methodology, hypotheses, and maintained
assumptions as well as robustness tests. In section 4, we introduce the data and some summary
statistics, and section 5 presents our main results as well as our robustness checks. Section 6 sums
up and concludes. Appendix 1 formally describes the event study methodology, Appendix 2
explicitly spells out our approach to correct the profitability measures for the market expectations
about the antitrust decision, and Appendix 3 provides a graphical exposition of our theoretical
framework.
2. Literature Review
The evaluation of competition policy effectiveness has attracted academic and policy interest since
the early 1970s. Earlier studies evaluated the ex-post effectiveness of merger control decisions and,
in particular, ordered remedies in the USA using a case-by-case approach. Elzinga (1969),
Pfunder, Plaine and Whittemore (1972) and Rogowsky (1986) use a methodology that is based on
classifying ordered remedies as successful, sufficient, deficient, or unsuccessful depending on
whether they fulfill certain criteria. While Elzinga (1969) argues that only one out of ten cases can
be classified as successful or sufficient, the success rate in Rogowsky (1986) increases to 40%.
More recent analyses are reported in two studies commissioned by antitrust authorities of
the U.S. and EU. The report commissioned by the FTC (1999) reviews 35 divestiture orders from
1990 through 1994. Based on interviews, the study finds that most divestitures appear to have
created viable competitors in the concerned market (28 out of 37). A higher percentage of
divestitures (19 out of 22) were successful when they involved the sale of an entire ongoing
business. The Directorate General for Competition of the European Commission also recently
published an in-house study on merger remedies (DG Comp, 2005). It reviews the design and
implementation of 85 different remedies adopted in 40 decisions by the European Commission

6
between 1996 and 2000. The analysis is also done by means of interviews with the committing
parties or sellers, licensors and grantors, the purchasers or buyers, licensees and grantees and the
trustees. More than half (57%) of the analyzed remedies were considered to have been effective,
24% were only partially effective since they raised design or implementation issues that were not
resolved during implementation, 7% were clearly “ineffective”, and 12% have been categorized as
“unclear” remedies. Interestingly, phase 1 remedies were considered more effective than phase 2
remedies. This may be due to the generally higher complexity of second phase cases. Phase 2
investigations differ from phase 1 investigations in view of the drastically different timeframes
involved (six weeks vs. four month) and that remedies proposed in phase 1 need to be clear-cut
and straightforward. While certainly informative, the fact that these divestiture studies only use
qualitative information (interviews) for a small number of cases limits their generality.
Ellert (1976) is the first study that looks at the valuation effects of anti-merger complaints
on firms’ stocks. He does not, however, consider the impact on rivals’ stock returns, which was
first proposed by Eckbo (1983), Stillman (1983), and Eckbo and Wier (1985). Although they find
significantly positive abnormal returns for rival firms, they argue that this positive valuation effect
may be due to positive information released by the merger: the merger announcement is good news
from the rival firms’ perspective, because it makes them (or the market) aware of real profit
opportunities that were so far unknown. In particular, the paper by Eckbo and Wier (1985) makes
the point that the only pattern consistent with a merger being anticompetitive is positive abnormal
returns to rivals at a merger’s announcement and negative abnormal returns at the antitrust
complaint. They do not find evidence for such patterns, and they therefore reject the collusion
hypothesis in favor of their information hypothesis.7 While our approach makes use of the same
kind of logic, we improve substantially on the identification issue as we explicitly relate
announcement and decision abnormal returns by means of regressions to make more precise
inference about the effectiveness of remedies. Moreover, different from these earlier studies, we
also correct for the market expectations about the merger control inquiry, which improves the
identification of the merger competitive effect.
The papers most closely related to the present one, in terms of data and research focus, are
probably Duso, Neven, and Röller (DNR, 2007), and Aktas et al. (2004, 2007). Using the same
sample of EU mergers as utilized in this paper, DNR (2007) show that for at least half of the
mergers rival firms benefit after the merger is announced, i.e. they can be considered to be
7 These early studies have been challenged by McAfee and Williams (1988) and Werden and Williams (1989). They argue that the failure to detect market power may be due to rivals being large conglomerates that receive only a small portion of their profits from the relevant market. They also argue that the existence of effective merger control may have had a deterrent effect on certain types of attempted mergers, which cannot be measured with this methodology. Finally, they claim that event studies of individual mergers are unreliable because stock prices provide very noisy information about the collusive effects of mergers. Eckbo (1989) offers a rebuttal to most of these criticisms.

7
anticompetitive. By contrasting the markets’ reactions with the actual Commission’s decisions,
they define type I errors (i.e. pro-competitive mergers blocked or modified by the authority) and
type II errors (i.e. anticompetitive mergers unconditionally cleared). Using probit regressions, they
show that procedural issues, market definition, as well as the merging firms’ country and industry
of origin play crucial roles in predicting both kinds of errors, while lobbying activities by firms do
not. The fact that the Commission made mistakes is a first hint about the potential “non-
effectiveness” of its policy. However, DNR (2007) did not look at the effects of the decisions.
Hence, our study should be seen as the natural next step in understanding the effectiveness of EU
merger policy.
Aktas et al. (2004) look at 602 EU Commission decisions involving 1,070 firms and
document significant abnormal returns for the target firms and smaller and less significant bidder
abnormal returns. As does this paper, they also estimate abnormal stock price reactions to phase 1
and phase 2 decisions, and find that outright prohibitions are associated with negative abnormal
returns and approvals subject to conditions are relatively good news. However, they do not look at
the effects on rival firms and they do not make inferences about the quality of antitrust. In a
follow-up paper, Aktas et al. (2007) look more closely at the issue of whether the Commission
decisions can be interpreted as being protectionist in the sense of protecting European firms from
foreign competitors. They enlarge their previous dataset by estimating CAARs for rivals as well.
Some of their results seem consistent with decisions increasing consumers’ surplus. Yet they find
that the likelihood of an intervention by the EU Commission is higher when the merger is
proposed by a bidder from outside the EU and has a negative effect on European rivals. They
interpret this result as the European merger control being protectionist. Clearly, this paper focuses
on one important yet very peculiar aspect of merger control. We therefore aim to provide a broader
framework, which can be more generally used to evaluate the effectiveness of merger policy.
To sum up, the evidence on merger control decisions is rather mixed. Studies of remedies
in a case-by-case approach point to the superiority of structural over behavioral remedies, and
possibly phase 1 over phase 2 remedies (DG Comp, 2005), but leave doubt about their general
effectiveness. Theoretical arguments underline this conclusion.8 Most studies based on stock
market reactions find positive effects of mergers for rival firms, yet the interpretation of this result
differs. Some authors interpret this as being consistent with the information revelation hypothesis
8 Motta, Polo, and Vasconcelos (2003) enumerate the pros and cons of the different kinds of remedies (i.e. structural and behavioral) used by the European Commission. While in principle they favor the use of structural remedies to clear problematic mergers, they also point to information asymmetries and incentive problems, as well as to the increased possibility of pro-collusive effects of divestitures. Davies and Lyons (2007), based on their empirical study using simulations, suggest that for global mergers behavioral remedies might be preferred in national markets especially when a national authority can monitor their application. Farrell (2003) argues that the effectiveness of structural remedies may suffer from inadequate buyers, "over" (or "miss"-) fixing and the discounting of merger efficiencies. Cabral (2003) instead supports the superiority of structural remedies.

8
(e.g. Eckbo, 1983; and Eckbo and Wier, 1985), while other authors interpret it as consistent with
the market power hypothesis (e.g. Simpson, 2001; DNR, 2007). In what follows, we try to resolve
these ambiguities.
3. Institutional Features
Merger control in the EU began with the European Communities Merger Regulation (ECMR),
which came into force on September 21, 1990.9 According to the ECMR, a merger has community
dimension, hence it is under the jurisdiction of the Commission, if “it takes place between firms
with a combined worldwide turnover of at least 5 billion Euros and a turnover within the European
Economic Area of more than 250 million Euros for each of at least two of the undertakings unless
each undertaking achieves more than 2/3 of its aggregate Community turnover within one and the
same member state.” This definition also includes mergers between firms that produce outside of
Europe and sell in Europe. If necessary, a merger can be referred back to the member states for
review.
Art. 2(3) of the ECMR states that: “A concentration, which creates or strengthens a
dominant position as a result of which effective competition would be significantly impeded in the
common market or in a substantial part of it, shall be declared incompatible with the common
market.” This is commonly referred to as the dominance test (DT). The DT constitutes an
important difference to the SLC (Substantial lessening of competition) test, which is used by U.S.
competition authorities. Some observers (e.g., Lyons, 2004) argue that the DT puts unnecessary
weight on the concept of dominance in cases where the most important issue concerns the
significant impediment of effective competition. The new merger regulation, which was applicable
from May 1, 2004, focuses on a merger’s impact on competition.
These regulations define the legal steps, which serve to control concentrations between
undertakings (see figure 2), and which provide important dates for our event study. After receiving
notification of the concentration, the Commission has 25 working days to assess whether the
concentration is compatible with the common market (the phase 1).
[figure 2 about here]
The Commission can either clear the proposed concentration unconditionally (Art. 6.1.b), it
can decide to let it go through after verifying that the commitments and obligations proposed by
the undertakings can effectively restore competition (Art. 6.2), or it can decide that the proposed
concentrations raise serious doubts as to their compatibility with the common market (Art. 6.1.c)
and, therefore, a more in-depth analysis is needed (notice that the Commission cannot out-rightly
9 Council Regulation (EEC) No. 4064/89 was amended by Council Regulation (EC) No. 139/2004 on the control of concentrations between undertakings that entered into force on January 20, 2004. Commission Regulation (EC) No.802/2004 implements the Council Regulation (EC) No. 139/2004.

9
block a merger after the phase 1 investigation). In this case, the Commission opens the so-called
phase 2, which consists of 90 working days, during which an in-depth investigation is carried out.
Generally, the Commission makes use of the entire available time, given the problematic nature of
these cases, after which it has to come to a final decision: block the merger (Art. 8.3), let it through
unconditionally, or clear it with commitments and obligations (Art. 8.2).
Looking at figure 2, there are three events which are important for our empirical analysis.
The first is the merger announcement, which we define as the first merger-specific rumors
appearing in the press, and which should help us identify the market’s assessment of the merger’s
competitive effects. The other two relevant events are the phase 1 and the phase 2 decision dates,
which should help us identify the effect of the merger control procedure.
4. Hypotheses, Methods, and Robustness Tests
This section develops the core framework of our analysis. The central idea of this paper is that an
effective merger control should dissipate anticompetitive rents generated by the merger. Therefore,
merger control effectiveness can be assessed in several steps: (i) theoretically identify
anticompetitive rents, (ii) empirically quantify the rents generated by mergers and merger control
decisions, (iii) relate these measures by means of regression analysis to assess the extent of rent
reversion achieved by different merger control tools.
Next, we separately describe these steps, explicitly spell out the framework’s founding
assumptions, and discuss our empirical predictions and how they might be affected if our
maintained assumptions fail to hold. Throughout the paper, we assume that stock markets are
efficient in a semi-strong form, i.e. that the prices of stocks reflect all publicly available
information. We share this basic hypothesis with the entire literature using the event study
methodology; hence we will not try to give an appraisal of this central assumption.
4.1. Defining the Competitive Effects of Mergers
Oligopoly theory (e.g. Stigler, 1950) predicts that when firms merge they potentially generate two
externalities on rival firms: A positive externality due to the merger’s market power effect and a
negative externality due to the potential efficiency gains generated by the merger. The first effect
arises as post-merger there is one less firm in the market and, ceteris paribus, pricing will be less
aggressive leading to higher prices and profits (“price umbrella”). In both standard Industrial
Organization models of imperfect competition – Cournot and Bertrand with differentiated products
– market output declines and prices rise absent efficiency gains (e.g. Salant et al., 1983, Deneckere

10
and Davidson, 1985; and Farrell and Shapiro, 1990).10 Rival firms gain, as they do not bear the
quantity reduction of insiders and nevertheless benefit from the higher prices. The second effect,
higher efficiency, leads to lower prices, benefits insiders and consumers, while rival firms lose
from fiercer competition. It is likely that in most mergers both effects are simultaneously present;
we therefore look at the net effects. Our first maintained assumption is:
Assumption 1: Anticompetitive mergers generate a positive externality on rivals, i.e. an increase
in rivals’ profits identify anticompetitive, i.e. consumer welfare decreasing, rents.
Our identifying assumption, i.e. the relation between the increase in rivals’ profits and the decrease
in consumer surplus (CS), is theoretically satisfied by many – but not all – oligopolistic
environments. Our framework focuses on the Industrial Organization approach of unilateral effects
in horizontal mergers in a static setting. There are situations in which the identification of changes
in consumer surplus through changes in competitors’ profits may break down. For instance, in a
dynamic context of sequential mergers (e.g. Nocke and Whinston, 2008), our identification would
work only under certain conditions. In particular, the holding of our assumption will crucially
depend on the nature of the sequence of mergers.11 Second, in models of endogenous mergers this
correspondence might break down, e.g. due to the so-called in- and out-of-play effects. Notice,
however, that our identification strategy would still work, even in these more sophisticated models,
under some additional conditions. Fridolfsson and Stennek (2009), for example, show that our
identification would work if the in- and out-of-play effects are not particularly strong. The
correspondence might also be lost in non-horizontal mergers, e.g. in a vertical merger consumers
may be hurt as well as rivals if the merger forecloses competitors. Finally, the correspondence
might be lost in the presence of strong agency problems, when mergers are undertaken for
managerial reasons which contrast with profit maximization (see Gugler et al., 2003).
Therefore, we expect our approach to be more appropriate for horizontal (rather than
vertical or conglomerate) mergers, for mergers which do not come in an industry-specific wave
and where the signaling of future industry-wide efficiency is less important, and for profitable
(rather than unprofitable) mergers. We do not think that non-horizontal mergers are problematic
for the present study, as most of the mergers in our sample have predominantly horizontal effects
and would now fall under the "Horizontal Merger Guidelines". However, we add in all regressions
a dummy that takes on the value of one in all those mergers, for which the Commission identified
10 The papers by DNR (2007) and Gugler and Siebert (2007) provide a formal analysis of this point in a Cournot framework. They also prove that this theoretical identification also holds in Bertrand models of price competition and product differentiation. 11 Nocke and Whinston (2008) show that if a merger is CS-decreasing in isolation it remains CS-decreasing if another merger takes place that is CS-non-increasing in isolation. However, there might be situations where a CS-decreasing merger becomes CS-increasing conditional on a previous CS-non-decreasing merger occurring.

11
"vertical", "foreclosure", or "conglomerate" concerns. Moreover, to more directly address this
issue, we run a robustness check, where we exclude all mergers that were not purely horizontal
according to the Commission’s analysis. We next turn to measuring announcement and decision
effects of mergers.
4.2. Measuring Announcement and Decision Effects
The second step of our approach consists of choosing an empirical measure for the profit effects of
a merger and the merger control decision. Following a long tradition in merger analysis starting
with Eckbo (1983) and Stillman (1983), we use stock market reactions to the announcement of a
merger and the merger decision to evaluate the impact of such events on merging firms’ and
competitors’ profits.12 Though this approach to evaluate the competitive effect of a merger has the
clear advantages that we discussed above it might be problematic. Indeed, the abnormal returns
measured around the merger announcement potentially entail four major components: (i) The
merger’s competitive effect (what we ought to measure), (ii) the effect of a shock that triggers the
merger (the merger wave/future acquisition probability or in-play effect), (iii) the information
about the allocation of the role in one particular merger (e.g. the out-of-play effect), and (iv) the
market expectations about the outcome of the antitrust procedure. Our second maintained
hypothesis is:
Assumption 2: After correcting for the market expectations about the outcome of the antitrust
inquiry, CAARs around the merger-specific first rumors measure the merger’s competitive effect.
This is clearly our most crucial assumption and it needs further discussion. First, if markets are
semi-strong efficient, they should account for the future antitrust decision when reacting to a
merger announcement (e.g. Eckbo, 1992). One of the innovations of this paper is to develop a
strategy to account for these expectations.13 In Appendix 2, we discuss our methodology to correct
CAARs for the expectations about the Commission’s decision. In short, we assume that the market
builds expectations on the possible antitrust decision based on the public information about the
merger and the Commission’s records available in the market around the merger announcement.
We quantify these expectations by estimating the probability of a particular decision as a function
of the observable merger characteristics. We then correct our CAARs accordingly. The
expectation-correction for the announcement CAARs make them a cleaner measure of the merger
12 In Appendix 1 we shortly review this standard methodology. A discussion of the literature using event studies in merger analysis can be found in Duso, Gugler, and Yurtoglu (2007). 13 Our approach is also in line with existing studies in the finance and corporate finance literature, e.g. Malatesta and Thompson (1985) and Acharya (1993), which propose a similar methodology to deal with the issue of separating the economic effects from anticipation effects.

12
effect. The expectation-correction for the decision CAARs make them a clearer measure of the
surprise entailed in the Commission’s decision and, hence, of its competitive effect.
Second, we use the merger-specific first rumors in the business press as our measure for the
merger announcement, since the surprise element to the stock market is likely to be largest around
these dates and thus the merger’s effects are likely to be best measured.14 This procedure can be
regarded as standard in the event study literature. For instance, Banerjee and Eckard (1998)
suggest using the first rumors about the merger instead of official announcement dates in order to
reduce the likelihood that the merger is already anticipated and thus that abnormal returns are
biased towards zero. However, as pointed out by Fridolfsson and Stennek (2009), this approach
might only be useful if there were no previous rumors of a possible merger in the industry when
the allocation of the roles (acquirer, target, rival) was still uncertain.15 It may also be argued that
rumors are more likely to intermingle effects, since they are closer in time to any market shocks
that might have triggered the merger. Official announcement dates occur after rumors and are less
likely to capture market shocks. However, if the allocation of role around the first rumors was
uncertain, they might contain the additional effect coming from the resolution of this uncertainty
(out-of-play effect). In any case, as a robustness check, we re-estimate our main equations using
official announcement dates instead of dates of first rumors.
Third, mergers might not be exogenous events but they might rather be triggered by market
shocks, e.g. shocks in demand or costs (e.g. Mitchell and Mulherin 1996; Jovanovic and Rousseau,
2002). If these market shocks are priced in rather than the competitive effects of the merger, we
may mis-measure anti as well as pro-competitive rents. More in general, stock prices might also
impound information effects. Early research (e.g. Eckbo, 1983) treated information effects vaguely
simply positing that mergers signal positive information about an industry’s value, and/or potential
synergies between rivals and subsequent bidders. Kim and Singal (1993) note that such an effect
has largely been interpreted as signals that ‘rival firms are now more likely to be takeover targets’.
Accordingly, more recent papers (e.g. Song and Walkling, 2000) concentrated on how mergers can
convey whether rivals are more or less likely to be targets in the future. Moreover, such
information effects will be moderated by where on the wave the event takes place (Akdogu et al.,
2005).16 In sum, an endogenous increase in future acquisition probabilities might influence our
14 When we say merger-specific rumor we mean the first article in the press where both target and acquirer were mentioned. A typical example is the following. “Allied Signalsignal Inc., the diversified manufacturer, and Honeywell Inc., the maker of electronic controls, are in merger discussions, people close to the companies said yesterday.” The New York Times, 06/05/1999. 15 Quoting Fridolfsson and Stennek (2009): “The out-of-play effect crucially hinges on the assumption that the market anticipates a merger but is uncertain about the allocation of the roles of acquirer, target and outsider.” 16 Because of the increased merger activity levels associated with the pre-crest period of a merger wave, mergers occurring in this time-lap entail a higher probability of future acquisition for rivals (i.e. a larger information effect)

13
measures of the rivals’ rents generated by the merger. Moreover, this information effect should
increase at the beginning of a merger wave.17
We propose several robustness checks for each of these criticisms. To control for the effect
of an industry-wide shock, we first partition the sample into two time periods: 1990-1995 and
1996-2002, during which a merger wave took place (see Gugler, Mueller, and Yurtoglu, 2006).
One may be concerned that stock market reactions during this period were possibly unrelated to
antitrust issues and mostly driven by economy-wide market shocks, such as the introduction of
information technology that led to the dot-com stock market bubble in the late 1990s. Hence, we
look at whether our results are consistent in this smaller, and potentially more problematic,
subsample. If this is the case, then we might be less concerned that economy-wide merger waves
strongly affect our findings.
Second, we look at industry-specific rather than economy-wide shocks conditioning on
future merger activity. In particular, we partition our sample between those industries (“inactive
industries”) that display below median merger activity growth in the two years following a
particular merger and those industries (“active industries”), which display above median merger
activity growth in the two years following a merger.18 Our assumption 2 is more likely to hold in
the inactive industries because endogenous increases in future acquisition probabilities should be
less relevant.
Third, we discriminate between mergers on the basis of the time span elapsed between first
rumors and the starting of the EC reviewing process (notification). Mergers differ according to the
"speed" with which they are completed, and it may be argued that the time-span between events
matters for the assessment of a merger’s competitive effects. For example, CAARs for mergers
that take a long time to be consummated after the first rumors may be contaminated by other
events/shocks like uncertainty over the feasibility of the merger itself or, as we discussed above, a
shock triggering the mergers. We expect assumption 2 to be more likely to hold for mergers that
were speedily notified to the Commission, as stock markets may be more efficient at pricing in
news when events are not too distant in time.19
than do mergers occurring in the post-crest period. Indeed, Song and Walkling (2000) focus on merger announcements in the pre-crest period as involving the greatest information effect. 17 Clougherty and Duso (2009), by using the same dataset as in this paper, observe that rival CAARs do not seem to be influenced by the merger wave, and therefore positive rival CAARs do not appear to be a function of a higher future acquisition probability. Similarly, Simpson (2001) uses an event study to analyze a merger among U.S. department stores. He finds positive abnormal returns to merging firms and their rivals, consistent with an increased concentration due to this merger. He shows that this pattern of abnormal returns seems to be better explained by the market power hypothesis rather than by the increased acquisition probability hypothesis. 18 To define these subsamples, we use the whole population of notified mergers in the time period between 1990 and 2002 (more than 3,500) and define the industry according to the NACE codes used in the Commission’s decision. 19 We measure the "speediness" of the merger by the number of days between the first rumors and the official notification of the merger, and re-estimate our main results for rival firms for the subsamples of "speedy" versus

14
We now turn to the measurement of the effect of the Commission’s decision. We formulate
the following:
Assumption 3: After correcting for the market expectations about the outcome of the antitrust
inquiry, CAARs around the Commission’s decision measure the profitability effects of this
decision.
First, we take the view that the Commission’s final decision, conditional on the information
already available around the merger announcement, entails a surprise element. As shortly
discussed in the introduction, several arguments and anecdotal evidence justify this approach.
There should be some surprise element in the decision process of the Commission, otherwise the
market would not significantly react to such news, which it however does. This surprise element
can come from surprises in the decision-making process itself, or errors in the merger control
procedure (DNR, 2007). Moreover, the fact that some announced mergers were later blocked by
the Commission is indirect evidence that the decision process is not completely determined
otherwise managers would probably not have announced these mergers in the first place.
Second, we focus on the direct effect of merger policy, i.e. the effect of a particular
decision on the market and the firms involved in that decision either as merging parties or as rivals.
As pointed out by Sørgard (2009), an optimal merger policy also entails deterrence, i.e. the effect a
decision has on firms’ future merger behavior. Indeed, Seldeslachts et al. (2009), by using a panel
of antitrust jurisdictions over the period 1992-2003, find prohibitions to deter future merger
activity, while remedies do not.
Our correction for market expectations should at least partially control for this issue,
because, by conditioning on the available information around the merger announcement, we try to
insulate the pure surprise element for any specific decision. Yet, we also suggest using the history
of past Commission decisions as a robustness test. Industries may differ in how the Commission
handles them in merger control. The Commission may define problematic industries, because
concentration is already high, e.g. telecommunications, or industries of “national interest”, e.g.
energy. Thus, the Commission’s past decisions may convey important information on how this
industry is treated or, put another way, the market can learn to better predict the Commission’s
decisions in these industries. Also, the Commission may learn how to implement effective
remedies in specific industries. Thus, we define “remedy-intensive” and “remedy-un-intensive”
industries in the robustness section, and test for differential effectiveness of remedies.20 In remedy-
"slow" mergers. "Speedy" ("slow") mergers are mergers for which the number of days between first rumors and notification is less (more) than the median number of days (55 days). 20 Also in this case, we use the entire population of mergers notified to the EU Commission between 1990 and 2002 to make this classification.

15
un-intensive industries, a decision to impose a remedy might entail a stronger signal about the
Commission’s future behavior in that particular industry. This might make our inference
potentially less accurate as in this case the effect measured around the decisions might also entail
indirect effects.
Finally, we believe that the market’s response to news can be appropriately measured
because the timing of the decision is tightly regulated, as we discussed in Section 3. However, not
all decisions are given before the official deadline. Hence, one might argue that the timing of the
Commission’s decisions might itself be used by the market as a signaling device. For instance, a
delay of the decision might signal that the Commission will be tougher than expected, while an
earlier decision might come as a larger surprise to the market. Looking at the preliminary statistics,
the average number of working days needed to come to a phase 1 decision after the merger
notification is 27, which is quite close to the official deadline of 25 days. Similarly, for phase 2
decisions the average time elapsed after the opening of the in-depth investigation phase is 89
working days, which is quite close to the official 90 days fixed by the merger regulation.21 We
therefore define “early” and “late” decisions. The former are cases where the Commission made its
decision 5 (25) days before the deadline in phase 1 (phase 2), while the latter are cases where the
decisions come 5 (10) days after the deadline in phase 1 (phase 2). As a robustness check, we run
our regressions on the subsample of cases for which the decision did not come either too early or
too late. For these cases, we expect the informative power of the expectation-corrected decision’s
CAARs to be the highest and hence our assumption 3 to be more likely to hold.
4.3. Effectiveness Assessment
Ideally, an effective merger control policy should be able to maintain the benefits to consumers
generated by increased efficiency and, at the same time, reduce the market power effects of the
merger.22 This is particularly relevant for remedies which are supposed to cleanly separate these
two effects. We therefore make the following simplifying assumption:
Assumption 4: The market power effects generated by a merger ( MP ) can be partially
separated from its efficiency effects ( efficiencies ).
This assumption makes the analysis easier, yet we do not think it to be particularly restrictive. It is
only needed in the case of remedies which are the sole instruments trying to separate these two
effects. Moreover, even in this case, we only need the reduction of the market power effect due to 21 In particular 89% of the phase 1 decisions come in the range between 5 days before and 5 days after the official deadline of 25 days after notification, while 85% of the phase 2 decisions come in the range between 15 days before and 10 days after the official 90 working days after the opening of the in-depth investigation. 22 This assumption is standard in merger models such as Farrell and Shapiro (1990), where the efficiency effects come from a marginal costs reduction achieved by the merging firms, while the market power effects come from the strategic reaction following the change in market structures determined by the merger.

16
the remedy to be larger than the potential reduction in efficiencies, which might also follow from
the remedy. Since the ability to separate these two effects is likely to increase with the experience
of the antitrust authority, we expect this assumption to more likely hold in remedy-intensive
industries. Hence, the robustness check proposed above will also serve as a robustness check for
this issue.
The market power effect of a merger implies positive profits for both merging and rival
firms, while the efficiency effect of a merger implies positive profits for the merging but negative
profits for rival firms (Eckbo, 1983). Thus, if the action of the antitrust authority is effective, the
decision-day abnormal returns of both merging and rival firms ( *Dij ) should be negative, since an
effective decision wipes out the market power profits for both types of firms (Eckbo and Wier,
1985). More importantly, however, they should be systematically negatively related to
announcement period abnormal returns. The larger the market power effect of the merger and,
thus, the larger the announcement period abnormal returns ( *Aij ) for both types of firms, the
more rent reversion there should be if the antitrust action is effective. Our methodology does not
simply rely on the sign of the decision CAARs, but rather on the effective rent reversion as
captured by the relation between announcement and decision CAARs.
We therefore propose assessing the "degree of effectiveness" of an antitrust action by
running the following basic regression separately for merging firms and rivals:
* *D Aij idj idj ij i j ija b g X (1)
where subscript i denotes either merging (M) or rival (R) firms, and subscript j denotes the merger,
which is our unit of observation. The subscript d represents the final Commission’s decision
(C=clearance; O=other remedies;23 S=structural remedies; and B=blockings). Thus, we estimate
different intercepts as well as slope coefficients for the four types of decision. The b-coefficients
measure the degree of rent reversion due to the specific EU Commission’s decision. The variables
contained in X are exogenous controls such as year and industry dummies and other merger-
specific characteristics. In the following, based on our maintained assumptions 1 to 4, we will
discuss our hypotheses on the sign and size of the intercepts and slopes, which are then
summarized in Table 1. Appendix 3 presents a graphical representation of our framework.
[table 1 about here]
23 These are remedies that are not divestitures and which are mentioned in the Commission Notice on remedies (2001) (http://eurex.europa.eu/LexUriServ/LexUriServ.do?uri=OJ:C:2001:068:0003:0011:EN:PDF). They are mainly behavioral commitments, e.g. terminating existing exclusive agreements, granting access to a necessary infrastructure, or licensing agreements.

17
Blockings. The most extreme action taken by the Commission, i.e. to block the merger,
dissipates all rents, i.e. both the market power and the efficiency rents. Therefore, the null
hypothesis 1iBb should not be rejected for both rivals (i=R) and merging firms (i=M): all rents
generated by the merger are reversed by the final decision. Moreover, the regression line should
pass through the origin: if there are no net rents generated by the merger, no rents are taken away
by the decision, thus aiB=0.
The failing of assumptions 1 and 4 should not affect these predictions, since prohibitions
should revert any kind of rents generated by the merger, simply because they bring back the pre-
merger competitive situation. Hence, the nature of the rents (assumption 1) and their composition
(assumption 4) should not matter, ceteris paribus. The failing of assumption 2 might instead bias
our coefficient estimates. For instance, if our CAARs measured around the first rumor also capture
the industry shock triggering the merger, then the biB coefficients might be smaller than one in
absolute value. In fact, not all of the rents measured around the merger announcement can in this
case be referred to the specific merger and, hence, reversed. If assumption 3 fails to hold, the
decision to block the merger might also entail signaling effects on the companies’ market values
not related to the specific deal. For example, the blocking decision could constitute a negative
signal on the future possibilities to merge in the industry under scrutiny and thus depress share
prices over and above the rents generated at the announcement. In this case, we would expect a
negative coefficient aiB and/or a coefficient biB smaller than -1.
Clearance. Under our maintained assumptions, if the merger is cleared without
commitments, we do not expect decision effects that are systematically related to announcement
returns, thus aiC,biC=0 for merging firms and rivals. This does not need to be the case if
assumptions 2 or 3 fail. In this case, in fact, the CAARs might also signal other information. In
particular, the reaction around the decision date might convey good news to the market about
future mergers’ feasibility. In this case, we might then expect a positive slope for the rivals (bRC) if
the clearing of the merger signals a green light from the Commission to mergers in that particular
industry. This is even more likely if the Commission makes type II errors and unconditionally
clears anticompetitive mergers.
Remedies. The situation is more complex in the case of remedies (both structural and other
remedies). Only market power rents measured around the merger announcement should be entirely
dissipated by the antitrust decision if it is effective. Hence, each remedial action will entail a
negative decision effect for merging firms and rivals. However, this effect will be differently
captured in our regression for merging firms and rivals.
For rivals, we expect a negative intercept (aRO < 0, aRS < 0) as well as a negative slope (bRO
< 0, bRS < 0). The former captures the shift due to the elimination of the market power rents, while

18
the latter indicates that rent reversion should be larger, the larger the size of the market power rents
generated by the merger. For the merging firms, since both market power and efficiency effects are
positive, we only expect a negative slope (bMO < 0, bMS < 0), while we expect a zero intercept (aMO
= 0, aMS = 0).
Only in the case of remedies does assumption 4 play an important role, as they are the only
antitrust instruments which aim to separate market power from efficiency rents. As already
mentioned, this separability does not need to be complete for our methodology to work. With
decreasing separability, however, we would expect both the intercept and the slope in the
regression for the rivals (aRS, aRO, bRS, bRO) to be biased towards zero. Hence, whether we should
interpret lack of significance in the coefficient estimates for remedies as a lack of effectiveness
will ultimately rest on the interpretation of the source of separability. In particular, it will rest on
the question of whether the two kinds of rents are indeed theoretically not separable – because the
nature of a particular implication of the merger is such that both kinds of effects simultaneously
appear – or whether the authority is not able to find a remedy apt to reach this separability.24
4.4. Further Considerations
Phase 1 vs. Phase 2. Mergers that are cleared with or without commitments in phase 1 and
mergers that go into phase 2 might be quite different. For example, the ex-post evaluation study
conducted by DG Comp (2005) finds that remedies are mostly effective in phase 1. One of the
reasons might be that these cases are simpler to fix, remedies in this investigation phase must be
clear-cut and easy to implement, and the Commission has a stronger bargaining power vis-à-vis the
merging firms through the credible threat of opening a costly phase 2 investigation. We shall test
for differences in the remedies’ effectiveness depending on whether the case was decided in phase
1 or phase 2.
Pro vs. Anticompetitive Mergers. The antitrust agency could wrongly intervene against pro-
competitive mergers (type I errors) or approve anticompetitive mergers without remedying them
(type II errors). We follow DNR (2007), and use rivals’ merger announcement effects to measure
anticompetitiveness. Under a consumer welfare standard, we can then define a merger to be
anticompetitive (i.e. consumer’s surplus reducing) if it increases competitors’ profits, i.e. if
0 ARj , and procompetitive if it reduces competitors’ profits, i.e. if 0 A
Rj . In the empirical
section, we shall run regressions testing for the robustness of our results and discriminate between
24 For example, the closing of a branch of a bank due to a merger, might simultaneously have procompetitive effects (e.g. increase efficiencies by reducing duplication) and anticompetitive effects (e.g. reducing the number of local competitors). Eventually, no kind of action taken by the antitrust authority can separate these two effects.

19
pro and anticompetitive mergers.25 This will also allow us to analyze whether merger control
average effectiveness is affected by the mistakes made by the Commission.
5. The Data and the Estimated Abnormal Returns
Our sample consists of 151 concentrations in the period 1990-2002 that have been analyzed by the
European Commission. Our starting database was developed in DNR (2007). Our sample includes
almost all phase 2 mergers scrutinized by the EC till the end of 2001, and a randomly drawn
sample of phase 1 cases which run up to June 2002. Because of difficulties in identifying
competitors or their stock, we end up with 71 phase 2 cases and 80 phase 1 cases for which we
have complete information. We identify 544 different firms involved in the mergers either as
merging parties or as rivals.
Merging firms and competitors are identified from the publicly available Commission’s
decisions.26 This is one of the big advantages of our dataset, since we can rely on the
Commission’s analysis concerning the market definition (i.e. the relevant competitors).27
Furthermore, the Commission’s reports also provide in-depth information about the characteristics
of the mergers and decisions, such as the kind of concentration (e.g. full versus partial merger), the
nature of the merger (pure horizontal vs. horizontal with conglomerate/vertical effects), the
involved product and geographical markets, the kind of remedies imposed, the provenience of the
involved firms, etc.
The merger announcement dates are collected from the financial press by using the Dow
Jones Interactive database. This is a customizable business news and research product that
integrates contents from newspapers, newswires, journals, research reports, and web sites. We look
at the first rumors about the merger, i.e. the first time a discussion of the merger appears in the
international press, but provide robustness checks using official announcement dates.28 This has
the advantage of reducing the noise in identifying the “right” event. Finally, we collect data on
firms’ stock prices and market values as well as market indexes, as defined by each firm’s country-
industry sector, by using Thomson Financial’s Datastream.
25 Fee and Thomas (2004) and Shahrur (2005) propose using information on corporate customers to refine the Eckbo and Stillman methodology adopted by DNR (2007). This approach, which surely would substantially improve the identification of anticompetitive mergers, has two major drawbacks. First, for many transactions it is not possible to define customers that are quoted firms. Second, it is not completely clear to what extent the potential loss suffered by the customer is then translated into losses for the final consumers. 26 The reports for each of the Commission’s decisions can be downloaded from the Commission’s webpage: http://ec.europa.eu/competition/mergers/cases/. 27 In the existing literature, in fact, rivals are defined as all other firms in the industry, however, antitrust markets are generally fairly different from an industry. Therefore, we can significantly reduce the measurement error due to a too broad market definition, which would bias the competitors’ abnormal return towards zero. This point was already put forward by Eckbo and Wier (1985). 28 These are taken from the SDC database (Thomson Reuters).

20
Table 2 presents a short description of the relevant variables. The market value of the
combined firms (rivals) is on average 45 (7.5) billion U.S. dollars. On average, the Commission
reports 7.6 rival firms, and we were able to find stock market information for 62.5% of them. The
majority of the concentrations in our sample (57.1%) were full mergers, 24% joint ventures, 13.1%
partial acquisitions, 11.3% tender offers, and only 6% consisted of asset acquisitions. In 41.1% of
the cases the geographical market definition is the European Economic Area, in 35.1% it was
defined to be national, in 21% it was worldwide, and in a few cases it was left open because the
geographical market definition was not relevant for the decision.
Remedies have been imposed in 35.1% of the mergers (12.2% of phase 1 and 78% of phase
2 mergers), and 7.7% were blocked. Hence, in 42.8% of the cases in our sample the Commission
took an action, i.e. intervened to modify or block the merger. Remedies are categorized as
structural or behavioral using the information contained in the Commission’s decision. In 23.5% of
the cases the Commission ordered a divestiture, while in 11.8% it imposed other kinds of
remedies.
[table 2 about here]
Table 3 reports statistics on the cumulative average abnormal returns (CAARs) around
various events using different event windows for merging firms and competitors. We consider a
short window from 5 days before to 5 days after the relevant event, and a long window that goes
back 50 days before the event to 5 days after.
[table 3 about here]
The mergers in our sample were on average “profitable” since the CAARs for the merging
firms around the announcement date are positive and statistically significant at the 5% level for all
used windows. The size of the effects ranges from 1.05% in the short window to 1.8% in the long
window. This result seems to be in line with the literature.29 The cumulative abnormal returns for
the rivals around the announcement date are, instead, not statistically significantly different from
zero and, on average, small in size. Looking at phase 1 decisions, we observe negative CAARs for
the merging firms as well as for the rivals. The negative effect stems mainly from those cases
where a phase 2 investigation was opened: The negative CAARs for the merging firms in that case
are on average -1.7% in the short window and -1.4% in the long window. Similarly, rivals lose
from the opening of a phase 2 investigation (in the long window up to -1.1%). For phase 2
decisions, almost all CAARs are statistically insignificant.
29 See for instance Andrade et al. (2001). Depending on the event window, we estimate average abnormal returns for acquirers in the range between -0.54% and 0.12% (not statistically significantly different from zero) and for the targets in the range between 3.4% and 6.2% (statistically significantly greater than zero at the 1% level). These results are quite similar to those reported by Aktas et al. (2004) using a comparable sample of mergers.

21
6. Results
6.1. The Probability of an Action
As discussed in section 4 and in Appendix 2, our first step is to estimate the probability that the
Commission takes an action. The dependent variable is a dummy (ACTION) equal to 0 in the case
of outright clearance and equal to 1 in the case of remedies or prohibitions. Table 4 reports the
estimation results. The probability of an action is explained by several observable merger
characteristics proxying for the merger’s likely (anti) competitive effects, firms’ lobbying, and/or
protectionist tendencies of the antitrust agency: whether one or both of the merging firms stem
from the USA (us), whether one or both of the merging firms stem from a major EU country
(bigeu; France, Germany, Italy, Spain, or UK), whether conglomerate or vertical concerns have
been identified (conglom), whether the merger is a cross border deal (crossbord), whether the EU
Commission defines the relevant geographic market as worldwide (world), EU wide (eu) or
national (reference group), whether the merger is a full merger (full; as opposed to partial
acquisitions), the size of merging and rival firms measured by the logarithm of their market values
(lnvm and lnvr respectively), industry indicators (d for manufacturing and i for communications)
and time variables (time trend and a dummy for the late years 1995–2002).30
[table 4 about here]
The probability of an action is significantly lower if one or both of the merging firms stem
from the USA31 or if markets are defined as EU-wide. It significantly increases with the presence
of conglomerate or vertical concerns,32 the size of rival firms, if the firms operate in
manufacturing, and during the last years of the sample (1995–2002). We correctly classify around
70% of the observations. From the reported estimates, we predict for each merger the probability
of an action conditional on the public information available at the announcement date
( AIactionPr ), and correct the estimated CAARs around the merger and decision announcements
by the predicted probabilities according to the discussion highlighted in Appendix 2. We run
regression (1) using the probability corrected CAARs.
6.2. Main Results
30 This dummy captures the years during which Mario Monti was the Competition Commissioner and several changes in merger control enforcement happened. These industry and time effects should also capture the learning process undergone by firms and investors about the Commission’s decision. Indeed, it might be easier for the market to build expectations about a specific decision in late years and in industries where the Commission was more active. 31 Note that this result seems to contrast with the findings of Aktas et al. (2007), who claim that EU merger control is protectionist and favors European firms. 32 A merger is defined to also have conglomerate or vertical (foreclosure) effects if the Commission stated so in its reports.

22
Table 5 presents our main regression results. We choose the long window (-50, +5) to measure the
merger’s effect around its announcement, the short window (-5, +5) around phase 1 decisions, and
again the long window (-50, +5) around phase 2 decisions. These strike us to be the best choices to
account for information leakages.33
In all specifications we control for time as well as industry effects (manufacturing and
communications). This might capture aggregate or industry specific shocks, which might affect the
decision CAARs. We also add a dummy equal to one for those cases where conglomerate and/or
foreclosure aspects were identified by the Commission (i.e. not purely horizontal mergers).
Finally, we control for the percentage of rivals identified by the Commission, for which we were
able to get stock market information to control for possible measurement errors due to a potentially
incomplete covering of the market.
[table 5 about here]
Our first important findings are the significantly negative coefficients biB for outright
blockings (bRB=-0.88 for rivals and bMB=-0.72 for merging firms), which are not statistically
significantly different from minus one for rivals. Prohibitions seem to fully restore the pre-merger
competitive situation and can be interpreted to be an effective merger control tool, according to our
theoretical framework. The significantly negative intercept term for merging firms when the
merger is blocked can be explained by additional costs (in addition to the lost market power and
efficiency rents) of a blocked merger. These involve the direct costs of the lost merger proceedings
and, probably more importantly, the indirect costs of the need to establish a new merger or
business strategy. Hence, the fact that bMB is not significantly smaller than minus one as well as the
significantly negative constant for merging firm (aMB) in the case of blockings might be explained
with the CAARs entailing other signals such as the shock triggering the merger or the cost of the
merger procedure itself.
Clearances do not have a positive effect on firms as witnessed by the zero intercepts, which
is consistent with our hypotheses. However, the positive and significant estimate of the slope for
rivals (bRC) implies that their gains after an outright clearance increase with the size of their
announcement gains, which we interpret as a possible measure of anticompetitiveness. The
absence of an action by the antitrust authority conveys positive news to the market that future 33 Before the phase 1 decision, one should not expect much outflow of information as this investigation phase spans over a quite short time period, which is mostly used for administrative and procedural issues. Instead, information leakages might be an issue during phase 2, since this in-depth investigation lasts several months and attracts more public attention than phase 1. Moreover, the Commission might provide some information to the market by applying the so-called “market test”, which asks competitors and customers to evaluate the proposed conditions. For further evidence supporting our choices also see Duso, Gugler, and Yurtoglu (2007). Duso, Gugler and Yurtoglu, (2010), using a subsample of the mergers used in this paper, show that the correlation between CAARs and ex-post merger profitability measures based on accounting data is the highest for larger event windows. Moreover, Fridolfsson and Stennek (2009) give a theoretical rationale for preferring long windows. Finally, we run our main regressions using shorter windows and our qualitative results are not substantially altered.

23
(possibly anticompetitive) mergers are feasible without provoking prolonged merger proceedings.
This result might suggest that, on average, our assumption 3 for clearances is too restrictive. We,
however, favor an alternative interpretation, i.e. the market evaluating the cost of a type I error: the
more anticompetitive the deal is (i.e. the larger the rivals’ rents at announcement), the more rivals
profit from an outright clearance. Indeed, our next extension that looks at differences between anti
and pro-competitive mergers (table 7) is in line with this interpretation.
The coefficient estimates for remedies are only partly in line with the predictions for an
effective merger control. In particular, the predicted negative shift for rivals is not observed, since
the estimated intercepts (aiO, aiS for i=M,R) are not significantly different from zero. Yet, given the
small coefficient estimates and the relatively large standard errors, we cannot reject the hypothesis
of these coefficients being smaller than zero. The coefficient estimates for the slopes are negative
for both rivals and merging firms (biO, biS for i=M,R), and for the latter they are significantly
different from zero. For rivals, we cannot reject the hypothesis that they are negative, given the
large standard errors. We interpret the negative estimates for the slopes as partial rent reversion
and, hence, partial effectiveness of remedies.
To wrap up, the main results using the full sample are the following: 1) prohibitions
achieve full rent reversion; 2) remedies achieve only partial rent reversion; 3) clearances increase
rents for rivals and the larger the merger effect at announcement the more they do so. Our
interpretation of these findings in terms of merger policy effectiveness is as follows: 1)
prohibitions are an effective merger control tool; 2) remedies are only partially effective; and 3)
some outright clearances might indeed be type II errors of the Commission.
6.3. Additional Results
We next analyze phase 1 and phase 2 decisions (subsamples) separately in table 6. For cases closed
after a phase 1 investigation, we observe significant rent reversion in case of remedies for rival
firms (bRR=-0.19), even if the intercept (aRR) is not significantly different form zero.34 This again
can be seen as consistent with remedies being, though only partially, effective in reverting market
power rents when they are applied in phase 1, and it is in line with the findings by the
Commission’s in-house study (DG Comp, 2005). Similarly to the full sample, the intercept and
slope coefficients for rivals (bRC) in mergers that were out-rightly cleared are significantly positive.
Again, one can interpret this finding as the cost of a type II error: some mergers with
anticompetitive effects are cleared after a short investigation phase. This result is consistent with
DNR (2007), who show that the probability of a type II error significantly increases in phase I.
[table 6 about here]
34 Due to the limited number of observations, we do not discriminate between structural and behavioral remedies.

24
The regressions run on the phase 2 subsample almost entirely replicate (and reinforce) the
results observed in the full sample. Again, the consistency check for our procedure is successful, as
the estimates for the blocking slopes (biB) are not significantly different from minus one. This is
true not only for rivals but also for merging firms. Consistent with our predictions, the intercepts
for blockings (aiB) are not significantly different from zero for both merging firms and rivals.
Furthermore, our hypotheses for out-rightly cleared mergers are also met for both merging firms
and rivals, as the slopes (biC) as well as the intercepts (aiC) are not significantly different from zero.
We interpret this result as showing that it is less likely that a type II error is made after an in-depth
investigation.
The major discrepancy is on the slopes for remedies. Now, the slope coefficient for
structural remedies is estimated to be significantly positive for rivals (bRS) and significantly
negative for merging firms (bMS). Our interpretation for this finding is that these possibly more
complex remedies might merely result in rent transfers from merging firms to their rivals without
correcting the anticompetitive nature of the merger. This interpretation seems intuitive: if the
divested assets are purchased by existing competitors at below market prices (because there is time
pressure and the Commission must agree to the identity of the buyer), rivals gain but effective
competition might not be fully restored. This interpretation of our findings would imply that
remedies in phase 2 are less of an effective merger control tool, on average.
The second extension consists of estimating different intercepts (aid) and slopes (bid)
differentiating between anticompetitive (rival announcement CAARs = 0 ARj ) vs. pro-
competitive (rival announcement CAARs = 0 ARj ) mergers (see table 7).35
[table 7 about here]
Our main results carry over in that outright prohibitions exhibit full rent reversion (i.e. biB
is not significantly different from -1) and remedies are only partially effective. In particular,
remedies in anticompetitive mergers have a strong and significantly negative effect on rivals (bRR
for anticompetitive mergers), while, in the case of merging firms, a negative and significant effect
(bMR for pro-competitive mergers) is observed when remedies are applied to pro-competitive
mergers. This might point to costs for merging firms when a type I error occurs and the authority
erroneously intervenes in a pro-competitive merger.
Finally, the clearance of an anticompetitive merger increases the rents earned by rivals (bRC
for anticompetitive mergers is positive), while not significantly influencing the merging firms:
This kind of type II error (no remedies in anticompetitive mergers) seems to benefit the
35 Data limitations do not allow us to separately estimate the effect of prohibitions (BLOCK) for pro and anticompetitive mergers.
25
competitors without hurting the merging firms. Therefore, the positive slope for clearance, rather
than to be understood as the failing of our assumption 3, seems to be consistent with the market
correctly evaluating the effects of the Commission’s mistakes.
6.4 Robustness Checks Against the Failing of Our Assumptions
In this section we discuss the robustness checks proposed in section 4.3 to account for the possible
failing of our assumptions.
6.4.1. Purely Horizontal Mergers
Table 8 presents the estimates for our main regressions using the subsample of purely horizontal
mergers (85% of the sample). These are mergers where the EU Commission did not identify any
conglomerate or vertical effects. Our assumption 1 should be more likely to hold for these mergers.
For this subsample, most of our main findings carry over with comparable significance levels. The
coefficients on blocked mergers are again not significantly different from minus one for rivals
(bRB), and smaller than minus one for merging firms (bMB). Again, the effectiveness of remedies is
only partially corroborated. Different from the full sample, the slope coefficient on other remedies
(bMO) for the merging firms is estimated to be significantly negative and that for rivals (bRO) to be
significantly positive. The interpretation we offer for this finding is that behavioral remedies in
horizontal mergers would be a rent transfer from the merging firms to their competitors.
[table 8 about here]
6.4.2. Official Announcement Dates
For our main estimations, the merger-specific first rumors are used as the merger announcement
dates. Although this procedure can be seen as the standard in the literature, it may be argued that
rumors are more likely to intermingle other effects, such as market shocks triggering the merger.
This problem should be less severe at the official announcement dates at the cost that mergers
might already be anticipated and measured effects are likely to be biased towards zero. We were
able to obtain the announcement dates from the SDC database (Thomson Reuters) for a subsample
of 120 out of our 151 mergers. A comparison of these two different sources of data reveals a fairly
strong overlap for most of the events. However, there were also some events for which the date of
the first rumor was substantially earlier than the announcement dates in the SDC database. Hence,
as a first robustness check for our assumption 2, we run the basic regression using this alternative
event for the merger announcement.
[table 9 about here]
Results are very comparable to those obtained with our preferred definition of the merger
announcement. We still cannot reject the hypothesis biB =-1 (i=M,R) for both merging and rival

26
firms. The intercepts for structural and other remedies (aMS, aMO) are negative for merging firms,
while only the latter (aRO) is negative for rivals and the former (aRS) is positive. In all these cases,
we cannot reject our hypotheses of these intercepts being negative. Both slopes for structural
remedies are negative for merging firms and rivals (bMS, bRS), while both slopes for other remedies
are positive (bMO, bRO). These results are again only partially consistent with remedies being
capable of reverting rents measured at the merger announcement. Also in this case, we observe
positive and significant reactions (i.e. both constant aRC and slope bRC) for clearances for rivals.
6.4.3. Post 1996 – The Merger Wave
Our sample period, 1990–2002, saw huge speculative stock price appreciations with a
commensurate merger wave in the second half of the 1990s. The following robustness check for
assumption 2 consists of controlling for this economy-wide merger wave. We split the sample into
a pre-1996 period (1990–1995) and a post-1996 (1996–2002) period, for which we present the
results in table 10.
[table 10 about here]
Our results are robust to merger wave arguments. We still cannot reject the hypothesis bRB = -1,
and the estimated slope for merging firms is just a bit smaller than in the full sample (bMB=-0.67).
Hence, the potential bias in our main findings seems to be quite limited. On remedy effectiveness,
we obtain very similar results as in the full sample: remedies are only partially effective in
reverting announcement rents. Moreover, the coefficient for structural remedies might again be
interpreted to be consistent with a rent transfer from merging firms (bMS=-0.185 and significant) to
rivals, for which the slope coefficient is positive (bRS=0.395) and significant.
6.4.4. Future Merger Activity
We next re-estimate our main equation for the two subsamples “inactive” vs. “active” industries to
control for industry-specific merger waves. This set of results should provide a robustness check
for the failing of assumptions 1 and 2. Table 11 presents the results.
[table 11 about here]
Our main findings for the two subsamples are qualitatively similar, yet some differences
also emerge. The slopes for blocking (biB) are not significantly different from minus one in both
subsamples, although the magnitudes of the point estimates are reduced particularly in the
“inactive” subsample.36 Remedies appear to be only partially effective, as the slopes for both
remedy types, in both subsamples, are negative for merging firms (bMO, bMS) and, apart of 36 Moreover, in the “inactive” subsample we also estimate a positive intercept for rivals in the case of prohibitions (aRB). If outside the wave (“inactive” industries) mergers are on average more efficient (e.g Gugler at al, 2003), this might be interpreted as the cost of a type I error: the Commission blocks a pro-competitive merger and, therefore, favors the rivals.

27
behavioral remedies, also for rivals (bRO). Again, clearances are greeted with a positive share price
reaction in both subsamples for both rivals and merging firms (aiC). In sum, while we cannot rule
out the possibility that announced mergers endogenously increase future merger activity in
particular industries (i.e. the “active” industries), the relation between decision and announcement
CAARs does not appear to be affected.
6.4.5. Time Between First Rumors and Notification
The speed with which mergers are completed differs across mergers, and the time spans between
events might matter for the assessment of competitive effects. The larger the time span between
the first rumor and the official notification, the more likely our CAARs can be contaminated by
other sources of uncertainty about the merger and, therefore, the more likely it is that our
assumption 2 does not hold. We therefore differentiate between “slow” and “speedy” mergers and
report the results for the two subsamples in table 12.
[table 12 about here]
As expected, results for “speedy” mergers are much more in line with our predictions. The
coefficient on blockings for rivals is bRB=-1.03 and not significantly different from minus one
confirming full rent reversion after a merger is blocked. For merging firms, the slope on blockings
bMB is -2.22, yet quite imprecisely estimated. In “the “slow” mergers subsample the slope on
blockings for rivals (bRB) is negative but not significantly different from minus one. This may be
attributable to the longer time span between first rumors and notification, and the implied
measurement errors. The results on remedies are quite similar to those observed in the full sample,
although there is more rent reversion in the subsample of “speedy” mergers for merging firms.
This robustness check essentially shows that reducing measurement errors, i.e. making it more
likely that our assumption 2 holds, moves the empirical findings closer to the predictions of our
framework.
6.4.6. Remedy Intensive Industries
The Commission’s past decisions are important for a number of reasons. First, besides intrinsic
characteristics such as merger intensity or growth, industries may differ in how the antitrust
authority treats them. Second, the Commission’s past decisions may convey important information
to the market with respect to future decisions. Hence, the signal-to-noise ratios of our measured
abnormal returns may vary across industries. Finally, the Commission may learn how to
implement effective remedies in specific industries. To analyze these issues and offer a robustness
check for assumptions 3 and 4, we define remedy-intensive industries, where we expect our
predictions to be more precisely met. Table 13 presents our findings.

28
[table 13 about here]
Results are again very much in line with our previous conclusions. Both for merging firms
and rivals, prohibitions reverse rents generated around the merger announcement. The remedies’
effectiveness is substantially increased in remedy-intensive industries: All four slope coefficients
have a negative sign (biO, biS), three of them are significant, and the sizes in absolute terms of the
coefficients are much larger than in the full sample. This indicates substantial rent reversion and,
according to our interpretation, suggests that the Commission might have learned over time and in
certain industries to implement more effective remedies.
6.4.7. Timely Merger Decisions
The timing of the Commission’s decision might convey additional information to the market, in
which case our assumption 3 might be hurt. We claim that the tightly regulated merger control
process should reduce this problem. We drop all cases where the decision came too early or too
late with respect to the regulated deadline and re-estimate our model on the subsample of mergers
for which there was a “timely decision”.37 Table 14 present our results.
[table 14 about here]
Our main results are reinforced. The slopes for blockings (biB) are not significantly different from
minus one for rivals and merging firms. The slopes on remedies for merging firms (bMO, bMS) are
(partially) significantly negative and larger in absolute value than in the full sample. The slope on
structural remedies for rivals (bRS) is negative and significant, while that for behavioral remedies
(bRO) is positive. Again, we interpret these findings as remedies being only partially effective.
7. Conclusions
This paper is a first attempt to provide a framework to econometrically assess the effectiveness of
merger control decisions. We do this by using a simple, intuitive, and novel approach based on
stock market data: By looking at the relation between firms’ abnormal returns around the two
major event dates, the merger and antitrust decision announcements, we obtain several testable
hypotheses. We try to be cautious in isolating the true effects of the antitrust decisions through
event studies. First, we account for information leakages prior to major events. Second, we adjust
our profitability measures for the market expectations about the merger control procedure by using
a probability correction method. Third, our dataset is as “clean” as possible in identifying major
rivals of merging firms, hence the merger’s true competitive effect, as our sources for market
definition are the decisions of the European Commission itself. Fourth, we propose several
37 Excluding either only “early” or only “late” decisions leads to comparable results.

29
robustness checks based on different types of mergers, industries, and time periods to control for
the possible failing of our framework’s crucial assumptions.
We find that outright prohibitions completely revert the rents generated around the merger
announcement. Our interpretation of this finding is that they solve the anticompetitive concerns
raised by the merger. This is also a consistency check for the reliability of our approach. Remedies,
instead, do not seem to achieve this full rent reversion on average. We therefore interpret them as
only partially effective. Yet, our methodology allows us to qualify this result in several directions.
Remedies appear to be more effective in reverting rents generated at the merger announcement if
they are ordered during the first investigation phase. This result, at first sight controversial, is in
line with the empirical evidence provided by the ex-post evaluation study conducted by DG Comp
(2005), which is based on a very different evaluation method. Remedies are mostly effective in
phase 1 because these cases are simpler, remedies must be clear cut and easily implementable, and
the Commission has a stronger bargaining power with respect to the merging firms through the
credible threat of opening a costly phase 2 investigation. Moreover, remedies seem to be more
effective if correctly applied to anticompetitive mergers.
We find that rents following an outright clearance increase with the size of the merger
announcement rents, but only for rivals. We interpret this result as a sign of the cost of possible
type II errors, where anticompetitive deals are waved through. We provide three additional pieces
of evidence confirming this interpretation. Finally we also offer insights about the evolution of
European merger policy effectiveness over time. Apparently, the Commission has been able to
learn over the years and from its past experience and has improved the effectiveness of its remedial
action. Four main assumptions are the pillars on which our framework is funded. We run several
robustness checks and show that our results are more in line with the predictions of our framework,
when we focus on subsamples for which our maintained assumptions are more likely hold. We
also show that running our test on subsamples where some of our assumptions are less likely to
hold, does not seem to have a significant impact on our main findings. We therefore believe we
have provided quite robust results on the effectiveness of European merger control.
In recent years the EU Commission – in contrast to the U.S. antitrust authorities –
increasingly hesitates to block mergers, especially after the European Court of Justice overruled
several of its blocking decisions. Our results imply that this may be problematic: remedies might
be a good policy tool, when the anticompetitive concerns brought by the merger are not too
serious. In complex mergers, which create serious worries about the post-merger industry’s
competitiveness, prohibitions might be the only tool capable of restoring effective competition.

30
References
Acharya, S., 1993, “Value of Latent Information: Alternative Event Study Methods,” Journal of Finance, 48, 1, 363-85.
Aktas, N., E. de Bodt and R. Roll, 2004, “Market Response to European Regulation of Business Combinations,” Journal of Financial and Quantitative Analysis, 39, 4, 731-757.
Aktas, N., E. de Bodt and R. Roll, 2007, “European M&A Regulation is Protectionist,” The Economic Journal, 117, 1096-1121.
Akdogu, E., Harford, J. and Moeller, S.B., 2005, ‘Value Creation and Merger Waves’. mimeo, Southern Methodist University.
Andrade, G., M. Mitchell and E. Stafford, 2001, “New Evidence and Perspectives on Mergers,” Journal of Economic Perspectives, 15, 103-120.
Baker J.B., 2003, “The Case for Antitrust Enforcement,” Journal of Economic Perspectives, 17, 27-50.
Banerjee, A. and Eckard, W. E., 1998, “Are mega-mergers anti-competitive? Evidence from the first great merger wave,” Rand Journal of Economics, 29, 803–27.
Cabral, L. M. B., 2003, “Horizontal Mergers with Free-Entry: Why Cost Efficiencies May Be a Weak Defense and Asset Sales a Poor Remedy,” International Journal of Industrial Organization, 21, 607-623.
Carlton, D. and R. Gertner, 2003, ”Intellectual Property, Antitrust and Strategic Behavior,” in eds. Adam Jaffee and Joshua Lerne, Innovation Policy and the Economy, Volume 3, MIT Press.
Clougherty, J. and T. Duso, 2009, “The Impact of Horizontal Mergers on Rivals: Gains to Being Left Outside a Merger,” Journal of Management Studies, 46, 8, 1365-1395.
Crandall, R. W., and C. Winston, 2003, “Does Antitrust Policy Improve Consumer Welfare? Assessing the Evidence,” Journal of Economic Perspectives 17, 3-26.
Davies, S. and B. Lyons, 2007, Merger and Merger Remedies in the EU. Assessing the Consequences for Competition, Edward Elgar Publishing, MA: Northampton.
DG Comp - European Commission, 2005, Merger Remedies Study. http://ec.europa.eu/comm/competition/mergers/others/remedies_study.pdf
Deneckere R. and C. Davidson, 1985, “Incentives to Form Coalitions with Bertrand Competition,” The RAND Journal of Economics, 16, 4, 473-486.
Duso, T., D. Neven, and L.-H. Röller, 2007, “The Political Economy of European Merger Control: Evidence Using Stock Market Data,” Journal of Law and Economics, 50, 3, 455-489.
Duso, T., K. Gugler, and B. Yurtoglu, 2007, “EU Merger Remedies: An Empirical Assessment,” in J. Stennek and V. Ghosal Eds., The Political Economy of Antitrust, Contributions to Economic Analysis, North-Holland, 2006.
Duso, T., K. Gugler, and B. Yurtoglu, 2010, “Is the Event Study Methodology Useful for Merger Analysis: A Comparison of Stock Market and Accounting Data,” International Review of Law and Economics, forthcoming.
Eckbo, B. E., 1983, “Horizontal Mergers, Collusion, and Stockholder Wealth,” Journal of Financial Economics, 11, 241-273.
Eckbo, B. E., 1989, “The Role of Stock Market Studies in Formulating Antitrust Policy Toward Mergers: Comment,” Quarterly Journal of Business and Economics, 28, 22-38.

31
Eckbo, E. B., 1992, “Mergers and the Value of Antitrust Deterrence,” Journal of Finance, 47, 3, 1005-1029.
Eckbo, B. E. and P. Wier, 1985, “Antimerger Policy Under the Hart-Scott-Rodino Act: A Re-examination of the Market Power Hypothesis,” The Journal of Law and Economics, 28, 119-149.
Ellert, James, 1976, “Mergers, Antitrust Law Enforcement and Stockholder Returns,” Journal of Finance, 31, 2, 715-732.
Elzinga, K., 1969, “The Antimerger Law: Pyrrhic Victories?,” Journal of Law and Economics, 43, 52- .
Evans, D.S. and Michael Salinger, 2002, “Competition thinking at the European Commission: lessons from the aborted GE/Honeywell merger”, 10 George Mason Law Review, 489-532.
Farrell, J., 2003, “Negotiation and Merger Remedies: Some Problems,” in F. Leveque and H. Shelanski, Merger Remedies in American and European Union Competition Law, Edward Elgar Publishing, MA: Northampton.
Farrell, J. and C. Shapiro, 1990, “Horizontal Mergers: An Equilibrium Analysis,” American Economic Review, March, 107-126.
Fee, C. E. and S. Thomas, 2004, “Sources of Gains in Horizontal Mergers: Evidence from Customer, Supplier and Rival Firms,” Journal of Financial Economics, 74, 423-60.
Fridolfsson, S. O. and J. Stennek, 2005, “Why Mergers Reduce Profits and Raise Share Prices,” Journal of the European Economic Association, 3, 1083-1104.
Fridolfsson, S. O. and J. Stennek, 2009, “Industry Concentration and Welfare: On the Use of Stock Market Evidence from Horizontal Mergers, Economica, 1–19.
Federal Trade Commission (FTC), 1999, A Study of the Commission's Divestiture Process, http://www.ftc.gov/opa/1999/08/divestreport.htm.
Gugler, K., D.C. Mueller, B. B. Yurtoglu and C. Zulehner, 2003, “The Effects of Mergers: An International Comparison,” International Journal of Industrial Organization, 21, 5, 625-653.
Gugler, K., Mueller, D. C. and B.B. Yurtoglu, 2006, “The Determinants of Merger Waves,” WZB DP SP II 2006-01.
Gugler, K. and R. Siebert, 2007, “Market Power versus Efficiency Effects of Mergers and Research Joint Ventures: Evidence from the Semiconductor Industry,” The Review of Economics and Statistics, Vol. 89, No. 4, 645-659.
Jovanovic, B. and P. L. Rousseau, 2002, “The Q-Theory of Mergers,” American Economic Review, Papers and Proceedings, 92, 2, 198-204.
Kim E. H. and V. Singal, 1993, “Mergers and Market Power: Evidence from the Airline Industry,” American Economic Review, 83, 3, 549-69.
Lyons, Bruce, 2004, “Reform of European Merger Policy,” Review of International Economics, 12, 2, 246-261.
Malatesta, P.H. and R. Thompson, 1985, “Partially anticipated events: A model of stock price reactions with an application to corporate acquisitions,” Journal of Financial Economics 14, 237-50.
McAfee, R. P. and M.A. Williams, 1988, “Can Event Studies detect anticompetitive Mergers?,” Economic Letters, 28, 199-203.
Mitchell, M. L. and Mulherin, J. H., 1996, “The impact of industry shocks on takeover and restructuring activity,” Journal of Financial Economics, 41, 193–229.

32
Motta, M., M. Polo, and H. Vasconcelos, 2003, “Merger Remedies in the European Union: An Overview,” in F. Leveque and H. Shelanski, Merger Remedies in American and European Union Competition Law, Edward Elgar Publishing, MA: Northampton.
Nocke, V. and M. D. Whinston, (2008), “Dynamic Merger Review,” NBER Working Paper 14526, National Bureau of Economic Research.
Office of Fair Trading (OFT), 2005, “Ex Post Evaluation of Mergers,” http://www.oft.gov.uk/shared_oft/reports/comp_policy/oft767.pdf
Organisation for Economic Cooperation and Development (OECD), 2004, “Merger Remedies,” DAF/COMP(2004)21. http://www.oecd.org/dataoecd/61/45/34305995.pdf
Pfunder, M.R., D.J. Plaine and A. M. Whittemore, 1972, “Compliance with Divestiture Orders under Section 7 of the Clayton Act,” Antitrust Bulletin, 17, 1, 19-180.
Rogowsky, Robert A., 1986, “The Economic Effectiveness of Section 7 Relief,” Antitrust Bulletin, Spring, 187-233.
Salant, S. W., S. Switzer and R. J. Reynolds, 1983, “Losses from Horizontal Merger: The Effects of an Exogenous Change in Industry Structure on Cournot-Nash Equilibrium,” Quarterly Journal of Economics, 98, 185-199.
Scholes, M. and J. Williams, 1977, “Estimating Beta from Non-Synchronous Data,” Journal of Financial Economics, 5, 309–327.
Seldeslachts, J., J. Clougherty, and P.P. Barros, 2009, “Settle for Now but Block for Tomorrow: The Deterrence Effects of Merger Policy Tools,” Journal of Law and Economics 52, 3, 607-634.
Shahrur, H., 2005, “Industry Structure and Horizontal Takeovers: Analysis of Wealth Effects on Rivals, Suppliers and Corporate Customers,” Journal of Financial Economics, 76, 61-98.
Simpson, John David, 2001, “Did May Company’s Acquisition of Associated Dry Goods Corporation Reduce Competition? An Event Study Analysis,” Review of Industrial Organization, 18, 351–62.
Song, M. H. and Walkling, R. A., 2000, “Abnormal returns to rivals of acquisition targets: a test of the acquisition probability hypothesis,” Journal of Financial Economics, 55, 143–71.
Sørgard, L., 2009, “Optimal Merger Policy,” The Journal of Industrial Economics, 57, 3, 438-456.
Stigler, G. J., 1950, “Monopoly and oligopoly by merger,” American Economic Review, 40(2), 23-34.
Stillman, R., 1983, “Examining Antitrust Policy Towards Horizontal Mergers,” Journal of Financial Economics, 11, 225-240.
Werden, Gregory, J., and Michael A. Williams, 1989, “The Role of Stock Market Studies in Formulating Antitrust Policy Toward Horizontal Mergers,” Quarterly Journal of Business and Economics, 28, 3-21.

33
Appendix 1. Event Study Methodology
Under the assumptions of efficient markets and rational expectations, the market model predicts
that firm f’s stock return at day t ( tfR , ) is proportional to a daily market return ( tmR , ):
, , ,f t m t f tR R .
We estimate the market model over 240 trading days, starting 50 days prior to the announcement
day and using the Scholes– and Williams (1977) method. Using the model’s parameters α and ,
we predict what firm f’s stock price would have been, had the event under consideration (merger
announcement or antitrust decision) not occurred, i.e. the abnormal returns are:
tmtftftftf RRRRAR ,,,,, ˆˆˆ .
With efficient markets abnormal returns have zero mean and a variance equal to:
m
mmttf
RR
LARVar tf 2
2, 1
1)( ,
,
where L is the estimation period length and mR and m2 are respectively the mean and variance of
the market portfolio. We then calculate the cumulative abnormal return over an event window
(1,2):
2
1
21 ,,
ff ARCAR .
To obtain the aggregate effects of the merger j on merging firms (i=M) and on rivals (i=R)
around the events of interest, eij , (e = A, D; announcement and decision), we take the weighted
average of the cumulative abnormal returns of all firms in each of the two groups, the weight being
firm f’s market value:
1
1
, ,
ij
ij
Ne ef f
feij N
ef
f
CAR MV
i M R e A, D
MV
,
where Nij is the number of firms in class i involved in merger j.

34
Appendix 2. Accounting for Market Expectations
If markets are semi-strong efficient, they should account for the future antitrust decision when
reacting to a merger announcement (e.g. Eckbo, 1992). We assume that the market builds
expectations about the effect of the Commission’s decision d (clearance or action, which includes
blockings and any kind of remedies), given the public information available in the market around
the merger announcement (IA). When expectations are rational, the expected value of the
Commission’s decision can be written as:
d
AjDijA
Dij IdIE Pr d= clear, action,
where Aj IdPr is the probability assigned by the market to decision d given the information
available around the merger’s announcement.
The observed abnormal return for firms i around the announcement day ( Aij ) is then equal
to the competitive effect of merger j for firms i ( *Aij ) minus the expected value of the effect of the
Commission’s decision. Assuming that any effective action (remedies or blockings) effectively
wipes out all market power profits accruing from the merger, i.e. *Aij
Dij
a , and a clearance
does not have any profitability effect, i.e. 0 cDij , we can then write the following:
* *
*
*
Pr Pr
1 Pr
c a
A A Dij ij ij A
D DAij ij j A ij j A
Aij j A
E I
clear I action I
action I
Therefore, the competitive effect of merger j on firms i is:
AjAij
Aij Iaction 1Pr* , (A1)
i.e. the measured announcement CAAR divided by the ex-ante probability that the merger will be
cleared without conditions. The market can build a prior of this probability by using available
information about the merger and the Commission’s records. This is what the econometrician can
do by running a logit regression to assess the probability of clearance given the merger
observables.
Similarly, at the time of the Commission’s decision some new information hits the market.
The first important date is the phase 1 decision. The phase 1 decision’s effect ( 1Pij ) is the

35
difference between the antitrust decision’s competitive effect on firm i ( *Dij ) and the market
expectation about it. Likewise, if anticompetitive concerns are substantial and the Commission
decides to open a phase 2 investigation, the market updates its beliefs about remedies.38 Therefore,
the abnormal returns around the phase 1 decision ( 1Pij ) for mergers that go into a phase 2
investigation should simply be the update of the market expectation about remedies, given the
newer information set available at this point in time (IP1). Summarizing, the phase 1 effect is the
following:
2
1 Pr1
*1
*
***
1
phaseifIEIE
phaseifIactionIE
ADijP
Dij
AjDijA
Dij
Dij
Pij .
The competitive effect of the Commission’s decision for a case that does not go into phase 2 is
thus:
Aj
PijD
ijIactionPr1
1*
. (A2)
Similarly for cases going into phase 2, around the phase 2 decision, the abnormal return
( 2Pij ) should measure the difference between the competitive effect of a remedy in phase 2 and
the expectation that the market built given the information available on the phase 1 decision
ADij
Pij
DijP
Dij
Dij
Pij IIE *1*
1**2 E , i=M, R. Hence, the competitive effect of the
Commission’s decision for cases that go into phase 2 is the sum of phase 1 and phase 2 effects
weighted by the ex-ante probability of clearance:
AjPij
Pij
Dij IactionPr1/12* . (A3)
38 Indeed, when a case goes into phase 2, the probability of an antitrust intervention increases sharply. According to the European Commission’s statistics, the incidence of remedies in phase 1 is ca. 5%, while it increases to over 75% in phase 2. Moreover, a merger can be prohibited only after phase 2.

36
Appendix 3: Graphical Representation of Our Framework
Figure 3 should help to clarify our predictions in diagrams representing the announcement rents on
the x-coordinate and the decision rents on the y-coordinate. In part a) we describe the prediction
for rivals. Consider a merger 1, where efficiency and market power effects on rivals exactly cancel
each other out (i.e. MP efficiencies ), so that measured abnormal returns around the merger
announcement are zero (point A1). If this merger is blocked, the decision’s effect on rivals should
also be zero, since there is no net rent to be reversed. On the contrary, for this merger an effective
remedy would rip out only the market power rents ( MP ), leading to a negative shift (i.e.
intercept) due to the decision (movement to R1). Consider now the clearly anticompetitive merger
2. The market power effect is larger than the efficiency effect, so the starting point is A2. If this
merger is blocked, both the market power and the efficiency rents are reversed: we move down to
B2, by the amount of the net effect ( )MP efficiencies . In the case of remedies, an effective
decision takes away the market power effect still maintaining the efficiency effect. So we move
further down to point R2. By tracing out all possible mergers, we get the predicted regression lines
for the case of prohibitions and effective remedies. In the former, the slope is equal to -1; in the
latter, it is still negative but less steep than -1. 39
[figure 3 about here]
In part b) we describe the situation for the merging firms. First, notice that here the origin
represents a merger that has neither a market power nor an efficiency effect on merging firms’
profitability. Furthermore, in this case an effective action should not take away any rent since the
merger does not create any. Therefore, both regression lines for remedies and prohibitions should
run through the origin. We now consider merger 1 again, which has a positive announcement
effect consisting of the sum of the positive market power rents ( MP ) and the positive rents due to
increased efficiency ( esefficienci ). The starting point is therefore A1. If this merger is blocked, both
kinds of rents are destroyed and we move down to point B1. If effective remedies are imposed,
only the market power rents are ripped out by the antitrust action and we move down to point R1.
The same mechanism applies to merger 2. As with rivals, we observe for the merging firms, too,
that in the case of blocking the slope of the regression line should be -1, while in the case of
remedies it should be negative yet, in absolute terms, smaller then -1.40
39 The negative slope hinges on the assumption that the anticompetitive effect monotonically increases with the net-effect, i.e. that anticompetitive and efficiency effects are not perfectly negatively correlated. 40 In figure 3b, we blanked out the possibility of non-profitable mergers. The fact that mergers happen which reduce the efficiency and profits of merging firms cannot be well explained by standard industrial organization models (for an exception, see Fridolfsson and Stennek, 2005). Nevertheless, there is overwhelming evidence that these managerial mergers do take place (see e.g. Gugler et al., 2003). Predictions for an effective merger control in this case are difficult to spell out.

37
Tables and Figures
Figure 1: Frequency of Merger Control Interventions: EU and USA
Figure 2: The EU Merger Control Process

38
Figure 3: Effective merger control
a) Rivals
b) Merging firms

39
Table 1. Effective Merger Control
Predictions
Rivals (i=R) Merging firms (i=M)
Blocking (d=B) aRB = 0, bRB = -1 aMB = 0, bMB = -1
Remedies (d=O, S, R) aRO < 0, aRS < 0, aRR < 0
bRO < 0, bRS < 0, bRR < 0
aMO = 0, aMS = 0, aMR = 0
bMO < 0, bMS < 0, bMR < 0
Clearance (d=C) aRC = 0, bRC = 0 aMC = 0, bMC = 0
Note: aid denotes the intercepts and bid the slope coefficients (i=M, R and d=C,O,S,B). First subscript: M for merging firms and R for rivals. Second subscripts: B for Blocking; O for Other remedies; S for Structural remedies; C for outright Clearance. In some specifications, we do not differentiate between structural and other remedies due to the lack of observations. Hence, we use the subscript R for Remedies in these cases.
Table 2. Preliminary Statistics
Description Obs Mean Min Max
mvm Market value of merging firms in million US $ 151 44165 10.8 607975mvr Market value of rivals (average) in million US $ 151 7492 3.6 227604ncomp Number of competitors mentioned in the Commission report 151 7.59 1 34 ncomp_list Percentage of mentioned competitors listed in the stock market 151 0.63 0 1 full Full acquisition 151 0.57 0 1 partial Partial acquisition 151 0.13 0 1 JV Joint Venture 151 0.24 0 1 asset Asset acquisition 151 0.06 0 1 tender Tender offer 151 0.11 0 1 conglom Conglomerate or vertical concerns have been identified 151 0.15 0 1 crossbord Cross-border deal 151 0.69 0 1 us One or both of the merging firms stem from the USA 151 0.33 0 1 bigeu One or both of the merging firms stem from a major EU country
(France, Germany, Italy, Spain, or the UK) 151 0.68 0 1
phase1 The merger was cleared in phase 1 151 0.54 0 1 phase2 The merger was cleared in phase 2 151 0.46 0 1 EU The geographical market is the European Economic Area 151 0.41 0 1 World The geographical market is worldwide 151 0.21 0 1 ACTION An action (remedies or blocking) has been taken 151 0.43 0 1 BLOCK The merger was prohibited 151 0.08 0 1 STRUCTURAL The remedy consisted of a divestiture 151 0.23 0 1 OTHER Other kinds of remedies 151 0.12 0 1

40
Table 3: Abnormal Returns to Merging Firms and Their Rivals for Various Events, Windows and Decisions
Merging firms Rivals Short run Long run Short run Long run
Nobs CAAR (5,5)
S.E. CAAR (50,5)
S.E. NobsCAAR (5,5)
St.E. CAAR (50,5)
St.E.
At announcement of the merger: 151 0.010** 0.005 0.018 ** 0.010 151 -0.003 0.003 0.004 0.008At phase 1 decision of the merger:a Cleared in phase 1 71 -0.002 0.007 0.003 0.010 71 -0.002 0.005 0.008 0.009Cleared with remedies in phase 1 10 0.013 0.024 -0.007 0.033 10 -0.035* 0.020 0.032 0.066Going to phase 2 70 -0.017*** 0.006 -0.014** 0.008 70 -0.0001 0.005 -0.011 0.009All 151 -0.008** 0.004 -0.005 0.006 151 -0.003 0.003 0.000 0.007At phase 2 decision of the merger:
Cleared in phase 2 16 0.018 0.019 0.066** 0.037 16 0.001 0.010 0.001 0.022Cleared with remedies in phase 2 41 0.003 0.012 -0.015 0.015 41 -0.004 0.008 -0.017 0.029Blocked 13 0.008 0.009 0.008 0.049 13 0.025 0.025 -0.055 0.045All 70 0.007 0.008 0.005 0.015 70 0.001 0.007 -0.019 0.348
Note: *, **, *** ... significant at 10%, 5%, 1%. a For the phase 1 decisions the long-run window is (25,5).
Table 4: The Probability of Action
Coef. Std. Err us -1.314** 0.540 bigeu -0.419 0.480 conglom 0.955* 0.568 crossbord -0.476 0.459 world -0.418 0.519 eu -0.844* 0.482 full 0.781* 0.421 lmvm 0.121 0.165 lmvr 0.183** 0.151 d 1.034** 0.508 i 0.673 0.637 trend -0.949 0.611 d95_02 1.729* 0.921 constant -2.452 1.688 Nobs 151 Pseudo R2 0.156 Correctly classified 69.48% Log-likelihood -88.80
Note: The dependent variable, ACTION, is equal to 1 if the merger was cleared with remedies or blocked. us is equal to 1 if one of the merging firms stems from the USA; bigeu is equal to 1 if one of the merging firms stems from a big EU country (Germany, France, UK or Italy); conglom is equal to 1 if conglomerate or vertical effects are also present; crossbord is equal to 1 if the merger is a cross-border deal; world is equal to 1 if the EU Commission defines the relevant geographic market worldwide; eu is equal to 1 if relevant market is EU wide; full equal to 1 if the merger is a full merger; lmvm and lmvr are respectively the size of merging and rival firms measured by the logarithm of market values; d is equal to 1 if manufacturing sector; i is equal to 1 if communications sector; trend represents a time trend; d95_02 equal to 1 if the merger was scrutinized during 1995-2002. The symbols *, **, *** represent significance at 10%, 5%, 1% respectively

41
Table 5: Regression Results for Equation (1)
Dependent variable: Probability Corrected Decision CAAR, D*
Rivals (i=R) Merging Firms (i=M)
Coeff Robust
S.E.
Single Tests H0
Coeff Robust
S.E.
Single Tests H0
(p-values) (p-values)
CLEAR (aiC) 0.042 0.061 H0: aRC=0
0.494 -0.020 0.093 H0: aMC=0
0.832
OTHER REMEDIES (aiO) 0.013 0.037 H0: aRO 0 0.420 -0.095 0.056 H0: aMO 0
0.826
STRUCTURAL REMEDIES (aiS) 0.049 0.028 H0: aRS 0
0.233 -0.033 0.045 H0: aMS 0 0.626
BLOCK (aiB) -0.061 0.041 H0: aRB=0
0.410 -0.213 0.063 H0: aMB=0
0.062
CLEAR * A* (biC) 0.274 0.076 H0: bRC=0
0.000 0.007 0.090 H0: bMC=0
0.940
OTHER REMEDIES* A* (biO) -0.116 0.093 H0: bRO 0 0.893 -0.341 0.172 H0: bMO 0
0.975
STRUCTURAL REM.*A* (biS) -0.105 0.091 H0: bRS 0
0.874 -0.165 0.077 H0: bMS 0 0.983
BLOCK* A* (biB) -0.875 0.100 H0: bRB =-1
0.211 -0.718 0.136 H0: bMB =-1
0.040
Nobs 151 151 R2 0.539 0.325
Note: We use the Huber–White sandwich estimator for robust standard errors. We control for industry effects, for conglomerate/foreclosure aspects, and for the proportion of rivals that we lost due to data limitation. CLEAR: the merger is cleared without remedies; OTHER REMEDIES: the merger is cleared with remedies other than divestitures (mainly behavioral remedies); STRUCTURAL REMEDIES: the merger is cleared with a divestiture; BLOCK the merger is blocked. We report the p-value for the tested hypotheses. Figures in bold represent estimates which are significantly different from zero at the 10% level at least.
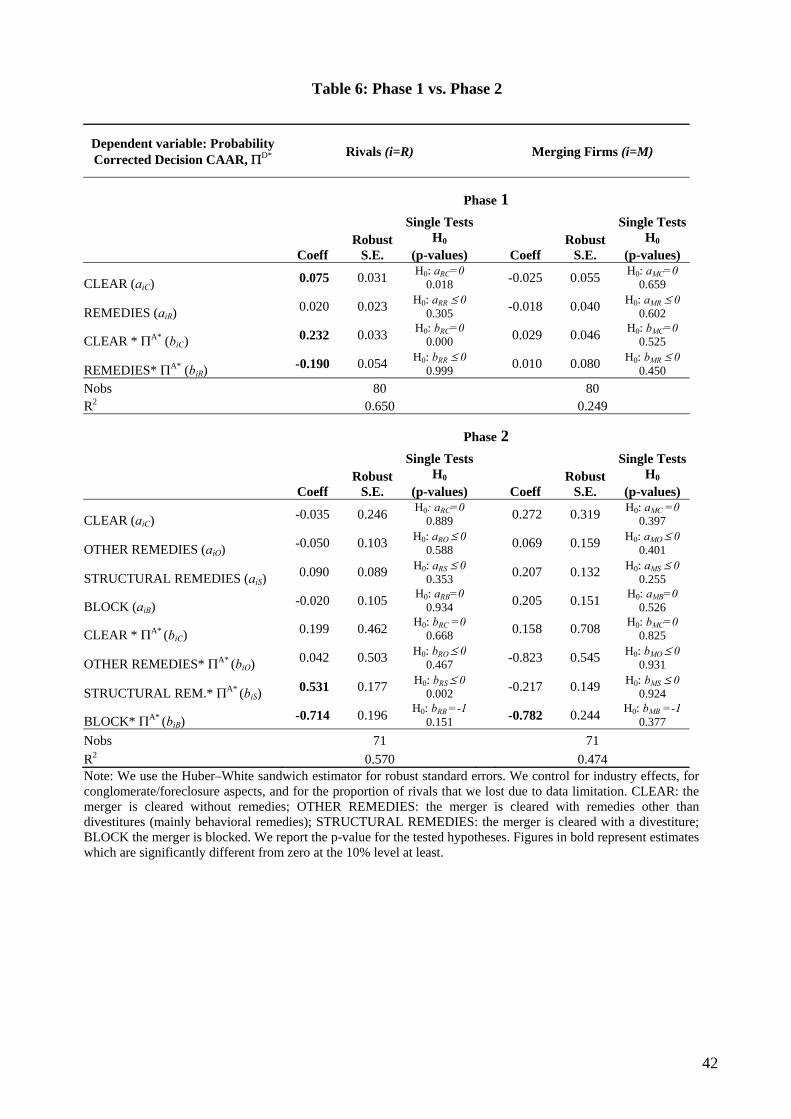
42
Table 6: Phase 1 vs. Phase 2
Dependent variable: Probability Corrected Decision CAAR, D*
Rivals (i=R) Merging Firms (i=M)
Phase 1
Coeff Robust
S.E.
Single Tests H0
Coeff Robust
S.E.
Single Tests H0
(p-values) (p-values)
CLEAR (aiC) 0.075 0.031 H0: aRC=0
0.018 -0.025 0.055 H0: aMC=0
0.659
REMEDIES (aiR) 0.020 0.023 H0: aRR 0 0.305 -0.018 0.040 H0: aMR 0
0.602
CLEAR * A* (biC) 0.232 0.033 H0: bRC=0
0.000 0.029 0.046 H0: bMC=0
0.525
REMEDIES* A* (biR) -0.190 0.054 H0: bRR 0 0.999 0.010 0.080 H0: bMR 0
0.450
Nobs 80 80 R2 0.650 0.249 Phase 2
Coeff Robust
S.E.
Single Tests H0
Coeff Robust
S.E.
Single Tests H0
(p-values) (p-values)
CLEAR (aiC) -0.035 0.246 H0: aRC=0
0.889 0.272 0.319 H0: aMC =0
0.397
OTHER REMEDIES (aiO) -0.050 0.103 H0: aRO 0 0.588 0.069 0.159 H0: aMO 0
0.401
STRUCTURAL REMEDIES (aiS) 0.090 0.089 H0: aRS 0
0.353 0.207 0.132 H0: aMS 0 0.255
BLOCK (aiB) -0.020 0.105 H0: aRB=0
0.934 0.205 0.151 H0: aMB=0
0.526
CLEAR * A* (biC) 0.199 0.462 H0: bRC =0
0.668 0.158 0.708 H0: bMC=0
0.825
OTHER REMEDIES* A* (biO) 0.042 0.503 H0: bRO 0 0.467 -0.823 0.545 H0: bMO 0
0.931
STRUCTURAL REM.*A* (biS) 0.531 0.177 H0: bRS 0
0.002 -0.217 0.149 H0: bMS 0 0.924
BLOCK* A* (biB) -0.714 0.196 H0: bRB =-1
0.151 -0.782 0.244 H0: bMB =-1
0.377
Nobs 71 71
R2 0.570 0.474 Note: We use the Huber–White sandwich estimator for robust standard errors. We control for industry effects, for conglomerate/foreclosure aspects, and for the proportion of rivals that we lost due to data limitation. CLEAR: the merger is cleared without remedies; OTHER REMEDIES: the merger is cleared with remedies other than divestitures (mainly behavioral remedies); STRUCTURAL REMEDIES: the merger is cleared with a divestiture; BLOCK the merger is blocked. We report the p-value for the tested hypotheses. Figures in bold represent estimates which are significantly different from zero at the 10% level at least.

43
Table 7: Pro- vs. Anticompetitive mergers
Dependent variable: Probability Corrected Decision CAAR, D*
Rivals (i=R) Merging Firms (i=M)
Full Sample
Coeff Robust
S.E.
Single Tests H0
Coeff Robust
S.E.
Single Tests H0
(p-values) (p-values)
CLEAR*ANTICOMP (aiC) 0.015 0.040 H0: aRC=0
0.834 0.031 0.041 H0: aMC=0
0.721
CLEAR*PROCOMP (aiC) 0.035 0.064 H0: aRC=0
0.590 0.018 0.081 H0: aMC=0
0.825
REMEDIES*ANTICOMP (aiR) 0.081 0.052 H0: aRR 0 0.150 -0.043 0.047 H0: aMR 0
0.685
REMEDIES*PROCOMP (aiR) 0.021 0.044 H0: aRR 0 0.387 0.011 0.044 H0: aMR 0
0.450
BLOCK (aiB) -0.066 0.048 H0: aRB=0
0.389 -0.257 0.058 H0: aMB=0
0.010
CLEAR*ANTICOMP* A*(biC) 0.352 0.172 H0: bRC=0
0.043 -0.226 0.123 H0: bMC=0
0.067
CLEAR*PROCOMP* A*(biC) 0.193 0.127 H0: bRC=0
0.129 0.020 0.105 H0: bMC=0
0.847
REMEDIES*ANTICOMP* A(biR)* -0.302 0.166 H0: bRR 0 0.964 -0.059 0.071 H0: bMR 0
0.797
REMEDIES*PROCOMP* A*(biR) -0.089 0.122 H0: bRR 0 0.767 -0.695 0.119 H0: bMR 0
0.999
BLOCK* A*(biB) -0.867 0.104 H0: bRB =-1
0.201 -0.763 0.118 H0: bMB =-1
0.047
Nobs 151 151 R2 0.497 0.469 Note: We use the Huber–White sandwich estimator for robust standard errors. We control for industry effects, for conglomerate/foreclosure aspects, and for the proportion of rivals that we lost due to data limitation. CLEAR: the merger is cleared without remedies; OTHER REMEDIES: the merger is cleared with remedies other than divestitures (mainly behavioral remedies); STRUCTURAL REMEDIES: the merger is cleared with a divestiture; BLOCK the merger is blocked. We report the p-value for the tested hypotheses. Figures in bold represent estimates which are significantly different from zero at the 10% level at least. ANTICOMP is equal to one if rivals’ announcement CAARs > 0 ( * 0A
Rj ); PROCOMP is equal to one if rivals’ announcement CAARs < 0 ( 0* ARj
).

44
Table 8: Robustness Check of Assumption 1: Pure Horizontal Mergers Dependent variable: Probability Corrected Decision CAAR, D*
Rivals (i=R) Merging Firms (i=M)
Pure Horizontal
Coeff Robust
S.E.
Single Tests H0
Coeff Robust
S.E.
Single Tests H0
(p-values) (p-values)
CLEAR (aiC) -0.027 0.073 H0: aRC=0
0.715 0.023 0.087 H0: aMC=0
0.790
OTHER REMEDIES (aiO) -0.119 0.045 H0: aRO 0 0.941 -0.097 0.054 H0: aMO 0
0.854
STRUCTURAL REMEDIES (aiS) -0.001 0.033 H0: aRS 0
0.506 0.031 0.042 H0: aMS 0 0.372
BLOCK (aiB) -0.102 0.050 H0: aRB=0
0.251 0.242 0.059 H0: aMB=0
0.022
CLEAR * A* (biC) 0.235 0.095 H0: bRC=0
0.015 -0.096 0.089 H0: bMC=0
0.286
OTHER REMEDIES* A* (biO) 0.886 0.169 H0: bRO 0 0.000 -0.365 0.175 H0: bMO 0
0.980
STRUCTURAL REM.*A* (biS) -0.077 0.106 H0: bRS 0
0.765 0.061 0.109 H0: bMS 0 0.288
BLOCK* A* (biB) -0.865 0.134 H0: bRB =-1
0.315 -1.325 0.136 H0: bMB =-1
0.018
Nobs 129 129 R2 0.560 0.570
Note: We use the Huber–White sandwich estimator for robust standard errors. We control for industry effects, for conglomerate/foreclosure aspects, and for the proportion of rivals that we lost due to data limitation. We report the p-value for the tested hypotheses. Figures in bold represent estimates which are significantly different from zero at the 10% level at least. Pure horizontal mergers are those for which the Commission identified only horizontal effects and no conglomerate or vertical effects
Table 9: Robustness Check of Assumption 2: Using the official announcement dates Dependent variable: Probability Corrected Decision CAAR, D*
Rivals Merging Firms
Coeff Robust
S.E.
Single Tests H0
Coeff Robust
S.E.
Single Tests H0
(p-values) (p-values)
CLEAR (aiC) 0.200 0.114 H0: aRC=0
0.082 0.007 0.118 H0: aMC=0
0.703
OTHER REMEDIES (aiO) -0.106 0.113 H0: aRO 0
0.826 -0.129 0.135 H0: aMO 0
0.564
STRUCTURAL REMEDIES (aiS) 0.155 0.122 H0: aRS 0
0.103 -0.052 0.094 H0: aMS 0
0.999
BLOCK (aiB) -0.009 0.149 H0: aRB 0
0.523
-0.473 0.320 H0: aMB =0
0.926
CLEAR * A* (biC) 0.303 0.054 H0: bRC=0
0.000 0.008 0.098 H0: bMC=0
0.830
OTHER REMEDIES* A* (biO) 0.054 0.086 H0: bRO 0
0.264 0.246 0.089 H0: bMO 0
0.004
STRUCTURAL REM.*A* (biS) -0.218 0.253 H0: bRS 0
0.805 -0.168 0.187 H0: bMS 0
0.414
BLOCK* A* (biB) -0.939 0.243 H0: bRB =-1
0.803 -0.887 0.800 H0: bMB =-1
0.256
Nobs 120 120 R2 0.38 0.36
Note: We control for industry effects, for conglomerate/foreclosure aspects, and for the proportion of rivals that we lost due to data limitation. We report the p-value for the tested hypotheses. Figures in bold represent estimates which are significantly different from zero at the 10% level at least. The official announcement is defined according to the SDC database (Thomson Reuters). We use the Huber-White sandwich estimator for robust standard errors.

45
Table 10: Robustness Check of Assumption 2: Post-1996
Dependent variable: Probability Corrected Decision CAAR, D*
Rivals (i=R) Merging Firms (i=M)
Post 1996
Coeff Robust
S.E.
Single Tests H0
Coeff Robust
S.E.
Single Tests H0
(p-values) (p-values)
CLEAR (aiC) 0.022 0.066 H0: aRC=0
0.743 0.072 0.081 H0: aMC=0
0.378
OTHER REMEDIES (aiO) -0.027 0.066 H0: aRO 0 0.625 -0.042 0.079 H0: aMO 0
0.661
STRUCTURAL REMEDIES (aiS) 0.031 0.045 H0: aRS 0
0.340 0.020 0.056 H0: aMS 0 0.413
BLOCK (aiB) -0.066 0.069 H0: aRB 0 0.464 -0.481 0.079
H0: aMB=0 0.000
CLEAR * A* (biC) 0.252 0.111 H0: bRC=0
0.026 -0.008 0.106 H0: bMC=0
0.942
OTHER REMEDIES* A* (biO) -0.106 0.136 H0: bRO 0 0.781 -0.338 0.192 H0: bMO 0
0.959
STRUCTURAL REM.*A* (biS) 0.395 0.132 H0: bRS 0
0.002 -0.185 0.089 H0: bMS 0 0.980
BLOCK* A* (biB) -0.843 0.178 H0: bRB =-1
0.379 -0.687 0.152 H0: bMB =-1
0.042
Nobs 104 104 R2 0.418 0.476
Note: We use the Huber–White sandwich estimator for robust standard errors. We control for industry effects, for conglomerate/foreclosure aspects, and for the proportion of rivals that we lost due to data limitation. We report the p-value for the tested hypotheses. Figures in bold represent estimates which are significantly different from zero at the 10% level at least. The post-1996 period includes the years 1996-2002, i.e. the years of the economy-wide merger wave.

46
Table 11: Robustness Check of Assumptions 1 & 2: "Active" vs. "Inactive" Industries
Dependent variable: Probability Corrected Decision CAAR, D*
Rivals (i=R) Merging Firms (i=M)
Active
Coeff Robust
S.E.
Single Tests H0
Coeff Robust
S.E.
Single Tests H0
(p-values) (p-values)
CLEAR (aiC) 0.109 0.074 H0: aRC=0
0.146 0.076 0.127 H0: aMC=0
0.554
OTHER REMEDIES (aiO) -0.120 0.138 H0: aRO 0
0.805 0.025 0.161 H0: aMO 0
0.876
STRUCTURAL REMEDIES (aiS) 0.099 0.106 H0: aRS 0
0.178 0.043 0.175 H0: aMS 0
0.403
BLOCK (aiB) 0.113 0.101 H0: aRB 0
0.268 -0.079 0.319 H0: aMB 0
0.805
CLEAR * A* (biC) 0.201 0.103 H0: bRC=0
0.057 -0.209 0.104 H0: bMC=0
0.050
OTHER REMEDIES* A* (biO) 0.561 0.530 H0: bRO 0
0.147 -0.461 0.458 H0: bMO 0
0.841
STRUCTURAL REM.*A* (biS) -0.069 0.270 H0: bRS 0
0.600 -0.190 0.363 H0: bMS 0
0.698
BLOCK* A* (biB) -0.654 0.273 H0: bRB =-1
0.210 -0.912 0.225 H0: bMB =-1
0.696
Nobs 75 75 R2 0.333 0.433
Inactive
Coeff Robust
S.E.
Single Tests H0
Coeff Robust
S.E.
Single Tests H0
(p-values) (p-values)
CLEAR (aiC) 0.322 0.116 H0: aRC=0
0.008 0.197 0.125 H0: aMC=0
0.200
OTHER REMEDIES (aiO) 0.176 0.140 H0: aRO 0
0.107 0.036 0.170 H0: aMO 0
0.107
STRUCTURAL REMEDIES (aiS) 0.279 0.132 H0: aRS 0
0.020 0.115 0.124 H0: aMS 0
0.177
BLOCK (aiB) 0.196 0.071 H0: aRB=0
0.008 0.188 0.181 H0: aMB=0
0.399
CLEAR * A* (biC) 0.008 0.217 H0: bRC=0
0.970 0.347 0.122 H0: bMC=0
0.230
OTHER REMEDIES* A* (biO) 0.273 0.280 H0: bRO 0
0.168 -0.155 0.154 H0: bMO 0
0.721
STRUCTURAL REM.*A* (biS) -0.022 0.564 H0: bRS 0
0.515 -0.053 0.086 H0: bMS 0
0.901
BLOCK* A* (biB) -0.651 0.209 H0: bRB =-1
0.101 -0.686 0.388 H0: bMB =-1
0.073
Nobs 76 76 R2 0.433 0.520
Note: We use the Huber–White sandwich estimator for robust standard errors. We control for industry effects, for conglomerate/foreclosure aspects, and for the proportion of rivals that we lost due to data limitation. We report the p-value for the tested hypotheses. Figures in bold represent estimates which are significantly different from zero at the 10% level at least. The subsample of "inactive (active) industries" is defined by those cases for which the future merger growth rate by 2-digit NACE in the following two years is lower (larger) than 12% (the median values). We use the full population of more than 3,500 notified EU mergers for this definition.

47
Table 12: Robustness Check of Assumption 2: "Speedy" versus "slow" mergers
Dependent variable: Probability Corrected Decision CAAR, D*
Rivals (i=R) Merging firms (i=M)
Speedy
Coeff Robust
S.E.
Single Tests H0
Coeff Robust
S.E.
Single Tests H0
(p-values) (p-values)
CLEAR (aiC) 0.079 0.090 H0: aRC=0
0.385 -0.021 0.103 H0: aMC=0
0.839
OTHER REMEDIES (aiO) 0.039 0.133 H0: aRO 0
0.385 -0.060 0.139 H0: aMO 0
0.669
STRUCTURAL REMEDIES (aiS) 0.062 0.129 H0: aRS 0
0.402 -0.019 0.126 H0: aMS 0
0.561
BLOCK (aiB) 0.063 0.135 H0: aRB 0
0.645 -0.464 0.303 H0: aMB 0
0.131
CLEAR * A* (biC) 0.164 0.127 H0: bRC=0
0.201 0.120 0.092 H0: bMC=0
0.197
OTHER REMEDIES* A* (biO) -0.281 0.224 H0: bRO 0
0.892 -0.623 0.303 H0: bMO 0
0.044
STRUCTURAL REM.*A* (biS) 0.188 0.761 H0: bRS 0
0.402 -0.179 0.067 H0: bMS 0
0.995
BLOCK* A* (biB) -1.034 0.153 H0: bRB =-1
0.827 -2.222 0.704 H0: bMB =-1
0.221
Nobs 75 75 R2 0.510 0.570
Slow
Coeff Robust
S.E.
Single Tests H0
Coeff Robust
S.E.
Single Tests H0
(p-values) (p-values)
CLEAR (aiC) 0.210 0.155 H0: aRC=0
0.180 0.055 0.111 H0: aMC=0
0.622
OTHER REMEDIES (aiO) -0.190 0.125 H0: aRO 0
0.934 -0.159 0.147 H0: aMO 0
0.286
STRUCTURAL REMEDIES (aiS) 0.125 0.163 H0: aRS 0
0.223 0.027 0.135 H0: aMS 0
0.423
BLOCK (aiB) 0.134 0.177 H0: aRB=0
0.452 0.029 0.210 H0: aMB=0
0.891
CLEAR * A* (biC) 0.193 0.141 H0: bRC=0
0.178 0.012 0.251 H0: bMC=0
0.188
OTHER REMEDIES* A* (biO) 0.721 0.174 H0: bRO 0
0.000 -0.063 0.294 H0: bMO 0
0.585
STRUCTURAL REM.*A* (biS) -0.117 0.430 H0: bRS 0
0.606 -0.234 0.325 H0: bMS 0
0.762
BLOCK* A* (biB) -0.444 0.245 H0: bRB =-1
0.027 -0.829 0.196 H0: bMB =-1
0.388
Nobs 76 76 R2 0.416 0.481 Note: We use the Huber–White/ sandwich estimator for robust standard errors. We control for industry effects, for conglomerate/foreclosure aspects, and for the proportion of rivals that we lost due to data limitation. We report the p-value for the tested hypotheses. Figures in bold represent estimates which are significantly different from zero at the 10% level at least. "Speedy" (“slow”) mergers are cases for which the distance between the first rumors about the merger and its notification is lower (larger) than 55 days (the median).

48
Table 13: Robustness Check of Assumptions 3 and 4: Remedy-intensive Industries
Dependent variable: Probability Corrected Decision CAAR, D*
Rivals (i=R) Merging Firms (i=M)
Remedy-Intensive Industries
Coeff Robust
S.E.
Single Tests H0
Coeff Robust
S.E.
Single Tests H0
(p-values) (p-values)
CLEAR (aiC) 0.000 0.186 H0: aRC=0
0.998 0.100 0.126 H0: aMC=0
0.429
OTHER REMEDIES (aiO) -0.046 0.065 H0: aRO 0 0.592 0.031 0.077 H0: aMO 0
0.415
STRUCTURAL REMEDIES (aiS) 0.011 0.051 H0: aRS 0
0.477 0.084 0.062 H0: aMS 0 0.250
BLOCK (aiB) -0.097 0.075 H0: aRB 0 0.625 0.276 0.097 H0: aMB 0
0.059
CLEAR * A* (biC) 0.441 0.170 H0: bRC=0
0.012 -0.148 0.143 H0: bMC=0
0.304
OTHER REMEDIES* A* (biO) -0.193 0.133 H0: bRO 0 0.924 -0.564 0.223 H0: bMO 0
0.993
STRUCTURAL REM.*A* (biS) -0.533 0.162 H0: bRS 0
0.999 -0.193 0.087 H0: bMS 0 0.985
BLOCK* A* (biB) -0.837 0.161 H0: bRB =-1
0.315 -1.514 0.302 H0: bMB =-1
0.094
Nobs 81 81 R2 0.590 0.587
Note: We use the Huber–White sandwich estimator for robust standard errors. We control for industry effects, for conglomerate/foreclosure aspects, and for the proportion of rivals that we lost due to data limitation. We report the p-value for the tested hypotheses. Figures in bold represent estimates which are significantly different from zero at the 10% level at least. In remedy-intensive industries, defined at the two digit NACE code, the Commission imposed remedies including prohibitions in more than 10% of the mergers (i.e. the median). We use the full population of more than 3,500 notified EU mergers for this definition.

49
Table 14: Robustness Check of Assumption 3: Timely Decisions
Dependent variable: Probability Corrected Decision CAAR, D*
Rivals (i=R) Merging Firms (i=M)
Timely Decisions
Coeff Robust
S.E.
Single Tests H0
Coeff Robust
S.E.
Single Tests H0
(p-values) (p-values)
CLEAR (aiC) 0.005 0.065 H0: aRC=0
0.943 0.069 0.066 H0: aMC=0
0.301
OTHER REMEDIES (aiO) -0.263 0.176 H0: aRO 0
0.931 -0.021 0.082 H0: aMO 0
0.604
STRUCTURAL REMEDIES (aiS) 0.025 0.091 H0: aRS 0
0.394 0.031 0.084 H0: aMS 0
0.358
BLOCK (aiB) -0.196 0.163 H0: aRB 0
0.625 -0.092 0.237 H0: aMB 0
0.703
CLEAR * A* (biC) 0.183 0.067 H0: bRC=0
0.008 0.027 0.088 H0: bMC=0
0.757
OTHER REMEDIES* A* (biO) 0.954 0.676 H0: bRO 0
0.081 -0.555 0.360 H0: bMO 0
0.937
STRUCTURAL REM.*A* (biS) -0.577 0.286 H0: bRS 0
0.976 -0.110 0.089 H0: bMS 0
0.891
BLOCK* A* (biB) -1.007 0.104 H0: bRB =-1
0.945 -1.655 1.715 H0: bMB =-1
0.094
Nobs 110 110 R2 0.4605 0.2273
Note: We use the Huber–White sandwich estimator for robust standard errors. We control for industry effects, for conglomerate/foreclosure aspects, and for the proportion of rivals that we lost due to data limitation. We report the p-value for the tested hypotheses. Figures in bold represent estimates which are significantly different from zero at the 10% level at least. “Timely decisions” are decisions made according to the deadlines prescribed by the merger regulation. We exclude “early” and “late” decisions. The former are cases where the commission made its decision 5 (25) days before the deadline in phase 1 (2), while the latter are cases where the decisions comes 5 (10) days after the deadline in phase I (2).