
EPR for Packaging Ontario Case Study | US EPA … · EPR for Packaging Ontario Case Study ......
29
Transcript of EPR for Packaging Ontario Case Study | US EPA … · EPR for Packaging Ontario Case Study ......

Slide 1
Derek Stephenson
President
EPR for PackagingOntario Case Study
USEPA Dialogue on Sustainable Financing of Municipal Recycling
November 22, 2010

Slide 2
12.7M population
4.4M households
500 municipalities– organized into 120 regional
recycling programs
95% of single family homes with recycling services
~25% of multi-family units served
Some significant differences in packaging generation– i.e., beverage containers ~ 50% of US rates
Ontario - Key StatisticsOntario - Key Statistics

Slide 3
Brand Owners & first importers are “stewards”
Stewards fund 50% approved net cost of municipal residential Blue Box (BB) programs– shared responsibility approach
Small business exemptions: – less than $2M sales
– less than 15,000 kg of designated materials
Stewards report on/pay for amount & type of printed paper & packaging they generate
Ontario’s Blue Box Program Plan (BBPP)Ontario’s Blue Box Program Plan (BBPP)

Slide 4
Defined by regulation (ON Reg. 273/02)– glass, metal, paper, plastic & textiles or
any combination of above
BBPP narrowed definition to only consumer packaging material & printed papers commonly found in residential waste stream– includes all household packaging &
printed paper managed as municipal waste
What are Blue Box Wastes (BBW)?What are Blue Box Wastes (BBW)?

Slide 5
BBPP Obligated CategoriesBBPP Obligated Categories
Category Material Category MaterialPrinted Paper
Newsprint: CNA & OCNANewsprint: Non-CNA/OCNAMagazines & CataloguesTelephone BooksOther Printed Paper
Plastics PET bottlesHDPE bottlesPlastic filmPlastic laminantsPolystyreneOther plastics
Paper Packaging
Old Corrugated ContainersGabletopPaper LaminantsAseptic ContainersOld Boxboard
Aluminum (Al)
Al food & beverage containersOther aluminum packaging
Steel Steel food & beverage containersAerosols Paint cans
Glass Food & beverage – Flint & coloured

Slide 6
All stewards report online
BBPP– annual report based on previous year sales
– total quantity (kg) sold or delivered into ON in 22 material categories
– quarterly payments
Steward RequirementsSteward Requirements

Slide 7
Stewards Register, Report & Invoice Online Stewards Register, Report & Invoice Online
2008 Results
Registration with Stewardship Ontario 4,235
Exempted - No Blue Box wastes 1,290
Exempted - Blue Box wastes but <$2 Million 992
Obligated Stewards – required to submit Steward’s Report 1,951
Reported between 0 to15 tonnes – no fees paid 407

Slide 8
Key elements include:– weight-based fees promote reduction
– activity-based costing to assign differential costs to each material type
– 3-factor formula shifts costs from highest performing materials to lowest performing
– market development fees to overcome market barriers, enhance value
– shares common costs across all materials
BB Fee-SettingBB Fee-Setting

Slide 9
Where required to increase capacity/increase revenues
Included in steward fees, by material type Glass market development successes
– ~ $2.5M added to glass fees– funding for 7 projects to use mixed glass
Plastics market development underway Plastics ~ $2.4M
– focus on developing markets & “All bottles plus tubs”promotion & education campaign
Market Development FeesMarket Development Fees

Slide 10
Encourages diversion of greater quantities of Blue Box Wastes– at lowest possible cost to stewards & municipalities
– encourages recovery of next least cost tonne BBW
– shares some costs incurred by stewards of materials with highest recycling rates among stewards of materials with lowest recycling rates
Current Funding FormulaCurrent Funding Formula
Slide 11
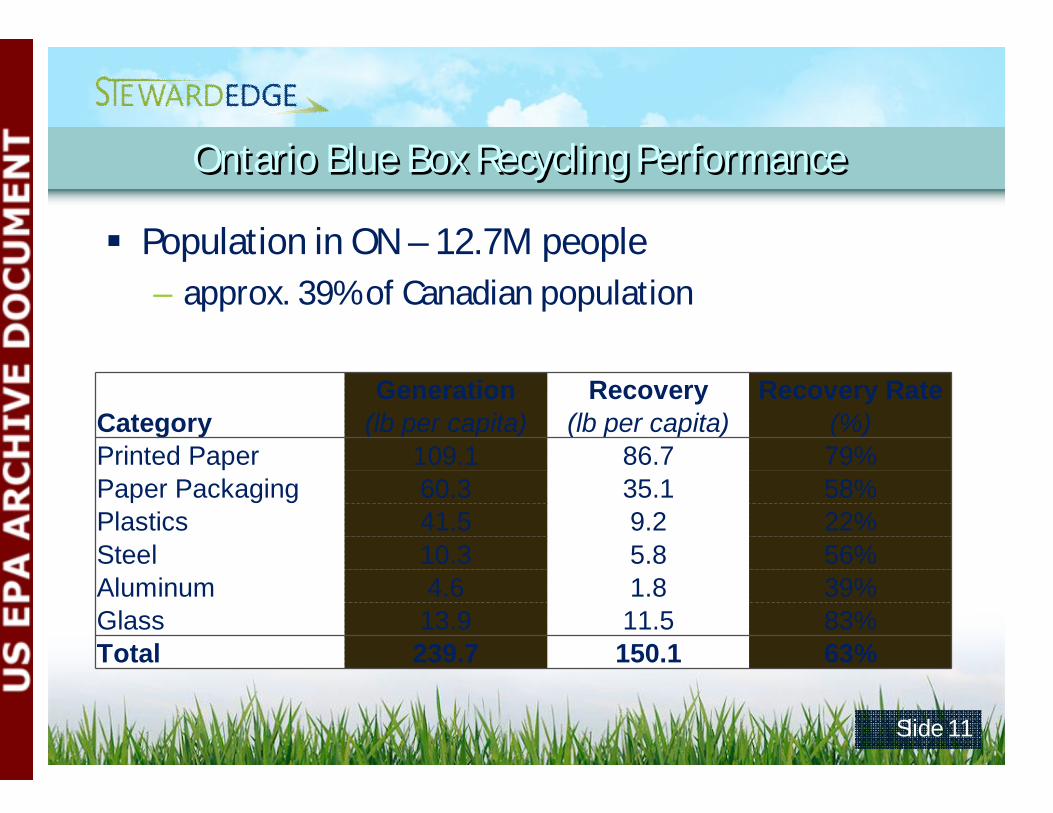
Ontario Blue Box Recycling PerformanceOntario Blue Box Recycling Performance
Population in ON – 12.7M people– approx. 39% of Canadian population
Generation Recovery Recovery RateCategory (lb per capita) (lb per capita) (%)Printed Paper 109.1 86.7 79%Paper Packaging 60.3 35.1 58%Plastics 41.5 9.2 22%Steel 10.3 5.8 56%Aluminum 4.6 1.8 39%Glass 13.9 11.5 83%Total 239.7 150.1 63%

Slide 12
Total costs divided by materials according to approved methodology
3-factor formula:– 35%: relative recovery rate–higher recovery, lower
fee rate
– 40%: net cost to manage (activity-based)
– 25%: to recognize materials at high recovery & low net cost (equalization factor)
How Fees Set to Share CostsHow Fees Set to Share Costs

Slide 13
Fees Reflecting 100% CostFees Reflecting 100% Cost
-150
-100
-50
0
50
100
150
200
250
OCC & OBB
Other PaperPackaging
PET Bottles
HDPEBottles
OtherPlastics
Steel AluminumCans
OtherAluminumPackaging
Clear Glass
ColouredGlassB
ase
Fee
Rat
e ($
/tonn
e)
Net Cost to Manage
Allocate cost to collect & sort each material using detailed activity-based costing

Slide 14
Impact of Fee-Setting FormulaImpact of Fee-Setting Formula
-150
-100
-50
0
50
100
150
200
250
Bas
e Fe
e R
ate
($/to
nne)
Net Cost to Manage
3-Factor Formula
OCC & OBB
Other PaperPackaging
PET Bottles
HDPEBottles
OtherPlastics
Steel AluminumCans
OtherAluminumPackaging
Clear Glass
ColouredGlass
69% 6% 57% 59% 6% 60% 51% 9% 69% 68%
3 factor formula transfers costs from materials with high recycling rates to those with low recycling rates to increase financial incentive to improve performance

Slide 15
Examples of Policy Impact on BBPP FeesExamples of Policy Impact on BBPP Fees
Recovery Rate
50% Net Cost Obligation
Base Fees
Costs Transferred
Corrugated Cardboard & Boxboard
69% $35M $19M ($16M)
Other Plastics 6% $6M $24M +$18M
www.stewardshipontario.ca/bluebox/fees/fees_2008.htm

Slide 16
Profile of Net E&E Factors for Small Urban Municipal Blue Box Programs
0.00
1.00
2.00
3.00
4.00
5.00
6.00
7.00
8.00
9.00
10.00
Owen So
undPete
rboro
ugh
Orillia
Newmark
etOran
geville
Brantford
Brockvil
leStra
tford
Sarnia
St. Thom
asSau
lt Ste.
Mari
eKingsto
nNorth
Bay
Timmins
Thunder
BayCorn
wall
Net
EE
Fac
tor (
net c
ost /
tonn
e /
% re
cove
ry)
Mean + Standard Deviation at 75th percentile
Monitoring & TrackingMonitoring & TrackingEstablishing & tracking key performance indicators
Recycling program designRecycling program design

Slide 17
Continuous Improvement FundContinuous Improvement Fund
• 80%of annual stewards obligation is paid out to individual municipalities in quarterly payments
• Through 2010, 20% of the annual stewards cash contribution is allocated to the CIF and distributed on a competitive grant basis
• Objectives is to assist Ontario municipalities to improve the effectiveness and efficiencies of the blue box program and to divert more paper and packaging material from landfill

Slide 18
Key Performance MetricsKey Performance Metrics
• CIF has received over 340 applications and invested $24.5 million in 242 projects. – Includes all aspects of the blue box program from collection to
processing, promotion and education, and end market reprocessing
• Funds have been distributed across the province to over 150 municipalities and First Nation communities.
• Over 100,000 tonnes of new material processing capacity has been added to the system with projected payback in operational savings of four years

Slide 19
Program Cost TrendProgram Cost Trend

Slide 20
How Much Does This Cost?How Much Does This Cost?

Slide 21
Steward obligation adjusted based on “best practice”analysis
$157 M CAD approved net system cost (gross cost less revenue) for 2009 fee’s– industry obligation: $78.5M
CAD (50% of net cost)• printed paper worth 13% of
obligation• packaging worth 87% of
obligation
Multi-Material Costs in OntarioMulti-Material Costs in Ontario
CategoryNet Cost
(CAD $/ton)
% ofNet
CostPrinted Paper $19 13%Paper Packaging $182 52%
Plastics $397 30%
Steel $76 4%
Aluminum ($401) (6%)
Glass $83 8%
Total $82 100%

Slide 22
Obligation to Municipalities
Transfers to WDO and MOE
Investments, e.g., Market Development
Program Management
3.3%
4.4%
1.1%
Budget Allocation
Where the Money GoesWhere the Money Goes
91.2%

Slide 23
System Cost Changes/TrendsSystem Cost Changes/Trends
2008 2009 % Change
Gross Cost $312.60t $330.40/t +5.7%
Material Revenue $132.95/t $119.32/t -10.3%
Net Cost $179.65/t $211.08/t +17.5%
• Steel price down 64%, aluminum down 36%• Plastic prices down 54%• Newspaper price down 41%, corrugated cardboard
down 39%, boxboard down 58%

Slide 24
Unusual Market Conditions (1)Unusual Market Conditions (1)
2008/9 recession created “perfect storm” of negative drivers for steward fees:
– commodity prices down across the board
– lower product sales, fewer tonnes to recycle, fewer tonnes against which to allocate costs
– fuel costs, changing material mix & largely fixed costs offset any reduction from fewer tonnes
– newsprint generation continues to decline

Slide 25
2003-2008 material generation was steadily increasing due to growing economy
Generation dropped in 2009 due to recession & impact of steward efforts to reduce product packaging
Clear but weak economic recovery suggests higher sales for some materials in 2010 versus 2009
Examined economic conditions on material basis & adjusted forecasted sales to reflect findings
Unusual Market Conditions (2) Unusual Market Conditions (2)

Slide 26
Example Fee Rates – Ontario (1)Example Fee Rates – Ontario (1)
Obligated MaterialsFees with 50/50 Cost
Share(cents/kg)
Fees with 100% Responsibility
(cents/kg)
Old Corrugated Containers 7.81 15.62
Gable top 19.65 39.30
Paper Laminants 19.65 39.30
Aseptic Containers 19.65 39.30
Old Boxboard 7.81 15.62
PET bottles 12.98 25.96
HDPE bottles 12.49 24.98
Plastic Film 24.65 49.30
Plastic Laminants 24.65 49.30
Polystyrene 24.65 49.30
Other Plastics 24.65 49.30

Slide 27
Example Fee Rates – Ontario (2)Example Fee Rates – Ontario (2)
Obligated MaterialsFees with 50/50
Cost Share(cents/kg)
Fees with 100% Responsibility
(cents/kg)
Steel Food & Beverage 5.54 11.08
Steel Aerosols 5.54 11.08
Steel Paint Cans 5.54 11.08
Al Food & Beverage Cans -2.20 -4.40
Other Aluminum Packaging 1.39 2.78
Flint Glass 3.80 7.60
Coloured Glass 4.10 8.20