EPPSA STudy THERMAL POWER IN 2030. Publications...THERMAL POWER IN 2030 - Added Value For EU Energy...
44
European Power Plant Suppliers Association THERMAL POWER IN 2030 ADDED VALUE FOR EU ENERGY POLICY EPPSA STUDY
Transcript of EPPSA STudy THERMAL POWER IN 2030. Publications...THERMAL POWER IN 2030 - Added Value For EU Energy...

European Power Plant Suppliers Association
THERMAL POWER IN 2030AddEd VALuE FOR Eu ENERgy POLIcy
EPPSA STudy

EPPSA STUDY2
Authors: Patrick Clerens, Mike Farley, Luka Jazbec, Nicolas Kraus and Klaus-Dieter Tigges Editor: Tom De Latte Special acknowledgment to the EPPSA members who helped make this publication possible.
© European Power Plant Suppliers Association, 2015
This text may be downloaded. If used, the source should be acknowledged. If cited or quoted, reference should be made to the full name of the authors, the title and the year.
Contents
Introduction ........................................................................................................................................ 3
Executive Summary ............................................................................................................................. 3
1. EU Energy Policy: Past, Present and Future ....................................................................................... 7
2. The EU Energy System and the changing role of Thermal Power ..................................................... 13
3. The Added Value of Thermal Power in 2030 .................................................................................... 35
4. Conclusions and Recommendations .............................................................................................. 39
Abbreviations and Acronyms .............................................................................................................. 42
Bibliography ...................................................................................................................................... 43

THERMAL POWER IN 2030 - Added Value For EU Energy Policy 3
Introduction
Thermal Power is the generation of electricity by the combustion of fossil fuels (including gas, coal and lignite) and/or biomass using combinations of boilers, gas and steam turbines and turbo-generators. Thermal power has traditionally been central - alongside nuclear power in some countries - in the production of electricity in Europe. Nowadays, with the increasing use of renewable energy, the role of Thermal Power is changing but nevertheless remains vitally important. This report
demonstrates the continuing central importance of Thermal Power in the European Union (EU) but also highlights the growing challenges due to the declining economic viability of thermal power plants. The criticism on Thermal Power with regard to carbon lock-in is refuted. The dichotomy between the importance of Thermal Power and the consequences of present-day policies are pointed out.
Executive Summary
This EPPSA report explores the future role of Thermal Power in Europe going forward. It demonstrates its continuing and central importance but also highlights the growing challenges and risks due to declining economic viability.
The review begins (Section 1) with a review of the past, present and future of EU Energy Policy in an attempt to define its current trajectory and the future place of Thermal Power. EU Energy Policies, especially the short-term targets for 2020 (i.e. 20-20-20) and the long-term aims for 2050 (80-95% Greenhouse Gas (GHG) emission reductions) have set the market on course for a low-carbon electricity system. This trajectory has been reinforced by the 2014 Policy Framework for Energy and Climate Change package with its binding national targets for 2030 of a 43% cut in Carbon Dioxide (CO2) emissions for the sectors covered by the Emission Trading System (ETS). The importance of Thermal Power and fossil fuel diversity have not been fully recognised, however.
The role of Thermal Power is changing as a result of the increasing deployment of intermittent Renewable Energy Sources (RES). Thermal power plants are moving from mostly “baseload” to a more flexible operation. EPPSA has compared the flexibility requirements of a modern electricity system with the technical capabilities of current and future thermal power plants (Section 2). Operation of the power system in the ‘classical’ sense, where demand was the main source of variation, is described in a simplified manner (2.2.1), and the role of Thermal Power in such a system is examined (2.2.2). The changes occurring to this operation as a result of an increasing deployment of intermittent RES (i-RES) are defined (2.3.1) and the associated new requirements that this places on thermal power plants are studied (2.3.2).
It is recognised that the necessary overall load gradients can be met by small numbers of plants with relatively fast (3%/min) ramping rates or a larger number of plants with slower ramping rates. The flexibility characteristics of thermal power plants are reviewed (2.4.1). The results of new EPPSA surveys (2.4.2) that set out member’s views on Best Available Technology (BAT) are given and exemplars of the many flexible plants already in operation are presented. (2.4.3). It is clear from the experience around Europe that existing thermal power plants (coal, lignite, gas and biomass) are capable of balancing the variability of demand and of intermittent generation whilst meeting environmental limits over their full load range. However, many existing thermal power plants are less than optimum:
• They are less efficient than BAT at full load, and they are frequently being operated at reduced efficiency at part-load. This reduction of efficiency at part-load pushes the cost of electricity up through the sub-optimum use of fuel and has an impact on CO2 emissions
• The cycling of plants reduces the plant life, with the lifetime determined by the number of cycles rather than by the total operating hours, which will be reduced
• Thermal power plants will be running for fewer hours and these at part-load. For example, plants optimised for full load operation at 4,000 to 8,000 hours per year (e.g. ‘classical’ baseload plants) will be expected to operate between 1,500 to 3,000 hours per year at part-load1.
1 VDE (2012), “Erneuerbare Energie braucht flexible Kraftwerke – Szenarien bis 2020”, pp. 57

EPPSA STUDY4
The increasing deployment of intermittent generation has important consequences for the economics of the whole power system and for future investments.
Modern plants that were built for base-load and are now only operating at part-load are less economical than anticipated in their investment case. The case for essential investments in new plants must be made against uncertainties in anticipated running hours, wholesale electricity prices and fuel prices.
EPPSA has analysed a number of studies on the EU energy system in 2030 to examine what role can be foreseen for thermal power plants. A total of 24 scenarios from 7 studies were taken up and compared (sections 2.5.1 to 2.5.4) with regard to electricity generation (MWh) and installed capacity (GW). In addition, they were specifically examined and compared with regard to the additional capacity of thermal power needed by 2030 to account for the decommissioning of existing plants (2.5.5). The key results from the reviewed scenarios are:
• In most decarbonisation scenarios, the absolute thermal power capacity in 2030 ranges from 423 to 485 GW, which is not significantly different from the 479 GW in the 2010 Reference case.
• In the 2010-2030 period, significant investment in dispatchable capacity generally and thermal power capacity in particular is required to maintain generation adequacy; between 166 and 234.3 GW of thermal power capacity additions are required. This means that between 39.4 and 48.3% of installed thermal power capacity in 2030 will need to be built in the years 2010-2030.
It is concluded (Section 3) that Thermal Power will continue to provide a significant added value to the EU through to 2030 and beyond, contributing to affordability, security of supply, sustainability and technological leadership:
• Affordability. Flexible and baseload thermal power plants will contribute enormously to the affordability of electricity in 2030. Thermal power (lignite, hard coal, and gas) is significantly less expensive than renewable power in terms of €/MWh, as indicated by the large support subsidies which are necessary to promote the use of renewables. Furthermore, if renewable sources are expected - in 2030 or thereafter – to deliver the electricity currently provided by thermal power, we would need very much more geographically diverse sources outside Europe and thus very long transmission lines.
• Security of Supply. Thermal power plants provide essential, secure, dispatchable power, available as required to meet demand. They are not subject to the regular daily intermittency of solar (day/night) or the weather dependent intermittency of solar and wind. Unlike the energy produced by the latter, thermal energy can be stored in the form of the fuel – e.g. a coal heap. There are ample reserves of fossil fuels, including coal and lignite which are indigenous to Europe, and these reserves have increased as a result of the discovery and potential use of shale gas. Security of supply can be assured by using geographically diverse sources of lignite, coal and gas.
• Sustainability. The energy efficiency of modern thermal power plants is 33% higher than older plants2. However, given the reserves of fossil fuels, the main sustainability issue for fossil thermal power plants is CO2 emissions. A potential solution to CO2 emissions is Carbon Capture and Storage (CCS) which will be essential by 2030 in order to reduce emissions from all industrial processes requiring fossil fuels. Europe is fortunate to have huge potential stores for CO2 within reach, including storage deep beneath the Central North Sea basin, in depleted gas fields and oil fields and in saline formations, sufficient for as much as 100 million tonnes of CO2 per year by 2030 and 500 million tonnes per year by 2050 – equivalent to 25% of the total EU emissions (at 2007 levels).
• Technological Leadership. Europe is a leader in most aspects of Thermal Power technology, including gas turbines (GTs), heat recovery steam generators (HRSG), coal and lignite fired boilers and steam turbines, CO2 capture, transport and storage systems, and control systems/ancillaries. Many leading global players in Thermal Power have their technology hubs in Europe. New plants and retrofits are being designed and built, many by EPPSA members, for improved efficiency, flexibility (minimum load, reduced start-up times and faster ramp rates) and to cope with thermal cycling. Coal, lignite, biomass and gas power plants can be optimised for flexibility and there is scope for further improvements. Universities and institutes around Europe are very experienced in the area of thermal power plants and CCS, notably in Germany, UK, France, Spain, Norway, Greece, Denmark, Italy and Poland. Technological leadership can lead to business opportunities, both inside the EU and in the rest of the world. Such business, both ongoing and new, perfectly complements the ongoing efforts of the EU and the national governments to bring a
2 EPPSA case study

THERMAL POWER IN 2030 - Added Value For EU Energy Policy 5
halt to de-industrialisation, it creates employment in the form of high level, well-paid jobs and generates tax revenues. Next to technological leadership, however, a stable and predictable home market is a pre-requisite for sustainable business, which, as described above, is missing at the moment.
• Policy. EU and MS policy makers must address the dichotomy between, on the one hand, the continuing importance of Thermal Power in 2030 and beyond and, on the other, the lack of economic viability under current policies. Policy makers should accordingly assess the impact of new policies on electricity markets, affordability, investment, business opportunities and RD&D (Research, Development and Demonstration), including flexible power plants and CCS. Adequate funding, a stable regulatory framework and public acceptance need to be combined with enhanced Research and Innovation efforts in order to maintain Europe’s leading technological competence in the current and future knowledge-based economy. European centres of Research and Development (R&D) excellence will contribute to creating skills and jobs and exporting efficient, cutting-edge European technology, including to the countries in the Asia-Pacific Region which are estimated to need 275 GW of new coal powered plants in the next five years alone. If the BAT was provided for these future plants, there would be a clear environmental benefit and an attractive market for European companies.

EPPSA STUDY6
THERMAL POWER IN 2030 - Added Value For EU Energy Policy 7
1. EU Energy Policy: Past, Present and Future
• 1990s: energy market liberalisation via the first ‘Energy Package’, consisting of Directive 96/92/EC (Electricity) and Directive 98/30/EC (Gas), introducing unbundling
• 2000s: further liberalisation via the second ‘Energy Package’, consisting of Directive 2003/54/EC (Electricity) and Directive 2003/55/EC (Gas), establishing of MS-level regulatory authorities; strengthening of environmental legislation, via Directive 2001/80/EC (LCP Directive); increasing concern over climate change leading to the establishment of the EU ETS via Directive 2003/87/EC
1.2.2. Towards a Common EU Energy Policy: 2006-2009
A common EU energy policy and the aims thereof were first explicitly formulated in the Commission’s 2006 Green Paper on “A European Strategy for Sustainable, Competitive and Secure Energy” (COM(2006) 105 final). The stated objectives were sustainability, competitiveness, and security of supply.
This Green Paper was followed by the Climate & Energy Package (presented in COM(2007) 1 final, “An Energy Policy for Europe”) which re-affirmed the three objectives and outlined an action plan on achieving them. More specifically, the Climate & Energy Package defined three explicit targets to be achieved by 2020, these being the so-called ‘20-20-20 by 2020’ targets:
• A 20% reduction in GHG emissions EU-wide, relative to 1990 levels (binding)
• A 20% share of RES in EU energy consumption (binding)
• A 20% reduction in EU energy consumption (non-binding)
To ensure reaching these targets, the 2009 Climate & Energy legislative package was adopted, consisting of:
• Directive 2009/28/EC, the so-called ‘RES Directive’, which sets out MS-specific targets, differentiated by national capabilities and potentials, in order to reach the overall RES share; to this end, they are to submit National Renewable Energy Action Plans (NREAPs) on how they aim to achieve their respective shares; the Directive also provides for the possibility of using support measures to promote RES deployment, and prescribes priority feed-in for RES
1.1. Introduction
Affordable and secure energy provides the basis for the functioning of modern society.
Within the EU, however, energy competences for energy policies are shared between EU-level action and the exclusive rights of Member States (MS) to select their own national energy mix, endangering both the security and affordability of our energy.
Since 2006, attempts have been made to establish a common EU energy policy; these culminated in 2009 in the adoption of a number of directives and the ‘20-20-20 by 2020’ targets and recently, in 2014, with the agreement of a policy framework for climate and energy in the period from 2020 to 2030.
In the following chapter, a brief overview of legislative developments affecting energy is given (1.2.1). Following this, there is an overview of the objectives of EU energy policy since its formulation in 2006 and the significant legislative activity in 2009 which, to a large extent, defines the current trajectory of energy policy and the EU energy system towards 2020 (1.2.2).
Despite the above attempts at formulating a common EU energy policy and short-term as well as long-term goals, however, the present situation is one marked with uncertainty as discussed in sections 1.2-1.4.
1.2. Progress towards a Common EU Energy Policy
1.2.1. European Integration and Energy Legislation: 1951 to 2006
EU energy policy has been important since the beginning of the European integration (i.e. the founding of the European Coal and Steel Community and Euratom):
• 1970s: security of supply (e.g. ‘Council Resolution of 17 September 1974 concerning a new energy policy strategy for the Community’ and ‘Council Resolution of 17 December 1974 concerning energy policy objectives for 1985’, dealing with reduction of import dependence)
• 1980s: environment (e.g. ‘Directive 88/609/EEC on the limitation of emissions of certain pollutants into the air from large combustion plants’)

EPPSA STUDY8
• Directive 2009/29/EC, amending the EU ETS
• Directive 2009/31/EC, on the geological storage of CO2 (CCS)
Additionally, in 2009, the Third Energy Package was adopted, which consisted of Directive 2009/72/EC (Electricity) and Directive 2009/73/EC (Gas), which was mainly focussed on unbundling and which accompanied regulations establishing ACER, ENTSO-E and ENTSO-G. The tasks of ENTSO-E and ACER are crucial with regard to electricity, as they are aimed at integrating EU markets into one internal energy market, via market coupling, network code development, and transmission and cross-border exchange infrastructure development via the Ten Year Network Development Plan (TYNDP).
Other important developments in 2009 included the Council’s aim to reduce GHG emissions by 80-95% in 2050, relative to 1990 levels, as well as the entry into force of the Lisbon Treaty. The Lisbon Treaty clarifies the position of energy as a shared competence between the EU and the MS (TFEU, Part I, art. 4 (i)). Furthermore, it introduces specific energy provisions under Title XXI – Energy, where it specifies four main aims for EU policy in energy (TFEU, art. 194 (1)):
1. ensuring the functioning of the energy market
2. ensuring security of energy supply
3. promoting energy efficiency, energy saving, and the development of new and renewable forms of energy
4. promoting the interconnection of energy networks
With regard to environmental legislation, 2010 saw the adoption of the Industrial Emissions Directive (IED) (Directive 2010/75/EU) which regulates emissions from industrial activities via more stringent Emission Limit Values (ELVs), entering into force in 2014 (2016 for large combustion plants). The IED combines several previous sectorial directives, and makes permitting subject to application of BATs based on so-called BAT Reference Documents (BREFs).
Finally, in 2012, legislation to support reaching the current energy efficiency target was adopted through the Energy Efficiency Directive (Directive 2012/72/EU).
1.3. The Present State of EU Energy Policy and the EU Energy System
As a result of the binding targets for 2020 and the MS’ policies to work towards these targets, there have been significant changes in the electricity generation, some of which are turning out to be in conflict with the high level objectives:
• Integration: ACER and ENTSO-E are developing Network Codes to ensure a minimum level of harmonisation among MS and regional electricity networks, helping the process of integration towards the 2014 deadline for completion of the Internal Energy Market;
• Fragmentation: The design of RES support schemes differs across MS, and due to concern over generation adequacy, several MS are considering or have already implemented capacity mechanisms, again different across MS3;
• Overall Change: The electricity generation mix in the EU-27 has in recent years seen a steady increase in renewable energy and decrease in fossil-fuel fired generation, as can be seen in Table 1 below:
EU-27 Generation Mix4 (%) 2010 2011 2012
Fossil-fuel fired 50.40 51.22 48.38
RES 19.58 21.19 22.38
Nuclear 27.20 28.20 27.01
Pumped hydro and other 3.31 1.38 3.27
Table 1 - EU-27 Generation Mix, 2010-2012 4
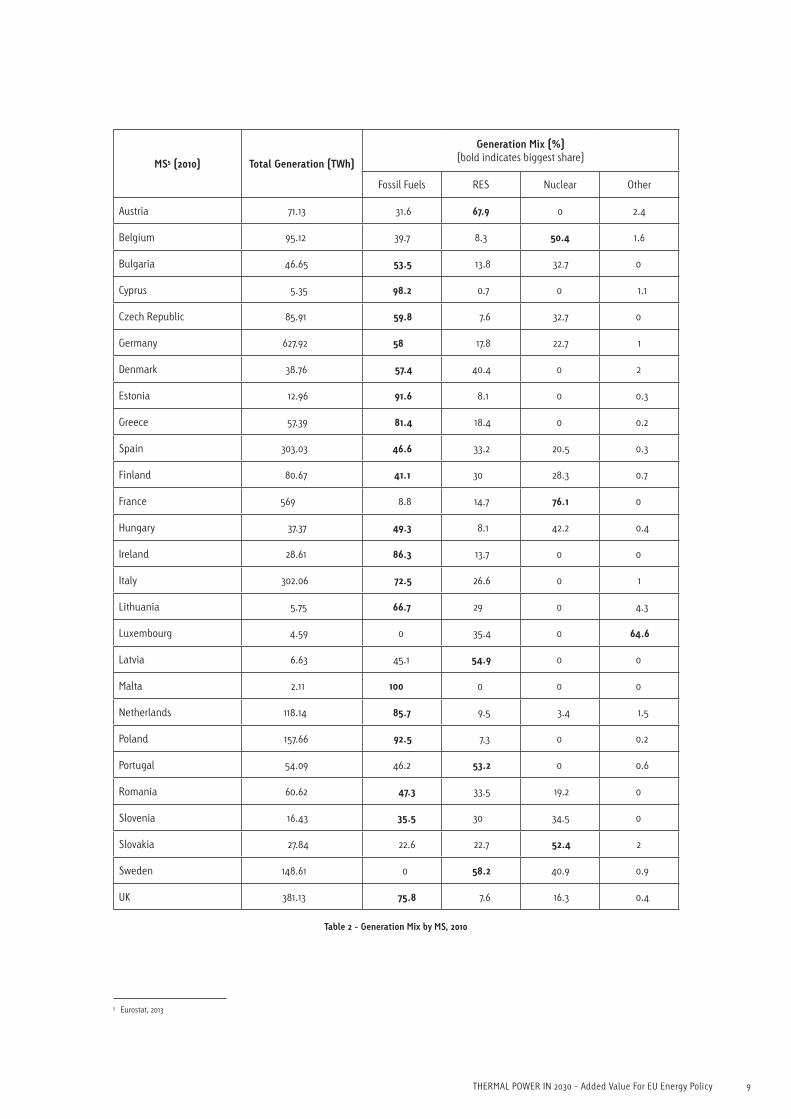
• Diversity: There is considerable diversity in the generation mixes of MS, as can be seen in Table 2 below.
3 For a detailed overview, see DG ENER (2013b), “Capacity Mechanisms in Individual Markets within the IEM”
4 Eurelectric (2013), “Power Statistics and Trends 2013”; p. 12
THERMAL POWER IN 2030 - Added Value For EU Energy Policy 9
MS5 (2010) Total Generation (TWh)
Generation Mix (%) (bold indicates biggest share)
Fossil Fuels RES Nuclear Other
Austria 71.13 31.6 67.9 0 2.4
Belgium 95.12 39.7 8.3 50.4 1.6
Bulgaria 46.65 53.5 13.8 32.7 0
Cyprus 5.35 98.2 0.7 0 1.1
Czech Republic 85.91 59.8 7.6 32.7 0
Germany 627.92 58 17.8 22.7 1
Denmark 38.76 57.4 40.4 0 2
Estonia 12.96 91.6 8.1 0 0.3
Greece 57.39 81.4 18.4 0 0.2
Spain 303.03 46.6 33.2 20.5 0.3
Finland 80.67 41.1 30 28.3 0.7
France 569 8.8 14.7 76.1 0
Hungary 37.37 49.3 8.1 42.2 0.4
Ireland 28.61 86.3 13.7 0 0
Italy 302.06 72.5 26.6 0 1
Lithuania 5.75 66.7 29 0 4.3
Luxembourg 4.59 0 35.4 0 64.6
Latvia 6.63 45.1 54.9 0 0
Malta 2.11 100 0 0 0
Netherlands 118.14 85.7 9.5 3.4 1.5
Poland 157.66 92.5 7.3 0 0.2
Portugal 54.09 46.2 53.2 0 0.6
Romania 60.62 47.3 33.5 19.2 0
Slovenia 16.43 35.5 30 34.5 0
Slovakia 27.84 22.6 22.7 52.4 2
Sweden 148.61 0 58.2 40.9 0.9
UK 381.13 75.8 7.6 16.3 0.4
Table 2 - Generation Mix by MS, 2010
5
5 Eurostat, 2013

EPPSA STUDY10
Figure 1 - Changing Electricity Prices, 2000-2014
enjoy priority feed-in, i.e. if and when they produce, their electricity must be sold on the market. As their variable costs are practically inexistent and their fixed costs are remunerated through support schemes (outside wholesale markets), RES exert downward pressure on wholesale prices and thereby change the merit order, displacing other generation technologies with a higher variable cost. In some cases, notably in Germany and the UK, this has led to new high capital value plants (e.g. highly efficient Combined Cycle Gas Turbine (CCGT)), being mothballed, such that increasing renewables often result in a production mix of (often) fluctuating RES with zero emissions and older, inefficient plants with higher emissions. At the same time, while wholesale prices decrease, retail prices for both households and industry increase.
Overall, the situation is as summarised by Eurelectric9:
• Affordability is undermined as energy bills have, in the past 4 years, risen by 17% for domestic and 24% for industrial consumers
• Security of supply is undermined by the mothballing of 51 GW of capacity
• Sustainability is undermined as CO2 emissions have increased by 2.4% in 2011-2012
9 Eurelectric (2013), “10 CEOs Push for EU Energy Policy to Change Direction”
While wholesale prices decrease, retail prices increase ...2010 = 100Index
Source: Statistisches Bundesamt, GermanyPress release 9. October 2014
Jan 00 Jan 01 Jan 02 Jan 03 Jan 04 Jan 05 Jan 06 Jan 07 Jan 08 Jan 09 Jan 10 Jan 11 Jan 12 Jan 13 Jan 14
• Decreasing Wholesale Prices: Increasing integration of variable renewable energy – with zero variable costs – shifts the merit order and exerts downward pressure on wholesale prices (EEX, red line) (see Figure 1 above), undermining the case for investment at a time when much of the EU’s generation fleet needs replacing6;
• Increasing Retail Prices: Renewables support schemes are generally funded through surcharges on the retail price, which means that the end-use electricity prices are increasing (see Figure 1 above), undermining competitiveness and putting a financial burden on domestic and industrial consumers7.
It is clear that while the aim of the Climate & Energy Package was to support the achievement of EU energy policy objectives, the combination of multiple targets (GHG, RES and Energy Efficiency (EE)) at multiple levels (both EU and MS) with multiple implementing tools (ETS, support schemes) has led to a situation where the three objectives are paradoxically being undermined.8
In particular, the effect of renewables support schemes, while successful in increasing the deployment of RES, has had several negative effects on energy markets and energy prices. RES are financially compensated through support schemes, such as feed-in tariffs, and
6 Kakaras et al. (2013), “Solutions from the European Power Plant Suppliers’ Perspective”; pp. 7-9
7 EPPSA (2013), “Energy Supply for Europe – Facts and Perspectives”, p. 98 Kakaras et al. (2013), “Solutions from the European Power Plant Suppliers’
Perspective”; pp. 7-9

THERMAL POWER IN 2030 - Added Value For EU Energy Policy 11
1.4. Future Paths for Energy Policy: Scenarios for 2030 and 2050
1.4.1. Need for a medium term framework
Following the European Council’s 2009 commitment to an EU-wide 80-95% reduction in GHG emissions by 2050 relative to 1990 levels, a number of studies by various stakeholders were published, with the aim of exploring if and how such a target might be achieved. To this end, the European Commission published its own “Energy Roadmap 2050” in 2011, exploring a total of five decarbonisation scenarios with different technology assumptions. Each scenario involves an increasing deployment of RES and a substantial transformation of the energy system (see 2.4).
However, while short-term targets for 2020 (i.e. 20-20-20) and long-term aims for 2050 (80-95% GHG emission reductions) had been defined, the medium term was still unclear. Thus, in March 2013, the European Commission published a Green Paper on “A 2030 Framework for Climate and Energy Policies”, opening the debate on possible targets for 2030. A key point was that a clear and stable framework for the 2020-2030 period must be developed as soon as possible, as it is crucial for providing a basis for much-needed investment stability.
1.4.2. Policy framework for climate and energy in the period from 2020 to 2030
On the 22nd January 2014, the European Commission published its Communication entitled ‘A policy framework for climate and energy in the period from 2020 to 2030’10 .The Framework, accepted by the European Council at its meetings on the 23rd and 24th October 201411 has the following main conclusions:
• Reducing gHg emissions by 40%.
A centre piece of the framework is the target to reduce EU domestic GHG emissions. The European Council endorsed a binding EU target of a domestic reduction in GHG emissions at least 40% by 2030 compared to 1990. This target will be achieved collectively by the EU in the most cost-effective manner possible, with the reductions in the ETS and non-ETS sectors amounting to 43% and 30% by 2030 compared to 2005, respectively; all MS will participate in this effort, balancing considerations of fairness and solidarity.
10 European Commission (2014) COM15 final Brussels, 22.1.2014 Communication ‘A policy framework for climate and energy in the period from 2020 to 2030’
11 European Council (23 and 24 October 2014) Conclusions http://www.consilium.europa.eu/uedocs/cms_data/docs/pressdata/en/ec/145397.pdf
This target should ensure that the EU is on the cost-effective track towards meeting its objective of cutting emissions by at least 80% by 2050. By setting its level of climate ambition for 2030, the EU will also be able to engage actively in the negotiations on a new international climate agreement that should take effect in 2020.
• Increasing the share of renewable energy to at least 27%.
An EU target of at least 27% is set for the share of renewable energy consumed in the EU in 2030. This target will be binding at EU level. It will be fulfilled through MS contributions and guided by the need to collectively deliver the EU target without preventing MS from setting their own more ambitious national targets and supporting them in line with the state aid guidelines, as well as taking into account their degree of integration in the internal energy market. The integration of rising levels of i-RES requires a more interconnected internal energy market and appropriate back up, which should be coordinated as necessary at the regional level.
This gives MS the flexibility to transform their energy systems in ways that are adapted to their national preferences and circumstances.
• Energyefficiencytobeimprovedbyatleast27%.
Improved energy efficiency makes an essential contribution to all EU climate and energy policies. Progress towards the 2020 target of improving energy efficiency by 20% is being delivered by policy measures at the EU and national levels. At the EU level, an indicative target of at least 27% for improving energy efficiency in 2030 compared to projections of future energy consumption based on the current criteria has been set. It will be delivered in a cost-effective manner and it will fully respect the effectiveness of the ETS-system in contributing to the overall climate goals. This will be reviewed by 2020, keeping an EU level of 30% in mind. The Commission will propose priority sectors in which significant energy-efficiency gains can be reaped, and ways to address them at EU level, with the EU and the MS focusing their regulatory and financial efforts on these sectors.

EPPSA STUDY12
• Reform of the Eu emissions trading system.
The annual factor to reduce the cap on the maximum permitted emissions will be changed from 1.74% to 2.2% from 2021 onwards. The existing NER300 facility will be renewed, including for CCS and renewables, with the scope extended to low carbon innovation in industrial sectors and with the initial endowment increased to 400 million allowances (NER400).
1.4.3. Policies for energy security
The G7 Energy Ministers (Canada, France, Germany, Italy, Japan, the United Kingdom and the United States) and the EU Commissioner for Energy met in Rome on the 5th and 6th of May 2014 to discuss ways to strengthen the collective energy security.12
The conclusions are highly relevant to Thermal Power:
”In the long term, it is vital to ensure diversification of the energy mix. Recognizing that fossil fuels still remain an important element of our energy mix, we believe that reducing emissions from fossil fuels is necessary to tackle climate change and can enhance our energy security. We intend to promote the use of low carbon technologies (renewable energies, nuclear in the countries which opt to use it, and CCS) including those which work as a base load energy source.”
It is therefore disappointing that the EU Council conclusions (Section 1.4.2 above) do not recognise the importance of state-of-the-art Thermal Power as an active contributor to the 2030/2050 objectives.
12 http://europa.eu/rapid/press-release_IP-14-530_en.htm

THERMAL POWER IN 2030 - Added Value For EU Energy Policy 13
2. The EU Energy System and the changing role of Thermal Power
2.2. Power System Operation
2.2.1. The Classical System – Variable Demand, Dispatchable Supply
A defining feature of power systems is that supply and demand must match at all times (within quite tight limits) in order to guarantee system stability. What follows is a simplified description of power system operation in the ‘classical’ sense, i.e. where demand is variable and supply can be controlled (‘dispatchable’).
Electricity is different from other supplies in that it cannot be easily stored. The technologies available for storage are either limited in capacity or bring significant added cost.
Demand varies from one moment to another, from hour to hour and day to day, as well as from season to season. However, it mostly follows predictable patterns. For example, changes in the demand pattern over one day generally exhibit the following characteristics: demand is relatively low during the night and higher during the day, with two distinct peaks, one before mid-day and one in the evening. To meet this demand, a system operator utilises different plants, in an order of merit (the ‘merit order’) depending on their operational performance and cost characteristics. Generally, plants with high capital but low variable costs operate at constant output when demand (and therefore price) is low (i.e. at night), while plants with low capital costs and high variable costs are operated flexibly and are mainly utilised when demand (and therefore price) is high. Plants with intermediate capital and variable costs operate in a load-following mode, i.e. they adjust to smaller changes in demand. These plants are respectively classified as baseload, peak-load, and mid-merit (or load-following) plants.
2.1. Introduction
In 2012, after having provided the majority of the EU’s electricity supply for decades, thermal power, for the first time in EU history, generated less than half (if only slightly)13 of it. At the same time, the share of RES, and in particular i-RES such as wind and solar photovoltaics (PV), has been rapidly increasing. This has substantial effects on the way power systems are operated. We examine in this section the effects that the increasing deployment of RES has on the power system and what the future role of Thermal Power will be in light of; (1) the 80-95% GHG emission reductions by 2050 aim and (2) the agreed (2014) 40% reduction in GHG emissions targets and (3) increasing the share of renewable energy to at least 27% of the EU’s energy consumption by 2030. This is done both qualitatively as well as quantitatively through a comparison of scenarios for the EU power sector in 2030.
Firstly, the operation of power systems in the ‘classical’ sense – with demand as the main source of variation - is described in a simplified manner (2.2.1), and the role of Thermal Power in such a system is examined (2.2.2). Secondly, the changes occurring to power system operations as a result of increasing deployment of i-RES are described (2.3.1) and the new requirements that this places on thermal power plants are examined (2.3.2). Thirdly, the flexibility characteristics of thermal power plants are reviewed (2.4.1), taking into consideration the results (2.4.2) of EPPSA surveys that set out the members’ views on BAT and give exemplars (2.4.3) of flexible plants in operation. Fourthly, selected scenarios for the EU power sector in 2030 are examined (2.4). Finally, conclusions regarding the role and importance of Thermal Power in a 2030 perspective are made (2.5).
13 Eurelectric (2013), “Power Statistics and Trends 2013”; p. 12
EPPSA STUDY14
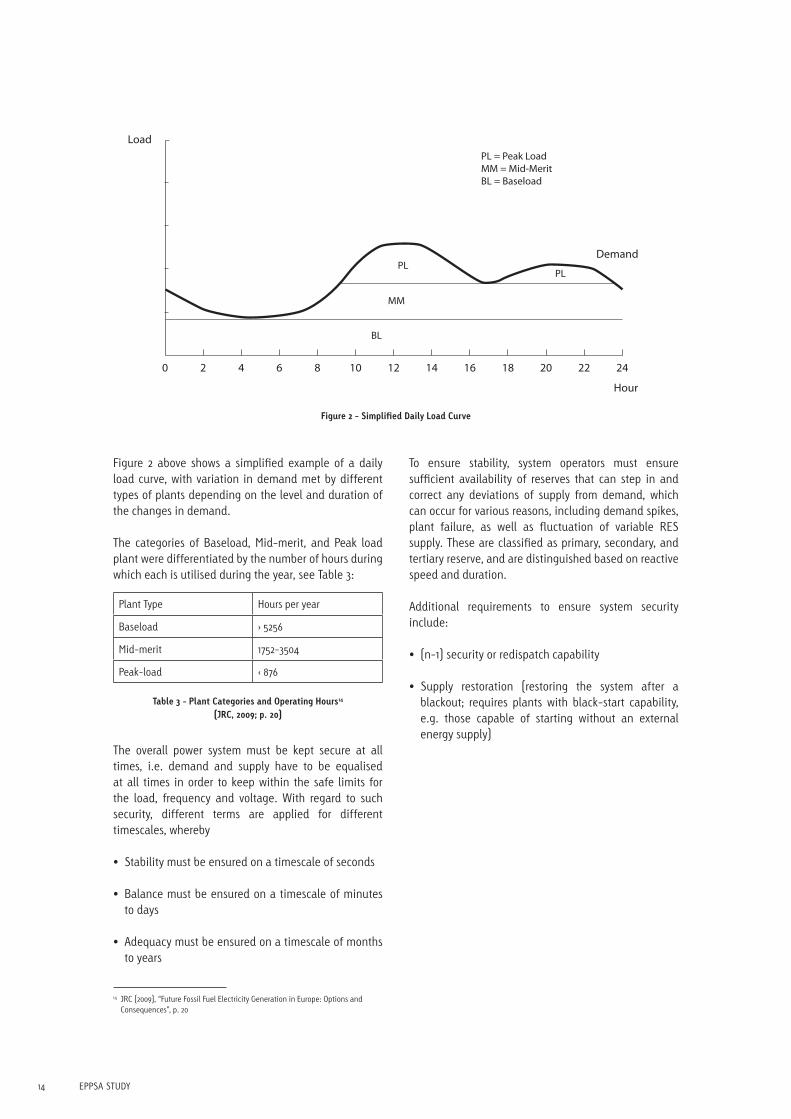
Figure 2 above shows a simplified example of a daily load curve, with variation in demand met by different types of plants depending on the level and duration of the changes in demand.
The categories of Baseload, Mid-merit, and Peak load plant were differentiated by the number of hours during which each is utilised during the year, see Table 3:
Plant Type Hours per year
Baseload > 5256
Mid-merit 1752-3504
Peak-load < 876
Table 3 - Plant Categories and Operating Hours14 (JRC, 2009; p. 20)
The overall power system must be kept secure at all times, i.e. demand and supply have to be equalised at all times in order to keep within the safe limits for the load, frequency and voltage. With regard to such security, different terms are applied for different timescales, whereby
• Stability must be ensured on a timescale of seconds
• Balance must be ensured on a timescale of minutes to days
• Adequacy must be ensured on a timescale of months to years
14 JRC (2009), “Future Fossil Fuel Electricity Generation in Europe: Options and Consequences”, p. 20
To ensure stability, system operators must ensure sufficient availability of reserves that can step in and correct any deviations of supply from demand, which can occur for various reasons, including demand spikes, plant failure, as well as fluctuation of variable RES supply. These are classified as primary, secondary, and tertiary reserve, and are distinguished based on reactive speed and duration.
Additional requirements to ensure system security include:
• (n-1) security or redispatch capability
• Supply restoration (restoring the system after a blackout; requires plants with black-start capability, e.g. those capable of starting without an external energy supply)
Figure 2 - Simplified Daily Load Curve
0 2 4 6 8 10 12 14 16 18 20 22 24
Hour
LoadPL = Peak LoadMM = Mid-MeritBL = Baseload
DemandPL
PL
MM
BL

THERMAL POWER IN 2030 - Added Value For EU Energy Policy 15
2.2.2. The Role of Thermal Power in a “classical” power system
Within a ‘classical’ power system as described above, a number of power plant types are utilised, all of which are dispatchable. The main plant types are hydropower, nuclear, and thermal power, each of which has contributed a major share of the electricity generation in Europe.
The mixture varies from country to country and has changed due to technological and economic developments through time. The Joint Research Centre of the European Commission summarised their view of the broad European picture as shown in Table 4 below.
Thermal Power is able to provide all of the system services elaborated in 2.2.1. and different types of thermal power plants have fulfilled the roles of baseload, mid-merit and peak-load in the past.
Overall efficiency improvements of both coal-fired and gas combined cycle power plant have brought a reduction of all pollutant emissions per kWh of electricity produced. The efficiency of the newest coal-fired plant now exceeds 46% compared to 30-34% before 1990 and CCGTs have improved from about 50% to approaching 60%.
Other technological advances, such as combustion systems optimisation and operation (e.g. staged combustion and low Nox burners) as well as end-of-pipe pollution control equipment (e.g. de-NOx systems, flue gas desulphurisation, and particulate control systems such as fabric filters or Electrostatic Precipitators (ESP)) have resulted in very significant reductions of emissions of specific pollutants. Table 5 below gives an overview of the main pollutants associated with thermal power plants and the respective technological developments that have resulted in emissions reductions.
Type Until early 1990s Late 1990s Early 2000s
Baseload Coal-fired CCGT Coal-fired
Mid-merit Oil Coal-fired CCGT, Coal-fired
Peak-load Oil and diesel engines Gas Open Cycle Gas Turbine (OCGT) OCGT
Table 4 - Plant types fulfilling different roles15
Pollutant Technological Solution
NOx
Low NOx burners, Selective Catalytic Reduction (SCR), Selective Non-Catalytic Reduction (SNCR), in-furnace optimisation
SOx Flue gas desulphurisation (wet, dry, semi-dry)
Dust Fabric filters, electrostatic precipitators
Heavy metals (Hg, etc.) Activated carbon filtration and others
Table 5 - Pollution Control
15 Ibid.

EPPSA STUDY16
Figure 3 - Reduction of Emissions of NOx, SOx and Dust 1990 to 2012
0
20
40
60
80
100
120
1990
1992
1994
1996
1998
2000
2002
2004
2006
2008
2010
Emis
sion
s (1
990=
100%
)
Year
NOx
SOx
Dust
2.3. Power System Operation with Increasing Intermittent Generation
2.3.1 The Changing System: Variable Demand, Increasingly Variable Generation
Electricity generation from RES has been increasing rapidly as a result of the Climate & Energy Package, the binding 20% share of RES in EU energy consumption target in 2020 and the corresponding NREAPs of MS. Additionally, with the objective of 80-95% decarbonisation by 2050, this share is expected to increase even further with time (see 2.4). Most of this increase is coming about by the deployment of wind and solar, both of which are i-RES.
Integration of i-RES has introduced additional variation into the system. Alongside fluctuating demand, there is an increasing amount of fluctuating supply. Furthermore, this fluctuating supply has priority feed-in. Overall, this results in increasing variability of supply, and consequently, the need for system services to ensure an equilibrium between supply and demand at all times, i.e. reserve, balancing, and back-up power, increases.
Progressively tighter ELVs16have been introduced through EU Directives and compliance with these has brought total emissions of NOx, SOx and Dust down as shown in Figure 3.
However, it must be noted that the above developments have aimed to optimise efficiency, costs, and emissions when operating as close to full load as possible, given the requirements of the ‘classical’ power system. The increasing deployment of RES, and in particular of such i-RES as wind and solar, however, is changing the way power systems operate and therefore the requirements of thermal power plants. This is discussed below.
16 Note that ELVs are set based on BAT, which reflects not only technical possibilities but also economic availability; thus, from a purely technical point of view, even lower emissions are attainable.

THERMAL POWER IN 2030 - Added Value For EU Energy Policy 17
An illustration of the situation in a system with high levels of i-RES penetration can be seen in the daily load curve illustrated in Figure 4 above. The fluctuating yet must-run17 generation by i-RES takes over the function of ‘baseload’, while the remaining load (net load minus intermittent generation) is the so-called ‘residual load’. In such a system, thermal power plants cover the (positive) residual loads via flexible operation as well as control reserves and balancing18. Classical ‘base-load’ thermal power plants are not used in such situations, but must remain available in case of insufficient generation from i-RES. At the same time, situations are possible
17 The purchase of all the electricity that is generated is guaranteed by renewable support schemes
18 VDE (2012), “Erneuerbare Energie braucht flexible Kraftwerke – Szenarien bis 2020”, p. 54
where the residual load is negative, i.e. the generation from i-RES is higher than demand. In this case, the excess generation must either be curtailed or may be stored, if sufficient storage is available19.A real example from Germany, showing the load variation over a week and the impact of intermittent solar and wind is shown in Figure 5. During this week, solar generation varied from 0 to 14 GW and wind from 3 to 20 GW. The maximum renewable generation was 28 GW and the minimum 3 GW, compared to total generation which varied from 57 to 82 GW. To compensate for variations in demand and renewable output, Thermal Power varied from 15 to 44 GW.
19 Although it might also be possible to use some excess power to keep thermal power plants warm to reduce start-up duration and make it easier to meet (inevitable) increases in residual load.
0 2 4 6 8 10 12 14 16 18 20 22 24
Hour
Load
Residual Load (+)i-RES as ‘baseload’
Residual Load (-)= excess i-RES generation
Residual Load (+)
Demand
Figure 4 - Daily Load Curve with High Intermittent Generation –schematic
10.02. 11. 02. 12.02. 13.02. 14.02. 15. 02. 16.02.
Power production: 10. to 16. February 2014
60
GW
50
40
30
20
10
Legend:
NuclearLigniteCoalGas
RO-Water
PHSWindSolar
Biomass
Mo Tu We Th Fr Sa So
70
Figure 5 - Weekly Load Curve with high intermittent generation

EPPSA STUDY18
Overall, a system with increasing fluctuation in supply as well as changing demand has correspondingly increasing balancing requirements. Enough dispatchable capacity must be available to meet demand at times with little or no generation from intermittent generation, and this capacity must be able to provide this service at varying speeds (e.g. rapid load changes to balance high residual load gradients) and for varying durations, including extremes of several weeks with low wind which can extend right across Europe, as in the example shown in Figure 6)20,21.
Figure 6 - Low wind across the whole of Europe
The example was in summer but similar low wind conditions can occur across wide areas on the coldest, stillest days of winter. For example in Great Britain on 7th December 2010. Figure 7 shows the generation used to meet peak demand that day. The GB demand was met, but only just. The wind generation produced only 5% of its nameplate capacity.
Figure 7 - Electricity generation in Great Britain on a still winter day (7/12/2010)
20 BET (2013), “Möglichkeiten zum Ausgleich fluktuierender Einspeisungen aus Erneuerbaren Energien”
21 UK Met Office Fri 25th July.
2.3.2 The Role of Thermal Power in a power system with a large share of intermittent generation
The behaviour of thermal power plants in a system with high shares of i-RES generation varies depending on whether the residual load is increasing or decreasing:
• Decreasing Residual Load: Thermal power plants can reduce their output - or even shut down - quickly in order to balance excess feed-in from i-RES. This presupposes that sufficient thermal power plants are active at sufficiently high levels, otherwise RES curtailment is necessary
• Increasing Residual Load: Thermal power plants can ramp up to meet increasing residual load when generation from i-RES decreases; the exact contribution possible depends on how many plants are active and how many are available as reserve.
As increasing shares of must-run generation from i-RES takes over the function of ‘baseload’ and the remaining residual load fluctuates more and more, thermal power plants will increasingly be required to provide flexible back-up and balancing. Additionally, thermal power plants will still be required for other system services, such as supply restoration and frequency control.
The magnitude of fluctuations in RES output and the consequential effect on the flexibility requirements of thermal plants, is very dependent on the amount of intermittent renewables deployed, whether wind, PV or both, and on the degree of interconnection of the electricity system (e.g. an island system like the UK or Ireland with limited interconnection vs a system like Germany with a large amount of interconnection with adjacent systems). While the characteristics of wind and solar complement one another over a yearly period, this does not hold true for hourly load gradients, and little correlation exists between solar and wind gradients22.
As an illustration, with the anticipated wind and PV capacities (42GW onshore wind, 16GW offshore wind and 60GW of PV), VDE suggests a planning value of expected load gradients of 15GW/h (for 1 h duration) and 10GW/h (for 3hr duration) for Germany in 2020.
These overall load gradients must be met by “ramping-up” plants which are already operating at part-load. This can either be done by small numbers of plants with relatively fast (3%/min) ramping rates or a larger number of plants with slower ramping rates.
22 VDE (2012), “Erneuerbare Energie braucht flexible Kraftwerke – Szenarien bis 2020”, pp. 55-56
0
10
20
30
40
50
60
70
80
Gas Coal Nuclear Oil Pumpedstorage
Hydro Wind
pere
cent
of f
ull c
apac
ity

THERMAL POWER IN 2030 - Added Value For EU Energy Policy 19
Figure 8 below illustrates this, showing the total (GW) power plant load capacity which is needed for balancing for three different possible ramp rates (1, 2 and 3% /min) and for three different total balancing requirements ( 5 GW in 1hour, 10 GW in 1 hour and 15 GW in 1 hour). This shows that the lower the ramping rate of the plants available, the higher the balancing capacity that must be utilised. For example, a load gradient of 10 GW/h can be met by approximately 5 GW of plants which have ramping rates of 3%/min; the same gradient can also be met by plants with lower ramping rates (e.g. 1%/min), but more than 15 GW of capacity thereof is required for the same balancing effect.
The total installed capacity of plants used for ramping depends on the minimum operating load of the plant; for plants whose minimum operating load is 50%, 30 GW of plants will be required to provide 15 GW of balancing capacity.
In such a system, thermal power plants will need to meet the following flexibility requirements23:
• The capability to meet higher load gradients with only a small effect on plant lifetime, which in the future may be determined by fatigue due to load cycling rather than by total operating hours;
23 Ibid., p. 57
• Lower minimum loads in order to be able to remain active and be able to quickly step in to balance fluctuating i-RES;
• Higher efficiencies at part-load;
• Environmental performance at part-load and during flexible operation will have to be optimised.
2.4 Flexibility characteristics of thermal power plants
2.4.1 Flexibility characteristics of thermal power plants- VDE review
The current flexibility characteristics of thermal power plants vary according to plant type and configuration, see Table 6, published by VDE where the abbreviation PN means nominal load which is the maximum continuous rating (MCR). For categories with three figures, the first reflects current fleet average (in Germany), the second reflects current state-of-the-art, while the third reflects expected technological developments.
0
5
10
15
20
25
30
3%/min 2%/min 1%/min
Power Plant ramping Rates (% of Nominal Capacity)
Pow
er P
lant
Loa
d Re
quire
d fo
r Bal
anci
ng
5 GW/H
10 GW/H
15 GW/H
Figure 8 - Effect of Ramping Rates on Required Balancing Load (VDE, 2012; p.59)

EPPSA STUDY20
Table 6 - Flexibility Characteristics24
Power Plant Type Hard coal Lignite CCGT OCGT
Ramp rate %PN/min 1,5 / 4 / 6 1 / 2,5 / 4 2 / 4 / 8 8 / 12 / 15
In range of %PN 40 - 90 50 - 90 40*) - 90 40*) - 90
Minimum load %PN 40 / 25 / 20 60 / 50 / 40 50 / 40 / 30 50 / 40 / 20
Start-up time
Hot (< 8h) h 3 / 2,5 / 2 6 / 4 / 2 1,5 / 1 / 0,5 < 0,1
Cold (> 48h)h
10 / 5 / 4 10 / 8 / 6 4 / 3 / 2 < 0,1
Type Pulverised Fuel CCGTCirculating Fluid
Bed (CFB)
Hard CoalCoal/
Biomass cofiring
Hard Coal – Indirect
FiringLignite
Lignite – Pre-dried
LigniteGas
Coal, Lignite,
and PeatBiomass
Min. Load (% MCR)
< 20 -251 <30 < 10 < 40 < 20< 40 (CCGT) 2a
< 30 (GT alone)2a 30-40 30-40
Ramp Rate
4-53
(%MCR/min)
4 – 63
(%MCR/min)
4-6
(%MCR/min)
3-4
(%MCR/min)
4-6
(%MCR/min)
5-6 (%MCR/min)
Average2a,2b (CCGT).
9-11%/min of max GT output 2b
(CCGT with Benson HRSG)
7%/min Peak ramp 2c
(GT alone)
For OT units: 3-45
(%MCR/min)
For all other plant types: 45 (%MCR/min)
Hot start (min) (after <8hoff)
1406a
1206b
666c
140120 expected
140
75-806c
120 expected
25 (Benson OT, OT)
30-45 (Drum type)120
Warm-start (min)
after between 8 and 48hr off
3006a
2606b
Cold-start (min)
(after > 72hrs off)
4806a
3806b300-480 300-480 300-480 300-480
40 (Benson OT)
120-140 (Drum type)540-600
Efficiency4 at full load
46% 43.5% 58-60% 43.3%
24Table 7 - Flexibility Characteristics25: BAT based on supplier information
24 Ibid., p. 2425 EPPSA (2014)

THERMAL POWER IN 2030 - Added Value For EU Energy Policy 21
2.4.2 EPPSA survey on BAT for flexible power plants
EPPSA has carried out a survey among its members and collected data on the BAT for thermal power plants. This data is summarised above, in Table 7.
Notes on Table 7
1. Depends on coal quality
2a. References GT26 Alstom, 9FB-FE50 General Electric, SGT5-8000H Siemens
2b. Averaged value from 35% MCR stable load to 95% MCR stable load, as per the EU definition of the ‘ramping rate’.
2c. Peak ramping rate of GT alone, during a limited time for grid control.
3. Ramping rates can be increased to 7-8%/min (the limit determined by pressure part loading and fatigue) and minimum loads can be reduced by utilising a supplementary fuel i.e. gas or oil
4. Efficiency figures are Lower Heating Value (LHV) figures. Some EPPSA members are now confident of reaching 50% efficiency, over the load range 60-100% and with a ramp rate of 7-8% (using supplementary fuel) by full optimisation of design, including double reheat, use of variable speed drives, without needing to go to 700°C final steam temperature. Note however that efficiencies depend both on the technology and also on local site conditions (sea-water or air temperature, altitude, fuel moisture content…)
5. Potential figures for 2030: 5-6%
6a. Ultra-supercriticals (USCs) designed for base-load
6b. Future USC’s at the design stage
6c. Ignition (light-off) to Synchronisation
2.4.3 EPPSA exemplars of flexible power plants
In order to justify the claims made above, EPPSA members have provided details of exemplar plants covering a wide range of technologies, fuels, locations both in Europe and elsewhere. Details of these plants are listed below in Table 8.

EPPSA STUDY22
Name of Plant Fuel/Type Date Minimum Load (%) (** with back-up fuel)
Ramp rate (%MCR/min) (** with back-up fuel)
Start-up time – hot (<8h) (from light-off to full load)
Start-up time –cold (>48h) (from light-off to full load)
Suppliers (boiler/ST/GT)
Efficiency at full load (%)
Efficiency at mini-mum load (%)
Lagisza 460 Mwe
Bit. Coal CFB-OTU
Retrofit 2009 40 4%/min FW/x/x 43.30%
LundBiomass CFB-drum
New 2014
30 4%/min FW/x/x
KladnoLignite+ biomass CFB drum
2013 30 3.5%/min FW/x/x
Turow 275 Mwe
Lignite CFB-drum
Retrofits 2002-2004
40 4%/min FW/x/x 40.40%
Belchatow 858 Mwe
Lignite Supercritical
201145% (with coal fire)
between 2% – 6 % 140 min 360 min Alstom for all 41.00% No info
Neurath 1100 Mwe
Lignite USC
201245% (with coal fire)
between 2 % - 8 % min 380 min Alstom-Hitachi / Alstom >43.00% No info
Walsum and othersNew PC with USC Hard Coal
35% 4.6-6%/min from 50% to 103% 66 min 290 min Hitachi 46.00%
BoxbergNew PC with USC Lignite
35% 3.5-6% from 35 -105% 75-85 290 min -330min Hitachi 43.70%
Bexbach & Heilbronn 7 PC subcritical, Sulzer 20% Alstom
Torrevaldaliga Nord (Italy) PC with USC 35% 2%/min 140 300 Ansaldo Caldaie-BHK/MHI 43.70%
NJVCoal PC OT
25% (20%)** (35%) ***
5% from 35% -95% (7-8%)** BWE
AVV-2 Pulverised wood pellets OT
25% (20%)** (30%)***
4% from 30%-95% (7-8%)** BWE
AMV-1Pulverised wood and straw pellets OT
25% (20%)** (35%)***
4% from 35%-95% (6%)** BWE
FV-08 Grate Biomass Drum 30-40%
(30%)**3% from 40%-95% (4%)** BWE
Castle Peak B 660 Mwe 160 bar/540/540
Coal Subcrit PC 1989 20% MCR 4.5% MCR 120 min 480 min Doosan/GEC/- 39.40% 34
Eraring Upgrade 600 to 750 Mwe 160 bar/540/540
Coal Subcrit PC
Upgrade Oct 2010 –Aug 2012 across four units
20% MCR
3%MCR/min with capability of: 10% MCR/min @ Constant Pressure 5%/min@ Variable Pressure
90 mins 720 min
OEM Blr: IHI-FW ST: Toshiba Upgrade Blr+ST: Doosan
Upgrade 40.90% Upgrade 36.6%
Yeong heung 5 & 6 930 Mwe 260 bar/566/595
Coal Adv Supercritical PC
06.2014 (#5) 12.2014 (#6) 30% NR 3% TMCR/min
(30%TMCR ~ 100%TMCR) 190 min 510 min Doosan/ Hitachi/- 45.60% 39.4
Shinboryeong 1 & 2 1100 Mwe 260 bar/610/621
Coal USC PC
06.2016 (#1) 06.2017 (#2) 30% NR 3% TMCR/min
(50%TMCR ~ 100%TMCR) 190 min 550 min Doosan/ Doosan/- 46.60% 41.4
Turano (Italy)
Gas CCGT Drum HRSG
2010 30% 2.5% /min 55 min 140 min Ansaldo Caldaie/AEN 57.00%
EDF Bouchain GE “Flexi Efficiency50” 510MW
Gas CCGT 2015 Est 30% 10%/min
30MW/min 30 min for “hot rapid start” 183min ?/GE/GE 61.00%
Hamm Uentrop (Germany)
Gas CCGT Low mass flux Benson HRSG
2013 10%/min Ansaldo Caldaie/ Siemens
GE “Flex- efficiency Combined Cycle” power Plant 592Mwe
Gas CCGT 9HA.02
EDF 2016 40% 60 MW/min 30 min ?/GE/GE 61.00% 60% at 87% load
Siemens “FlexPlant” Irsching 570MWe
Gas CCGT SCC 8000H
Jul-11 ? ? 30 min ? ?/Siemens/Siemens 60.75% ?
Table 8 - Examples of modern plants (including retrofits)

THERMAL POWER IN 2030 - Added Value For EU Energy Policy 23
Name of Plant Fuel/Type Date Minimum Load (%) (** with back-up fuel)
Ramp rate (%MCR/min) (** with back-up fuel)
Start-up time – hot (<8h) (from light-off to full load)
Start-up time –cold (>48h) (from light-off to full load)
Suppliers (boiler/ST/GT)
Efficiency at full load (%)
Efficiency at mini-mum load (%)
Lagisza 460 Mwe
Bit. Coal CFB-OTU
Retrofit 2009 40 4%/min FW/x/x 43.30%
LundBiomass CFB-drum
New 2014
30 4%/min FW/x/x
KladnoLignite+ biomass CFB drum
2013 30 3.5%/min FW/x/x
Turow 275 Mwe
Lignite CFB-drum
Retrofits 2002-2004
40 4%/min FW/x/x 40.40%
Belchatow 858 Mwe
Lignite Supercritical
201145% (with coal fire)
between 2% – 6 % 140 min 360 min Alstom for all 41.00% No info
Neurath 1100 Mwe
Lignite USC
201245% (with coal fire)
between 2 % - 8 % min 380 min Alstom-Hitachi / Alstom >43.00% No info
Walsum and othersNew PC with USC Hard Coal
35% 4.6-6%/min from 50% to 103% 66 min 290 min Hitachi 46.00%
BoxbergNew PC with USC Lignite
35% 3.5-6% from 35 -105% 75-85 290 min -330min Hitachi 43.70%
Bexbach & Heilbronn 7 PC subcritical, Sulzer 20% Alstom
Torrevaldaliga Nord (Italy) PC with USC 35% 2%/min 140 300 Ansaldo Caldaie-BHK/MHI 43.70%
NJVCoal PC OT
25% (20%)** (35%) ***
5% from 35% -95% (7-8%)** BWE
AVV-2 Pulverised wood pellets OT
25% (20%)** (30%)***
4% from 30%-95% (7-8%)** BWE
AMV-1Pulverised wood and straw pellets OT
25% (20%)** (35%)***
4% from 35%-95% (6%)** BWE
FV-08 Grate Biomass Drum 30-40%
(30%)**3% from 40%-95% (4%)** BWE
Castle Peak B 660 Mwe 160 bar/540/540
Coal Subcrit PC 1989 20% MCR 4.5% MCR 120 min 480 min Doosan/GEC/- 39.40% 34
Eraring Upgrade 600 to 750 Mwe 160 bar/540/540
Coal Subcrit PC
Upgrade Oct 2010 –Aug 2012 across four units
20% MCR
3%MCR/min with capability of: 10% MCR/min @ Constant Pressure 5%/min@ Variable Pressure
90 mins 720 min
OEM Blr: IHI-FW ST: Toshiba Upgrade Blr+ST: Doosan
Upgrade 40.90% Upgrade 36.6%
Yeong heung 5 & 6 930 Mwe 260 bar/566/595
Coal Adv Supercritical PC
06.2014 (#5) 12.2014 (#6) 30% NR 3% TMCR/min
(30%TMCR ~ 100%TMCR) 190 min 510 min Doosan/ Hitachi/- 45.60% 39.4
Shinboryeong 1 & 2 1100 Mwe 260 bar/610/621
Coal USC PC
06.2016 (#1) 06.2017 (#2) 30% NR 3% TMCR/min
(50%TMCR ~ 100%TMCR) 190 min 550 min Doosan/ Doosan/- 46.60% 41.4
Turano (Italy)
Gas CCGT Drum HRSG
2010 30% 2.5% /min 55 min 140 min Ansaldo Caldaie/AEN 57.00%
EDF Bouchain GE “Flexi Efficiency50” 510MW
Gas CCGT 2015 Est 30% 10%/min
30MW/min 30 min for “hot rapid start” 183min ?/GE/GE 61.00%
Hamm Uentrop (Germany)
Gas CCGT Low mass flux Benson HRSG
2013 10%/min Ansaldo Caldaie/ Siemens
GE “Flex- efficiency Combined Cycle” power Plant 592Mwe
Gas CCGT 9HA.02
EDF 2016 40% 60 MW/min 30 min ?/GE/GE 61.00% 60% at 87% load
Siemens “FlexPlant” Irsching 570MWe
Gas CCGT SCC 8000H
Jul-11 ? ? 30 min ? ?/Siemens/Siemens 60.75% ?

EPPSA STUDY24
Figure 9 - Plant efficiency and specific fuel costs
There is limited information in Table 7 and Table 8 on efficiency at low/minimum load. However, the data available is consistent with the general understanding that the efficiency falls off as the load reduces, indicated in Figure 9 above. As the load is decreased (right to left on the lower scale) plant efficiency decreased significantly (see dark red curves and left-hand scale) and the cost of fuel used for each MWh generated increase (see light red curves and right-hand scale), pushing up the cost of electricity (the inset box shows in red the portion of the electricity cost which is due to fuel for coal and gas respectively).
CO2 emissions per MWh of electricity generated also increase as the load reduces below the optimum. As a result, the reduction in CO2 emissions due to the displacement of fossil fuel generation by i-RES is less than proportionate.
The EPPSA survey also considered emissions of pollutants at part load and during the plant ramping up and down. It is clear that emissions per MWh remain at all times within the limits set by EU Directives and are closely monitored by national environment agencies.
2.4.4 Thermal power plants in a modern electricity system in 2014
The experience around Europe shows that existing thermal power plants (coal, lignite, gas and biomass) are capable of balancing the variability of demand and of
intermittent generation whilst meeting environmental limits over their full load range.
The type of plant (and fuel) used for balancing (mid-merit plant) varies in different countries and has changed over time as fuel prices and carbon prices have changed. Initially there was a move to more gas-fired generation, but more recently with falling coal prices and carbon prices there has been a change away from using gas to using hard coal and lignite:
• In Germany, relatively new high efficiency hard coal–fired power plants built for base-load have to be used for balancing. These plants replaced old, less efficient plants and have reduced CO2 emissions from coal and lignite.
• In the UK, older coal-fired plants whose running hours are restricted by EU emissions legislation (LCPD and IED) are being used for balancing but the number of these plants available is reducing as allocations of permitted running hours are used up. Many of these plants have had successful boiler and pipework modifications to improve their ability to cycle.
Many existing plants, however, are less than optimum:
• Less efficient than BAT at full load (many coal plants are only 30-39% efficient compared to BAT of 46%), and frequently being operated at reduced efficiency at part-load

THERMAL POWER IN 2030 - Added Value For EU Energy Policy 25
• Reduction of efficiency at part-load pushes up the cost of electricity through sub-optimum use of fuel and has an impact on CO2 emissions
• Cycling of plant reduces plant life and the lifetime will be determined by the number of cycles rather than total operating hours, which will be reduced
• Thermal power plants will be running for fewer hours and these at part-load. For example, plants optimised for full load operation at 4,000 to 8,000 hours per year (e.g. ‘classical’ baseload plants) will be expected to operate between 1,500 to 3,000 hours per year at part-load26.
There are important economic consequences: New thermal power plants built for base-load and now only operating part-load are less economical than anticipated in the investment case. As a result, some plants have been closed. The case for new investment in Thermal Power must be made against uncertainties in anticipated running hours, wholesale electricity prices and fuel prices. In practice, the case cannot be made and numerous planned gas and coal power plant projects have been cancelled (9.5 GW) or postponed (12.5 GW). These numbers for 2012 are typical of what has happened each year for the last five years.
As demonstrated in Table 8, new plants and retrofits have been designed and built, many by EPPSA members, with improved efficiency, flexibility (minimum load, reduced start-up times and faster ramp rates) and able to cope with thermal cycling. Coal, lignite, biomass and gas power plants can be optimised for flexibility and there is scope for further improvement and a need for continuing RD&D.
26 VDE (2012), “Erneuerbare Energie braucht flexible Kraftwerke – Szenarien bis 2020”, pp. 57
2.5 The EU Energy System in 2030: Scenario Comparison
2.5.1 Scenarios towards 2030
2.5.1.1 Scenario description and comparison
EPPSA has analysed a number of studies on the EU energy system in 2030 to examine what role can be foreseen for thermal power plants. A total of 24 scenarios from 7 studies were taken up and compared (sections 2.5.1 to 2.5.4) with regard to electricity generation (MWh) and installed capacity (GW). Table 9 below presents a comparison of the studies and scenarios examined by scope, modelling approach, and policy assumptions used.
In addition, in section 2.5.5, they were specifically examined and compared with regard to the additional capacity of thermal power needed by 2030 to account for the decommissioning of existing plants which is expected to be substantial in the coming years.

EPPSA STUDY26
Study Scope Modelling Scenario Policy Assumptions
JRC (2009), “Future Fossil Fuel Electricity Generation in Europe: Options and Consequences”
Fossil fuel generation in EU-27, up to 2030
Production mix exogenously determined by setting shares of RES & nuclear, and then determining necessary fossil fuel generation & capacity
Business As Usual
Low Carbon Policy Policies promoting RES in place (leading to higher RES share, exogenously determined)
Eurelectric (2009), “Power Choices: Pathways to Carbon-Neutral Electricity in Europe by 2050”
EU-27 energy system as a whole, up to 2050
Energy sector modelling by PRIMES
Baseline EU Policies adopted by March 2009
Power ChoicesFulfilment of NREAPs by 2020; for 2030, no RES targets but achievement of 40% GHG reductions driven by carbon pricing
Greenpeace (2010), “Energy (R)Evolution: Towards a Fully Renewable Energy Supply in the EU-27”
EU-27 energy system as a whole, up to 2050
Global modelling using MESAP/PlaNet simulation
Reference Based on IEA WEO 2009 reference scenario; no CO2 reduction target
Energy (R)Evolution CO2 reduction targets and phase-out of nuclear energy; no CCS
Advanced Energy (R)Evolution Stricter CO2 reduction targets; no CCS
European Climate Foundation (2011), “Power Perspectives 2030: On the Road to a Decarbonised Power Sector”
EU-27 (plus Norway and Switzerland), power sector only, up to 2030
3-step approach:
1. defining demand and production mix in 2020/2030
(based on PRIMES data), and calculating capacity (RES
share in production mix exogenously set)
2. creating hourly demand and production curves
3. grid and system modelling: computing transmission and
back-up requirements, simulation of hourly operation
On TrackNREAPs and TYNDPs are fulfilled by 2020; after 2020, constraints are CO2 reduction target, system reliability (99.97%) and 50% RES
Higher RES Higher RES share in 2030 (60%)
Less Nuclear and CCS Less nuclear and CCS due to public opposition
European Commission (2011), “Energy Roadmap 2050”
EU-27 energy system as a whole, up to 2050 PRIMES, GEM-E3, PROMETHEUS
Reference EU policies adopted by March 2010 (inc. NREAPs)
Current Policy Initiatives EU policies after March 2010 (inc. TYNDP); includes revised assumptions on nuclear (after Fukushima) and slow progress on CCS
High Energy Efficiency
Stronger climate policies, including CO2 reduction targets for 2030 and RES-facilitation policies; support for early demonstration to all low-carbon technologies; stringent energy efficiency measures (appliances, buildings); obligation for installations to upgrade to BAT whenever permit is updated; full smart-grid roll-out
Diversified Supply Technologies
Stronger climate policies, including CO2 reduction targets for 2030 and RES-facilitation policies; support for early demonstration to all low-carbon technologies; all low-carbon energy sources compete on market basis; no specific support for RES or energy efficiency, and public acceptance of nuclear and CCS
High RESStronger climate policies, including CO2 reduction targets for 2030 and RES-facilitation policies; support for early demonstration to all low-carbon technologies; very high RES penetration (off-shore wind, CSP); significant storage
Delayed CCSStronger climate policies, including CO2 reduction targets for 2030 and RES-facilitation policies; support for early demonstration to all low-carbon technologies; similar to Diversified Supply Technologies except issues with acceptance of CCS
Low NuclearStronger climate policies, including CO2 reduction targets for 2030 and RES-facilitation policies; support for early demonstration to all low-carbon technologies; similar to Diversified Supply Technologies except issues with acceptance of nuclear
DG ENER (2013), “EU Energy Trends to 2050” EU-28 energy system as a whole, up to 2050 PRIMES, GEM-E-3, GAINS, GLOBIOM-G4M, PROMETHEUS Reference EU and MS policies adopted by spring 2012; takes into account effects of recent unconventional
gas developments globally
ENTSO-E (2013), “2030 Visions”
Note: Visions 2030 is not a study but will form part of the 2014 TYNDP. However, data on installed capacity in 2030 was open for public consultation in 2013, and is utilised in the present study for a broader basis of comparison in Section 2.4.5.Money RulesGreen TransitionGreen Revolution
Slow Progress National energy policies dominate; no CCS
EU energy policy; partial implementation of CCS
National energy policies dominate; no CCS
EU energy policy; full implementation of CCS
Table 9 - Overview of Selected Scenarios

THERMAL POWER IN 2030 - Added Value For EU Energy Policy 27
Study Scope Modelling Scenario Policy Assumptions
JRC (2009), “Future Fossil Fuel Electricity Generation in Europe: Options and Consequences”
Fossil fuel generation in EU-27, up to 2030
Production mix exogenously determined by setting shares of RES & nuclear, and then determining necessary fossil fuel generation & capacity
Business As Usual
Low Carbon Policy Policies promoting RES in place (leading to higher RES share, exogenously determined)
Eurelectric (2009), “Power Choices: Pathways to Carbon-Neutral Electricity in Europe by 2050”
EU-27 energy system as a whole, up to 2050
Energy sector modelling by PRIMES
Baseline EU Policies adopted by March 2009
Power ChoicesFulfilment of NREAPs by 2020; for 2030, no RES targets but achievement of 40% GHG reductions driven by carbon pricing
Greenpeace (2010), “Energy (R)Evolution: Towards a Fully Renewable Energy Supply in the EU-27”
EU-27 energy system as a whole, up to 2050
Global modelling using MESAP/PlaNet simulation
Reference Based on IEA WEO 2009 reference scenario; no CO2 reduction target
Energy (R)Evolution CO2 reduction targets and phase-out of nuclear energy; no CCS
Advanced Energy (R)Evolution Stricter CO2 reduction targets; no CCS
European Climate Foundation (2011), “Power Perspectives 2030: On the Road to a Decarbonised Power Sector”
EU-27 (plus Norway and Switzerland), power sector only, up to 2030
3-step approach:
1. defining demand and production mix in 2020/2030
(based on PRIMES data), and calculating capacity (RES
share in production mix exogenously set)
2. creating hourly demand and production curves
3. grid and system modelling: computing transmission and
back-up requirements, simulation of hourly operation
On TrackNREAPs and TYNDPs are fulfilled by 2020; after 2020, constraints are CO2 reduction target, system reliability (99.97%) and 50% RES
Higher RES Higher RES share in 2030 (60%)
Less Nuclear and CCS Less nuclear and CCS due to public opposition
European Commission (2011), “Energy Roadmap 2050”
EU-27 energy system as a whole, up to 2050 PRIMES, GEM-E3, PROMETHEUS
Reference EU policies adopted by March 2010 (inc. NREAPs)
Current Policy Initiatives EU policies after March 2010 (inc. TYNDP); includes revised assumptions on nuclear (after Fukushima) and slow progress on CCS
High Energy Efficiency
Stronger climate policies, including CO2 reduction targets for 2030 and RES-facilitation policies; support for early demonstration to all low-carbon technologies; stringent energy efficiency measures (appliances, buildings); obligation for installations to upgrade to BAT whenever permit is updated; full smart-grid roll-out
Diversified Supply Technologies
Stronger climate policies, including CO2 reduction targets for 2030 and RES-facilitation policies; support for early demonstration to all low-carbon technologies; all low-carbon energy sources compete on market basis; no specific support for RES or energy efficiency, and public acceptance of nuclear and CCS
High RESStronger climate policies, including CO2 reduction targets for 2030 and RES-facilitation policies; support for early demonstration to all low-carbon technologies; very high RES penetration (off-shore wind, CSP); significant storage
Delayed CCSStronger climate policies, including CO2 reduction targets for 2030 and RES-facilitation policies; support for early demonstration to all low-carbon technologies; similar to Diversified Supply Technologies except issues with acceptance of CCS
Low NuclearStronger climate policies, including CO2 reduction targets for 2030 and RES-facilitation policies; support for early demonstration to all low-carbon technologies; similar to Diversified Supply Technologies except issues with acceptance of nuclear
DG ENER (2013), “EU Energy Trends to 2050” EU-28 energy system as a whole, up to 2050 PRIMES, GEM-E-3, GAINS, GLOBIOM-G4M, PROMETHEUS Reference EU and MS policies adopted by spring 2012; takes into account effects of recent unconventional
gas developments globally
ENTSO-E (2013), “2030 Visions”
Note: Visions 2030 is not a study but will form part of the 2014 TYNDP. However, data on installed capacity in 2030 was open for public consultation in 2013, and is utilised in the present study for a broader basis of comparison in Section 2.4.5.Money RulesGreen TransitionGreen Revolution
Slow Progress National energy policies dominate; no CCS
EU energy policy; partial implementation of CCS
National energy policies dominate; no CCS
EU energy policy; full implementation of CCS

EPPSA STUDY28
Study Scenario2030 GHG Reduction (rel. 1990)
CO2 Prices
JRC (2009), “Future Fossil Fuel Electricity Generation in Europe: Options and Consequences”
Business As Usual ± 50% 20-105€2005/tCO2
Low Carbon Policy -10 to -70% 20-105€2005/tCO2
Eurelectric (2009), “Power Choices: Pathways to Carbon-Neutral Electricity in Europe by 2050”
Baseline N/A 39 €2008/tCO2
Power Choices -40% 52.1 €2008/tCO2
Greenpeace (2010), “Energy (R)Evolution: Towards a Fully Renewable Energy Supply in the EU-27”
Reference -36.5% 30 $/tCO2
Energy (R)Evolution -60.9% 30 $/tCO2
Advanced Energy (R)Evolution
-65.8% 30 $/tCO2
European Climate Foundation (2011), “Power Perspec-tives 2030: On the Road to a Decarbonised Power Sector”
On Track -65% (power sector only) 85 €/tCO2
Higher RES -70% (power sector only) 85 €/tCO2
Less Nuclear and CCS -59% (power sector only) 85 €/tCO2
European Commission (2011), “Energy Roadmap 2050”
Reference -40.8% 40 €2008/tCO2
Current Policy Initia-tives
-47.5% 32 €2008/tCO2
High Energy Efficiency -56.2% 25 €2008/tCO2
Diversified Supply Technologies
-55.6% 52 €2008/tCO2
High RES -56.7% 35 €2008/tCO2
Delayed CCS -56% 55 €2008/tCO2
Low Nuclear -55.1% 63 €2008/tCO2
DG ENER (2013), “EU Energy Trends to 2050” Reference -30.5% 35 €2010/tCO2
ENTSO-E (2013), “2030 Visions”
Slow Progress
N/A
31 €/tCO2
Money Rules 31 €/tCO2
Green Transition 93 €/tCO2
Green Revolution 93 €/tCO2
Table 10 - Overview of Selected Scenarios - Emissions Reductions and Carbon Prices

THERMAL POWER IN 2030 - Added Value For EU Energy Policy 29
The scenarios also differ with regard to the GHG reductions and carbon prices in 2030. Table 10 above presents a comparison of this data.
2.5.1.2 Assumptions and Inputs: Analysis
The studies and scenarios compared are from the years 2009-2013; as such, their respective reference scenarios reflect projections based on different starting points. Additionally, only the most recent study (DG ENER, 2013) considers the EU-28 instead of the EU-27. Some only consider the power sector, while others consider the EU energy system as a whole.
With regard to decarbonisation scenarios, a wide variety of technology mixes is utilised; some scenarios consider the emphasis placed on certain technologies (most often RES), while others evaluate the effects of public opposition to certain technologies (nuclear, CCS) or disregard them altogether.
Scenarios differ based on the role of GHG reductions; in some, they are exogenous (i.e. defined as inputs to the model) and represent boundary conditions, while in others, they represent outputs based on policy assumptions. This depends on the way a specific study has been carried out, i.e. whether it examines the effect of certain policies or technologies on emissions, or whether it selects desired emissions and examines what technology mixes and/or policies can achieve it. Overall, for the EU as a whole, predicted GHG reductions vary from -30.5% (reference projection) to -65.8%.
Likewise, the role of carbon prices differs from scenario to scenario. In some, carbon prices are modelled, while in others (e.g. ECF), they are exogenously determined. Overall, carbon prices for 2030 across all scenarios range from 25 €2008/tCO2 to 105 €2005/tCO2.
In summary, the scenarios exhibit a wide variety with regard to policy assumptions, carbon prices, and GHG reductions. The sections below address:
2.5.2 The Generation Mix in 2030 (i.e.: the quantity of electricity generated by different plant types taking account of running hours)
2.5.3 The Capacity Mix in 2030 (i.e. the total nameplate capacity for different plant types)
2.5.4 Thermal power capacity in 2030 by type of fuel
2.5.5 New thermal power capacity to be built by 2030 (taking account of plant replacements)
The key conclusions of each analysis are given in italics at the end of each section and summarised in section 2.5.6.
Notes:Some scenarios, like this report, include biomass with other thermal power, others include biomass with renewables.
In Figure 10, Figure 11, Figure 12 and Figure 13 the results of the scenario modelling are compared with a “reference” year (2010 Reference DG ENER) which is a result of modelling based on business as usual, i.e. unchanged politics, shown in each case in the first column.
In Figure 14 the reference case is JRC 2009 Business as Usual.
2.5.2 The Generation Mix in 2030
2.5.2.1 comparison of Scenarios
Figure 10 below shows a comparison of the generation mix (i.e. the proportion of the total electricity generated for each type of plant) in 2030 for those scenarios where generation shares were defined for RES (including biomass), nuclear, and thermal power (as fossil fuels only).
Figure 11 below shows a comparison for scenarios where generation shares were composed of RES, nuclear, and thermal power including biomass.
2.5.2.2 Analysis
In all scenarios, the share of RES in the generation mix increases compared to the 2010 Reference case, while the shares of nuclear and thermal power decrease27.
For scenarios where thermal power does not include biomass: thermal power shares in 2030 reference and baseline scenarios range from 33.7% to 55%. In decarbonisation scenarios, they range from 22% to 36.2% (Eurelectric). However, aside from the Eurelectric scenarios, the 2030 generation mix was exogenously determined, i.e. it is not a result of the scenario model but a limiting boundary condition.
For scenarios where thermal power includes biomass, the picture is somewhat different. Thermal power shares in 2030 reference and baseline scenarios range from 43.2% to 53.3%. In decarbonisation scenarios, thermal power shares range from 34.1% to 48.4%, i.e. the share of Thermal Power in the 2030 generation mix never falls below a third.
27 Except in the JRC Business As Usual scenario.

EPPSA STUDY30
Figure 10 - Generation Mix in 2030 (Thermal = Fossil)
Figure 11 - Generation Mix in 2030 (Thermal incl. Biomass)
Figure 12 - Capacity Mix in 2030
27,5
18,5
24,5 20,721,8 4,8
3,318,6 21,2
15,821,5 13,4
16,628,2 32,3 34,8 37,9
46,955,7
42,8 41,350,1
41,8 43,7
0%
25%
50%
75%
100%
2010
Refe
rence
(DG E
NER)
Referen
ce (G
reenp
eace
)
Referen
ce (R
M 2050
)
CPI (RM 20
50)
Referen
ce (D
G ENER)
E(R) (G
reenp
eace
)
Adv. E
(R) (G
reenp
eace
)
EE (RM 20
50)
DST (RM 20
50)
RES (RM 20
50)
Del. C
CS (RM 20
50)
L. Nuc
(RM 20
50)
% o
f tot
al
Scenario
RES Nuclear Thermal (inc. biomass)
27,5 19
26,2
21,8 2926,1
16
16
9
2126
33,344,5 41 37,7
5060 57
0%
25%
50%
75%
100%
2010
Refe
rence
(DG E
NER)
Busine
ss A
s Usu
al (JR
C)
Baseli
ne (E
urele
ctric)
2030
Refe
rence
(DG E
NER)
Low C
arbon
Poli
cy (J
RC)
Power
Choice
s (Eur
electr
ic)
On Trac
k (ECF)
Higher
RES (ECF)
Less
Nuc
lear a
nd C
CS (ECF)
RES (inc. biomass) Nuclear Thermal%
of t
otal
Scenario
15,7
9,7 11 99,4
12
21,4
7,3 8,86,8
8,9 5,2 9,6
6,6
7,36,4
27
46,4 46,7 47,8 5143,9
65,371,3
54,5 5459,9
54,2 56,2 54,6
69,461,4
66,9
0%
25%
50%
75%
100%
2010
Refe
rence
(DG E
NER)
Referen
ce (G
reenp
eace
)
Referen
ce (R
M 2050
)
CPI (RM 20
50)
Referen
ce (D
G ENER)
Power
Choice
s (Eur
electr
ic)
E(R) G
reenp
eace
Adv. E
(R) (G
reenp
eace
)
EE (RM 20
50)
DST (RM 20
50)
RES (RM 20
50)
d. C
CS (RM 20
50)
l. NUC (R
M 2050
)
Slow P
rogr
ess (
ENTSO-E
)
Money
Rule
s (ENTS
O-E)
Green T
ransit
ion (E
NTSO-E
)
Green R
evolu
tion (
ENTSO-E
)
RES Nuclear Thermal (inc. biomass)
% o
f tot
al
Scenario

THERMAL POWER IN 2030 - Added Value For EU Energy Policy 31
2.5.3 The Capacity Mix in 2030
2.5.3.1 comparison of Scenarios
Figure 12 below shows a comparison of the capacity mix (i.e. the proportion of the total installed capacity for each type of generating plant) in 2030 for the different scenarios examined, with Thermal inclusive of biomass.
2.5.3.2 Analysis
Similar to the generation mix in 2030, all scenarios show a decrease in the share of thermal power capacity in 2030 compared to the 2010 Reference case.
For reference/baseline scenarios in 2030, thermal power capacity shares range from 39.3% to 44%, while in decarbonisation scenarios, they range from 27.4% to 44%. In only two scenarios (E(R) and Adv. E(R)) are the shares of thermal power capacity below a third of total installed capacity. Yet, in these scenarios, this capacity produces 41 - 48.4% of total electricity in 2030; they are also the scenarios with the most drastic reduction in nuclear power (as phase-out thereof is an explicit objective). This underlines above all the importance of dispatchable capacity in the power system; as one kind of dispatchable capacity is phased out, another increases in importance and generation, even if the share of installed capacity decreases.
2.5.4 Thermal power capacity in 2030 by type of fuel
This section examines the scenarios with regard to (absolute not relative) Thermal capacity installed by type of fuel. In addition to the scenarios used in previous sections, data from ENTSO-E’s 2030 Visions is included in the comparison to widen the basis thereof.
2.5.4.1 comparison of Scenarios
Figure 13 above shows the absolute installed capacity of thermal power by fuel type28 in 2030.
2.5.4.2 Analysis
Compared to the 2010 Reference case, most scenarios (i.e. all except Eurelectric’s Power Choices) show a decrease in total thermal capacity. The changes differ depending on the type of fuel. In the decarbonisation scenarios for 2030, solids-fired capacity ranges between 17 – 174 GW; gas-fired capacity ranges between 219 - 276.7 GW; oil-fired capacity ranges between 11.2 – 30 GW; and biomass ranges between 53 – 81.3 GW.
Thus, in all scenarios, solid fossil-fired capacity decreases the most, but - except for two scenarios - remains at more than 100 GW. At the same time, biomass capacity increases. With regard to gas-fired capacity, some scenarios see an increase compared to the 2010 Reference case while others see a decrease, with an overall range from 220 GW to 277 GW, i.e. the scenarios indicate around twice as much gas capacity as coal. However, despite the decreases, all scenarios show a substantial installed Thermal capacity in 2030. In the scenarios with the lowest capacity (E(R) and Adv. E(R)), the total installed thermal power capacity still amounts to at least 335 GW. In most non-reference/baseline scenarios (9 out of 12), the total installed thermal power capacity is between 423 – 485 GW, compared to a 2010 Reference case of 479 GW.
28 Note that in Figure 13, the data for biomass/waste/CHP differs depending on the scenario. For all scenarios except the ENTSO-E scenarios (last four on the right), the figures refer exclusively to biomass-waste, whereas for the ENTSO-E scenarios, the figures refer to CHP and non-renewable waste, i.e. biomass and renewable waste are not included. Likewise, the Eurelectric Power Choices scenario does not offer separate data for gas and oil, so the gas category includes oil as well. In all other scenarios, CHP is included in the other categories depending on the fuel used.
225 242238,8 256,1 281
258
230228
219 230 227,2 230,4 236,7 234 220276,7 270,6
175,8 159133,6 123,2 104
174
40 17
106,1 107,9 107,5 107,1 115 116,5 116,5 111,9 103,8
5429
47,6 32,8 24
1313
24,129,3 29,3 28,1
30 11,211,2
16,216,2
2539 72 73,5
3953
7677
74,676,7 77,7 76,9
81,3
50,150,1
50,749
0
100
200
300
400
500
600
2010
Refe
rence
(DG E
NER)
Referen
ce (G
reenp
eace
)
Referen
ce (R
M 2050
)
CPI (RM 20
50)
Referen
ce (D
G ENER)
Power
Choice
s (Eur
electr
ic)
E(R) G
reenp
eace
Adv. E
(R) (G
reenp
eace
)
EE (RM 20
50)
DST (RM 20
50)
RES (RM 20
50)
d. C
CS (RM 20
50)
l. NUC (R
M 2050
)
Slow P
rogr
ess (
ENTSO-E
)
Money
Rule
s (ENTS
O-E)
Green T
ransit
ion (E
NTSO-E
)
Green R
evolu
tion (
ENTSO-E
)
Cap
acity
Inst
alle
d (G
W)
Scenario
Biomass/Waste/CHP Oil Gas Solids
Figure 13 - Thermal Capacity in 2030

EPPSA STUDY32
2.5.5 Thermal power capacity to be built by 2030
Section 2.4.4 outlines the absolute shares of thermal power capacity installed in 2030 in the different scenarios. Some of this capacity will be taken care of by plants already operating today which will continue to operate in 2030, while others will be by new plants to be built (including plants built to replace old plants that are decommissioned). This section compares scenarios where relevant data was available with regard to thermal power capacity investments required by 2030.
In addition, data on total dispatchable capacity investment needed by 2030 is compared; this is taken from a study commissioned by DG Energy in 201329 analysing the investment in dispatchable capacity until 2030 that is required to ensure generation adequacy. In this study, three scenarios are evaluated: a reference scenario, a scenario with higher RES penetration (“Higher RES”), and a scenario with reduced cross-border trade (‘Low XB Trade”).
2.5.5.1 comparison of Scenarios
Figure 14 above shows the thermal power capacity investments required by 2030.
29 DG ENER (2013b), “Capacity Mechanisms in Individual Markets Within the IEM”
2.5.5.2 Analysis
In reference/baseline scenarios, required capacity investments by 2030 for thermal power range from 228 to 435 GW (of which 3 - 11 GW are in CCS capacity).
In decarbonisation scenarios, required new capacity investments by 2030 for thermal power range from 166 to 310 GW (of which 3 – 62.9 GW are in CCS capacity). Excluding the JRC figure30 changes this to a range of 166 to 234.3 GW. Comparing this range to the total installed capacity of thermal power in 2030 (see 3.4), which ranges from 423 – 485 GW, it can be estimated that thermal capacity investments required in the 2010-2030 period will account for between 39.4 and 48.3% of all installed thermal capacity in 2030.
For overall dispatchable capacity (including dispatchable RES and nuclear), the figures range between 275.9 GW, for the reference scenario, to 277.2, for the scenario with higher RES, while reduced cross-border trade raises the figure to 359 GW. This underlines the additional importance of transmission infrastructure for ensuring generation adequacy in the future. EPPSA welcomes the adequate response from the European Council in its 2030 Climate and Energy Policy Framework conclusions.
30 Excluding the JRC figure may be justified on the basis that it results from the remaining capacity required given an exogenously determined share of RES in the generation mix, as well as the fact that it does not take into account a significant amount of energy-related legislation put into place after its publishing.
435
236,2
203,4
265,5290
232 228
310
234,3
166187 183 184
204
11 3
62,9
3 4 3 3 8
275,9 277,2
359
0
100
200
300
400
500
Business
As Usu
al (JRC)
Baselin
e (DG ENERa)
Reference (D
G ENERa)
Baselin
e (Eurelectr
ic)
Reference (D
G ENERb)
Reference (R
M 2050)
CPI (RM 2050)
Low Carbon Polic
y (JRC)
Power Choice
s (Eurelectr
ic)
EE (RM 2050)
DST (RM 2050)
RES (RM 2050)
d. CCS (R
M 2050)
l. NUC (R
M 2050)
Reference (D
G ENERc)
Higher RES (D
G ENERc)
Low XB Trade (DG ENERc)
Capa
city
Inve
stm
ent (
GW
)
Scenario
Thermal CCS Total Dispatchable Plants

THERMAL POWER IN 2030 - Added Value For EU Energy Policy 33
Figure 14 - Capacity Investments Required, 2010-2030
2.6. Conclusions to Section 2
In the ‘classical’ power system where demand was the main source of fluctuation, thermal power (alongside other sources such as nuclear and hydropower) provided dispatchable generation that was flexible enough to meet demand fluctuations. Plants were classified into baseload, mid-merit, and peak-load, and were dispatched depending on technical and economic considerations. Additionally, they provided important system services such as reserves and balancing provision. In a system with increasing shares of i-RES, the distinction between baseload, mid-merit, and peak-load plant no longer applies in the same way. The ‘new baseload’ is provided by must-run generation from i-RES, while thermal power plants must meet the remaining residual load and provide essential system services.
While overall generation from thermal power necessarily decreases as the share of i-RES generation increases, this does not necessarily mean that the required installed capacity of thermal power decreases to the same extent. As the residual load changes rapidly and increasingly
often, thermal power plants will increasingly be required to provide flexible back-up and balancing. Additionally, thermal power plants will still be required for other system services, e.g. supply restoration.
For this reason, thermal power plant capacity and availability will remain important in the future. Comparative examination of selected 2030 scenarios supports this, as both generation and capacity shares of thermal power plants decrease yet the absolute installed capacity, while decreasing somewhat, remains close to 2010 levels.
At the same time, plant retirements in the 2010-2030 period mean that significant capacity investments (up to 48.3% of expected installed capacity in 2030) will be necessary to ensure system adequacy, balance, and stability.
Given the increasing flexibility requirements of power systems with increasing shares of intermittent generation, such capacity investments should be made in state-of-the-art flexible plants to minimise the costs of decarbonisation.
It is clear from the experience around Europe that existing thermal power plants (coal, lignite, gas and biomass) are capable of balancing the variability of demand and of intermittent generation whilst meeting environmental limits over their full load range. The type of plant (and fuel) used for balancing (mid-merit plant) varies in different countries and has changed over time, together with fuel and carbon prices, leading to a move away from gas to hard coal and lignite. However, many existing plants used for balancing are sub-optimum in terms of thermal efficiency (particularly at part–load) and their operating lives will be reduced due to cycling.
The important economic consequences have been pointed out; new plants built for base-load and now only operating part-load are less economical than anticipated in the investment case. Some such plants have been closed. The case for new investment is even more difficult and must be made against uncertainties in anticipated running hours and wholesale electricity and fuel prices. Most planned thermal power projects, typically 12 GW/year, have been cancelled or postponed. This has led some MS to introduce capacity mechanisms.
New plants and retrofits have been designed and built, many by EPPSA members, for improved efficiency, flexibility (minimum load, reduced start-up times and faster ramp rates) and to cope with thermal cycling. Coal, lignite, biomass and gas power plants can be optimised for flexibility and there is scope for further improvement.
Key results from Scenarios reviewThe share of thermal power in the generation
mix decreases in all considered decarbonisation scenarios. For those scenarios where generation is not exogenously determined, thermal power shares in generation range from 34.1% to 48.4% in 2030 (compared to 51.5% in the 2010 Reference case), i.e. the share of thermal power in the 2030 generation mix does not fall below a third.
The percentage share of thermal power in total installed capacity decreases by 2030; in the decarbonisation scenarios considered, thermal power capacity shares range from 27.4% to 44% in 2030 (compared to 55.8% in the 2010 Reference case).
In all except one scenario, absolute thermal capacity decreases by 2030, with the lowest value acrossscenarios being a minimum of 335 gW in 2030; but in most decarbonisation scenarios, absolute thermal capacity in 2030 ranges from 423-485 gW, which is not significantlydifferentto479GWinthe2010Referencecase.In the 2010-2030 period, significant investment
in dispatchable capacity generally and thermal power capacity in particular is required to maintain generation adequacy. Between 166 and 234.3 gW of thermal power capacity additions are required. This means that between 39.4 and 48.3% of installedthermal power capacity in 2030 will be built in the years 2010-2030.

EPPSA STUDY34

THERMAL POWER IN 2030 - Added Value For EU Energy Policy 35
3. The Added Value of Thermal Power in 2030
3.1 Added Value for EU Energy Policy
3.1.1 Affordability
Flexible and baseload thermal power plants will contribute enormously to the affordability of electricity in 2030. Thermal power (lignite, hard coal, and gas) are significantly less expensive than renewable power in terms of €/MWh, as indicated by the large support subsidies which are necessary to promote the use of renewables.
EPPSA has studied the benefits of replacing old coal-fired power plants by new build coal, looking at 26 plants (22GW)31. This analysis shows that, taking into account both investment and operational costs until 2030, investment costs are more than offset by the savings in fuel and CO2 allowances which arise from the improved thermal efficiency and result in CO2 avoidance with a positive Return on Investment (RoR). Additionally, findings show that 37 million tonnes of coal every year will be saved, equivalent to the combined hard coal imported by Austria, Belgium, Bulgaria, Croatia, Cyprus, Czech Republic, Denmark, Estonia, France, Greece, Hungary, Ireland, Latvia, Lithuania, Luxembourg, Malta, Spain and Romania in 2012.
Furthermore, if RES are expected - in 2030 or thereafter – to deliver the electricity currently provided by thermal power, we would need very much more geographically diverse sources outside Europe and thus very long and costly transmission lines.
3.1.2 Security of Supply
Thermal power plants provide secure, dispatchable power, available as required to meet demand. They are not subject to the regular daily intermittency of solar (day/night) or the weather dependent intermittency of solar and wind.
Unlike solar and wind energy, thermal energy can be stored in the form of the fuel. This is especially easy for coal which can be stored in stockyards, less so for gas which needs dedicated stores.
There are ample reserves of fossil fuels, including coal and lignite resources which are indigenous to Europe
31 EPPSA Case Study
and these reserves have increased as a result of the discovery and potential use of shale gas. Security of supplies can be assured by using geographically diverse and secure sources of lignite, coal and gas. In the light of recent events, it is crucial for Europe to make use of a balanced energy mixed for a stable and secure energy system.
3.1.3 Sustainability
The energy efficiency of modern plants is 33% higher than older plants32. Calculations for the 22GW of plant referenced in section 3.1.1 show that the reduction in burnt coal has reduced CO2 emissions by 56.4 million tonnes per year, equivalent to the combined GHG emissions in the energy industries of Sweden, Ireland, Croatia, Cyprus, Latvia, Lithuania, Malta, Slovenia and Slovakia (56.2 million) in 2012. However, given the reserves of fossil fuels, the main sustainability issue for fossil thermal power plants is the lock-in of CO2 emissions from plants used in baseload mode – the lock-in argument does not apply to plants that are being operated in a flexible mode when necessary in order to provide back-up for the non-availability of renewable sources. The potential solution to CO2 emissions from baseload plant initially, and potentially from flexible plant in the longer term, is CCS which will be essential by 2030 in order to reduce emissions from industrial processes requiring fossil fuels.
Europe is fortunate to have huge potential stores for CO2 within reach, including storage deep beneath the Central North Sea basin in depleted gas fields and oil fields and in saline formations, sufficient to store as much as 100 million tonnes of CO2 a year before 2030 and 500 million tonnes a year by 2050 – equivalent to 25% of the total EU emissions (at 2007 levels)33.
The preparation of this report coincided with the announcement of the start of operations of the world’s largest CCS Thermal Power plant project at Boundary Dam in Canada. This project has transformed the aging Unit #3 at Boundary Dam Power Station near Estevan, Saskatchewan into a reliable, long-term producer of 110 megawatts (MW) of base-load electricity and will reduce GHG emissions by one million tonnes of CO2 each year. Boundary Dam Unit #3 has been retrofitted with a post-combustion capture plant and a new steam turbine
32 EPPSA Case Study33 Scottish CCS report “Central North Sea - CO2 Storage Hub -Enabling CCS
Deployment in the UK and Europe”. http://www.sccs.org.uk/expertise/reports/central-north-sea-co2-storage-hub#downloads

EPPSA STUDY36
designed to supply the heat requirements of the process.
Progress on CCS in Europe needs to be accelerated if full commercialisation is to be achieved in time to meet the 2030 targets. This requires a continuing commitment to RD&D and the European institutions and those MS which envisage CCS within their energy and security plans should agree upon a clear route forward to implementation.
3.2 Added Value for EU Citizens
3.2.1 Technological Leadership
Europe is a leader in most aspects of Thermal Power technology. Many leading global players in thermal power have their technology hubs in Europe. For example:
• GTs: Siemens, Mitsubishi Hitachi Power Systems Europe (MHPSE) in Germany and General Electric in France each offer the highest efficiency CCGTs available in the world, using HRSGs from EPPSA companies.
• HRSG for CCGTs: CMI in Belgium, Siemens/NEM in Holland, Ansaldo Caldaie, STF and Nooter/Eriksen in Italy, and Bilfinger Power Systems and MHPSE in Germany.
• Coal and Lignite boilers: Andritz in Austria Alstom, Bilfinger Power Systems and MHPSE in Germany, Doosan Babcock in UK, Foster Wheeler in Finland, BWE in Denmark, Ansaldo Caldaie and STF in Italy. Several of these companies are participating in the projects to develop a 50% efficient coal power plant.
• Biomass boilers, conversions and co-firing systems: Andritz in Austria, Foster Wheeler in Finland, Alstom in UK and France, BWE in Denmark and Doosan Babcock in the UK.
• Steam Turbines: Andritz in Austria, Alstom in France, Siemens and MHPSE in Germany, Doosan Skoda in the Czech Republic
• Flue Gas Cleaning: Andritz in Austria
• Carbon Capture: Alstom and MHPSE in Germany, Doosan Babcock in UK, Foster Wheeler in Finland and Spain, Fluor in UK. Each of these companies has designed, built and operated pilot plants for carbon capture and is able to offer “capture-ready designs” for post-combustion capture (coal, lignite and gas) or oxy-fuel (coal and lignite). Alstom is working on the FEED study for the coal-fired White Rose CCS project
in the UK, supported by the EU NER 300.
• CO2 transport and storage: National Grid Carbon and Shell in UK, Total in France.
• Control systems and ancillaries: ABB in many countries, Bilfinger Power Systems in Germany.
The above mentioned do not include the multitude of component, raw material and services companies present in Europe.
Universities and institutes around Europe are very experienced in the area of thermal power plants, emissions control systems and CCS, notably in Germany, UK, France, Spain, Norway, Greece, Denmark, Italy and Poland.
Technological leadership can lead to business opportunities, both inside the EU and in the rest of the world. Such business, both ongoing and new, perfectly complements the ongoing efforts of the EU and the national governments to bring a halt to the de-industrialisation, it creates employment in the form of high level, well-paid jobs and generates tax revenues. Next to technological leadership, however, a stable and predictable home market is a pre-requisite for sustainable business, which, as described above is missing at the present time.
3.2.2 Global Dimension
Even though this paper is focussed on the European dimension of energy politics, it is necessary to keep the global evolution of the energy markets in mind and to see how the European industrial presence is necessary on both the European and global level.
To meet the electricity demand, countries which have fossil fuel resources or access to the very liquid market of LNG or coal, will, in the short to medium term, continue to build and use Thermal Power for base-load purposes. It is also expected that, in the medium to long term, Thermal Power will be needed worldwide to balance renewable energy.
This conclusion is supported by the US EIA34, which states that, although the share of electricity produced worldwide from coal will go down from 40% to 36%, the total electricity production – most of it in non-OECD countries - will double by 2040 (amounting to an 80% rise in absolute terms of the electricity produced by coal worldwide). It is estimated that, in the next 5 years alone,
34 Energy Information Agency: International Energy Outlook 2013

THERMAL POWER IN 2030 - Added Value For EU Energy Policy 37
utilities in the Asia-Pacific region will order 275 GW of new coal powered plants. This is an important point, as an IEA report35 states that 60% of all coal power plants newly built over the last decade use the least efficient of commercially available technologies, rather than the best available, thus emitting much more CO2. With the EIA projection of coal based electricity production at 15,000 TWh, even the difference between “average” and “best” is around 1,500,000,000 tonnes/year of CO2 emissions, or about 4% of today’s global CO2 emissions. If the BAT was specified for future plants, there would be an environmental benefit and an attractive market for European companies.
The decision of the European Investment Bank not to support power plant technologies that produce more than 550g/KWh (i.e. in practice, to support the building of gas power plants but not coal) has had an unintended consequence, penalising European companies with a negative impact on the environment in, inter-alia, Europe. China, for example, is offering low interest rate loans with a long grace period to build coal-fired plants in Africa and the Balkans. Many Chinese-funded projects are well under way in Europe, which authorise only Chinese manufacturers to provide their technologies. These projects are set to exceed the EIB emission limits, EU legislations and exceed the emissions of state-of the art European coal technology36.
35 International Energy Agency: Energy Technology Perspectives 201436 https://www.chinadialogue.net/blog/6794-Dirty-Bosnian-coal-plant-shows-
holes-in-China-s-green-investment-drive/en

EPPSA STUDY38

THERMAL POWER IN 2030 - Added Value For EU Energy Policy 39
4. Conclusions and Recommendations
- They are less efficient than BAT at full load, and they are frequently being operated at reduced efficiency at part-load. This reduction of efficiency at part-load pushes up the cost of electricity through sub-optimum use of fuel and has an impact on CO2 emissions- Replacement of older power plants by modern state–of-the-art plants would achieve energy efficiency improvements of the order of one third, similar to the latest EU efficiency target - The cycling of plants reduces the plant life and the lifetime will be determined by the number of cycles rather than the total operating hours. Plants will be running for fewer hours and these at part-load. For example, plants optimised for full load operation at 4,000 to 8,000 hours per year (e.g. ‘classical’ baseload plants) will be expected to operate between 1,500 to 3,000 hours per year at part-load.
5. The increasing deployment of intermittent generation has important consequences for the economics of the whole power system and for future investments.
Modern thermal power plants that were built for base-load and are now only operating at part-load are less economical than anticipated in their investment case. The case for essential investments in new plants must be made against uncertainties in anticipated running hours and in wholesale electricity and fuel prices and many planned projects have been cancelled as a consequence.
6. EPPSA has analysed a number of studies on the EU energy system in 2030 and determined what role can be foreseen for thermal power plants.
A total of 24 scenarios from 7 studies were taken up and compared with regard to electricity generation (MWh) and installed capacity (GW). In addition, they were specifically compared with regard to the additional capacity of Thermal Power needed by 2030 to account for the decommissioning of existing plants. The scenarios review demonstrates that whilst in the decarbonisation scenarios Thermal Power’s shares of total generation and capacity decrease, the share of generation does not fall below one third and the absolute capacity required in 2030 still ranges from 423-485 GW, which is similar to the base-case of 479 GW. Significant investment in dispatchable capacity in general, and
1. EU Energy Policies, especially the short-term targets for 2020 (i.e. 20-20-20) and the long-term aims for 2050 (80-95% GHG emission reductions) have set the market on course for a low-carbon electricity system. This trajectory has been reinforced by the 2014 Policy Framework for Energy and Climate Change package with its binding national targets for 2030 and a 43% cut in CO2 emissions for the sectors covered by the ETS. The importance of Thermal Power and fossil fuel diversity has not been fully recognised, however.
2. The role of Thermal Power is changing as a result of the increasing deployment of i-RES and thermal power plants are moving from mostly “baseload” to a more flexible operation.
EPPSA has compared the flexibility requirements of a modern electricity system with the technical capabilities of current and future plants. The changes occurring to power system operations as a result of an increasing deployment of intermittent generation have been considered and the associated new requirements that this places on thermal power plants have been examined. It is concluded that the necessary overall load gradients can be met by small numbers of plants with relatively fast (3%/min) ramping rates or a larger number of plants with slower ramping rates.
3. The flexibility characteristics of existing and future thermal power plants have been reviewed.
This includes the results of new EPPSA surveys that set out members’ views on BAT and give exemplars of many flexible plants already in operation. It is clear from the experience around Europe that existing thermal power plants (coal, lignite, gas and biomass) are already capable of balancing the variability of demand and intermittent generation whilst meeting environmental limits over their full load range.
4. Many existing thermal power plants are less than optimum in terms of efficiency (and carbon emissions) and flexibility.

EPPSA STUDY40
thermal power capacity in particular, is required to maintain generation adequacy. Over the next 15 years, around 200 GW of new thermal power capacity must be built.
7. Thermal Power can continue to provide a significant added value to the EU through to 2030 and beyond, contributing to affordability, security of supply, sustainability and technical leadership
Affordability. Flexible and baseload thermal power plants will contribute enormously to the affordability of electricity in 2030. Thermal Power (lignite, hard coal, and gas) is significantly less expensive than renewable power in terms of €/MWh, as indicated by the large support subsidies which are necessary to promote the use of renewables. Furthermore, if renewable sources are expected - in 2030 or thereafter – to deliver the electricity currently provided by thermal power, we would need very much more geographically diverse sources outside Europe and thus very long transmission lines. Security of Supply. Thermal power plants provide essential, secure, dispatchable power, available as required to meet demand. They are not subject to the regular daily intermittency of solar (day/night) or the weather dependent intermittency of solar and wind. Unlike the energy produced by the latter, thermal energy can be stored in the form of the fuel. There are ample reserves of fossil fuels, including coal and lignite resources which are indigenous to Europe, and these reserves have increased as a result of the discovery and potential use of shale gas. Security of supply can be assured by using geographically diverse sources of lignite, coal and gas.
Sustainability. The energy efficiency of modern thermal power plants is 33% higher than older plants37. However, given the reserves of fossil fuels, the main sustainability issue for fossil thermal power plants operating is CO2 emissions. A potential solution to these emissions is CCS which will be essential by 2030 in order to reduce emissions from all industrial processes requiring fossil fuels. Europe is fortunate to have huge potential stores for CO2 within reach, including storage deep beneath the Central North Sea basin in depleted gas fields and oil fields and in saline formations, sufficient for as much as 100 million tonnes of CO2 per year by 2030 and 500 million tonnes a year by 2050 – equivalent to 25% of the total EU emissions (at 2007 levels).
37 EPPSA case study
Technological Leadership. Europe is a leader in most aspects of Thermal Power technology, including GTs, HRSGs, coal and lignite fired boilers and steam turbines, CO2 capture, and storage systems, and control systems/ancillaries. Many leading global players in Thermal Power have their technology hubs in Europe. New plants and retrofits are being designed and built, many by EPPSA members, for improved efficiency, flexibility (minimum load, reduced start-up times and faster ramp rates) and to cope with thermal cycling. Coal, lignite, biomass and gas power plants can be optimised for flexibility and there is scope for further improvements. Universities and institutes around Europe are very experienced in the area of thermal power plants and CCS, notably in Germany, UK, France, Spain, Norway, Greece, Denmark, Italy and Poland. Technological leadership can lead to business opportunities, both inside the EU and in the rest of the world. It is estimated, for example, that, in the next 5 years alone, utilities in the Asia-Pacific region will need 275 GW of new coal powered plants. If the BAT was provided for these future plants, there would be a clear environmental benefit and an attractive market for European companies. Such business, both ongoing and new, perfectly complements the ongoing efforts of the EU and the national governments to bring a halt to de-industrialisation, it creates employment in the form of high level, well-paid jobs and generates tax revenues. Next to technological leadership, however, a stable and predictable home market is a pre-requisite for sustainable business, which, as described above, is missing at the moment.
Policy. EU and MS policy makers must address the dichotomy between, on the one hand, the continuing importance of Thermal Power in 2030 and beyond and, on the other, the lack of economic viability under current policies. Policy makers should accordingly assess the impact of new policies on electricity markets, affordability, investment, business opportunities and RD&D, including flexible power plants and CCS. Adequate funding, a stable regulatory framework and public acceptance need to be combined with enhanced Research and Innovation efforts in order to maintain Europe’s leading technological competence in the current and future knowledge-based economy. European centres of R&D excellence will contribute to creating skills and jobs and exporting efficient cutting-edge European technology to countries who need thermal power for back up or who cannot make full use of renewable energy.


Abbreviations and Acronyms
BAT Best Available TechnologyBREF Best Available Technology Reference DocumentCCGT Combined Cycle Gas TurbineCCS Carbon Capture and StorageCFB Circulating Fluid BedCHP Combined Heat and PowerCO2 Carbon DioxideEE Energy EfficiencyELV Emission Limit ValueESP Electrostatic PrecipitatorETS Emission Trading SystemEU European UnionGHG Greenhouse Gas(es)GT Gas TurbineGW GigawattHRSG Heat Recovery Steam GeneratorIED Industrial Emissions Directivei-RES Intermittent Renewable Energy SourcesJRC Joint Research Centre of the European CommissionkWh Kilowatt HourLCPD Large Combustion Plant DirectiveLHV Lower Heating ValueLNG Liquid Natural GasMCR Maximum Continuous RatingMS Member State(s)MWh Megawatt HourNER New Entrants’ ReserveNOx Nitrogen OxideNREAP National Renewable Energy Action PlanOCGT Open Cycle Gas TurbineOT Once-ThroughPC Pulverised CoalPV PhotovoltaicsR&D Research and DevelopmentRD&D Research, Development and DemonstrationRES Renewable Energy SourcesRoR Return on InvestmentSCC Siemens Combined CycleSCR Selective Catalytic ReductionSNCR Selective Non-Catalytic ReductionSOx Sulphur OxideTWh Terawatt HourTYNDP Ten Year Development PlanUSC Ultra-Supercritical

Bibliography
• BET (2013), “Möglichkeiten zum Ausgleich fluktuierender Einspeisungen aus Erneuerbaren Energien”
• Delors et al. (2011), “Towards a European Energy Community: A Policy Proposal”
• DG Energy (2013a), “EU Energy Trends to 2050”
• DG Energy (2013b), “Capacity Mechanisms in Individual Markets within the IEM”
• ENTSO-E (2013), “2030 Visions”
• EPPSA (2013), “Energy Supply for Europe – Facts and Perspectives”
• Eurelectric (2009), “Power Choices: Pathways to Carbon-Neutral Electricity in Europe by 2050”
• Eurelectric (2013), “10 CEOs Push for EU Energy Policy to Change Direction”
• Eurelectric (2013), “Power Statistics and Trends 2013”
• European Climate Foundation (2011), “Power Perspectives 2030: On the Road to a Decarbonised Power Sector”
• European Commission (2006), “A European Strategy for Sustainable, Competitive and Secure Energy”, COM(2006) 105 final
• European Commission (2007), “An Energy Policy for Europe”, COM(2007) 1 final
• European Commission (2011), “Energy Roadmap 2050”, COM(2011) 885 final
• European Commission (2013), “Green Paper: A 2030 Framework for Climate and Energy Policies”, COM(2013) 169 final
• European Commission (2013), “Delivering the internal electricity market and making the most of public intervention”, COM(2013) 7243 final
• Eurostat, 2013
• Greenpeace (2010), “Energy (R)Evolution: Towards a Fully Renewable Energy Supply in the EU-27”
• JRC (2009), “Future Fossil Fuel Electricity Generation in Europe: Options and Consequences”
• Kakaras et al. (2013), “Solutions from the European Power Plant Suppliers’ Perspective”
• Treaty on the Functioning of the European Union (2009)
• VDE (2012), “Erneuerbare Energie braucht flexible Kraftwerke – Szenarien bis 2020”
EPPSAEuropean Power Plant Suppliers Association
AvenueAdolpheLacomblé59B-1030 Brussels
phone+3227432986fax+3227432990
www.eppsa.eu
www.eppsa.eu