Episode Payment Models Final Rule & Analysis
28
© 2017 DataGen. May not be reproduced or distributed without prior written permission. Episode Payment Models Final Rule & Analysis February 15, 2017
Transcript of Episode Payment Models Final Rule & Analysis

© 2017 DataGen. May not be reproduced or distributed without prior written permission.
Episode Payment Models Final Rule & Analysis
February 15, 2017

© 2017 DataGen. May not be reproduced or distributed without prior written permission.
Agenda
• Overview
• Changes from Proposed Rule
• Categorization of Episodes
• Episode Attribution
• Reconciliation
• Quality Performance
• Cardiac Rehab Incentive Program
• Data Analysis
• Q&A

© 2017 DataGen. May not be reproduced or distributed without prior written permission.
Overview
Mandatory • All hospitals in selected MSAs must participate
• Few exclusions (CAHs and BPCI participants in the same DRGs)
• Surgical Hip/Femur Fracture (SHFFT): DRGs 480-482
• Cardiac
AMI DRGs 280-282
PCI DRGs 246-251 with AMI diagnosis
CABG DRGs 231-236
Modifies CJR to align with EPM
Effective July 1, 2017 • 4.5 years (July 1, 2017- December 31, 2021)

© 2017 DataGen. May not be reproduced or distributed without prior written permission.
Overview
90 day episode bundles • Begin with acute care stay
• Episodes/bundles include initial inpatient acute stay plus all Medicare
FFS Part A and Part B covered services for 90 days post-discharge
• Some exceptions for CMS identified unrelated services/diagnoses
• All providers continue to receive FFS payments as usual
• FFS payments are retrospectively reconciled to targets
Hospitals “own” the bundles • At risk for Medicare spending in excess of targets
• Rewarded for Medicare spending below targets
• Quality metrics must be met
• Gainsharing with physicians and partner providers is allowed

© 2017 DataGen. May not be reproduced or distributed without prior written permission.
EPM Beneficiaries
Beneficiaries included Medicare FFS as primary payer (no MA coverage)
Enrolled in both Part A and B the during the entire episode
Does not have ESRD Medicare coverage
Not covered under United Mine Workers of America health plan
Not aligned to:
• Next Gen ACO
• Comprehensive ESRD Care Initiative ACO with downside risk
• MSSP Track 3
Not already in any BPCI model episode

© 2017 DataGen. May not be reproduced or distributed without prior written permission.
Final Rule Updates EPMs PR EPMs FR
Selected MSAs 67 for SHFFT; 98 for CAD TBD 67 for SHFFT; 98 for Cardiac
Target Structure by DRG
• By DRG with chaining • AMI stratification for CABG
readmission DRG • CABG stratification for index
admission with AMI or MCC
• By DRG • Same • Same
Waivers SNF Waiver on or after April 1, 2018; not available for CABG or
SHFFT Same
Risk Sharing (Financial Arrangements)
Adds the ability to collaborate with CAHs and ACOs
Same
Data Availability Summary and Claims upon
request Same

© 2017 DataGen. May not be reproduced or distributed without prior written permission.
Final Rule Updates – Targets
EPMs PR EPMs FR
Discount
PY 1: No downside risk 3% PY 2-5 3% Adjusted for quality performance
PY 1: Same PY 2: Voluntary downside risk 3% PY 3-5: 3% Adjusted for quality performance
Hospital Specific vs. Regional
PY 1,2 – 1/3 Region; 2/3 Hospital PY 3 – 2/3 Region; 1/3 Hospital PY 4,5 – 100% Region
Same
Baseline 3 Year Baseline CY 2013-2015;
updated every other year Same
Treatment of reconciliation payments and repayments
Included in update of baseline Same
Episode cancellation
When beneficiary dies during anchor stay or if beneficiary
initiates any BPCI episode at any time during an EPM episode
When beneficiary dies at any point during episode or if beneficiary initiates any BPCI episode at any
time during an EPM episode

© 2017 DataGen. May not be reproduced or distributed without prior written permission.
Final Rule Updates – Targets
EPM FR EPMs PR
VBP, HAC, Readmissions Adjusted out of both targets
and performance Same
Wage Adjustment
Adjusted out of individual claims at provider specific level;
added back at attributed hospital, 70% labor share
Same
Prospective Announce prior to start of each
quarter; changing Oct.1 and Jan.1 of each CY
Same
Operating and Capital Includes operating and capital
payments Same
© 2017 DataGen. May not be reproduced or distributed without prior written permission.
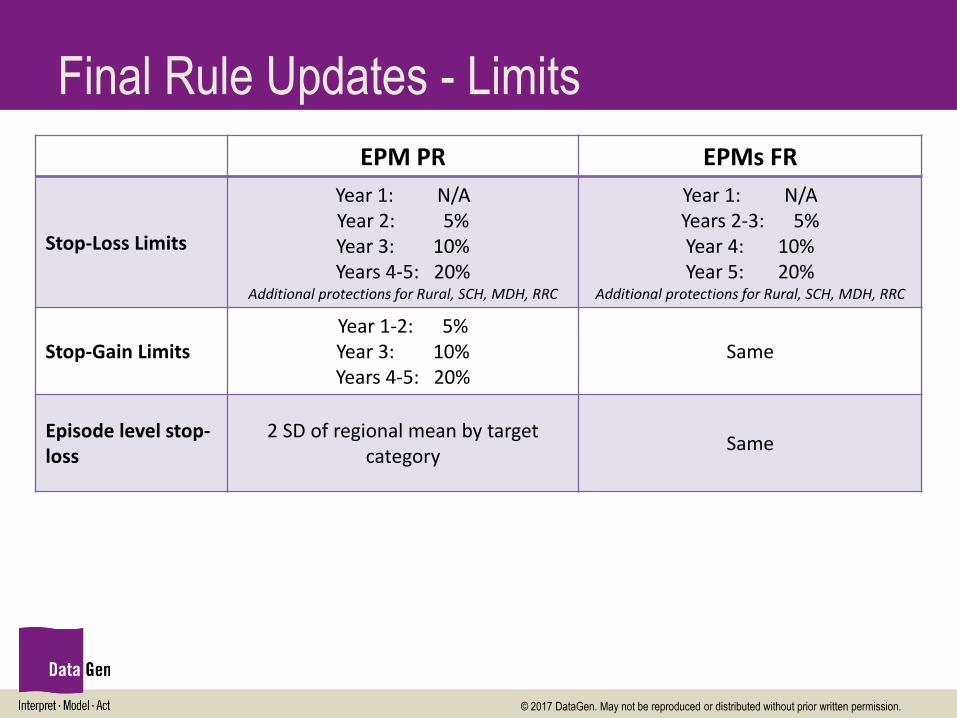
Final Rule Updates - Limits
EPM PR EPMs FR
Stop-Loss Limits
Year 1: N/A Year 2: 5% Year 3: 10% Years 4-5: 20%
Additional protections for Rural, SCH, MDH, RRC
Year 1: N/A Years 2-3: 5% Year 4: 10% Year 5: 20%
Additional protections for Rural, SCH, MDH, RRC
Stop-Gain Limits Year 1-2: 5% Year 3: 10% Years 4-5: 20%
Same
Episode level stop-loss
2 SD of regional mean by target category
Same

© 2017 DataGen. May not be reproduced or distributed without prior written permission.
Final Rule Updates - Quality
EPM PR EPMs FR
SHFFT Measures TKA Complications, HCAHPS,
Voluntary Patient Reported Outcomes Same
Cardiac Measures
AMI: Mortality, Excess Days Acute Care, HCAHPS, Voluntary hybrid
mortality; CABG: Mortality, HCAHPS
Addition CABG: Composite CABG voluntary data submission
Quality Performance
Quality Composite Score: Performance + Improvement+
Voluntary Measure
Must meet a minimum score on composite measure for reconciliation; Discount percentage varies by score.
Same

© 2017 DataGen. May not be reproduced or distributed without prior written permission.
No More Chaining

© 2017 DataGen. May not be reproduced or distributed without prior written permission.
Hospital Attribution For Transfers

© 2017 DataGen. May not be reproduced or distributed without prior written permission.
Reconciliation
Price DRG and Stratifier
Performance Period Episode
Count (a)
Performance Period Episode
Target $ (b)
Total Performance
Target $ (a*b)
Total Actual Performance $
(c)
Reconciliation Amount $ ([a*b]-c)
AMI 281 w/o CABG
Readmission 100 $24,000 $2,400,000 $2,200,000 $200,000 AMI 280 w/o
CABG Readmission 10 $40,000 $400,000 $550,000 -$150,000
Hospital A Total 110 $24,455 $2,800,000 $2,750,000 $50,000
• Providers continue to bill and will be paid as usual
• First reconciliation will take place 3 months after the end of the first
performance year.
• Final reconciliation will take place 12 months later to ensure all claims run-
out is captured
• Same process for years 2 through 5

© 2017 DataGen. May not be reproduced or distributed without prior written permission.
Quality
Composite score methodology
• Based on each hospital’s performance compared to the nation
• Hospitals earn points for each measure
• Measure scores are individually weighted
Transparency
• Data is reported on Hospital Compare
• 30-day preview period

© 2017 DataGen. May not be reproduced or distributed without prior written permission.
Cardiac Rehabilitation Incentive Payments
• Encourages the use of Cardiac Rehab and Intensive
Cardiac Rehab following AMI or CABG
• Effective: July 1, 2017 – December 31, 2021
• 90 MSAs: 45 MSAs overlap with EPM
• HCPCS codes: 93797,93798,G0422,G0423
• Physician claim with POS code 11 or Outpatient claim
• Visits 1-11: $25 per visit, 12th + visit $175 per visit; paid
retrospectively on an annual basis

© 2017 DataGen. May not be reproduced or distributed without prior written permission.
Analysis

© 2017 DataGen. May not be reproduced or distributed without prior written permission.
Data Source
CYs 2013-2015 Medicare SAF Inpatient PPS including capital
Hospital outpatient PPS
Home health PPS
Skilled nursing facility PPS
Inpatient rehab PPS
Hospice
DME (5% national sample extrapolated)
Physician and other Part B services (5% national sample extrapolated)
Regional benchmarks Census Region
Wage adjusted to hospital wage index
Cells<11 redacted per CMS Data Use Agreement

© 2017 DataGen. May not be reproduced or distributed without prior written permission.
Exclusions
Beneficiaries • Medicare Advantage enrollees
• Those without both Part A and Part B
• Medicare ESRD enrollees
• Deaths during the episode
Payment adjustments • Medicare Indirect Medical Education (IME)
• Medicare Disproportionate Share Hospital (DSH)
• Value Based Purchasing
• Hospital Readmissions Reduction Program penalty
• Hospital-Acquired Conditions penalty

© 2017 DataGen. May not be reproduced or distributed without prior written permission.
Estimated Impact • AMI model: AMI MS-DRGs 280-282 and those Percutaneous
Coronary Intervention (PCI) MS-DRGs 246-251 also containing AMI
diagnosis codes
• CABG model: MS-DRGs 231-236
• SHFFT model: MS-DRGs 480-482
© 2017 DataGen. May not be reproduced or distributed without prior written permission.
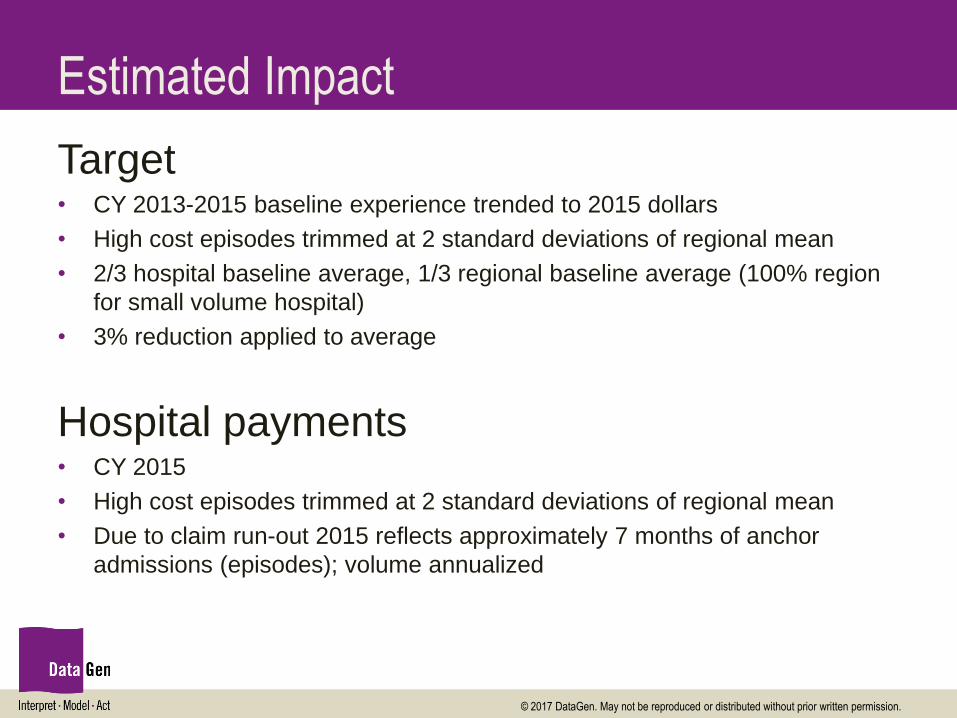
Estimated Impact
Target • CY 2013-2015 baseline experience trended to 2015 dollars
• High cost episodes trimmed at 2 standard deviations of regional mean
• 2/3 hospital baseline average, 1/3 regional baseline average (100% region
for small volume hospital)
• 3% reduction applied to average
Hospital payments • CY 2015
• High cost episodes trimmed at 2 standard deviations of regional mean
• Due to claim run-out 2015 reflects approximately 7 months of anchor
admissions (episodes); volume annualized

© 2017 DataGen. May not be reproduced or distributed without prior written permission.
Comparative Reports
Hospital payments • CY 2015 average by model (AMI, CABG, SHFFT)
• Average Payment NOT trimmed for high cost episodes
• Volume annualized
Regional payments • CY 2015 average by model (AMI, CABG, SHFFT)
• Average Payment NOT trimmed for high cost episodes
• Volume annualized
• Case mix adjusted to match hospital episode mix
• Hospital wage index applied

© 2017 DataGen. May not be reproduced or distributed without prior written permission.
Comparative Reports

© 2017 DataGen. May not be reproduced or distributed without prior written permission.
Comparative Reports
Numerator = total episode costs by claim type
Denominator Units = claims or days for SNF or visits for Home
Health
Denominator Total Episodes (230 in this example)

© 2017 DataGen. May not be reproduced or distributed without prior written permission.
Comparative Reports
80% of
Episode
35% of
Episode

© 2017 DataGen. May not be reproduced or distributed without prior written permission.
Comparative Reports
• Regional Average minus 3%: $55,600
• Average PAC spend $12,200
• Hospital would need to reduce average by ~ $3,000 to
break even

© 2017 DataGen. May not be reproduced or distributed without prior written permission.
Comparative Reports
Why is my anchor admission average more than the region’s?
More inpatient acute high cost outliers than the region
© 2017 DataGen. May not be reproduced or distributed without prior written permission.
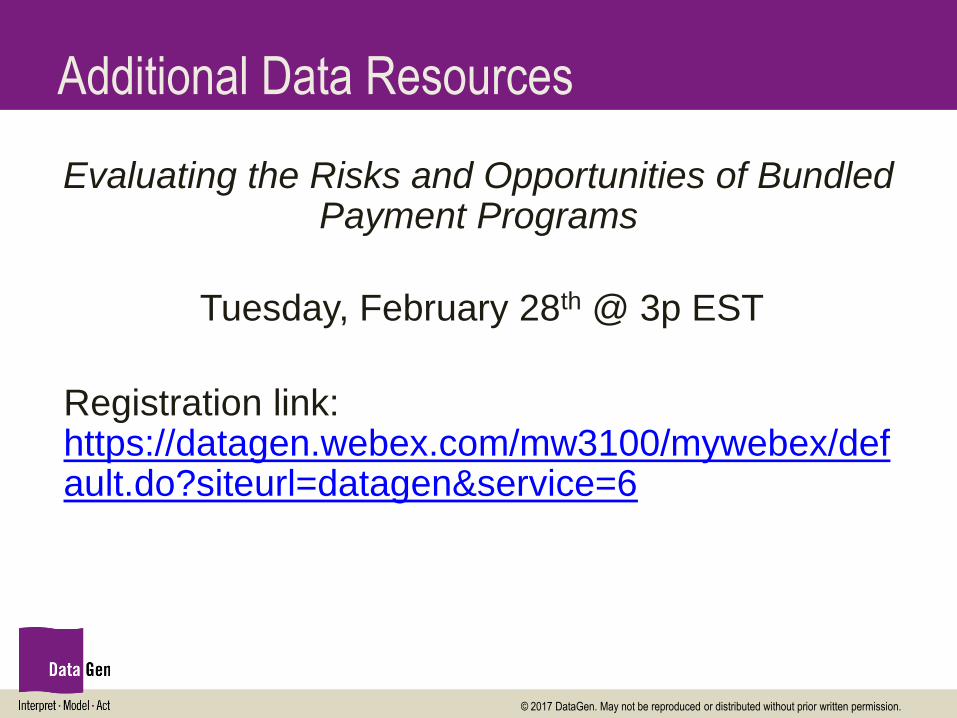
Additional Data Resources
Evaluating the Risks and Opportunities of Bundled Payment Programs
Tuesday, February 28th @ 3p EST
Registration link: https://datagen.webex.com/mw3100/mywebex/default.do?siteurl=datagen&service=6

© 2017 DataGen. May not be reproduced or distributed without prior written permission.
Contacts
Kelly Price Vice President and Chief of Healthcare Analytics
(518) 431-7629 [email protected]
Darcie Hurteau Director, DataGen Group
(518) 431-7695 [email protected]
Susan McDonough Senior Director, KeySTATS National
(518) 431-7710 [email protected]
27