
EPISODE 3 - · PDF fileFigure B-12 – 20-Nov-09 – Predicted Level = f(t) during...
46
Episode 3 D6.5-01b - Annex B to Technological Enablers Consolidated Validation Report - Air Ground Initial 4D Management Version: 2.00 Page 1 of 46 Issued by the Episode 3 consortium for the Episode 3 project co-funded by the European Commission and Episode 3 consortium. EPISODE 3 Single European Sky Implementation support through Validation Document information Programme Sixth framework programme Priority 1.4 Aeronautics and Space Project title Episode 3 Project N° 037106 Project Coordinator EUROCONTROL Experimental Centre Deliverable Name Annex B to Technological Enablers Consolidated Validation Report - Air Ground Initial 4D Management Deliverable ID D6.5-01b Version 2.00 Owner S. VIEYRES, J.-E. DERAET, X. JOURDAIN AIRBUS Contributing partners AIRBUS THALES AIR SYSTEMS THALES AVIONICS
Transcript of EPISODE 3 - · PDF fileFigure B-12 – 20-Nov-09 – Predicted Level = f(t) during...

Episode 3
D6.5-01b - Annex B to Technological Enablers Consolidated Validation Report - Air Ground Initial 4D
Management
Version: 2.00
Page 1 of 46
Issued by the Episode 3 consortium for the Episode 3 project co-funded by the European Commission and Episode 3 consortium.
EPISODE 3 Single European Sky Implementation support through Validation
Document information
Programme Sixth framework programme Priority 1.4 Aeronautics and Space
Project title Episode 3
Project N° 037106
Project Coordinator EUROCONTROL Experimental Centre
Deliverable Name Annex B to Technological Enablers Consolidated Validation Report - Air Ground Initial 4D Management
Deliverable ID D6.5-01b
Version 2.00
Owner
S. VIEYRES, J.-E. DERAET, X. JOURDAIN AIRBUS
Contributing partners
AIRBUS
THALES AIR SYSTEMS
THALES AVIONICS

Episode 3
D6.5-01b - Annex B to Technological Enablers Consolidated Validation Report - Air Ground Initial 4D
Management
Version: 2.00
Page 2 of 46
Issued by the Episode 3 consortium for the Episode 3 project co-funded by the European Commission and Episode 3 consortium.
- This page is intentionally blank -
Episode 3
D6.5-01b - Annex B to Technological Enablers Consolidated Validation Report - Air Ground Initial 4D
Management
Version: 2.00
Page 3 of 46
Issued by the Episode 3 consortium for the Episode 3 project co-funded by the European Commission and Episode 3 consortium.
DOCUMENT CONTROL
Approval
Role Organisation Name
Document owner AIRBUS Sabine VIEYRES
Technical approver AIRBUS Patrick LELIEVRE
Quality approver EUROCONTROL Catherine PALAZO
Project coordinator EUROCONTROL Philippe LEPLAE
Version history
Version Date Status Author(s) Justification - Could be a
reference to a review form or a comment sheet
1.00 18/12/2009 Approved S. VIEYRES, J.-E. DERAET, X. JOURDAIN
Approved by the Episode 3 consortium
2.00 12/04/2010 Approved P. LELIEVRE J.-E. DERAET
Approved by the Episode 3 consortium

Episode 3
D6.5-01b - Annex B to Technological Enablers Consolidated Validation Report - Air Ground Initial 4D
Management
Version: 2.00
Page 4 of 46
Issued by the Episode 3 consortium for the Episode 3 project co-funded by the European Commission and Episode 3 consortium.
TABLE OF CONTENTS
ANNEX B - AIR GROUND INITIAL 4D MANAGEMENT ......... ................................................ 6 B.1 OVERVIEW OF SCENARIOS ............................................................................................ 6 B.2 AIRBORNE EVALUATIONS .............................................................................................. 7
B.2.1 Summary of experiment and strategy planning ................................................. 7 B.2.2 Conduct of validation exercise runs................................................................... 8 B.2.3 Experiment results and analysis........................................................................ 9
B.3 GROUND EVALUATIONS .............................................................................................. 13 B.3.1 Summary of experiment and strategy planning ............................................... 13 B.3.2 Conduct of validation exercise runs................................................................. 14 B.3.3 Experiment results and analysis...................................................................... 15 B.3.4 Findings from evaluation by controllers ........................................................... 34 B.3.5 Conclusion ....................................................................................................... 36
B.4 QUESTIONNAIRE FILLED IN BY EUROCONTROL MUAC............................................. 39

Episode 3
D6.5-01b - Annex B to Technological Enablers Consolidated Validation Report - Air Ground Initial 4D
Management
Version: 2.00
Page 5 of 46
Issued by the Episode 3 consortium for the Episode 3 project co-funded by the European Commission and Episode 3 consortium.
LIST OF TABLES
Table 1 - Results of the WP6 exercises derived from Technical Validation Requirements execrise..... 37
Table 2 - Questionnaire filled in by EUROCONTROL MUAC ................................................................ 45
LIST OF FIGURES
Figure B-1 – Overview of the routes followed by the aircraft for Initial 4D experiments .......................... 6
Figure B-2 – Overview of the arrival in CDG TMA ................................................................................... 7
Figure B-3 – Predicted level during climb phase.................................................................................... 15
Figure B-4 – Differences on ETO during climb phase............................................................................ 16
Figure B-5 – Predicted Level = f(t) during climb phase, computed around 2 minutes after take-off...... 17
Figure B-6 – Differences on ETO during cruise phase........................................................................... 18
Figure B-7 – Differences on ETOs during cruise phase, computed around 2 minutes after take-off .... 19
Figure B-8 – 23-Mar-09 – Predicted Level = f(t) during descent phase ................................................. 21
Figure B-9 – 29-May-09 – Predicted Level = f(t) during descent phase ............................................... 22
Figure B-10 – 20-Nov-09 – Predicted Level = f(t) during descent phase, computed 2 min after take off........................................................................................................................................................ 23
Figure B-11 – 20-Nov-09 – Differences on ETOs during descent phase, computed around 2 min after take-off ............................................................................................................................................ 23
Figure B-12 – 20-Nov-09 – Predicted Level = f(t) during descent phase, computed around TOD, 31 min before landing ................................................................................................................................. 24
Figure B-13 – 20-Nov-09 – Predicted Level = f(t) before and after a route change............................... 26
Figure B-14 – 20-Nov-09 – Predicted 2D trajectory before and after a route change ........................... 26
Figure B-15 – 20-Nov-09 – Predicted 2D trajectory before and after a route change – zoomed on RETNO LASUR .............................................................................................................................. 27
Figure B-16 – 20-Nov-09 – Predicted 2D trajectory in arrival to LFPG .................................................. 27
Figure B-17 – Level=f(t) during descent phase, RTA on LARPO........................................................... 29
Figure B-18 – Level = f(t)........................................................................................................................ 30
Figure B-19 – Differences on ETOs during descent phase, RTA on LARPO ........................................ 30
Figure B-20 – Level=f(t) during descent phase, RTA on SOLBA........................................................... 33
Figure B-21 – Differences on ETOs during descent phase, RTA on SOLBA ........................................ 33

Episode 3
D6.5-01b - Annex B to Technological Enablers Consolidated Validation Report - Air Ground Initial 4D
Management
Version: 2.00
Page 6 of 46
Issued by the Episode 3 consortium for the Episode 3 project co-funded by the European Commission and Episode 3 consortium.
ANNEX B - AIR GROUND INITIAL 4D MANAGEMENT
B.1 OVERVIEW OF SCENARIOS
The following figures summarise the scenarios used for the Initial 4D function evaluation (scenario 4 in EP3 D6.4-01).
The dark blue path represents the route followed by the EPOPEE aircraft in the scenario. From LIMGO, it is overlapped by the flight path (yellow) of another flight that merged on this point to then follow the same route until the arrival.
Figure B-1 – Overview of the routes followed by the aircraft for Initial 4D experiments

Episode 3
D6.5-01b - Annex B to Technological Enablers Consolidated Validation Report - Air Ground Initial 4D
Management
Version: 2.00
Page 7 of 46
Issued by the Episode 3 consortium for the Episode 3 project co-funded by the European Commission and Episode 3 consortium.
Figure B-2 – Overview of the arrival in CDG TMA
B.2 AIRBORNE EVALUATIONS
B.2.1 Summary of experiment and strategy planning
B.2.1.1 Objectives
The working session of Initial 4D was performed in March 2009.
The main objective of this test was to assess the Initial 4D functionality relevance in regards to the ATM concept of operations. Secondary objective was to verify operational acceptance from a flight crew perspective and identify potential issues related to the function design.
The main operational issues addressed during the evaluation campaign are related to:
• Global integration of Initial 4D function with other tasks performed by the crew and with the other functions available in the cockpit
• Aircrew task sharing in the context of the Initial 4D procedure
• Control Initial 4D usability and information usability regarding use of the MCDU, DCDU, and Navigation Display during the 4D trajectory negotiation, execution and synchronization with ATC
B.2.1.2 Evaluation Protocol
The evaluation medium is the EPOPEE research simulator, (mock-up cockpit simulating an A340-600 environment) using THALES SIMULATED FMS capable of Initial 4D and ASAS S&M manoeuvres. EPOPEE is coupled with EUROCAT THALES ATM ground station allowing to model air traffic.

Episode 3
D6.5-01b - Annex B to Technological Enablers Consolidated Validation Report - Air Ground Initial 4D
Management
Version: 2.00
Page 8 of 46
Issued by the Episode 3 consortium for the Episode 3 project co-funded by the European Commission and Episode 3 consortium.
B.2.1.3 Evaluation Methodology:
The assessment methodology is principally qualitative.
For data collection purposes:
• Interviewed pilots evaluate the function into a simulated operational environment;
• Relevant facts noticed during flights are written down
• Pilots comments are gathered together during a debriefing session
• All data collected through the test and the debriefing are analyzed.
• Recorded parameters are analyzed to evaluate the performance of the algorithm, the impact on the passenger’s comfort, the HMI performance.
• Once collected, data are analyzed in order to release appropriate recommendations if necessary.
B.2.2 Conduct of validation exercise runs
The global duration of the exercise is about 4 hours (3 hours inside the simulator). Each test is divided into 3 parts: Training the participating pilots, playing the scenarios, and debriefing.
Training
A briefing on operational context and the function to be evaluated is provided to the interviewed pilots before entering the simulator (duration 15 minutes). This briefing explains the test objectives, presents the current limits of the configuration used for the evaluation and the planning of the test.
Inside the simulator, additional interactive training is provided to present the interfaces of the function to be evaluated (duration 15 minutes).
Training duration: 30 minutes (15’ + 15’).
Scenarios
The main scenario consisted in an end-of-cruise and descent phase towards northern runway 09L of Roissy CDG airport, coming from the south (LFMN) and east. Due to time constraints, scenarios were restricted to the flight starting about 20 minutes before the Top of Descent, and ending after sequencing the RTA waypoint.
Three different flights were played, where the following event occurred:
• The first scenario showed a nominal situation with Initial 4D function. Pilots made an AOC wind / temp request. The RTA remained “made” and thrust were adjusted by the algorithm to handle unpredicted winds and wind gusts
• The second scenario showed a particular situation requiring re-negotiation. Pilots made an AOC wind/temp request. The RTA became missed because of unpredicted tail winds (+15kts) and was negotiated by voice.
Assessment team
5 flight crews were involved in this evaluation session including both test pilots and training pilots.
The assessment team was composed of the following:
• The flight crew: a pilot flying and a pilot not flying;
• Interviewers inside the cockpit: one main interviewer, a secondary interviewer and an HF interviewer;

Episode 3
D6.5-01b - Annex B to Technological Enablers Consolidated Validation Report - Air Ground Initial 4D
Management
Version: 2.00
Page 9 of 46
Issued by the Episode 3 consortium for the Episode 3 project co-funded by the European Commission and Episode 3 consortium.
• One or two observers inside the cockpit;
• Two to Three persons simulating ATC controllers and surrounding aircraft:
− 1 person managing the EUROCAT system (traffic generation, vectoring…)
− 1 person handling the communication of ATC (with EPOPEE and with other simulated aircraft): CPDLC and party-line
− 1 person managing the traffic generator
• 1 person managing the simulator.
Debriefing
A debriefing session was conducted inside the simulator so that the flight crew had the possibility to use the Basic 4D HMI to explain their positions.
A global 1h00 long debriefing was conducted in a meeting room to gather feedbacks from the pilots. A questionnaire prepared in advance by designers and human factors specialists was used to explore and evaluate the different aspects of the Basic 4D function. The debriefing was performed strictly in accordance with this questionnaire.
All data collected through the test and the debriefing were analyzed. Moreover, recorded parameters were used to assess the performance of the algorithm, the impact of the function on the passenger’s comfort, HMI performance and the impact on the fuel consumption.
These data were used to express recommendations to improve the design of the function.
B.2.3 Experiment results and analysis
B.2.3.1 Global feedback
The flight crews’ comments on these topics were globally positive. All flight crews considered the Initial 4D airborne function (and the Initial 4D trajectory concept of operation) as globally acceptable.
It was also agreed that the task sharing between pilot and co-pilot under RTA was not significantly altered compared to today’s task sharing.
However, expected benefits could not be assessed on a single aircraft basis, and should take into account the overall ATM system.
The main validated points were:
• The overall usability of the function (including the usage of data link for clearance exchanges) was acceptable,
• The RTA algorithm’s behaviour was acceptable,
• Flight crews have to inform ATC when the RTA becomes unavailable with a margin,
• Task sharing under RTA is not altered compared to today’s task sharing,
• Workload is not increased when flying the RTA,
• The provision of the achievable earliest and latest times to the flight crew is necessary so as to be able to assess the acceptability of the RTA.
However, some items were identified as requiring evolutions and further tests. These comprise:
• The Initial 4D operation shall be refined in order to ease its integration in current onboard tasks and procedures;

Episode 3
D6.5-01b - Annex B to Technological Enablers Consolidated Validation Report - Air Ground Initial 4D
Management
Version: 2.00
Page 10 of 46
Issued by the Episode 3 consortium for the Episode 3 project co-funded by the European Commission and Episode 3 consortium.
• Improving the awareness of the pilot on the RTA driven speed management and monitoring aids of the RTA,
• Feedback on time constraint becoming unachievable should be more alerting,
• Meteo data update should be automated.
B.2.3.2 Detailed Results
Route clearance
The route clearance handling and negotiation using CPDLC, existing FANS A definition and the loading of route clearances into the FMS was well appreciated. It was considered as easy to use and did not increase the flight crew workload.
As a consequence of some limitations on the simulator, the route clearances were loaded into the temporary flight plan. This did not disturb flight crews and some of them also pointed out that this might avoid erasing a previously prepared secondary flight plan when loading the clearance.
On reception of the route clearance data link message, several flight crews used the CPDLC STANDBY temporary response so as to have enough time to verify the proposed route before accepting. A 100 sec pilot response timer, compliant with the current interoperability requirements for continental environment, was implemented. These evaluations showed that this timer is too short and does not allow pilots to validate the received route clearance before answering to the ATC.
It has to be noted that the onboard timer will be removed in the future FANS standards for continental areas due to an evolution of future interoperability document. However, a ground timer will remain mandated in order to alert the controller if no pilot answer has been received within a predefined time. These evaluations showed that this ground timer should be adapted to the pilots’ operational need (given them enough time for analysing a route clearance).
Meteo data
Once the route clearance has been loaded, a new trajectory is built and the ETAs are computed using the available MET data. So as to guarantee prediction accuracy compliant with the performance objectives, the MET data have to be updated.
The flight crews agreed that the HMI for MET data and the procedure to update MET data are comprehensible.
Four crews considered having no added value in requesting manually a MET data uplink. Moreover, the flight crew has no way to validate the MET data, except in the case of obviously wrong data (wind speed out of possible range).
The MET data update request should be automated. However, the manual uplink request command should be kept.
Although a fully automated update could be implemented (with flight crew feed back), it appears preferable to keep the pilot in the loop: flight crew will still have to insert the uploaded data into the FMS. This allows the possibility to check the received data.
Time Constraint Negotiation
All the flight crews appreciated the transparent request (ADS-C) from the ATC of the ETAmin and ETAmax on waypoints of the trajectory.
When receiving the time constraint from ATC (CROSS [waypoint] AT [time]), pilots had the possibility to load the constraint. The loading of the time constraint was well considered easy to use and prevent from any error. Moreover, the principle of loading the time constraint for validation before accepting it was accepted.
In order to accept a time constraint, Flight Crews used the ETA min and ETA max provided by the FMS on the RTA page. The overall content and presentation of the RTA page was well appreciated and all the necessary information was available.

Episode 3
D6.5-01b - Annex B to Technological Enablers Consolidated Validation Report - Air Ground Initial 4D
Management
Version: 2.00
Page 11 of 46
Issued by the Episode 3 consortium for the Episode 3 project co-funded by the European Commission and Episode 3 consortium.
The possibility to upper limit the RTA algorithm to a Vmax value was well understood and accepted.
The availability of earliest and latest information was well appreciated. Without these values, it would have been difficult if not impossible for pilots to assess the acceptability of the proposed RTA in compliance with the accuracy objectives, if the RTA is not close to the ETA. However, the real meaning of these two values was not easily understandable as they include some margins to meet the 95% success ratio requirement.
The design on SA/LR required two pushes to access the RTA page (on MCDU keys) away from the FPLN page. It was not considered as satisfactory. Design on A380 and A350 is simpler. It was recommended to improve the access to RTA page on SA/LR, if it is to be used for Basic 4D.
Flying the trajectory down to the RTA waypoint
The pilots considered the behaviour of the aircraft under RTA speed management (in full managed mode) was acceptable. They appreciated the information RTA CI on FMS PERF page, indicating that the management mode is RTA driven and it was recommended to generalize the information “RTA CI” of the PERF page on all FMS.
It was also noted that the full-managed mode is more and more used in operation, confirming the hypothesis used for Basic 4D.
Once the RTA waypoint has been sequenced, it seems preferable to switch back to the preceding CI. However, the speed at which the aircraft should fly once the RTA waypoint is sequenced is not obvious and depends on external factors (ATC, speed constraints, etc.).
In any case, the adopted strategy should aim at maintaining the ETA on the next waypoints unchanged.
Pilots have the responsibility to ensure that the ATC is informed of a constraint that cannot be met. Thus, it was confirmed that the flight crews have to inform (by voice or datalink) that the RTA cannot be achieved.
Two flight crews switched from the full-managed mode to selected speed when the RTA became unachievable so as to override the Vmax value. This was due to the negative impact expected by the pilot if the RTA is not achieved. Pilots did not changed the VMAX value as the RTA page access is not easy) compared to selected speed.
As a consequence, the ETA will be computed taking some assumptions, in particular on when the pilot will return in full managed mode and the downlinked trajectory will tag these ETA as less accurate. It is anticipated that the ATC may not make use of this information.
In further evaluation, it should be checked if current predictions in selected speed are sufficient, and if not, how they could be enhanced.
RTA indication in primary field of view
Although some HMI elements indicated that an RTA was entered in the active flight plan (e.g. RTA CI in PERF page) pilot’s awareness of the RTA driven speed management could be enhanced.
It was recommended to provide more RTA information on the primary field of view.
RTA becomes unachievable
All flight crews pointed out that the feedback when the RTA becomes unachievable was not alerting enough.
As a reminder, when the RTA becomes unachievable:
A white scratchpad message “TIME ERROR AT [waypoint]” is displayed,
On MCDU FPLN page, the star next to the time estimate becomes amber,
On Navigation Display, the circle around the RTA waypoint becomes amber (if EFIS CP on constraint),
On MDCU RTA page, a RTA ERROR label and value is displayed.

Episode 3
D6.5-01b - Annex B to Technological Enablers Consolidated Validation Report - Air Ground Initial 4D
Management
Version: 2.00
Page 12 of 46
Issued by the Episode 3 consortium for the Episode 3 project co-funded by the European Commission and Episode 3 consortium.
���� It is recommended to improve the flight crew aware ness regarding to “missed” RTA.
Moreover, the condition leading to the display of a missed RTA message should be protected against unstable situations: colour code or message should not appear and disappear continuously.

Episode 3
D6.5-01b - Annex B to Technological Enablers Consolidated Validation Report - Air Ground Initial 4D
Management
Version: 2.00
Page 13 of 46
Issued by the Episode 3 consortium for the Episode 3 project co-funded by the European Commission and Episode 3 consortium.
B.3 GROUND EVALUATIONS
B.3.1 Summary of experiment and strategy planning
Ground Data recorded in EUROCAT during Initial Scop e
The analysis mainly uses following data recorded by the Flight Data Processing:
•••• 4D trajectory computed by the FDP, recorded on every modification of the flight data record representing internally the flight plan,
•••• 4D trajectory downlinked by the EPOPEE aircraft: the 4D trajectory is received in every ASTERIX category 62 messages sent by the aircraft every 4 seconds but the trajectory provided by the ATSU is really updated by the aircraft periodically (every minute for this experiment) and on event (2D route change, evolution of predicted altitude or time over a point above a defined threshold),
•••• Downlinked Aircraft Parameters (DAP) are recorded with the downlinked 4D trajectory,
•••• Automatic Position Reports (APR), generated in the EUROCAT cyclically (every about 120 seconds during experiments, depending on offline parameters) and each time the aircraft crosses a waypoint; the APR contains the position, altitude and time. This data is extracted from the ASTERIX cat 62 messages,
• CPDLC messages exchanged with the EPOPEE aircraft: they are indicators to know when requests and clearances (such as request for ETA min/max, reply, CTA clearance etc…) were processed on board.
When did the experimentation take place? :
The results that are analysed in this document have been gathered from:
• The experimentation of the 23rd of March 2009 (Eval N°3) Scenario 2_a. The experimentation took place from 20' - 30' before TOD (en En-Route and Approach phases) to a few minutes after LARPO. It includes two main events that have a significant impact on the 4D trajectory flown by the aircraft:
− First use of the aircraft 4D trajectory, either when this 4D trajectory is received in the ground system for the first time or after a change of route (during march experiments, the flight, that originally flown to LARPO via OMAKO is given a new route from LASAT via UN852 to LIMGO, then RENSA and the STAR RENS4E, rejoining its former route at LARPO).
Application, while the flight is still in cruise, of a CTA on the point LARPO, delaying the time of crossing on this point of about 40 seconds.
• A complementary experiment performed the 28th-29th of May 2009. For this experiment the flight started from Nice (see figure further below). This allowed receiving and processing from the FMS a complete trajectory, including climbing and cruising phases. The event that could be analysed the week following this experiment is the first receipt of a downlinked 4D trajectory.
• Another complementary experiment performed the 20th of November 2009 with the same flight starting from Nice. A complete trajectory, including climbing, cruising and descending phases, was received from the FMS. It includes two main events that have a significant impact on the 4D trajectory flown by the aircraft:

Episode 3
D6.5-01b - Annex B to Technological Enablers Consolidated Validation Report - Air Ground Initial 4D
Management
Version: 2.00
Page 14 of 46
Issued by the Episode 3 consortium for the Episode 3 project co-funded by the European Commission and Episode 3 consortium.
− First use of the aircraft 4D trajectory, when this 4D trajectory is received in the ground system for the first time 2 minutes after take-off while the flight is performing the SID PERU2W from LFMN.
Application, while the flight is in cruise, of a CTA on the point SOLBA, bringing forward the time of crossing this point of 51 seconds.
B.3.2 Conduct of validation exercise runs
How did we analyse the impact of the downlinked 4D- Trajectory on the ground TP?
For this analysis, three events have been analysed in term of 4D trajectory prediction:
• Event 1: First receipt, a few minutes after take off, of a downlinked 4D trajectory conforming to the 2D route of the flight plan managed by EUROCAT (May and November 2009 experiments)
Before this receipt, the ground prediction was only based, as in a traditional EUROCAT system, on aircraft performances coming from BADA and on APR coming from the surveillance. We could therefore compare the Ground TP performance:
− Without using the airborne data, then
− Using the airborne data,
With only a few seconds interval between.
• Event 2: First receipt of a downlinked 4D trajectory conforming to the 2D route of the flight plan managed by EUROCAT, 45’ before arrival (March 2009 experiments), with the simulations beginning while the flight is already in cruise)
Before this receipt, the ground prediction is based, as in a traditional EUROCAT system, only on aircraft performances coming from BADA and on APR coming from the surveillance.
• Event 3: Application on board of an RTA corresponding to the CTA cleared to the pilot on LARPO (March 2009 experiment) or SOLBA (November 2009 experiment).
It is to be noted that during experiments, the Cruise True Air Speed input in the Flight Plan in the EUROCAT was 420 kts, less than the Cruise True Air Speed input in the FMS (Mach 0.78 which at FL360 is equivalent to about 448 kts). This has, as we will see all along the analysis, a direct impact on the ground TP performances for ETOs computation when the 4D downlinked trajectory is not used.
During November 2009 experiments, the Cruise True Air Speed input in the Flight Plan in the EUROCAT was closer (less than a difference of 10 kts) to the Cruise True Air Speed input in the FMS (Mach 0.81 which at FL360 is equivalent to about 465 kts).
For each of the analysed events, a comparison of the on board and ground 4D trajectory before and after the event has been performed.
Key:
The following abbreviations are displayed on the graphs further below:
• GB or Ground(n-1) : Dark green on the graphs . Trajectory Prediction of the Ground (EUROCAT) Flight Data Processing Before the event.
• GA or Ground(n) : Light Green on the graphs. Trajectory Prediction of the Ground (EUROCAT) Flight Data Processing After the event.
• AB or Air(n-1) : Dark Blue on the graphs. 4D Trajectory downlinked by the Airborne EPOPEE ATSU Before the event.

Episode 3
D6.5-01b - Annex B to Technological Enablers Consolidated Validation Report - Air Ground Initial 4D
Management
Version: 2.00
Page 15 of 46
Issued by the Episode 3 consortium for the Episode 3 project co-funded by the European Commission and Episode 3 consortium.
• AA or Air(n) : Light Blue on the graphs 4D Trajectory downlinked by the Airborne EPOPEE ATSU After the event.
The following sections analyse:
• The impacts on the ground TP of using the aircraft 4D-Trajectory in the 3 phases of flight (climb, cruise, descent)
• How the CTA set up and uplinked to the aircraft by EUROCAT, resulted in an updated downlinked 4D Trajectory and impacted the ground 4D-Trajectory.
Figure B-1 – Overview of the routes followed by the aircraft for Initial 4D experiments also defines (dark blue path) the waypoints mentioned in this document.
B.3.3 Experiment results and analysis
B.3.3.1 Use of aircraft 4D trajectory for Climb phase
Data used for the analysis on this phase has been recorded during the experiments of 28th-29th of May 2009 and 20th of November 2009.
During this experimentation, the same flight has been performed several times with on the ground a different ATOW (Actual Take Off Weight) input in the flight plan.
The first results provided below have been extracted from the flight where the Actual Take Off Weight input in the ATC system was similar or a little bit heavier (+10 tons) to the one simulated on board (170 tons).
28th-29th of May 2009 experiment:
Predicted Level
0
5000
10000
15000
20000
25000
30000
35000
40000
0 200 400 600 800 1000 1200
Time (seconds)
Leve
l (fe
et) Level Prediction Ground(n)
Level Prediction Ground(n-1)
Level Prediction Air(n)
(n-1) : before receiving the 4D from aircraft(n) : after receiving & processing the 4D
diff TOC(GB-AA)=1m14s
ATOW(Ground)=ATOW(Aircraft)=170 t
diff TOC(GA-AA)=16s
Figure B-3 – Predicted level during climb phase

Episode 3
D6.5-01b - Annex B to Technological Enablers Consolidated Validation Report - Air Ground Initial 4D
Management
Version: 2.00
Page 16 of 46
Issued by the Episode 3 consortium for the Episode 3 project co-funded by the European Commission and Episode 3 consortium.
Differences on ETOs
-40
-30
-20
-10
0
10
20
30
40
200 300 400 500 600 700 800 900 1000 1100 1200
Time (seconds)
Diff
eren
ces
on E
TO
s (s
econ
ds)
ETO differenceGround(n) vs Air(n)
ETO differenceGround(n-1) vs Air(n)
Figure B-4 – Differences on ETO during climb phase
Result Analysis
The ground prediction in climbing phase becomes very close from the FMS prediction for the climbing phase as soon as the downlinked 4D is taken into account.
Using the 4D downlinked trajectory, the difference of prediction in the altitude profile is always below 400 ft with an average of 200 ft to be compared respectively to 1700 ft with an average of 700 ft.
The Top Of Climb was estimated 1’14” later than the FMS prediction without the use of the aircraft 4D (mainly because around F230, the speed, reaching the cruise speed quite stopped to increase). The difference becomes 16” only once the FMS prediction is used, 15 minutes before the TOC thanks to a re-computation of rate of climb performances from the received 4D.
Until reaching F300, once the downlinked 4D trajectory is used in the EUROCAT, the difference on ETO’s between the Ground TP and the downlinked trajectory is never more than 5” as one can see on the above figure, thanks to re-computation of speed performances. Without using the downlink 4D trajectory, it is up to 40”.
During the analysis, a small problem in the algorithm has been reported: on route segment that precedes (from ~F300) the TOC, the speed used to compute the ETO’s is not the one deduced from the 4D downlinked trajectory. This is the reason of the increase of the ETO difference to 45” on the waypoint following the TOC.
It is to be noted that when the Take Off Weight input in the Ground System is similar to the real one, the Ground Prediction, based on BADA, does not diverge quickly from the FMS prediction. Some other trials have been done with on the ground a Take Off Weight different (medium load vs. low load) and in such case there is a much more important difference between profiles and therefore a much more important benefit of using the aircraft 4D trajectory.

Episode 3
D6.5-01b - Annex B to Technological Enablers Consolidated Validation Report - Air Ground Initial 4D
Management
Version: 2.00
Page 17 of 46
Issued by the Episode 3 consortium for the Episode 3 project co-funded by the European Commission and Episode 3 consortium.
20th of November 2009 experiment:
Figure B-5 – Predicted Level = f(t) during climb ph ase, computed around 2 minutes after take-off
Result Analysis:
As already shown in the graphs of May 2009 experiment, the ground prediction in climbing phase becomes very close from the FMS prediction for the climbing phase as soon as the downlinked 4D is taken into account.
The Ground curves are computed before and after the time of the first receipt of 4D trajectory around 2 minutes after take-off.
The climb profile predicted by the Ground System – curve Ground(n-1) –before receiving and processing from aircraft the downlinked 4D trajectory, is below the climb profile (i.e. the 4D trajectory intent data) – curve Air(n) –predicted by the FMS.
This difference of climb profiles is mainly due to the heavier ATOW (+10 tons) input in the Ground System than the real aircraft ATOW (170 tons). As a reminder, the heavier the aircraft is, the lower the Rate of Climb is. As a result, the TOC of curve Ground(n-1) happens 3’19” later than the aircraft predicted TOC – curve Air(n).
As soon as the Ground System – curve Ground(n) –receives and processes the downlinked 4D trajectory, its climb profile (including the TOC) prediction is enhanced, so the TOC difference is reduced to 16”. It shows that if Ground System does not know the real aircraft ATOW, this does not really matter for the climb profile prediction whenever the Ground System receives and processes the downlinked 4D trajectory.

Episode 3
D6.5-01b - Annex B to Technological Enablers Consolidated Validation Report - Air Ground Initial 4D
Management
Version: 2.00
Page 18 of 46
Issued by the Episode 3 consortium for the Episode 3 project co-funded by the European Commission and Episode 3 consortium.
B.3.3.2 Use of aircraft 4D trajectory in Cruise
As for Climb phase analysis, data used for the analysis on this phase has been recorded during the experiments of 28th-29th of May 2009 and 20th of November 2009.
The impact of the use of the downlink 4D trajectory on the cruise phase is observed in terms of ETOs on the points planned to be over flown En-Route.
28th-29th of May 2009 experiment:
Differences on ETOs
-100
0
100
200
300
400
500
600
900 1400 1900 2400 2900 3400 3900 4400
Time (seconds)
Diff
eren
ces
on E
TO
s (s
econ
ds)
ETO differenceGround(n) vs Air(n)
ETO differenceGround(n-1) vs Air(n)
TOCTOD
Figure B-6 – Differences on ETO during cruise phase
Result Analysis
Before the aircraft 4D trajectory is received, the ETOs computed by the flight data processing, based on a True Air Speed defined in the flight plan, which is 30 to 40 kts slower than the one of the FMS, derives obviously all along the cruise phase proportionally to the difference with the FMS planned speed. As soon as the downlinked 4D is taken into account (The Flight Data Processing uses the ETOs on the points between TOC and TOD to determinate a cruise speed), the ground prediction in cruising phase follows quite exactly the FMS prediction.
Note that the constant difference on ETOs between Ground FDP and Airborne FMS during the cruise phase (light green curve) is indeed the difference of about 45” that we had already near the Top of Climb.

Episode 3
D6.5-01b - Annex B to Technological Enablers Consolidated Validation Report - Air Ground Initial 4D
Management
Version: 2.00
Page 19 of 46
Issued by the Episode 3 consortium for the Episode 3 project co-funded by the European Commission and Episode 3 consortium.
20th of November 2009 experiment:
Figure B-7 – Differences on ETOs during cruise phas e, computed around 2 minutes after take-off
Result Analysis:
Differences on ETOS
The curves are computed before and after the time of the first receipt of 4D trajectory around 2 minutes after take-off.
Before the aircraft 4D trajectory is received, the ETOs computed by the flight data processing, based on a True Air Speed defined in the flight plan (465 kts), which is 8 kts faster than the one of the FMS (457 kts), derives obviously all along the cruise phase proportionally to the difference with the FMS planned speed. As soon as the downlinked 4D is taken into account (The Flight Data Processing uses the ETOs on the points between TOC and TOD to determinate a cruise speed), the ground prediction in cruising phase follows quite exactly the FMS prediction.
Note that the constant difference on ETOs between Ground FDP and Airborne FMS during the cruise phase (light green curve) is indeed the difference of about 8” that we had already near the Top of Climb.
B.3.3.3 Use of aircraft 4D trajectory for descent phase
Data used for the analysis on this phase were recorded during the experiments of 23rd of March 2009, 28th-29th of May 2009 and 20th of November 2009.
During March experimentations, the beginning of the scenario was always the following:
• Creation of the flight plan in parallel in the EUROCAT and in the FMS
• Starting of the flight simulation from a point of the on board flight plan Nice Paris. The starting of the simulation was in the vicinity of MOROK.
• As soon as the aircraft is moving, it starts to send to the EUROCAT ASTERIX Category 62 messages with two kind of information:
− Surveillance data (as usual data coming from a tracker type ARTAS)
− Aircraft Derived Data, with the 4D trajectory and some Downlinked Aircraft Parameters
• The EUROCAT uses first, via an APR, the 4D position received in surveillance data to update its TP. Then it begins to use the downlink 4D trajectory for updating its own 4D Trajectory Prediction.

Episode 3
D6.5-01b - Annex B to Technological Enablers Consolidated Validation Report - Air Ground Initial 4D
Management
Version: 2.00
Page 20 of 46
Issued by the Episode 3 consortium for the Episode 3 project co-funded by the European Commission and Episode 3 consortium.
• Until the route change is applied on board, making both routes, in FMS and in EUROCAT FDP, become consistent, the 4D Trajectory Prediction of the EUROCAT could not be updated correctly from downlinked 4D.
The analysis was therefore performed using the following data:
• 4D trajectory prediction computed by the ground system following the first receipt of the 4D position from the aircraft
• 4D trajectory received from the ATSU once the route change is applied
• 4D trajectory prediction computed by the ground system following this receipt.
The goal was to see how the use of the 4D TP received from the board enhances a ground 4D Trajectory prediction that was before updated only from automatic position reports. It is to be noted that there was about 5 minutes of delay between these two ground predictions. This correspond to the initial phase of experiment during which the FMS route was different from the one stored in the ground flight plan. This was only the case for March 2009 experiment.
Another element that has complicated the analysis for March and May 2009 experiments only was that there was not the same position in the ground and air databases for the runway threshold (about 10 NM difference). This leaded to differences in terms of distance to travel and therefore has an impact on the descent profile. The air database was updated accordingly to the AIP France data for November 2009 experiment to have the correct location of the runway threshold.
And another element to take into account is that for the March 2009 experiments the simulated aircraft had an Actual Take Off Weight (ATOW) that was sensibly lower than the one input in the flight plan on the EUROCAT (170t vs. 210t), instead of May 2009 experiments where the ATOW was identical (170t) and November 2009 experiment where the Ground System ATOW was higher (180t) than aircraft ATOW (170t).
All these difficulties and inaccuracies did not occur during the experiment of May where both aircraft had already the same planned route until the arrival runway when the aircraft begun to downlink the FMS 4D trajectory. Nevertheless during May 2009 experiments the flight was interrupted at the end of the climb phase and therefore the predictions on the descent phase were away from the TOD.

Episode 3
D6.5-01b - Annex B to Technological Enablers Consolidated Validation Report - Air Ground Initial 4D
Management
Version: 2.00
Page 21 of 46
Issued by the Episode 3 consortium for the Episode 3 project co-funded by the European Commission and Episode 3 consortium.
23rd March 2009 experiment:
Predicted Level
0
5000
10000
15000
20000
25000
30000
35000
40000
0 500 1000 1500 2000 2500 3000
Time (seconds)
Leve
l fee
t)
Level Prediction Ground(n)
Level Prediction Ground(n-1)
Level Prediction Air(n)
Actual Crossing levels
Level Prediction Air(n-1)
LASAT
LARPO
(n-1) : before receiving the 4D from aircraft(n) : after receiving & processing the 4D
Figure B-8 – 23-Mar-09 – Predicted Level = f(t) dur ing descent phase
Result Analysis:
Once the downlinked 4D trajectory is taken into account (light green curve), the level prediction is closer to the trajectory downlinked by the aircraft. The ROCD on the different segments in the ground prediction and in the FMS are similar in the flight phases that are not constrained in altitude. This is because the 4D trajectory received from the aircraft is used to compute in real time an individual aircraft model of performances (speed and ROCD) that is applied immediately on the Trajectory Prediction.
The ground TP does not adhere completely to the 4D trajectory computed by the FMS. This is normal, because it uses it only to evaluate aircraft performances that are re-injected instead of BADA in the model, but the way the profile is computed remains the same with or without this real time input. Nevertheless, it is to be noted that the computation of the individual aircraft model of performances is biased on the two segments where the aircraft does not expect to descend “idle”, i.e. with the altitude constraint of 7000fr on LARPO and most of all with the level off phase at 3000ft. This level off phase, does not correspond to an ATC constraint on the ground. The ground TP does not identify it and therefore, it is not included in the prediction.
And as explained before, the computed distance to travel of about 10 NM more on board during this experimentation (runway threshold) partially explains the observed difference between the Air (light blue) and Ground (light green) trajectory on the time to reach the runway threshold.

Episode 3
D6.5-01b - Annex B to Technological Enablers Consolidated Validation Report - Air Ground Initial 4D
Management
Version: 2.00
Page 22 of 46
Issued by the Episode 3 consortium for the Episode 3 project co-funded by the European Commission and Episode 3 consortium.
29th May 2009 experiment:
Predicted Level
0
5000
10000
15000
20000
25000
30000
35000
40000
3200 3700 4200 4700 5200 5700 6200Time (seconds)
Leve
l fee
t)
Level Prediction Ground(n)
Level Prediction Ground(n-1)
Level Prediction Air(n)
LASAT
LARPO
(n-1) : before receiving the 4D from aircraft(n) : after receiving & processing the 4D
Figure B-9 – 29-May-09 – Predicted Level = f(t) dur ing descent phase
Result Analysis:
• One can see here that while for climbing phase the Ground Flight Data Processing 4D prediction follows very accurately the down linked 4D trajectory there is still a notable difference in the descent phase. This is mainly due to various constraints that are followed by the aircraft, which are bringing some inaccuracy in the re-computation of aircraft performances in the ground FDP.
• Nevertheless the benefit of the use of the 4D trajectory appears more important than during climbing phase even when, as during this experiment the Actual Take Off Weight at departure was similar in both sides.
− The difference on the time of Top of Descent in regards with the FMS prediction decreases from 8’34” before the aircraft 4D is used in the EUROCAT FDP to 1’35” after.
− At landing on runway threshold, the differences are respectively of 8’02”” and 37”.
− The maximum differences on planned altitude between ground and air trajectory predictions are respectively 4600ft and 18800ft (always at TOD since the aircraft plans to descend earlier what is predicted in the ground system),
− The average differences on planned altitude are respectively 1900ft and 7800ft
For this experiment, it is visible that without the level off planned on board at 3000ft (or if the ground system was able to take it into account in the profile computation), the ground TP would be closer to the airborne one, including the Top Of Climb estimation, and especially when the aircraft 4D trajectory is taken into account.

Episode 3
D6.5-01b - Annex B to Technological Enablers Consolidated Validation Report - Air Ground Initial 4D
Management
Version: 2.00
Page 23 of 46
Issued by the Episode 3 consortium for the Episode 3 project co-funded by the European Commission and Episode 3 consortium.
It is also to be reminded that for this experiment, the predictions have been recorded at the beginning of the flight, more than one hour before the Top Of Descent. Each little difference between ground and air predictions on the different phases of the flight have a cumulative repercussion on the rest of the flight.
20th November 2009 experiment:
Figure B-10 – 20-Nov-09 – Predicted Level = f(t) du ring descent phase, computed 2 min after take off
Figure B-11 – 20-Nov-09 – Differences on ETOs durin g descent phase, computed around 2 min after take-o ff

Episode 3
D6.5-01b - Annex B to Technological Enablers Consolidated Validation Report - Air Ground Initial 4D
Management
Version: 2.00
Page 24 of 46
Issued by the Episode 3 consortium for the Episode 3 project co-funded by the European Commission and Episode 3 consortium.
Figure B-12 – 20-Nov-09 – Predicted Level = f(t) du ring descent phase, computed around TOD, 31 min bef ore landing
Result Analysis:
One can see here that while for climbing phase the Ground Flight Data Processing 4D prediction follows very accurately the down linked 4D trajectory, when it processes this 4D trajectory, there is still a notable difference in the descent phase.
First graph Predicted Level versus time
The Ground curves are computed before and after the time of the first receipt of 4D trajectory around 2 minutes after take-off.
• The difference on the time of Top of Descent (TOD) in regards with the FMS prediction decreases from 3’04” before the aircraft 4D is used in the EUROCAT FDP to 1’11” after.
• At the computation time (2 minutes after take-off), the Ground System is not able today to take into account the level-off at 3000 ft (duration 1’20”) corresponding to the ILS interception by the aircraft. This explains mainly the gap between the curves Ground(n) and Air(n) between the Top Of Descent and the end of level off.
Second graph Differences on ETOS
As soon as the Ground System receives and processes the down linked 4D trajectory, the gap between ETO’s predicted by Ground System versus FMS is significantly reduced.
Before the aircraft 4D trajectory is received, the ETO’s computed by the flight data processing, based on a True Air Speed defined in the flight plan (465kts), which is 8kts faster than the one of the FMS (457kts), derives obviously all along the descent phase proportionally to the difference with the FMS planned speed (maximum gap of -156” on LARPO). As soon as the downlinked 4D is taken into account, the ground prediction in descent phase follows quite exactly the FMS prediction (maximum gap of +28” on RENSA).

Episode 3
D6.5-01b - Annex B to Technological Enablers Consolidated Validation Report - Air Ground Initial 4D
Management
Version: 2.00
Page 25 of 46
Issued by the Episode 3 consortium for the Episode 3 project co-funded by the European Commission and Episode 3 consortium.
Third graph Predicted Level versus time
The Ground curve is computed around Top Of Descent, 31’ before landing.
• The difference on the time of Top of Descent (TOD) predicted by the Ground System EUROCAT FDP in regards with the FMS prediction becomes very low (8”).
• At the computation time, the Ground System is able to take into account the level-off at 3000 ft (duration 1’49”) corresponding to the ILS interception by the aircraft: the level-off duration is the same (1‘49” i.e. 6,4 Nm) for both but the start time for the Ground System is 1’ later (the final wrong Rate of Descent is due to an incorrect use of last segment of downlinked 4D trajectory). However the Ground System determines the correct geographic locations of start/end level-off points (not shown on the graph but seen in the FDP recorded data).
B.3.3.4 Use of Aircraft 4D Trajectory on Route Change
Data used for the analysis on this phase were recorded during the November 2009 experiments.
The scenario was the following
• Creation of the flight plan in parallel in EUROCAT and in the FMS. Flight: Nice Paris.
• Starting of the flight simulation at departure from Nice.
• As soon as the aircraft is moving, it starts to send to the EUROCAT ASTERIX Category 62 messages with two kind of information:
− Surveillance data (as usual data coming from a tracker like ARTAS)
− Aircraft Derived Data, with the 4D trajectory and some Downlinked Aircraft Parameters
• EUROCAT uses the downlinked 4D trajectory to update its own 4D Trajectory Prediction.
• A few minutes before PERUS (end of SID), the controller graphically updates the flight plan route, (the route is deviated between PERUS and BALSI) and selects the sending of the corresponding CPDLC route clearance message (UM83). The pilot loads the clearance in the active flight plan and responds to the clearance with a WILCO. The receipt of the WILCO validates the route modification in the EUROCAT Flight Data Processing, which then computes its 4D trajectory prediction based on the new agreed route and uses the new downlinked 4D trajectory to enhance this prediction.
The analysis was performed using the following data:
• 4D trajectory prediction computed by the ground system before the new 4D clearance
• 4D trajectory received from the ATSU once the route change has been applied
• 4D trajectory prediction computed by the ground system following this receipt.
The goal was to see how the Ground System continues to compute the flight predicted trajectory using the downlinked 4D when the initial route is modified.

Episode 3
D6.5-01b - Annex B to Technological Enablers Consolidated Validation Report - Air Ground Initial 4D
Management
Version: 2.00
Page 26 of 46
Issued by the Episode 3 consortium for the Episode 3 project co-funded by the European Commission and Episode 3 consortium.
Figure B-13 – 20-Nov-09 – Predicted Level = f(t) be fore and after a route change
Figure B-14 – 20-Nov-09 – Predicted 2D trajectory b efore and after a route change

Episode 3
D6.5-01b - Annex B to Technological Enablers Consolidated Validation Report - Air Ground Initial 4D
Management
Version: 2.00
Page 27 of 46
Issued by the Episode 3 consortium for the Episode 3 project co-funded by the European Commission and Episode 3 consortium.
Figure B-15 – 20-Nov-09 – Predicted 2D trajectory b efore and after a route change – zoomed on RETNO LA SUR
Figure B-16 – 20-Nov-09 – Predicted 2D trajectory i n arrival to LFPG

Episode 3
D6.5-01b - Annex B to Technological Enablers Consolidated Validation Report - Air Ground Initial 4D
Management
Version: 2.00
Page 28 of 46
Issued by the Episode 3 consortium for the Episode 3 project co-funded by the European Commission and Episode 3 consortium.
Result:
The 4D trajectory prediction computed by the ground system remains correct in terms of ETO’s and level prediction once the route change has been activated in both air and ground sides.
Concerning the 2D prediction, which keeps being computed in EUROCAT independently from the one received from the aircraft, a phenomenon was observed on the prediction of trajectory around the crossing of flight route waypoints that present an angle of around 90 degrees.
Before the route amendment, the flight was expected to follow the following path: PERUS RETNO KOTIT BALSI. And instead of RETNO where the route was doing a 90 degrees curve to rejoin KOTIT, the aircraft FMS computed a trajectory point (downlinked to the ground) that was a bit more than 1 NM.
After the route amendment, the path is changed to PERUS LASUR BALSI. This time, over the point LASUR, where again the route was doing a curve of about 90 degrees to rejoin the next point, the computed trajectory point latitude/longitude corresponded sensibly to the actual position of LASUR. And effectively, the aircraft then crossed exactly LASUR then turned to BALSI.
The difference is that the FMS considered RETNO as a Fly-by point while it considered LASUR as a fly-over.
The Trajectory Prediction in the ground system does not receive the Fly-by and Fly-over Point type information and by default considers all the points as Fly-over.
In this scenario, the difference in 2D prediction due to this non-knowledge in the ground system of the point type managed in the FMS was only of a bit more than 1 NM on the turning point. This could be also observed in the arrival circuit before the landing to LFPG.
It could be of interest to later evaluate more widely the potential differences according to the aircraft types, speeds, route configurations, and study the possible enhancement of the 2D ground prediction that would be brought by using also Point Type information extracted from the 4D trajectory downlinked by the aircraft.
B.3.3.5 CTA application
CTA application on LARPO (after the IAF VELER)
The experimentation used for the following analysis is the one of the 23rd of March 2009, with the same experiment limitations as described in B.3.3.1.
The CTA application was indeed performed in two steps:
• Step 1: Demand by the controller to the avionics of the Estimated Time of Arrival as well as the ETAmin / ETAmax (i.e. range acceptable by the FMS) on LARPO
This is performed via a menu opened when selecting the point. A CPDLC message (free text) was sent automatically to the aircraft, requested the data to the aircraft. On board, the ATSU transmitted automatically the request to the FMS, which returned automatically the requested data, transmitted by the ATSU in a downlink free text CPDLC message. It is to be noted that this is the way of exchange that was decided preliminarily for the experiment but meanwhile the ADS-C has been selected in Initial 4D – 4DTRAD to be the means of communication to be used in the future for such request from the ground. Nevertheless, functionally, for this experimentation, there is not a big difference: the downlink of the information is triggered by a controller command and the data is returned automatically on board, without intervention from the aircrew.
• Step 2: Input by the controller of a CTA on the point, with the possibility to choose to send or not (voice) the corresponding CPDLC message UM51 CROSS <position> at <time>.
It is to be noted that this message element was completed by a free text element providing the “seconds” of the CTA, since the current standards provide the possibility to transmit times only in hour minutes.

Episode 3
D6.5-01b - Annex B to Technological Enablers Consolidated Validation Report - Air Ground Initial 4D
Management
Version: 2.00
Page 29 of 46
Issued by the Episode 3 consortium for the Episode 3 project co-funded by the European Commission and Episode 3 consortium.
When receiving the CTA clearance, the aircrew loaded it in the FMS then accepted the clearance (WILCO), closing the CPDLC dialogue in progress.
At the moment of the CTA application (while the flight was near SUTAL about 5’ from the TOD), the 2D route was not changed (the CTA was applied on board only via a speed adjustment making delay of 44” the ETA on LARPO).
Therefore, the analysis was performed using the following data recorded in chronological order:
• Last 4D trajectory received from the ATSU before the CTA is applied in the FMS
• 4D trajectory prediction computed by the ground system before receipt of the 4D trajectory from the aircraft indicating application of CTA on LARPO
• 4D trajectory received from the ATSU after the CTA is applied
• 4D trajectory prediction computed by the ground system following this receipt.
The goal was to see the impact on the ground TP of the application of the CTA on board (knowing that for these experiments, the CTA constr aint is not directly used to update the TP in the EUROCAT Flight Data Processing: the TP is updat ed via the resulting change on board)
Predicted Level
0
5000
10000
15000
20000
25000
30000
35000
40000
0 500 1000 1500 2000 2500 3000Time (seconds)
Leve
l fee
t)
Level Prediction Ground(n)
Level Prediction Ground(n-1)
Level Prediction Air(n)
Actual Crossing levels
Level Prediction Air(n-1)
SUTAL
LARPO
(n-1) : before RTA is applied(n) : after RTA is applied (and new 4D is received)
Figure B-17 – Level=f(t) during descent phase, RTA on LARPO

Episode 3
D6.5-01b - Annex B to Technological Enablers Consolidated Validation Report - Air Ground Initial 4D
Management
Version: 2.00
Page 30 of 46
Issued by the Episode 3 consortium for the Episode 3 project co-funded by the European Commission and Episode 3 consortium.
Differences on ETOs
-60
-40
-20
0
20
40
60
0 500 1000 1500
Time (seconds)
Eca
rts E
TO
s (s
econ
ds)
ETO differenceGround(n) vs Air(n)
ETO differenceGround(n-1) vs Air(n-1)
ETO differenceActual vs Air(n)
LARPO
SUTAL
TOD
Ground TP ETO's late
Ground TP ETO's early
Figure B-18 – Level = f(t)
D iffe re n c e s o n E T O s
-6 0
-4 0
-2 0
0
2 0
4 0
6 0
0 5 0 0 1 0 0 0 1 5 0 0
T im e (s e c o n d s )
Eca
rts
ET
Os
(sec
onds
)
E TO d iffe re n c eG ro u n d (n ) vs A ir(n )
E TO d iffe re n c eG ro u n d (n -1 ) vs A ir(n -1 )
E TO d iffe re n c eA c t u a l vs A ir(n )
L A R P O
S U TA L
TO D
G ro u n d TP E TO 's la t e
G ro u n d TP E TO 's e a rly
Figure B-19 – Differences on ETOs during descent ph ase, RTA on LARPO
Result Analysis
Once the CTA input by the controller was applied as an RTA on board, the aircraft immediately downlinked the 4D trajectory with this amendment. The impact appears on the two above graphs. The trajectory computation in the FDP changed accordingly with, after the CTA application, the same remaining errors as before, in terms of level profile and ETO’s computation.

Episode 3
D6.5-01b - Annex B to Technological Enablers Consolidated Validation Report - Air Ground Initial 4D
Management
Version: 2.00
Page 31 of 46
Issued by the Episode 3 consortium for the Episode 3 project co-funded by the European Commission and Episode 3 consortium.
Note on both graphs the display in orange of information on the difference between predictions and actual trajectory followed by the aircraft.
The first graph on level prediction indicates that, except over LARPO (ATC constraint to 7000 feet), the ground trajectory prediction, performed 5’ before the TOD, was constantly very close to the actual level profile followed by the aircraft.
The second graph shows the difference between the FMS prediction (after CTA application) and the actual flight in terms of ETO’s. It appears that for this experiment the maximum difference was less than 16” over BS38A at 17000ft and the difference was 2” over LARPO.
CTA application on SOLBA (in APP entry, before the IAF VELER)
The experiment used for the following analysis is the one of the 20-Nov-09.
For the flight plan trajectory of this experiment, SOLBA corresponds to the TMA Paris entry. According to AIP France, SOLBA is a merging point for traffic coming from North and East of France. SOLBA is common to several STAR’s RNAV with IAF VELER and East arrival runways (09L, 09R, 08L, 08R) of LFPG. SOLBA is 8 Nm before IAF VELER (refer to figure LFPG STAR RNAV hereafter).
At the moment of the CTA application (while the flight was in cruise around GILIR, 25 minutes before TOD, 36 minutes before SOLBA and 54 minutes before landing), the 2D route was not changed (the CTA was applied only via a speed adjustment making 51” earlier the current ETO on SOLBA).
Therefore, the analysis was performed using the following data recorded in chronological order:
• Last 4D trajectory received from the ATSU before the CTA is applied
• 4D trajectory prediction computed by the ground system before receipt of the 4D trajectory from the aircraft indicating application of CTA on SOLBA
• 4D trajectory received from the ATSU after the CTA is applied
• 4D trajectory prediction computed by the ground system following this receipt.
The goal was to see the impact on the ground TP of the application of the CTA on board (knowing that for these experiments, the CTA constraint is not directly used to update the TP in the EUROCAT Flight Data Processing: the TP is updated via the resulting change on board).

Episode 3
D6.5-01b - Annex B to Technological Enablers Consolidated Validation Report - Air Ground Initial 4D
Management
Version: 2.00
Page 32 of 46
Issued by the Episode 3 consortium for the Episode 3 project co-funded by the European Commission and Episode 3 consortium.

Episode 3
D6.5-01b - Annex B to Technological Enablers Consolidated Validation Report - Air Ground Initial 4D
Management
Version: 2.00
Page 33 of 46
Issued by the Episode 3 consortium for the Episode 3 project co-funded by the European Commission and Episode 3 consortium.
Figure B-20 – Level=f(t) during descent phase, RTA on SOLBA
Figure B-21 – Differences on ETOs during descent ph ase, RTA on SOLBA

Episode 3
D6.5-01b - Annex B to Technological Enablers Consolidated Validation Report - Air Ground Initial 4D
Management
Version: 2.00
Page 34 of 46
Issued by the Episode 3 consortium for the Episode 3 project co-funded by the European Commission and Episode 3 consortium.
Result Analysis:
First graph Predicted Level versus time
The Ground curves are computed nearly GILIR, 25’ before TOD, around 36’ before SOLBA and 54’ before landing.
Once the CTA input by the controller is applied as an RTA on board, the aircraft immediately downlink the 4D trajectory with this amendment. The impact appears on the two above graphs. The trajectory computation in the Ground System changed accordingly after the CTA application.
Before CTA on SOLBA is done, the aircraft predicted to be on this point at FL 128.
After CTA on SOLBA is done the aircraft to be predicts to be on this point at FL 122 and to comply with CTA time + 2” (same as the Ground System prediction), as it is shown in the second graph “Differences on ETO’s”.
While the flight is still in cruise (around GILIR), the CTA on the point SOLBA is performed as a RTA onboard, with the time of crossing on this point being 51” earlier.
As a result, the aircraft 4D trajectory prediction is modified:
• ETO on LIMGO is predicted 36” earlier,
• Top Of Descent is predicted 42” earlier.
• ETO on SOLBA is predicted 55” earlier
• ETO on VELER is predicted 53” earlier
• ETO on LARPO is predicted 37” earlier
• ETO on CI09L is predicted 22” earlier
• Landing time is predicted 21” earlier.
NB: The FMS flight trajectory remains compliant with the 2 constraints: VELER at FL110, LARPO at FL070.
Such constraints could impact FMS profile following the RTA application point, in such a way that the ETO’s on the next points are not propagating the time saving get on the CTA application point.
Note on both graphs the display in orange of information on the difference between 4D trajectory prediction and actual trajectory followed by the aircraft. This shows the good achievement of the aircraft predictions by the FMGS.
B.3.4 Findings from evaluation by controllers
The main comments, with regards to INITIAL 4D scenarios, resulting of the evaluation sessions are summarized below.

Episode 3
D6.5-01b - Annex B to Technological Enablers Consolidated Validation Report - Air Ground Initial 4D
Management
Version: 2.00
Page 35 of 46
Issued by the Episode 3 consortium for the Episode 3 project co-funded by the European Commission and Episode 3 consortium.
The following remarks are related to the operational procedures implemented in the scenario. Please refer also to § B.4 Questionnaire filled in by EUROCONTROL MUAC.
B.3.4.1 Use of aircraft 4D trajectory for enhancing the ground 4D
prediction
The downlinking of the 4D trajectory has to be performed via ADS-C: “after CO-logon the ground system automatically sets up a default contract depending on its needs”. But for some specific situations, “there may be a simple HMI for the controller to initiate a single shot request”. It “would save having to wait for the contract triggering event (time or event driven)”. Indeed, the system should manage ADS-C contracts in a way that such need for the controller to request manually a one shot update of the airborne 4D trajectory prediction is as rare as possible
The down linked 4D predicted trajectory was also displayed graphically, on request, on the controller position. It was remarked that one specific point, the TOD (Top Of Descent) was more especially useful to be displayed, and the most important information was not the time of the TOD but the geographical point. This would provide the controller with a better confidence on where (then when) the pilot will be ready for descent.
B.3.4.2 Use of CPDLC for Route Clearance
During the scenarios, when the controller changed the route manually further on the flight path, (s)he could select to use voice or to use CPDLC for transmitting the corresponding Route Clearance to the pilot. When CPDLC was selected, it made send UM83 2D Route Clearance from the point of application of the route amendment. Controllers remarked that 2D route clearance could be “cleared by the controller at entry into sector. Vertical dimension is “built up in steps, there is the possibility to use "expect" but this is not a clearance and cannot be executed. Time is a separate clearance”. “With CPDLC it is possible to concatenate messages to build a single 4D clearance however the execution of the vertical path still needs to be cleared in steps, hopefully keeping ahead of the actual position of the a/c.” They confirmed that “assuming the clearance has to be input into the FDP regardless of the means of communication to the pilot the way the message is built on the HMI must be the same in both cases”. The main benefit of providing such 2D clearance in entry of the sector is to have the “assurance that the airborne and ground flight plans are the same. Additionally this "consistency check" can be carried out by the non-tactical controller on the sector relieving the executive of work”.
B.3.4.3 CTA application
The main concern of controllers on the application of a CTA on a point that is close to the arrival (like LARPO at 7,000 ft in the main scenario of the experiment) is that we have the assurance that the aircraft will be well spaced on this point but we do not know how each one expects to manage its descent to this point, and therefore, we are not sure that there will not be somewhere a lack of separation due to various speed/level profiles during descent. An immediate stopgap measure would be to get as well in the 4D downlinked trajectory the FMS expected speeds on the points and display these values to the controller on request.
It was also remarked that usually the CTA application will be issued from an AMAN regulation, which horizon is about 40 minutes, therefore, CTA (for arrival management) applied beyond this horizon would not be very realistic.
During the scenarios, before applying a CTA on a point, the controller requested to the FMS, via CPDLC its ETA on this point as well as is acceptable range ETAmin-ETAmax on the same point. It was remarked that “if the times are being calculated by the ground then the ground needs the min/max speeds for climb/cruise/descent in the ADS-C message. (EUROCAE WG85)”. It was also noted during preparation of the scenarios that if the CTA is cleared on a point that is to close on the flight path, there is a risk to have it not accepted or accepted then missed due to a too small margin within ETAmin/ETAmax around the RTA.

Episode 3
D6.5-01b - Annex B to Technological Enablers Consolidated Validation Report - Air Ground Initial 4D
Management
Version: 2.00
Page 36 of 46
Issued by the Episode 3 consortium for the Episode 3 project co-funded by the European Commission and Episode 3 consortium.
In the scenario of experiment, a simulated aircraft was following the EPOPEE aircraft in the descent with a spacing of about 90”. This aircraft was simulated without RTA capability and therefore the controller managed it via speed clearances. It was remarked that this is “very difficult to achieve as the speed variation of the EPOPEE is unknown and this would require constant monitoring increasing workload”. Managing mixed traffic with RTA capable and non-RTA capable aircraft in arrival is a real issue: it may increase the workload of the controller, especially if the goal is to reduce globally the spacing of the aircraft.
A scenario was run with the aircraft not able anymore to comply with a CTA due to adverse conditions. The pilot warned the controller by voice about the event (the ground system did not indicate a “missed”. EUROCONTROL MUAC representative provided advice on the way this missed CTA should be detected/displayed on the ground. The ground system should not declare itself the CTA as missed: “the pilot may still be able to achieve the time by taking the plane out of auto-thrust etc. It should be the pilot who declares the time as missed - the ground can only warn that this may happen.”
In addition to the primary benefit of the CTA that is to be able to sequence the flights on a strategic point, another important benefit was noted: combined with the use of the down linked predicted trajectory to enhance the ground trajectory prediction, the estimated time of over-flight on the intermediate points should become more accurate quicker: This could have a positive impact on other ground functions such as the medium term conflict detection processing.
B.3.5 Conclusion
D6.3-01 - Requirements for technical validation has identified the validation objectives apportioned to WP6. The following table summarised the results of the WP6 exercises derived from these exercises.
Id Objective Exercise Result
7 Assess CWP HMI capability of presenting necessary information to monitor Aircraft flying an RTA.
This objective has been achieved by means of scenarios addressed in this annex.
Comments pertaining to the way of improving the EUROCAT CWP HMI have been captured and discussed
8 Assess detection and signalling of CTA non-conformance both on the air and ground sides.
Detection of CTA non –conformance was implemented in the airside, not in the ground side. When the aircrew was warned by the FMS that the CTA could not be maintained anymore, this was transmitted to the controller by voice.
11 Assess the ability to negotiate a CTA constraint via datalink between air and ground.
This objective has been achieved by means of scenarios addressed in this annex.
Comments pertaining to the way of improving the EUROCAT CWP HMI have been captured and discussed

Episode 3
D6.5-01b - Annex B to Technological Enablers Consolidated Validation Report - Air Ground Initial 4D
Management
Version: 2.00
Page 37 of 46
Issued by the Episode 3 consortium for the Episode 3 project co-funded by the European Commission and Episode 3 consortium.
Id Objective Exercise Result
12
Check the validity of the method and strategy selected by the Ground ATC automation system to take into account the airborne trajectories.
Check the capability of the Ground Trajectory Predictor to generate and provide 4D-predicted trajectories in a smooth and timely manner, to the other ground functions that need them (e.g. Controller Working Position, MTCD).
Assess impacts on the interactions between the Ground Trajectory Predictor function and the other ground-based functions.
This objective has been achieved by means of scenarios addressed in this annex.
Comments pertaining to the way of improving the EUROCAT CWP HMI have been captured and discussed
The MTCD function was present and activated in the EUROCAT system and indirectly beneficiated of the better accuracy of the Ground Trajectory Prediction for the EPOPEE aircraft, but the impact of the use of the enhancement of the Trajectory Prediction on the MTCD was not widely experimented. It would have necessitated running many scenarios with a tuning of the MTCD alert parameter to provide statistics on the true or false alerts raised.
13
Demonstrate, at the technology level, that the Ground ATC automation system will be capable to efficiently take into account the trajectory data downlinked by the airborne system. Define the technical characteristics of this process (downlink, fusion with ground trajectory).
This objective has been achieved by means of scenarios addressed in this annex.
Table 1 - Results of the WP6 exercises derived from Technical Validation Requirements execrise
The results of the experiments of the initial scope cannot be used as “statistics” since the experiments were performed only on one aircraft type and with one scenario. But they qualitatively demonstrate significant improvements.
Use of down linked 4D trajectory
The knowledge on the ground of the approximate aircraft take off weight appears to be a very valuable piece of information for enhancing the ground prediction when the aircraft 4D trajectory is not available. This is true especially during climbing phase. But this data and its evolution during the flight are almost never available to the ATC systems today.
When the aircraft 4D trajectory is downlinked and used in the ground Flight Data Processing, the knowledge of the weight of the aircraft is no longer needed for the trajectory prediction. Ground predictions become very accurate for climb and cruise phases, and, even if the presence of various ATC or flight constraints introduce differences in the trajectory prediction in these flight segments (impacting up to the Top Of Descent), the benefit is very important during the descent phase. Nevertheless, taking into account the speed and altitude constraints that the aircraft plans to follow during the descent (especially the level-off at 3,000 ft corresponding to the ILS interception by the aircraft) would certainly increase the accuracy of the ground prediction on the whole descent phase.
The benefit of the use of some DAP’s such as Ground Speed or Rate Of Climb Descent for profile re-computation on the next segment of route, even if not disrupting the trajectory computation (the values computed in EPOPEE were very stable), did not appear to provide a benefit since the 4D trajectory was received in parallel and very frequently. This would have to be confirmed with a larger set of flights, with various environments and with a less frequent 4D trajectory downlink.

Episode 3
D6.5-01b - Annex B to Technological Enablers Consolidated Validation Report - Air Ground Initial 4D
Management
Version: 2.00
Page 38 of 46
Issued by the Episode 3 consortium for the Episode 3 project co-funded by the European Commission and Episode 3 consortium.
During the experiments, the downlink of the 4D trajectory was performed based on a simulated ADS contract with a periodic component (downlink of 4D trajectory every 60 to 180 seconds) and an event-based component (downlink of 4D trajectory when the list of points changed or when the modification of time, altitude or position over one of the points exceeded a given threshold). Indeed, the frequency of the downlink was largely sufficient for improving the ground Trajectory Prediction: a very few intermediate points in the FMS computed trajectory were changing too frequently, thus triggering the downlink of the 4D trajectory mainly due to this event.
When the few remaining improvements of the Ground System Trajectory Prediction (TP) have been implemented, particularly on TOD determination and level-off (ILS interception) consideration in the descent phase, the Ground 4D TP will become very close to the airborne 4D TP for all flight phases.
CTA application
Technically the simple application of a CTA in the ground system does not cause a particular problem, with a quick easy menu for the controller to apply it and a clear display of the sequence of aircraft, of the same arrival flow, on the point on which CTA’s are applied. But operationally, and especially if the CTA is applied in a point low in the descent phase, the controller would need more information from the aircraft than just the 4D trajectory in order to be able to check in advance, may be with an assistance tool, that the separation will still be respected between aircraft. The issue about the additional workload (with current control means) for management by the controller of non-RTA equipped aircraft would have to be worked on, in order to get already some benefit from the CTA application during transition with a mixed RTA equipage.

Episode 3
D6.5-01b - Annex B to Technological Enablers Consolidated Validation Report - Air Ground Initial
4D Management
Version: 2.00
Page 39 of 46
Issued by the Episode 3 consortium for the Episode 3 project co-funded by the European Commission and Episode 3 consortium.
B.4 QUESTIONNAIRE FILLED IN BY EUROCONTROL MUAC
Phase of the scenario What are today's actions to achieve this phase?
Start of scenario (about 45 min before landing).
ATC request the A/C ADS-C contract (automatic downlink of 4D-Traj)
Note: not yet implemented but to be taken into account in the evaluation
What are today's actions to achieve this phase?
ADS-C is envisaged to be a system to system facility i.e. after CO-logon the ground system automatically sets up a default contract depending on it's needs. There may be an HMI for the controller to initiate a single shot request.
What would the ATCo do to implement this phase?
Simple HMI to request a one shot update of the ADS-C data.
What would be the benefit for the ATCo, if the new procedure were implemented?
Single shot request would save having to wait for the contract triggering event (time or event driven)
What would be the drawback for the ATCo, if the new procedure were implemented?
Time to receive data
Can a request interrupt the collection of data for an event type?

Episode 3
D6.5-01b - Annex B to Technological Enablers Consolidated Validation Report - Air Ground Initial
4D Management
Version: 2.00
Page 40 of 46
Issued by the Episode 3 consortium for the Episode 3 project co-funded by the European Commission and Episode 3 consortium.
Phase of the scenario What are today's actions to achieve this phase?
Transmit a 2D-route "clearance" (CPDLC UM83) to the aircraft, corresponding to the flight plan
What are today's actions to achieve this phase?
2D route cleared by the controller at entry in to sector. Vertical built up in steps, there is the possibility to use "expect" but this is not a clearance and cannot be executed. Time is a separate clearance.
With CPDLC it is possible to concatenate messages to build a single 4D clearance however the execution of the vertical path still needs to be cleared in steps, hopefully keeping ahead of the actual position of the a/c.
What would the ATCo do to implement this phase?
Assuming the clearance has to be input in to the FDP regardless of the means of communication to the pilot the way the message is built on the HMI must be the same in both cases.
What would be the benefit for the ATCo, if the new procedure were implemented?
The biggest benefit at this time is the assurance that the airborne and ground flight plans are the same. Additionally the non-tactical controller on the sector relieving the executive of work can carry out this “consistency check”.

Episode 3
D6.5-01b - Annex B to Technological Enablers Consolidated Validation Report - Air Ground Initial
4D Management
Version: 2.00
Page 41 of 46
Issued by the Episode 3 consortium for the Episode 3 project co-funded by the European Commission and Episode 3 consortium.
Phase of the scenario What are today's actions to achieve this phase?
The controller requests EUROCAT to display the list of flight plans foreseen at LARPO:
- Flight TR6001, coming from OMAKO, is estimated over LARPO at To (RTA)
- EPOPEE aircraft is estimated over LARPO at To+90”.
- Flight TR6004 is estimated over LARPO at To+4.5’ (RTA).
- Flight TR6003 is controlled by ATC. There is no RTA but is expected to arrive at LARPO 90 sec behind EPOPEE.
What are today's actions to achieve this phase?
HMI displays the ground TP estimated times over the point depending on the local HMI
What would the ATCo do to implement this phase?
This works if the only flights crossing the point are part of an arrival flow otherwise the non-arrival have to be filtered, (by the system). The other option is for the controller to select the relevant flights individually and request the time-over or an extrapolation of the flight path.
What would be the benefit for the ATCo, if the new procedure were implemented?
What would be the drawback for the ATCo, if the new procedure were implemented?

Episode 3
D6.5-01b - Annex B to Technological Enablers Consolidated Validation Report - Air Ground Initial
4D Management
Version: 2.00
Page 42 of 46
Issued by the Episode 3 consortium for the Episode 3 project co-funded by the European Commission and Episode 3 consortium.
Phase of the scenario What are today's actions to achieve this phase?
The controller asks the EPOPEE aircraft to indicate the minimum and maximum ETA it could respect at LARPO via ADS-C.
What are today's actions to achieve this phase?
By R/T
What would the ATCo do to implement this phase?
If the times are coming from the FMS then as always a simple HMI needs to be made.
If the times are being calculated by the ground then the ground needs to the min/max speeds for climb/cruise/descent in the ADS-C message. (EUROCAE WG85)
What would be the benefit for the ATCo, if the new procedure were implemented?
What would be the drawback for the ATCo, if the new procedure were implemented?
...
The controller analyses the aircraft's answer containing the minimum and maximum ETA over LARPO
What are today's actions to achieve this phase?
What would the ATCo do to implement this phase?
With this and the next step the window needs to be assessed against the "tool" that is generating the time to let the system decide a time that is mutually acceptable. Or it is just presented to the controller to select manually a time and uplink it
What would be the benefit for the ATCo, if the new procedure were implemented?
Apart from where the window is calculated in high traffic situations there must be system support to advice the controller of a valid CTA. In a single stream as in this scenario is it easy to put everybody 90" apart but when this stream is merged at a later point with a second or third stream then the time gaps will vary. The controller may or may not know the "other" streams CTAs and should not solve "their" problems in isolation. When using time control for flow/arrival management a bigger picture needs to be available.
What would be the drawback for the ATCo, if the new procedure were implemented?
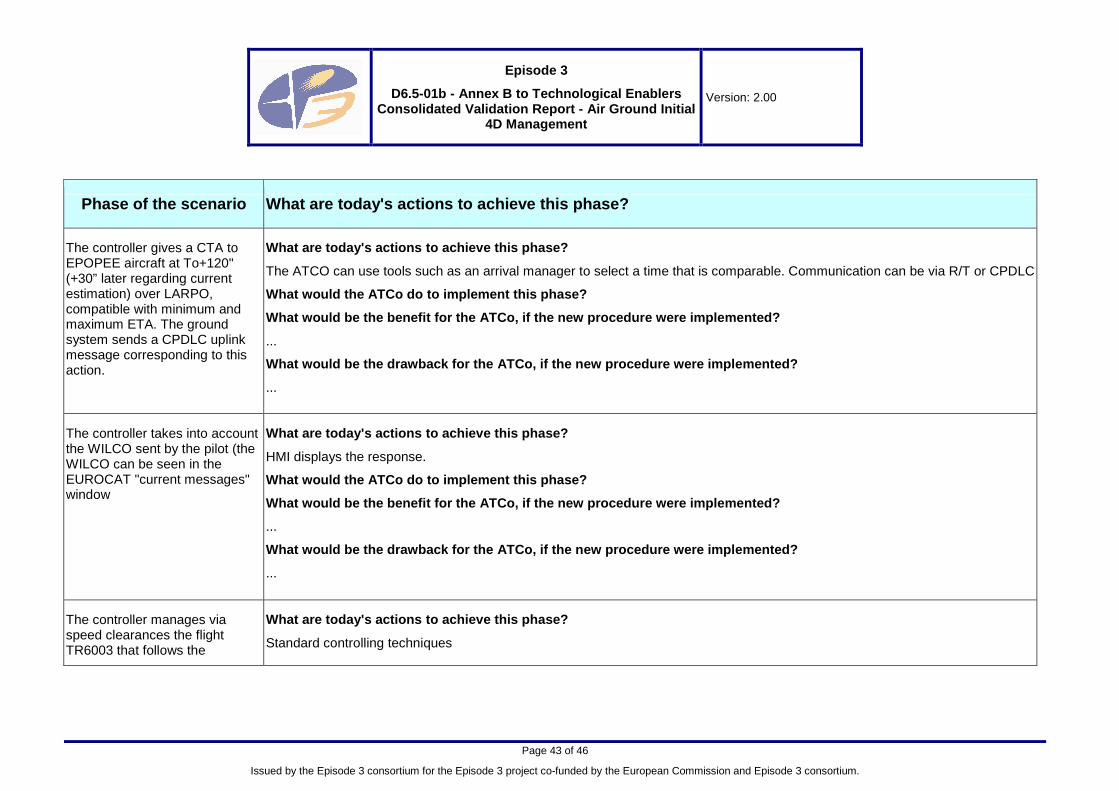
Episode 3
D6.5-01b - Annex B to Technological Enablers Consolidated Validation Report - Air Ground Initial
4D Management
Version: 2.00
Page 43 of 46
Issued by the Episode 3 consortium for the Episode 3 project co-funded by the European Commission and Episode 3 consortium.
Phase of the scenario What are today's actions to achieve this phase?
The controller gives a CTA to EPOPEE aircraft at To+120" (+30” later regarding current estimation) over LARPO, compatible with minimum and maximum ETA. The ground system sends a CPDLC uplink message corresponding to this action.
What are today's actions to achieve this phase?
The ATCO can use tools such as an arrival manager to select a time that is comparable. Communication can be via R/T or CPDLC
What would the ATCo do to implement this phase?
What would be the benefit for the ATCo, if the new procedure were implemented?
...
What would be the drawback for the ATCo, if the new procedure were implemented?
...
The controller takes into account the WILCO sent by the pilot (the WILCO can be seen in the EUROCAT "current messages" window
What are today's actions to achieve this phase?
HMI displays the response.
What would the ATCo do to implement this phase?
What would be the benefit for the ATCo, if the new procedure were implemented?
...
What would be the drawback for the ATCo, if the new procedure were implemented?
...
The controller manages via speed clearances the flight TR6003 that follows the
What are today's actions to achieve this phase?
Standard controlling techniques

Episode 3
D6.5-01b - Annex B to Technological Enablers Consolidated Validation Report - Air Ground Initial
4D Management
Version: 2.00
Page 44 of 46
Issued by the Episode 3 consortium for the Episode 3 project co-funded by the European Commission and Episode 3 consortium.
Phase of the scenario What are today's actions to achieve this phase?
EPOPEE aircraft in order to continue to respect a 90” spacing with it.
What would the ATCo do to implement this phase?
What would be the benefit for the ATCo, if the new procedure were implemented?
...
What would be the drawback for the ATCo, if the new procedure were implemented?
Very difficult to achieve as the speed variation of the EPOPEE is unknown and this would require constant monitoring increasing workload.
Alternative#1 :
The EPOPEE aircraft respects the CTA with required +/-10sec CTA accuracy.
The controller manages via speed clearances the flight TR6003 that follows the EPOPEE aircraft in order to continue to respect a 90” spacing with it.
What are today's actions to achieve this phase?
What would the ATCo do to implement this phase?
What would be the benefit for the ATCo, if the new procedure were implemented?
...
What would be the drawback for the ATCo, if the new procedure were implemented?
...
Alternative#2 :
The EPOPEE aircraft is not able to comply with CTA (discrepancy between airborne meteo data
What are today's actions to achieve this phase?
Question - does the ground side indicated a "missed"? The pilot may still be able to achieve the time by taking the plane out of auto-thrust etc. It should be the pilot who declares the time as missed - the ground can only warn that this may happen.
What would the ATCo do to implement this phase?
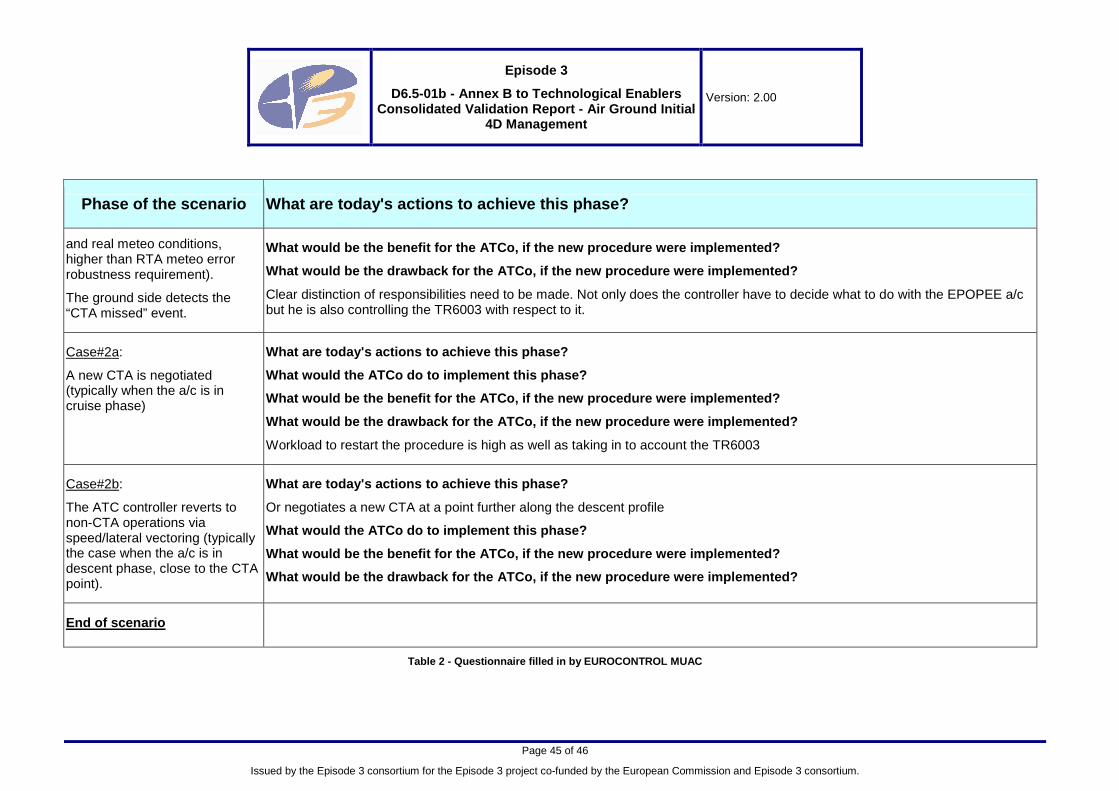
Episode 3
D6.5-01b - Annex B to Technological Enablers Consolidated Validation Report - Air Ground Initial
4D Management
Version: 2.00
Page 45 of 46
Issued by the Episode 3 consortium for the Episode 3 project co-funded by the European Commission and Episode 3 consortium.
Phase of the scenario What are today's actions to achieve this phase?
and real meteo conditions, higher than RTA meteo error robustness requirement).
The ground side detects the “CTA missed” event.
What would be the benefit for the ATCo, if the new procedure were implemented?
What would be the drawback for the ATCo, if the new procedure were implemented?
Clear distinction of responsibilities need to be made. Not only does the controller have to decide what to do with the EPOPEE a/c but he is also controlling the TR6003 with respect to it.
Case#2a:
A new CTA is negotiated (typically when the a/c is in cruise phase)
What are today's actions to achieve this phase?
What would the ATCo do to implement this phase?
What would be the benefit for the ATCo, if the new procedure were implemented?
What would be the drawback for the ATCo, if the new procedure were implemented?
Workload to restart the procedure is high as well as taking in to account the TR6003
Case#2b:
The ATC controller reverts to non-CTA operations via speed/lateral vectoring (typically the case when the a/c is in descent phase, close to the CTA point).
What are today's actions to achieve this phase?
Or negotiates a new CTA at a point further along the descent profile
What would the ATCo do to implement this phase?
What would be the benefit for the ATCo, if the new procedure were implemented?
What would be the drawback for the ATCo, if the new procedure were implemented?
End of scenario
Table 2 - Questionnaire filled in by EUROCONTROL MU AC

Episode 3
D6.5-01b - Annex B to Technological Enablers Consolidated Validation Report - Air Ground Initial
4D Management
Version: 2.00
Page 46 of 46
Issued by the Episode 3 consortium for the Episode 3 project co-funded by the European Commission and Episode 3 consortium.
END OF DOCUMENT


![Flexible Manufacturing Systems [F.M.S] · PDF fileFigure 2: - Block Diagram of a Flexible Manufacturing Cell (F.M.C.), Courtesy Flexible Manufacturing systems in Practice, Bonneto](https://static.fdocuments.in/doc/165x107/5a9e4e527f8b9a077e8b7393/flexible-manufacturing-systems-fms-2-block-diagram-of-a-flexible-manufacturing.jpg)