
EPIGENETIC PROFILINGOF OBESITY AND SMOKING
104
Institute for Molecular Medicine Finland, FIMM University of Helsinki Helsinki, Finland EPIGENETIC PROFILING OF OBESITY AND SMOKING Sailalitha Bollepalli ACADEMIC DISSERTATION To be presented for public examination with the permission of the Faculty of Medicine of the University of Helsinki, in Lecture Hall 2, Biomedicum 1, Haartmaninkatu 8, on 27 March 2020 at noon. Helsinki, Finland 2020
Transcript of EPIGENETIC PROFILINGOF OBESITY AND SMOKING

Institute for Molecular Medicine Finland, FIMMUniversity of Helsinki
Helsinki, Finland
EPIGENETIC PROFILING OF OBESITY AND SMOKING
Sailalitha Bollepalli
ACADEMIC DISSERTATION
To be presented for public examination with the permission of the Faculty of Medicine of the University of Helsinki, in Lecture Hall 2, Biomedicum 1, Haartmaninkatu 8, on 27 March 2020 at
noon.
Helsinki, Finland 2020

Cover layout by Anita Tienhaara
Cover picture by Nikita Mathur ISBN 978-951-51-5806-2 (paperback) ISBN 978-951-51-5807-9 (PDF) ISSN 2342-3161 (PRINT) ISSN 2342-317X (ONLINE) Unigrafia Helsinki 2020 The Faculty of Medicine uses the Urkund system (plagiarism recognition) to examine all doctoral dissertations.

Supervisors
Adjunct Professor Miina Ollikainen, PhDInstitute for Molecular Medicine Finland (FIMM),University of Helsinki, Helsinki, Finland
Professor Jaakko Kaprio, MD, PhDInstitute for Molecular Medicine Finland (FIMM),Department of Public Health,University of Helsinki, Helsinki, Finland
Thesis Advisory Committee
Professor Sampsa Hautaniemi, DTechResearch Program in Systems Oncology, University of Helsinki, Helsinki, Finland
Dr Panu Somervuo, D.Sc. (Tech.)Organismal and Evolutionary Biology Research Programme, University of Helsinki, Helsinki, Finland
Reviewers
Dr Christopher G. Bell, MBChB, PhD, FRCPA William Harvey Research Institute,John Vane Science Centre,Barts & The London School of Medicine and Dentistry,Queen Mary University of London, London, United Kingdom
Assistant Professor Juulia Jylhävä, PhDDepartment of Medical Epidemiology and Biostatistics,Karolinska Institutet, Stockholm, Sweden
Opponent
Assistant Professor Tuuli Lappalainen, PhDDepartment of Systems Biology, Columbia University, New York, USA,Core Faculty Member, New York Genome Center, New York, USA
Faculty Representative
Adjunct Professor Nina Kaminen-Ahola, PhDDepartment of Medical Genetics,University of Helsinki, Helsinki, Finland


“In God we trust. All others must bring data.”- William E. Deming
“All models are wrong, but some are useful.”
- George E. P. Box
To my family


Abstract
i
Abstract
Obesity and smoking are the two major preventable causes of global mortality associated with a multitude
of comorbidities, inflicting greater public health and economic burden. Complex interactions between
genetic and environmental factors influence susceptibility to obesity and smoking. Epigenetic modifications
provide a mechanistic link between genetic and non-genetic factors causing complex diseases or traits.
Epigenetic modifications also function as an additional layer of gene regulation by modifying the structure
and accessibility of DNA and chromatin. The fundamental objective of this thesis is to elucidate the role of
epigenetic and transcriptomic markers in obesity and smoking. Hence, this thesis focuses on identifying
epigenetic and transcriptomic markers associated with weight loss and smoking behavior using different
study designs and by applying computational and statistical approaches. Genome-wide transcriptome and
methylome were assessed in an unbiased, hypothesis-free setting to identify weight-loss and smoking-
associated signals in Study I and II, respectively. Validation of the main findings from the discovery analyses
and integration of transcriptomic and methylation data were performed to assess the validity and biological
significance of the identified markers. A machine learning approach was employed in Study III to develop a
robust smoking status classifier based on DNA methylation profiles. The performance of the classifier was
tested in three different test datasets and also in comparison with two other existing approaches. Therefore,
this thesis encompasses both application and method development aspects to achieve the corresponding
aims of the studies.
In Study I, clinical parameters, genome-wide transcriptome, and methylome analyses were assessed
longitudinally at three time points during a one-year weight loss intervention study, to understand the
temporal changes in transcriptome and methylome of subcutaneous adipose tissue (SAT) in response to
weight-loss. Results from the discovery analyses were validated using monozygotic (MZ) twin pairs
discordant for acquired obesity, to examine whether weight loss and acquired obesity exhibit reciprocal
transcriptome and methylome profiles. Gene expression and methylation profiles of the SAT at the three
time points were also integrated to enhance our understanding of their interaction and thereby their
contribution in weight loss. Based on the weight loss trajectory of the participants, three comparisons were
performed: short-term (baseline to the fifth month), continuous (fifth to twelfth month), and long-term weight
loss (baseline to twelfth month). Clinical parameters were improved with the weight loss (e.g. from baseline
to fifth month, total and low-density lipoprotein cholesterol; triglycerides; and systolic blood pressure
decreased and insulin sensitivity increased) and several significant transcriptome profiles were identified in
response to weight loss at the three comparisons. No genome-wide significant methylation profiles were
identified for the three comparisons. However, several significant correlations were observed between
expression and methylation, indicating a potential regulatory role of DNA methylation in weight loss -
Abstract
ii
associated transcriptome profiles. At the pathway level, short-term weight loss was implicated in lipoprotein
metabolism and long-term weight loss associated with various pathways associated with multiple functions
of the SAT. Furthermore, several weight loss -associated genes exhibited opposite direction of expression
in acquired obesity in the validation cohort of MZ twins, validating the robustness of identified associations.
In Study II, discovery analyses focused on understanding the widespread effects of smoking on SAT by
simultaneous assessment of genome-wide transcriptome and methylome of SAT. Discovery analyses
performed on the current (n=54) and never (n=291) smokers in the TwinsUK cohort identified 42 significantly
differentially methylated signals and 42 significant differentially expressed genes (DEGs) indicating a
substantial impact of smoking on metabolically important SAT. Integration of these results revealed an
overlap at five genes (AHRR, CYP1A1, CYP1B1, CYTL1, and F2RL3) comprising 14 CpG sites. To further
characterize the widespread effects of smoking on metabolic disease risk three adiposity phenotypes (total
fat mass [TFM], android-to-gynoid fat ratio [AGR] and visceral fat mass [VFM]) were assessed with regards
to the identified smoking-associated methylation and expression signals. Three CpG sites in CYP1A1
showed significant associations with VFM and AGR, and an inverse association was identified between
methylation levels of cg14120703 (NOTCH1) and AGR. To validate these associations, a subset of younger
Finnish twins (n=69, 21 current smokers) was used as a replication cohort. The overall inverse association
between cg10009577 (CYP1A1) and AGR was replicated and exhibited a similar direction for interaction
effects between smoking status and AGR. However, this association did not reach the genome-wide
significance level. Expression levels of F2RL3 showed a significant association with all three adiposity
phenotypes. While OR51E1 expression levels were significantly associated with AGR and VFM. Our results
show that smoking affects both the methylome and transcriptome of the SAT with overlapping signals.
Furthermore, smoking-associated methylation and transcriptome profiles are also associated with adiposity
phenotypes indicating a broader impact of smoking on human metabolic health.
In Study III, I developed a methylation-based smoking status classifier using a machine learning
approach to overcome the limitations of cotinine and carbon monoxide biomarkers (i.e. limited to measuring
recent exposure to smoking due to their short half-lives in body fluids) and the existing DNA methylation
score-based approaches and to advance the practical applicability of smoking-associated methylation
signals. I considered three smoking status categories (current, former and never) and used multinomial
LASSO regression coupled with internal cross-validation to build the classifier. I demonstrated the global
applicability and robustness of our classifier by evaluation of its performance in three independent test
datasets from different populations and also compared the performance with two existing approaches. Our
classifier differs from the existing approaches by curtailing the need to compute a threshold value specific
to each dataset to predict smoking status. Our classifier showed good discriminative ability in identifying
current and never smokers compared to other approaches. I also performed an extensive phenotypic
evaluation to understand the results of our classifier. Accurate classification of former smokers is challenging

Abstract
iii
as their classification is affected by cessation time and smoking intensity prior to quitting. I provide the
functionalities of our classifier including other the two methods as an R package EpiSmokEr (Epigenetic
Smoking status Estimator), facilitating prediction of smoking status in future studies.
In conclusion, this doctoral thesis (1) enhances our understanding of obesity and smoking by integrating
methylation and transcriptome data and identifying several weight-loss and smoking-associated signals, (2)
shows wide-spread impact of smoking on metabolic health risk by evaluating the associations between
smoking-associated signals and adiposity measures, and (3) demonstrates the role of DNA methylation
profiles as a robust biomarker to predict smoking status by developing a smoking-status classifier.

iv
Table of Contents
Abstract .....................................................................................................................................................i
1 Introduction.....................................................................................................................................1
2 Literature Review............................................................................................................................3
2.1 Multi-ome ....................................................................................................................................4
2.2 Quantifying transcriptome and DNA methylation..................................................................... 11
2.3 Obesity and Smoking: Complex Interplay of Genetic and Epigenetic factors ......................... 16
3 Aims............................................................................................................................................. 29
4 Materials and Methods ................................................................................................................ 30
4.1 Cohorts/Datasets ..................................................................................................................... 30
4.2 Phenotypes .............................................................................................................................. 33
4.3 Sample collection and DNA and RNA extraction..................................................................... 37
4.4 Omics Data .............................................................................................................................. 38
4.5 Statistical Analyses .................................................................................................................. 41
4.6 Ethics permissions and Data availability ................................................................................. 50
5 Results and Discussion ............................................................................................................... 51
5.1 Gene expression and DNA methylation changes in adipose tissue during weight loss (Study
I) 51
5.2 Smoking-associated changes in DNA methylation and gene expression of adipose tissue and
their consequences for metabolic health (Study II) ................................................................................... 56
5.3 EpiSmokEr: a robust DNA-methylation based smoking status classifier (Study III)................ 60
6 Implications and Future Directions .............................................................................................. 67
7 Conclusions ................................................................................................................................. 73
Acknowledgements ............................................................................................................................... 75
Appendix I ............................................................................................................................................. 77
References............................................................................................................................................ 80

v
List of original publications
This thesis is based on the following original publications and are referred in the text by their Roman
numerals:
I. Bollepalli S, Kaye S, Heinonen S, Kaprio J, Rissanen A, Virtanen KA, Pietiläinen KH, Ollikainen M.
Subcutaneous adipose tissue gene expression and DNA methylation respond to both short- and
long-term weight loss. International Journal of Obesity, 2018. 42: p. 412. PMID: 28978976
II. Tsai P-C, Glastonbury CA, Eliot MN, Bollepalli S, Yet I, Castillo-Fernandez JE, Carnero-Montoro E,
Hardiman T, Martin TC, Vickers A, Mangino M, Ward K, Pietiläinen KH, Deloukas P, Spector TD,
Viñuela A, Loucks EB, Ollikainen M, Kelsey KT, Small KS, Bell JT. Smoking induces coordinated
DNA methylation and gene expression changes in adipose tissue with consequences for metabolic
health. Clinical Epigenetics, 2018. 10(1): p. 126. PMID: 30342560.
III. Bollepalli S, Korhonen T, Kaprio J, Anders S*, Ollikainen M*. EpiSmokEr: A robust classifier to
determine smoking status from DNA methylation data. Epigenomics, 2019. 11(13): p. 1469.
PMID:31466478.
*These authors equally contributed to this research.
All publications are reprinted at the end of this book with permissions from the publishers.
vi
Abbreviations
5caC 5-carboxylcytosine
5fC 5-formylcytosine
5hmC 5-hydroxymethylcytosine
5mC 5-methylcytosine
AGR Android-to-gynoid fat ratio
ATATAC-seq
Adipose Tissue
Assay for Transposase-Accessible Chromatin using sequencing
BMI Body Mass Index
CpGDEG
Cytosine-phosphate-guanine dinucleotide
differentially expressed gene
DEXA Dual energy X-ray absorptiometry
DILGOM DIetary, Lifestyle and Genetic determinants of Obesity and Metabolic syndrome
DNAm DNA methylation
DNMT DNA Methyltransferase
DZ Dizygotic
EIRA Epidemiological Investigation of Rheumatoid Arthritis
EpiSmokEr Epigenetic Smoking status Estimator
EWAS Epigenome-Wide Association Study
FTC Finnish Twin cohort
GWAS Genome-Wide Association Study
HDL-C High Density Lipoprotein-cholesterol
HOMA-index Homeostatic Model Assessment – quantifies insulin resistance and beta-cell function
IDAT Intensity Data
ILN Illumina normalization
LASSO Least Absolute Shrinkage and Selection Operator
LD Linkage Disequilibrium
LDL Low Density Lipoprotein
mQTL Methylation Quantitative Trait Loci
Matsuda-index an insulin sensitivity index
MR Mendelian Randomization
MRI Magnetic Resonance Imaging
MRS Magnetic Resonance Spectroscopy
MS Methylation Score
MZ Monozygotic
OGTT Oral Glucose Tolerance Test
PC Principal Component
PCA Principal Component Analysis
QC Quality Control

vii
QN Quantile normalization
RMA Robust Multi-array Average
SATscRNA-seq
Subcutaneous Adipose Tissue
Single-cell RNA sequencing
SNP Single Nucleotide Polymorphism
SQN Subset Quantile Normalization
SSc Smoking Score
SVD Singular value decomposition
TET Ten-eleven Translocation
TFM Total fat mass
TWAS Transcriptome-wide association study
VAT Visceral Adipose Tissue
VFM Visceral fat mass
WLS Weight Loss Study

Introduction
1
1 Introduction
The ultimate goal of modern genetics research is to develop effective drugs and design efficient prevention
strategies to treat and prevent diseases. A key challenge associated with this goal is to identify causal
genetic variants and molecular mechanisms contributing to diseases. The recent explosion of genomic data
and genome-wide association studies (GWAS) have significantly enhanced our understanding of the
genetic architecture of several complex diseases and traits. However, a majority of the genetic variants
identified by GWAS have modest effect sizes explaining only a smaller proportion of genetic predisposition
(heritability) and are confined to non-coding regions of the genome. In addition to the genetic factors,
environmental and lifestyle factors also implicate the disease phenotype and etiology. Epigenetic
mechanisms provide mechanistic links accounting for both missing heritability and non-genetic factors
influencing the genome. These mechanisms act as an interface between a stably inherited genome and a
dynamically changing environment by regulating gene expression.
The field of epigenetics is rapidly progressing with a plethora of studies aiming to understand different
phenomena, specifically the development of complex diseases. DNA methylation is the most widely studied
epigenetic mark which mediates environmental effects on gene-expression regulation by controlling
transcriptional machinery. Genome-wide assessment of DNA methylation has become an affordable
avenue to uncover biomarkers for complex diseases. Moreover, the transient and reversible nature of DNA
methylation makes it an ideal predictor to estimate the effect of diseases and environmental exposures.
Combined evaluation of genetics, transcriptomics and epigenetics data provides a greater opportunity to
obtain a holistic understanding of the disease mechanism. This increased understanding facilitates the
development of improved drugs and treatments.
The prevalence of obesity and smoking is governed by a combination of genetic, epigenetic and
environmental factors. Both obesity and smoking inflict metabolic diseases, subsequently posing a major
risk for mortality and imposing a heavy economic burden worldwide. Losing weight and quitting smoking
have become high-priority global public health issues, holding a promise of improving the quality and
duration of life.
The major objective of this thesis is to identify epigenetic and transcriptomic markers associated with
weight loss/obesity and smoking by applying computational and statistical approaches. This thesis has two
major parts: (1) application part outlines integrative analysis of DNA methylation and transcriptome data
using most relevant analysis pipelines to understand the concurrently occurring changes in response to
weight loss and smoking (2) methods development part presents the development and implementation of
an epigenetic classifier using a machine learning approach to predict smoking status based on DNA
methylation profiles.

Introduction
2
Genome-wide transcriptome and methylome analyses of SAT were performed in Study I to identify and
integrate gene expression and DNA methylation profiles reactive to short- and long-term weight-loss.
Furthermore, weight-loss associated gene expression profiles were tested for reciprocal effects in acquired
obesity. Study II focused on comprehensively investigating the impact of smoking on adipose tissue by
performing transcriptome- and methylome-wide association studies. Identified smoking-associated
methylation changes were used to characterize the broader impact of smoking on metabolic disease
phenotypes. In Study III a machine learning methodology was used to train a robust DNA-methylation based
classifier to predict smoking status. I demonstrated global applicability and higher accuracy of our classifier
by testing its performance on multiple independent test datasets and by comparing it with two other existing
methods. I provided the implementation of this classifier as an R package, EpiSmokEr, facilitating smoking
status prediction in future studies.
Overall, this thesis contributes to enhancing our understanding of the role of DNA methylation in obesity
and smoking by using several statistical and bioinformatics tools. We comprehensively analyzed
transcriptome and methylome in Studies I and II to capture the simultaneously occurring changes in
response to obesity and smoking. In Study III, I have overcome the limitations of existing methods by
employing a penalized regression coupled with internal cross-validation to identify smoking-associated
CpGs to build the smoking status classifier. The following chapter presents an overview of the current state
of epigenetics of obesity and smoking by summarizing key concepts, technologies and analysis strategies,
followed by aims of the three studies. The next chapter describes the materials and methods employed in
this thesis along with a new methodology implemented to build the smoking status classifier, followed by
the results and discussion from all the three studies. Final chapters present implications and future directions
and conclusions.

Literature Review
3
2 Literature Review
This chapter provides an overview of the importance of epigenetic mechanisms in the broader context of
obesity and smoking. It serves to introduce the key concepts in epigenetics and reviews the literature with
a focus on the main research goals of this thesis. Table 1 provides a glossary of key terms used in this
thesis.
Table 1: Glossary of key terms
BMI-Discordant
MZ Twin Pairs
BMI-discordant monozygotic twin pairs are discordant for obesity despite the same
genotype, with one twin being heavy and other being lean (here: a minimum of 3 units of
BMI (kg/m2) difference).
CpG A CpG site represents cytosine adjacent to a guanine on the same strand of DNA. DNA
methylation usually occurs at the cytosine in the context of CpGs.
CpG islands are long stretches of non-methylated CpGs with high GC content (>50%) and
high frequency of CpGs compared to the rest of the genome. CpG islands usually occur at
gene promoters and increased methylation at CpG islands is conventionally associated with
gene repression.
DZ twins Dizygotic (DZ) or fraternal twins are derived from two distinct zygotes and share on average
50% of their segregating genes. DZ twins are non-identical and can be of the same or
opposite sex, sharing age and common early childhood environment.
Epigenome Collection of chemical modifications overlaying the genome which can profoundly influence
gene expression without changing the underlying DNA sequence. DNA methylation, histone
modifications and non-coding RNAs are the most widely known epigenetic modifications.
EWAS Epigenome-Wide Association Study; quantifies statistical association between epigenetic
variation (DNA methylation in this thesis) and a phenotype (a trait or disease).
Genome The complete set of genetic instructions of an organism inherited from parents, which
remains (nearly) constant throughout the lifespan.
GWAS Genome-Wide Association Study; quantifies statistical association between genetic variation
(SNPs) and a phenotype (a trait or disease).
Heritability Heritability measures the proportion of the phenotypic variance that can be explained by
genotypic differences between individuals. Heritability is a population parameter which can
differ based on age, sex, geographical regions and time period. Conventionally, twin and
family studies have been used to yield heritability estimates for various traits [1].
Literature Review
4
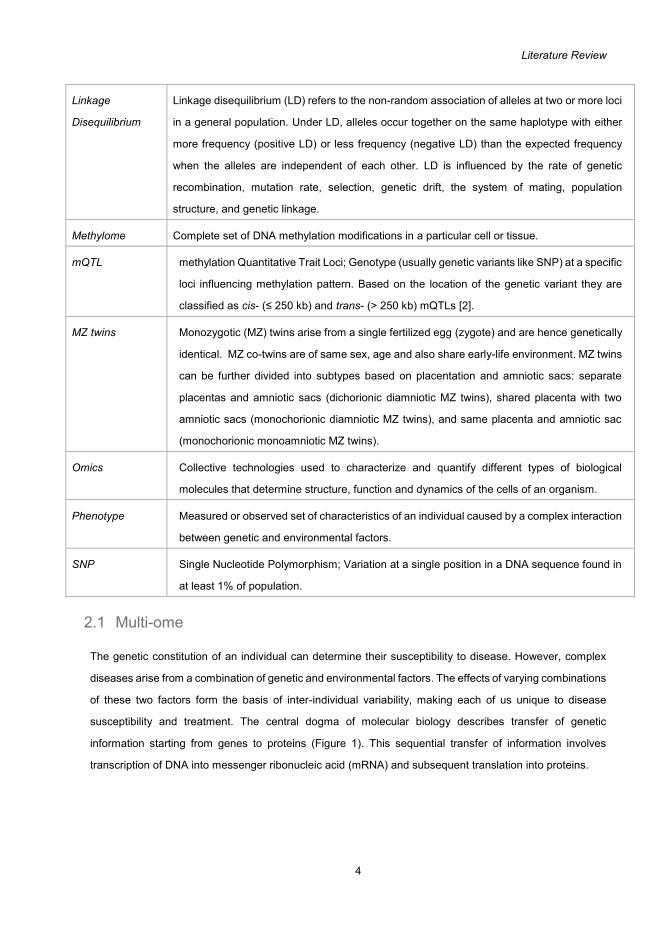
Linkage
Disequilibrium
Linkage disequilibrium (LD) refers to the non-random association of alleles at two or more loci
in a general population. Under LD, alleles occur together on the same haplotype with either
more frequency (positive LD) or less frequency (negative LD) than the expected frequency
when the alleles are independent of each other. LD is influenced by the rate of genetic
recombination, mutation rate, selection, genetic drift, the system of mating, population
structure, and genetic linkage.
Methylome Complete set of DNA methylation modifications in a particular cell or tissue.
mQTL methylation Quantitative Trait Loci; Genotype (usually genetic variants like SNP) at a specific
loci influencing methylation pattern. Based on the location of the genetic variant they are
classified as cis- (≤ 250 kb) and trans- (> 250 kb) mQTLs [2].
MZ twins Monozygotic (MZ) twins arise from a single fertilized egg (zygote) and are hence genetically
identical. MZ co-twins are of same sex, age and also share early-life environment. MZ twins
can be further divided into subtypes based on placentation and amniotic sacs: separate
placentas and amniotic sacs (dichorionic diamniotic MZ twins), shared placenta with two
amniotic sacs (monochorionic diamniotic MZ twins), and same placenta and amniotic sac
(monochorionic monoamniotic MZ twins).
Omics Collective technologies used to characterize and quantify different types of biological
molecules that determine structure, function and dynamics of the cells of an organism.
Phenotype Measured or observed set of characteristics of an individual caused by a complex interaction
between genetic and environmental factors.
SNP Single Nucleotide Polymorphism; Variation at a single position in a DNA sequence found in
at least 1% of population.
2.1 Multi-ome
The genetic constitution of an individual can determine their susceptibility to disease. However, complex
diseases arise from a combination of genetic and environmental factors. The effects of varying combinations
of these two factors form the basis of inter-individual variability, making each of us unique to disease
susceptibility and treatment. The central dogma of molecular biology describes transfer of genetic
information starting from genes to proteins (Figure 1). This sequential transfer of information involves
transcription of DNA into messenger ribonucleic acid (mRNA) and subsequent translation into proteins.

Literature Review
5
Figure 1: An illustration of the central dogma showing the transfer of information from DNA to proteins. Epigenetic mechanisms act as additional layer of control on this transfer of information. This schema shows the most widely studied epigenetic mechanism, DNA methylation.
Genomics is the study of the complete genome of an organism, specifically structure and function of
genes. While transcriptomics deals with entire collection of RNA molecules expressed by an organism.
Proteomics studies the total set of proteins expressed by an organism. However, the information transfer
from DNA to proteins is not just linear. All these biological layers interact with one another giving rise to a
complex and multi-dimensional interactome. In addition to these three layers, epigenetic mechanisms
mediate developmental and environmental effects on expression and translation by changing the structure
and conformation of DNA (Figure 1). Therefore, it is integral to comprehensively analyze interactions among
genetic, epigenetic and transcriptomic mechanisms to understand and treat complex diseases effectively.
Recent technological developments and collaborative research efforts have enabled us to integrate the
interactions across these multiple layers revolutionizing biomedical research and medical practice. The next
three subsections provide an overview of genome, epigenome and transcriptome.
2.1.1 Genome
Decoding the causal factors behind complex diseases has been a prime focus of human genetics and has
been catapulted by the human genome project [3] which unveiled the complete human genome sequence.
The human genome comprises over 3 billion base pairs of DNA and the genetic information encoded by
these base pairs are unique for each individual except for monozygotic (identical) twins. This uniqueness
Literature Review
6
arises from less than 0.1% percent of our genome in the form of single-base pair substitutions termed as
single nucleotide polymorphism (SNPs), insertions or deletions and structural variation. Human genome
has around 10 million SNPs making it the most common form of genetic variants contributing to inter-
individual variation. SNPs and their associated gene expression levels have been considered as the major
causal factors for disease susceptibility. For instance, the comprehensive catalogue of genetic variants
generated by the HapMap project allows for deeper interrogation of genomic variation in human health and
disease [4].
Genome-wide association studies (GWAS) further enabled the identification of disease-associated
genetic variants by scanning whole genome of cases and controls in an unbiased and hypothesis-free
approach. GWASs revolutionized our understanding of complex diseases by identifying several associated
and causal variants [5,6]. Furthermore, extensive resources and collaborative efforts have made GWAS a
powerful genetic approach [5]. A recent systematic study performed on 4155 GWASs across 2965 unique
traits demonstrated that ~61% of the genome is covered with trait-associated loci, with 93% loci being
associated with more than one trait (pleiotropy) [7]. Such widespread pleiotropy can occur due to the same
gene in a locus being associated with multiple traits or due to different genes or SNPs that are in linkage
disequilibrium being associated with multiple traits [7]. Interestingly, almost 90% of the identified GWAS
findings occur in non-coding regions with most of them located in intronic regions [7,8]. Moreover, the
identified disease-associated SNPs explain lower proportion of genetic variance than twin or family studies
giving rise to the “missing heritability” problem. Some of the prevailing explanations of the missing heritability
are: common variants with small effects that are not reaching genome-wide significance level, rare variants
with large effects that are not tagged by SNP arrays, and overestimation of heritability estimates in twin
studies (due to shared environment) [9]. However, by using whole-genome sequencing, the proportion of
variance accounted for by measured variants is close to that found in family studies for height and BMI [10].
Non-genetic or environmental influence on gene regulation through epigenetic mechanisms can also
contribute to substantial proportion of missing heritability [11,12]. However, the extent of autonomy of
epigenetic marks can range from obligatory to pure epigenetic variation, depending on the relationship
between epigenetic states and their genotypic context [13]. Here obligatory epigenetic variation refers to
the epigenetic variation that is completely dependent on the genetic variation, whereas pure epigenetic
variation occurs when the epigenetic variation is largely independent of genetic variation.
2.1.2 Epigenome
The term “epigenetics” meaning “above genetics” was coined by Conrad Waddington [14]. His famous
“epigenetic landscape” [15] illustrates that the destiny of a pluripotent cell to form a specialized cell is largely
determined by the path it travels. Epigenetic mechanisms govern this cell specialization by controlling tissue
and time specific expression [16,17] without modifying the underlying identical DNA sequence present in all

Literature Review
7
the cells of an individual. In addition to the cell development, epigenetic mechanisms have been
predominantly associated with genomic imprinting [18] and X-inactivation [19–21]. Genomic imprinting leads
to monoallelic expression of a small subset of genes in a parent-of-origin-specific manner while X-
inactivation is a dosage compensation mechanism of sex chromosome genes occurring in females, where
each cell randomly silences one of its X chromosomes. These two epigenetically regulated mechanisms
are vital in ensuring normal mammalian development [18,20]. Since Waddington, epigenetics as a field has
shown tremendous progress, which is evident from the series of definitions of epigenetics, that evolved with
advancement in technology and accumulation of evidence [22–27]. Currently, epigenetic modifications are
considered as stable and heritable changes without changing the underlying DNA sequence. Although
epigenetic inheritance to daughter cells through mitosis is widely accepted, more conclusive evidence is
needed to prove transgenerational inheritance via meiosis in humans [28–33].
DNA methylation (DNAm), histone modifications and non-coding RNAs (ncRNAs) are the main
epigenetic mechanisms (Figure 2). Epigenetic marks are transient and reversible in nature and exhibit tissue
and cell-type specific profiles. DNAm is the central focus of this thesis and is explained in detail in the
following section 2.1.2.1.
Histone proteins are responsible for compaction and packaging of DNA inside the cell nucleus. DNA
wrapped around the histone proteins forms chromatin, where each unit of the chromatin is called a
nucleosome. This DNA-protein complex is tightly wound owing to the positive charge of histone proteins
and negative charge of DNA (from phosphate groups in its phosphate-sugar backbone). Each nucleosome
has a nucleosome core, composed of histone octamer (two copies of each: H2A, H2B, H3, and H4) serving
as a spool to wrap ~147 bp of DNA [34,35]. Linker histone proteins (H1 or H5) connect adjacent
nucleosomes. Histone modifications occurring at the N-terminal tails of histone proteins can alter the
interactions between histone proteins, DNA and nuclear proteins. They affect DNA condensation and make
DNA accessible (euchromatin) or inaccessible (heterochromatin) to transcriptional machinery [36]. Specific
histone modifications are associated with transcriptional activation (e.g. H3 trimethylation at lysine 4
[H3K4me3]) and repression (e.g. H3 trimethylation at lysine 27 [H3K27me3]) [37]. Heterochromatin can be
further classified into facultative and constitutive heterochromatin. Constitutive heterochromatin remains
condensed and transcriptionally silent (e.g. H3 trimethylation at lysine 9 [H3K9me3]), whereas facultative
heterochromatin (e.g. H3K27me3) has the potential to interconvert between hetero and euchromatin, with
a possibility to decondense and allow transcription within temporal and spatial contexts [38]. NIH Roadmap
Epigenomics project has comprehensively characterized various histone modifications across several
human tissues [39].

Literature Review
8
RNAs that are transcribed but not translated to proteins in eukaryotes are termed as non-coding RNAs
(ncRNAs). ncRNAs perform a wide range of functions, specifically regulation of transcription and translation
[40,41], and are classified into two major classes based on their length short (e.g. microRNA [miRNA]), and
long ncRNAs (e.g. Antisense ncRNA).
Figure 2: A schematic representation of genetic and epigenetic architecture. Chromosomes are composed of chromatin. DNA wrapped around histone proteins forms chromatin, each unit of chromatin is called a nucleosome. Histone modifications like phosphorylation (Ph), methylation (Me), and acetylation (Ac) occur on the tails of histone proteins. DNA is methylated by covalent attachment of a methyl group to the fifth carbon of a cytosine adjacent to a guanine. Transcription converts DNA to messenger RNA (mRNA) which can be repressed by epigenetic modifications. microRNA, a short ncRNA, can repress conversion of mRNA into proteins, establish DNA methylation, and may alter chromatin structure by regulating histone modifiers. All these three epigenetic marks control gene regulation by altering transcription and/or translation. Figure reproduced from Relton, C. L., & Davey Smith, G. (2010) [42].

Literature Review
9
2.1.2.1 DNA methylome
In the mammalian genome, DNA methylation (DNAm) usually occurs at the cytosine–phosphate–guanine
dinucleotides (CpGs) by the covalent attachment of a methyl group to the fifth carbon of a cytosine forming
5-methylcytosine (5mC) (Figure 2). DNAm also occurs in a non-CG context (such as CpA, CpT and CpC),
and has been observed in embryonic stem cells, neurons, and oocytes [43]. DNAm is catalyzed by a family
of DNA methyltransferase (DNMT) enzymes using S-adenosylmethionine (SAM) as a methyl donor [44].
DNMT1 targets hemimethylated strands generated through DNA replication and methylates the CpGs on
the newly synthesized strand [44]. This maintenance methylation by DNMT1 ensures the mitotic heritability
of pre-existing methylation patterns. DNMT3a and DNMT3b perform genome-wide de novo methylation
(both at hemi- and unmethylated DNA) after embryo implantation and are also essential for early
development [45,46]. However, some evidence suggests that all these three DNMTs work in a coordinated
fashion and are involved in both maintenance and de novo methylation [47].
There are about 28 million CpG sites distributed throughout the human genome, of which 60 to 90%
are estimated to be methylated [48,49]. However, their occurrence is regarded as a “rarity” as they occur at
about one-fifth of the expected frequency determined from base composition [48]. This rarity was attributed
to the spontaneous mutation of 5mC to form thymine [50]. However, there are long stretches of CpGs
occurring at higher frequency with elevated GC content compared to the rest of the genome defined as CpG
islands (CGI). Unlike most CpGs in the entire genome, CGIs are typically unmethylated in healthy cells and
around 56% of the human genes harbor CGIs in their promoter regions [48,51]. The conventional notion of
DNAm as a gene silencing mark stems from the majority of the initial studies which have focused on the
methylation of CGIs near transcription start sites (TSS). However, studies have revealed that the function
of DNAm and its influence on transcription is context-dependent and is largely determined by its genomic
position [52]. For instance, DNAm in the regions downstream of TSS (e.g. first intron) is also highly
informative of transcription [53,54]. A clear and consistent inverse correlation between DNAm of the first
intron and transcription has been demonstrated across tissues and species [54]. The regulatory role of this
inverse relationship can be partially explained by the presence of intronic enhancers interacting with the
promoters of their corresponding genes [54]. Furthermore, DNAm can have positive and negative effects
on transcription factor binding, even within promoter loci [55].
In addition to its well-documented role in transcription, constantly increasing evidence from various
scientific studies established DNAm as a prime epigenetic factor with diverse roles in development and
disease [56].
DNAm is stable both chemically and genetically compared to other epigenetic marks. However, 5mC
can be reversed by passive or active demethylation. Passive demethylation occurs in the absence of DNA
methylation maintenance machinery, resulting in fully unmethylated strands during successive DNA

Literature Review
10
replication cycles. Active demethylation is catalyzed by ten-eleven translocation (TET) enzymes by
iteratively oxidizing 5mC to 5-hydroxymethylcytosine (5hmC), 5-formylcytosine (5fC) and
5-carboxylcytosine (5caC). TET-thymine DNA glycosylase (TDG)-mediated pathway completes DNA
demethylation by first excising 5hmC, 5fC and 5caC from the genome and then replacing them with
unmethylated cytosines through base excision repair mechanism [57]. Global DNA demethylation of the
human zygote is a crucial step of epigenetic reprogramming while aberrant DNA demethylation serves as
a biomarker for several cancers [57]. DNAm profile can be altered due to genetic [58], disease [59],
developmental (e.g. ageing, embryo development) [16], lifestyle (e.g. smoking, diet, exercise) [60–62],
stochastic and environmental factors [25,42]. In recent years, epigenome-wide association studies (EWAS)
have gained importance in unravelling the DNAm variants associated with several complex diseases and
traits [59,63,64]. In addition to investigating effects of single epigenetic marks in isolation, their combined
evaluation will yield a more comprehensive view of epigenome and disease mechanism [65].
2.1.3 Transcriptome
Transcription facilitates the transfer of genetic information in DNA by synthesizing a complementary strand
of RNA (mRNA) which is later translated into proteins by ribosomes. Transcription occurs in three stages
initiation, elongation and termination. Transcription factors (TFs) along with RNA polymerase enzymes
initiate transcription. First, TFs bind to specific DNA regions called enhancer and promoter regions
facilitating the recruitment of RNA polymerase (RNA polymerase II for transcription of mRNAs) at an
appropriate transcription site [66]. RNA polymerase unwinds DNA strand and the antisense strand of the
DNA acts as a template to synthesize complementary pre-mRNA strand. pre-mRNA is elongated until the
complete synthesis of strand and is followed by the termination of transcription. pre-mRNA is protected from
exonuclease degradation through capping at 5’ end and polyadenylation at 3’ end [66]. Mature mRNA is
formed by removing introns from the pre-mRNA through splicing, which then serves as a template for
translation in ribosomes.
Only ~1.5% of the human genome is translated into proteins through mRNAs [67]. Although the rest of
the genome is actively transcribed to non-coding RNAs, they are not further translated into proteins.
Transcriptome usually refers to the total set of all RNAs or gene transcripts expressed in a specific cell or
tissue. Transcriptional profiles are time- and tissue-specific owing to the variable expression of genes in
different cells and tissues. Transcriptome shows more variation across tissues than individuals [68]. Also,
inter-individual variation in gene expression can be mainly due to disease candidate genes associated with
sex, ethnicity, and age [68]. Therefore, it is essential to use the appropriate tissue sample to assess the
corresponding transcriptome. For instance, in this thesis, Study I used SAT to identify weight-loss
associated gene expression changes, as SAT is a highly relevant tissue to study obesity. The Genotype-

Literature Review
11
Tissue Expression (GTEx) project serves as a comprehensive resource to study tissue-specific expression
and regulation [69], currently it has 54 non-diseased tissue sites from more than 1000 individuals.
2.2 Quantifying transcriptome and DNA methylation
DNA methylation and transcriptomic data used in this thesis are generated using microarrays with different
chemistries and technology. However, they are very similar in their general workflow. The key steps in the
general workflow of microarray chip technology are sample preparation, array processing and scanning
followed by data analysis, as outlined in the Figure 3.
Figure 3: A general workflow of microarray chip technology outlining the key steps involved.
2.2.1 Profiling DNA methylation Variation
DNA methylation has been the most interrogated epigenetic mark because of its stability and ease of
accessibility compared to other epigenetic marks. Methods available to measure DNA methylation can be
grouped into three major classes: enrichment based-methods, methods using bisulfite treatment and
digestion with methylation sensitive restriction enzymes [70]. Here I will focus on bisulfite treatment
methods, specifically using microarrays. Bisulfite treatment protects methylated cytosines by converting
unmethylated cytosines to uracil residues, which are later converted to thymine during PCR amplification.
This step ensures that only methylated cytosines will remain as cytosines and can be interrogated by
microarrays or sequencing platforms. Both microarray and sequencing platforms serve as excellent
platforms to investigate genome-wide DNA methylation modifications with respect to a biological phenotype
at a single base resolution in a hypothesis free manner. Bisulfite sequencing is currently considered as the
golden standard to accurately measure genome-wide DNA methylation with a greater coverage [71,72].
Literature Review
12
Compared to sequencing-based approaches, microarrays provide limited coverage, however, they are
affordable enabling to perform studies with larger sample size.
The Illumina Infinium HumanMethylation microarrays are the most widely used microarrays to
investigate genome-wide DNA methylation and are currently available in three generations: 27k, 450k and
EPIC. To date IlluminaHumanMethylation450 (450k) array is the widely used platform with 485512 probes
targeting 99% genes and 96% of CpG island regions [73]. The newest EPIC array contains over 850000
CpGs with more than 90% sites on 450k and an additional 413743 CpGs, of which 333265 CpGs target
potential enhancer regions [74]. All the studies in this thesis were performed using 450k, hence the rest of
this section focuses only on 450k array.
Probes on the Illumina arrays are attached to silica beads deposited on the surface of Sentrix BeadChip
[75]. 27k array is based on Infinium I assay and was biased towards promoter regions [76]. To improve the
genomic coverage, 450k array was designed by including additional probes based on Infinium II chemistry
to the existing 27k array (Figure 4) [73,77]. Owing to this extension 450k array has probes with two different
assays. Infinium I has two bead types for each CpG to measure methylation and unmethylation using the
same color channel. While Infinium II uses single bead type with two color channels (red and green) and
detects methylation by single base extension (Figure 4) [73]. Because of the dual-channel readout, Infinium
II probes show larger variance and are less sensitive to detect extreme methylation values [78].
Comparatively, Infinium assay I is more robust and hence considered as a better estimator of methylation
state [78]. Several pre-processing and normalization methods have been developed to account for the two
different assays on the 450k array [79–88]. Specific preprocessing and normalization methods used in this
thesis are discussed in detail in the Materials and methods section.

Literature Review
13
Figure 4: The Illumina Infinium HumanMethylation450 BeadChip (450k) uses probes with two different assays. Inifinium I assay uses two bead types for each CpG locus corresponding to Methylated and Unmethylated state of the CpG site and detected in the same color channel. Infinium II assay employs single bead type for each CpG locus, with two color channels. Methylation state is determined by single base extension. Reproduced from: https://www.cancer.gov/about-nci/organization/ccg/research/structural-genomics/tcga/using-tcga/technology/illumina-humanmethylation450-data-sheet
Unlike the human genome, epigenome is tissue-specific and is dynamically changing in response to
internal and/or external stimuli. Thus, epigenetic changes can be causal or consequential. Therefore, utmost
care should be taken while designing an epigenetic study and the required considerations have been
comprehensively reviewed [26,70,89–91]. Most importantly, both phenotype and sample collection must be
measured concurrently to appropriately assess the impact of biological phenomenon on the epigenetic mark
in the specific tissue of interest. A brief overview of important considerations while analyzing DNA
methylation data is presented in the following paragraphs.
Literature Review
14
Affordability of Illumina arrays coupled with their ability to perform genome-wide interrogation of the
DNA methylation lead to explosion of EWASs. However, the computational and statistical analysis methods
are still evolving to appropriately analyze methylation data and integrate it with other omics data. As
discussed above using specific tissue sample is paramount for understanding DNAm variation in association
with a phenotype. In addition to using the appropriate tissue for performing EWAS, adjustment for cell type
confounding is essential. That is, the compositions of cells in a tissue could vary with phenotype/disease or
tissue sampling. Hence, adjustment for cell type confounding is essential to ensure that measured
epigenetic difference is reflecting true DNAm variation and not reflecting differences in cell-type composition
of the tissue. Most of the EWASs performed so far used whole blood because of its ease of accessibility
and can also serve as proxy for tissues like brain which are difficult to obtain non-invasively. Houseman’s
reference-based algorithm is the most widely used method to adjust for confounding by blood cell types
[92]. Reference-free methods have also been designed allowing for cell-type correction in other tissues
[93,94]. Although cell-type correction is an important consideration in the analysis of DNAm data obtained
from complex tissues, it should also be noted that the cell-type variation could be a hallmark for certain
phenotypes and hence, can in some cases, still be useful as a biomarker.
Because of their dynamic nature, it is difficult to establish causal, consequential or confounding role of
epigenetic variation with respect to a disease or phenotype [91]. Furthermore, environmental factors like
smoking, and developmental factors like age, impact DNAm and can lead to spurious associations in EWAS.
Hence, confounding from these known sources of variation need to be adjusted in EWAS. Additionally,
unmeasured confounders can be adjusted by methods such as principal components analysis (PCA), by
using principal components correlated with the phenotype of interest as covariates. However, by using
informative study designs in EWAS (described below) we can mitigate these problems to some extent and
infer the role of DNAm in the phenotype. Finally, to ensure the credibility and reproducibility of the identified
associations, EWAS hits need to be replicated, ideally in an independent dataset.
Longitudinal cohorts, following unrelated healthy individuals from birth, by recording phenotypic
changes and samples at regular time intervals could serve to differentiate causal and consequential DNAm
variation. Monozygotic (MZ) co-twins share the same genotype, age and sex as well as early-life
environment, allowing to dissect the genetic and environmental contributions to a disease phenotype [95].
Notably, epigenetic variability within MZ co-twins has been observed with respect to the intrauterine
environment and time of splitting of the zygote (see Table 1 for subtypes of MZ twin pairs) [95,96].
Nevertheless, more evidence from larger samples is needed to determine the impact of prenatal develop
ment during twinning on the epigenetic similarity of MZ twin pairs. Discordant MZ twin pair design is based
on the hypothesis that the observed phenotypic discordance within MZ twin pairs is likely a response to
non-genetic (environmental and stochastic) factors. Thus, the underlying phenotypic discordance is likely
mediated by epigenetic mechanisms, whether causal or consequential to the respective phenotype. In this

Literature Review
15
thesis, BMI-discordant MZ twin pairs were used as a validation cohort in Study I. Inter-individual variation in
DNAm at specific CpG sites can be attributed to underlying genetic variations (i.e. genetic differences
between individuals) [58,97]. Also, genetic and environmental effects on complex trait variation can be
estimated by comparing the phenotypic similarity between MZ and DZ twins using twin heritability estimates.
By comparing genome-wide epigenetic profiles of twins, regions with high epigenetic heritability estimates
can be identified, where DNA methylation could be affected by genetic variation [98]. Loci harboring these
genetic variants (usually SNPs) influencing methylation are termed as methylation quantitative trait loci
(mQTL). DNAm variation associated with mQTLs can be considered as consequential to the SNP.
However, statistical approaches like Mendelian randomization can be used to assess causality and direction
of effect of DNAm variants, by testing whether DNAm mediates the effect from genetic variant to phenotype
through the same biological pathway [99].
Potential functional consequences of disease-associated DNAm variants can be inferred by integrating
DNAm data with transcriptome data. However, to confirm the regulatory role of DNAm in gene transcription,
functional studies are required [100]. Integrating DNAm data with other epigenetic marks and other omic
layers will probably provide a holistic overview of underlying biological mechanism. However, this would
require large datasets with multi omics data and statistical methods for integration and interpretation of data.
Thankfully several resources and international consortiums are already striving to achieve this goal.
ENCODE [101], NIH Roadmap Epigenomics [102], BLUEPRINT [103], and International Human Epigenome
Consortium (IHEC) [104] are some of the excellent available resources facilitating epigenetic research.
Additionally, to enable scientific progress datasets are being made publicly available in repositories such as
the Gene Expression Omnibus (GEO).
2.2.2 Transcriptome profiling
Transcriptome analysis using microarrays provides a snapshot of transcriptional activity and expression
levels of thousands of genes (mRNA transcripts) in a specific cell or tissue. Microarray investigates labelled
DNA sequences (targets), using a collection of probes. Probe is a short stretch of DNA representing a
specific sequence within a gene. Affymetrix Human Genome U133 Plus 2.0 Array (Affymetrix, Vienna,
Austria) was used to assess transcriptome in Study I of this thesis. This is a high-density microarray, with
multiple short oligonucleotide probes (25 base pair; bp) per target, synthesized directly on its surface. It has
~ 1300000 unique oligonucleotide probes covering over 47000 transcripts and variants
(https://www.affymetrix.com/support/technical/datasheets/human_datasheet.pdf). To ensure accurate
quantification and to account for nonspecific hybridization, probes are provided as probesets (~ 54 000
probesets) [105]. Typically each probeset corresponds to a gene with one perfect-match probe and one
mismatch probe which differ at the 13th position of the 25 bp probe [105]. Perfect-match probe is designed
to exactly match the sequence of interest.
Literature Review
16
To study transcriptome, mRNA is first converted to complementary DNA (cDNA) and labelled with
fluorescent dyes. This labelled target is then hybridized to the microarray with bound probes. The successful
hybridization of target and probe results in increased fluorescence intensity compared to background, which
is captured by a scanner [75,105]. Expression values are then derived by summarizing probe intensities of
each probeset [106]. Unlike microarrays, Ribonucleic acid-sequencing (RNA-seq) allows high-throughput
sequencing of cDNA, enabling characterization of the transcriptome with higher coverage and greater
resolution [107]. Although RNA-seq is relatively expensive compared to microarrays, it provides higher
accuracy and is not limited to the detection of annotated gene transcripts and thus can be used to discover
novel transcripts [108]. A general RNA-seq workflow includes sample preparation, library construction,
sequencing and data analysis.
Similar to the epigenome, transcriptome is also time- and tissue-specific, and dynamically changes with
internal and external stimuli. Also, transcriptome represents a snapshot of gene transcription from a mixture
of cells (cellular heterogeneity). As outlined in the section 2.2.1, study design and concurrent collection of
phenotype and tissue samples are also crucial in designing transcriptome studies.
2.3 Obesity and Smoking: Complex Interplay of Genetic and Epigenetic factors
2.3.1 Obesity
Obesity is a complex disease associated with several comorbidities and chronic diseases and is also one
of the leading risk factors for mortality. Obesity is generally defined as a pathological condition caused by
excess accumulation of body fat [109]. It primarily occurs due to the long-term imbalance between energy
intake and energy expenditure. However, the underlying causes leading to the development of this
imbalance are not fully understood. A rapid increase in the obese population and health risks incurred due
to obesity made obesity as a pandemic.
Body mass index (BMI), calculated by dividing weight in kilograms by height in meters squared (kg/m2),
is typically used to classify individuals as: underweight (< 18.5), normal (18.5- 24.9), overweight (25–29.9)
and obese (>30). More than 1.9 billion adults were estimated to be overweight in 2016, with a global
prevalence of obesity nearly tripled since 1975 [110]. With the increase in BMI relative risk for type 2
diabetes (T2D), hypertension cardiovascular diseases and certain cancers also increase [111]. A recent
study reported that maintaining a normal BMI could prevent 1 in 7 premature deaths occurring in Europe
[112]. Even more alarming is the prevalence of childhood obesity with 41 million children (below age 5)
classified as overweight or obese [110]. Childhood obesity is associated with T2D in adolescents [113,114]
and premature mortality in adulthood [115]. Moreover, obesity imposes huge clinical and public health
burden, in Finland alone the estimated annual costs of obesity are around 300 million euros [116].
Literature Review
17
Although BMI serves as a crude estimate of overall adiposity, it does not reflect the variation in body fat
distribution. Waist circumference provides a measure of abdominal fat distribution, while waist-to-hip ratio
(WHR) also assesses different aspects of body composition in addition to fat distribution [117]. Assessment
of body composition provides accurate estimation of fat and muscle mass composition, enabling improved
clinical evaluation of obesity and weight loss [118]. Bioelectrical impedance analysis (BIA) and dual-energy
X-ray absorptiometry (DEXA) can accurately measure body fat and skeletal muscle (comprehensively
compared in [118]).
In this thesis, Study I and II use SAT to investigate impact of weight loss and smoking, respectively.
The following section provides a comprehensive overview of adipose tissue before reaching a detailed
discussion of epigenetic studies in obesity and smoking.
2.3.1.1 Adipose Tissue
Adipose tissue (AT), commonly called as “fat”, is the primary energy reservoir in the human body. It stores
excess energy in the form of triglycerides, a type of lipids, through lipogenesis. AT is also the largest
endocrine tissue secreting various hormones, growth factors and adipokines regulating several
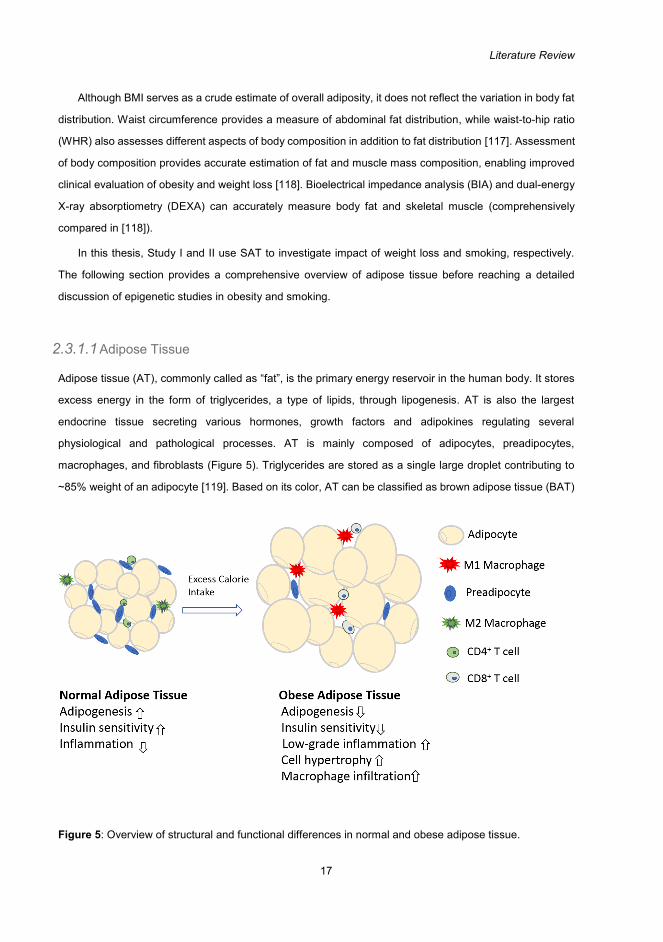
physiological and pathological processes. AT is mainly composed of adipocytes, preadipocytes,
macrophages, and fibroblasts (Figure 5). Triglycerides are stored as a single large droplet contributing to
~85% weight of an adipocyte [119]. Based on its color, AT can be classified as brown adipose tissue (BAT)
Figure 5: Overview of structural and functional differences in normal and obese adipose tissue.

Literature Review
18
and white adipose tissue (WAT). BAT predominantly occurs from fetal to adolescence phase and is found
in a smaller proportion in the adult body [120]. BAT dissipates energy as heat through thermogenesis via
uncoupled protein 1-containing mitochondria [120]. WAT can be further classified based on its location as
subcutaneous adipose tissue (SAT, located beneath the skin) and visceral adipose tissue (VAT, associated
with internal organs). SAT is the largest body fat reserve accounting for 80% of the total body fat and is
distributed across the upper and lower body [121]. SAT and VAT differ in their development, structure,
function and are associated with different health risks [122]. Beige or brown-to-white adipocytes are recently
identified adipocytes, exhibiting characteristics of both WAT and BAT. They are structurally similar to WAT
(formed via browning of WAT) and are capable of thermogenesis like BAT [120].
Beige cells can contribute to heat production when exposed to stimuli such as cold and exercise [120].
Emerging evidence suggests a central role of beige adipocyte thermogenesis in whole-body energy
metabolism and thereby obesity [123]. An obesity-associated FTO allele (rs1421085 T-to-C single-
nucleotide variant) has been shown to repress mitochondrial thermogenesis in adipocyte precursor cells,
resulting in a cell-autonomous developmental shift from energy-dissipating beige adipocytes to energy-
storing white adipocytes [123].
Leptin, adiponectin and tumour necrosis factor-alpha (TNF-α) are the prominent hormones secreted by
AT which perform diverse functions. Leptin is mainly secreted by AT and leptin signalling from adipocytes
to hypothalamus is crucial for appetite control and energy balance. Discovery of this specific role of leptin
deeply enhanced our understanding of AT as an endocrine organ and its role in obesity [124–127]. Total
absence of functional leptin in ob/ob mutant mice generates obesity phenotype and injecting leptin has
shown to induce weight loss in these mice [128]. Morbidly obese individuals with leptin deficiency showed
huge weight loss on leptin therapy [129–131]. Adiponectin, exclusively secreted by adipocytes is known to
regulate insulin sensitivity, vascular function and has anti-inflammatory properties [119,126]. TNF-α is a pro-
inflammatory adipokine associated with dysregulation of carbohydrate and lipid metabolism through AT
dysfunction [132].
To facilitate whole-body energy balance AT undergoes dynamic remodelling based on nutrient supply
[133]. In the starvation mode, triglycerides in adipocytes are converted to free fatty acids (FFA) and glycerol
through the lipolytic pathway [134]. FFA and glycerol are then distributed throughout the body via blood
restoring the energy balance. During excess calorie intake, adipocytes accommodate lipids either by
increasing their size (hypertrophy) or number (hyperplasia). Concurrently, hypertrophic adipocytes recruit
preadipocytes which are then differentiated into mature adipocytes to store excess energy. However,
prolonged periods of AT expansion coupled with chronic excess energy intake leads to AT dysfunction
[135]. Adipocytes become overloaded with lipids and can no longer accommodate excess energy after
reaching a critical size. This leads to lipid spillover resulting in the storage of lipids in the liver, pancreas,
and muscle causing insulin resistance in these organs [134]. Furthermore, hypertrophy of adipocytes

Literature Review
19
dysregulates secretion of adipokines resulting in a low-grade inflammatory state (Figure 5). Increased
adipokine secretion promotes macrophage infiltration into AT and subsequent impairment of preadipocyte
recruitment and differentiation. Altogether, increased inflammation, elevated adipokine levels and disrupted
lipid metabolism leads to insulin resistance of AT [132]. Insulin resistance is a prominent feature in obesity,
metabolic syndrome, and type 2 diabetes (T2D) [136]. Most importantly obesity results in increased AT
mass and impaired secretion of adipokines, making AT a direct link to understand pathologies associated
with obesity [119,132,135,137].
2.3.1.2 Epigenetics and Transcriptomics of obesity
Genetic predisposition is considered as the primary factor contributing to obesity. Heritability estimates from
twin studies estimated that around 45 to 85% variance in BMI could be attributed to genetic variance [138–
140]. Fat mass and obesity associated (FTO) gene was the first obesity-associated gene identified by
GWASs in 2007 [141,142]. A series of GWASs since then identified several hundreds of obesity-associated
variants, and explain ~3% variance in BMI [143–146] and ~40% of variance in BMI was explained with
whole-genome sequencing [10].
In addition to genetic susceptibility, the dramatic increase in the prevalence of obesity can also be
attributed to obesogenic environment with abundant availability of calorie-rich food [147], increased portion
size, and reduced physical activity [148]. However, there is a huge variability in the susceptibility of obesity,
and not all individuals exposed to obesogenic environment develop obesity [149]. This variability can be
attributed to the complex interplay of genetic, behavioral and environmental factors making obesity a
multifactorial disorder.
Emerging evidence suggests that epigenetic modifications can be considered as the obvious
mechanism that connects the effects of obesogenic environment and genetic susceptibility of obesity [150–
155]. Alteration of gene expression by epigenetic mechanisms could partly account for both missing
heritability and inter-individual variation of obesity.
DNAm, as one of the epigenetic marks, has been extensively studied to understand its contribution to
obesity and associated metabolic complications, like T2D [150]. Especially MZ twin pairs discordant for BMI
has served as an ideal design setting to unravel the impact of environment on the epigenome and obesity
[58,95,156]. Furthermore, studies performed on the Dutch Hunger Winter showed that adverse intrauterine
environment like insufficient maternal diet can cause persistent changes in DNAm along with increased
disease risks during later life, including increased risk for obesity and glucose intolerance [157–159]. A
recent stepwise genome-wide mediation analysis using the Dutch Hunger Winter data revealed that whole
blood DNAm at specific CpGs mediates a significant proportion of the association between prenatal famine
exposure and later-life metabolic health i.e. body mass index (BMI), serum triglycerides (TG) [160].

Literature Review
20
Extensive research has been ongoing to unravel DNAm variants associated with obesity and has been
comprehensively reviewed [150,152,154,161–166]. No clear global methylation direction has been
established in association with obesity, as studies reported both hyper- and hypomethylation with increase
in obesity-related measures [152]. CpG sites located within or near HIF3A, CPT1A, and ABCG1 have been
consistently reported in association with BMI and/or waist circumference [150]. HIF3A, (hypoxia-inducible
factor 3 subunit alpha) is involved in hypoxia (low levels of oxygen) regulation and CPT1A encodes carnitine
palmitoyltransferase 1A enzyme essential for fatty acid oxidation, while ABCG1 (ATP-binding cassette sub-
family G member 1) mediates cholesterol efflux to prevent cellular lipid accumulation. Sayols-Baixeras and
colleagues identified 94 CpG sites associated with BMI and 49 CpG sites associated with waist
circumference which could explain 26% and 29% of heritability of these traits, respectively [167]. The largest
EWAS on BMI till date identified 187 CpGs associated with BMI and most of these identified CpGs were
consequential to obesity [168]. This observation was also confirmed by Mendelson and colleagues who
further showed that 18% of inter-individual variation in BMI could be explained by methylation of 83 BMI-
associated CpGs [169]. Furthermore, they identified differential methylation and expression of SREBF1
(sterol regulatory element binding transcription factor 1), a key regulator of lipid synthesis, associated with
adiposity and cardiometabolic disease.
Results from transcriptome profiling of SAT during obesity showed upregulation of inflammation [170–
173], immune response [170], and downregulation of mitochondrial functions [171,174], insulin signalling
[172] and lipogenic genes [173,175]. Most of the EWASs so far used whole blood to assess the impact of
obesity. Assessing more relevant tissues like SAT, would reveal the role of methylome in pathogenesis of
obesity. Rönn and colleagues identified 2825 BMI-associated genes in SAT, showing both differential
expression and methylation, including FTO and IRS1 genes [176]. IRS1 (Insulin receptor substrate 1)
initiates stimulation of glucose transport in SAT and muscle tissue. Three HIF3A CpG sites identified by an
earlier study [177] were also replicated in the female cohort of this study. On overall, obesity is associated
with epigenetic dysregulation resulting in DNAm variability and the obesity-associated CpG methylation
show modest effect sizes.
2.3.1.3 Epigenetics and Transcriptomics of Weight loss
A modest, sustained weight loss around 5% is estimated to achieve clinically meaningful reductions in blood
glucose, triglycerides and the risk of T2D [178]. Despite our greater understanding of obesity-associated
changes in SAT functionality, it is still necessary to elucidate distinctive impacts of weight loss on SAT.
Presumably, weight loss should reverse the adverse effects of obesity, including pathological expansion of
SAT, inflammation and insulin resistance. Therefore, it is crucial to understand how weight loss affects SAT
structure, functionality and associated inflammatory profiles.

Literature Review
21
Table 2 outlines the genome-wide transcriptomic and/or methylome analyses performed in SAT during
weight loss by diet and/or exercise (excluding surgical procedures). Findings from these studies show little
overlap, likely due to discrepancy in their study designs, duration of the study, sample size, participants
considered for the study (overweight to morbidly obese) and sex of participants. Results from the
transcriptomic studies indicated that weight loss influences expression levels of genes associated with
polyunsaturated fatty acids production [179], improved high-density lipoprotein (HDL)-mediated cholesterol
transport [180], insulin secretion from pancreatic beta cells [181], reduced inflammation [180,182] and
insulin-like growth factor signalling [183]. In studies with both transcriptome and methylation analyses,
weight loss attained through exercise showed differential expression and methylation of genes associated
with adipocyte metabolism [60]. Whereas calorie restriction modified expression levels of genes associated
with angiogenesis and methylation levels of genes involved in insulin secretion pathways [184]. A recent
review on 25 prospective studies comparing DNA methylation in various tissues (including surgical and
candidate gene approach studies) concluded that small but widespread changes occur across genome in
response to weight loss [185]. This review also suggested that limited reproducibility of results could be
partly due to dynamic nature of DNAm, and that inter-individual variation in DNAm at several genomic loci
can impact weight loss. In summary, our understanding of SAT transcriptome and methylome and their
interplay in response to long-term weight loss still remains limited.
Table 2: Table summarizing the findings from genome-wide weight loss transcriptome and/or methylome studies performed on SAT (in chronological order).
Research Objectives Study Design Assay* Main Findings┼ Ref.
Gene Expression Studies: diet and /or exercise interventions
To investigate the consequence of calorie deficit on the inflammation-related genes in SAT.
Twenty nine obese premenopausal women followed VLCD for 28 days and were compared with 17 non-obese subjects.
Stanford cDNA microarray and RT-PCR
Weight loss improved inflammatory profile of adipose tissue by simultaneously decreasing expression of proinflammatory factors and increasing expression of anti-inflammatory molecules.
[182]
To investigate the impact of two LCDs with same energy content but different compositions of fat and carbohydrate on SAT gene expression.
Ten week intervention of 40 post and pre-menopausal obese women who were randomly assigned to either a low-fat, high-carbohydrate diet (n=20) or a moderate-fat, moderate-carbohydrate diet (n=20).
Affymetrix Human Genome Focus arrayand RT-PCR
Genes regulating polyunsaturated fatty acids were affected by energy deficit. Although no effect was observed due to varying compositions of carbohydrates and fats.
[179]
1. To identify SAT gene expression profiles differing between weight responders and non-responders to a low-fat diet.2. To use these
Obese women were grouped into weight responders (n=27) and non-responders (n=26), based on the weight loss following a low-fat diet for 10 weeks. SAT biopsies before the intervention were used to
Agilent 44K whole human genome microarrays
Nine common genes identified from different statistical methods were used to predict weight loss. However, the prediction accuracy was low and couldn't clearly distinguish respondents from non-respondents.
[186]

Literature Review
22
identified expression profiles to predict whether an individual will lose weight during diet intervention.
identify differential expression profiles.
To investigate the effects of two LCDs with same energy content but different compositions of fat and carbohydrate on SAT gene expression.
Obese women were randomly assigned to a 10 week low-fat (n=47) or moderate-fat (n=47) diet. Two sets of women combined from both the diets were assessed using a candidate gene approach (n=46) or microarrays (n=48).
Stanford cDNA microarray and RT-PCR
Energy limitation had a predominant impact on the SAT expression profiles compared to the composition of fats and carbohydrates in the diets. Although macronutrient composition may influence SAT function and metabolic response.
[187]
Tocomprehensively identify gene expression changes occurring in SAT during three stages of a dietary intervention program and to investigate the link with insulin sensitivity.
Twenty two obese women participated in a dietary intervention program with three consecutive phases: a 1-month VLCD, a 2-month LCD and a 3-4-months of a weight maintenance diet. Only 8 biopsies were available for generating microarray data.
Agilent 44K whole human genome microarrays
Distinct molecular mechanisms were observed during VLCD and weight stabilization phase including opposite regulation of genes in adipocytes and macrophages. Also, different genes were responsible for the improvement of insulin sensitivity in both phases.
[188]
To investigate SAT expression profiles of obese women who initially lost weight and then showed different weight trajectories after following diets with varying protein and glycemic index content.
After an initial VLCD of 8 weeks, obese women were randomly assigned to 4 diets with varying protein and glycemic index content for 6 months. SAT expression profiles were compared between women with continuous weight loss (n=22) and women who regained weight (n=22) across the 4 diets.
Agilent 44K whole human genome microarrays
Differences observed in SAT expression profiles of two groups of women were primarily due to weight variations rather than diet compositions. Continuous weight loss was associated with mitochondrial oxidative phosphorylation whereas weight regain was associated with cellular growth and proliferation.
[189]
To investigate if SAT gene expression profiles during a LCD can be used to distinguish subjects with successful weight maintenance from weight regainers.
Forty white women followed an 8 week LCD phase followed by a 6-month weight-maintenance phase. SAT profiles were compared between weight maintainers (WMs, n=20) and weight regainers (WRs, n=20).
Agilent 44K whole human genome microarrays
Although both WMs and WRs lost considerable weight during LCD, their SAT profiles revealed differential regulation of genes associated with fatty acid metabolism, citric acid cycle, oxidative phosphorylation, and apoptosis.
[181]
To identify differentially expressed genes during weight loss and weight maintenance
Nine of twelve obese subjects who followed an initial LCD phase for 3 months and a weight maintenance phase for six months were used to assess SAT expression profiles.
HG-U133 Plus 2.0 array and reverse transcription quantitative PCR
Weight loss and weight maintenance reveal distinct biological mechanisms with reciprocal regulation at several genes. Both CETP and ABCG1, participants of HDL-mediated reverse cholesterol transport, were most upregulated after both processes.
[180]

Literature Review
23
To investigate the effect of a six-month intervention using calorie restriction, exercise or both on SAT expression profiles.
Forty five obese postmenopausal women were randomly allocated to diet, exercise and diet plus exercise groups. After the six month intervention, all the women includingcontrols were classified based on the extent of weight loss to compare their SAT gene expression profiles.
Illumina Human HT-12v3 Expression Beadchips
Significant changes in SAT expression profile were identified, particularly in genes associated with sex hormone steroid synthesis, leptin and insulin signaling. Interestingly, no pathways associated with inflammation were implicated in this study.
[183]
Both Transcriptome and Epigenome-wide association studies: diet or exercise interventions
To determine the contribution of DNAm and gene expression changes to weight loss responsiveness.
Fourteen overweight and obese postmenopausal women followed LCD for six months and were classified as high responders (HR) or low responders (LR) based on their body fat loss percentage. Differential methylation and expression analyses were performed comparing HR and LR before and after LCD.
Affymetrix HG U133 plus 2.0 GeneChip microarray and Human CpG-island 8.1 Karray
Significant DNAm changes between HRs and LRs were identified at baseline and after LCD. While differences in gene expression profiles were seen only after LCD. DNAm changes were related to weight control and insulin secretion pathways whereas gene expression changes were associated with angiogenesis and cerebellar long-term depression pathways.
[184]
To examine changes in SAT DNAm and gene expression patterns after a six-month exercise intervention.
SAT DNAm and expression profiles were compared in 23 healthy but sedentary men before and after a six-month intervention.
Affymetrix GeneChip Human Gene 1.0 ST whole transcript based array and Infinium HumanMethylation450 BeadChip assay
Differential methylation patterns were observed at both global and individual CpG site level in response to exercise including candidate genes for obesity and type 2 diabetes. Genes exhibiting both differential methylation and expression in response to exercise were shown to influence adipocyte metabolism.
[60]
DNAm: DNA methylationRT-PCR: Reverse Transcriptase polymerase chain reactionSAT: subcutaneous adipose tissueLCD: low calorie dietVLCD: very low calorie dietAssay*: Microarray platform and techniques used to assess gene expression or DNAmMain Findings┼: Majority of the findings in this table are from early studies in the field, so results have not been adjusted for cell type confounding.
2.3.2 Smoking
Smoking is a major causal risk factor for several chronic diseases and is a prominent cause of preventable
mortality accounting for ~7 million deaths annually [190]. In addition to the well-established negative impact
of smoking on lung cancer, chronic obstructive pulmonary disease (COPD) and heart disease, smoking also
inflicts comorbidities like tuberculosis, alcohol use and worsens mental illness and HIV infection [191]. The
total economic cost of smoking in Finland is around 2589 million euros [191].
Smoking is a complex behavior which progresses through multiple stages, mainly smoking initiation,
development of nicotine dependence (among most but not all smokers), nicotine withdrawal when
attempting to quit smoking, cessation and relapse [192]. Several factors contribute to smoking initiation such
as peer pressure during adolescence [193–195], positive image of smoking, socioeconomic status, parental
smoking, sex, ethnicity and other substance use [196–198]. Despite the knowledge of smoking-associated

Literature Review
24
health risks more than a billion people are still smoking. In Finland, more than 731000 adults (aged above
15 years) use tobacco each day [191]. This highlights the addictive or dependence nature associated with
smoking and nicotine intake.
Tobacco contains about 7000 toxic chemicals and 70 carcinogens [191], of which nicotine is the most
addictive substance. Nicotine promotes compulsive smoking by creating positive reinforcement in smokers
by altering dopamine and adrenaline in the brain. On inhaling smoke from burning tobacco, distilled nicotine
enters lungs, where it is rapidly absorbed and then transported to brain via blood stream in less than 20
seconds [199]. Nicotine then binds to nicotine acetylcholine receptors (nAChRs) in the brain tissue releasing
adrenaline and dopamine. This rapid spike in the levels of nicotine followed by release of neurotransmitters
elicits feeling of pleasure and calmness making smokers nicotine dependent [200], leading to
neuroadaptation and a positive feedback leading to greater intake. However, the extent of dependency or
addiction varies and smokers who exhibit high nicotine dependence have extreme difficulty in quitting
smoking. Furthermore, nicotine withdrawal symptoms such as insomnia, depressed mood, anxiety,
restlessness and loss of appetite increases the likelihood of relapse [201–203].
2.3.2.1 Epigenetics of smoking
In addition to behavioral, physiological and environmental factors, genetic factors [204], and perhaps
epigenetic factors, also strongly influence smoking behavior. Heritability estimates from twin studies
revealed that genetic differences among individuals have a substantial impact on multiple aspects of
smoking behavior, including smoking initiation and nicotine dependence [205,206]. Several loci associated
with various stages of smoking have been identified by candidate gene approaches and GWASs. The
nicotinic receptor genes CHRNA5–CHRNA3–CHRNB4 at 15q25 [207–213] and the primary nicotine
metabolism gene CYP2A6 at 19q13 [214,215] are the most significant and consistently replicated
associations with nicotine dependence, cigarettes per day and smoking cessation.
Smoking is the most widely studied lifestyle factor which substantially influences DNA methylation, with
current and never smokers exhibiting different methylation profiles [61,64,216–222]. It has been consistently
reported that majority of the smoking-associated CpGs are hypomethylated in current smokers compared
to never smokers. It was also shown that methylation levels of former smokers partially reverse upon
cessation, towards the levels of never smokers [61,216,219,220,222,223]. However, the extent of reversal
is site-specific, determined by the magnitude of smoking-induced methylation alterations at the specific CpG
site [216,219]. Interestingly, CpGs with persistent methylation alterations after decades of cessation have
been reported, indicating a broader and long-lasting impact of smoking on methylome [216,219,224].
Smoking is a well-established risk factor for several diseases. Differential DNA methylation due to
smoking has also been observed in relation to smoking-related diseases (e.g. cancers) [225–227],
suggesting a potential role of DNA methylation in the pathway from smoking to disease development.

Literature Review
25
Furthermore, this also makes DNA methylation as a suitable biomarker to predict both smoking and
smoking-associated disease risk.
2.3.2.2 Epigenetic signatures of disease: DNAm-based predictors
Lately, disease-associated genetic and epigenetic signals are being computed into a usable score to predict
disease risk. For instance, polygenic risk scores computed using trait-associated genetic loci and their
associated weights have been used to predict genetic susceptibility for a trait (e.g. progression of smoking
behavior [192]). DNAm serves as an ideal biomarker owing to its dynamic and reversible nature in response
to external and internal stimuli. Recently, there has been a growing interest in the development of DNAm-
based predictors to predict onset or progression of a disease or phenotype (Table 3).
The following section provides a brief introduction to machine learning concepts to help understand the
overview on DNAm-based predictors.
Basic concepts in machine learning
Machine learning (ML) is a branch of artificial intelligence which uses computational algorithms and
statistical methods to enable computers to perform a specific task without the need for explicit instructions.
ML differs from statistical modelling, as ML primarily focuses on prediction than inferring relationships
between variables. The basic premise is that ML learns underlying patterns in the training data which are
then used to make predictions on the unseen data. ML involves application of mathematical rules and
statistical assumptions. Supervised and unsupervised learning are the main types of ML. Classification is
the most commonly used supervised learning algorithm, where the training is performed on a well labelled
dataset and learned patterns are then used to map unseen data to labels. Generalization of a model, that
is applying a model on unseen data to make reliable predictions needs to avoid both overfitting and
underfitting. Overfitting occurs when the model learns the noise in the training data along with underlying
structure, making it less generalizable to new data. Underfitting occurs when model is unable to capture the
underlying patterns in the data structure and therefore cannot make accurate predictions.
Penalized regression offers a practical alternative to subset the variables in linear regression by
applying a penalty constraint which shrinks the coefficients of variables [228]. Ridge, Least Absolute
Shrinkage and Selection Operator (LASSO), and elastic net regression are the most widely used penalized
regression methods. Ridge regression applies L2 norm (sum of the squared coefficients) and shrinks the
coefficients close to zero. LASSO applies L1 norm (sum of absolute values of the coefficients) and shrinks
most of the coefficients to exactly zero thereby performing variable selection [229]. Elastic net regression
applies a convex combination of ridge and LASSO. Amount of shrinkage can be regulated by a tuning
parameter (lambda). Cross-validation can be used to identify an optimal lambda to find the model´s best fit
and avoid overfitting. Table 3 below provides a brief overview of different DNA methylation-based predictors
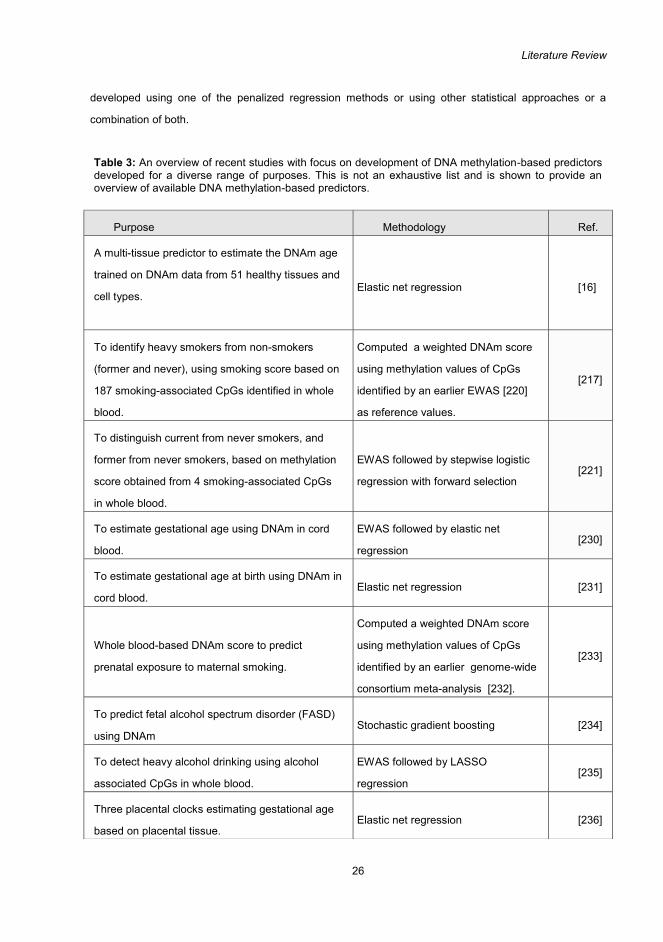
Literature Review
26
developed using one of the penalized regression methods or using other statistical approaches or a
combination of both.
Table 3: An overview of recent studies with focus on development of DNA methylation-based predictors developed for a diverse range of purposes. This is not an exhaustive list and is shown to provide an overview of available DNA methylation-based predictors.
Purpose Methodology Ref.
A multi-tissue predictor to estimate the DNAm age
trained on DNAm data from 51 healthy tissues and
cell types.Elastic net regression [16]
To identify heavy smokers from non-smokers
(former and never), using smoking score based on
187 smoking-associated CpGs identified in whole
blood.
Computed a weighted DNAm score
using methylation values of CpGs
identified by an earlier EWAS [220]
as reference values.
[217]
To distinguish current from never smokers, and
former from never smokers, based on methylation
score obtained from 4 smoking-associated CpGs
in whole blood.
EWAS followed by stepwise logistic
regression with forward selection[221]
To estimate gestational age using DNAm in cord
blood.
EWAS followed by elastic net
regression[230]
To estimate gestational age at birth using DNAm in
cord blood.Elastic net regression [231]
Whole blood-based DNAm score to predict
prenatal exposure to maternal smoking.
Computed a weighted DNAm score
using methylation values of CpGs
identified by an earlier genome-wide
consortium meta-analysis [232].
[233]
To predict fetal alcohol spectrum disorder (FASD)
using DNAmStochastic gradient boosting [234]
To detect heavy alcohol drinking using alcohol
associated CpGs in whole blood.
EWAS followed by LASSO
regression[235]
Three placental clocks estimating gestational age
based on placental tissue.Elastic net regression [236]

Literature Review
27
Epigenetic smoking status estimation
The precise knowledge of smoking history facilitates in designing appropriate treatments ranging from
preventive interventions for occasional smokers to cessation therapies for heavy current smokers. Further,
accurate smoking history can serve as a basis to predict long-term health risks associated with smoking
(e.g. lung cancer). Traditionally, smoking exposure is ascertained using self-administered questionnaires.
Diagnostic and Statistical Manual of Mental Disorders (DSM) [237] and the Fagerström Test of Nicotine
Dependence (FTND) [238] are the most commonly used self-report questionnaires to capture nicotine
dependence. However, self-reported smoking status is prone to errors due to under-reporting [239] and
poor recall of long-term smoking history. Also, it fails to account for the passive exposure to smoking.
Biomarkers like cotinine, can quantify the extent of absorbed nicotine in the body fluids [239]. Nonetheless,
its efficacy is limited to measuring recent exposure, as cotinine can be detected only for a few days at most
after smoking, given the half-life of 16 hours [240]. Moreover, usage of nicotine replacement therapy,
smokeless tobacco and e-cigarettes might also result in high levels of cotinine, resulting in inaccurate
evidence of smoking. This clearly demonstrates a requirement for a robust indicator of smoking exposure
that overcomes these limitations and can accurately measure current and past smoking.
Numerous independent studies performed on different populations have identified several smoking-
associated CpGs [61,64,216–222]. The so-far largest EWAS of ~16000 individuals has identified 18760
significantly differentially methylated CpGs across 7000 genes between current and never smokers [64].
Interestingly, many of these studies consistently reported the same top significant CpGs associated with
smoking, demonstrating the robustness of smoking-associated methylation signatures [61,64,216–222].
Methylation status of genes AHRR [241,242] and F2RL3 [222] have been suggested as potential
biomarkers to estimate smoking. Notably, two studies attempted to translate EWAS findings to scores that
reflect the extent of smoking [217,221]. Although quantifying cumulative methylation exposure into a score
is an interesting approach, the key challenges of applicability and interpretation remain. For instance, the
smoking score of Elliott et al [217] has an ethnic-specific threshold to differentiate smokers from never
smokers, limiting its universal applicability and necessitating threshold for each ethnicity. Methylation score
of Zhang et al [221] can only tackle binary comparisons i.e. current vs never and former vs never
smokers. To overcome these existing limitations, Study III in this thesis focused on developing a robust
smoking status classifier to estimate smoking status based on DNAm profiles of individuals. A detailed
description of the classifier development is provided in the section 4.5.3.
2.3.3 Smoking meets obesity: double jeopardy and a dual challenge
Smoking and obesity are the two leading preventable causes of death associated with a multitude of
comorbidities and health risks, with widespread effects across multiple tissues. The Framingham Heart
Study estimated that compared to normal-weight non-smokers, obese men and women smokers lost on
Literature Review
28
average 14 and 13 years of life, respectively [243]. However, their inter-relationship is highly complex and
unclear.
Several epidemiological studies concluded that current smokers have lower body weight compared to
never smokers and smoking cessation results in weight gain [244–248]. Causal role of smoking on BMI
reduction in current smokers has been demonstrated by two Mendelian randomization studies using a SNP
in the CHRNA5-A3-B4 gene cluster as proxy for heavy smoking [249,250]. In contrast to findings from BMI
studies, current smokers tend to have more abdominal obesity than never smokers [251]. A recent genome-
wide meta-analysis suggested that smoking alters genetic susceptibility to overall adiposity and body fat
distribution, showing a preference towards central adiposity with increased cigarette consumption [252].
Conversely, a recent Mendelian randomization study performed on UK Biobank cohort (n=372791) strongly
suggested that obesity and higher adiposity may influence smoking behavior and with each standard
deviation increase in BMI there is a chance of smoking one additional cigarette per day [253]. This
contradictory evidence on causal relationship between obesity and smoking highlights the complexity in the
underlying biological mechanisms.
Decreased BMI in current smokers has been associated with increased metabolic rate and reduced
appetite caused by nicotine [254]. Increased BMI after smoking cessation could be a result of increased
calorie intake and changes in fatty acid catabolism [255]. Regulation of appetite for tobacco and food has
been suggested as a possible common biological basis for nicotine addiction and obesity [256].
Furthermore, both nicotine dependence and obesity revealed common neuronal and behavioral circuits
triggering regions associated with reward, satiety and self-control within the brain [257,258]. In summary,
given the detrimental effects of smoking and obesity, and the associated comorbidities, it is crucial to
investigate the impact of their co-occurrence on mortality.

Aims
29
3 Aims
The primary objective of this thesis was to advance our understanding of obesity and smoking by identifying
and integrating DNA methylation variants with transcriptomics data by applying statistical methods and
bioinformatics tools. This thesis also focused on developing a robust classifier to predict smoking status
using DNA methylation profiles.
Rationale and aims specific to each study are listed below:1. Little is known about the crosstalk between gene expression and DNA methylation in SAT during weight
loss. Moreover, using a study design controlled for genetic variation serves as an ideal setting to unravel weight loss-associated expression and methylation changes independent of genetic influence. Concurrent evaluation of weight-loss associated expression and methylation changes in obesity can provide crucial insights into mechanisms governing both weight loss and weight gain.
Study I aimed to identify and integrate gene expression and DNA methylation changes in SAT during a one-year weight loss intervention. We used a validation cohort of BMI-discordant MZ twin pairs to examine the directionality of the identified changes in acquired obesity. We employed a longitudinal and BMI-discordant MZ twin approach to investigate effects of weight loss and obesity independent of genetic background.
2. Smoking is a well-established risk factor for several cancers including cardiovascular disease and diabetes. Several studies identified smoking-associated methylation signals in blood methylome, however, the broader impact of smoking on other metabolically relevant tissues and obesity remains unclear. SAT is a key metabolic organ with a crucial role in metabolic health and accumulation of adipose tissue has been associated with smoking behavior. Therefore, investigating smoking-associated changes in transcriptome and methylome of SAT provides valuable insights into effects of smoking on metabolic health phenotypes.
Study II aimed at comprehensively characterizing the impact of smoking on metabolically relevant SAT by simultaneously performing transcriptome- and methylome-wide association studies. We further aimed to link the identified smoking-associated signals with adiposity phenotypes to understand the impact of smoking on metabolic health.
3. Methylation-based smoking status prediction has been shown to be more robust than self-reported smoking status and biomarkers like cotinine which can only measure short-term exposure. Existing DNA methylation-based smoking status estimation methods use scores calculated from cumulative methylation levels at smoking-associated CpGs to identify smoking status. However, these approaches have limited applicability as a score threshold value needs to be computed for each dataset and can only perform binary classifications.
Study III aimed at overcoming the limitations of existing nicotine biomarker and DNAm score-based approaches by developing a robust smoking status classifier using a machine learning approach to predict the smoking status of individuals based on methylation signatures. To test the prediction performance and global applicability of the classifier three independent whole-blood test datasets and two existing methods were used. Additionally, we aimed to provide our classifier as an R package to facilitate theimplementation of the classifier in future studies to predict smoking status.

Materials and Methods
30
4 Materials and Methods
This chapter presents the datasets, phenotypes and statistical methods used in the Studies I to III.
4.1 Cohorts/Datasets
This section gives a brief overview of all the datasets used in this thesis. Multiple cohorts originating from
the Finnish population were used in the Studies I to III. Also, datasets from public repositories were used to
test or replicate the findings. More detailed descriptions of the cohorts can be found in the original
publications and references therein. Study-wise sample characteristics of all the datasets used in the thesis
are presented in Tables 4 and 5.
4.1.1 The Finnish Twin Cohort (Study I-III)
The Finnish Twin Cohort (FTC), was established in 1974 to investigate genetic and environmental factors
contributing to complex diseases and associated behavioral risks (www.twinstudy.helsinki.fi) [259,260]. The
three main longitudinal datasets of the FTC are reviewed below:
The Older Finnish Twin Cohort was formed in 1975 by ascertaining same-sex twin pairs (both
monozygotic and dizygotic) born before 1958 from the Central Population Registry of Finland [261]. This
cohort was further expanded in 1996 by the inclusion of opposite-sex pairs born during 1938-1949. An
additional three waves of follow-up data were collected in 1981, 1990 and 2011-2012 through mailed
questionnaires [259,260].
Essential Hypertension Epigenetics (EH-Epi) is a sub-study of the Older Finnish Twin Cohort
launched in 2011 to study hypertension. Twins were recruited based on the responses to the 2011-12
comprehensive questionnaire assessing diagnosed hypertension, history of hypertension and usage of
anti-hypertensive medication [262]. Participants in this study went through a comprehensive physical
examination, interview and blood sample collection during 2012-2015. A subset of 408 twins with
extensive smoking information from this study was used as a test dataset in the Study III.
FinnTwin16 study was initiated in 1991 by recruiting twins born during 1975-1979 [259,263]. The first wave
of assessments was performed on twins at the age of 16 along with their parents and siblings. Intensive
follow-up assessments were performed on the twins at ages 17, 18.5 and at young adulthood (age 22-25)
through mailed questionnaires.
FinnTwin12 study established in 1994 comprises twins born during 1983- 1987 [259,264]. At the baseline,
11 to 12 year old twins were assessed along with their parents and teachers. Twins were then followed up
at ages 14, 17.5 and 22.

Materials and Methods
31
TwinFat (n =109) [265], a sub-study formed from the FinnTwin16 and FinnTwin12 cohorts to
extensively investigate obesity in twins. A rare and deeply phenotyped dataset of 26 BMI-discordant MZ
twin pairs (intra-pair difference in BMI 3-10 kg/m2, males n = 9, females n = 17, aged 29.55 ± 4.61
years) from TwinFat was used as a validation cohort in Study I, to assess the expression and methylation
of weight responsive genes in acquired obesity. In Study II, 69 individuals (34 full MZ twin pairs, mean
age 31.1 ± 4.43 years, mean BMI 27.5 ± 4.72, 44.9% male) from the TwinFat with complete covariate
data as per the discovery cohort TwinsUK [266] (e.g. alcohol intake), were used to replicate methylation
associations with metabolic health traits.
4.1.2 Weight Loss Study (WLS) (Study I)
Nineteen obese volunteers (mean BMI 34.65 kg/m2) constituting 12 females and 7 males (Table 4) were
recruited for a 12-month weight loss program through a newspaper advertisement [118,267]. All participants
were healthy non-smoking weight-stable adults without any clinical complications and regular medications.
The intervention started with a very-low-energy diet (800–1000 kcal per day) for first 6 weeks, followed by
a normal weight loss diet in conjunction with exercise plans. Participants were given customized diet plans
at 0, 2 and 5 months.
4.1.3 DILGOM (Study III)
FINRISK study [268] comprises of nationwide surveys of the Finnish adult population on risk factors related
to chronic diseases performed every five years since 1972. DILGOM (Dietary, Lifestyle and Genetic
determinants of Obesity and Metabolic syndrome) (n=5024) [269,270] is a cross-sectional study originated
from the FINRISK 2007 study (n=6258), designed to investigate the impact of genetics, environment and
Table 4: Characteristics of the datasets used in the Studies I and II
Study Dataset Age(Mean ± SD)
M/F BMI(Mean ± SD)
Smokers Transcriptome Data
Methylation Data
I WLS 35.21± 7.79 7/12 34.65±2.67a - 19 19
TwinFat 29.55± 4.61 18/34 Heavy twins31.25±5.18
Lean twins25.28 ±4.52
only one co-twin smokes: 6
both twins smoke: 4 pairs
26 pairs 24 pairs
II TwinsUK* 58.40±9.56 0/345 26.82±4.81 54 345 345
TwinFat 31.05±4.43 31/38 27.47±4.72 21 - 69
aAt the baseline in weight loss study. *Methylation and transcriptome dataset from the TwinsUK cohort with only current and never smokers, used in discovery analyses to identify smoking-associated methylation and expression signals.SD: Standard deviation
Materials and Methods
32
lifestyle factors on obesity and metabolic syndrome. Comprehensive phenotypic data and blood samples
were collected from the participants. Genome-wide DNA methylation data and extensive smoking
information available from 514 individuals was used in Study III (Tables 5 and 6). We have also used plasma
cotinine measurements determined by gas chromatography-mass spectrometry available from 86 current,
31 former and 3 never smokers [271].
4.1.4 Public Datasets (Study III)
In Study III in addition to the FTC dataset (n=408), we have used two publicly available whole-blood datasets
[59,61], a buccal tissue [272] and a PBMC dataset [273] quantified on 450k array to test the performance
of the classifier (Tables 5 and 6). The first whole-blood dataset is from the EIRA study [59], a population-
based rheumatoid arthritis (RA) case-control study conducted in Sweden. We have used methylation data
and smoking status information from 687 participants, including 354 RA cases and 333 cases matched for
age, sex and smoking status. The second whole-blood dataset consisted of 464 participants from the
CARDIOGENICS consortium [61], a European descent case-control study of coronary artery disease,
including 238 patients. We have used 80 individuals (after excluding 40 moist-snuff users) with buccal tissue
methylation data (n=120) [272] composed of healthy Caucasian and African-American men from North
Carolina. The PBMC methylation data [273] was collected from 111 African-American women living in the
states of Iowa and Georgia, as a part of the Family and Community Health Study (FACHS).

Materials and Methods
33
4.2 Phenotypes
This section outlines the phenotypes associated with obesity and smoking examined in this thesis to profile
methylome and/or transcriptome. Extensive phenotypic information was used in Study I and Study III to
assess obesity and smoking-associated changes in adipose and whole-blood tissues, respectively.
4.2.1 Obesity
In WLS (Study I) all the clinical measures were taken at three time points (baseline, 5 and 12 months). To
assess the habitual dietary intake WLS participants were requested to maintain a detailed food journal for
three consecutive days at 0, 5 and 12 months. Additionally, lifestyle counselling sessions were held twice a
month for the first five months and monthly from sixth to twelfth month. At the end of the intervention,
Table 5: Characteristics of the training and test datasets used to train and evaluate the performance of smoking status classifier (Study III)
Datasets N Sex (M/F)Self-reported Smoking Status Age
(Mean, Range, SD)Current Former Never
Training Dataset (whole-blood)
DILGOM 474 215/259 113 118 243 52.2(25-74,13.6)
Test Datasets (whole-blood)
EH-Epi study 408 166/242 67 141 200 62.2 (32.3-69.7, 4.3)
EIRA (Epidemiological Investigation of Rheumatoid Arthritis)
687 196/491 266 228 193 51.9(18-70,11.8)
CARDIOGENICS 464 327/137 22 263 179 55.4(38-67, 6.7)
Test Datasets
Buccal 80a 80/0 40b - 40b 47.2(35-60, 7.9)
PBMCs 111c 0/111 50 - 61 48.4 (NA, 10)
aOf these 80 individuals, 58 were Caucasian, 21 were African-American and 1 unknown ethnicity. bIn buccal tissue data smoking behavior was defined as cigarette smoker and non-tobacco smoker. cAfrican-American ancestry. SD: Standard deviation; NA: Not available
Materials and Methods
34
complete data on energy intake and Baecke indices [274] were available from 15 and 16 participants,
respectively.
MZ twins from the TwinFat study (Study I validation cohort and Study II) were selected based on the
questionnaire data and during a twin’s clinical visit, interviews, on-site measurements of body composition
and sample collection (adipose tissue biopsy) was performed. All measures were used on continuous scale
in statistical analyses unless specified otherwise.
4.2.1.1 Clinical assessments
In the Study I identical protocols were followed in the weight loss- and the validation cohort unless specified
otherwise. Weight and height measurements taken after a 12-hour overnight fast were used to calculate
BMI and total body composition was assessed by dual energy X-ray absorptiometry (DEXA) (GE Lunar
Prodigy Madison, WI, England) [275]. In the weight loss cohort, liver fat was measured by magnetic
resonance spectroscopy (MRS) and volumetric subcutaneous adipose tissue (SAT) and visceral adipose
tissue (VAT) were measured by magnetic resonance imaging (MRI) [276]. Systolic and diastolic blood
pressure was measured in supine position and a mean of three consecutive measurements was considered
as the accurate measurement. To calculate homeostatic model assessment (HOMA)-insulin resistance
[277] and Matsuda-insulin sensitivity [278], plasma glucose (spectrophotometric hexokinase and glucose-
6-phosphate dehydrogenase assay, Roche Diagnostics, Basel, Switzerland) and serum insulin (time-
resolved immunofluorometric assay, Perkin Elmer, Waltham, MA, USA) were measured after a 12 hour
overnight fast by performing a 75-g oral glucose tolerance test (OGTT) [279] at four time points (0, 30, 60
and 120 min). Fasting plasma total cholesterol, HDL cholesterol, and triglyceride concentrations were
determined by enzymatic methods (Roche Diagnostics Hitachi, Hitachi Ltd, Tokyo, Japan) and LDL
cholesterol was calculated using Friedewald formula. In Study I fat percentage was considered as a
representative measure of adiposity and obesity.
In the Study II total fat mass (TFM) and android-to-gynoid fat ratio (AGR) were determined by DEXA.
4.2.2 Smoking
Smoking status was ascertained through self-reported questionnaire data in all the datasets and was used
as a categorical variable in all the analyses. Except for the PBMC dataset, smoking status was defined with
respect to the cigarette consumption (Table 6). FTC and EIRA datasets also included additional smoking
measures enabling us to comprehensively assess the smoking status of the participants. Table 6 provides
a summary of the smoking phenotypes used in this thesis.
In Study III DILGOM data was used as the training dataset to build a smoking status classifier (see
Table 6 for detailed smoking status definitions). Hence, to ensure the classification accuracy of the classifier

Materials and Methods
35
and to minimize bias, smoking behavior of the participants was thoroughly assessed using a combination
of the following three measures:
1. Self-reported smoking status:
a. Never Smoker
b. Former Smoker (quit more than a year ago)
c. Recent quitter (quit 1 month to year ago)
d. Current occasional smoker
e. Current daily smoker
2. When did you have your last cigarette? (measured using 7 response alternatives):
1. Yesterday or today
2. Two days to one month ago
3. One month to half a year ago
4. Half a year to year ago
5. 1 to 5 years ago
6. 6 to 10 years ago
7. More than 10 years ago
3. Cotinine measurements
Self-reported smoking status was validated with cotinine measures where available (86 current, 31
former and 3 never smokers) and using a response measured on a scale of 1-7 about last smoking (Q:
when did you have your last cigarette). We considered current occasional smokers with either high cotinine
values or who smoked their last cigarette less than six months ago as current smokers. By using a
combination of the above three measures I have excluded 28 former, 2 never and 6 occasional smokers
with discrepant smoking information from the further analyses.
I used 408 twins from the FTC corresponding to the EH-Epi study as a test dataset in Study III.
Comprehensive smoking information available from these participants, including cumulative pack-years,
smoking abstinence duration (years since quitting) and passive smoking information was used to perform
secondary analyses in Study III. Current smoker category was subdivided into current daily and current
occasional smokers in FTC and EIRA datasets based on frequency and extent of smoking.

Materials and Methods
36
Table 6: Detailed smoking-status definitions from all the datasets used in Study III
Self-reported
smoking status
DEFINITION
DILGOM (N=474) Smoking behavior of the study participants was thoroughly assessed using three
measures
Current (1) Smokes regularly or occasionally, (2) last cigarette was smoked ranging from today
to less than six months ago and (3) where available has a cotinine value > 10 (nanogram
per milliliter; ng/ml).
A sub-class of current occasional smokers was separated from current daily
smokers with individuals who had smoked their last cigarette one month to half a year
ago.
Former Has quit smoking at least a year ago, last cigarette was smoked more than 1 year ago
and where available has a cotinine value less than 10 ng/ml.
Never Has never smoked or smoked less than 100 cigarettes during their lifetime.
FTC (n=408) Smoking was ascertained with response alternatives ranging from 1 to 7 (see
numbering below).
Current Smokes cigarettes less than once a week to 20 or more cigarettes per day (1 - 5).
We have further divided them into current daily and current occasional smokers as
follows:
Current daily: smokes between > 20 cigarettes per day to < 10 cigarettes per
day (1 - 3).
Current occasional: Smokes at least once per week but not every day or smokes
less than once a week (4 - 5).
Former Has quit smoking or is in abstinence (6).
Never Has never smoked or smoked less than 100 cigarettes during their lifetime (7).
EIRA (n=687) For patients with RA, smoking status was ascertained based on the smoking habits in
the index year (the year in which symptoms of RA onset occurred).
Current If smoking currently, when did you start smoking and the average number of cigarettes
per day.

Materials and Methods
37
4.3 Sample collection and DNA and RNA extraction
In Studies I and II surgical biopsies of abdominal SAT were obtained from the periumbilical area under local
anesthesia and were snap-frozen in liquid nitrogen. In the validation cohort (Study I) [280], SAT biopsies
were available from all the BMI-discordant MZ twin pairs (n=26 pairs) for gene expression analyses,
whereas only 24 twin pairs had DNA for the methylation analyses. High-molecular weight total RNA was
isolated from SAT biopsy using RNeasy Lipid Mini Kit (QIAGEN Nordic, Sollentuna, Sweden) following the
manufacturers' instructions and the RNA quality was assessed by 2100 Bioanalyzer using RNA Integrity
Number (RIN) algorithm (Agilent Technologies, Espoo, Finland). High-molecular-weight DNA was extracted
from whole blood (Study III) and adipose tissue (Study I and II) using QIAamp DNA Mini kit (QIAGEN Nordic,
Sollentuna, Sweden) according to the manufacturer’s instructions. Quality and concentration of DNA were
For RA cases, if smoked during the index year. Current smokers were further
classified into daily and occasional smokers.
Former Not a current smoker but smoked previously, start year and end year of regular smoking,
average number of cigarettes smoked while smoking.
In RA cases, patients who quit regular smoking for at least one year before the
index year.
Never Has never smoked before or during the index year.
CARDIOGENICS (n=464)
Former Has quit smoking for more than 12 weeks (n=251) or less than 12 weeks (n=12) before
the participant recruitment.
Buccal Tissue Dataset (n=80)
Smokers Smoked at least 10 cigarettes per day for a minimum of 3 years and had exhaled carbon
monoxide (CO) levels between10-100 (parts per million; ppm).
Non-smokers Abstinent from all nicotine and tobacco containing products for a minimum of 5 years
with expired CO levels between 0-5 ppm.
PBMC Dataset (n=111)
Smokers Actively smoking
Non-smokers Denied using any tobacco products

Materials and Methods
38
assessed using NanoDrop® ND-1000 UV-Vis (ThermoFisher Scientific, Helsinki, Finland)
spectrophotometer.
4.4 Omics Data
This section outlines various omics datasets used in the studies summarized in this thesis. Genome-wide
transcriptome and methylome data were characterized using microarray technology. Stringent QC and
filtering performed in each study to include only high-quality samples and probes for further analyses are
described in this section. Figure 6 outlines the general workflow of array-based DNA methylation and
transcriptome data analysis.
4.4.1 Expression data
Total RNA isolated from SAT was used to measure gene expression on Affymetrix Human Genome U133
Plus 2.0 Array (Affymetrix, Vienna, Austria) at the Biomedicum Functional Genomics Unit (FuGU), Helsinki,
Finland), following a previously validated protocol [281]. All the samples (both WLS and the validation
TwinFat cohort) passed QC checks for RNA degradation, hybridization, and amplification performed using
R packages: simpleaffy (to read Affymetrix data i.e. CEL files) [282] and affyPLM (to fit probe-level
models and quality assessments) [283]. Robust Multi-array Average (RMA) algorithm [284] was applied (R
package affy) to perform background correction (correcting for optical noise and non-specific binding),
quantile normalization and to summarize expression values on logarithmic scale per each probeset.
Probesets were then mapped to the corresponding genes using the Brainarray customized Chip Description
File version 18.0 (hgu133plus2hsentrezgcdf) [285]. Expression data from 19598 genes were available for
downstream analyses. From the validation cohort of MZ twins, I used only a subset of the expression array
data corresponding to the significantly differentially expressed genes identified in the discovery analyses in
the WLS to perform validation analyses.
4.4.2 Methylation data
The Illumina Infinium HumanMethylation450 BeadChip (Illumina, San Diego, CA, USA) (450k array) was
used to quantify methylation from whole blood (Study III) and adipose tissue (Study I and II) at the Microarray
Consortium, Oslo, Norway, at the Technology Centre, FIMM, University of Helsinki, Finland, at The
Genomics Facility, University of Chicago, Chicago, IL, USA, and at The SNP&SEQ Technology Platform,
University of Uppsala, Sweden. Samples were randomly distributed into 96-well plates to minimize potential
batch effects, and discordant co-twins were always placed next to each other on the same plate. Bisulfite
conversion of genomic DNA was performed using the EZ-96 DNA Methylation-Gold Kit (Zymo Research,

Materials and Methods
39
Irvine, CA, USA) and genome-wide DNA methylation was quantified on the 450k array following the
manufacturer’s instructions.
Figure 6: A comprehensive workflow of DNA methylation and transcriptome data analysis
Quality control (QC) and preprocessing steps in Study I-III were performed using R package minfi [86].
Numerous preprocessing and normalization methods are proposed for 450k data, however, there is no clear
consensus on the best approach to be followed. This is also reflected in the different preprocessing steps,
normalization methods and cut-offs employed in this thesis, to ensure the inclusion of high-quality samples
and probes for further analysis. I excluded probes with higher detection P-values to ensure that the
measured intensity was not representing background noise. In Study II, I excluded probes with detection P-
value > 0.05 as per Illumina recommendations. In Study I, I employed a more stringent cut-off and excluded
probes with P-value >0.001. In the Study III, detection P-value threshold was further lowered to 1x10-16
following more recent recommendations by Lehne et al, to improve quantification of methylation and to avoid
spurious detection of call rates [87]. Additionally, in Study III probes with more than 2% missing data across
samples were also excluded. I removed probes located on X and Y chromosomes and probes specific to
SNPs and non-CpG probes (Study I–III). Sample exclusion threshold was set as sample call rate< 95%,
based on this criteria four samples were excluded from Study III.
Materials and Methods
40
At each CpG site methylation levels (β-values) were calculated as the ratio of methylation signal to the
total locus intensity, ranging from 0 to 1, representing 0 to 100% methylation.
Following the QC and preprocessing steps described above, methylation data was normalized and
filtered when needed as per study design. The goal of normalization is to remove technical noise or
unwanted variation from the signal (thereby normalized data representing very likely true signal or biological
variation) and to make the methylation measures across samples comparable. Different normalization
methods were employed in this thesis, reflecting the constant development in methods to efficiently correct
for two type of probe chemistries present on the 450k array (Figure 4).
In Study I, quantile normalization (QN) followed by Beta MIxture Quantile (BMIQ) [84] normalization was
performed in both WLS and the validation cohort TwinFat. While QN makes all the samples to have the
same distribution of probe intensities, BMIQ adjusts the distribution of type II probes with respect to type I
probes within each sample. Following normalization, I used ComBat function in the R package SVA [286]
to remove unwanted variation introduced by potential batch effects. Finally, unreliable probes (mapping to
multiple genomic locations, presence of SNPs in probe body or at the CpG site or deletions, insertions, and
repetitive DNA) [287] were removed leaving 292802 probes for further analyses. By filtering low-quality
probes multiple testing burden was minimized. In the validation cohort of MZ twins, I have used only a
subset of CpG probes needed to verify methylation results from WLS.
In Study II, I first performed within-sample normalization using the BMIQ method and then normalized
methylation levels to follow the normal distribution N(0,1) using qqnorm R function. This additional step was
performed as most of the probes on the 450k array do not follow the normal distribution which may violate
the assumptions of linear regression.
In Study III, I first separated the probe intensity values into six categories based on the color channel,
probe-type, and subtype and then performed QN on each probe category using a custom function. In each
probe category, I first sorted the actual intensity values within each sample and then calculated average
intensity values for each rank across all the samples. I then replaced the actual intensity values with the
corresponding average intensity values (quantiles) thereby forcing all samples to have the same distribution.
I saved the quantiles obtained from the six probe categories. I then calculated beta values for each CpG
probe using the normalized intensity values. I have not rescaled the intensities of Infinium II probes based
on Infinium I probes, as it is nonessential for building a classification algorithm. After the normalization, I
have removed unreliable probes mapping to multiple genomic positions [288] and weakly varying probes
with variance <0.002 across the samples. To assess the performance of our classifier in the three whole-
blood test datasets, I have performed quantile normalization using the same six set of quantiles

Materials and Methods
41
(corresponding to probe categories) obtained from the training dataset. This approach of fitting test dataset
distribution to the training dataset ensures cross-study performance and can be referred to as “frozen”
quantile normalization following McCall et al [289]. I performed subset quantile normalization (SQN) [80]
and Illumina normalization (ILN) on the datasets to calculate smoking score (SSc) [217] and methylation
score (MS) [221], respectively. In SQN, the reference quantiles are first calculated for each probe category
of Infinium I signals using CpG annotations (Shore, S shelf, N shore, N shelf and distant), to which the Type
II probes are then adjusted. ILN uses internal control probes as a reference to normalize the data. Frozen
quantile normalization was not performed on publicly available test datasets from tissues other than blood,
as the quantiles used in QN were derived using whole blood training dataset.
I used R package ‘IlluminaHumanMethylation450kanno.ilmn12.hg19’ for annotating the 450k data in all
the studies.
4.5 Statistical Analyses
This section provides a broad overview of statistical analyses employed in the Studies I to III. All statistical
analyses used in this thesis were performed in the R statistical environment [290].
4.5.1 Differential expression and methylation analyses (Study I)
We hypothesized that weight loss causes changes in gene expression profiles of SAT. To assess these
changes, I performed differential expression analyses for three comparisons: short-term, continuous and
long-term weight loss. I used pair-wise moderated t-tests [291] to compare expression levels of individuals
with themselves at the current time point (lean) to an earlier time point (obese). Fat percentage was used
as a continuous variable and was assessed for normality using Shapiro-Wilk test. I used R package limma
[291] to fit gene-wise linear models using the fat percentage as a predictor and normalized gene expression
data as a response variable. A design matrix was defined with fat percentage as a continuous variable and
a pair-wise comparison (using an individual identification number to pair the samples from two-time points).
I then fitted linear models on normalized gene expression data and the design matrix. Empirical Bayes
procedure was then performed on the linear models to calculate the moderated t-statistic, to assess
differential expression between the lean and obese conditions of individuals. The moderated t-statistic [291]
differs from the classic t-statistic as the variance is estimated by borrowing information across all the genes.
Hence variability of a gene implies a combination of gene-specific variability and global variability.
In the validation cohort, we hypothesized that weight loss-associated genes identified from WLS will
have opposite direction of expression in acquired obesity. I performed paired moderated t-tests to compare
BMI-discordant MZ co-twins. A design matrix was defined outlining the condition of the twins (a two-level
factor: Heavy and Lean, using Heavy as a reference class) and a pair-wise comparison (using a twin
identification number to pair the co-twins). I assessed differential expression between heavy and lean co-

Materials and Methods
42
twin to validate significantly differentially expressed genes identified in the WLS comparisons, to test
whether the gene expression changes in acquired obesity were in opposite direction to weight loss.
We also investigated changes in SAT DNA methylation profiles during weight loss. I performed
differential methylation analyses at three comparisons: short-term, continuous and long-term weight loss,
to compare methylation levels of individuals at the current time point to an earlier time point. I have used
the same design matrix as outlined above using the fat percentage as a predictor and normalized
methylation data as a response variable. R package limma [291] was used to fit probe-wise linear models
on normalized methylation data and design matrix. In the validation cohort, I used paired moderated t-tests
to investigate differential methylation between the heavier and the leaner co-twins.
In all the analyses above, raw P-values were derived from moderated t-statistic. Bonferroni correction
was applied to correct for multiple testing and genes or CpG sites with adjusted P-values <0.05 were
considered as significant.
4.5.2 Integrated DNA methylation and gene expression analyses and Replication analyses (Study II)
The objective of Study II was to identify concurrently occurring smoking-associated changes in methylome
and transcriptome of SAT and to test the effects of these identified smoking-associated methylation and
expression signals on weight gain and adiposity measures. Discovery analysis was performed using
adipose methylome (450k array) and transcriptome (RNA sequencing) from female twins of the TwinsUK
cohort (n= 542) [266] by first author, Pei-Chien Tsai. A subset of 345 individuals was used to identify
differentially expressed genes and methylated sites between current (n=54) and never smokers (n=291)
using linear mixed-effect regression (LMER) model adjusting for appropriate covariates.
A subset of TwinFat participants (n=69) was used to replicate the significant methylation associations
with TFM, VFM and AGR. A LMER model with family structure and zygosity as random effect terms and
rest of the covariates as fixed effect terms were used to perform replication analyses. Here, fixed effects
terms represent the parameters that are invariant across individuals (i.e. the model holds with respect to all
individuals in the population of interest) while random effects terms capture the correlation between
individuals within twin pairs. For each CpG site, a full model that regressed all of the covariates was
compared to a null model that regressed all the covariates except smoking status. ANOVA F statistic was
used to compare full and null models.

Materials and Methods
43
Full model:
y
Null model:
4.5.3 Epigenetic Smoking status Estimator (EpiSmokEr) (Study III)
Our objective in Study III was to build a smoking status classifier (EpiSmokEr) using whole-blood
methylation data to predict smoking status of an individual from his/her methylation profiles. To build the
smoking status classifier I used the DILGOM dataset, which is representative of the general Finnish
population with extensive smoking information (including cotinine measurements) and broad age spectrum,
as the training dataset. I used multinomial LASSO regression to identify CpG sites predictive of smoking
and then tested the performance of our classifier in five independent test datasets. Figure 7 outlines the
steps involved in training the classifier and also shows how the output (predicted smoking status) is
generated for user data.
Fixed Effects Random Effects
Fixed Effects Random Effects

Materials and Methods
44
Figure 7: Schematic illustration of the workflow of the smoking status classifier. This figure is reproduced from [292] (Bollepalli et al 2019) with permission of Future Medicine Ltd.

Materials and Methods
45
4.5.3.1 Training the classifier:
Multinomial LASSO regression
I used 52421 high-quality CpG probes available from the DILGOM dataset after stringent quality control and
filtering to perform multinomial LASSO regression using the R package glmnet [293]. I fitted a LASSO-
penalized generalized linear model of the multinomial family, with three categorical variables (smoking
status: current, former and never) and sex as an additional covariate to select CpGs predictive of smoking
status. LASSO regression minimizes the residual sum of squares of coefficients by applying L1 norm penalty
and forcing several coefficients to become exactly zero.
The following is an outline of the multinomial LASSO regression model used in Study III. This outline
provides a mathematical review of our model for obtaining a parsimonious set of smoking-associated CpGs
which were then used to build a classifier to predict smoking status (Equations 1 to 4). We represent the
index of a CpG probe on the 450k array as , subject (sample or individual) as and quantile normalized
methylation values on beta scale as . Three levels of smoking status categories are represented as
= {current, former, never}. In multinomial regression, model fits a linear predictor which is a multinomial
equivalent to the log odds of logistic regression, i.e., corresponds to the probability for the subject
for each smoking status assigned by the classifier via the logistic transformation,
(1)
Here denominator ensures that the sum of the probabilities from the three smoking statuses are
equivalent to 1.
The linear predictor is given as a linear combination of the fitted model coefficients ,
(2)
Here each CpG probe has three coefficients , corresponding to each smoking status while the three
intercepts acts as thresholds. The sex coefficient is included as a covariate and is added to the
intercept if the subject is male and omitted if the subject is female .

Materials and Methods
46
These coefficients were obtained by fitting the LASSO regression model, which maximizes the
penalized log likelihood as follows:
(3)
Here , represents the penalty term which prevents overfitting by making the fit to select only those
CpG probes that contribute most to the prediction of smoking status and shrinks the coefficients of rest of
the probes to zero. I used the “grouped” shrinkage option where the glmnet function links the three
coefficients (each coefficient corresponding to a smoking status) for a given probe such that they are either
selected or not selected together.
An optimal value of tuning parameter which regulates the amount of shrinkage was chosen through
internal cross-validation which is explained below.
Cross-validation
I performed 100 iterations of internal cross-validation on the DILGOM dataset to identify an optimal lambda
of 0.55 from a sequence of 100 candidate values. In each iteration, the training dataset, DILGOM, was
randomly subdivided into 90% training and 10% hold-out data. A multinomial LASSO regression model was
then fitted on the 90% training dataset using the 100 candidate lambda values. For each lambda value, I
then tested the fit of the prediction on the 10% hold-out data to obtain estimated probabilities per each class
of smoking status.
I calculated multinomial deviance in each iteration for every as below:
Here the sum runs over the 10% of the hold-out data. is the probability assigned by the classifier to
the held-out subject using Equation (1), with true smoking status , obtained by using the coefficients
from the training with the given penalty parameter . I then averaged the deviances for each value over
the 100 iterations and chose the lambda value with lowest average deviation (between the probability that
the classifier has assigned and the subject´s original smoking status) as the optimal (here 0.55). I
performed a final fit on the full training dataset (DILGOM) to obtain the non-zero coefficients of 121 CpG
sites, sex and intercept coefficients. These coefficients were used to build the classifier to predict the
smoking statuses in the test datasets.
Materials and Methods
47
4.5.3.2 Testing the classifier:
Smoking status prediction
To predict the smoking status of a given test dataset using the classifier, the test dataset is first quantile
normalized reusing the quantiles obtained from the training dataset. Then using the Equation (1), for each
subject in the test data set, a probability is calculated for each of the three smoking statuses. The smoking
status category with the highest probability is reported as the predicted smoking status of the individual.
Evaluating the performance of the classifier
I used three independent and external whole-blood test datasets (FTC, CARDIOGENICS and EIRA) to
evaluate the performance of our classifier. As explained above raw methylation data from these test
datasets was first quantile normalized using the training dataset quantiles and then smoking statuses were
predicted using our classifier.
I also evaluated the performance of our classifier in two additional tissues: buccal tissue and PBMCs,
to test the broader impact of smoking on methylation across tissues. No additional normalization was
performed in these two datasets owing to the difference in the tissues.
I calculated sensitivity and specificity values to assess the accuracy of the predictions from our classifier.
Owing to the multinomial model with three smoking status categories, I calculated these accuracy estimates
by comparing one category with the union of the other two categories.
4.5.3.3 Smoking scores (SSc) and methylation scores (MS)
I additionally computed smoking and methylation scores from the two whole-blood test datasets (FTC and
EIRA) to compare with the performance of our classifier.
To calculate SSc, test datasets were first normalized using the SQN method and scores were calculated
as described by the Elliott et al [217], using the methylation values from never smokers of Zeilinger et al
[220] as reference values.
)
Here index runs over the 187 smoking-associated CpGs from the Zeilinger et al. ‘s Table S2 [220] and
denotes the SQN normalized methylation value of an individual for CpG site . The reference methylation
value for CpG site is the median methylation value of never smokers from Zeilinger et al, where the
methylation values were averaged over discovery and replication cohorts (columns P and S of the Table
S2).

Materials and Methods
48
The probe weight is obtained as follows:
Here represents median methylation value of current smokers obtained by averaging methylation
values across discovery and replication cohorts (columns Q and T of their Table S2) [220].
To calculate MS, test datasets were normalized using the ILN method and the methylation values of 4
CpG probes (cg05575921, cg05951221, cg02451831 and cg06126421) from the test datasets were
multiplied with their corresponding weights provided in the Figure 4 of Zhang et al [221] and then summed
up.
I tested multiple threshold values for SSc and MS to compare with our method because the papers on
SSc and MS did not provide a fixed threshold value to use.
4.5.3.4 Secondary analyses
I used the well-annotated FTC dataset (Table 6) to comprehensively scrutinize the misclassifications of our
classifier. Here, misclassification refers to the disagreement between self-reported smoking status and
predicted smoking status from the classifier. Considering self-reported smoking status as the ground truth
can be counter-productive when unreliable self-reports are used. Therefore, I examined the duration of
smoking abstinence (years since quitting) and cumulative exposure to smoking (pack-years), the two most
informative smoking behavior variables to verify the disagreements. I also examined the effects of passive
smoking on the misclassifications. To specifically understand the misclassifications from the current
smoking category, I subdivided current smokers into current daily and occasional smokers in the FTC and
EIRA datasets.
4.5.3.5 Availability and usage of our classifier
Our smoking status classifier, EpiSmokEr, is available as an R package:
https://github.com/sailalithabollepalli/EpiSmokEr
EpiSmokEr expects methylation data from the 450k arrays as an input, either as raw methylation data
(IDAT files) or a normalized methylation matrix and a sample sheet with sex information. The normaliseData
function of our package has a suite of customized internal functions for normalizing and calculating beta
values from the IDAT files. I use functionalities from the minfi package [86] to perform SQN [80] and ILN
normalization, and I use a custom function to perform QN. The output from the classifier is provided as a
Materials and Methods
49
label, namely the smoking status category with the highest probability. The output is generated both in
HTML and CSV file formats and also includes probability estimates for each of the smoking status
categories. It requires only a few minutes for a typical calculation beginning with the IDAT files to the
prediction of the smoking status. I also provide the functionality to calculate SSc and MS.
4.5.4 Correlation analysis between gene expression, DNA methylation and clinical measures (Study I)
In Study I, I associated expression and DNA methylation by calculating Pearson correlation coefficients for
each comparison. In WLS, correlation coefficients were computed for significantly differentially expressed
genes and the CpG sites within the corresponding genes by using the expression and methylation
differences within an individual. CpG sites were mapped to corresponding genes using
IlluminaHumanMethylation450kanno.ilmn12.hg19 annotation file. To validate these correlations in acquired
obesity I have computed correlations in BMI-discordant MZ twins using within pair expression and
methylation differences. I also associated gene expression with obesity-related clinical measures by
correlating intra-individual gene expression differences with the corresponding intra-individual differences
in clinical measures. Pearson correlation coefficients with P-values below 0.05 after adjusting the false
discovery rate using the Benjamini-Hochberg procedure were considered as significant.
4.5.5 Pathway Analyses (Study I)
I performed Gene Set Analysis (GSA) [294] on genes from each weight loss comparison in the Study I to
gain functional insights. GSA enabled us to assess the significance of pre-defined gene sets representing
Reactome pathways [295] rather than individual genes. We expect that closely related genes with similar
expression levels belong to a gene set and thereby increase the statistical power by borrowing strength
across the genes. I performed a two-class paired comparison with 1000 permutations [296] using 526 of
674 gene sets with a size of 15 to 500 genes. Pathways with FDR adjusted p-values below 0.05 were
considered as significant.
4.5.6 Covariates
Various study-specific covariates were included in the statistical models to adjust for confounding. In Study
I, no covariates were included in the statistical models as I performed intra-individual or within-pair (in MZ
twins) comparisons. In Study II, age, sex, BMI, alcohol, batch effects (plate), family and zygosity structure
were used as covariates. In Study III, I performed singular value decomposition (SVD) analysis using R
ChAMP [81] package to test whether the top 20 principal components (PCs) of the DILGOM methylation
data were associated with the proportions of blood cell subtypes. Only a nominal association was identified
between PC-2 and CD8+ (cytotoxic) T cells. I have included sex as a covariate in the LASSO model for
building the classifier owing to the higher global prevalence of smoking in men compared to women.

Materials and Methods
50
4.6 Ethics permissions and Data availability
All the participants in the Weight Loss Study, FTC and DILGOM/FINRISK have provided written informed
consent and the studies were designed and carried out following the principles of the Declaration of Helsinki.
Data collection and ethical permissions were approved by the appropriate ethics committees. All the other
datasets used in this thesis have obtained permission from their respective ethical boards.
Data used in Study I is available from the Gene Expression Omnibus (GEO) repository under the
accession numbers GSE103769, GSE68336, and GSE92405. Data from the DILGOM and FTC cohorts can
be obtained through permission from the corresponding data access committees. Four test datasets used
in Study III are publicly available from the GEO (EIRA: GSE42861; CARDIOGENICS: GSE50660; Buccal
dataset: GSE94876; and PBMC dataset: GSE53045).

Results and Discussion
51
5 Results and Discussion
5.1 Gene expression and DNA methylation changes in adipose tissue during weight loss (Study I)
Relentlessly increasing global obesity and its associated co-morbidities are posing a major health-care
challenge. Losing weight is the primary recommendation to treat obesity-associated diseases. Despite a
plethora of existing weight-loss interventions, only a few obese individuals succeed to attain and maintain
long-term weight loss. Consequently, it is crucial to improve our understanding of the underlying genetic
and epigenetic mechanisms inducing acquired obesity and weight loss, to design efficient long-term weight
loss strategies.
We performed a one-year weight loss intervention program on 19 healthy obese participants to assess
longitudinal gene expression and DNA methylation at three time points in the subcutaneous adipose tissue
(SAT). Participants consumed a hypocaloric diet for the first six weeks, followed by a normal weight loss
diet in conjunction with counselling sessions and exercise plans. We concurrently analyzed SAT expression
and methylation to broaden our current knowledge of weight loss mechanism in mildly-obese but clinically
healthy individuals.
Based on the biopsy collection our study can be divided into three phases: 0, 5 and 12 months. Several
metabolic and clinical parameters were measured at each time point. Total energy consumption reduced
by an average of 35.2% over the first 5 months, resulting in a mean weight loss of 11.7 % and a 5 %
decrease in the mean fat percentage (Appendix I: Supplementary Table 1). Also, several clinical and
metabolic measures considerably altered with weight reduction, suggesting enhanced health status. For
instance, all fat depots (SAT, VAT and liver fat), waist circumference and LDL cholesterol decreased while
physical activity and insulin sensitivity increased.
After the fifth month of intervention, participants were categorized into two separate groups based on
their weight loss trajectory, enabling us to evaluate metabolic parameters, transcriptome and methylome in
weight losers (WLs, n=6) and weight regainers (WRs, n=13), separately (Figure 8). While WLs continued to
lose weight, WRs either maintained their weight at the fifth month level or began to regain weight. WLs
showed a steady decline in BMI, body fatness and waist circumference after the fifth month, as well as an
increase in HDL-cholesterol (HDL-C) up to the twelfth month (Appendix I: Supplementary Table 1). By the
end of the study WLs achieved a total weight loss of 17% and a 7.4% decrease in the fat percentage.
Conversely, at the twelfth month, WRs showed an increase in BMI, body fatness and systolic blood pressure
and a decrease in insulin sensitivity (Matsuda index) compared to fifth month. Interestingly, there was no
significant difference in the energy intake between WLs and WRs, although WLs had higher physical activity
and work index [274] compared to the baseline.
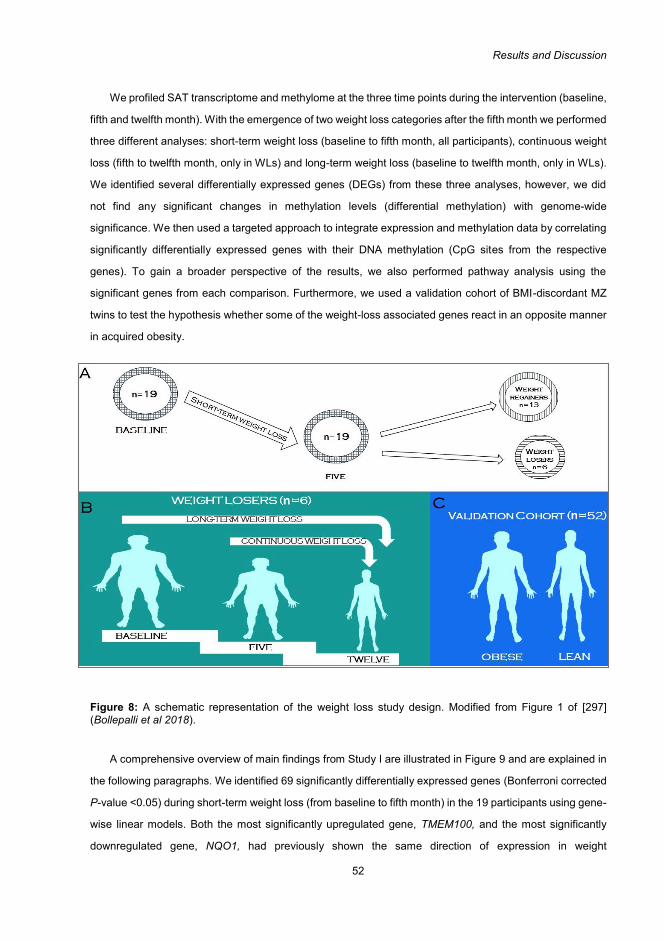
Results and Discussion
52
We profiled SAT transcriptome and methylome at the three time points during the intervention (baseline,
fifth and twelfth month). With the emergence of two weight loss categories after the fifth month we performed
three different analyses: short-term weight loss (baseline to fifth month, all participants), continuous weight
loss (fifth to twelfth month, only in WLs) and long-term weight loss (baseline to twelfth month, only in WLs).
We identified several differentially expressed genes (DEGs) from these three analyses, however, we did
not find any significant changes in methylation levels (differential methylation) with genome-wide
significance. We then used a targeted approach to integrate expression and methylation data by correlating
significantly differentially expressed genes with their DNA methylation (CpG sites from the respective
genes). To gain a broader perspective of the results, we also performed pathway analysis using the
significant genes from each comparison. Furthermore, we used a validation cohort of BMI-discordant MZ
twins to test the hypothesis whether some of the weight-loss associated genes react in an opposite manner
in acquired obesity.
Figure 8: A schematic representation of the weight loss study design. Modified from Figure 1 of [297] (Bollepalli et al 2018).
A comprehensive overview of main findings from Study I are illustrated in Figure 9 and are explained in
the following paragraphs. We identified 69 significantly differentially expressed genes (Bonferroni corrected
P-value <0.05) during short-term weight loss (from baseline to fifth month) in the 19 participants using gene-
wise linear models. Both the most significantly upregulated gene, TMEM100, and the most significantly
downregulated gene, NQO1, had previously shown the same direction of expression in weight

Results and Discussion
53
loss [180,298]. While TMEM100 is crucial for vascular integrity [299], NQO1 has been positively associated
with adiposity, glucose intolerance and obesity-associated metabolic complications [300]. Altogether, short-
term weight loss upregulated genes involved in cholesterol flux (APOE) and downregulated genes involved
in oxidative stress (NQO1, UCHL1 and CRYAB), adipogenesis (CRYAB, AKR1C2 and ADAM12) and lipid
metabolism (BHMT2, AKR1C2 and SEPT11). Furthermore, most of the genes identified during short-term
weight loss have been previously associated with obesity or weight loss [301]. Our findings were further
strengthened by the opposite direction of regulation in 60 of these 69 weight-loss associated genes in
acquired obesity observed in the within-pair comparisons of the obesity-discordant MZ twins. Pathway
analyses revealed enhanced blood HDL-C levels following short-term weight loss, which was evident from
the improved blood HDL-C levels in the WLs during fifth to twelfth month weight loss. Typically, increased
levels of HDL-C are regarded as a signature of effective cholesterol efflux transporting cholesterol back
from peripheral tissues to the liver. Our results are consistent with earlier findings suggesting that weight
loss results in increased HDL-C levels [180,301,302]. Integrative analyses revealed that methylation at 21
of 69 genes had significant correlations with gene expression of the corresponding gene indicating the
potential regulatory impact of DNA methylation on these genes. Moreover, six CpGs in 5 genes (CPXM1,
APOE, COL6A3, SYNPO and VGLL3) that showed positive expression-methylation correlations were
replicated in the validation cohort of BMI-discordant MZ twins representing acquired obesity.
We next assessed changes in transcriptome during continuous weight loss (fifth to twelfth month) in
WLs. A total of 5 genes were identified to be differentially expressed, with three upregulated (BCL9,
RPS4XP3 and TUBGCP5) and two downregulated (EGFEM1P and SPON1) genes. Pathway analyses
showed elevated signalling by insulin receptor which is in line with earlier studies that demonstrated
improved insulin sensitivity following weight loss [181,301]. Also, three of the five genes showed significant
expression-methylation correlations.
We identified 35 DEGs (20 downregulated and 15 upregulated) responding to long-term weight loss by
comparing the baseline to 12 month in the WL group. UCHL1 was the most downregulated gene, and
previously associated with reducing oxidative stress [301] indicating a positive impact of weight loss.
Pathway analyses of long-term weight loss-associated genes showed a wider impact resulting in several
pathways related to structural, developmental and metabolic functions of SAT. These included
downregulation cell cycle control, metabolism of proteins and gene expression pathways and upregulation
of pathways associated with signal transduction. Of the 35 significant genes, gene expression was
correlated with methylation at 23 CpG sites corresponding to 16 genes. Both positive and negative
expression-methylation correlations were observed for the CpGs located in the promoters of the
corresponding genes. However, for the CpGs located in the gene bodies, only positive correlations were
observed, except for one CpG site. In the validation cohort of MZ twins, 20 of these 35 genes were
associated with acquired obesity and five CpGs residing in four genes (MAL2, FAM129A, PPL and

Results and Discussion
54
PDZRN4) were also replicated. Replication in the validation cohort indicates the opposite direction of
expression of weight-loss associated genes in acquired obesity. Altogether, 73 of the 99 weight-loss
associated genes were also associated with acquired obesity suggesting their high responsiveness to
changes in weight.
Although we anticipated to observe overlap between genes from various time points, there was no
overlap between all three time points. This suggests that genes may not react linearly and may return to
their baseline pre-weight loss function after an initial change in gene expression during weight loss. Notably,
in both the short-term and long-term weight loss, seven genes (UCHL1, BAG3, TNMD, LEP, BHMT2,
EPDR1 and OSTM1) were commonly down-regulated. While downregulation of BAG3, an anti-apoptotic
protein [303] and an indicator of cellular stress [304] may be indicative of reduction in adipocyte size [305].
While downregulation of TNMD [306], LEP [301,307,308], BHMT2 [309], EPDR1 [310] and OSTM1 [311]
have been previously associated with shrinkage of SAT and reduced adipogenesis.
Figure 9: A schematic representation of the main findings from Study I.

Results and Discussion
55
Alterations in DNA methylation associated with diet [184] and exercise [60] have been reported earlier.
We did not observe any genome-wide significant differentially methylated CpG sites during our weight loss
intervention. However, we have identified several significant correlations between differentially expressed
genes and CpGs in the corresponding genes. We highlight that six CpGs in 5 genes (CPXM1, APOE,
COL6A3, SYNPO and VGLL3) from short-term weight loss and five CpGs in 4 genes (MAL2, FAM129A,
PPL and PDZRN4) from long-term weight loss which had positive correlation with the expression were also
replicated in the validation cohort. These results hint that DNA methylation might potentially regulate the
expression of these genes.
The sample size of 19 individuals is a major limitation of our study, especially subgroup analysis of WLs
is statistically underpowered to detect modest genome-wide differences in DNA methylation. We also note
that due to the cellular heterogeneity of SAT, we may not have captured the same cell-type specific signals
at different time points of the study and our findings may partly reflect changes in the composition of SAT
during weight loss. In addition to SAT cellular heterogeneity, immune cell infiltration could also impact
the overall methylation profile of SAT. Also, expression results from subgroup analysis may have false
negatives when there are small or medium effects. However, we validated many of our results by observing
opposite direction of gene expression in acquired obesity, and additionally results from our study replicate
several previously published results indicating the consistency of observed gene expression changes of
these specific genes during weight loss. We were also successful in controlling for several confounding
factors by using intra-individual comparisons and a validation cohort of BMI-discordant MZ twin pairs.
Moreover, our study was performed for a longer duration compared to other weight loss studies, and our
approach of attaining weight loss through diet and exercise was highly similar to the current practice at
weight loss clinics. Also, our study fills the gap in the existing literature about the weight loss intervention
on healthy obese individuals. Nevertheless, we agree that it is difficult to distinguish between consequences
and causes in these analyses with this study design; it is indeed likely that most of the changes that we
observe were consequential to weight loss. However, it is possible that some of the gene expression
changes are indicators of processes that enable or hinder weight loss or maintenance of weight loss.
Validation in the twin sample provided additional verification that the genes indeed were responsive to
weight change. We acknowledge that our results are mainly descriptive and needs further functional
validation to determine their potential use in clinical setting. However, we believe that the information
generated in our study serves to improve our basic understanding of weight loss induced changes in SAT
at multiple time points, and the results from our study pave the way forward to the integrative analysis
approach by using the information from multiple mechanisms impacting both weight loss and obesity.
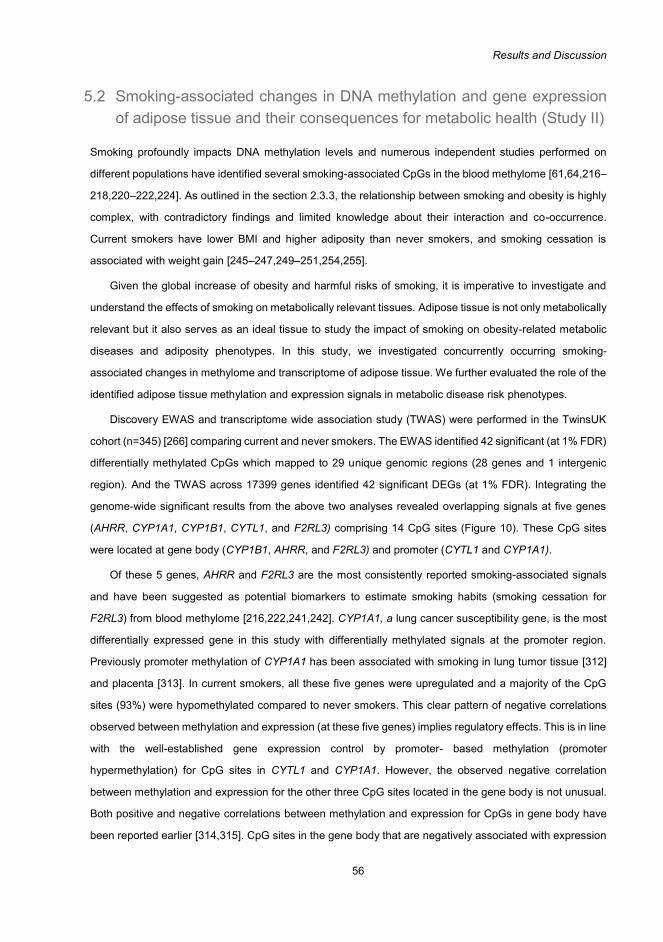
Results and Discussion
56
5.2 Smoking-associated changes in DNA methylation and gene expression of adipose tissue and their consequences for metabolic health (Study II)
Smoking profoundly impacts DNA methylation levels and numerous independent studies performed on
different populations have identified several smoking-associated CpGs in the blood methylome [61,64,216–
218,220–222,224]. As outlined in the section 2.3.3, the relationship between smoking and obesity is highly
complex, with contradictory findings and limited knowledge about their interaction and co-occurrence.
Current smokers have lower BMI and higher adiposity than never smokers, and smoking cessation is
associated with weight gain [245–247,249–251,254,255].
Given the global increase of obesity and harmful risks of smoking, it is imperative to investigate and
understand the effects of smoking on metabolically relevant tissues. Adipose tissue is not only metabolically
relevant but it also serves as an ideal tissue to study the impact of smoking on obesity-related metabolic
diseases and adiposity phenotypes. In this study, we investigated concurrently occurring smoking-
associated changes in methylome and transcriptome of adipose tissue. We further evaluated the role of the
identified adipose tissue methylation and expression signals in metabolic disease risk phenotypes.
Discovery EWAS and transcriptome wide association study (TWAS) were performed in the TwinsUK
cohort (n=345) [266] comparing current and never smokers. The EWAS identified 42 significant (at 1% FDR)
differentially methylated CpGs which mapped to 29 unique genomic regions (28 genes and 1 intergenic
region). And the TWAS across 17399 genes identified 42 significant DEGs (at 1% FDR). Integrating the
genome-wide significant results from the above two analyses revealed overlapping signals at five genes
(AHRR, CYP1A1, CYP1B1, CYTL1, and F2RL3) comprising 14 CpG sites (Figure 10). These CpG sites
were located at gene body (CYP1B1, AHRR, and F2RL3) and promoter (CYTL1 and CYP1A1).
Of these 5 genes, AHRR and F2RL3 are the most consistently reported smoking-associated signals
and have been suggested as potential biomarkers to estimate smoking habits (smoking cessation for
F2RL3) from blood methylome [216,222,241,242]. CYP1A1, a lung cancer susceptibility gene, is the most
differentially expressed gene in this study with differentially methylated signals at the promoter region.
Previously promoter methylation of CYP1A1 has been associated with smoking in lung tumor tissue [312]
and placenta [313]. In current smokers, all these five genes were upregulated and a majority of the CpG
sites (93%) were hypomethylated compared to never smokers. This clear pattern of negative correlations
observed between methylation and expression (at these five genes) implies regulatory effects. This is in line
with the well-established gene expression control by promoter- based methylation (promoter
hypermethylation) for CpG sites in CYTL1 and CYP1A1. However, the observed negative correlation
between methylation and expression for the other three CpG sites located in the gene body is not unusual.
Both positive and negative correlations between methylation and expression for CpGs in gene body have
been reported earlier [314,315]. CpG sites in the gene body that are negatively associated with expression

Results and Discussion
57
levels could be located in alternative promoters that regulate the expression of particular isoforms or in
intragenic CpG islands influencing enhancer loci, specifically enriched within large first introns [54].
To characterize the widespread effects of smoking on metabolic health, three metabolic disease risk
measures (total fat mass [TFM], android-to-gynoid fat ratio [AGR] and visceral fat mass [VFM]) were
assessed with respect to the identified smoking-associated methylation and expression signals. Figure 10
illustrates the discovery and replication analyses performed to associate smoking-associated methylation
signals and adiposity measures. Methylation levels at the 42 genome-wide significant CpG sites from the
discovery EWAS were tested for association with the three metabolic health traits (adiposity phenotypes)
using 288 individuals (42 current and 246 never smokers, mean BMI = 26.70 ± 4.62) adjusting for BMI and
smoking. Significant associations were identified for three CpG sites in CYP1A1 with VFM and AGR. To
elaborate, cg23160522 (beta = 1.35 × 10⁻³, SE = 3.03 × 10⁻³, P = 4.35 × 10⁻⁷) and cg23680900
(beta = − 1.59, SE = 0.44, P = 6.58 × 10⁻⁶) were independently and significantly associated with VFM and
AGR, respectively. Interestingly, cg10009577 located in the CYP1A1 promoter, showed an interaction effect
with AGR (P = 5.50 × 10⁻⁴) exhibiting different patterns of association in current and never smokers.
Moreover, a significant inverse association was identified for NOTCH1 (cg14120703) and AGR
(beta = − 1.80, SE = 0.43, P = 1.07 × 10⁻⁷). A subset of younger Finnish twins (n=69, 21 current smokers)
was used to replicate the methylation associations with metabolic risk factors. The overall inverse
association between cg10009577 (CYP1A1) and AGR (discovery sample beta = − 0.95, SE = 0.31;
replication sample beta = − 0.58, SE = 0.25, P = 0.02) and direction of interaction effects remained
consistent, however, the replication signal did not reach statistical significance. Expression levels of F2RL3
showed significant association with all the three risk factors (VFM beta = − 1.5 × 10⁻³, SE = 3.78 × 10⁻⁴,
P = 7.8 × 10⁻⁴; AGR beta = 2.3, SE = 0.56, P = 4.5 × 10⁻⁵; TFM beta = 1.6 × 10⁻³, SE = 3.9 × 10⁻⁴,
P = 5.8 × 10⁻⁵). OR51E1 expression was significantly associated with VFM (beta = − 1.5 × 10⁻³,
SE = 3.78 × 10⁻⁴, P = 7.8 × 10⁻⁴) and AGR (beta = − 2.85, SE = 0.51, P = 3.1 × 10⁻⁸). These significant
associations reveal the broader impacts of smoking on metabolic health.

Results and Discussion
58
Figure 10: An overview of discovery and replication analyses performed in Study II. DMS: differentially
methylated signal; DEG: differentially expressed gene. Modified from Figure 1 of [316] (Tsai P-C et al 2018).
To test the effects of smoking-associated methylation and expression signals on weight gain and
adiposity measures, 248 individuals comprising current, former and never smokers were used. Phenotype
differences observed between the two-time points separated by 5-year time interval were correlated with
the methylation and expression levels measured at the initial time point. After a 5-year interval, current
smokers who quit smoking by time point two and recent quitters (< 4 years) at time point one showed higher
levels of adiposity measures. However, this increase seems transient as this effect was not observed in
former smokers with higher cessation time (> 5 years) at the initial time point. To explore these associations
further smoking-associated methylation and expression signals were used to predict future changes in
adiposity, specifically in visceral fat accumulation, upon smoking cessation. Visceral fat is a major risk factor
for metabolic diseases and has been strongly associated with type 2 diabetes and cardiovascular disease
[122,317]. Two significant signals predictive of future gain in visceral fat were identified for individuals who
were current smokers (n=5) or recent quitters (n=13, < 4 years) at time point one, who later quit smoking or
continued abstention at time point two. Methylation levels of these current smokers or recent quitters at
cg16320419 in BHLHE40 (by group interaction term P = 9.3 × 10⁻⁴) explained 35.5% of the variation in future
gain in visceral fat. Similarly, expression levels of AHRR (by group interaction term P = 4.7 × 10⁻⁵) in these

Results and Discussion
59
current smokers or recent quitters explained 44% of the variation in future gain in visceral fat. While these
associations indicate a potential impact of environment-mediated molecular mechanisms on metabolic
disease risk, replication of these results in a larger sample will enable to make further conclusions. Although
correcting for cell composition [93] did not alter the identified associations, usage of adipose tissue data in
this study might have identified signals that reflect cell-type specific methylation profiles. Also, infiltration of
inflammatory immune cells specifically during obese state could affect the overall methylation profiles of
SAT. Technical factors such as the procedure used to retrieve SAT (e.g. surgical biopsy), sample handling
and blood cell contamination during SAT acquisition could also influence SAT biopsy composition [318].
This was the first study to comprehensively assess the coordinated changes occurring in the adipose
tissue methylome and transcriptome due to smoking and is of great relevance to public health. Several
smoking-associated methylation and expression signals were identified indicating a substantial impact of
smoking on adipose tissue. Some of these signals were also associated with metabolic health risk factors
highlighting the widespread effects of smoking and importance of understanding common basis of smoking
and adiposity.

Results and Discussion
60
5.3 EpiSmokEr: a robust DNA-methylation based smoking status classifier (Study III)
Epigenetic modifications, especially DNA methylation have been extensively reported to be influenced by
environmental exposures. Smoking strongly influences methylation with current and never smokers
exhibiting distinct methylation profiles [61,64,216,217,219–222]. Notably, two studies attempted to quantify
methylation at smoking-responsive CpGs into a score that reflects smoking behavior [217,221]. However,
these score-based approaches are not ideal for predictive purposes as a threshold cut-off value specific to
each dataset needs to be determined by the user. For instance, the smoking score (SSc) of Elliott et al [217]
uses ethnic-specific threshold values to differentiate smokers from never smokers, limiting its universal
applicability, while methylation score (MS) of Zhang et al [221] can only perform binary comparisons i.e.
current vs never and former vs never smokers.
To advance the practical applicability of the smoking-associated methylation signals, we proposed a
classifier with an emphasis on smoking status prediction. We have implemented multinomial least absolute
shrinkage and selection operator (LASSO) regression on whole blood-derived 450K methylation data from
an adult population with a wide age spectrum. We have considered three smoking statuses, current, former
and never smokers, to build the classifier. We have demonstrated the accuracy of our classifier in three
independent whole blood datasets. We have developed an R package EpiSmokEr (Epigenetic Smoking
status Estimator) with functionalities to start from raw intensity files (IDAT), followed by quantile
normalization and smoking status prediction. The R package also provides functions to calculate the SSc
by Elliott et al [217] and MS by Zhang et al [221].
Our objective was to build a classifier to predict the smoking status of a person based on their DNA
methylation profile. We have used whole blood methylation data from the DILGOM cohort [269,270] to train
our classifier. DILGOM is representative of the general Finnish adult population with a wide range of age
distribution and well-characterized smoking status information. We considered current smokers (occasional
to heavy smokers), former smokers (recent quitters [>1 year] to long-term quitters) and never smokers for
training the smoking status classifier (Tables 5 and 6). To ensure the usage of high-quality data to train the
classifier and limit misclassification, self-reported smoking status was verified with cotinine measures
whenever data was available. Multinomial LASSO regression with nested cross-validation was performed
to select a parsimonious set of 121 CpG sites predictive of smoking status (Figure 7).
To assess the performance of our classifier we used three external test datasets: FTC [259], EIRA [59]
and CARDIOGENICS [61] from different populations, from which we calculated sensitivity and specificity to
quantify the performance of our classifier. These values were calculated for each smoking category by
comparing the one versus the union of the other two categories. Results indicated that on average current
smokers were identified with a sensitivity of 81% and a specificity of 85% across the three test datasets,

Results and Discussion
61
whereas never smokers were identified with 94% sensitivity and 57% specificity. Lower sensitivity values
were identified for former smokers averaging to 18% across the test datasets. However, a higher average
specificity of 96% was shown by the classifier demonstrating its ability to correctly identify individuals who
did not belong to the former smoker category.
Owing to the differences in outputs we could not comprehensively compare our classifier with SSc and
MS. However, we calculated sensitivity and specificity from the other two methods to make a fair
comparison. We tested multiple threshold values for SSc and MS to compare with our classifier. A threshold
value of zero for SSc showed good sensitivity to identify current smokers from other smoking status
categories. For MS a threshold value of -7.5 achieved an average sensitivity of 85% and a specificity of
68% to identify current smokers from never smokers. However, we could not determine a single threshold
value of MS that could discriminate former from never smokers with reasonable accuracy across all test
datasets. We note that this process of determining a threshold value for each test dataset in itself is a serious
limitation. We demonstrated this limitation by trying to compute a threshold to calculate sensitivity and
specificity for MS and SSc. This also presents a difficulty in interpreting the meaning of the score when
dealing with individual samples, as there is no comparable threshold or reference value to determine the
sample’s smoking status. Additionally, the SSc European ethnic threshold 17.75 was not applicable to any
of the test datasets highlighting that this threshold might be dataset-specific, which cannot be generalized
to other datasets. We curtail the need of determining the threshold by user as our classifier uses an implicit
threshold and determines the smoking status category.
For instance, figures 11A and 11B illustrate that the SSc and MS respectively showed overlapping
profiles for different smoking statuses and thus failed to achieve clear classification. Also, the European
ethnic smoking score threshold of 17.55 proposed by Elliott et al [217] was not applicable, as only two
individuals were identified as current smokers based on this threshold. Figure 11C shows the results from
our classifier as a confusion matrix with actual self-reported smoking statuses on the X-axis and the
predicted smoking statuses on the Y-axis.
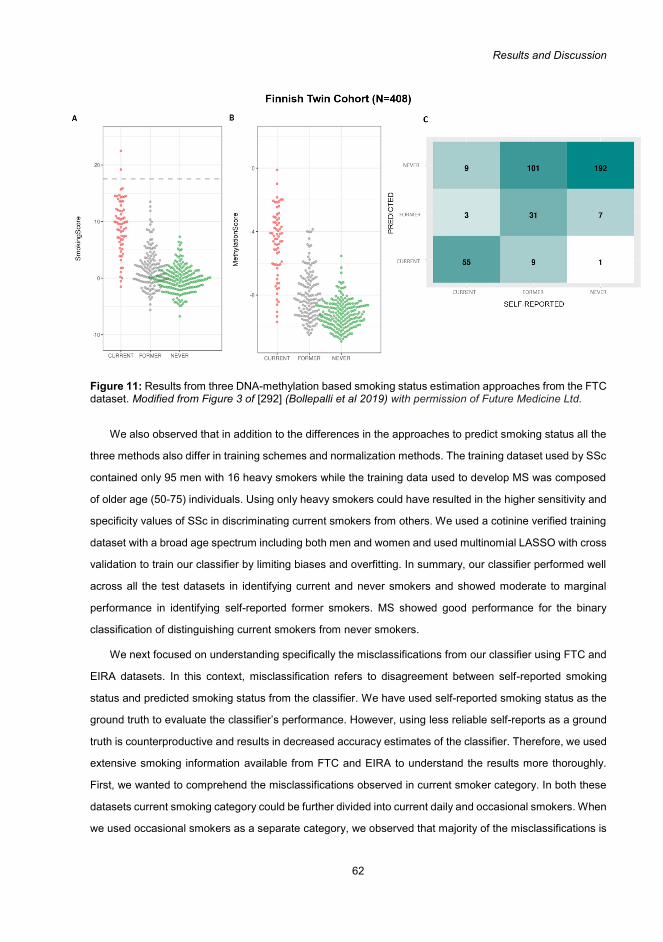
Results and Discussion
62
Figure 11: Results from three DNA-methylation based smoking status estimation approaches from the FTC dataset. Modified from Figure 3 of [292] (Bollepalli et al 2019) with permission of Future Medicine Ltd.
We also observed that in addition to the differences in the approaches to predict smoking status all the
three methods also differ in training schemes and normalization methods. The training dataset used by SSc
contained only 95 men with 16 heavy smokers while the training data used to develop MS was composed
of older age (50-75) individuals. Using only heavy smokers could have resulted in the higher sensitivity and
specificity values of SSc in discriminating current smokers from others. We used a cotinine verified training
dataset with a broad age spectrum including both men and women and used multinomial LASSO with cross
validation to train our classifier by limiting biases and overfitting. In summary, our classifier performed well
across all the test datasets in identifying current and never smokers and showed moderate to marginal
performance in identifying self-reported former smokers. MS showed good performance for the binary
classification of distinguishing current smokers from never smokers.
We next focused on understanding specifically the misclassifications from our classifier using FTC and
EIRA datasets. In this context, misclassification refers to disagreement between self-reported smoking
status and predicted smoking status from the classifier. We have used self-reported smoking status as the
ground truth to evaluate the classifier’s performance. However, using less reliable self-reports as a ground
truth is counterproductive and results in decreased accuracy estimates of the classifier. Therefore, we used
extensive smoking information available from FTC and EIRA to understand the results more thoroughly.
First, we wanted to comprehend the misclassifications observed in current smoker category. In both these
datasets current smoking category could be further divided into current daily and occasional smokers. When
we used occasional smokers as a separate category, we observed that majority of the misclassifications is

Results and Discussion
63
because of occasional smokers being identified as either never or former smokers. Of the 66 occasional
smokers in the EIRA dataset, 53 were predicted as never smokers and six as former smokers by the
classifier. Consequently, the exclusion of occasional smokers has improved the sensitivity values of current
smokers in this dataset from 69% to 88%. This highlights the effect of including occasional smokers along
with current daily smokers on the ostensible performance of the classifier. This misclassification can be
attributed to similarity in methylation profiles of occasional smokers to never and former smokers based on
the extent and intensity or frequency of smoking, which also reflects in the results of our classifier.
Next we focused on understanding misclassifications observed in the former smokers category by using
the comprehensive smoking behavior information from the FTC dataset. The former smokers class in the
FTC had a high misclassification rate where a majority of former smokers (n=101) were predicted as never
smokers. We noticed that 85 out of the 101 individuals had quit smoking for more than 10 years prior to
blood sampling (Figure 12). This is line with results from earlier studies where the former smokers showed
highly similar profiles to never smokers [61,64,216,217,219,220]. Interestingly, nine of the former smokers
who were predicted as current smokers had recently quit smoking and had higher mean pack-years than
other former smokers. While these results appear to be misclassifications compared to self-reported
smoking status, they are biologically meaningful as they indicate the reversal in the methylation patterns of
former smokers after cessation of smoking, which after a long period of cessation are indistinguishable from
never smokers. Several studies have already shown that the methylation profiles of former smokers may
resemble current or never smokers based on the total abstinence time between cessation and sampling
[216,219,222–224], and the extent [219] and the duration they have smoked before cessation (pack-year
history). Although the magnitude or extent of this reversal varies, a typical abstinence period of more than
ten years is likely to reverse the methylation pattern of former smokers making them very similar to never
smokers. However, this reversal of methylation levels may also be site-specific, as it has been shown that
methylation levels at certain CpG sites remained unchanged even after decades of cessation [61,219,220].
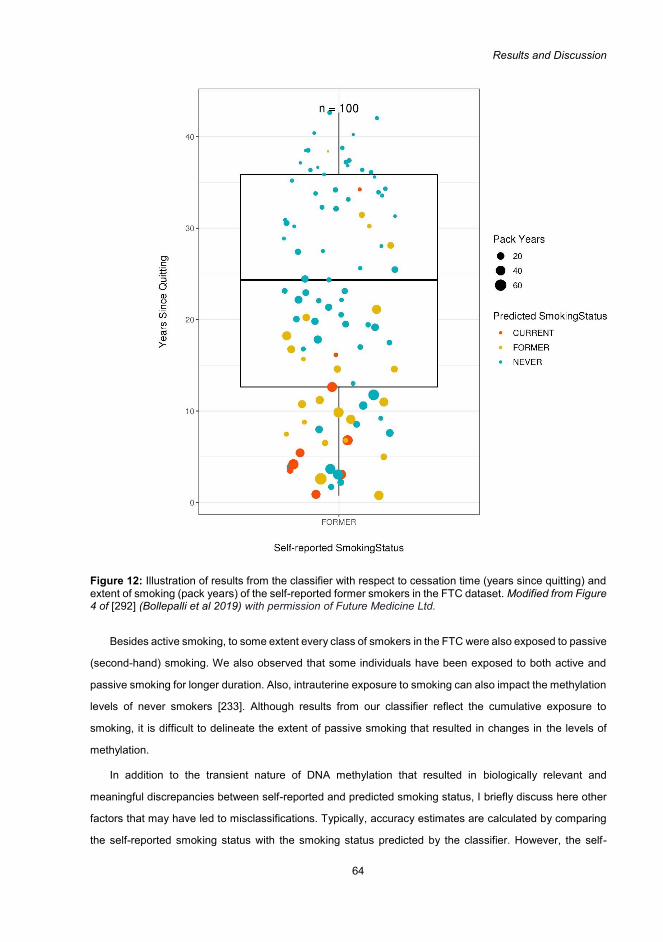
Results and Discussion
64
Figure 12: Illustration of results from the classifier with respect to cessation time (years since quitting) and extent of smoking (pack years) of the self-reported former smokers in the FTC dataset. Modified from Figure 4 of [292] (Bollepalli et al 2019) with permission of Future Medicine Ltd.
Besides active smoking, to some extent every class of smokers in the FTC were also exposed to passive
(second-hand) smoking. We also observed that some individuals have been exposed to both active and
passive smoking for longer duration. Also, intrauterine exposure to smoking can also impact the methylation
levels of never smokers [233]. Although results from our classifier reflect the cumulative exposure to
smoking, it is difficult to delineate the extent of passive smoking that resulted in changes in the levels of
methylation.
In addition to the transient nature of DNA methylation that resulted in biologically relevant and
meaningful discrepancies between self-reported and predicted smoking status, I briefly discuss here other
factors that may have led to misclassifications. Typically, accuracy estimates are calculated by comparing
the self-reported smoking status with the smoking status predicted by the classifier. However, the self-
Results and Discussion
65
reported smoking status is prone to errors due to misreporting and poor recall of long-term smoking history
[239]. Accuracy estimates are therefore affected by the reliability of the test dataset’s smoking status
information. Generally, the classification methods are based on the premise of independence (mutually
exclusive) that each smoking status category has a distinctive methylation profile without overlapping with
other categories. However, this assumption is not true for smoking-associated methylation profiles (i.e.
overlap in methylation profiles between different categories of smoking) and smoking behavior in general.
Accuracy of the classifier can also be affected by the presence of SNPs in close proximity to smoking-
associated CpG sites [319].
To evaluate our classifier's efficiency in tissues other than blood we used methylation data from buccal
tissue [272] and peripheral mononuclear blood cells (PBMCs) [273]. In the buccal tissue dataset current
smokers were detected with 95% sensitivity 97% specificity. This dataset had two categories namely
"tobacco smoker" and "non-tobacco smoker" based on the self-reported smoking status. However, 15 of
the non-tobacco smokers were identified as former smokers by our classifier. This result is consistent with
the definition of non-tobacco smoker [272] used in this cohort (Table 6), that is individuals who have been
abstinent from tobacco or nicotine-containing products for at least 5 years. The good performance of our
whole blood trained classifier on the buccal tissue data was surprising owing to the tissue-specific nature of
DNA methylation. However, a similar result was observed when a smoking index developed using blood-
derived smoking-associated CpGs showed a good discrimination of smokers from non-smokers in the same
dataset [320,321]. We have also observed a good performance in the PBMC dataset and the results are
reassuring as PBMCs are extracted from whole blood. These results indicate a broader impact of smoking
on methylome spanning across multiple tissues. Additionally, these two datasets allowed us to demonstrate
global applicability of our classifier as these datasets comprised individuals of African-American ethnicity.
However, to confirm the cross-tissue performance of our classifier further testing in multiple tissues is
needed.
Our classifier is publicly available as an R package, EpiSmokEr (Epigenetic Smoking Status Estimator)
and expects raw (IDAT) or normalized methylation data from the 450K array along with sex information as
an input. The package vignette provides extensive documentation with examples and has been already
tested on multiple datasets with sample size ranging from 400 to 700. It only takes a few minutes to estimate
smoking status starting with the IDAT files. We also provide functionality for SSc and MS approaches
offering users with a choice for their analysis. Our classifier offers an objective smoking status measure and
is applicable to all datasets, reducing the need for population or ethnic-specific thresholds to be calculated.
Predicted smoking status from our classifier is beneficial when self-reported smoking status is unavailable
or highly inaccurate and can also reduce misreporting bias by validating self-reported smoking information.
Also, the predicted smoking status can be used as a covariate in association analyses like EWAS and
GWAS to account for smoking-associated confounding.
Results and Discussion
66
Typically, the predictive performance of a classifier can be influenced by the quality of the training
dataset used to train the classifier. We have minimized this limitation by using a high-quality dataset with
reliable self-reported smoking status data verified by multiple measures. Considering the complex nature of
former smoker class it may remain as a challenge for methylation-based prediction algorithms to achieve a
higher accuracy in this category. However, results from our classifier reflect the effect of smoking on DNA
methylation and potential functional impacts on the genome which are clinically and biologically significant.
Although our classifier is trained using the Infinium HumanMethylation450 BeadChip data, our approach
can be re-implemented on the EPIC BeadChip array data to build a classifier specific to EPIC derived data.
In this study, we developed a robust smoking status predictor based on DNA methylation which provides
an objective measure of smoking status. Our classifier considers three classes of smoking status and can
be applied to any dataset. We also performed extensive phenotypic evaluation to examine the reasons for
misclassification. By using our R package, EpiSmokEr, users can implement our classifier to predict
smoking status in their own datasets. In conclusion, methylation-based smoking status predictors are more
robust than existing traditional biomarkers with shorter half-lives. Therefore, we recommend using predicted
smoking status from our classifier as a covariate to adjust for smoking-associated confounding rather than
self-reported smoking status.

Implications and Future Directions
67
6 Implications and Future Directions
We have come a long way in our understanding of the molecular basis of complex diseases in the last two
decades. With the rapid progress and advances in technology and increased affordability, we have moved
from the candidate gene approach to genome-wide studies. GWASs have identified hundreds of significant
associations between genomic regions and diseases, improving our understanding of the
genetic architecture of complex diseases. However, a majority of the identified genetic variants exhibit
smaller effect sizes, explaining only a smaller proportion of total heritability. Moreover, most of these
identified variants reside in non-coding regions of the genome posing a challenge to understand their effects
on gene regulation and disease mechanism. Larger sample sizes and better phenotyping as well as using
uncommon and rare variants with whole genome and exome approaches can address these challenges.
Epigenetic mechanisms serve as a key nexus between genetic and non-genetic factors that can
regulate gene expression profiles and subsequent susceptibility to a complex disease or trait. Akin to
GWAS, EWASs have enabled the identification of several disease-associated methylation sites. Both
GWAS and EWAS require large sample sizes owing to the multiple testing problem to identify statistically
significant associations, specifically to detect associations with smaller effect sizes. Although sample sizes
used in Study II and III were modest, we had sufficient power to identify large effects. However, Study I
used a smaller sample size, and specifically the subgroup analysis was underpowered to identify modest
differences in DNAm. While a larger sample size could potentially identify additional associations, for
practical reasons, it is difficult to recruit participants who attend interventions for a longer duration.
Comparatively, our study was performed for a longer duration than other weight loss studies that
investigated genome-wide methylome and/or transcriptome of SAT. Moreover, we validated results from
transcriptomic analysis using a validation cohort representing acquired obesity, showing the opposite
direction of gene expression in obesity compared to weight loss. Also, we replicated several previously
reported findings indicating the consistency of observed gene expression changes at specific genes during
weight loss. Furthermore, identified DNAm differences usually show modest effect sizes, therefore it is
necessary to appropriately adjust for potential biological and technical confounding factors to identify these
modest associations. Age, BMI and smoking are included as covariates in EWAS owing to their well-
established impact on DNA methylation patterns. Also, covariates such as batch, sample plate, microarray
slide are usually included in the association studies to account for technical variation. Additionally,
techniques like PCA and SVD are also being employed to check and account for the unknown sources of
variation.
Performing EWAS and interpretation of its results include additional challenges compared to GWAS.
First, the dynamic nature of epigenetic modifications necessitates sample collection at the time of exposure
or at a specific time point based on the study hypothesis. Second, the tissue-specific nature of epigenetic

Implications and Future Directions
68
marks requires sampling of relevant tissues. Ideally, tissues that are directly affected by the disease or
mediating the disease outcomes need to be studied. However, due to easy availability, whole blood is the
most widely used tissue in EWAS. Additionally, buccal cells, saliva, hair follicles, and urine [91] have also
been considered as good surrogate tissues for tissues that are challenging to sample (e.g. brain). In addition
to inter-individual variation, the dynamic nature of the epigenetic marks results in both spatial and temporal
intra-individual variability. That is variation in epigenetic profiles across the tissues and variation in
epigenetic profiles of the same tissue with time within an individual. Hence, multiple measurements over
time might be needed to test their association with a phenotype. For instance, in Study I to capture the
DNAm changes with respect to weight loss trajectory we have collected SAT biopsies at three-time points.
Third, using a tissue composed of different mixture of cells might lead to spurious associations, as the
DNAm variation captured often reflects the variation in the cellular composition that occurred as a
consequence of disease or sample collection. Currently, histological quantification of cell proportions and
employing cell-type deconvolution methods are the common practices to correct for the cellular
heterogeneity confounding. Preferably, using single-cell types would minimize cellular heterogeneity,
although the extent of this minimization depends on the purity of the cell samples. Single-cell RNA
sequencing (scRNA-seq) could serve as a useful approach to identify, discriminate and quantify cell
subtypes, especially in the tissues where the cell subtypes are not yet well studied [26]. scRNA-seq can be
performed on a subset of samples to quantify cell subtypes and their corresponding gene expression profiles
in a tissue, which can then be used to estimate the cell-type composition of the remaining set of larger
samples with bulk RNA sequencing data [26].
Although DNAm and gene transcription profiles are tissue-specific, some of the trait-associated DNAm
changes exhibit tissue-shared effects. For example, several smoking-associated DNAm changes identified
in SAT in Study II overlapped with previously reported smoking EWAS hits in whole blood. The smoking
status classifier developed in Study III was trained using whole blood data. However, it has shown good
predictability in buccal tissue samples. A previous study reported a similar observation of overlap in
smoking-associated methylation signals in buccal samples and whole blood [322]. This indicates that
complex traits like smoking leaves wide-spread effects on methylation at certain CpGs across tissues,
resulting in tissue-shared effects.
In addition to timing and sample collection, study design determines the direction of interpretation of
results. It is important to identify disease-associated DNAm variants, however, it is crucial to identify causal
DNAm variants to understand disease etiology. Establishing causality is more challenging in EWAS, as the
observed DNAm alterations could be causal, consequential or even confounding. Longitudinal cohorts
following disease-free individuals from birth are ideal study designs to establish causality of epigenetic
marks. However, these cohorts are very difficult to establish and follow-up. For example, Study I used a
longitudinal sample of 19 individuals with tissue samples, phenotype, and clinical assessments at three time

Implications and Future Directions
69
points during a one year weight loss intervention. Therefore, it is likely that the observed gene expression
and DNAm differences between the time points are due to weight change. However, we cannot definitely
determine the causality of the identified changes. From a practical perspective, it is difficult to perform
intervention studies for a longer duration, or to follow-up individuals for their lifetime, although they would
be the best for understanding the etiology of complex traits and the corresponding role of epigenetic
modifications.
MZ twin pairs with divergent phenotypes are also valuable to study epigenetic associations, as within-
pair comparisons control for age, sex, genetic and early environment confounding. However, discordant MZ
twin pairs are very rare, and it is difficult to establish a large cohort of this nature. MZ twin pairs discordant
for BMI were used as a validation cohort in Study I to verify the direction of expression of weight loss-
associated genes in obesity. This study design was appropriate as it not only captured weight-loss
associated gene expression using intra-individual comparison but also simultaneously verified the findings
by within-pair comparison of MZ twins discordant for BMI, as a model for acquired obesity. Nevertheless, it
is difficult to distinguish if the observed gene expression or DNA methylation associations are causal or
consequential of weight loss and obesity with this study design; it is indeed likely that many of the
associations that we observe are due to body fatness or BMI. However, some of the gene expression
changes may be indicators of processes that enable or hinder weight loss or maintain it. Furthermore, it is
necessary to verify whether the changes observed in gene expression are also translated to corresponding
protein levels.
Regarding DNAm and expression changes, efforts are clearly needed to collect large samples followed
for a longer duration to determine the direction of effect of DNAm in gene expression and complex diseases
like obesity, especially to establish causality. Alternatively, statistical techniques like Mendelian
randomization (MR) and causal inference test can be used to assess the directionality of DNAm and to infer
causality by combining genetic and epigenetic data. However, care should be taken to model the complex
biological data with regard to the underlying assumptions of these statistical models. For instance, a two-
step epigenetic Mendelian randomization strategy has been proposed to establish the causal relationships
between environmental exposure, epigenetic signature (e.g. DNAm) and outcome [323]. In Step 1, the
causal impact of exposure on the epigenetic signature is established using an SNP as a proxy for the
exposure. In Step 2, the causal nature of the epigenetic signature on the outcome is interrogated using a
genetic proxy for the epigenetic signature. In addition to the requirement of large sample sizes and satisfying
the conventional MR assumptions, the epigenetic MR strategy faces the additional challenge of tissue
specificity and availability of genetic variants that can be used as a proxy for epigenetic signature (e.g. cis-
acting SNP can be used as a proxy for DNAm levels). Furthermore, statistically identified causal
relationships need to be functionally validated (e.g. with functional laboratory tests on cell lines or animal
models) to determine the causal effect of DNAm or gene expression in the corresponding phenotype.

Implications and Future Directions
70
By comprehensively understanding the human genome and the biological layers of information it
encodes, we will gain a holistic understanding of biological processes and mechanisms associated with
disease phenotypes. In this thesis, only DNAm and transcriptomic data were integrated identifying potential
role of DNAm in gene regulation. Combining other informative layers like genotype, proteome, metabolome,
and gut microbiome in the analysis would ideally reveal the complex interactions among these layers in
relation to disease pathogenesis. Integrating multiple omics data also unravels the reasons for inter-
individual epigenetic variation. For instance, recent mQTL studies [2,58,324,325] revealed the influence of
genetic variants on methylation at several CpGs, acting both in cis and trans fashion. In fact, a second-
generation EWAS approach was proposed to constitute a necessary panel of multiple complementary
genome-wide assays (WGBS, ATAC-seq, RNA-seq, scRNA-seq, and genotyping), enabling multi-
perspective interpretation of results [26]. Although DNAm as 5mC is widely studied because of its stability,
easy access, and affordable technology to measure it, other forms of cytosine modifications (e.g. 5hmC,
5fC, and 5caC) also need to be investigated to understand their role in disease and development, although
their quantification requires additional steps compared to 5mC [326]. Besides, existing array-based
technologies mainly measure DNAm in the CpG context. However, it is also crucial to assess and
understand the role of DNAm in the non-CpG (CpH; H=A, C, or T) context to enhance our understanding
related to development and disease. It is also vital to understand the role of histone modifications and
ncRNAs to comprehensively understand the contribution of the epigenome to disease mechanism.
However, comprehensive investigation of all the epigenetic measures is expensive as all the measures
need to be captured simultaneously. Additionally, efficient computational and statistical methods are crucial
to successfully integrate and interpret multiple genetic and epigenetic layers. In GWAS identifying causal variants is more important than inferred or associated variants, as causal
variants help to identify drug targets to treat a disease. Similarly, identifying causal epigenetic variants is of
high importance, and epigenetic variants serve as ideal drug targets because of their reversible nature.
However, most of the identified DNAm variants so far are shown to be consequential in nature to disease
outcomes. Independent of being causal or consequential, dynamic nature of epigenetic marks makes them
ideal biomarkers indicating the onset or progress of the disease, or exposure. Currently available and
frequently used assays measuring absolute DNAm at single-CpG resolution (e.g. 450k array) are robust to
replicate DNAm differences identified in large cohorts, and therefore have the potential to detect DNAm
biomarkers [327]. In Study III we built a classifier to predict smoking status based on DNA methylation
profiles. We identified smoking-associated CpGs using penalized regression to serve as predictors. Given
the cross-sectional nature of the study, we cannot determine the causality, but nevertheless these smoking-
associated CpG sites are valuable to identify DNAm patterns to distinguish smoking status categories.
Furthermore, we showed that smoking status estimated using DNAm profiles is biologically relevant and
more reliable than smoking status based on questionnaires. Our classifier is provided as an R package

Implications and Future Directions
71
enabling identification of smoking status in future studies and can be used in preclinical settings to screen
the impact of smoking on methylation profiles of patients. However, the development of a biomarker panel
using smoking-associated CpGs would perhaps be more cost-efficient and better suited for clinical
purposes.
Although microarray technology (450k and EPIC) allows a cost-effective investigation of genome-wide
DNA methylation, they only cover a fraction of the 28 million known genomic CpG sites. Therefore,
affordable sequencing technologies are necessary to unravel the complete potential of DNAm in disease
mechanisms. Furthermore, developments in statistical methods are needed to enable efficient integration
of data across platforms and multiple omics. Machine learning and artificial intelligence are revolutionizing
several fields including biomedicine. Deep learning, a subfield of machine learning, is showing exceptional
results in image and speech recognition settings. However, larger and well-annotated samples are needed
to apply deep learning algorithms to biological settings. In Study III we achieved this by using detailed
smoking-behavior specific questions and by validating self-reported smoking status with cotinine to filter the
training data. Additionally, independent test datasets are also required to test the performance of predictors.
The requirement of large datasets can be partly achieved through publicly sharing data in databases like
GEO and by collaborative efforts such as ENCODE and IHEC. However, privacy regulations such as the
General Data Protection Regulation (GDPR) limit the extent of this sharing in public domain. For instance,
only three whole blood 450k datasets were available from GEO (as of September 2018) with smoking
behaviour (e.g. self-reported smoking status) and sex information to test the performance of our classifier
in Study III. Fortunately, an increasing number of biobanks with new laws in place (e.g. Finnish biobank act
2013) are making huge datasets available for research.
Studies in this thesis focused mainly on obesity and smoking. Both obesity and smoking are associated
with complex interactions among genetic, epigenetic and environmental factors. Despite several campaigns
and policies to treat and prevent obesity, there is still a need for more efficient and implementable strategies
to combat obesity [328–330]. The prevalence of smoking has reduced in developed countries because of
strict policies and taxation, however, increased prevalence is observed in developing and under-developed
countries [190,191]. Thus, there is a crucial need to strengthen translational research strategies with the
potential to implement promising novel findings directly to clinical practice to treat obesity and smoking.
Developing drugs and therapies targeting the reversible epigenetic marks is certainly an avenue to consider
and explore.
After a decade of GWAS, we are still in infancy to use causal GWAS hits in a clinical setting, and a
similar trajectory is also expected with epigenetic variants. In addition to the biological hypothesis, EWAS
should define possible cellular epigenetic models which are thought to mediate the phenotypic changes,
which can then be tested by designing appropriate molecular studies [26]. To determine and establish
causality of the identified genetic and epigenetic variants, functional laboratory experiments are needed.

Implications and Future Directions
72
Recently, it has been suggested to test the functional value of identified epigenetic associations through
epigenetic editing using CRISPR toolbox [331–334]. Epigenetic biomarkers can be considered
advantageous over genetic markers as they can capture environmental and lifestyle factors impacting
disease. Notably, DNAm-based biomarkers are more stable than RNA-based tests and can be detected in
all genomic contexts i.e. not limited to coding regions. However, the cell-type-specific nature of epigenetic
marks, and costs associated with screening, still pose limitations. Epidrugs target specific epigenomes with
disrupted epigenetic signalling, and reverse the aberrations at the target to restore the signalling. Several
epidrugs are already used in clinics, for instance, DNA methyltransferase inhibitor (DNMTi) and histone
deacetylase inhibitor (HDACi) drugs are approved for treating hematological malignancies [331]. However,
there are certain limitations associated with the epidrugs (e.g. lack of specificity), and further research is
needed to overcome the current limitations. Another important aspect of epigenetic findings pertains to
sharing the results to participants. As the epigenetic marks reflect the impact of genetic and non-genetic
factors, results may have to be shared with participants and other concerned individuals (e.g. sharing the
same environment). Also, epigenetic information may not be covered under existing genetic non-
discrimination laws, as these laws are specific to “genetic characteristics” and might result in decreased
participation of individuals in studies [335]. Therefore, new laws should be enacted specifically covering
epigenetic data. In summary, there are certainly several challenges to be met in future research to tailor
personalized medicine which can target inter-individual variability in disease, and epigenetic markers will be
vital in achieving these goals.

Conclusions
73
7 Conclusions
Each of us are unique owing to the complex interplay of inherited genetic factors and experienced
environmental stimuli. Even MZ twins with identical genotype can exhibit phenotypic divergence with their
co-twin as a response to environmental and stochastic factors. By understanding inter-individual variability
we can assess an individual’s risk for developing a disease and response to treatment. Epigenetic
mechanisms, specifically DNA methylation has been shown to contribute to human variation by acting as
an additional layer of gene regulation. Integration of multiple layers of omics data is essential to uncover the
mechanisms behind complex phenotypes like obesity and smoking, and to design effective and efficient
treatments. This thesis focused on integrating transcriptomic and DNA methylation data to understand the
regulatory mechanisms in obesity and smoking by employing appropriate study designs and statistical
methods.
In Study I, we aimed to understand the temporal changes in expression and methylation profiles of
adipose tissue during weight loss. We also integrated gene expression data and methylation profiles, to
obtain a holistic view on the impact of methylation on gene expression and thereby weight loss. Both short-
and long-term weight loss resulted in several differentially expressed genes, with significant correlations
with methylation levels in the respective genes. Furthermore, replication of our results in a validation cohort
of BMI-discordant MZ twin pairs indicated that majority of the weight-loss associated genes showed opposite
expression in acquired obesity. This study fills the gap in the existing literature regarding SAT transcriptome
and methylome changes during weight loss and also adds to our current understanding of the weight loss
mechanism in healthy obese individuals from multiple perspectives. This study also highlights the
importance of longer duration intervention studies, controlled for genetic and other confounding factors, in
identifying biologically relevant findings despite of small sample size.
Obesity and smoking are independently associated with high risk of mortality and are of high public
health relevance worldwide. A co-occurrence of these two conditions is even more detrimental to health.
Therefore, to understand the impact of smoking on adiposity, we performed transcriptome- and methylome-
wide assessment of SAT in Study II. We identified 42 differentially methylated signals and 42 differentially
expressed genes associated with smoking with an overlap at five genes, including highly replicated
smoking-methylation signals AHRR and F2RL3. Identified smoking-associated methylation and
transcriptome profiles were associated with adiposity phenotypes demonstrating the broader impact of
smoking on human metabolic health.
In Study III we extended the practical applicability of smoking-associated methylation sites by building
a robust smoking status classifier. We used multinomial LASSO regression in conjunction with internal
cross-validation to build the classifier. We have extensively tested the performance of this classifier on
several independent test datasets in comparison with two existing approaches. Our classifier showed higher
Conclusions
74
accuracy compared to other approaches and is globally applicable to all datasets without the need for
explicit data-specific threshold. Our classifier is available as an R package, EpiSmokEr, to enable smoking
status prediction in future studies.
In conclusion, this thesis advances our understanding of obesity and smoking by integrating
transcriptome and methylation data. Furthermore, this thesis extends practical applicability of smoking-
associated methylation signals and overcomes the limitations of existing score-based approaches by
developing a robust smoking status estimator and closes an important gap in the currently available toolbox
for methylation studies.
Our findings clearly show that trait associated DNA methylation profiles, independent of causality
claims, serve as important biomarkers, and are thus valuable in assessing progression of a disease or trait.
Research presented in this thesis provides valuable insights for epidemiological and epigenetic research of
obesity and smoking, and paves way forward to application of statistical and machine learning approaches
to enhance our understanding of complex diseases and traits. Epigenetic variants hold a great promise and
may emerge as vital biomarkers and drug targets, taking us a step closer to understanding inter-individual
variability in disease and realizing personalized medicine.

75
Acknowledgements
The work for this thesis was conducted at the Department of Public Health, University of Helsinki and
Institute for Molecular Medicine Finland (FIMM). I wish to acknowledge present and former department
heads and directors for providing excellent research facilities and a stimulating research environment. My
sincere thanks to the Academy of Finland, Doctoral Programme in Population Health (DocPop), European
Commission Marie Skłodowska-Curie Initial Training Network Project EPITRAIN and Sigrid Juselius
Foundation for funding the studies in this thesis.
My deepest gratitude goes to my supervisors Professor Jaakko Kaprio and Adjunct Professor Miina
Ollikainen for their constructive supervision, expertise and enthusiasm throughout my PhD. Jaakko, you
have always amazed me with your enthusiasm towards science, willingness to share your wisdom and for
always finding time amidst your busy schedule. I am very grateful for the opportunity to work with you and
thank you for being a huge source of inspiration. Miina, I am greatly indebted to you for always being
supportive and trusting in my abilities. I immensely appreciate your emotional support and professional
guidance over the years. Thank you for your patience, encouragement and understanding throughout.
Assistant Professor Tuuli Lappalainen is warmly thanked for graciously accepting the invitation to act
as the official opponent at the public examination of this thesis. My sincere thanks to Dr Christopher Bell
and Assistant Professor Juulia Jylhävä for providing constructive feedback on my thesis. Your detailed
comments and suggestions were valuable to improve the quality of my thesis. Adjunct Professor Nina
Kaminen-Ahola, thank you for accepting the role of faculty representative at the public examination of this
thesis. I warmly acknowledge my thesis committee members Professor Sampsa Hautaniemi and Dr Panu
Somervuo for their time, continuous support and timely guidance. Special thanks to Sampsa for asking
critical and challenging questions.
I warmly acknowledge the contribution and encouragement from Professor Kirsi Pietiläinen, Dr Simon
Anders, Adjunct Professor Tellervo Korhonen, Dr Jordana Bell, Dr Pei-Chien Tsai and all the co-authors of
the three articles of this thesis. Simon, thank you for pushing my limits and for inspiring me with your
technical savvy and effortless ease to spout profound ideas. During this thesis, I had the pleasure to visit
and work with wonderful researchers. Thank you very much to Dr Teodora Ribarska, Dr Anthony Mathelier,
Dr Aziz Khan and Dr Anders for hosting me and sharing your expertise on different research topics. Teodora,
thank you as well for your generosity and friendship. I also wish to thank Assistant Professor Jenny van
Dongen, Adjunct Professor Riikka Lund and several national and international collaborators
with whom I have had the privilege to work with during this thesis.
I want to express my sincere thanks to the friendly and helpful present and former colleagues in the
Kaprio group: Aileen, Aino, Aline, Alyce, Anja, Anna Kankaanpää, Antti, Anu L, Anu R, Beenish, Eero, Eeva,

76
Elina, Emma, Guiomar, Jade, Jenni, Katerina, Kauko, Khadeeja, Leonie, Linda, Maarit, Mahes, Mia, Milla,
Paula, Pauliina, Pia, Richa, Sara Kaartinen, Sara Kuitunen, Sara L, Sari, Shunshuke, Suvi, Teemu, Venla
and Yu. You have been the best colleagues, PhD companions, friends I could have hoped for. A very special
thanks to Professor Anna Keski-Rahkonen for her compassion, kindness, and instilling inspiration through
her courses and writing retreats. I also extend my gratitude to all twins and participants in the studies. I also
thank colleagues and friends at FIMM. Thanks to Anja Thiede for your friendship and funny lunch
conversations.
I sincerely thank Olle Hansson for accommodating my numerous requests and resolving my
computational problems on the FIMM cluster. Thanks to Ulla Tuomainen and Emilia Vanamo for their help
in administrative matters.
My deepest gratitude goes to my master’s thesis supervisor Dr Martin Trick for trusting in my skills and
guiding me to embark on this research journey.
Finally, much gratitude and love to Amma, Nanna and Guru for your unflinching support and
unconditional love throughout. Thank you for always believing in me, even when I didn’t believe in myself.
Sairam, I cannot thank you enough for your love and support throughout this journey. A very special thanks
to Coco and Paavo for bringing happiness, peace and joy into my life. Finally, I will be forever grateful to
you Baba for your love and blessings.

77
App
endi
x I
Supp
lem
enta
ry T
able
1
Stud
y I:
Clin
ical
and
Met
abol
ic C
hara
cter
istic
s of
Hea
lthy
Obe
se P
artic
ipan
ts a
t Thr
ee T
ime
Poin
ts D
urin
g a
One
Yea
r Wei
ght L
oss
Inte
rven
tion.
This
tab
le is
mod
ified
from
the
Tabl
e 1
of [2
97](
Bol
lepa
lli e
t al 2
018)
.
All
Par
ticip
ants
(n=1
9)W
eigh
t Los
ers
(n=6
)
Wei
ght R
egai
ners
(n=1
3)
Age
rang
e20
-48
21-4
820
-45
Sex
(m/f)
7/12
3/3
4/9
Clin
ical
Par
amet
ers
Base
line
5 m
o0
vs 5
mo
Base
line
5 m
o12
mo
5 vs
12
mo
0 vs
12
mo
Base
line
5 m
o12
mo
5 vs
12
mo
Wei
ght (
kg)
99.0
(3.2
)87
.4
(3.3
)
<.00
0
1
101.
87
(4.8
8)
87.1
3
(5.2
9)
84.4
2
(4.6
8)
0,01
60,
071
97.6
8 (4
.19)
87.5
8
(4.2
1)
92.7
2
(4.4
7)
<.00
01
BM
I (kg
/m2)
34.6
(0.6
)30
.6
(0.8
)
<.00
0
1
34.6
4
(0.7
)
29.6
(1.2
)
28.7
(0.9
6)
0,01
40,
002
34.6
5 (0
.85)
31.0
6
(1.0
2)
32.8
8
(1.0
7)
<.00
01
Bod
y fa
t (%
)44
.6 (1
.6)
39.6
(2.0
)
<.00
0
1
42.1
5
(3.2
1)
37.5
(4.5
8)
34.7
(4.0
)
0,01
80,
003
45.7
6 (1
.84)
40.5
8
(2.0
9)
43.3
7
(2.2
)
<.00
01
Subc
utan
eous
adi
pose
tis
sue
(kg)
13
.8 (0
.75)
9.8
(0.9
)<.
000
1
13.2
2
(0.9
4)
9.73
(.161
)
NA
NA
NA
14.1
5 (1
.04)
10.0
8(1.
25)
NA
NA
Intr
aabd
omin
al a
dipo
se
tissu
e (k
g)3.
7 (0
.6)
2.3
(0.4
)<.
000
1
3.19
(0.8
)
3.74
(0.8
1)
NA
NA
NA
4.11
(0.7
9)2.
65(0
.6)
NA
NA
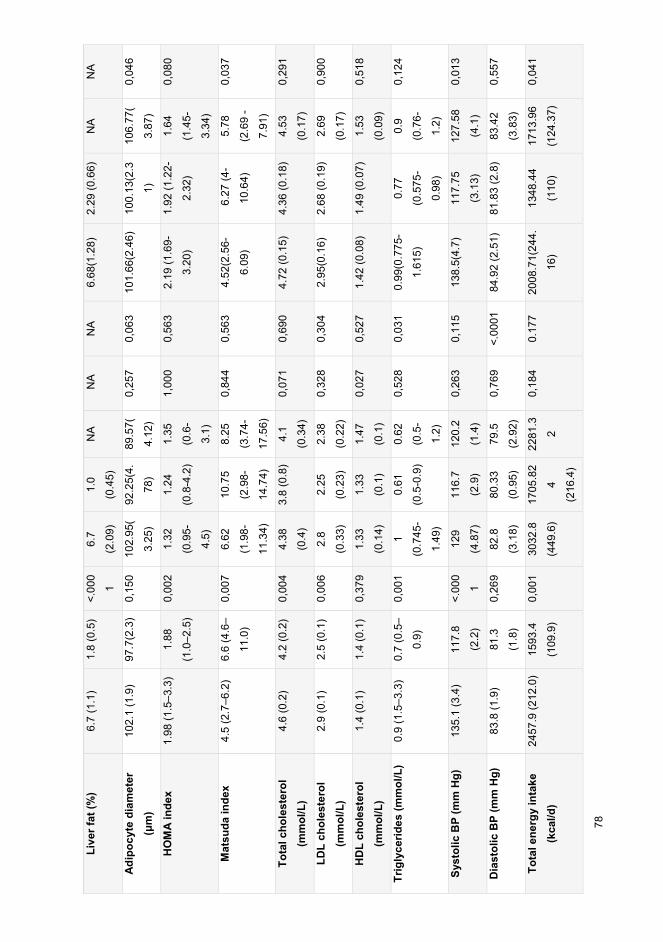
78
Live
r fat
(%)
6.7
(1.1
)1.
8 (0
.5)
<.00
0
1
6.7
(2.0
9)
1.0
(0.4
5)
NA
NA
NA
6.68
(1.2
8)2.
29 (0
.66)
NA
NA
Adi
pocy
te d
iam
eter
(μm)
102.
1 (1
.9)
97.7
(2.3
)0,
150
102.
95(
3.25
)
92.2
5(4.
78)
89.5
7(
4.12
)
0,25
70,
063
101.
66(2
.46)
100.
13(2
.3
1)
106.
77(
3.87
)
0,04
6
HO
MA
inde
x1.
98 (1
.5–3
.3)
1.88
(1.0
–2.5
)
0,00
21.
32
(0.9
5-
4.5)
1.24
(0.8
-4.2
)
1.35
(0.6
-
3.1)
1,00
00,
563
2.19
(1.6
9-
3.20
)
1.92
(1.2
2-
2.32
)
1.64
(1.4
5-
3.34
)
0,08
0
Mat
suda
inde
x4.
5(2
.7–6
.2)
6.6
(4.6
–
11.0
)
0,00
76.
62
(1.9
8-
11.3
4)
10.7
5
(2.9
8-
14.7
4)
8.25
(3.7
4-
17.5
6)
0,84
40,
563
4.52
(2.5
6-
6.09
)
6.27
(4-
10.6
4)
5.78
(2.6
9 -
7.91
)
0,03
7
Tota
l cho
lest
erol
(m
mol
/L)
4.6
(0.2
)4.
2 (0
.2)
0,00
44.
38
(0.4
)
3.8
(0.8
)4.
1
(0.3
4)
0,07
10,
690
4.72
(0.1
5)4.
36 (0
.18)
4.53
(0.1
7)
0,29
1
LDL
chol
este
rol
(mm
ol/L
)2.
9 (0
.1)
2.5
(0.1
)0,
006
2.8
(0.3
3)
2.25
(0.2
3)
2.38
(0.2
2)
0,32
80,
304
2.95
(0.1
6)2.
68 (0
.19)
2.69
(0.1
7)
0,90
0
HD
L ch
oles
tero
l (m
mol
/L)
1.4
(0.1
)1.
4 (0
.1)
0,37
91.
33
(0.1
4)
1.33
(0.1
)
1.47
(0.1
)
0,02
70,
527
1.42
(0.0
8)1.
49 (0
.07)
1.53
(0.0
9)
0,51
8
Trig
lyce
rides
(mm
ol/L
)0.
9 (1
.5–3
.3)
0.7
(0.5
–
0.9)
0,00
11
(0.7
45-
1.49
)
0.61
(0.5
-0.9
)
0.62
(0.5
-
1.2)
0,52
80,
031
0.99
(0.7
75-
1.61
5)
0.77
(0.5
75-
0.98
)
0.9
(0.7
6-
1.2)
0,12
4
Syst
olic
BP
(mm
Hg)
135.
1 (3
.4)
117.
8
(2.2
)
<.00
0
1
129
(4.8
7)
116.
7
(2.9
)
120.
2
(1.4
)
0,26
30,
115
138.
5(4.
7)11
7.75
(3.1
3)
127.
58
(4.1
)
0,01
3
Dia
stol
ic B
P (m
m H
g)83
.8 (1
.9)
81.3
(1.8
)
0,26
982
.8
(3.1
8)
80.3
3
(0.9
5)
79.5
(2.9
2)
0,76
9<.
0001
84.9
2 (2
.51)
81.8
3 (2
.8)
83.4
2
(3.8
3)
0,55
7
Tota
l ene
rgy
inta
ke
(kca
l/d)
2457
.9 (2
12.0
)15
93.4
(109
.9)
0,00
130
32.8
(449
.6)
1705
.82
4
(216
.4)
2281
.3
2
0,18
40.
177
2008
.71(
244.
16)
1348
.44
(110
)
1713
.96
(124
.37)
0,04
1

79
(378
.2
2)
Dat
a is
pre
sent
ed a
s m
ean
(SE
) for
var
iabl
es fo
llow
ing
the
norm
al d
istri
butio
n an
d as
med
ian
(inte
rqua
rtile
rang
e) fo
r ske
wed
var
iabl
es. P
aire
d t-t
ests
wer
e us
ed fo
r com
putin
g co
mpa
rison
s
betw
een
diffe
rent
tim
e po
ints
for n
orm
ally
dis
tribu
ted
varia
bles
. W
ilcox
on s
igne
d-ra
nk te
sts
wer
e im
plem
ente
d fo
r ske
wed
var
iabl
es. m
o, m
onth
; NA
, dat
a no
t ava
ilabl
e.

80
References
1 Polderman, T.J.C. et al. (2015) Meta-analysis of the heritability of human traits based on fifty years of twin studies. Nat. Genet. 47, 702
2 Bonder, M.J. et al. (2017) Disease variants alter transcription factor levels and methylation of their binding sites. Nat. Genet. 49, 131–138
3 Consortium, I.H.G.S. (2004) Finishing the euchromatic sequence of the human genome. Nature 431, 931–9454 Altshuler, D.M. et al. (2010) Integrating common and rare genetic variation in diverse human populations. Nature
467, 52–585 Visscher, P.M. et al. (2017) 10 Years of GWAS Discovery: Biology, Function, and Translation. Am. J. Hum. Genet.
101, 5–226 MacArthur, J. et al. (2017) The new NHGRI-EBI Catalog of published genome-wide association studies (GWAS
Catalog). Nucleic Acids Res. 45, D896–D9017 Watanabe, K. et al. (2019) A global overview of pleiotropy and genetic architecture in complex traits. Nat. Genet.
51, 1339–13488 Welter, D. et al. (2014) The NHGRI GWAS Catalog, a curated resource of SNP-trait associations. Nucleic Acids
Res. DOI: 10.1093/nar/gkt12299 Yang, J. et al. (2015) Genetic variance estimation with imputed variants finds negligible missing heritability for
human height and body mass index. Nat. Genet. 47, 1114–112010 Wainschtein, P. et al. (2019) Recovery of trait heritability from whole genome sequence data. bioRxiv DOI:
10.1101/58802011 Trerotola, M. et al. (2015) Epigenetic inheritance and the missing heritability. Hum. Genomics 9, 1712 Manolio, T.A. et al. Finding the missing heritability of complex diseases. , Nature. (2009) 13 Richards, E.J. (2006) Inherited epigenetic variation — revisiting soft inheritance. Nat. Rev. Genet. 7, 395–40114 Waddington and H, C. (1942) The epigenotype. Endeavour 1, 18–2015 Waddington, C.H. (2014) The strategy of the genes, Routledge.16 Horvath, S. (2013) DNA methylation age of human tissues and cell types. Genome Biol. 14, R11517 Gutierrez-Arcelus, M. et al. (2015) Tissue-specific effects of genetic and epigenetic variation on gene regulation
and splicing. PLoS Genet. 11, e100495818 Barlow, D.P. and Bartolomei, M.S. (2014) Genomic imprinting in mammals. Cold Spring Harb. Perspect. Biol. 6, 19 Sharp, A.J. et al. (2011) DNA methylation profiles of human active and inactive X chromosomes. Genome Res.
21, 1592–160020 Reik, W. (2007) Stability and flexibility of epigenetic gene regulation in mammalian development. Nature 447,
425–43221 Riggs, A.D. (1975) X inactivation, differentiation, and DNA methylation. Cytogenet. Cell Genet. 14, 9–2522 Berger, S.L. et al. (2009) An operational definition of epigenetics. Genes Dev. 23, 781–78323 Bird, A. (2007) Perceptions of epigenetics. Nature 447, 396–39824 Dupont, C. et al. (2009) Epigenetics: definition, mechanisms and clinical perspective. Semin. Reprod. Med. 27,
351–35725 Feil, R. and Fraga, M.F. (2012) Epigenetics and the environment: emerging patterns and implications. Nat. Rev.
Genet. 13, 97–10926 Lappalainen, T. and Greally, J.M. (2017) Associating cellular epigenetic models with human phenotypes. Nat.
Rev. Genet. 18, 441–45127 Sharma, S. et al. (2010) Epigenetics in cancer. Carcinogenesis 31, 27–3628 Weaver, I.C.G. et al. (2004) Epigenetic programming by maternal behavior. Nat. Neurosci. 7, 847–85429 Dias, B.G. and Ressler, K.J. (2014) Parental olfactory experience influences behavior and neural structure in
subsequent generations. Nat. Neurosci. 17, 89–9630 Daxinger, L. and Whitelaw, E. (2012) Understanding transgenerational epigenetic inheritance via the gametes in
mammals. Nat. Rev. Genet. 13, 153–16231 Guerrero-Bosagna, C. and Skinner, M.K. (2012) Environmentally induced epigenetic transgenerational
inheritance of phenotype and disease. Mol. Cell. Endocrinol. 354, 3–832 Heard, E. and Martienssen, R.A. (2014) Transgenerational epigenetic inheritance: myths and mechanisms. Cell
157, 95–10933 Horsthemke, B. (2018) A critical view on transgenerational epigenetic inheritance in humans. Nat. Commun. 9,
2973

81
34 McGinty, R.K. and Tan, S. (2015) Nucleosome structure and function. Chem. Rev. 115, 2255–227335 Zhou, K. et al. (2019) Nucleosome structure and dynamics are coming of age. Nat. Struct. Mol. Biol. 26, 3–1336 Egger, G. et al. (2004) Epigenetics in human disease and prospects for epigenetic therapy. Nature 429, 457–46337 Kouzarides, T. (2007) Chromatin Modifications and Their Function. Cell 128, 693–70538 Trojer, P. and Reinberg, D. (2007) Facultative Heterochromatin: Is There a Distinctive Molecular Signature? Mol.
Cell 28, 1–1339 Consortium, R.E. et al. (2015) Integrative analysis of 111 reference human epigenomes. Nature 518, 317–33040 Gendrel, A.-V. and Heard, E. (2014) Noncoding RNAs and epigenetic mechanisms during X-chromosome
inactivation. Annu. Rev. Cell Dev. Biol. 30, 561–58041 Kaikkonen, M.U. et al. (2011) Non-coding RNAs as regulators of gene expression and epigenetics. Cardiovasc.
Res. 90, 430–44042 Relton, C.L. and Davey Smith, G. (2010) Epigenetic epidemiology of common complex disease: prospects for
prediction, prevention, and treatment. PLoS Med. 7, e1000356–e100035643 Patil, V. et al. (2014) The evidence for functional non-CpG methylation in mammalian cells. Epigenetics 9, 823–
82844 Lyko, F. (2018) The DNA methyltransferase family: a versatile toolkit for epigenetic regulation. Nat. Rev. Genet.
19, 81–9245 Okano, M. et al. (1999) DNA Methyltransferases Dnmt3a and Dnmt3b Are Essential for De Novo Methylation and
Mammalian Development. Cell 99, 247–25746 Okano, M. et al. (1998) Cloning and characterization of a family of novel mammalian DNA (cytosine-5)
methyltransferases. Nat. Genet. 19, 219–22047 Jeltsch, A. and Jurkowska, R.Z. (2014) New concepts in DNA methylation. Trends Biochem. Sci. 39, 310–31848 Bird, A.P. (1986) CpG-rich islands and the function of DNA methylation. Nature 321, 209–21349 Lister, R. et al. (2009) Human DNA methylomes at base resolution show widespread epigenomic differences.
Nature 462, 315–32250 Bird, A.P. (1980) DNA methylation and the frequency of CpG in animal DNA. Nucleic Acids Res. 8, 1499–150451 Suzuki, M.M. and Bird, A. (2008) DNA methylation landscapes: provocative insights from epigenomics. Nat. Rev.
Genet. 9, 465–47652 Jones, P.A. (2012) Functions of DNA methylation: islands, start sites, gene bodies and beyond. Nat. Rev. Genet.
13, 484–49253 Blattler, A. et al. (2014) Global loss of DNA methylation uncovers intronic enhancers in genes showing expression
changes. Genome Biol. 15, 46954 Anastasiadi, D. et al. (2018) Consistent inverse correlation between DNA methylation of the first intron and gene
expression across tissues and species. Epigenetics Chromatin 11, 3755 Yin, Y. et al. (2017) Impact of cytosine methylation on DNA binding specificities of human transcription factors.
Science (80-. ). 356, eaaj223956 Greenberg, M.V.C. and Bourc’his, D. (2019) The diverse roles of DNA methylation in mammalian development
and disease. Nat. Rev. Mol. Cell Biol. DOI: 10.1038/s41580-019-0159-657 Wu, X. and Zhang, Y. (2017) TET-mediated active DNA demethylation: mechanism, function and beyond. Nat.
Rev. Genet. 18, 517–53458 Hannon, E. et al. (2018) Characterizing genetic and environmental influences on variable DNA methylation using
monozygotic and dizygotic twins. PLoS Genet. 14, 59 Liu, Y. et al. (2013) Epigenome-wide association data implicate DNA methylation as an intermediary of genetic
risk in rheumatoid arthritis. Nat. Biotechnol. 31, 142–14760 Rönn, T. et al. (2013) A six months exercise intervention influences the genome-wide DNA methylation pattern
in human adipose tissue. PLoS Genet. 9, e100357261 Tsaprouni, L.G. et al. (2014) Cigarette smoking reduces DNA methylation levels at multiple genomic loci but the
effect is partially reversible upon cessation. Epigenetics 9, 1382–139662 Grundberg, E. et al. (2013) Global Analysis of DNA Methylation Variation in Adipose Tissue from Twins Reveals
Links to Disease-Associated Variants in Distal Regulatory Elements (vol 93, pg 876, 2013). Am. J. Hum. Genet.93, 1158
63 Wahl, S. et al. (2017) Epigenome-wide association study of body mass index, and the adverse outcomes of adiposity. Nature DOI: 10.1038/nature20784
64 Joehanes, R. et al. (2016) Epigenetic Signatures of Cigarette Smoking. Circ. Cardiovasc. Genet. 9, 436–44765 Marzi, S.J. et al. (2018) A histone acetylome-wide association study of Alzheimer’s disease identifies disease-
associated H3K27ac differences in the entorhinal cortex. Nat. Neurosci. 21, 1618–162766 Carlberg, C. and Molnár, F. (2016) Overview: What Is Gene Expression? BT - Mechanisms of Gene Regulation.
(Carlberg, C. and Molnár, F., eds), pp. 3–16, Springer Netherlands
82
67 Lander, E.S. (2011) Initial impact of the sequencing of the human genome. Nature 470, 187–19768 Melé, M. et al. (2015) Human genomics. The human transcriptome across tissues and individuals. Science 348,
660–66569 Aguet, F. et al. (2017) Genetic effects on gene expression across human tissues. Nature DOI:
10.1038/nature2427770 Marabita, F. et al. (2015) Introduction to Data Types in Epigenomics BT - Computational and Statistical
Epigenomics. (Teschendorff, A. E., ed), pp. 3–34, Springer Netherlands71 Bock, C. et al. (2010) Quantitative comparison of genome-wide DNA methylation mapping technologies. Nat.
Biotechnol. 28, 110672 Li, Y. and Tollefsbol, T.O. (2011) DNA methylation detection: bisulfite genomic sequencing analysis. Methods
Mol. Biol. 791, 11–2173 Bibikova, M. et al. (2011) High density DNA methylation array with single CpG site resolution. Genomics 98, 288–
29574 Moran, S. et al. (2015) Validation of a DNA methylation microarray for 850,000 CpG sites of the human genome
enriched in enhancer sequences. Epigenomics 8, 389–39975 Miller, M.B. and Tang, Y.-W. (2009) Basic Concepts of Microarrays and Potential Applications in Clinical
Microbiology. Clin. Microbiol. Rev. 22, 611 LP – 63376 Bibikova, M. et al. (2009) Genome-wide DNA methylation profiling using Infinium® assay. Epigenomics 1, 177–
20077 Sandoval, J. et al. (2011) Validation of a DNA methylation microarray for 450,000 CpG sites in the human
genome. Epigenetics 6, 692–70278 Marabita, F. et al. (2013) An evaluation of analysis pipelines for DNA methylation profiling using the Illumina
HumanMethylation450 BeadChip platform. Epigenetics 8, 333–34679 Bock, C. (2012) Analysing and interpreting DNA methylation data. Nat. Rev. Genet. 13, 705–71980 Touleimat, N. and Tost, J. (2012) Complete pipeline for Infinium(®) Human Methylation 450K BeadChip data
processing using subset quantile normalization for accurate DNA methylation estimation. Epigenomics 4, 325–341
81 Morris, T.J. et al. (2014) ChAMP: 450k chip analysis methylation pipeline. Bioinformatics 30, 82 Pidsley, R. et al. (2013) A data-driven approach to preprocessing Illumina 450K methylation array data. BMC
Genomics 14, 29383 Laird, P.W. (2010) Principles and challenges of genome-wide DNA methylation analysis. Nat. Rev. Genet. 11,
191–20384 Teschendorff, A.E. et al. (2013) A beta-mixture quantile normalization method for correcting probe design bias in
Illumina Infinium 450 k DNA methylation data. Bioinformatics 29, 189–19685 Maksimovic, J. et al. (2012) SWAN: Subset-quantile Within Array Normalization for Illumina Infinium
HumanMethylation450 BeadChips. Genome Biol. 13, R4486 Aryee, M.J. et al. (2014) Minfi: a flexible and comprehensive Bioconductor package for the analysis of Infinium
DNA methylation microarrays. Bioinformatics 30, 1363–136987 Lehne, B. et al. (2015) A coherent approach for analysis of the Illumina {HumanMethylation450} {BeadChip}
improves data quality and performance in epigenome-wide association studies. Genome Biol. 16, 3788 Fortin, J.-P. et al. (2014) Functional normalization of 450k methylation array data improves replication in large
cancer studies. Genome Biol. 15, 50389 Cazaly, E. et al. (2019) Making Sense of the Epigenome Using Data Integration Approaches. Front. Pharmacol.
10, 12690 Ballereau, S. et al. (2013) Functional Genomics, Proteomics, Metabolomics and Bioinformatics for Systems
Biology BT - Systems Biology: Integrative Biology and Simulation Tools. (Prokop, A. and Csukás, B., eds), pp. 3–41, Springer Netherlands
91 Rakyan, V.K. et al. (2011) Epigenome-wide association studies for common human diseases. Nat. Rev. Genet.12, 529–541
92 Houseman, E.A. et al. (2012) DNA methylation arrays as surrogate measures of cell mixture distribution. BMC Bioinformatics 13, 86
93 Houseman, E.A. et al. (2014) Reference-free cell mixture adjustments in analysis of DNA methylation data. Bioinformatics 30, 1431–1439
94 Zou, J. et al. (2014) Epigenome-wide association studies without the need for cell-type composition. Nat. Methods11, 309
95 van Dongen, J. et al. (2012) The continuing value of twin studies in the omics era. Nat. Rev. Genet. 13, 64096 Kaminsky, Z.A. et al. (2009) DNA methylation profiles in monozygotic and dizygotic twins. Nat. Genet. 41, 240–
245
83
97 van Dongen, J. et al. (2016) Genetic and environmental influences interact with age and sex in shaping the human methylome. Nat. Commun. 7,
98 Bell, J.T. and Spector, T.D. (2012) DNA methylation studies using twins: what are they telling us? Genome Biol.13, 172
99 Richardson, T.G. et al. (2017) Mendelian Randomization Analysis Identifies CpG Sites as Putative Mediators for Genetic Influences on Cardiovascular Disease Risk. Am. J. Hum. Genet. 101, 590–602
100 Davegårdh, C. et al. (2017) Abnormal epigenetic changes during differentiation of human skeletal muscle stem cells from obese subjects. BMC Med. 15, 39
101 Dunham, I. et al. (2012) An integrated encyclopedia of DNA elements in the human genome. Nature 489, 57–74102 Bernstein, B.E. et al. (2010) The NIH Roadmap Epigenomics Mapping Consortium. Nat. Biotechnol. 28, 1045103 Martens, J.H.A. and Stunnenberg, H.G. (2013) BLUEPRINT: mapping human blood cell epigenomes.
Haematologica 98, 1487 LP – 1489104 Bujold, D. et al. (2016) The International Human Epigenome Consortium Data Portal. Cell Syst. 3, 496-499.e2105 Lipshutz, R.J. et al. (1999) High density synthetic oligonucleotide arrays. Nat. Genet. 21, 20–24106 Irizarry, R.A. et al. (2003) Exploration, normalization, and summaries of high density oligonucleotide array probe
level data. Biostatistics 4, 249–264107 Stark, R. et al. (2019) RNA sequencing: the teenage years. Nat. Rev. Genet. 20, 631–656108 Ozsolak, F. and Milos, P.M. (2011) RNA sequencing: advances, challenges and opportunities. Nat. Rev. Genet.
12, 87–98109 World Health Orgnaization (2000) Obesity: preventing and managing the global epidemic Report of a WHO
Consultation, World Health Organization.110 WHO. Obesity and overweight. . [Online]. Available: http://www.who.int/mediacentre/factsheets/fs311/en/.
[Accessed: 10-Sep-2019]111 De Gonzalez, A.B. et al. (2010) Body-mass index and mortality among 1.46 million white adults. N. Engl. J. Med.
DOI: 10.1056/NEJMoa1000367112 Global BMI Mortality Collaboration et al. (2016) Body-mass index and all-cause mortality: individual-participant-
data meta-analysis of 239 prospective studies in four continents. Lancet 388, 776–786113 Copeland, K.C. et al. (2013) Management of newly diagnosed type 2 diabetes mellitus (T2DM) in children and
adolescents. Pediatrics DOI: 10.1542/peds.2012-3494114 Fagot-Campagna, A. (2000) , Emergence of type 2 diabetes mellitus in children: Epidemiological evidence. , in
Journal of Pediatric Endocrinology and Metabolism115 Reilly, J.J. and Kelly, J. Long-term impact of overweight and obesity in childhood and adolescence on morbidity
and premature mortality in adulthood: Systematic review. , International Journal of Obesity. (2011) 116 Finsote (2018) Alueelliset erot aikuisten palvelukokemuksissa ja hyvinvoinnissa –Finsote 2018. Stat. Rep.
21/2018, June 4, 2018.117 van Dijk, S.B. et al. (2012) Different anthropometric adiposity measures and their association with cardiovascular
disease risk factors: a meta-analysis. Neth. Heart J. 20, 208–218118 Pietiläinen, K.H. et al. (2013) Agreement of bioelectrical impedance with dual-energy X-ray absorptiometry and
MRI to estimate changes in body fat, skeletal muscle and visceral fat during a 12-month weight loss intervention. Br. J. Nutr. 109, 1910–1916
119 Trayhurn, P. (2007) Adipocyte biology. Obes. Rev. 8 Suppl 1, 41–44120 Bartelt, A. and Heeren, J. (2014) Adipose tissue browning and metabolic health. Nat. Rev. Endocrinol. 10, 24–
36121 Arner, P. (1997) Regional adipocity in man. J. Endocrinol. 155, 191–192122 Wajchenberg, B.L. (2000) Subcutaneous and visceral adipose tissue: their relation to the metabolic syndrome.
Endocr. Rev. 21, 697–738123 Claussnitzer, M. et al. (2015) FTO Obesity Variant Circuitry and Adipocyte Browning in Humans. N. Engl. J. Med.
373, 895–907124 Ahima, R.S. and Flier, J.S. (2000) Adipose tissue as an endocrine organ. Trends Endocrinol. Metab. 11, 327–
332125 Coelho, M. et al. (2013) Biochemistry of adipose tissue: an endocrine organ. Arch. Med. Sci. 9, 191–200126 Scherer, P.E. (2006) Adipose tissue: from lipid storage compartment to endocrine organ. Diabetes 55, 1537–
1545127 Friedman, J.M. (2019) Leptin and the endocrine control of energy balance. Nat. Metab. 1, 754–764128 Halaas, J.L. et al. (1995) Weight-reducing effects of the plasma protein encoded by the obese gene. Science
(80-. ). 269, 543 LP – 546129 Farooqi, I.S. et al. (1999) Effects of Recombinant Leptin Therapy in a Child with Congenital Leptin Deficiency. N.
Engl. J. Med. 341, 879–884

84
130 Montague, C.T. et al. (1997) Congenital leptin deficiency is associated with severe early-onset obesity in humans. Nature 387, 903–908
131 Licinio, J. et al. (2004) Phenotypic effects of leptin replacement on morbid obesity, diabetes mellitus,hypogonadism, and behavior in leptin-deficient adults. Proc. Natl. Acad. Sci. U. S. A. 101, 4531 LP – 4536
132 Cawthorn, W.P. and Sethi, J.K. (2008) TNF-α and adipocyte biology. FEBS Lett. 582, 117–131133 Sun, K. et al. (2011) Adipose tissue remodeling and obesity. J. Clin. Invest. 121, 2094–2101134 Frayn, K. (2002) Adipose tissue as a buffer for daily lipid flux. Diabetologia 45, 1201–1210135 Longo, M. et al. (2019) Adipose Tissue Dysfunction as Determinant of Obesity-Associated Metabolic
Complications. Int. J. Mol. Sci. 20, 136 Laclaustra, M. et al. (2007) Metabolic syndrome pathophysiology: the role of adipose tissue. Nutr. Metab.
Cardiovasc. Dis. 17, 125–139137 Lee, M.-J. et al. (2010) Adipose tissue remodeling in pathophysiology of obesity. Curr. Opin. Clin. Nutr. Metab.
Care 13, 371–376138 Elks, C.E. et al. (2012) Variability in the heritability of body mass index: a systematic review and meta-regression.
Front. Endocrinol. (Lausanne). 3, 29139 Min, J. et al. (2013) Variation in the heritability of body mass index based on diverse twin studies: a systematic
review. Obes. Rev. 14, 871–882140 Silventoinen, K. et al. (2016) Genetic and environmental effects on body mass index from infancy to the onset of
adulthood: an individual-based pooled analysis of 45 twin cohorts participating in the COllaborative project of Development of Anthropometrical measures in Twins (CODATwins). Am. J. Clin. Nutr. 104, 371–379
141 Frayling, T.M. et al. (2007) A Common Variant in the FTO Gene Is Associated with Body Mass Index and Predisposes to Childhood and Adult Obesity. Science (80-. ). 316, 889 LP – 894
142 Scuteri, A. et al. (2007) Genome-Wide Association Scan Shows Genetic Variants in the FTO Gene Are Associated with Obesity-Related Traits. PLOS Genet. 3, e115
143 Locke, A.E. et al. (2015) Genetic studies of body mass index yield new insights for obesity biology. Nature DOI: 10.1038/nature14177
144 Hoffmann, T.J. et al. (2018) A Large Multiethnic Genome-Wide Association Study of Adult Body Mass Index Identifies Novel Loci. Genetics 210, 499 LP – 515
145 Speakman, J.R. et al. GWAS for BMI: a treasure trove of fundamental insights into the genetic basis of obesity. , International Journal of Obesity. (2018)
146 Yengo, L. et al. (2018) Meta-analysis of genome-wide association studies for height and body mass index in 700000 individuals of European ancestry. Hum. Mol. Genet. 27, 3641–3649
147 Walley, A.J. et al. (2006) Genetics of obesity and the prediction of risk for health. Hum. Mol. Genet. DOI: 10.1093/hmg/ddl215
148 Blundell, J.E. et al. Appetite control and energy balance: Impact of exercise. , Obesity Reviews. (2015) 149 Van Der Klaauw, A.A. and Farooqi, I.S. The hunger genes: Pathways to obesity. , Cell. (2015) 150 Ling, C. and Rönn, T. (2019) Epigenetics in Human Obesity and Type 2 Diabetes. Cell Metab. 29, 1028–1044151 van Dijk, S.J. et al. (2015) Recent developments on the role of epigenetics in obesity and metabolic disease. Clin.
Epigenetics 7, 66152 van Dijk, S.J. et al. (2015) Epigenetics and human obesity. Int. J. Obes. 39, 85–97153 Thaker, V. V (2017) Genetic and epigenetic causes of obesity. Adolesc. Med. State Art Rev. 28, 379–405154 Herrera, B.M. et al. Genetics and epigenetics of obesity. , Maturitas. (2011) 155 Cordero, P. et al. (2015) Epigenetics of obesity: beyond the genome sequence. Curr. Opin. Clin. Nutr. Metab.
Care 18, 361–366156 Ollikainen, M. et al. (2015) Genome-wide blood DNA methylation alterations at regulatory elements and
heterochromatic regions in monozygotic twins discordant for obesity and liver fat. Clin. Epigenetics 7, 39157 Roseboom, T. et al. (2006) The Dutch famine and its long-term consequences for adult health. Early Hum. Dev.
82, 485–491158 Heijmans, B.T. et al. (2008) Persistent epigenetic differences associated with prenatal exposure to famine in
humans. Proc. Natl. Acad. Sci. U. S. A. 105, 17046–17049159 Tobi, E.W. et al. (2009) DNA methylation differences after exposure to prenatal famine are common and timing-
and sex-specific. Hum. Mol. Genet. 18, 4046–4053160 Tobi, E.W. et al. (2018) DNA methylation as a mediator of the association between prenatal adversity and risk
factors for metabolic disease in adulthood. Sci. Adv. 4, eaao4364161 Bell, C.G. (2017) The Epigenomic Analysis of Human Obesity. Obesity 25, 1471–1481162 Rohde, K. et al. (2019) Genetics and epigenetics in obesity. Metabolism 92, 37–50163 Milagro, F.I. and Martínez, J.A. (2013) Epigenetics of obesity and weight loss. Endocrinol. Nutr. 60 Suppl 1, 12–
14
85
164 Martínez, J.A. et al. (2014) Epigenetics in adipose tissue, obesity, weight loss, and diabetes. Adv. Nutr. 5, 71–81165 Lopomo, A. et al. (2016) Epigenetics of Obesity. Prog. Mol. Biol. Transl. Sci. 140, 151–184166 Nicoletti, C.F. et al. (2016) DNA Methylation and Hydroxymethylation Levels in Relation to Two Weight Loss
Strategies: Energy-Restricted Diet or Bariatric Surgery. Obes. Surg. 26, 603–611167 Sayols-Baixeras, S. et al. (2017) DNA methylation and obesity traits: An epigenome-wide association study. The
REGICOR study. Epigenetics 12, 909–916168 Wahl, S. et al. (2017) Epigenome-wide association study of body mass index, and the adverse outcomes of
adiposity. Nature 541, 81–86169 Mendelson, M.M. et al. (2017) Association of Body Mass Index with DNA Methylation and Gene Expression in
Blood Cells and Relations to Cardiometabolic Disease: A Mendelian Randomization Approach. PLOS Med. 14, e1002215
170 Das, S.K. et al. (2015) Adipose tissue gene expression and metabolic health of obese adults. Int. J. Obes. 39, 869–873
171 Heinonen, S. et al. (2017) Mitochondria-related transcriptional signature is downregulated in adipocytes in obesity: a study of young healthy MZ twins. Diabetologia 60, 169–181
172 Walley, A.J. et al. (2012) Differential coexpression analysis of obesity-associated networks in human subcutaneous adipose tissue. Int. J. Obes. 36, 137–147
173 Pietilainen, K.H. et al. (2016) DNA methylation and gene expression patterns in adipose tissue differ significantly within young adult monozygotic BMI-discordant twin pairs. Int. J. Obes. 40, 654–661
174 Pietiläinen, K.H. et al. (2008) Global Transcript Profiles of Fat in Monozygotic Twins Discordant for BMI: Pathways behind Acquired Obesity. PLOS Med. 5, e51
175 Dubois, S.G. et al. (2006) Decreased Expression of Adipogenic Genes in Obese Subjects with Type 2 Diabetes. Obesity 14, 1543–1552
176 Rönn, T. et al. (2015) Impact of age, BMI and HbA1c levels on the genome-wide DNA methylation and mRNA expression patterns in human adipose tissue and identification of epigenetic biomarkers in blood. Hum. Mol. Genet. 24, 3792–3813
177 Dick, K.J. et al. (2014) DNA methylation and body-mass index: a genome-wide analysis. Lancet 383, 1990–1998178 Jensen, M.D. et al. (2014) 2013 AHA/ACC/TOS Guideline for the Management of Overweight and Obesity in
Adults: A Report of the American College of Cardiology/American Heart Association Task Force on Practice Guidelines and The Obesity Society. J. Am. Coll. Cardiol. 63, 2985–3023
179 Dahlman, I. et al. (2005) Changes in adipose tissue gene expression with energy-restricted diets in obese women. Am. J. Clin. Nutr. 81, 1275–1285
180 Johansson, L.E. et al. (2012) Differential gene expression in adipose tissue from obese human subjects during weight loss and weight maintenance. Am. J. Clin. Nutr. 96, 196–207
181 Mutch, D.M. et al. (2011) A distinct adipose tissue gene expression response to caloric restriction predicts 6-mo weight maintenance in obese subjects. Am. J. Clin. Nutr. 94, 1399–1409
182 Clément, K. et al. (2004) Weight loss regulates inflammation-related genes in white adipose tissue of obese subjects. FASEB J. 18, 1657–1669
183 Campbell, K.L. et al. (2013) Gene expression changes in adipose tissue with diet- and/or exercise-induced weight loss. Cancer Prev. Res. 6, 217–231
184 Bouchard, L. et al. (2010) Differential epigenomic and transcriptomic responses in subcutaneous adipose tissue between low and high responders to caloric restriction. Am. J. Clin. Nutr. 91, 309–320
185 Aronica, L. et al. (2017) A systematic review of studies of DNA methylation in the context of a weight loss intervention. Epigenomics 9, 769–787
186 Mutch, D.M. et al. (2007) Adipose gene expression prior to weight loss can differentiate and weakly predict dietary responders. PLoS One 2, e1344
187 Capel, F. et al. (2008) Contribution of energy restriction and macronutrient composition to changes in adipose tissue gene expression during dietary weight-loss programs in obese women. J. Clin. Endocrinol. Metab. 93, 4315–4322
188 Capel, F. et al. (2009) Macrophages and Adipocytes in Human Obesity. Diabetes 58, 1558 LP – 1567189 Márquez-Quiñones, A. et al. (2010) Adipose tissue transcriptome reflects variations between subjects with
continued weight loss and subjects regaining weight 6 mo after caloric restriction independent of energy intake. Am. J. Clin. Nutr. 92, 975–984
190 World Health, O. (2017) WHO report on the global tobacco epidemic 2017: Monitoring tobacco use and prevention policies. at <https://escholarship.org/uc/item/8nw5p0zt>
191 J. Drope, N. Schluger, et al. (2018) The Tobacco Atlas. Atlanta: American Cancer Society and Vital Strategies. 192 Belsky, D.W. et al. (2013) Polygenic Risk and the Developmental Progression to Heavy, Persistent Smoking and
Nicotine Dependence: Evidence From a 4-Decade Longitudinal Study. JAMA Psychiatry 70, 534–542193 Aloise-Young, P.A. et al. (1994) Peer influence on smoking initiation during early adolescence: A comparison of
86
group members and group outsiders. Journal of Applied Psychology, 79, American Psychological Association, 281–287
194 Maxwell, K.A. (2002) Friends: The Role of Peer Influence Across Adolescent Risk Behaviors. J. Youth Adolesc.31, 267–277
195 Simons-Morton, B.G. and Farhat, T. (2010) Recent findings on peer group influences on adolescent smoking. J. Prim. Prev. 31, 191—208
196 Mercken, L. et al. (2009) Social influence and selection effects in the context of smoking behavior: Changes during early and mid adolescence. , Health Psychology, 28. American Psychological Association, 73–82
197 CONRAD, K.M. et al. (1992) Why children start smoking cigarettes: predictors of onset. Br. J. Addict. 87, 1711–1724
198 Buller, D.B. et al. (2003) Understanding factors that influence smoking uptake. Tob. Control 12, iv16 LP-iv25199 Hukkanen, J. et al. (2005) Metabolism and Disposition Kinetics of Nicotine. Pharmacol. Rev. 57, 79 LP – 115200 Picciotto, M.R. and Mineur, Y.S. (2014) Molecules and circuits involved in nicotine addiction: The many faces of
smoking. Neuropharmacology 76 Pt B, 545–553201 McLaughlin, I. et al. (2015) Nicotine withdrawal. Curr. Top. Behav. Neurosci. 24, 99–123202 Allen, S.S. et al. (2008) Craving, Withdrawal, and Smoking Urges on Days Immediately Prior to Smoking Relapse.
Nicotine Tob. Res. 10, 35–45203 Jackson, K.J. et al. (2015) New mechanisms and perspectives in nicotine withdrawal. Neuropharmacology 96,
223–234204 Li, M.D. (2006) The genetics of nicotine dependence. Curr. Psychiatry Rep. 8, 158–164205 Vink, J.M. et al. (2005) Heritability of Smoking Initiation and Nicotine Dependence. Behav. Genet. 35, 397–406206 Lessov-Schlaggar, C.N. et al. (2008) Genetics of nicotine dependence and pharmacotherapy. Biochem.
Pharmacol. 75, 178–195207 Thorgeirsson, T.E. et al. (2010) Sequence variants at CHRNB3–CHRNA6 and CYP2A6 affect smoking behavior.
Nat. Genet. 42, 448–453208 Chen, L.-S. et al. (2012) Interplay of Genetic Risk Factors (CHRNA5-CHRNA3-CHRNB4) and Cessation
Treatments in Smoking Cessation Success. Am. J. Psychiatry 169, 735–742209 Saccone, S.F. et al. (2006) Cholinergic nicotinic receptor genes implicated in a nicotine dependence association
study targeting 348 candidate genes with 3713 SNPs. Hum. Mol. Genet. 16, 36–49210 Freathy, R.M. et al. (2009) A common genetic variant in the 15q24 nicotinic acetylcholine receptor gene cluster
(CHRNA5–CHRNA3–CHRNB4) is associated with a reduced ability of women to quit smoking in pregnancy. Hum. Mol. Genet. 18, 2922–2927
211 Bierut, L.J. et al. (2008) Variants in Nicotinic Receptors and Risk for Nicotine Dependence. Am. J. Psychiatry165, 1163–1171
212 Bierut, L.J. et al. (2006) Novel genes identified in a high-density genome wide association study for nicotine dependence. Hum. Mol. Genet. 16, 24–35
213 Furberg, H. et al. (2010) Genome-wide meta-analyses identify multiple loci associated with smoking behavior. Nat. Genet. 42, 441–447
214 Benowitz, N.L. et al. (2006) CYP2A6 genotype and the metabolism and disposition kinetics of nicotine. Clin. Pharmacol. Ther. 80, 457–467
215 Malaiyandi, V. et al. (2005) Implications of CYP2A6 Genetic Variation for Smoking Behaviors and Nicotine Dependence. Clin. Pharmacol. Ther. 77, 145–158
216 Ambatipudi, S. et al. (2016) Tobacco smoking-associated genome-wide DNA methylation changes in the EPIC study. Epigenomics 8, 599–618
217 Elliott, H.R. et al. (2014) Differences in smoking associated DNA methylation patterns in South Asians and Europeans. Clin. Epigenetics 6, 4
218 Gao, X. et al. (2015) DNA methylation changes of whole blood cells in response to active smoking exposure in adults: a systematic review of DNA methylation studies. Clin. Epigenetics 7, 113
219 Guida, F. et al. (2015) Dynamics of smoking-induced genome-wide methylation changes with time since smoking cessation. Hum. Mol. Genet. 24, 2349–2359
220 Zeilinger, S. et al. (2013) Tobacco smoking leads to extensive genome-wide changes in DNA methylation. PLoS One 8,
221 Zhang, Y. et al. (2016) Self-reported smoking, serum cotinine, and blood DNA methylation. Environ. Res. 146, 395–403
222 Zhang, Y. et al. (2014) F2RL3 methylation as a biomarker of current and lifetime smoking exposures. Environ. Heal. Perspect. 122, 131–137
223 Wan, E.S. et al. (2012) Cigarette smoking behaviors and time since quitting are associated with differential DNA methylation across the human genome. Hum Mol Genet 21,

87
224 Shenker, N.S. et al. (2013) DNA methylation as a long-term biomarker of exposure to tobacco smoke. Epidemiology 24,
225 Fasanelli, F. et al. (2015) Hypomethylation of smoking-related genes is associated with future lung cancer in four prospective cohorts. Nat. Commun. 6, 10192
226 Shenker, N.S. et al. (2013) Epigenome-wide association study in the European prospective investigation into cancer and nutrition (EPIC-Turin) identifies novel genetic loci associated with smoking. Hum Mol Genet 22,
227 Teschendorff, A.E. et al. (2015) Correlation of Smoking-Associated DNA Methylation Changes in Buccal Cells With DNA Methylation Changes in Epithelial Cancer. JAMA Oncol. 1, 476–85
228 Hastie, T. et al. (2009) The Elements of Statistical Learning: Data Mining, Inference, and Prediction, Second Edition, Springer Science & Business Media.
229 Hastie, T. et al. (2015) Statistical Learning with Sparsity: The Lasso and Generalizations. Crc DOI: 10.1201/b18401-1
230 Bohlin, J. et al. (2016) Prediction of gestational age based on genome-wide differentially methylated regions. Genome Biol. 17, 207
231 Knight, A.K. et al. (2016) An epigenetic clock for gestational age at birth based on blood methylation data. Genome Biol. 17, 206
232 Joubert, B.R. et al. (2016) DNA Methylation in Newborns and Maternal Smoking in Pregnancy: Genome-wide Consortium Meta-analysis. Am. J. Hum. Genet. 98, 680–696
233 Richmond, R.C. et al. (2018) DNA methylation as a marker for prenatal smoke exposure in adults. Int. J. Epidemiol. 47, 1120–1130
234 Lussier, A.A. et al. (2018) DNA methylation as a predictor of fetal alcohol spectrum disorder. Clin. Epigenetics10, 5
235 Liu, C. et al. (2018) A DNA methylation biomarker of alcohol consumption. Mol. Psychiatry 23, 422–433236 Lee, Y. et al. (2019) Placental epigenetic clocks: estimating gestational age using placental DNA methylation
levels. Aging (Albany. NY). 11, 4238–4253237 Bell, C.C. (1994) DSM-IV: Diagnostic and Statistical Manual of Mental Disorders. JAMA 272, 828–829238 Heatherton, T.F. et al. The Fagerström Test for Nicotine Dependence: A revision of the Fagerström Tolerance
Questionnaire. , British Journal of Addiction, 86. (1991) , Blackwell Publishing, 1119–1127239 Benowitz, N.L. et al. (2009) Prevalence of Smoking Assessed Biochemically in an Urban Public Hospital: A
Rationale for Routine Cotinine Screening. Am. J. Epidemiol. 170, 885–891240 Hsieh, S.J. et al. (2011) Biomarkers increase detection of active smoking and secondhand smoke exposure in
critically ill patients. Crit. Care Med. 39, 40–45241 Philibert, R. et al. (2016) Reversion of AHRR Demethylation Is a Quantitative Biomarker of Smoking Cessation.
Front. Psychiatry 7, 55242 Philibert, R. et al. (2015) A quantitative epigenetic approach for the assessment of cigarette consumption. Front.
Psychol. 6, 656243 Peeters, A. et al. (2003) Obesity in Adulthood and Its Consequences for Life Expectancy: A Life-Table Analysis.
Ann. Intern. Med. 138, 24–32244 Munafò, M.R. et al. (2009) Smoking status and body mass index: A longitudinal study. Nicotine Tob. Res. 11,
765–771245 Kaufman, A. et al. (2012) Unraveling the Relationship between Smoking and Weight: The Role of Sedentary
Behavior. J. Obes. 2012, 11246 Dare, S. et al. (2015) Relationship between smoking and obesity: a cross-sectional study of 499,504 middle-aged
adults in the UK general population. PLoS One 10, e0123579–e0123579247 Mackay, D.F. et al. (2013) Impact of smoking and smoking cessation on overweight and obesity: Scotland-wide,
cross-sectional study on 40,036 participants. BMC Public Health 13, 348248 Piirtola, M. et al. (2018) Association of current and former smoking with body mass index: A study of smoking
discordant twin pairs from 21 twin cohorts. PLoS One 13, e0200140249 Taylor, A.E. et al. (2014) Stratification by smoking status reveals an association of CHRNA5-A3-B4 genotype
with body mass index in never smokers. PLoS Genet. 10, e1004799–e1004799250 Winsløw, U.C. et al. (2015) High tobacco consumption lowers body weight: a Mendelian randomization study of
the Copenhagen General Population Study. Int. J. Epidemiol. 44, 540–550251 Canoy, D. et al. (2005) Cigarette Smoking and Fat Distribution in 21, 828 British Men and Women: A Population-
based Study. Obes. Res. 13, 1466–1475252 Justice, A.E. et al. (2017) Genome-wide meta-analysis of 241,258 adults accounting for smoking behaviour
identifies novel loci for obesity traits. Nat. Commun. DOI: 10.1038/ncomms14977253 Carreras-Torres, R. et al. (2018) Role of obesity in smoking behaviour: Mendelian randomisation study in UK
Biobank. BMJ 361, k1767
88
254 Chiolero, A. et al. (2008) Consequences of smoking for body weight, body fat distribution, and insulin resistance. Am. J. Clin. Nutr. 87, 801–809
255 Filozof, C. et al. (2004) Smoking cessation and weight gain. Obes. Rev. 5, 95–103256 Thorgeirsson, T.E. et al. (2013) A common biological basis of obesity and nicotine addiction. Transl. Psychiatry
3, e308–e308257 Criscitelli, K. and Avena, N.M. (2016) The neurobiological and behavioral overlaps of nicotine and food addiction.
Prev. Med. (Baltim). 92, 82–89258 Volkow, N.D. et al. (2013) Obesity and addiction: neurobiological overlaps. Obes. Rev. 14, 2–18259 Kaprio, J. (2013) The Finnish Twin Cohort Study: an update. Twin Res. Hum. Genet. 16, 157–162260 Kaprio, J. et al. (2019) The Older Finnish Twin Cohort - 45 Years of Follow-up. Twin Res. Hum. Genet. DOI:
10.1017/thg.2019.54261 Kaprio, J. et al. (1978) The Finnish Twin Registry: formation and compilation, questionnaire study, zygosity
determination procedures, and research program. Prog. Clin. Biol. Res. 24 Pt B, 179–184262 Huang, Y. et al. (2018) Genetic and Environmental Effects on Gene Expression Signatures of Blood Pressure: A
Transcriptome-Wide Twin Study. Hypertens. (Dallas, Tex. 1979) 71, 457–464263 Kaprio, J. (2006) Twin studies in Finland 2006. Twin Res. Hum. Genet. 9, 772–777264 Rose, R.J. et al. (2019) FinnTwin12 Cohort: An Updated Review. Twin Res. Hum. Genet. DOI:
10.1017/thg.2019.83265 Naukkarinen, J. et al. (2012) Causes and consequences of obesity: the contribution of recent twin studies. Int. J.
Obes. 36, 1017–1024266 Moayyeri, A. et al. (2013) Cohort Profile: TwinsUK and healthy ageing twin study. Int. J. Epidemiol. 42, 76–85267 Rappou, E. et al. (2016) Weight Loss Is Associated With Increased NAD(+)/SIRT1 Expression But Reduced
PARP Activity in White Adipose Tissue. J. Clin. Endocrinol. Metab. 101, 1263–1273268 Borodulin, K. et al. (2015) Forty-year trends in cardiovascular risk factors in Finland. Eur. J. Public Health 25,
539–546269 Inouye, M. et al. (2010) Metabonomic, transcriptomic, and genomic variation of a population cohort. Mol. Syst.
Biol. 6, 441270 Inouye, M. et al. (2010) An immune response network associated with blood lipid levels. PLoS Genet. 6,
e1001113271 Broms, U. et al. (2012) Diurnal Evening Type is Associated with Current Smoking, Nicotine Dependence and
Nicotine Intake in the Population Based National {FINRISK} 2007 Study. J. Addict. Res. Ther. S2, 272 Prasad, G.L. et al. (2016) A cross-sectional study of biomarkers of exposure and effect in smokers and moist
snuff consumers. Clin. Chem. Lab. Med. 54, 633–642273 Dogan, M. V et al. (2014) The effect of smoking on DNA methylation of peripheral blood mononuclear cells from
African American women. BMC Genomics 15, 151274 Baecke, J.A. et al. (1982) A short questionnaire for the measurement of habitual physical activity in
epidemiological studies. Am. J. Clin. Nutr. 36, 936–942275 Pietrobelli, A. et al. (1996) Dual-energy X-ray absorptiometry body composition model: review of physical
concepts. Am. J. Physiol. 271, E941-51276 Granér, M. et al. (2012) Epicardial fat, cardiac dimensions, and low-grade inflammation in young adult
monozygotic twins discordant for obesity. Am. J. Cardiol. 109, 1295–1302277 Matthews, D.R. et al. (1985) Homeostasis model assessment: insulin resistance and beta-cell function from
fasting plasma glucose and insulin concentrations in man. Diabetologia 28, 412–419278 Matsuda, M. and DeFronzo, R.A. (1999) Insulin sensitivity indices obtained from oral glucose tolerance testing:
comparison with the euglycemic insulin clamp. Diabetes Care 22, 1462–1470279 Yeckel, C.W. et al. (2004) Validation of insulin sensitivity indices from oral glucose tolerance test parameters in
obese children and adolescents. J. Clin. Endocrinol. Metab. 89, 1096–1101280 Pietiläinen, K.H. et al. (2016) DNA methylation and gene expression patterns in adipose tissue differ significantly
within young adult monozygotic BMI-discordant twin pairs. Int. J. Obes. 40, 654–661281 Heinonen, S. et al. (2014) Adipocyte morphology and implications for metabolic derangements in acquired
obesity. Int. J. Obes. 38, 1423–1431282 Wilson, C.L. and Miller, C.J. (2005) Simpleaffy: a BioConductor package for Affymetrix Quality Control and data
analysis. Bioinformatics 21, 3683–3685283 Brettschneider, J. et al. (2008) Quality Assessment for Short Oligonucleotide Microarray Data. Technometrics
50, 241–264284 Irizarry, R.A. et al. (2003) Summaries of Affymetrix GeneChip probe level data. Nucleic Acids Res. 31, e15285 Dai, M. et al. (2005) Evolving gene/transcript definitions significantly alter the interpretation of GeneChip data.
Nucleic Acids Res. 33, e175

89
286 Johnson, W.E. et al. (2007) Adjusting batch effects in microarray expression data using empirical Bayes methods. Biostatistics 8,
287 Naeem, H. et al. (2014) Reducing the risk of false discovery enabling identification of biologically significant genome-wide methylation status using the HumanMethylation450 array. BMC Genomics 15, 51
288 Chen, Y.-A. et al. (2013) Discovery of cross-reactive probes and polymorphic CpGs in the Illumina Infinium HumanMethylation450 microarray. Epigenetics 8, 203–209
289 McCall, M.N. et al. (2010) Frozen robust multiarray analysis (fRMA). Biostatistics 11, 242–253290 (2012) R: A language and environment for statistical computing, R Foundation for Statistical Computing.291 Smyth Gordon, K. (2004) Linear Models and Empirical Bayes Methods for Assessing Differential Expression in
Microarray Experiments. Stat. Appl. Genet. Mol. Biol. 3, 1–25292 Bollepalli, S. et al. (2019) EpiSmokEr: a robust classifier to determine smoking status from DNA methylation data.
Epigenomics 11, 1469–1486293 Friedman, J. et al. (2010) Regularization Paths for Generalized Linear Models via Coordinate Descent. J. Stat.
Softw. 33, 1–22294 Efron, B. and Tibshirani, R. (2007) On testing the significance of sets of genes. Ann. Appl. Stat. 1, 107–129295 Fabregat, A. et al. (2018) The Reactome Pathway Knowledgebase. Nucleic Acids Res. 46, D649–D655296 Efron, B. and Tibshirani, R. (2010) GSA: Gene set analysis. at <http://cran.r-project.org/package=GSA>297 Bollepalli, S. et al. (2018) Subcutaneous adipose tissue gene expression and DNA methylation respond to both
short- and long-term weight loss. Int. J. Obes. 42, 412–423298 Mardinoglu, A. et al. (2015) Extensive weight loss reveals distinct gene expression changes in human
subcutaneous and visceral adipose tissue. Sci. Rep. 5, 14841299 Somekawa, S. et al. (2012) Tmem100, an ALK1 receptor signaling-dependent gene essential for arterial
endothelium differentiation and vascular morphogenesis. Proc. Natl. Acad. Sci. U. S. A. 109, 12064–12069300 Palming, J. et al. (2007) The expression of NAD(P)H:quinone oxidoreductase 1 is high in human adipose tissue,
reduced by weight loss, and correlates with adiposity, insulin sensitivity, and markers of liver dysfunction. J. Clin. Endocrinol. Metab. 92, 2346–2352
301 Magkos, F. et al. (2016) Effects of Moderate and Subsequent Progressive Weight Loss on Metabolic Function and Adipose Tissue Biology in Humans with Obesity. Cell Metab. 23, 591–601
302 Rashid, S. and Genest, J. (2007) Effect of obesity on high-density lipoprotein metabolism. Obesity 15, 2875–2888
303 Gandhi, P.U. et al. (2015) Analysis of BAG3 plasma concentrations in patients with acutely decompensated heart failure. Clin. Chim. Acta 445, 73–78
304 Rosati, A. et al. (2011) BAG3: a multifaceted protein that regulates major cell pathways. Cell Death Dis. 2, e141305 Rizkalla, S.W. et al. (2012) Differential effects of macronutrient content in 2 energy-restricted diets on
cardiovascular risk factors and adipose tissue cell size in moderately obese individuals: a randomized controlled trial. Am. J. Clin. Nutr. 95, 49–63
306 Senol-Cosar, O. et al. (2016) Tenomodulin promotes human adipocyte differentiation and beneficial visceral adipose tissue expansion. Nat. Commun. 7, 10686
307 Arvidsson, E. et al. (2004) Effects of different hypocaloric diets on protein secretion from adipose tissue of obese women. Diabetes 53, 1966–1971
308 Bastard, J.P. et al. (2000) Elevated levels of interleukin 6 are reduced in serum and subcutaneous adipose tissue of obese women after weight loss. J. Clin. Endocrinol. Metab. 85, 3338–3342
309 Aguilera, C.M. et al. (2015) Genome-wide expression in visceral adipose tissue from obese prepubertal children. Int. J. Mol. Sci. 16, 7723–7737
310 Ye, F. et al. (2011) Comparative proteome analysis of 3T3-L1 adipocyte differentiation using iTRAQ-coupled 2DLC-MS/MS. J. Cell. Biochem. 112, 3002–3014
311 Liu, Y. et al. (2013) MicroRNA-140 promotes adipocyte lineage commitment of C3H10T1/2 pluripotent stem cells via targeting osteopetrosis-associated transmembrane protein 1. J. Biol. Chem. 288, 8222–8230
312 Tekpli, X. et al. (2012) DNA methylation of the CYP1A1 enhancer is associated with smoking-induced genetic alterations in human lung. Int. J. Cancer 131, 1509–1516
313 Suter, M. et al. (2011) Maternal tobacco use modestly alters correlated epigenome-wide placental DNA methylation and gene expression. Epigenetics 6, 1284–1294
314 Gutierrez-Arcelus, M. et al. (2013) Passive and active DNA methylation and the interplay with genetic variation in gene regulation. Elife 2, e00523–e00523
315 Jjingo, D. et al. (2012) On the presence and role of human gene-body DNA methylation. Oncotarget; Vol 3, No 4 April 2012 at <http://legacy.oncotarget.com/index.php?journal=oncotarget&>
316 Tsai, P.-C. et al. (2018) Smoking induces coordinated DNA methylation and gene expression changes in adipose tissue with consequences for metabolic health. Clin. Epigenetics 10, 126

90
317 Fontana, L. et al. (2007) Visceral fat adipokine secretion is associated with systemic inflammation in obese humans. Diabetes 56, 1010–1013
318 Glastonbury, C.A. et al. (2019) Cell-Type Heterogeneity in Adipose Tissue Is Associated with Complex Traits and Reveals Disease-Relevant Cell-Specific eQTLs. Am. J. Hum. Genet. 104, 1013–1024
319 Gao, X. et al. (2017) The impact of methylation quantitative trait loci (mQTLs) on active smoking-related DNA methylation changes. Clin. Epigenetics 9, 87
320 Gao, X. et al. (2016) Relationship of tobacco smoking and smoking-related DNA methylation with epigenetic age acceleration. Oncotarget 7, 46878–46889
321 Nwanaji-Enwerem, J.C. et al. (2019) Relationships of Long-Term Smoking and Moist Snuff Consumption With a DNA Methylation Age Relevant Smoking Index: An Analysis in Buccal Cells. Nicotine Tob. Res. 21, 1267–1273
322 Teschendorff, A.E. et al. (2015) Correlation of Smoking-Associated DNA Methylation Changes in Buccal Cells With DNA Methylation Changes in Epithelial Cancer. JAMA Oncol 1, 476–485
323 Relton, C.L. and Davey Smith, G. (2012) Two-step epigenetic Mendelian randomization: a strategy for establishing the causal role of epigenetic processes in pathways to disease. Int. J. Epidemiol. 41, 161–176
324 Hannon, E. et al. (2015) Methylation QTLs in the developing brain and their enrichment in schizophrenia risk loci. Nat. Neurosci. 19, 48–54
325 Gaunt, T.R. et al. (2016) Systematic identification of genetic influences on methylation across the human life course. Genome Biol. 17,
326 Plongthongkum, N. et al. (2014) Advances in the profiling of DNA modifications: cytosine methylation and beyond. Nat. Rev. Genet. 15, 647
327 consortium, T.B. et al. (2016) Quantitative comparison of DNA methylation assays for biomarker development and clinical applications. Nat. Biotechnol. 34, 726
328 Walls, H.L. et al. (2011) Public health campaigns and obesity - a critique. BMC Public Health 11, 136329 Frieden, T.R. et al. (2010) Reducing childhood obesity through policy change: acting now to prevent obesity.
Heal. Aff. 29, 357–363330 Ramos Salas, X. (2015) The ineffectiveness and unintended consequences of the public health war on obesity.
Can. J. Public Heal. 106, e79-81331 Berdasco, M. and Esteller, M. (2019) Clinical epigenetics: seizing opportunities for translation. Nat. Rev. Genet.
20, 109–127332 Stricker, S.H. et al. (2017) From profiles to function in epigenomics. Nat. Rev. Genet. 18, 51–66333 Bultmann, S. and Stricker, S.H. (2019) Entering the post-epigenomic age: back to epigenetics. Open Biol. 8,
180013334 Brocken, D.J.W. et al. (2018) dCas9: A Versatile Tool for Epigenome Editing. Curr. Issues Mol. Biol. 26, 15–32335 Dyke, S.O.M. et al. (2019) Points-to-consider on the return of results in epigenetic research. Genome Med. 11,
31