EPIDEMIOLOGY - · PDF filedisease on the property in the pigs. ... Oedema disease, ......
7
1 VOLUME 6 ISSUE 7 EPIDEMIOLOGY REPORT VETERINARY SERVICES July 2014 Volume 6 Issue 7 CAPS Introducon In January 2014 we launched our CAPS surveillance program (www.elsenburg.com/vetepi/epireport_pdf/January2014.pdf) which targets piggeries (both commercial and non-commercial) and non-commercial poultry farmers. The surveillance program is split into a clinical surveillance program for all farm visits as well as a formal, targeted surveillance program looking to serologically survey a specific number of non-commercial poultry farmers for Avian Influenza (AI). We set targets per magisterial districts for the number of farms that should be registered based on our historical data. We planned to aempt to reach these targets within the year of CAPS starng but this is very dependant on whether the farms sll exist so it more likely that 18 months will be needed before we are close to the accurate registraon of the farms and their categories. Visit report Officials have in total visited and registered 380 farms onto the CAPS database up ll the date of this report. We have 118 pig farms, 170 chicken farms and 92 chicken and pig farms logged - see figure 1 below. The pig farms total about 21% of our target for the year but there are sll 19 areas which have not yet logged a farm. These areas have been idenfied and will be targeted for the following 6 months. The chicken farm visits account for about 25% of our annual target with 12 areas not yet registering a farm. Our formal DAFF avian influenza surveillance program in non commercial properes has merged nicely with the CAPS system. The DAFF target is 50 farms per province per 6 months. Our officials sampled 71 farms in total for this surveillance, so well above the 50 required by DAFF. Results To recap: CAPS surveillance is simplified to answer 2 basic quesons per visit: 1. Has the farmer experienced any significant clinical disease on the property over the past 6 months and sec- ondly does the official noce any clinical disease on the farm that could be as a result of an infecous disease? If the answer is yes to any of these quesons the technician in consultaon with his/ her State vet decides whether to sample/invesgate further. Historical disease events Chicken farms 199 visits were performed and on 193 occasions farmers indicated that they had had no experience of any significant clinical disease on the property within the last 6 months. Four of the 6 events were followed up with sampling. One of the historical events had occurred in the previous year and avian influenza (AI) samples had been taken with negave results in 2013 so no further samples were taken. Another of the 6 historical events did not have samples taken based on a decision of the AHT involved with or without consultaon with his/her State vet. Of the 6 events two were reports of death in chickens with clinical signs that were consistent with Newcastle disease (NCD). Three reports were of chickens that had “just died” with either showing weakness or not showing signs of disease. One report was of a case of confirmed pox in chickens that had been diagnosed at the Stellenbosch Provincial Veterinary Lab (SPVL). Table 1 below lays out the results of follow up invesgaons for this category. Pig farms 166 visits were performed and 163 farmers indicated that they had had no experience of any significant clinical disease on the property within the last 6 months. Of the 3 events two were sll ongoing and are included in the current disease events secon below. The last of the events the farmer had been losing pigs aſter separaon of the sow and introducon to a new feed. The weaners were showing signs of nervous disorder but samples were not taken. Current disease events Chicken farms 199 visits were performed and on 195 occasions the technician indicated that there was no evidence of a suspect infecous disease on the property in the poultry. Of the four occasions were clinical disease was evident samples were taken on 3 occasions as a result of the suspect disease – one disease suspected was a flea infestaon and samples were not taken in this case. 2 of the three sampled clinical events were suspect for NCD/AI and one was suspect for fowl pox. Surveillance Reports - CAPS AND Avian Influenza JDG CAPS ID Diseases tested for Final Diagnosis 114 NCD, AI NCD posive, AI negave 155 Fowl Pox Fowl Pox posive 189 AIV Negave (NCD not tested) 266 AIV, NCD Negave Table 1: CAPS results - Historical events - poultry CAPS ID Diseases tested for Final Diagnosis 25 NCD, AI NCD posive, AI negave 147 Fowl Pox Fowl Pox posive 207 NCD, AIV Negave Table 2: CAPS results - Current events - poultry connued on Page 2
Transcript of EPIDEMIOLOGY - · PDF filedisease on the property in the pigs. ... Oedema disease, ......

1
VOLUME 6 ISSUE 7
EPIDEMIOLOGY
REPORT
VETERINARY SERVICES
July 2014
Volume 6 Issue 7
CAPS Introduction In January 2014 we launched our CAPS surveillance program (www.elsenburg.com/vetepi/epireport_pdf/January2014.pdf) which targets piggeries (both commercial and non-commercial) and non-commercial poultry farmers. The surveillance program is split into a clinical surveillance program for all farm visits as well as a formal, targeted surveillance program looking to serologically survey a specific number of non-commercial poultry farmers for Avian Influenza (AI). We set targets per magisterial districts for the number of farms that should be registered based on our historical data. We planned to attempt to reach these targets within the year of CAPS starting but this is very dependant on whether the farms still exist so it more likely that 18 months will be needed before we are close to the accurate registration of the farms and their categories.
Visit report Officials have in total visited and registered 380 farms onto the CAPS database up till the date of this report. We have 118 pig farms, 170 chicken farms and 92 chicken and pig farms logged - see figure 1 below. The pig farms total about 21% of our target for the year but there are still 19 areas which have not yet logged a farm. These areas have been identified and will be targeted for the following 6 months. The chicken farm visits account for about 25% of our annual target with 12 areas not yet registering a farm. Our formal DAFF avian influenza surveillance program in non commercial properties has merged nicely with the CAPS system. The DAFF target is 50 farms per province per 6 months. Our officials sampled 71 farms in total for this surveillance, so well above the 50 required by DAFF.
Results To recap: CAPS surveillance is simplified to answer 2 basic questions per visit: 1. Has the farmer experienced any significant clinical disease on the property over the past 6 months and sec-ondly does the official notice any clinical disease on the farm that could be as a result of an infectious disease? If the answer is yes to any of these questions the technician in consultation with his/her State vet decides whether to sample/investigate further.
Historical disease events Chicken farms 199 visits were performed and on 193 occasions farmers indicated that they had had no experience of any significant clinical disease on the property within the last 6 months. Four of the 6 events were followed up with sampling. One of the historical events had occurred in the previous year and avian influenza (AI) samples had been taken with negative results in 2013 so no further samples were taken. Another of the 6
historical events did not have samples taken based on a decision of the AHT involved with or without consultation with his/her State vet. Of the 6 events two were reports of death in chickens with clinical signs that were consistent with Newcastle disease (NCD). Three reports were of chickens that had “just died” with either showing weakness or not showing signs of disease. One report was of a case of confirmed pox in chickens that had been diagnosed at the Stellenbosch Provincial Veterinary Lab (SPVL). Table 1 below lays out the results of follow up investigations for this category.
Pig farms 166 visits were performed and 163 farmers indicated that they had had no experience of any significant clinical disease on the property within the last 6 months. Of the 3 events two were still ongoing and are included in the current disease events section below. The last of the events the farmer had been losing pigs after separation of the sow and introduction to a new feed. The weaners were showing signs of nervous disorder but samples were not taken.
Current disease events
Chicken farms 199 visits were performed and on 195 occasions the technician indicated that there was no evidence of a suspect infectious disease on the property in the poultry. Of the four occasions were clinical disease was evident samples were taken on 3 occasions as a result of the suspect disease – one disease suspected was a flea infestation and samples were not taken in this case. 2 of the three sampled clinical events were suspect for NCD/AI and one was suspect for fowl pox.
Surveillance Reports - CAPS AND Avian Influenza JDG
CAPS ID
Diseases tested for
Final Diagnosis
114 NCD, AI NCD positive, AI negative
155 Fowl Pox Fowl Pox positive
189 AIV Negative (NCD not tested)
266 AIV, NCD Negative
Table 1: CAPS results - Historical events - poultry
CAPS ID
Diseases tested for
Final Diagnosis
25 NCD, AI NCD positive, AI negative
147 Fowl Pox Fowl Pox positive
207 NCD, AIV Negative
Table
2: C
AP
S resu
lts - Cu
rren
t e
ven
ts - po
ultry
continued on Page 2

2
VOLUME 6 ISSUE 7
Pig farms 166 visits were performed and on 158 occasions the technician indicated that there was no evidence of a suspect infectious disease on the property in the pigs.
Of the 8 events two were NOT sampled as sarcoptic mange and mastitis were diagnosed by the technician. Of the 6 remaining events all were sampled as a result of undiagnosed death/illness.
DAFF Avian Influenza Surveillance - Non Commercial Poultry For the first six months of the year 1269 serum samples were taken in the DAFF NAI (notifiable AI) surveillance program from 71 non-commercial chicken farms. Fourteen farms in total returned results that were positive on AI ELISA (36 positive samples in total) but no cases were H5 or H7 HI tests positive (a total of 59 unique HN HI combinations were tested from the 39 positive ELISA samples). With the poultry blood there is often not enough blood to perform H6 HI testing and in these 6
months no H6 HI was tested against for this reason. Figure 1 shows the location of the farms logged on the CAPS database as well as the 71 locations where we took samples for the formal DAFF AI surveillance program and then the places where ELISA positive results (with negative HI) were identified.
OTHER AVIAN INFLUENZA SURVEILLANCE Introduction As discussed in previous reports the avian influenza surveillance within the Province is targeted at 3 major sectors - commercial poultry, non commercial (backyard) poultry and ostriches. We have discussed before the significant numbers of samples tested in the ostrich sector compared to the other two (January 2014 report) and the first 6 months of the year was no different. The non commercial surveillance has been discussed under the CAPS section.
Commercial poultry The commercial poultry totals are not 100% accurate as we use data from the Stellenbosch Provincial Veterinary lab (SPVL) and there are producers that test at other institutions. We have received some data from private sources that do testing but this is aggregated data and thus only totals are available (no geographic or farm level data). The SPVL data we have showed 113 sampling events from all commercial farms totalling 3314 samples that were all tested using an ELISA test. A total of 41 ELISA tests were positive - all with negative HI results. The private lab data as mentioned is aggregated and at the time of writing the positive ELISA count was unknown although all results were HI negative as positive HI results are reported to the regional State Vet and we have not had reports during this period. The private lab tested 5023 samples using the ELISA during the 6 month period. In total therefore 8337 samples were tested from commercial flocks for AI with no confirmed AI outbreaks.
Ostrich sector We have a close to 100% accurate ostrich sector surveillance as we capture this information for our use
throughout the year. Figure 2 shows where surveillance was performed and a
total of 284 unique farms were sampled over the 6 month period. A total of 32 035 samples were taken with the majority being serum (n=27 997) and the remainder being tracheal swabs. Surveillance is performed for a num-ber of reasons with samples for movement (137 farms, 12395 samples) and pre slaughter (138 farms, 9164 samples) making
up the majority of samples tested for AI. Other high frequency sampling is through the formal 6
monthly AI surveillance program performed by
SUREVILLANCE REPORTS - CAPS AND AVIAN INFLUENZA
CAPS ID
Diseases tested for
Final Diagnosis
271 PRRS Negative
52 CSF, PRRS Negative
71 PM Post weaning E. coli enteritis
77 PM Oedema disease
92 PM Multiple possibilities: Mycotoxicosis, OPP, Cocklebur poisoning, Oedema disease, A. hydrophilia infection
148 PM Intussusception
Table 3: CAPS results - Current events - pigs
Figure 1: CAPS visits and DAFF NAI surveillance
continued on Page 3
3
VOLUME 6 ISSUE 7
SUREVILLANCE REPORTS - CAPS AND AVIAN INFLUENZA
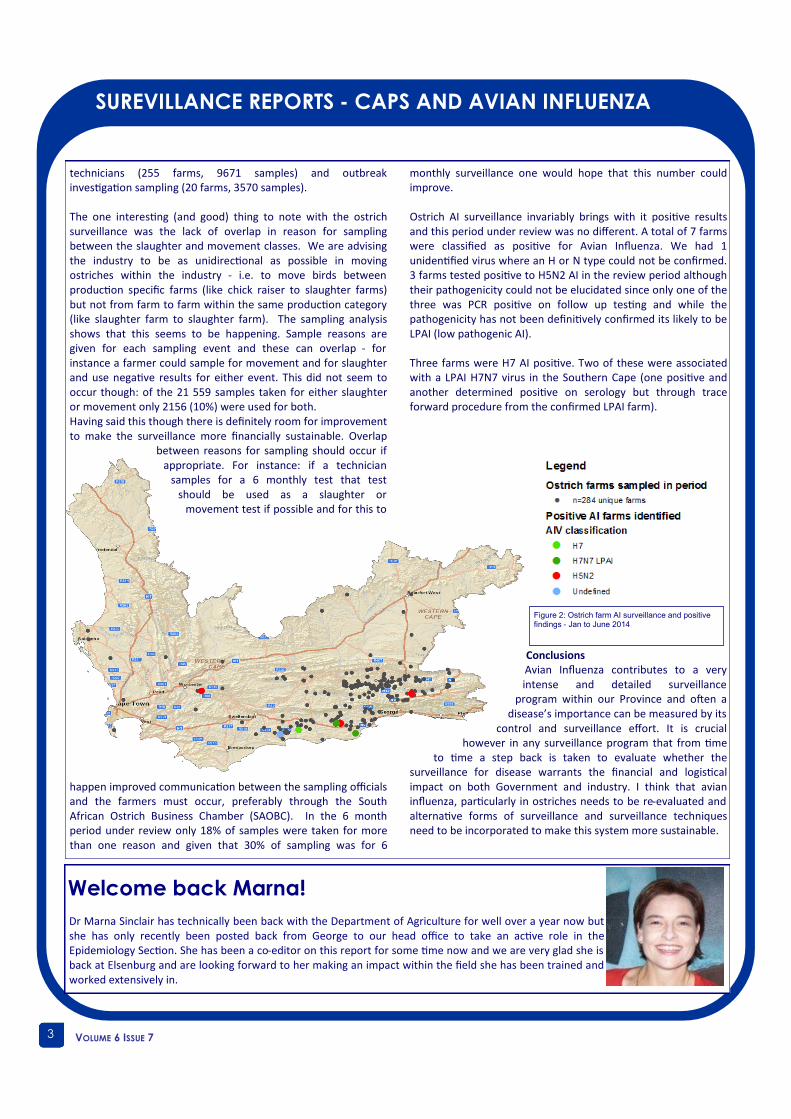
technicians (255 farms, 9671 samples) and outbreak investigation sampling (20 farms, 3570 samples). The one interesting (and good) thing to note with the ostrich surveillance was the lack of overlap in reason for sampling between the slaughter and movement classes. We are advising the industry to be as unidirectional as possible in moving ostriches within the industry - i.e. to move birds between production specific farms (like chick raiser to slaughter farms) but not from farm to farm within the same production category (like slaughter farm to slaughter farm). The sampling analysis shows that this seems to be happening. Sample reasons are given for each sampling event and these can overlap - for instance a farmer could sample for movement and for slaughter and use negative results for either event. This did not seem to occur though: of the 21 559 samples taken for either slaughter or movement only 2156 (10%) were used for both. Having said this though there is definitely room for improvement to make the surveillance more financially sustainable. Overlap
between reasons for sampling should occur if appropriate. For instance: if a technician
samples for a 6 monthly test that test should be used as a slaughter or
movement test if possible and for this to
happen improved communication between the sampling officials and the farmers must occur, preferably through the South African Ostrich Business Chamber (SAOBC). In the 6 month period under review only 18% of samples were taken for more than one reason and given that 30% of sampling was for 6
monthly surveillance one would hope that this number could improve. Ostrich AI surveillance invariably brings with it positive results and this period under review was no different. A total of 7 farms were classified as positive for Avian Influenza. We had 1 unidentified virus where an H or N type could not be confirmed. 3 farms tested positive to H5N2 AI in the review period although their pathogenicity could not be elucidated since only one of the three was PCR positive on follow up testing and while the pathogenicity has not been definitively confirmed its likely to be LPAI (low pathogenic AI). Three farms were H7 AI positive. Two of these were associated with a LPAI H7N7 virus in the Southern Cape (one positive and another determined positive on serology but through trace forward procedure from the confirmed LPAI farm).
Conclusions Avian Influenza contributes to a very intense and detailed surveillance
program within our Province and often a disease’s importance can be measured by its
control and surveillance effort. It is crucial however in any surveillance program that from time
to time a step back is taken to evaluate whether the surveillance for disease warrants the financial and logistical impact on both Government and industry. I think that avian influenza, particularly in ostriches needs to be re-evaluated and alternative forms of surveillance and surveillance techniques need to be incorporated to make this system more sustainable.
Figure 2: Ostrich farm AI surveillance and positive findings - Jan to June 2014
Dr Marna Sinclair has technically been back with the Department of Agriculture for well over a year now but she has only recently been posted back from George to our head office to take an active role in the Epidemiology Section. She has been a co-editor on this report for some time now and we are very glad she is back at Elsenburg and are looking forward to her making an impact within the field she has been trained and worked extensively in.
Welcome back Marna!
4
VOLUME 6 ISSUE 7
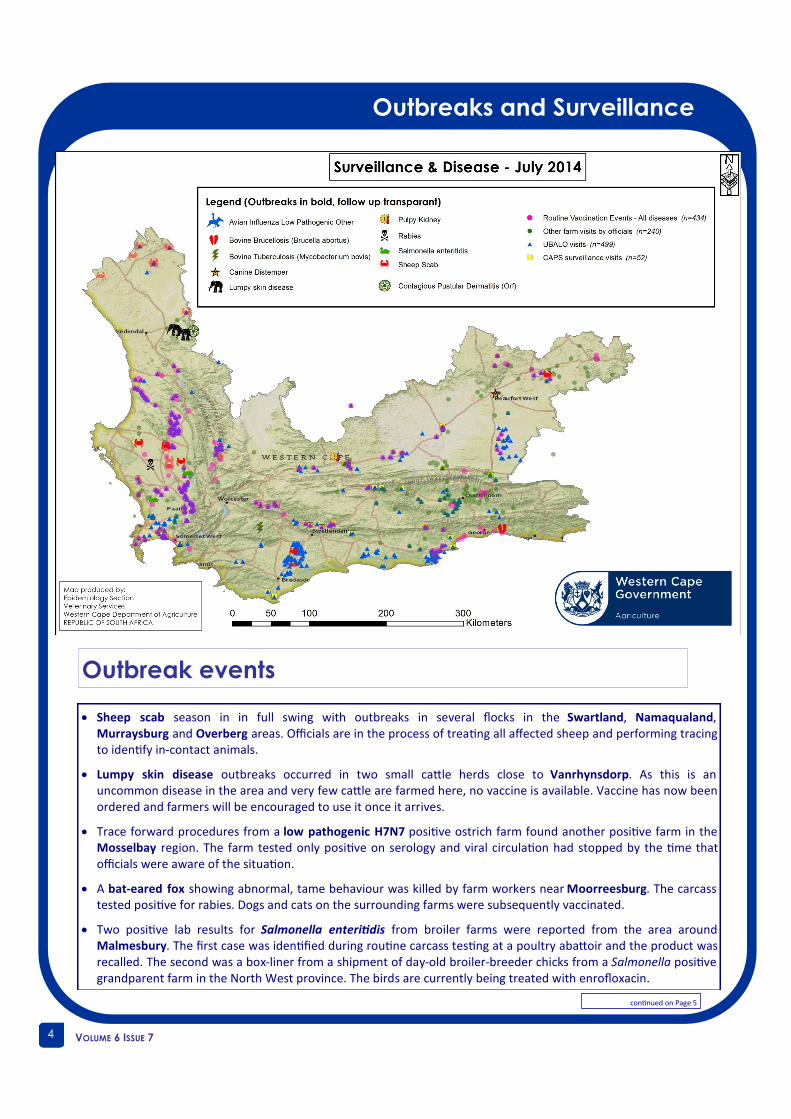
Outbreaks and Surveillance
Sheep scab season in in full swing with outbreaks in several flocks in the Swartland, Namaqualand, Murraysburg and Overberg areas. Officials are in the process of treating all affected sheep and performing tracing to identify in-contact animals.
Lumpy skin disease outbreaks occurred in two small cattle herds close to Vanrhynsdorp. As this is an uncommon disease in the area and very few cattle are farmed here, no vaccine is available. Vaccine has now been ordered and farmers will be encouraged to use it once it arrives.
Trace forward procedures from a low pathogenic H7N7 positive ostrich farm found another positive farm in the Mosselbay region. The farm tested only positive on serology and viral circulation had stopped by the time that officials were aware of the situation.
A bat-eared fox showing abnormal, tame behaviour was killed by farm workers near Moorreesburg. The carcass tested positive for rabies. Dogs and cats on the surrounding farms were subsequently vaccinated.
Two positive lab results for Salmonella enteritidis from broiler farms were reported from the area around Malmesbury. The first case was identified during routine carcass testing at a poultry abattoir and the product was recalled. The second was a box-liner from a shipment of day-old broiler-breeder chicks from a Salmonella positive grandparent farm in the North West province. The birds are currently being treated with enrofloxacin.
Outbreak events
continued on Page 5
5
VOLUME 6 ISSUE 7
The back page
Disclaimer: This report is published on a monthly basis for the
purpose of providing up-to-date information regarding
epidemiology of animal diseases in the Western Cape Province.
Much of the information is therefore preliminary and should not
be cited/utilised for publication
Web based event logging AHT leader boards
Total OIE logs Most rabies vaccinations performed
Epidemiology Report
Edited by:
J D Grewar [email protected]
L van Helden [email protected]
M Sinclair [email protected]
VOLUME 6 ISSUE 7
Total UBALO logs
Trace-forward from a Brucella abortus positive farm near Clanwilliam (identified in April 2014) resulted in the discovery of another positive cattle farm which had bought in cattle in 2012 and 2013. The farm has been quarantined and positive cows will be slaughtered, but the situation is worrying, as there are potentially more infected herds that have not yet been identified.
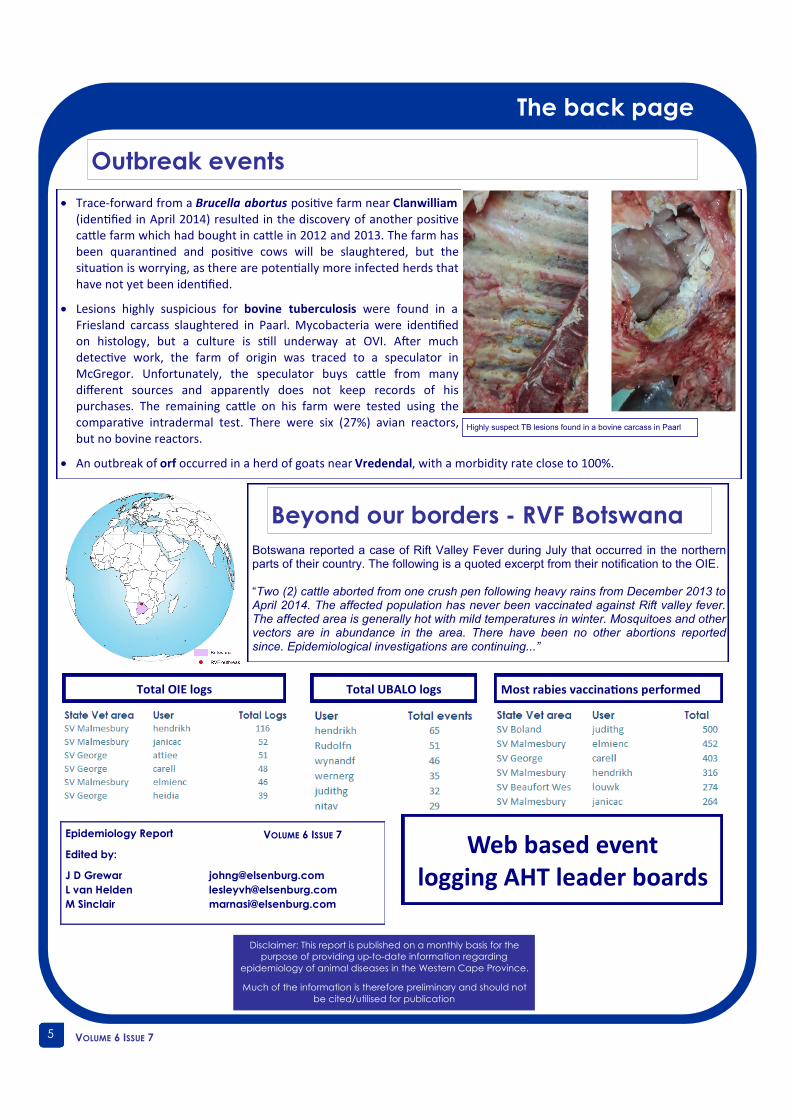
Lesions highly suspicious for bovine tuberculosis were found in a Friesland carcass slaughtered in Paarl. Mycobacteria were identified on histology, but a culture is still underway at OVI. After much detective work, the farm of origin was traced to a speculator in McGregor. Unfortunately, the speculator buys cattle from many different sources and apparently does not keep records of his purchases. The remaining cattle on his farm were tested using the comparative intradermal test. There were six (27%) avian reactors, but no bovine reactors.
An outbreak of orf occurred in a herd of goats near Vredendal, with a morbidity rate close to 100%.
Highly suspect TB lesions found in a bovine carcass in Paarl
Outbreak events
Botswana reported a case of Rift Valley Fever during July that occurred in the northern parts of their country. The following is a quoted excerpt from their notification to the OIE. “Two (2) cattle aborted from one crush pen following heavy rains from December 2013 to April 2014. The affected population has never been vaccinated against Rift valley fever. The affected area is generally hot with mild temperatures in winter. Mosquitoes and other vectors are in abundance in the area. There have been no other abortions reported since. Epidemiological investigations are continuing...”
Beyond our borders - RVF Botswana
6
VOLUME 6 ISSUE 7
Back Page Epi Lab
In this back page lab we are going to do something a little different, using an R package with a graphic user
interface (GUI). For the majority of this approach, we do not have to type code into the R console, but can work with a user-friendly “calculator” developed by the authors of the package. The package “FFD” is designed for designing two-stage freedom from disease surveys. In this example, we are going to work with the hypothetical situation that an outbreak of PRRS has occurred in the Western Cape. After controlling the outbreak, we want to make sure that the disease has been eradicated from the province by means of a survey to show freedom from disease in the pig population.
Freedom from disease survey
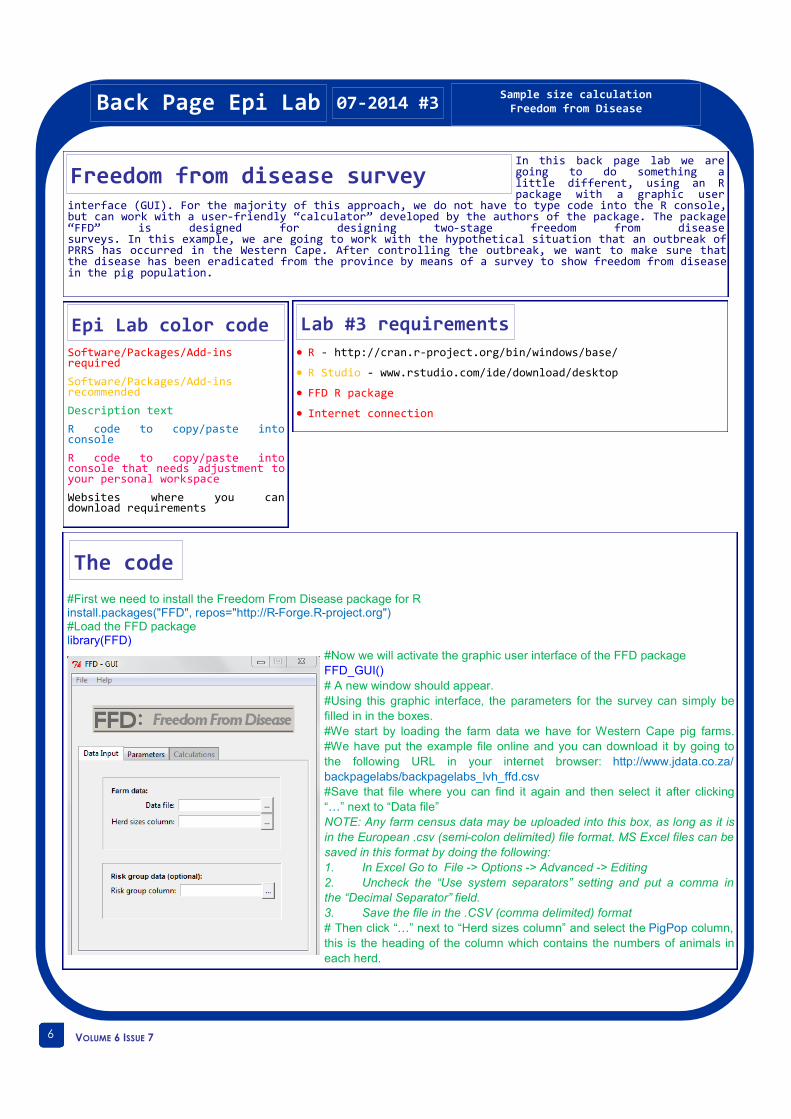
#First we need to install the Freedom From Disease package for R install.packages("FFD", repos="http://R-Forge.R-project.org") #Load the FFD package library(FFD)
#Now we will activate the graphic user interface of the FFD package
FFD_GUI()
# A new window should appear.
#Using this graphic interface, the parameters for the survey can simply be
filled in in the boxes.
#We start by loading the farm data we have for Western Cape pig farms.
#We have put the example file online and you can download it by going to
the following URL in your internet browser: http://www.jdata.co.za/
backpagelabs/backpagelabs_lvh_ffd.csv
#Save that file where you can find it again and then select it after clicking
“…” next to “Data file”
NOTE: Any farm census data may be uploaded into this box, as long as it is
in the European .csv (semi-colon delimited) file format. MS Excel files can be
saved in this format by doing the following:
1. In Excel Go to File -> Options -> Advanced -> Editing
2. Uncheck the “Use system separators” setting and put a comma in
the “Decimal Separator” field.
3. Save the file in the .CSV (comma delimited) format
# Then click “…” next to “Herd sizes column” and select the PigPop column,
this is the heading of the column which contains the numbers of animals in
each herd.
The code
07-2014 #3 Sample size calculation Freedom from Disease
R - http://cran.r-project.org/bin/windows/base/
R Studio - www.rstudio.com/ide/download/desktop
FFD R package
Internet connection
Lab #3 requirements
Software/Packages/Add-ins required
Software/Packages/Add-ins recommended
Description text
R code to copy/paste into console
R code to copy/paste into console that needs adjustment to your personal workspace
Websites where you can download requirements
Epi Lab color code

7
VOLUME 6 ISSUE 7
The output
Bautista, E.M., Morrison, R.B., Goyal, S.M., Collins, J.E.& Annelli, J.F. (1993) Seroprevalnce of PRRS virus in the United States. Swine Health and Production, November and December, 4-8. Kopacka, I. (2013). FFD: Package to substantiate freedom from disease in R using two-stage sampling. R package version 1.0-2.http://ffd.r-forge.r-project.org/
OIE (2008) Report of the OIE ad hoc group on porcine reproductive respiratory syndrome (Appendices IV and V). http://www.oie.int/fileadmin/Home/eng/Our_scientific_expertise/docs/pdf/PRRS_guide_web_bulletin.pdf R Core Team (2014). R: A language and environment for statistical computing. R Foundation for Statistical Computing, Vienna, Austria. URL http://www.R-project.org/
References
Back Page Epi Lab 07-2014 #3 Sample size calculation Freedom from Disease
#Now click on the Parameters tab and fill in the following values:
Design prevalence: 1% (aka between-herd prevalence: the minimum
expected prevalence of positive herds, as recommended by the OIE for
PRRS)
Intraherd prevalence: 10% (aka within herd prevalence: the minimum
prevalence of diseased animals we expect to find in a PRRS-positive herd)
Test sensitivity: 98.8% (Using the IDEXX PRRS X3 Ab test)
Type I error level: 0.05 (meaning we are 95% confident that there is
freedom from disease if the result of the survey is negative)
Sampling strategy: individual sampling (as opposed to limited sampling where
we limit ourselves to a specific number of animals to sample per herd)
#Now click on the calculations tab and fill in 95% in the “Herd Sensitivity” box
under “Compute sample size”. We have chosen a high herd sensitivity
because the high sensitivity of the diagnostic test implies that there is a low
chance that a positive herd will not be detected positive in the survey. That
means that for each herd that is being tested we say we have a 95% chance
of finding the disease (=confidence level). There are more
sophisticated methods of calculating herd sensitivity, but for simplification of
this example we are using an estimated value.
#Click Calculate
A new window will appear with your required sampling parameters. At the
bottom of the output window, you will find the following result (see left -below):
Here we are given a sampling strategy using the parameters we entered. 288 randomly selected herds in the province should be sampled. Within each herd, the lookup table can be used to determine how many individual samples should be taken from each herd based on herd size. To get a list of farms to sample that is randomly selected you can click on the “Sample” button. A small box with a sampling strategy of “fixed” or “dynamic” comes up. We want to sample exact number of herds required (288 in this case) so we select fixed and then click on “Sample” (the “Seed” refers to the random number generator - don’t worry about it)- you are prompted to save your file showing which farms to sample and the number of pigs present on each farm. You can then use the lookup table as discussed above to choose the number of animals to sample per farm. This tool has several other functions available, including risk-based sampling plans and calculations of the cost of the survey. We would like to encourage you to explore these other possibilities using your own data, and let us know how you manage.