Epidemiology Kept Simple
28
Epidemiology Epidemiology Kept Simple Kept Simple Chapter 7 Chapter 7 Rate Adjustment Rate Adjustment
description
Epidemiology Kept Simple. Chapter 7 Rate Adjustment. Goal. To reduce distortions and incomparability of rates when making comparison over time and among populations To encourage “like-to-like” comparisons. Illustrative Example Table 7.2 (p. 144). - PowerPoint PPT Presentation
Transcript of Epidemiology Kept Simple

Epidemiology Epidemiology Kept SimpleKept Simple
Chapter 7Chapter 7
Rate AdjustmentRate Adjustment
GoalGoal
To reduce distortions and To reduce distortions and incomparability of rates when incomparability of rates when
making comparison over time and making comparison over time and among populationsamong populations
To encourage “like-to-like” To encourage “like-to-like” comparisonscomparisons
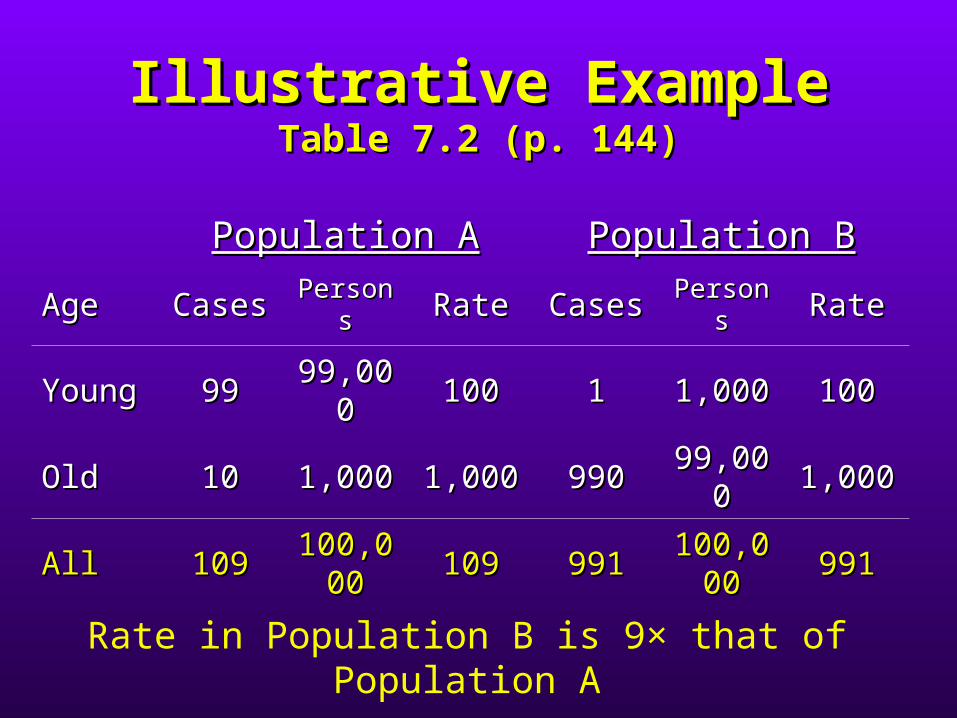
Illustrative ExampleIllustrative ExampleTable 7.2 (p. 144)Table 7.2 (p. 144)
Population APopulation A Population BPopulation B
AgeAge CasesCases PersonsPersons RateRate CasesCases PersonsPersons RateRate
YoungYoung 9999 99,0099,0000
100100 11 1,0001,000 100100
OldOld 1010 1,0001,000 1,0001,000 990990 99,0099,0000
1,0001,000
AllAll 109109 100,0100,00000 109109 991991 100,0100,0
0000 991991
Rate in Population B is 9× that of Population A
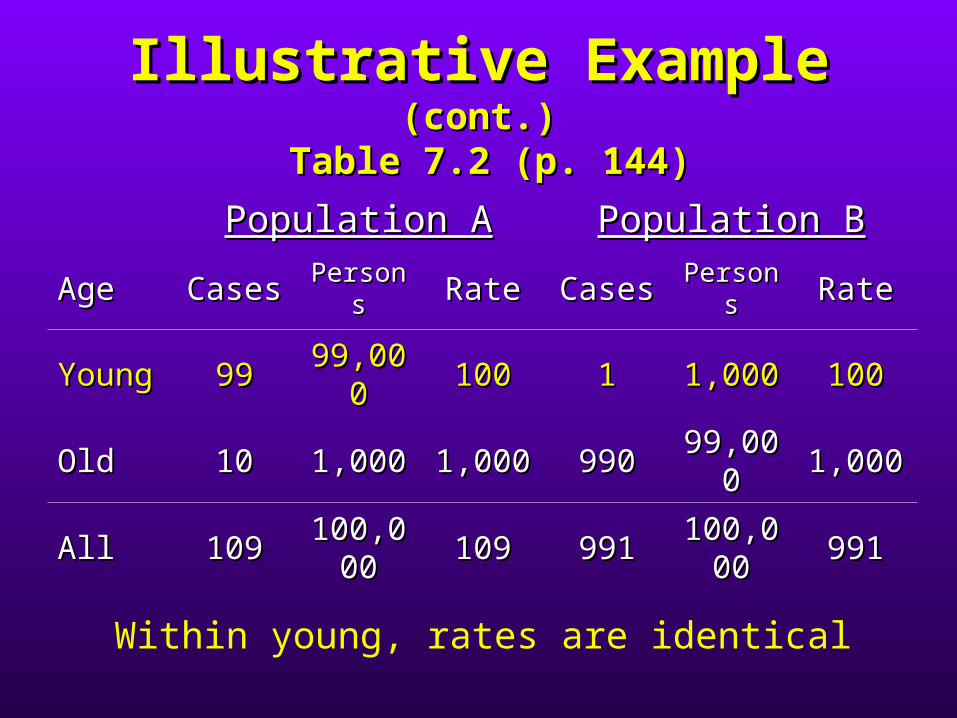
Illustrative Example Illustrative Example (cont.)(cont.)
Table 7.2 (p. 144) Table 7.2 (p. 144)
Population APopulation A Population BPopulation B
AgeAge CasesCases PersonsPersons RateRate CasesCases PersonsPersons RateRate
YoungYoung 9999 99,0099,0000
100100 11 1,0001,000 100100
OldOld 1010 1,0001,000 1,0001,000 990990 99,0099,0000
1,0001,000
AllAll 109109 100,0100,00000 109109 991991 100,0100,0
0000 991991
Within young, rates are identical
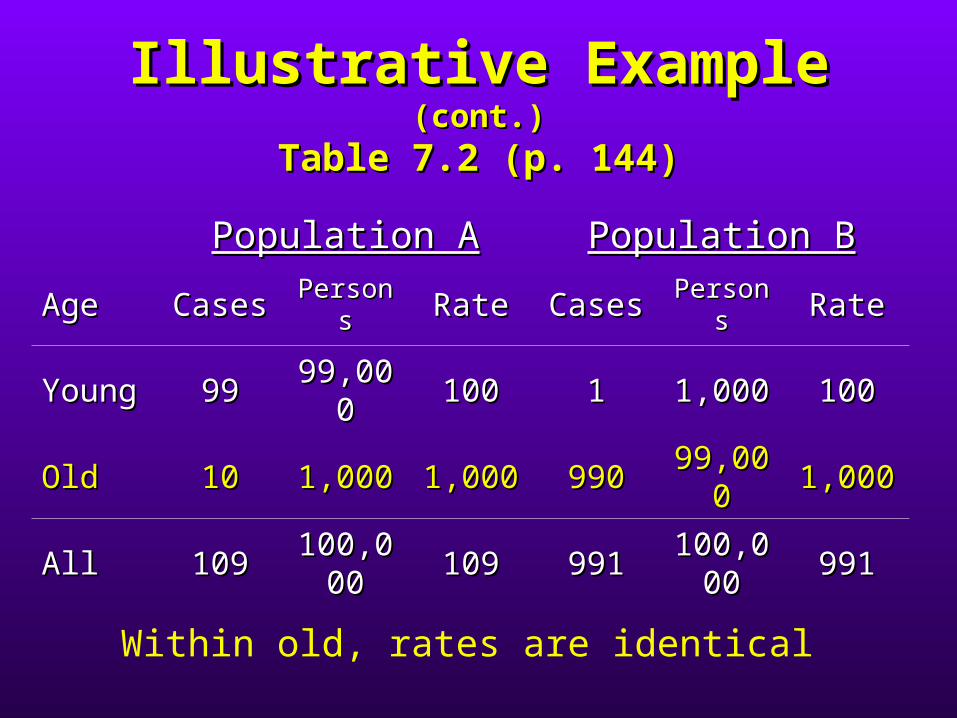
Illustrative Example Illustrative Example (cont.)(cont.)
Table 7.2 (p. 144)Table 7.2 (p. 144)
Population APopulation A Population BPopulation B
AgeAge CasesCases PersonsPersons RateRate CasesCases PersonsPersons RateRate
YoungYoung 9999 99,0099,0000
100100 11 1,0001,000 100100
OldOld 1010 1,0001,000 1,0001,000 990990 99,0099,0000
1,0001,000
AllAll 109109 100,0100,00000 109109 991991 100,0100,0
0000 991991
Within old, rates are identical
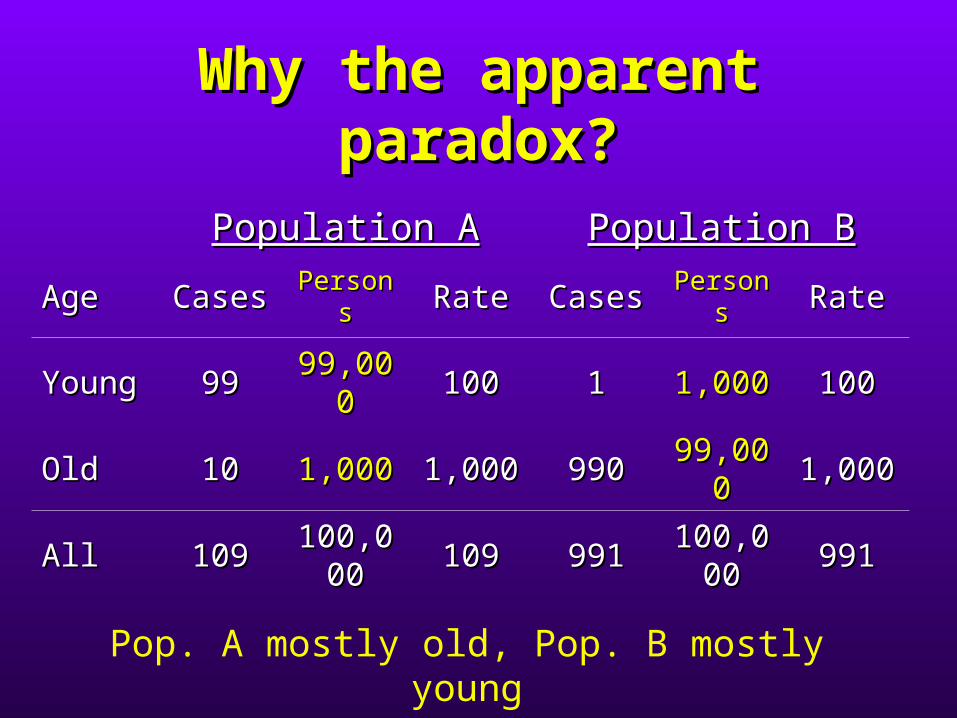
Why the apparent Why the apparent paradox?paradox?
Population APopulation A Population BPopulation B
AgeAge CasesCases PersonsPersons RateRate CasesCases PersonsPersons RateRate
YoungYoung 9999 99,0099,0000
100100 11 1,0001,000 100100
OldOld 1010 1,0001,000 1,0001,000 990990 99,0099,0000
1,0001,000
AllAll 109109 100,0100,00000 109109 991991 100,0100,0
0000 991991
Pop. A mostly old, Pop. B mostly young
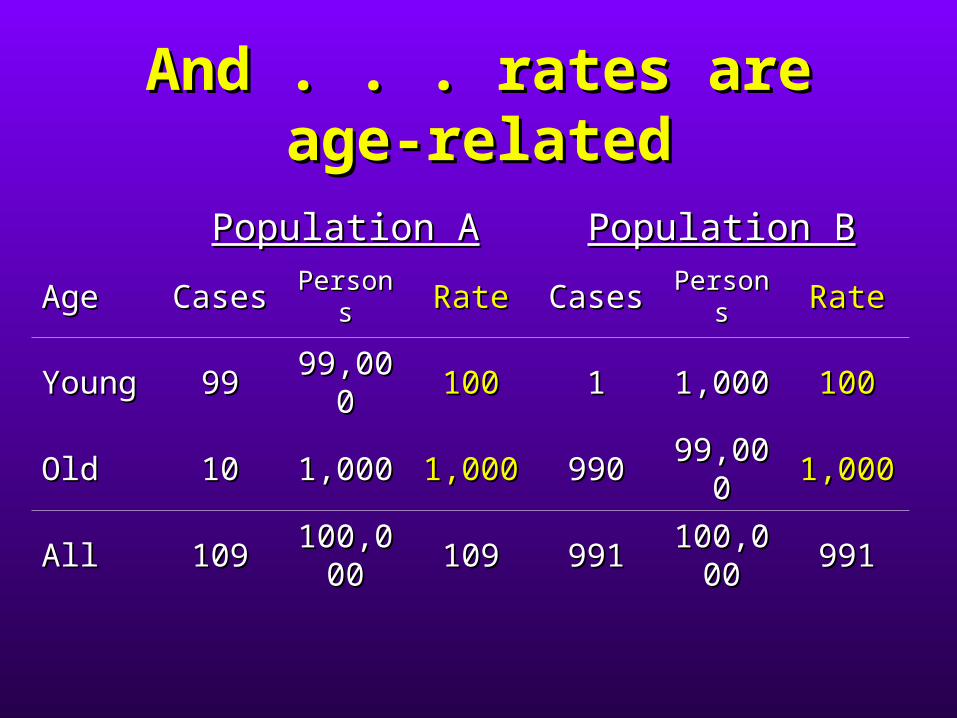
And . . . rates are age-And . . . rates are age-relatedrelated
Population APopulation A Population BPopulation B
AgeAge CasesCases PersonsPersons RateRate CasesCases PersonsPersons RateRate
YoungYoung 9999 99,0099,0000
100100 11 1,0001,000 100100
OldOld 1010 1,0001,000 1,0001,000 990990 99,0099,0000
1,0001,000
AllAll 109109 100,0100,00000 109109 991991 100,0100,0
0000 991991
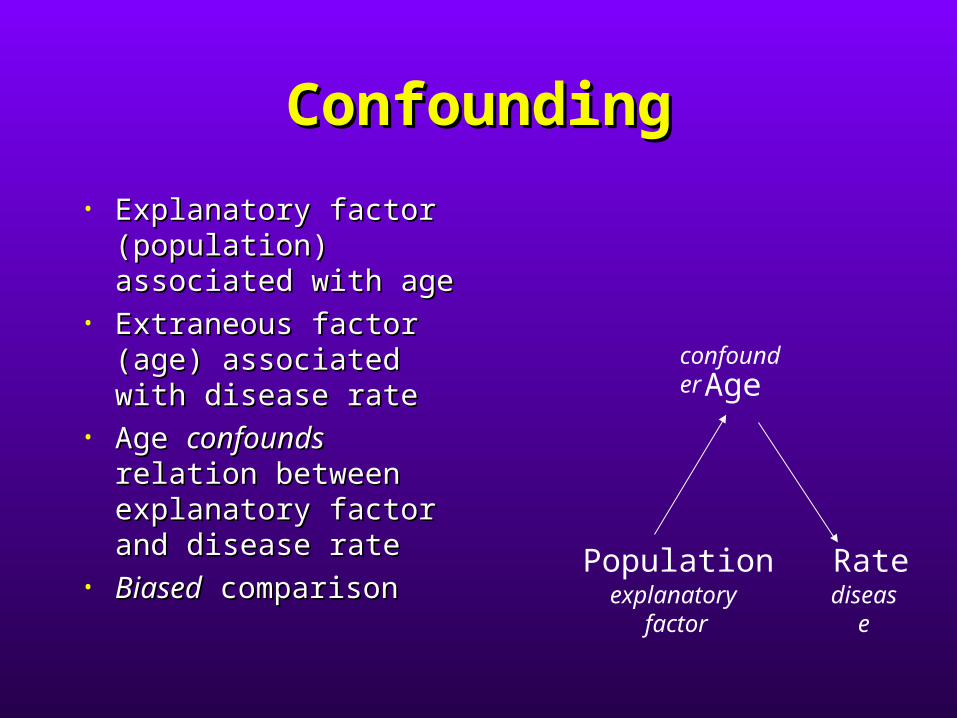
ConfoundingConfounding
• Explanatory factor Explanatory factor (population) (population) associated with ageassociated with age
• Extraneous factor Extraneous factor (age) associated with (age) associated with disease ratedisease rate
• Age Age confoundsconfounds relation between relation between explanatory factor explanatory factor and disease rateand disease rate
• BiasedBiased comparison comparison
Age
Population Rate
confounder
explanatory factor
disease
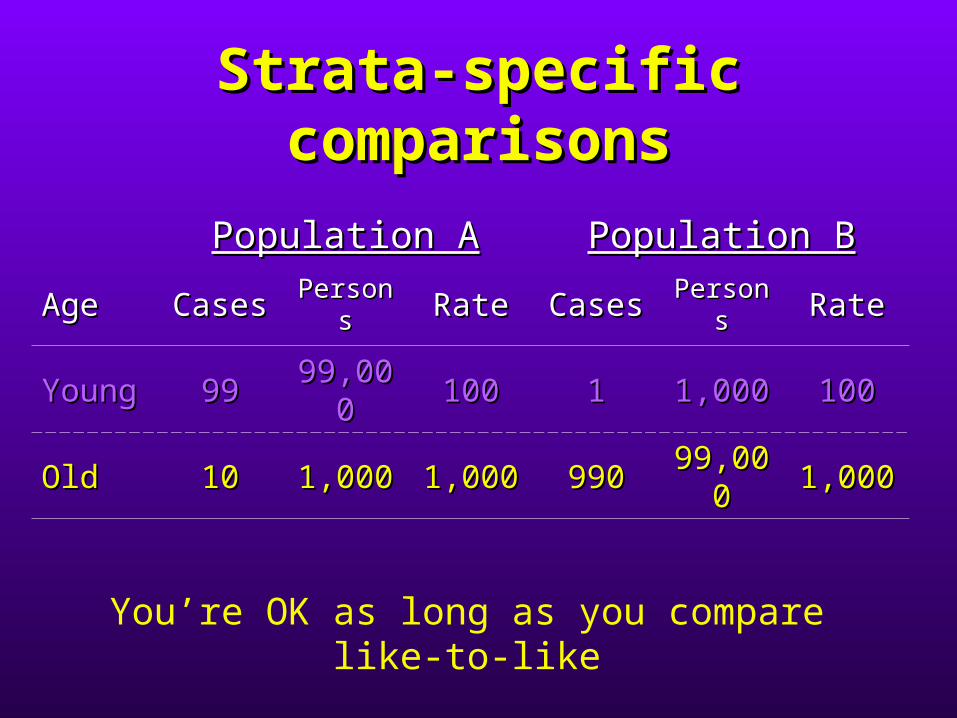
Strata-specific Strata-specific comparisonscomparisons
Population APopulation A Population BPopulation B
AgeAge CasesCases PersonsPersons RateRate CasesCases PersonsPersons RateRate
YoungYoung 9999 99,0099,0000
100100 11 1,0001,000 100100
OldOld 1010 1,0001,000 1,0001,000 990990 99,0099,0000
1,0001,000
You’re OK as long as you compare like-to-like
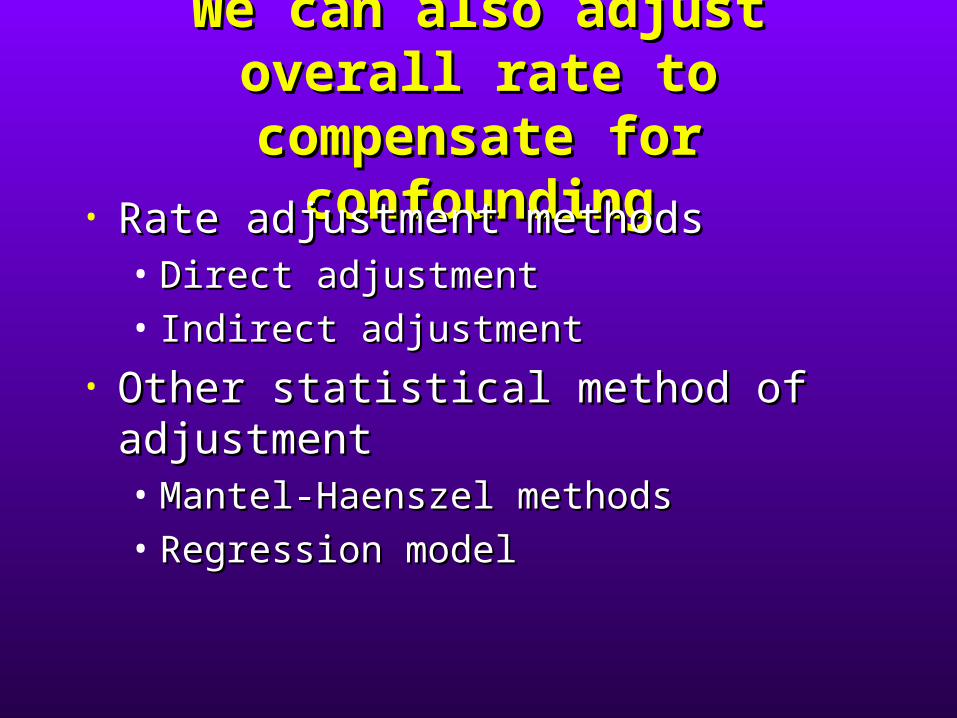
We can also adjust overall We can also adjust overall rate to compensate for rate to compensate for
confoundingconfounding• Rate adjustment methodsRate adjustment methods
• Direct adjustmentDirect adjustment• Indirect adjustmentIndirect adjustment
• Other statistical method of Other statistical method of adjustmentadjustment• Mantel-Haenszel methods Mantel-Haenszel methods • Regression modelRegression model
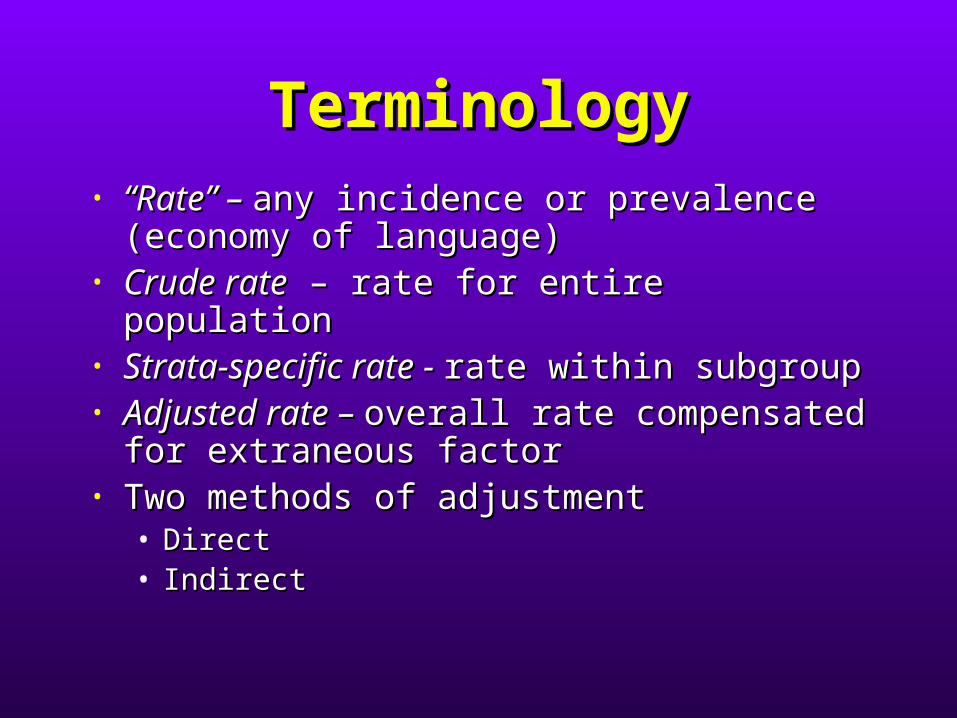
TerminologyTerminology• ““Rate” – Rate” – any incidence or prevalence any incidence or prevalence
(economy of language)(economy of language)• Crude rateCrude rate – rate for entire population – rate for entire population • Strata-specific rate - Strata-specific rate - rate within rate within
subgroupsubgroup• Adjusted rate – Adjusted rate – overall rate compensated overall rate compensated
for extraneous factor for extraneous factor • Two methods of adjustmentTwo methods of adjustment
• DirectDirect• IndirectIndirect
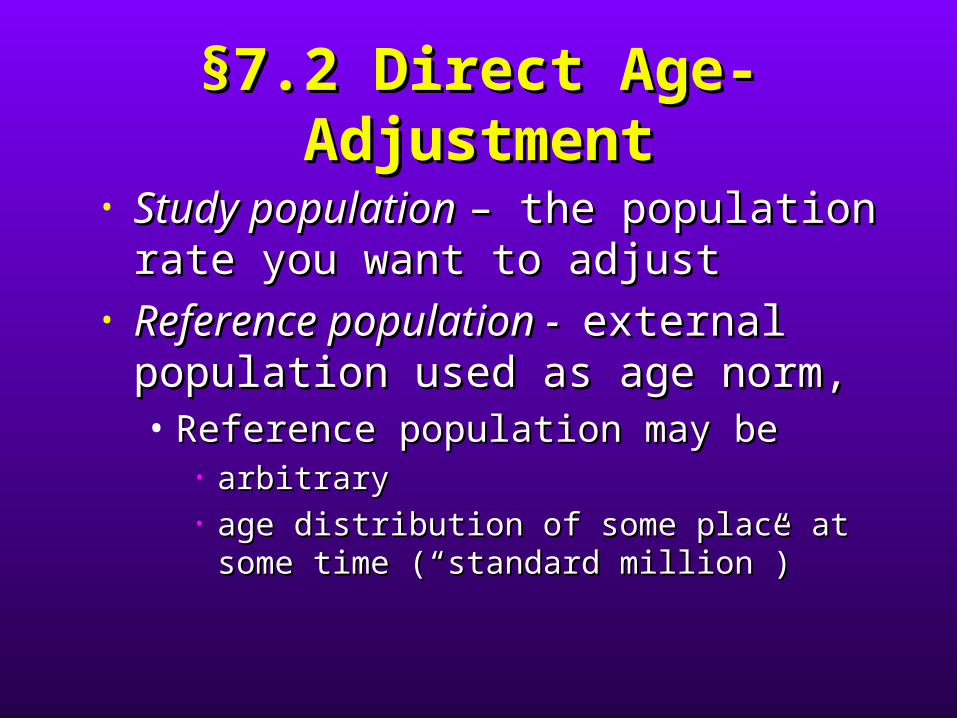
§7.2 Direct Age-§7.2 Direct Age-AdjustmentAdjustment
• Study population Study population – the population – the population rate you want to adjustrate you want to adjust
• Reference population - Reference population - external external population used as age norm, population used as age norm, • Reference population may beReference population may be
• arbitrary arbitrary • age distribution of some place at some age distribution of some place at some
time (“standard million”) time (“standard million”)
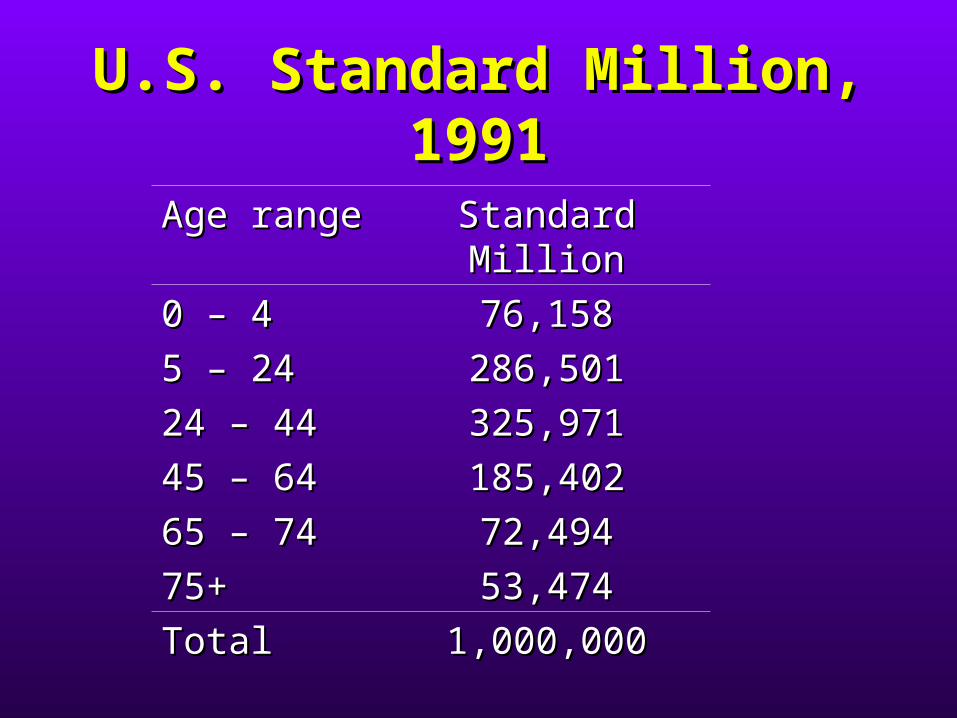
U.S. Standard Million, U.S. Standard Million, 19911991
Age rangeAge range Standard MillionStandard Million
0 – 40 – 4 76,15876,158
5 – 245 – 24 286,501286,501
24 – 4424 – 44 325,971325,971
45 – 6445 – 64 185,402185,402
65 – 7465 – 74 72,49472,494
75+75+ 53,47453,474
TotalTotal 1,000,0001,000,000
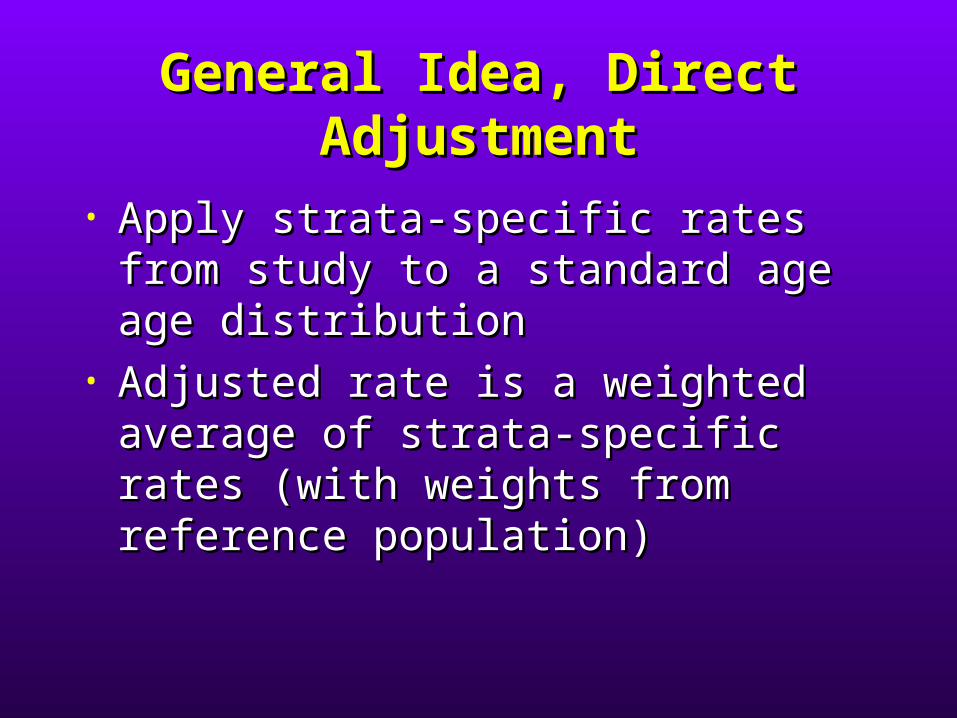
General Idea, Direct General Idea, Direct AdjustmentAdjustment
• Apply strata-specific rates from Apply strata-specific rates from study to a standard age age study to a standard age age distribution distribution
• Adjusted rate is a weighted Adjusted rate is a weighted average of strata-specific rates average of strata-specific rates (with weights from reference (with weights from reference population) population)
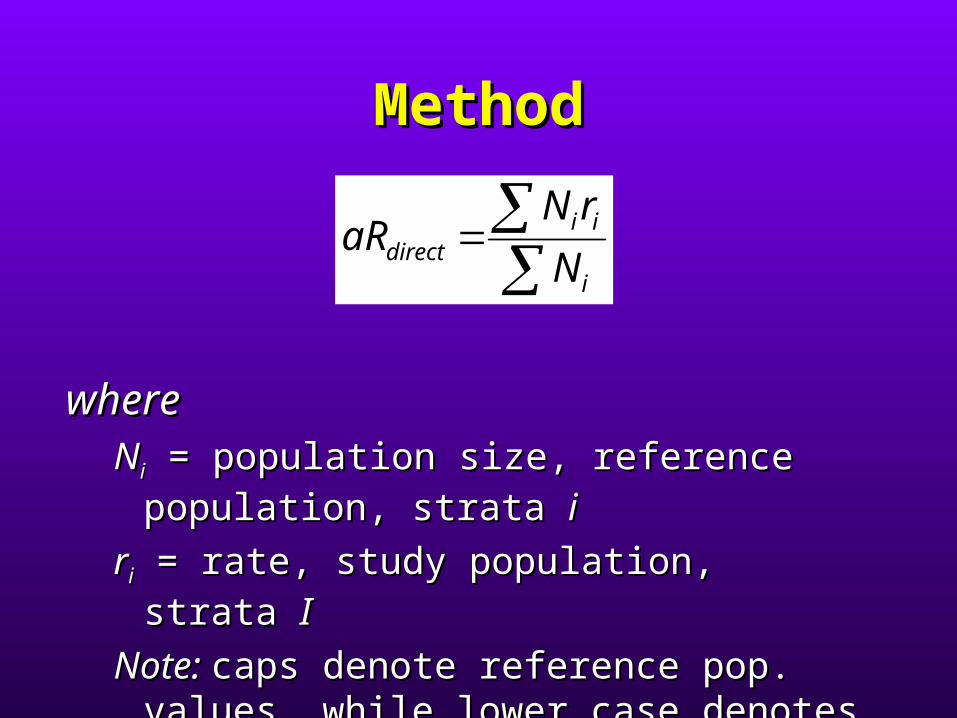
MethodMethod
where where NNii = population size, reference = population size, reference
population, strata population, strata ii
rrii = rate, study population, strata = rate, study population, strata II
Note: Note: caps denote reference pop. caps denote reference pop. values, while lower case denotes values, while lower case denotes study pop. valuesstudy pop. values
i
iidirect N
rNaR
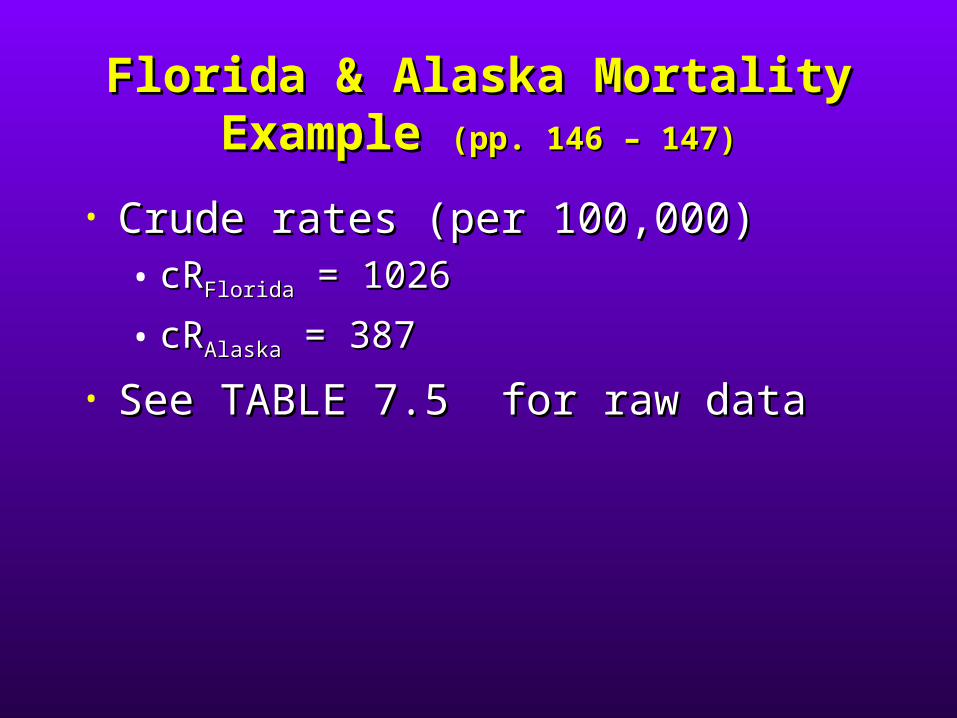
Florida & Alaska Mortality Florida & Alaska Mortality Example Example (pp. 146 – 147)(pp. 146 – 147)
• Crude rates (per 100,000) Crude rates (per 100,000) • cRcRFloridaFlorida = 1026 = 1026
• cRcRAlaskaAlaska = 387 = 387
• See TABLE 7.5 for raw dataSee TABLE 7.5 for raw data
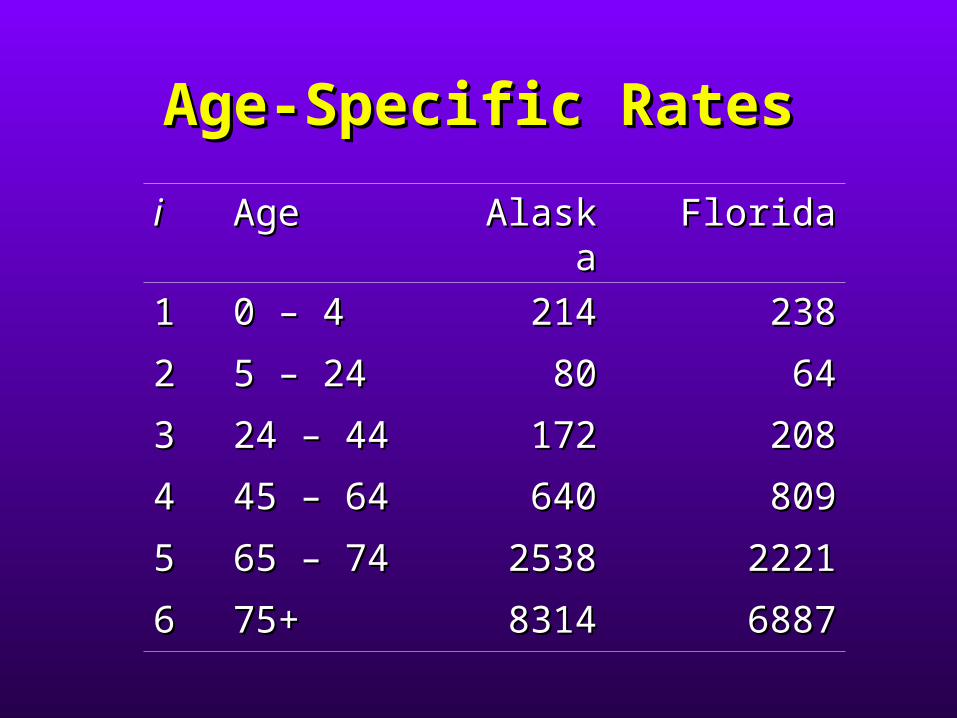
Age-Specific RatesAge-Specific Rates
ii AgeAge AlaskaAlaska FloridaFlorida
11 0 – 40 – 4 214214 238238
22 5 – 245 – 24 8080 6464
33 24 – 4424 – 44 172172 208208
44 45 – 6445 – 64 640640 809809
55 65 – 7465 – 74 25382538 22212221
66 75+75+ 83148314 68876887
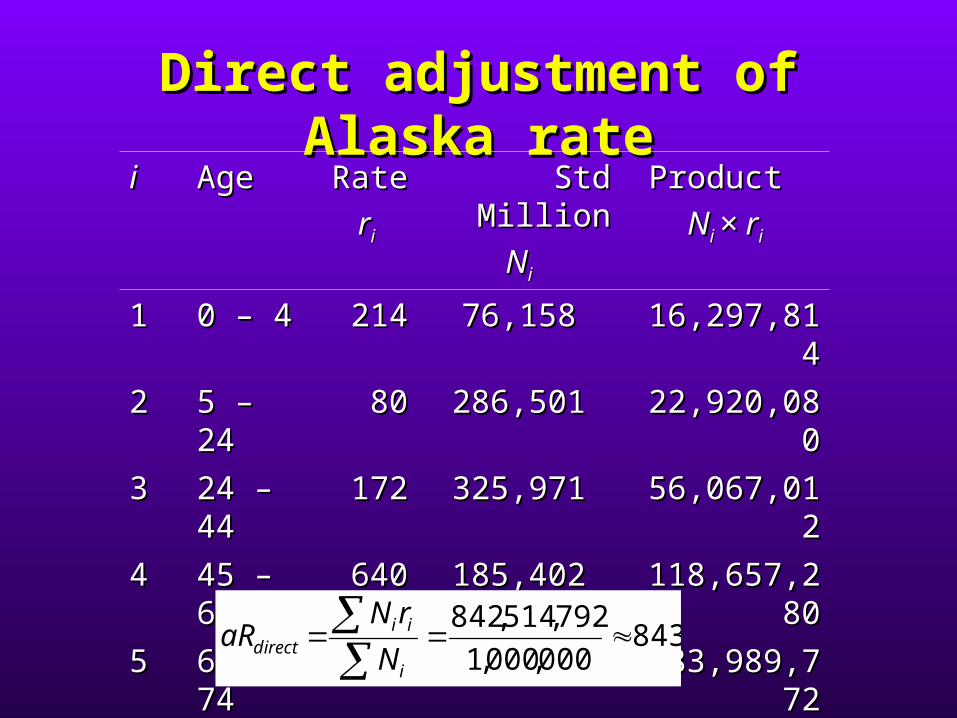
Direct adjustment of Direct adjustment of Alaska rateAlaska rate
ii AgeAge RateRate
rrii
Std MillionStd Million
NNii
Product Product
NNi i × r× rii
11 0 – 40 – 4 214214 76,15876,158 16,297,81416,297,814
22 5 – 245 – 24 8080 286,501286,501 22,920,08022,920,080
33 24 – 24 – 4444
172172 325,971325,971 56,067,01256,067,012
44 45 – 45 – 6464
640640 185,402185,402 118,657,28118,657,2800
55 65 – 65 – 7474
25382538 72,49472,494 183,989,77183,989,7722
66 75+75+ 83148314 53,47453,474 444,582,83444,582,8366
1,000,0001,000,000 842,514,79842,514,7922
843000,000,1
792,514,842
i
iidirect N
rNaR
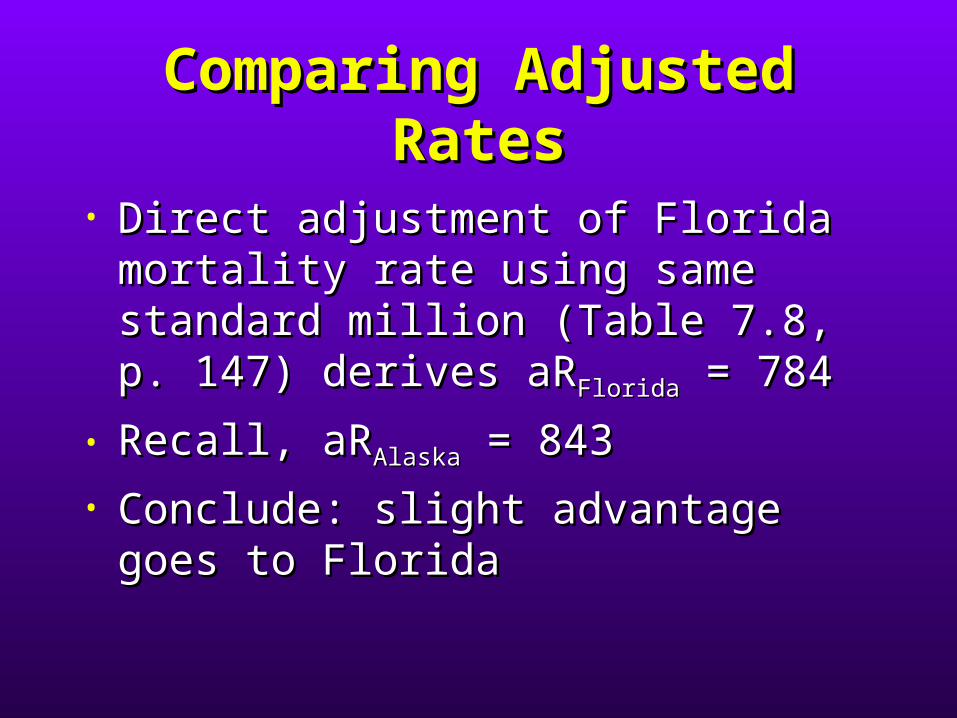
Comparing Adjusted Comparing Adjusted RatesRates
• Direct adjustment of Florida Direct adjustment of Florida mortality rate using same standard mortality rate using same standard million (Table 7.8, p. 147) derives million (Table 7.8, p. 147) derives aRaRFloridaFlorida = 784 = 784
• Recall, aRRecall, aRAlaskaAlaska = 843 = 843
• Conclude: slight advantage goes to Conclude: slight advantage goes to FloridaFlorida
The section on indirect The section on indirect adjustment (§7.3) may adjustment (§7.3) may or may not be coveredor may not be covered
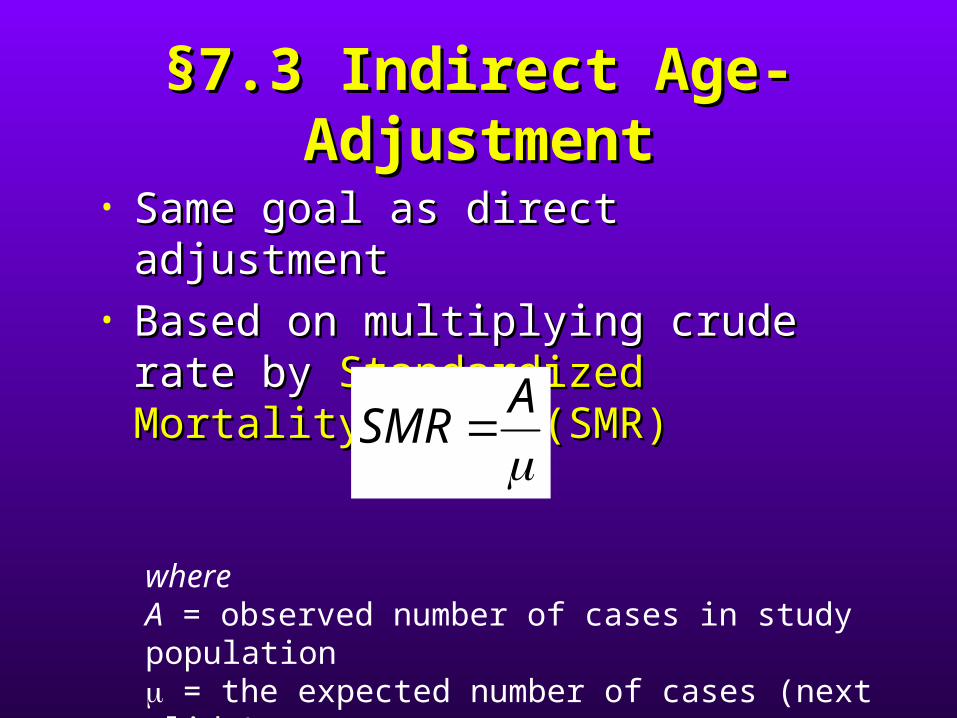
§7.3 Indirect Age-§7.3 Indirect Age-AdjustmentAdjustment
• Same goal as direct adjustment Same goal as direct adjustment • Based on multiplying crude rate by Based on multiplying crude rate by
Standardized Mortality Ratio (SMR)Standardized Mortality Ratio (SMR)
A
SMR
where A = observed number of cases in study population = the expected number of cases (next slide)
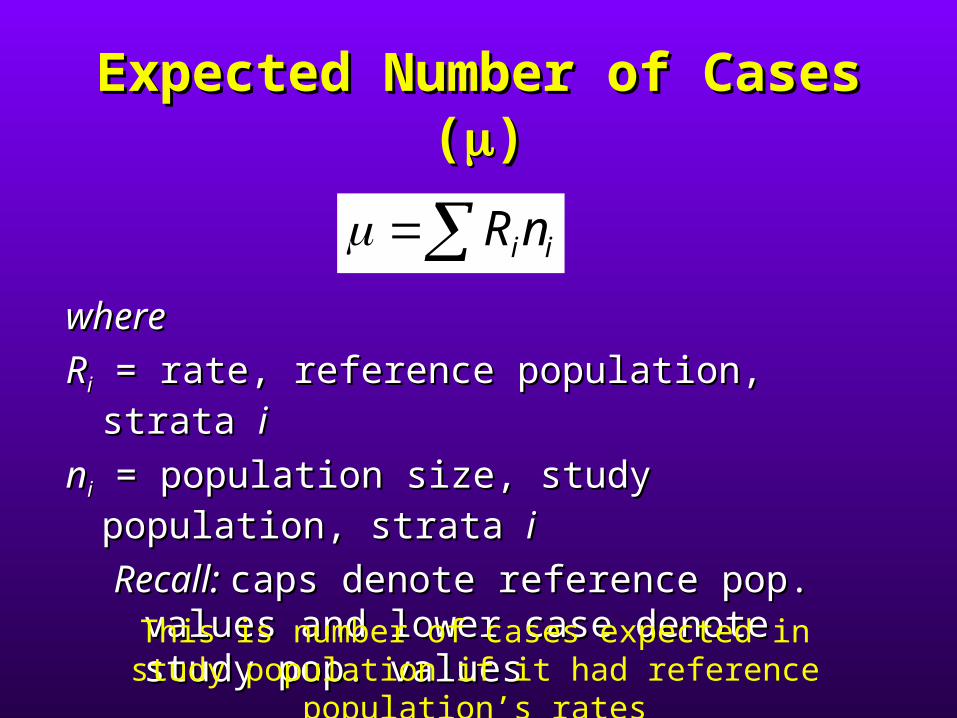
Expected Number of Expected Number of Cases (Cases ())
iinR
where where
RRii = rate, reference population, strata = rate, reference population, strata ii
nnii = population size, study population, = population size, study population, strata strata ii
Recall: Recall: caps denote reference pop. caps denote reference pop. values and lower case denote study values and lower case denote study pop. valuespop. valuesThis is number of cases expected in study
population if it had reference population’s rates

Illustrative ExampleIllustrative ExampleZimbabwe & US Population (pp. 148 – Zimbabwe & US Population (pp. 148 –
9)9)
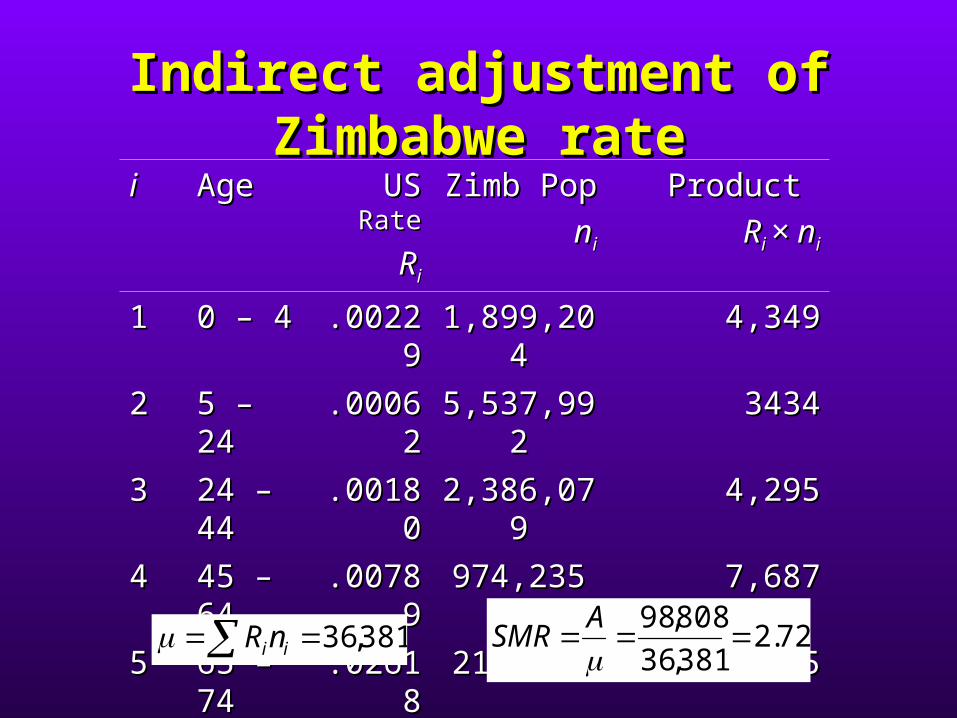
Indirect adjustment of Indirect adjustment of Zimbabwe rateZimbabwe rate
ii AgeAge US US RateRate
RRii
Zimb PopZimb Pop
nnii
Product Product
RRi i × n× nii
11 0 – 40 – 4 .0022.002299
1,899,201,899,2044
4,3494,349
22 5 – 245 – 24 .0006.000622
5,537,995,537,9922
34343434
33 24 – 24 – 4444
.0018.001800
2,386,072,386,0799
4,2954,295
44 45 – 45 – 6464
.0078.007899
974,235974,235 7,6877,687
55 65 – 65 – 7474
.0261.026188
216,387216,387 5,6655,665
66 75+75+ .0804.080466
136,109136,109 10,95110,951
RRiinnii = = 36,38136,381
381,36 iinR 72.2381,36
808,98
A
SMR
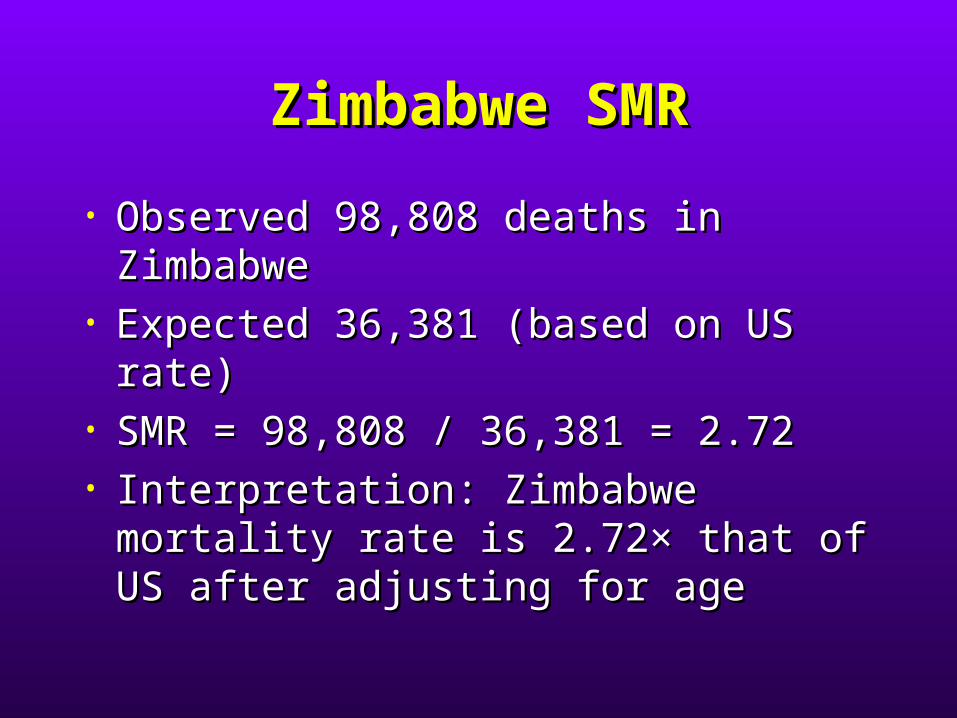
Zimbabwe SMRZimbabwe SMR
• Observed 98,808 deaths in Observed 98,808 deaths in ZimbabweZimbabwe
• Expected 36,381 (based on US rate)Expected 36,381 (based on US rate)• SMR = 98,808 / 36,381 = 2.72SMR = 98,808 / 36,381 = 2.72• Interpretation: Zimbabwe mortality Interpretation: Zimbabwe mortality
rate is 2.72× that of US after rate is 2.72× that of US after adjusting for ageadjusting for age
Indirectly Adjusted Indirectly Adjusted Rate Rate
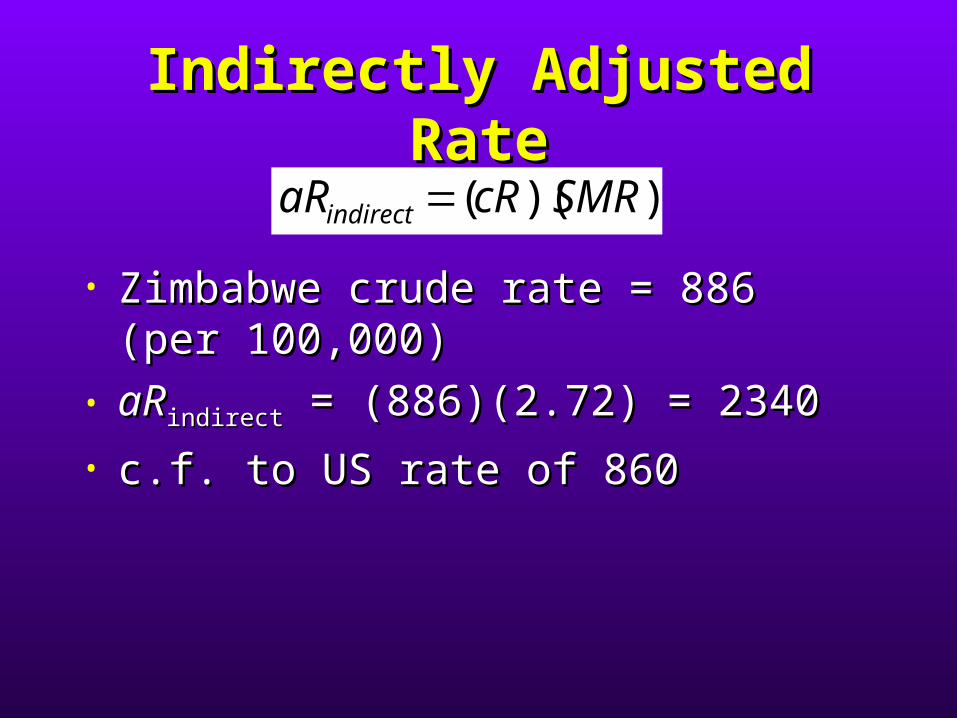
Indirectly Adjusted Indirectly Adjusted RateRate
• Zimbabwe crude rate = 886 (per Zimbabwe crude rate = 886 (per 100,000)100,000)
• aRaRindirectindirect = (886)(2.72) = 2340 = (886)(2.72) = 2340
• c.f. to US rate of 860c.f. to US rate of 860
))(( SMRcRaRindirect
§7.4 Adjustment for §7.4 Adjustment for Multiple FactorsMultiple Factors
• Any extraneous factor can be Any extraneous factor can be adjusted foradjusted for
• Mortality rates are often adjusted Mortality rates are often adjusted for year, age, and sexfor year, age, and sex
• Principles of adjusting for potential Principles of adjusting for potential confounders apply to more confounders apply to more advanced studyadvanced study

![(c) B. Gerstman 2007Chapter 91 Epidemiology Kept Simple Chapter 9: Types of Epidemiologic Studies [Introduction to Analytic Studies]](https://static.fdocuments.in/doc/165x107/56649d6b5503460f94a4a898/c-b-gerstman-2007chapter-91-epidemiology-kept-simple-chapter-9-types-of.jpg)