Epidemics workshoprise
48
Dr. Mayteé Cruz-Aponte RISE WORKSHOP March 20,2015 BIOMATHEMATICS: EPIDEMIOLOGY OF THE SPREAD OF DISEASES Source: http://consensus.nih.gov/IMAGES/ Art/EndOfLifeCareSOS024HIRESsmall.jpg
-
Upload
nicole-rivera -
Category
Software
-
view
39 -
download
1
Transcript of Epidemics workshoprise
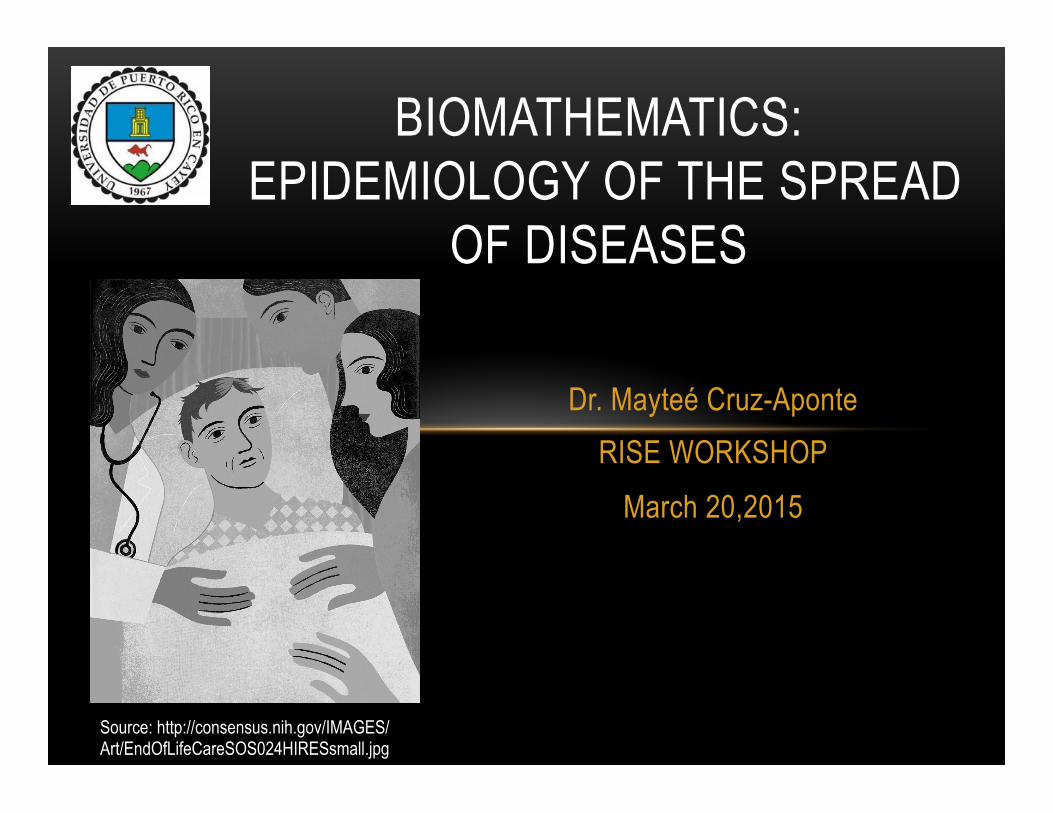
Dr. Mayteé Cruz-Aponte RISE WORKSHOP
March 20,2015
BIOMATHEMATICS: EPIDEMIOLOGY OF THE SPREAD
OF DISEASES
Source: http://consensus.nih.gov/IMAGES/Art/EndOfLifeCareSOS024HIRESsmall.jpg
OVERVIEW
• Epidemiology • Epidemiological compartmental models • Basic Reproductive number • Real life applications from epidemics to life sciences • Simulations • Group work
Interdisciplinary work needed!
WHAT IS EPIDEMIOLOGY?
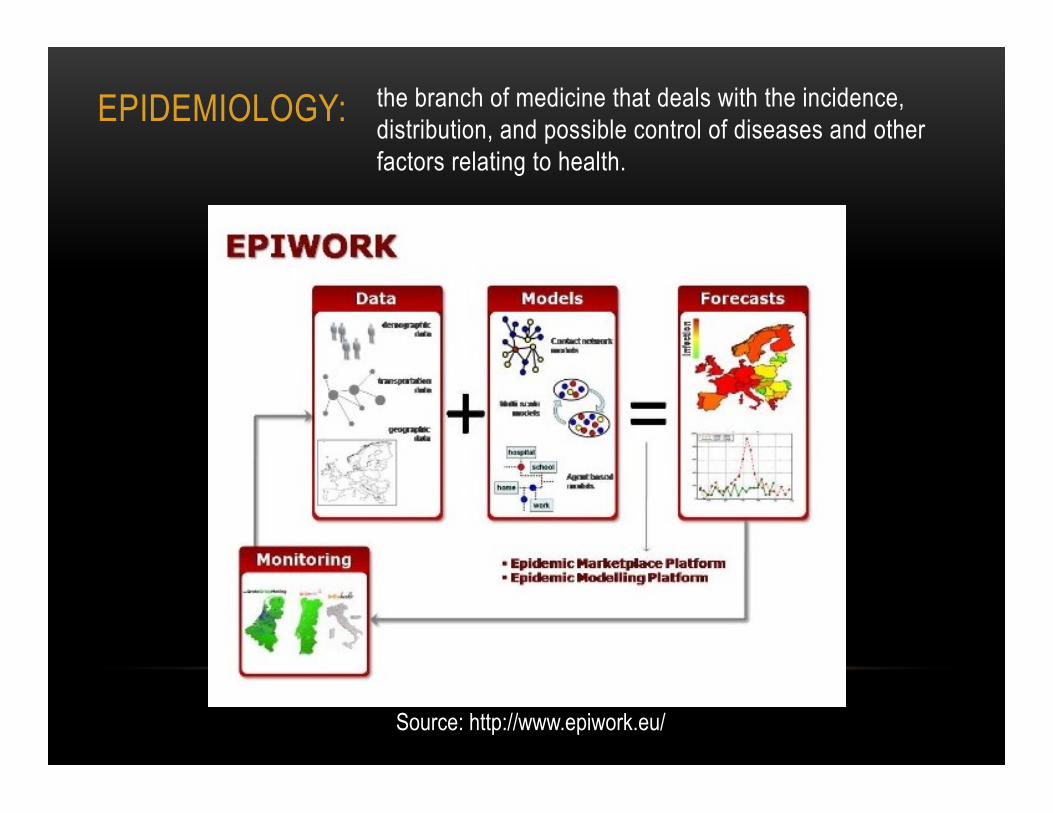
EPIDEMIOLOGY: the branch of medicine that deals with the incidence, distribution, and possible control of diseases and other factors relating to health.
Source: http://www.epiwork.eu/
… How disease spread …
Experiment
SPREAD OF DISEASES
http://weddingsabeautiful.com/files/2012/12/1326591.jpg
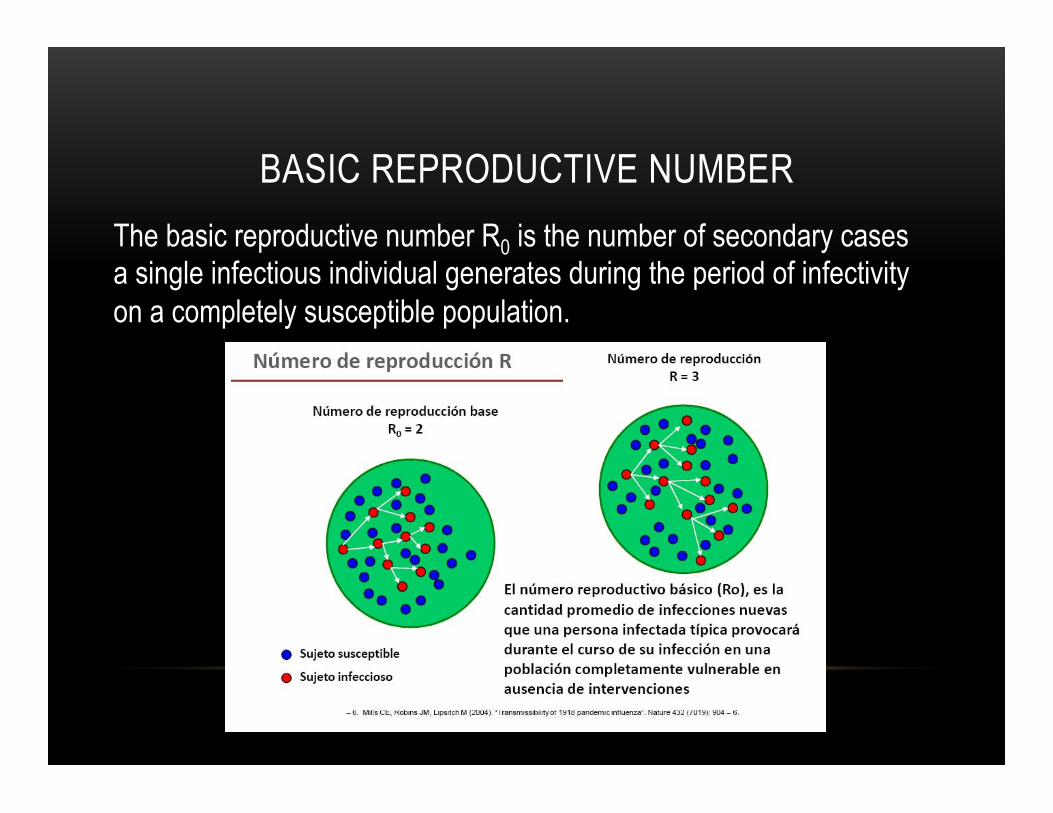
BASIC REPRODUCTIVE NUMBER The basic reproductive number R0 is the number of secondary cases a single infectious individual generates during the period of infectivity on a completely susceptible population.
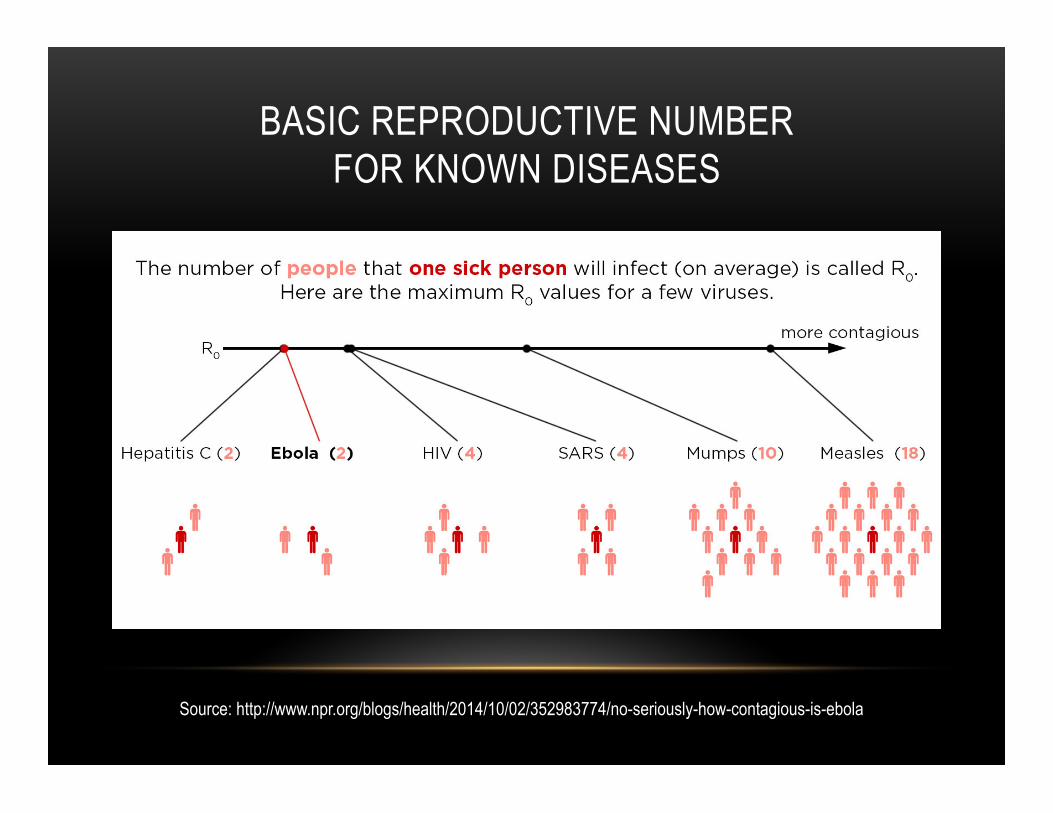
BASIC REPRODUCTIVE NUMBER FOR KNOWN DISEASES
Source: http://www.npr.org/blogs/health/2014/10/02/352983774/no-seriously-how-contagious-is-ebola
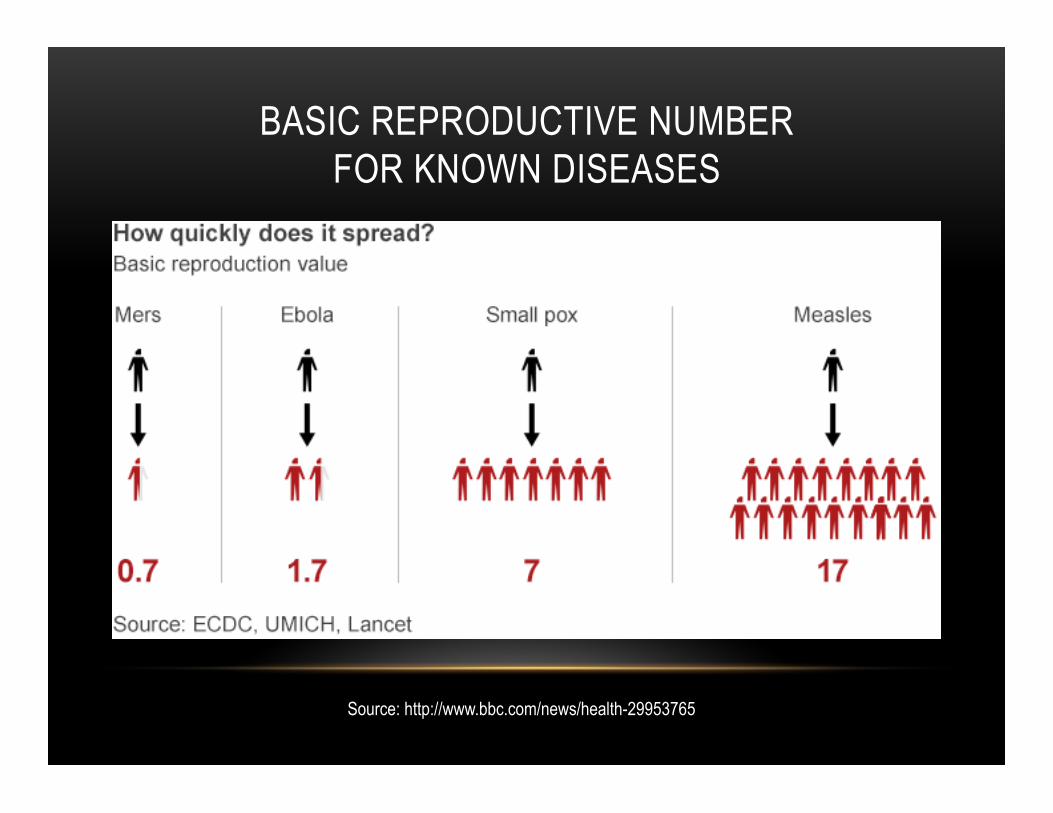
BASIC REPRODUCTIVE NUMBER FOR KNOWN DISEASES
Source: http://www.bbc.com/news/health-29953765
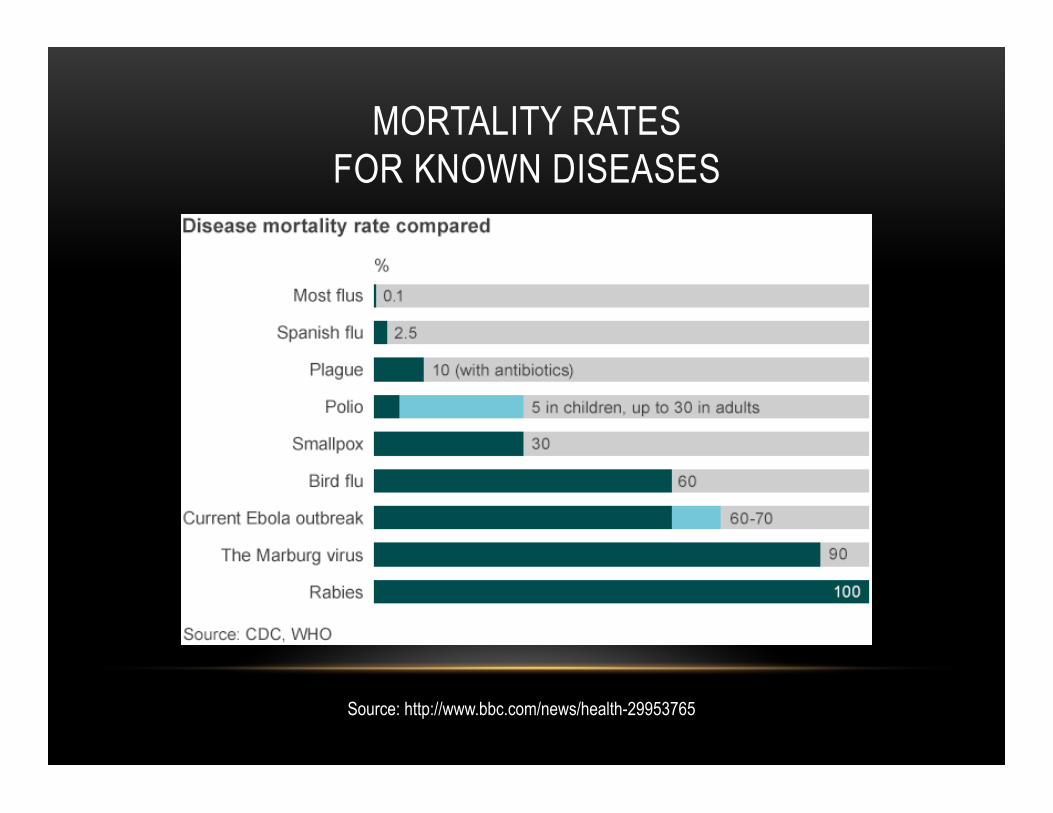
MORTALITY RATES FOR KNOWN DISEASES
Source: http://www.bbc.com/news/health-29953765
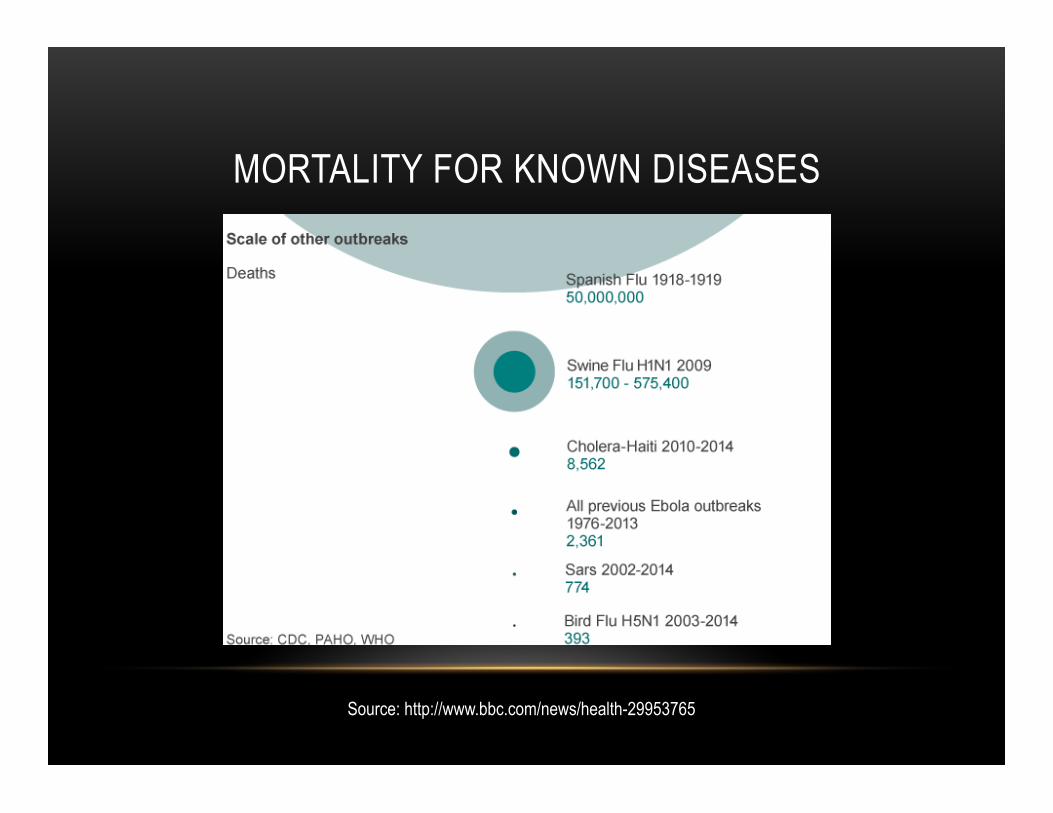
MORTALITY FOR KNOWN DISEASES
Source: http://www.bbc.com/news/health-29953765
Epidemic Models
Social Science Models and more …
EPIDEMIOLOGICAL COMPARTMENTAL MODELS
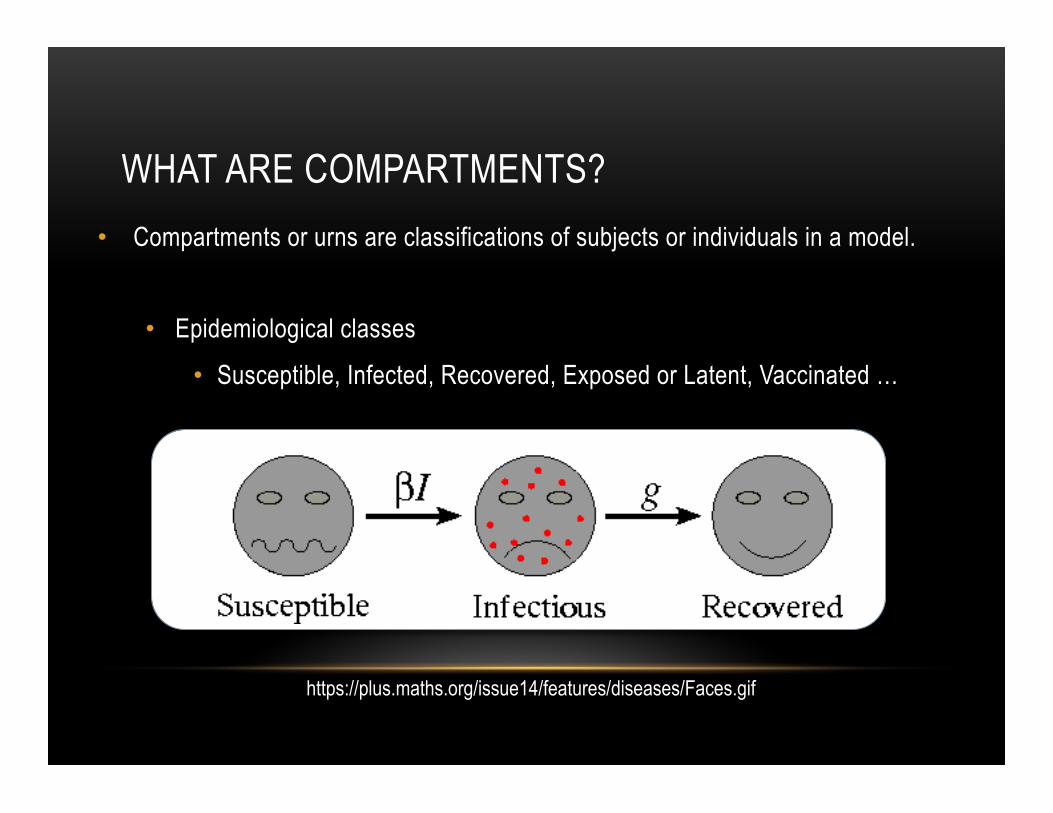
WHAT ARE COMPARTMENTS? • Compartments or urns are classifications of subjects or individuals in a model.
• Epidemiological classes
• Susceptible, Infected, Recovered, Exposed or Latent, Vaccinated …
https://plus.maths.org/issue14/features/diseases/Faces.gif
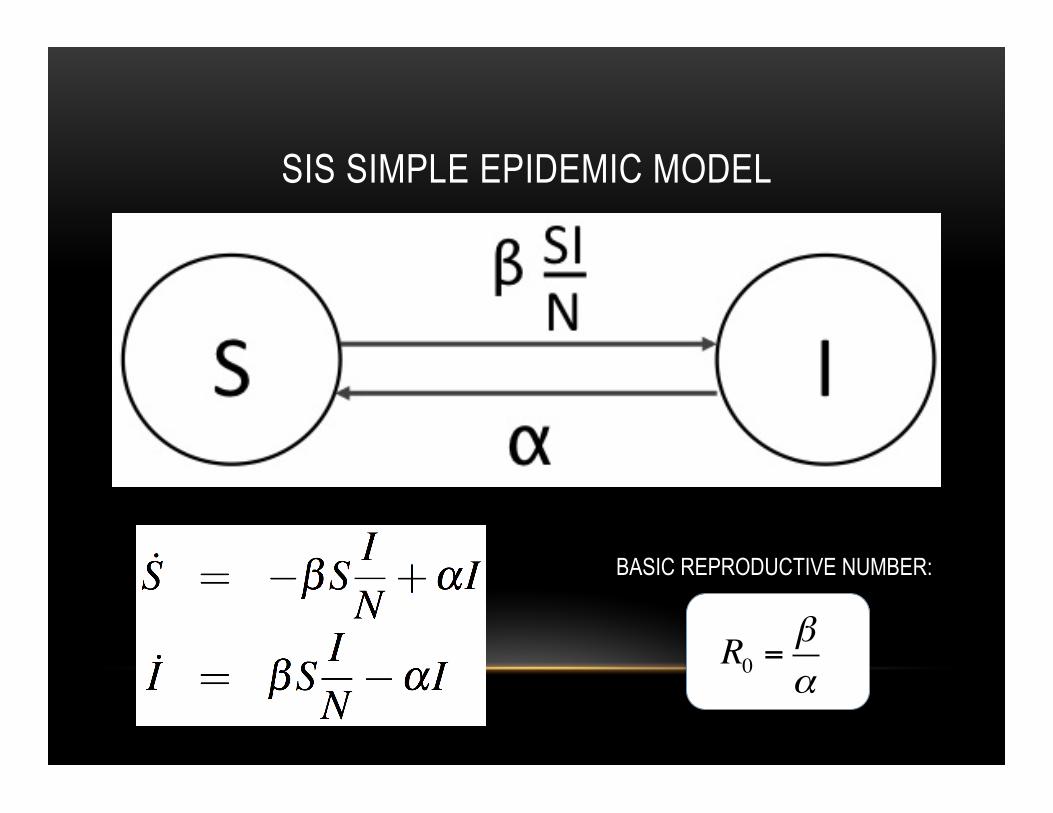
SIS SIMPLE EPIDEMIC MODEL
BASIC REPRODUCTIVE NUMBER:
R0 =βα
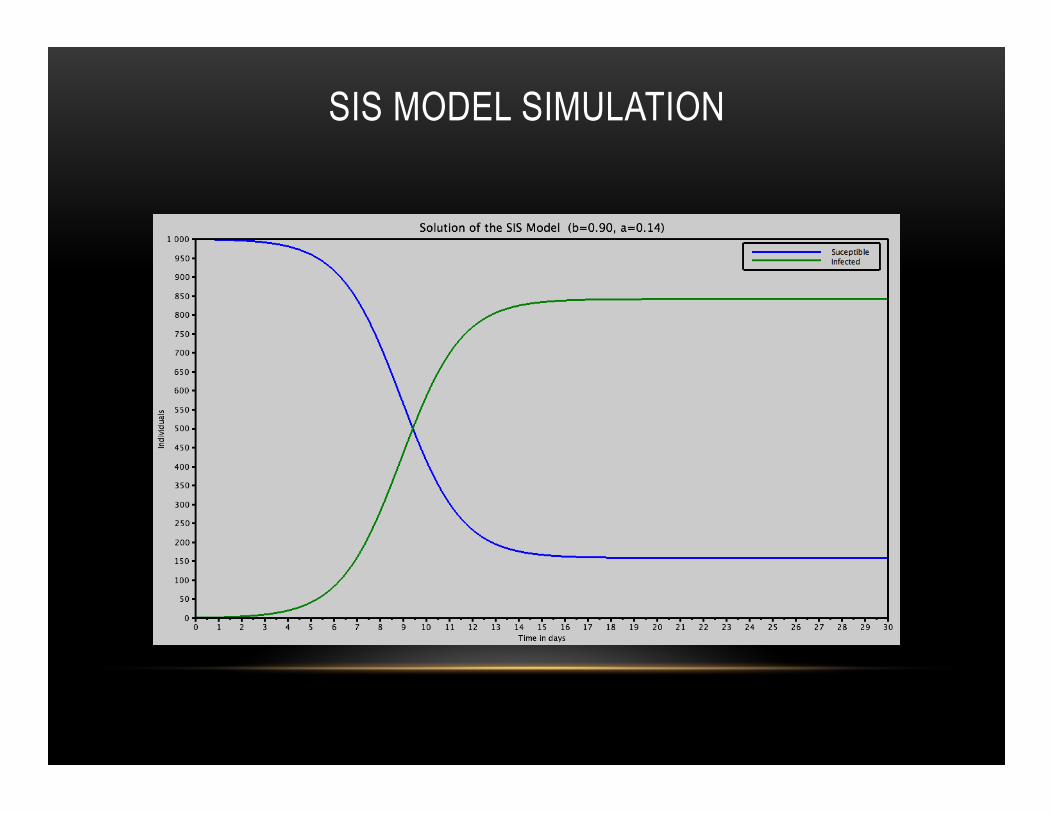
SIS MODEL SIMULATION
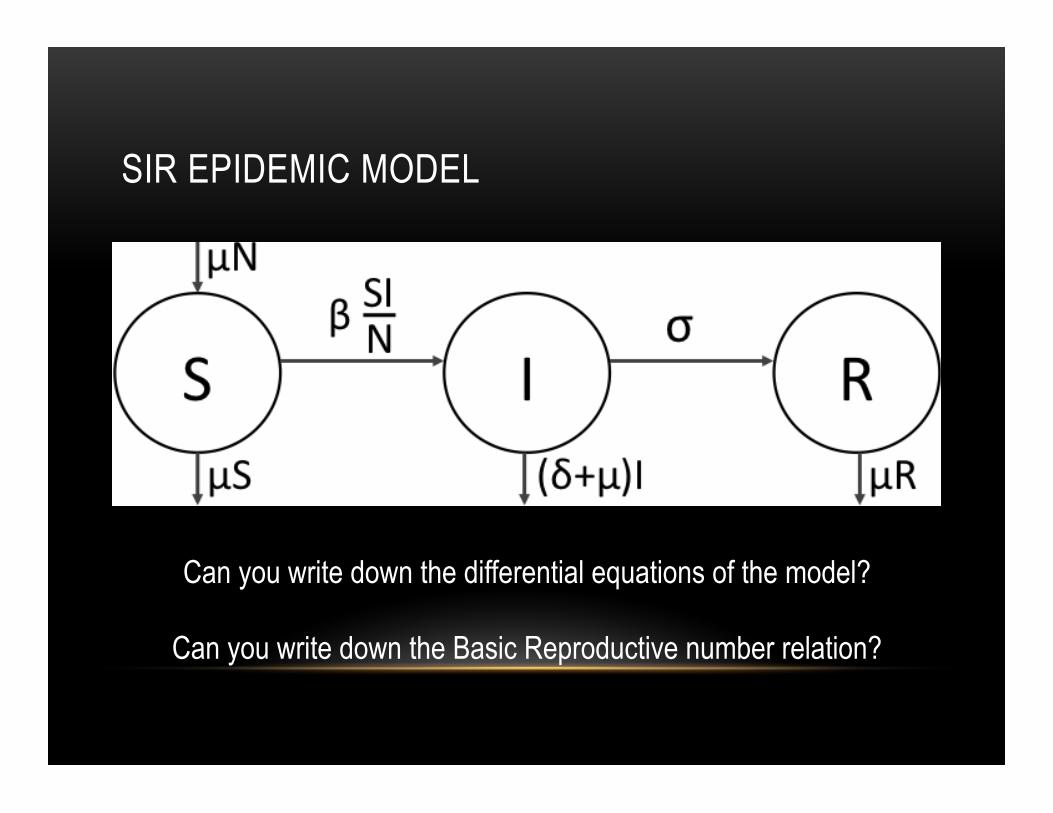
SIR EPIDEMIC MODEL
Can you write down the differential equations of the model?
Can you write down the Basic Reproductive number relation?
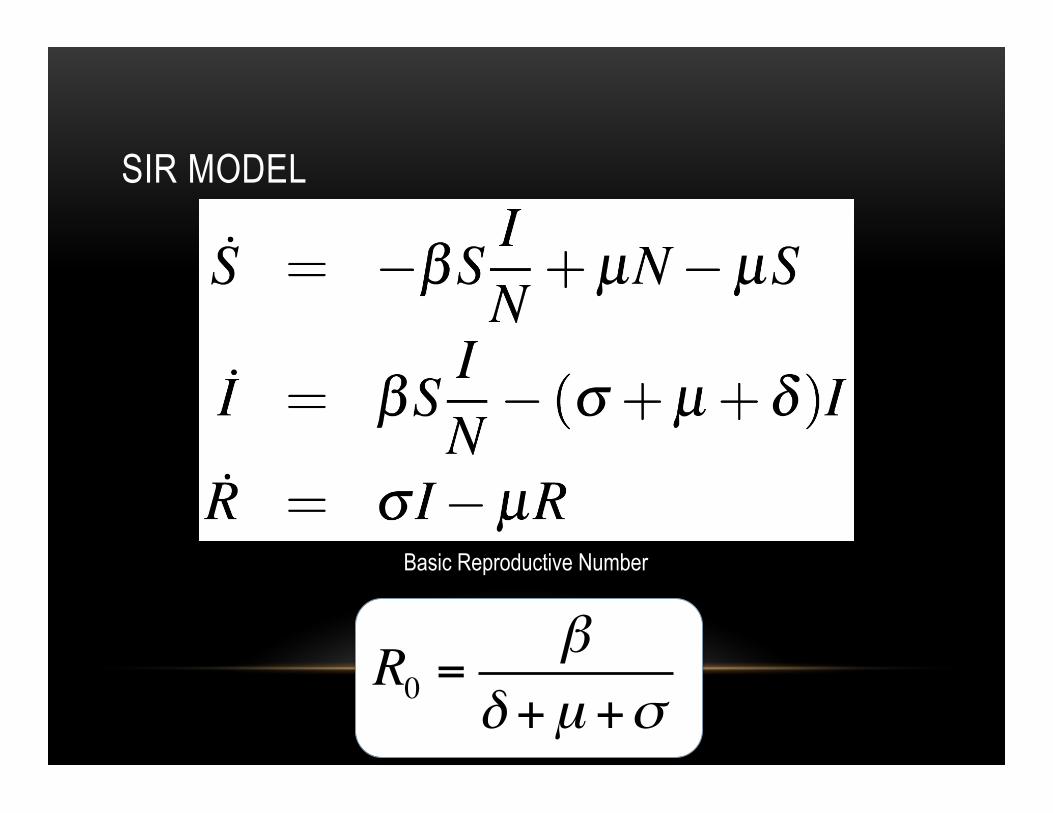
SIR MODEL
R0 =β
δ +µ +σ
Basic Reproductive Number
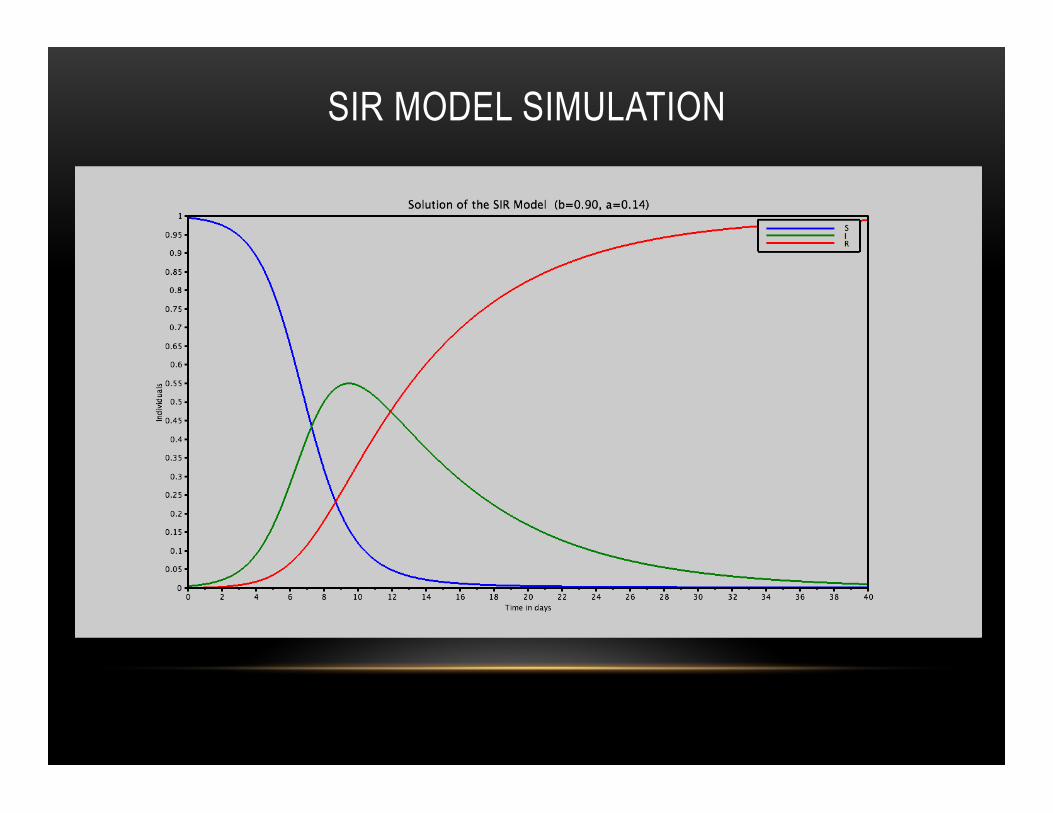
SIR MODEL SIMULATION
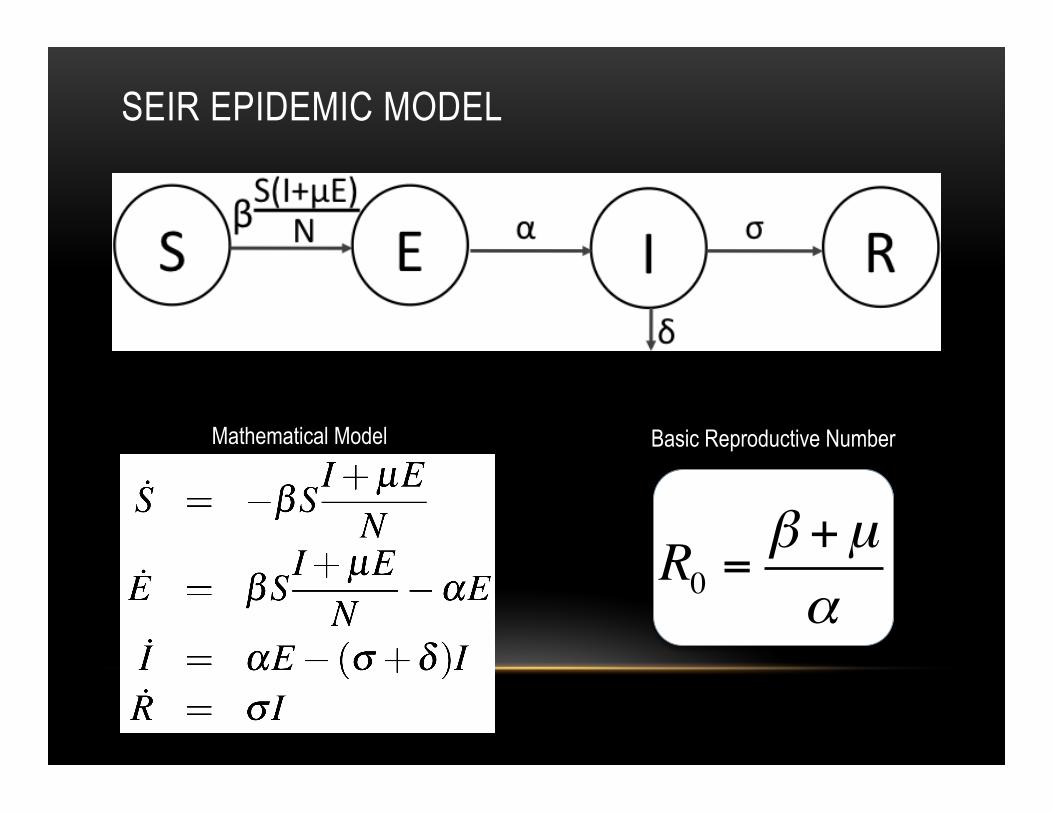
SEIR EPIDEMIC MODEL
R0 =β +µα
Mathematical Model Basic Reproductive Number
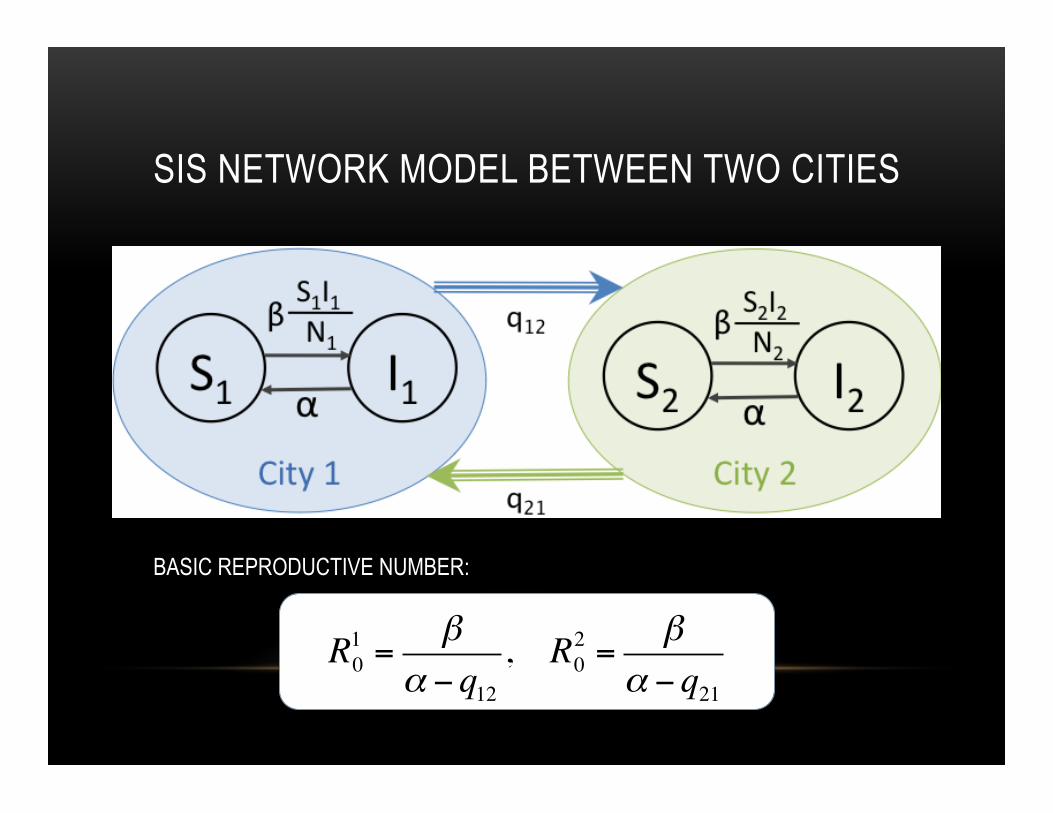
SIS NETWORK MODEL BETWEEN TWO CITIES
R10 =β
α − q12, R20 =
βα − q21
BASIC REPRODUCTIVE NUMBER:
Zombies Bibber Fever
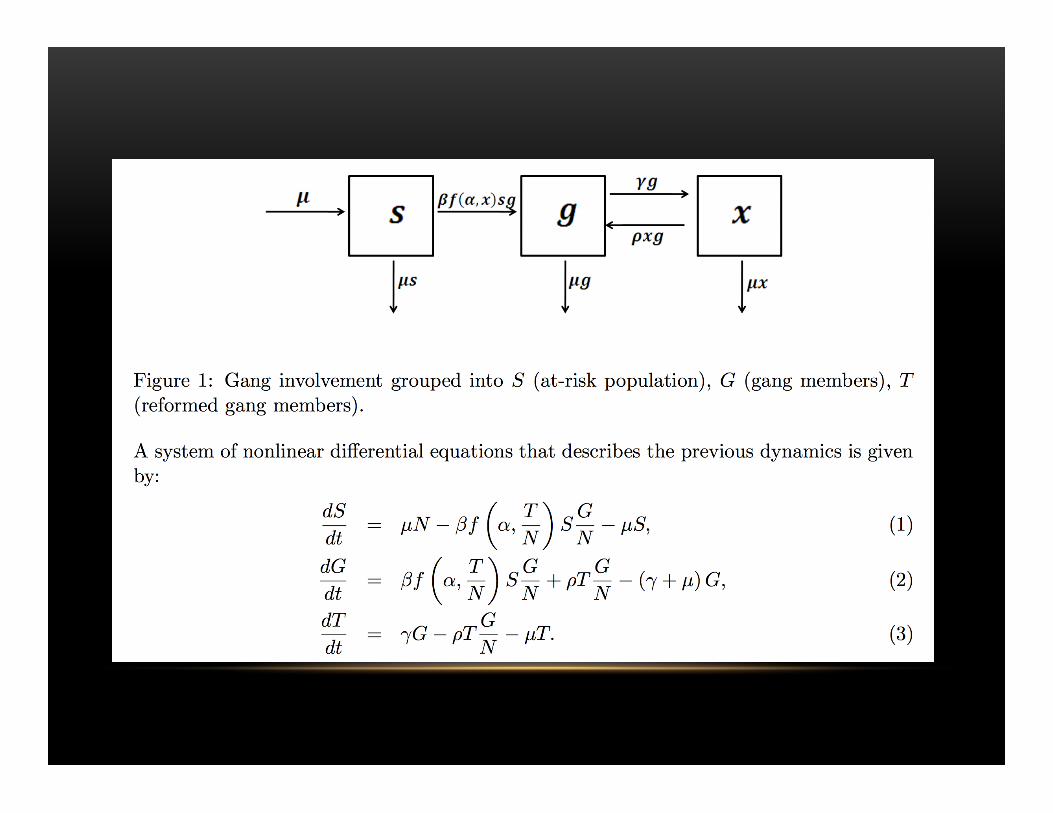
Gangs Rumor Spreads
Viral Videos
NON TRADITIONAL MODELS
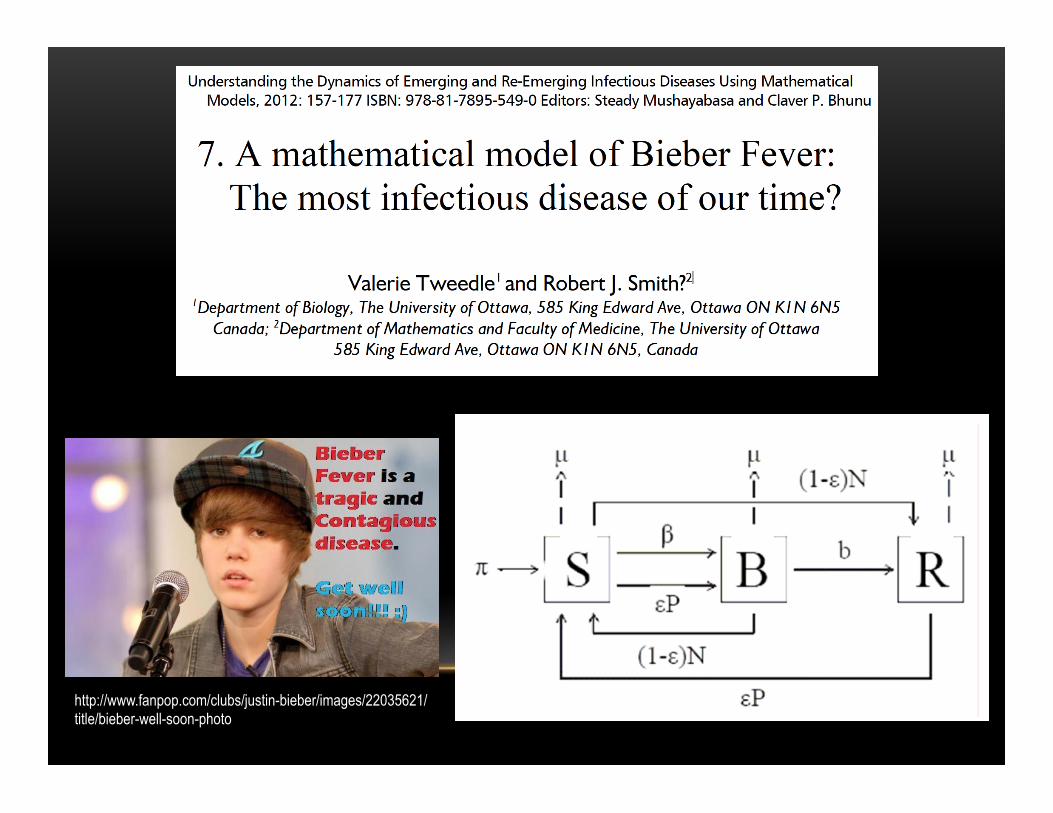
http://www.fanpop.com/clubs/justin-bieber/images/22035621/title/bieber-well-soon-photo
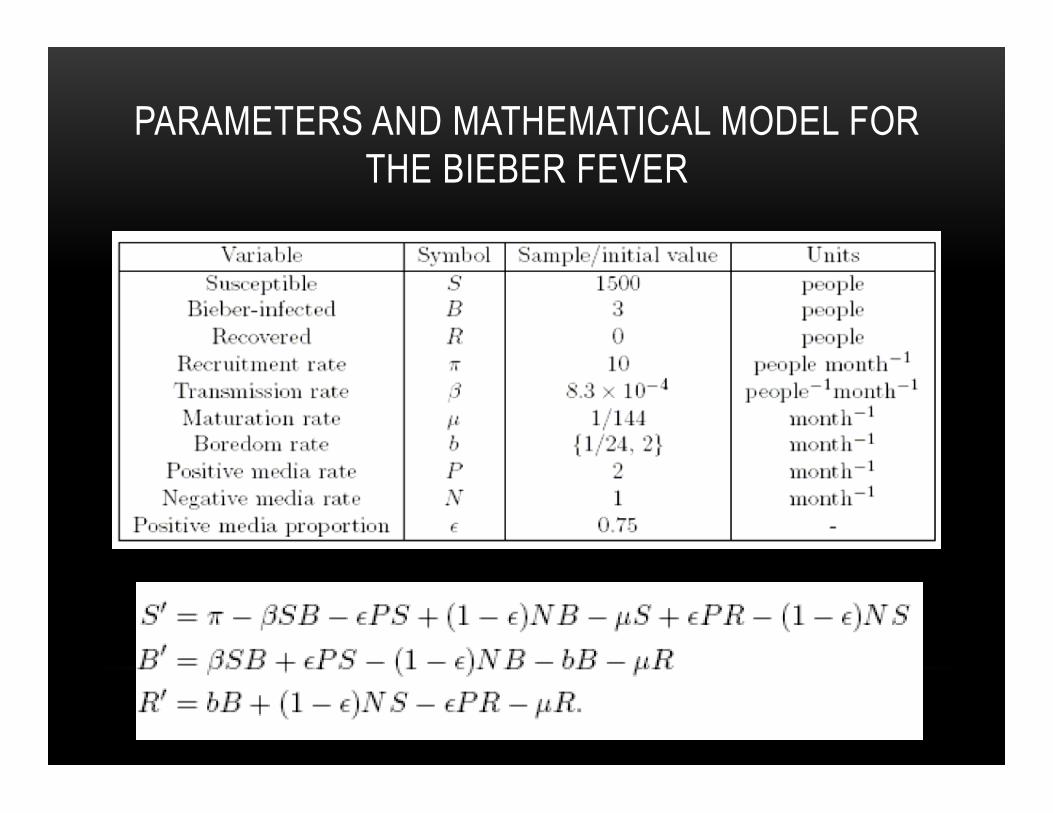
PARAMETERS AND MATHEMATICAL MODEL FOR THE BIEBER FEVER

The Viral Disease in this Age of
Technology?
Jacob Perez - Shadow Mountain High School!Meilia Brooks - Agua Fria High School!
Keyaanna Pausch - Flagstaff High School !Yulian Chulovskiy - San Miguel High School !
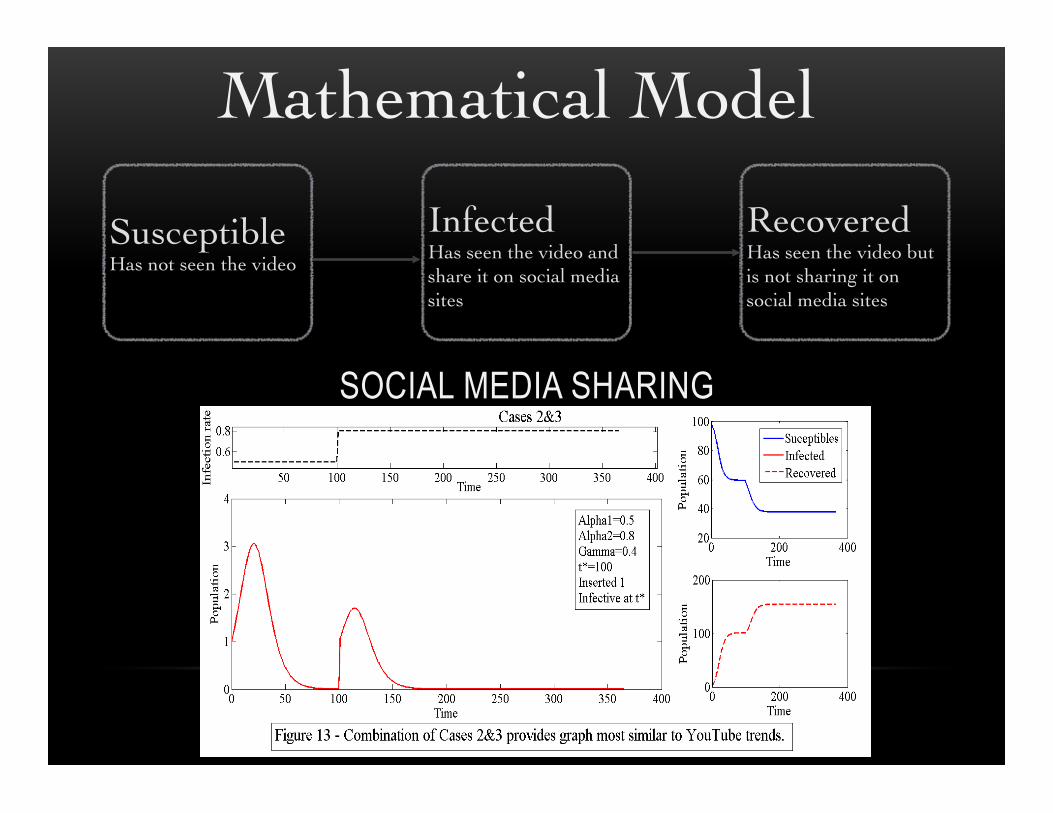
SOCIAL MEDIA SHARING
Mathematical Model!
Susceptible!Has not seen the video!!
Infected!Has seen the video and share it on social media sites!
Recovered!Has seen the video but is not sharing it on social media sites!
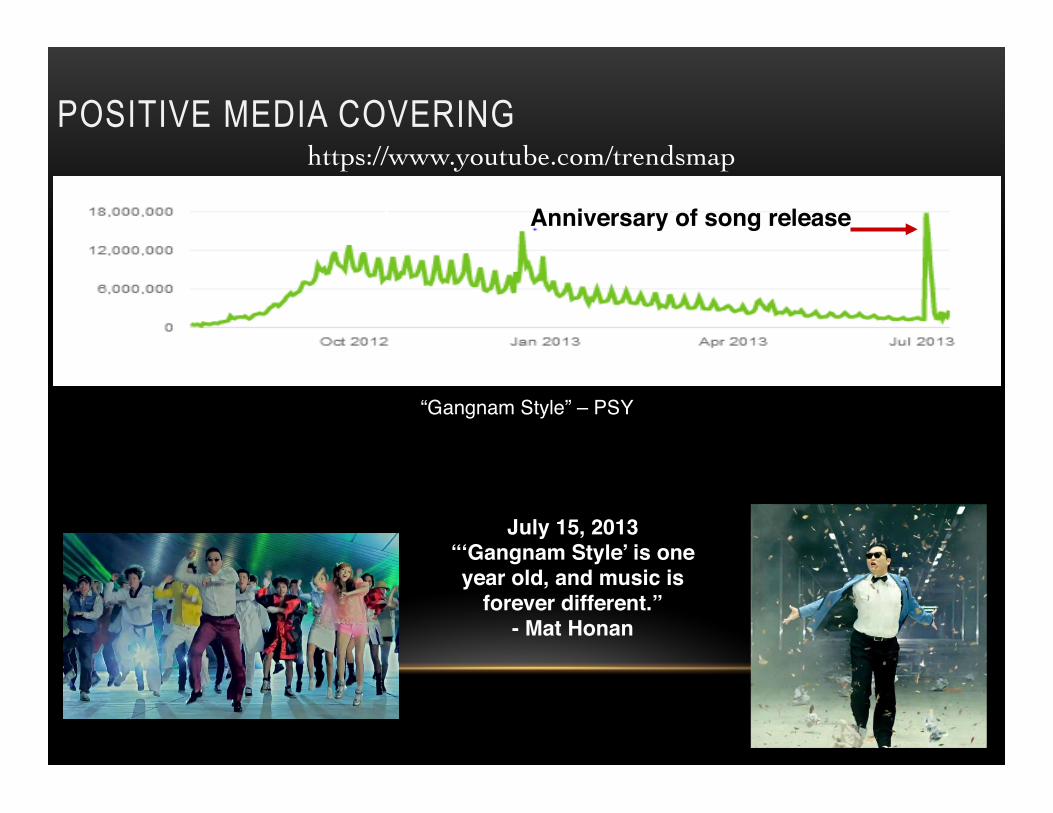
POSITIVE MEDIA COVERING
July 15, 2013!“‘Gangnam Style’ is one year old, and music is
forever different.”!- Mat Honan!
“Gangnam Style” – PSY"
Anniversary of song release!
https://www.youtube.com/trendsmap!
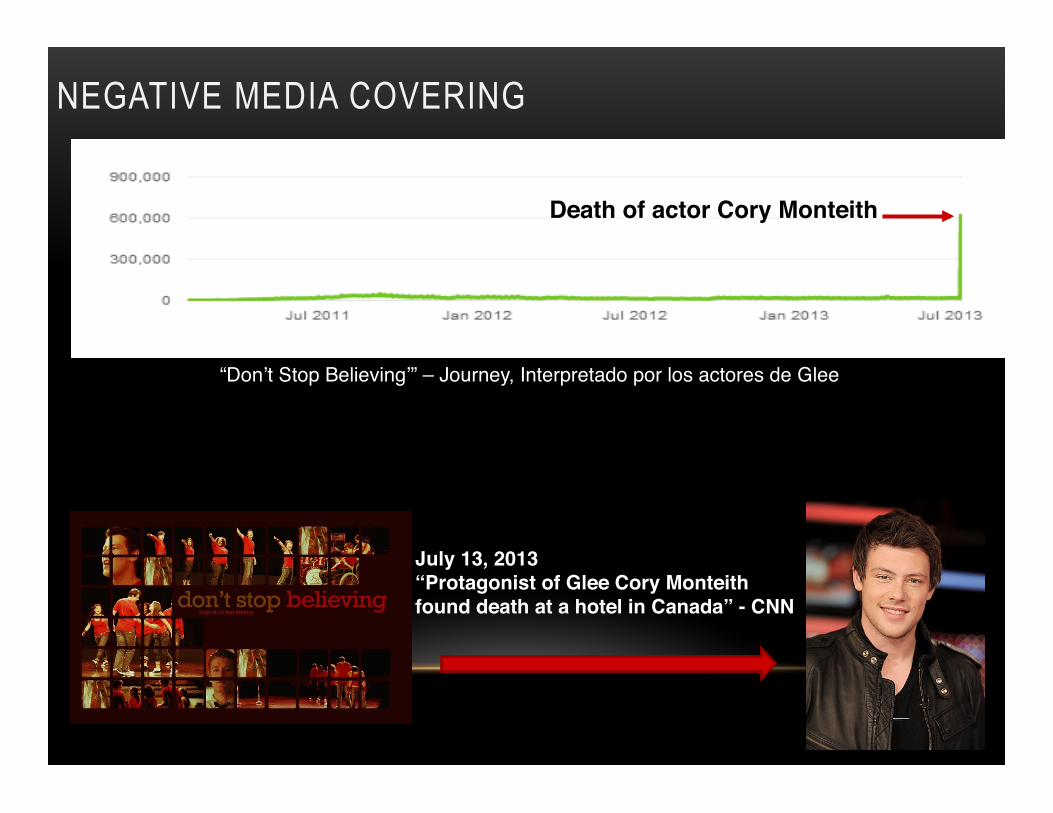
NEGATIVE MEDIA COVERING
July 13, 2013!“Protagonist of Glee Cory Monteith found death at a hotel in Canada” - CNN!
“Don’t Stop Believing’” – Journey, Interpretado por los actores de Glee"
Death of actor Cory Monteith!
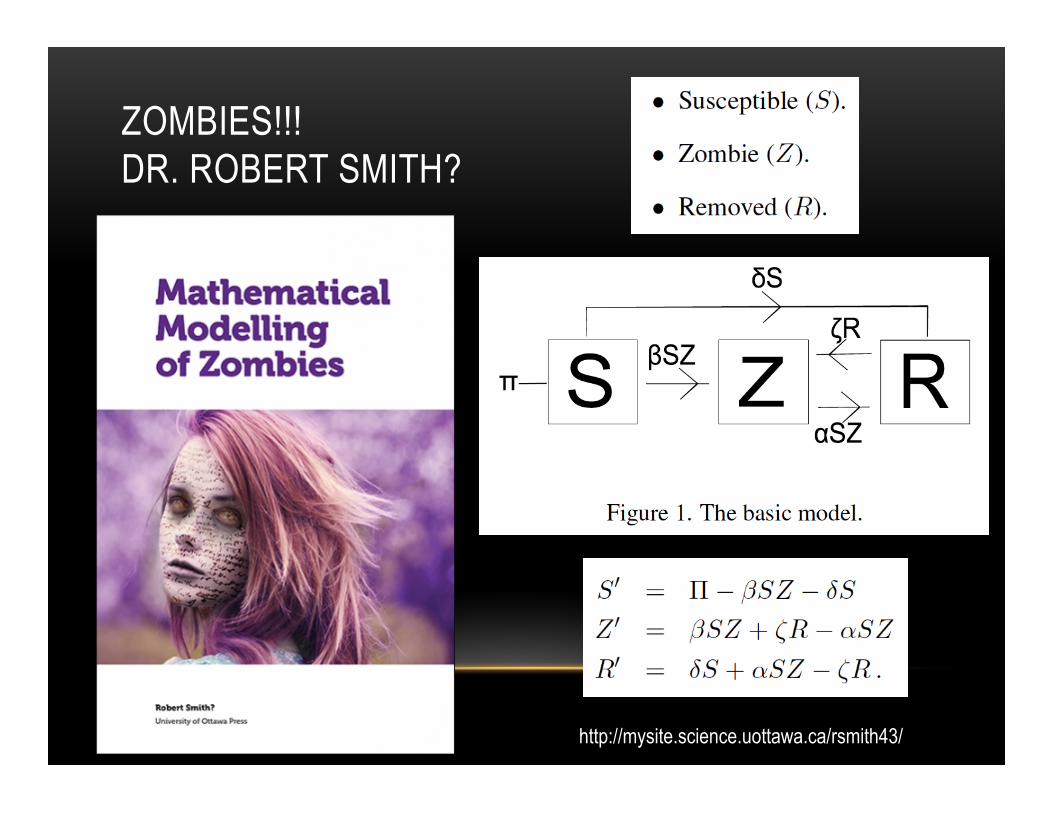
ZOMBIES!!! DR. ROBERT SMITH?
http://mysite.science.uottawa.ca/rsmith43/
The truth shall set us free…
METAPOPULATION MODEL OF INFLUENZA AH1N1 THE CASE OF MEXICO
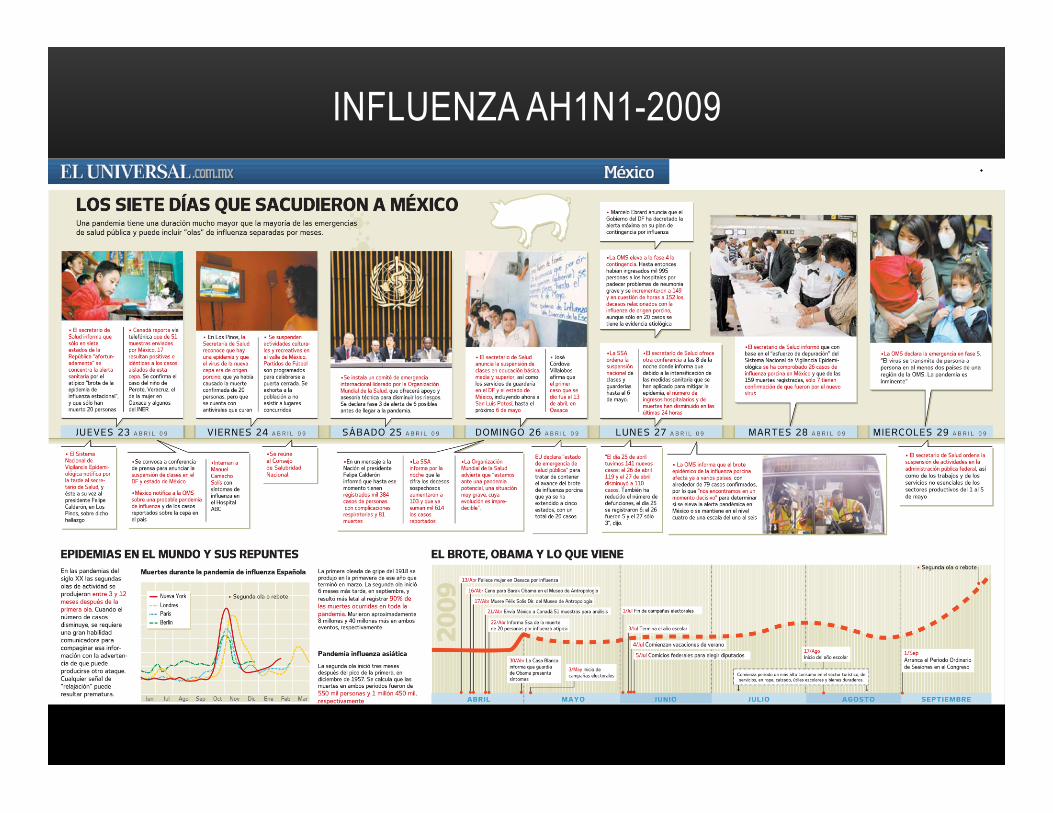
INFLUENZA AH1N1-2009
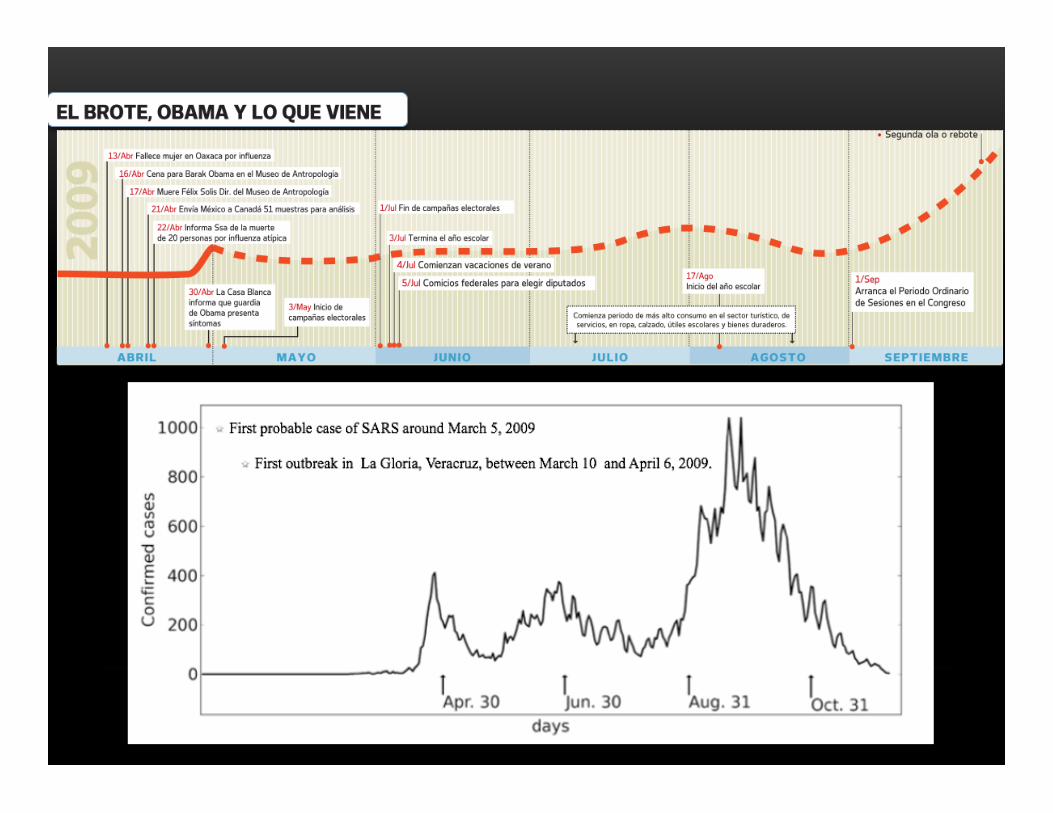
" Primer brote en La Gloria, Veracruz, entre el 10 de marzo y 6 de abril 2009.
" Primer caso probable de SARS alrededor del 5 de marzo de 2009
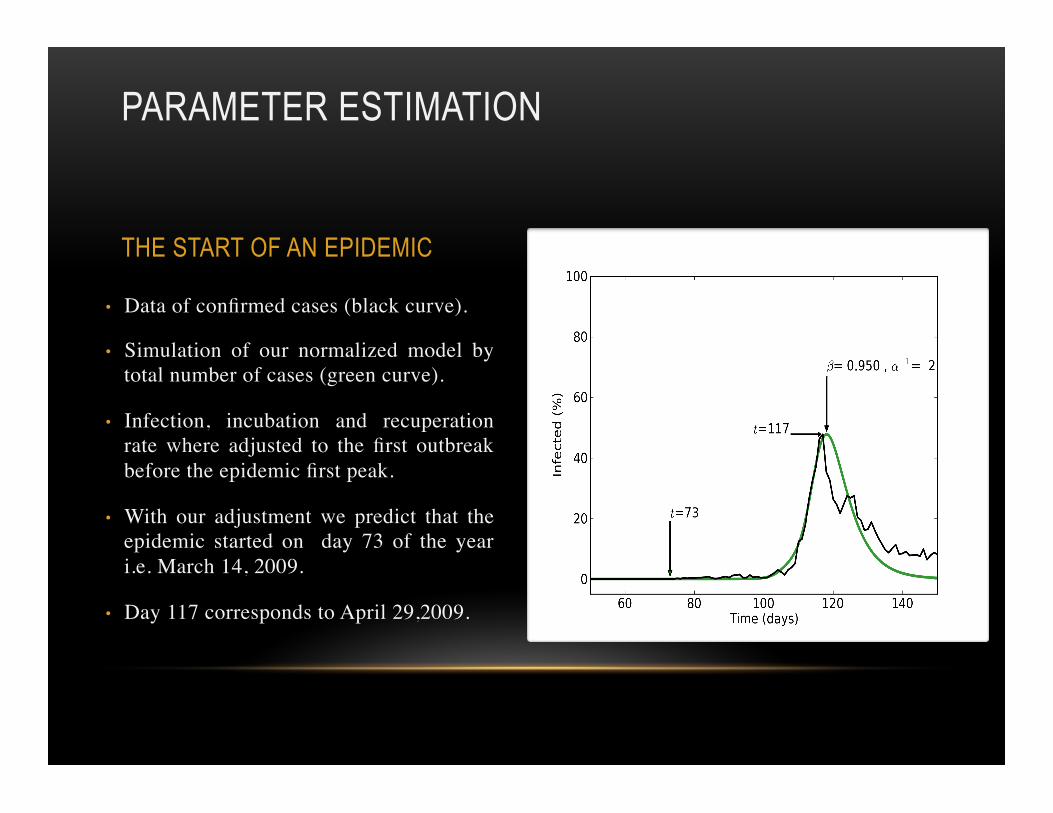
• Data of confirmed cases (black curve). !
• Simulation of our normalized model by total number of cases (green curve). !
• Infection, incubation and recuperation rate where adjusted to the first outbreak before the epidemic first peak. !
• With our adjustment we predict that the epidemic started on day 73 of the year i.e. March 14, 2009. !
• Day 117 corresponds to April 29,2009.!
PARAMETER ESTIMATION
THE START OF AN EPIDEMIC
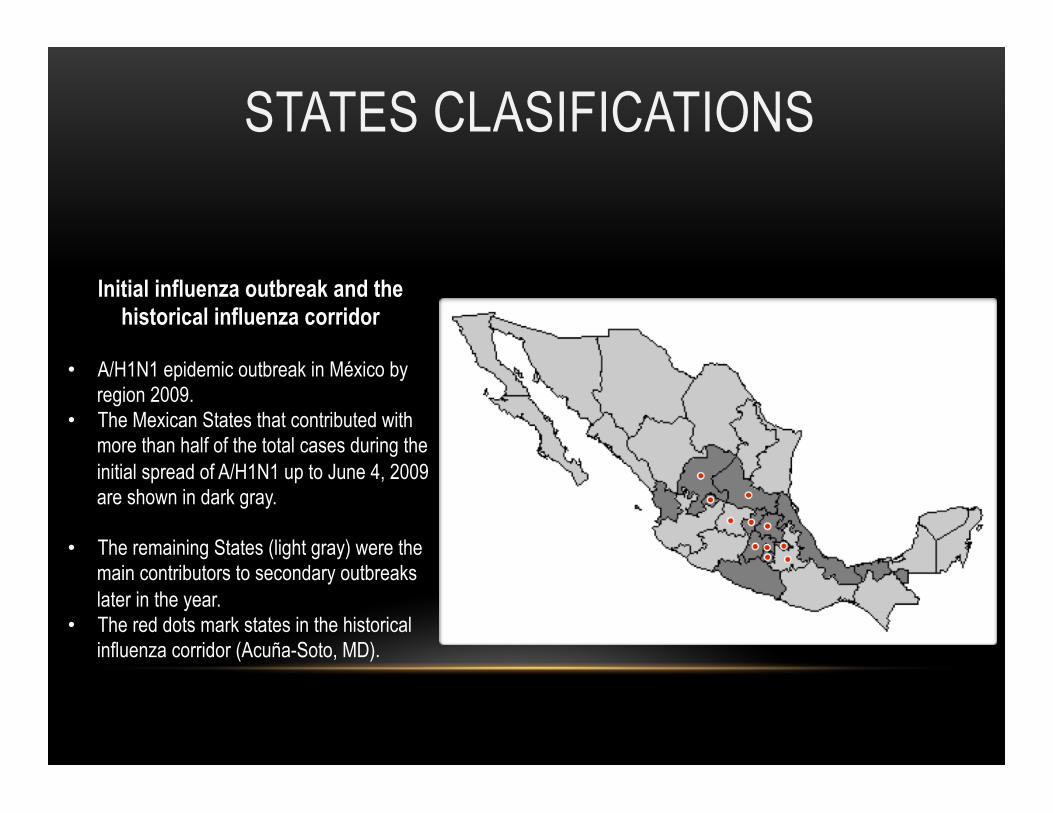
STATES CLASIFICATIONS
Initial influenza outbreak and the historical influenza corridor
• A/H1N1 epidemic outbreak in México by region 2009.
• The Mexican States that contributed with more than half of the total cases during the initial spread of A/H1N1 up to June 4, 2009 are shown in dark gray.
• The remaining States (light gray) were the main contributors to secondary outbreaks later in the year.
• The red dots mark states in the historical influenza corridor (Acuña-Soto, MD).!
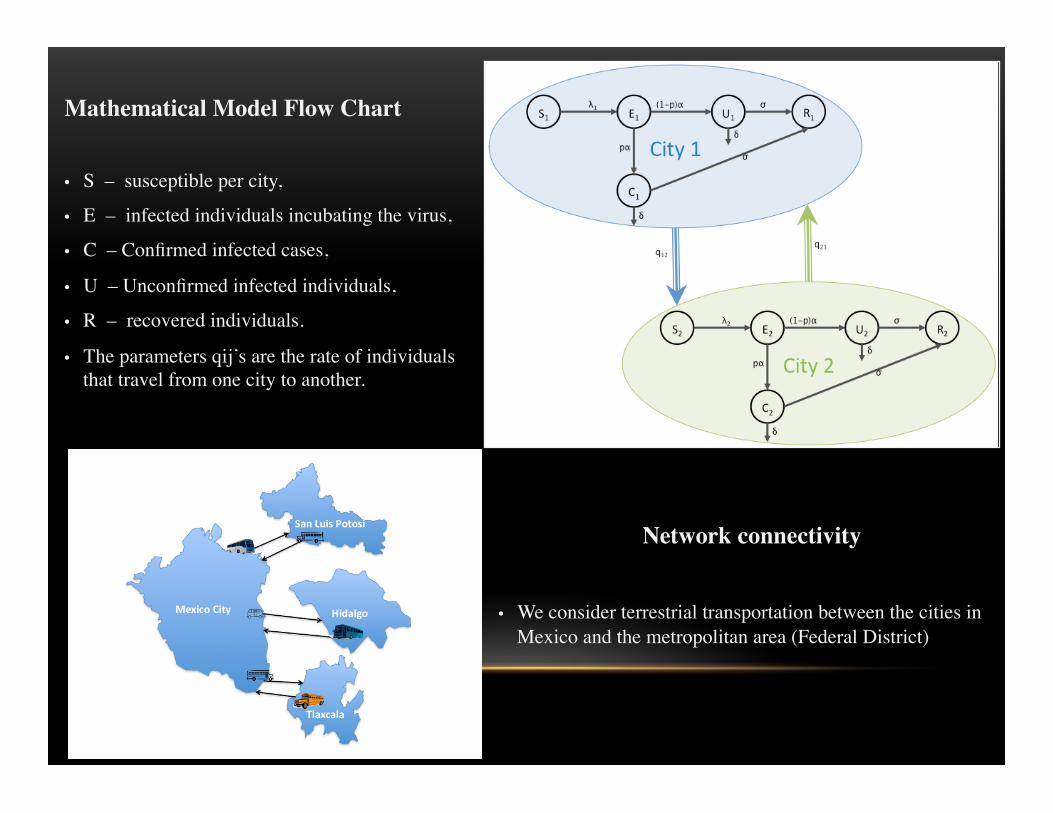
Mathematical Model Flow Chart!!
• S – susceptible per city, !
• E – infected individuals incubating the virus, !
• C – Confirmed infected cases, !
• U – Unconfirmed infected individuals, !
• R – recovered individuals. !
• The parameters qij’s are the rate of individuals that travel from one city to another.!
Network connectivity !!
• We consider terrestrial transportation between the cities in Mexico and the metropolitan area (Federal District)!
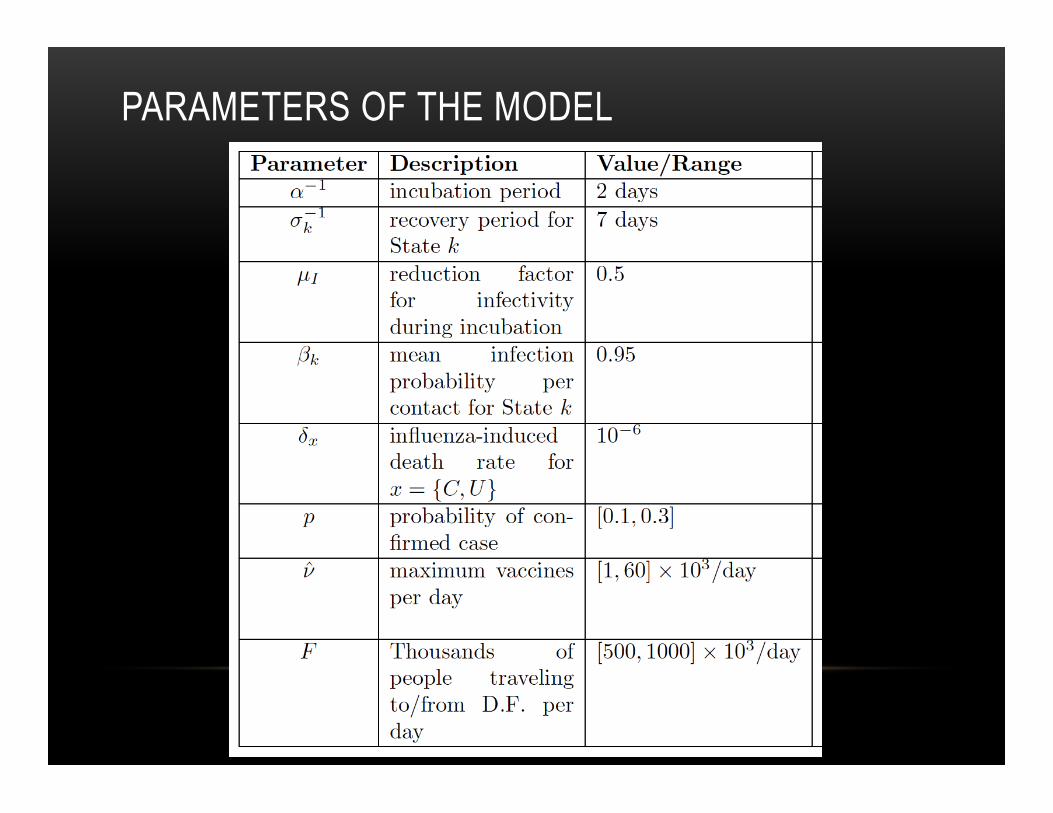
PARAMETERS OF THE MODEL
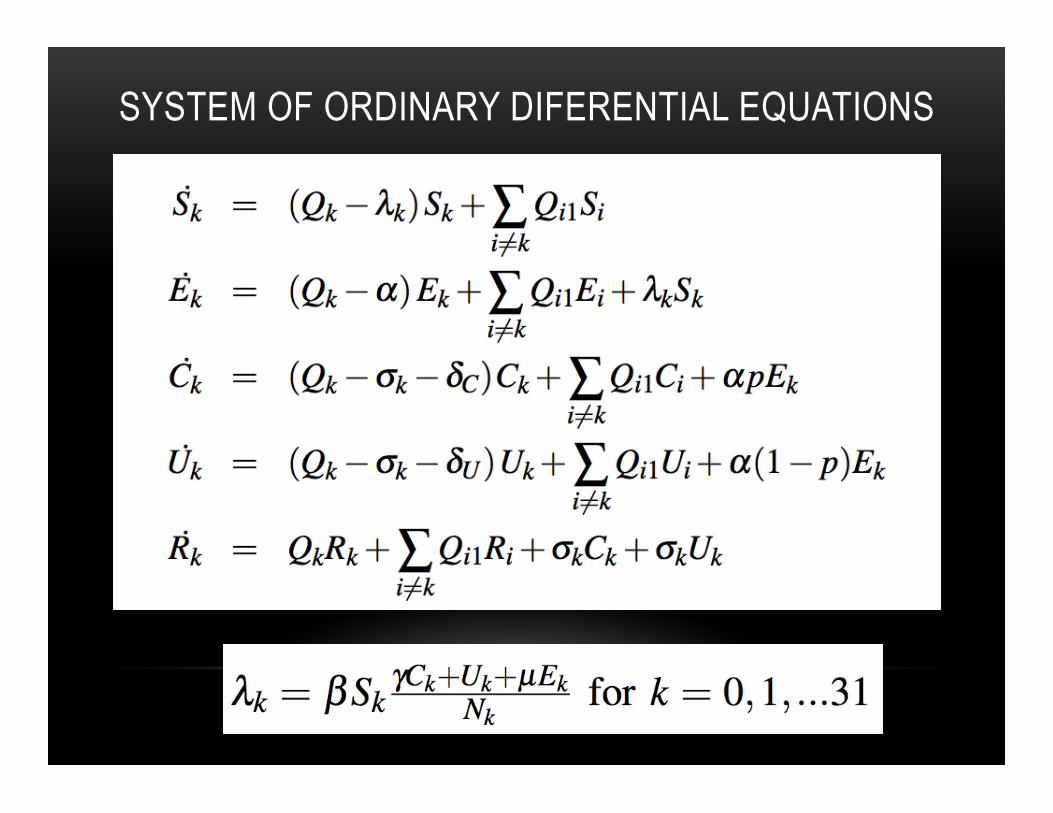
SYSTEM OF ORDINARY DIFERENTIAL EQUATIONS
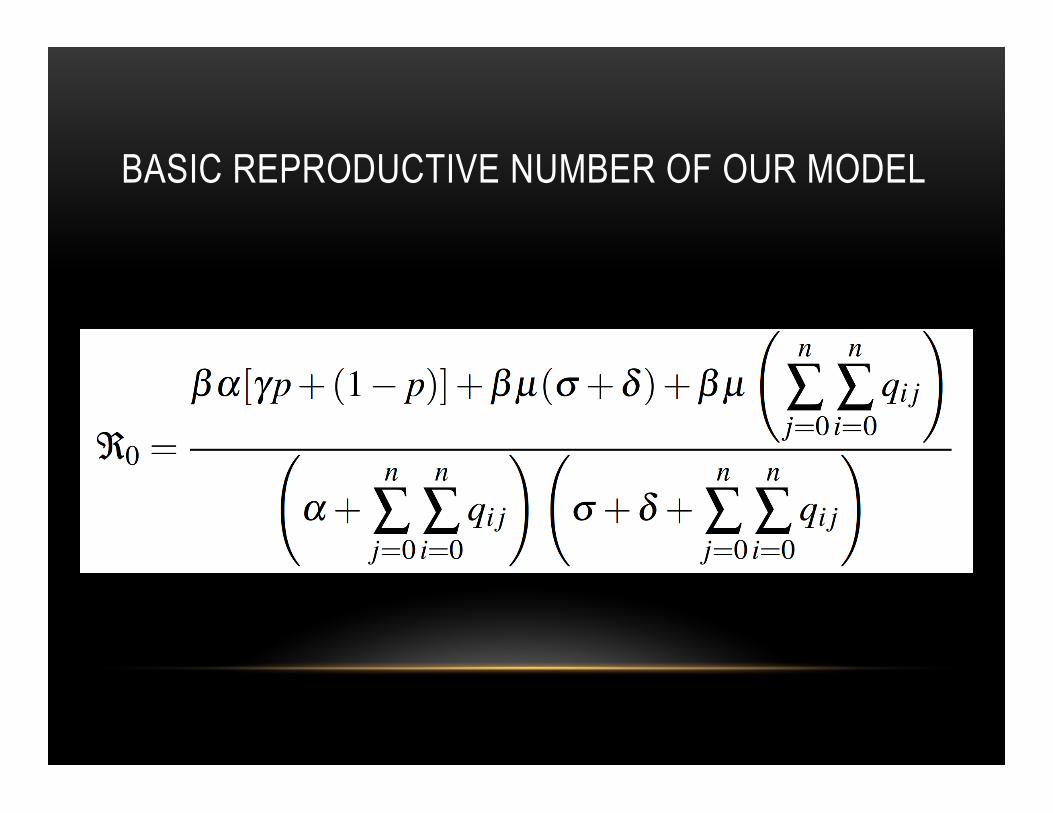
BASIC REPRODUCTIVE NUMBER OF OUR MODEL
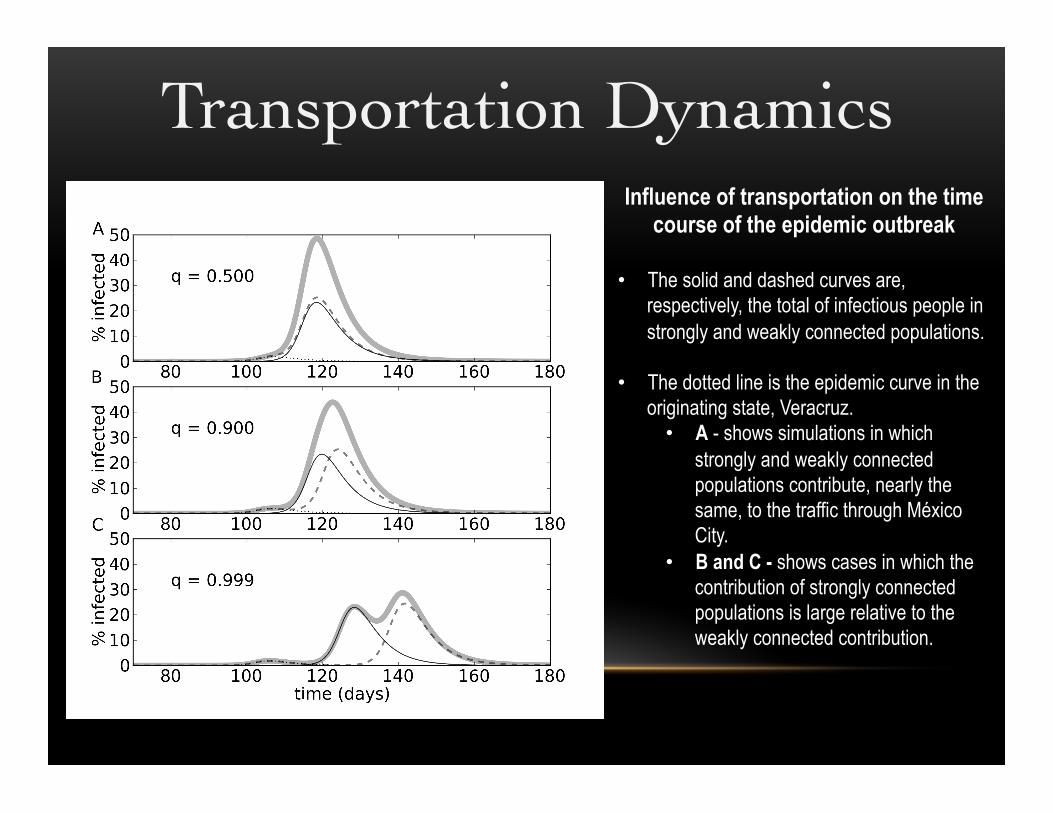
Influence of transportation on the time course of the epidemic outbreak
• The solid and dashed curves are,
respectively, the total of infectious people in strongly and weakly connected populations.
• The dotted line is the epidemic curve in the originating state, Veracruz.
• A - shows simulations in which strongly and weakly connected populations contribute, nearly the same, to the traffic through México City.
• B and C - shows cases in which the contribution of strongly connected populations is large relative to the weakly connected contribution.!
Transportation Dynamics!
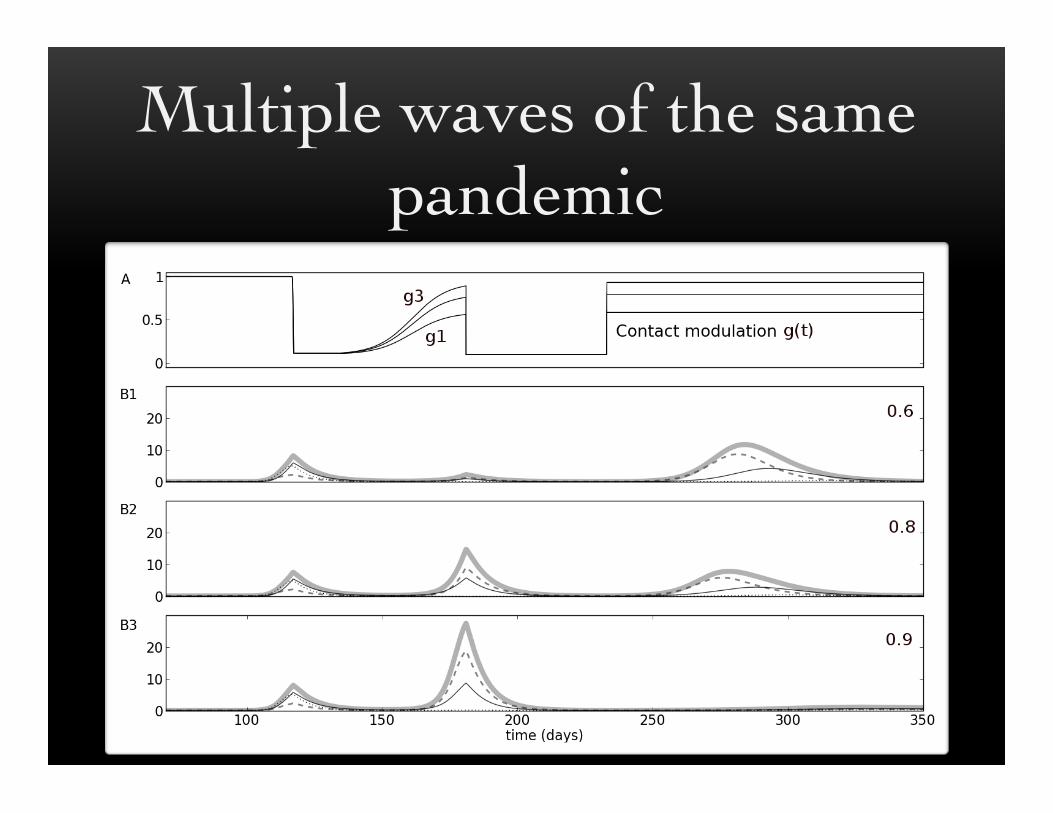
Multiple waves of the same pandemic!
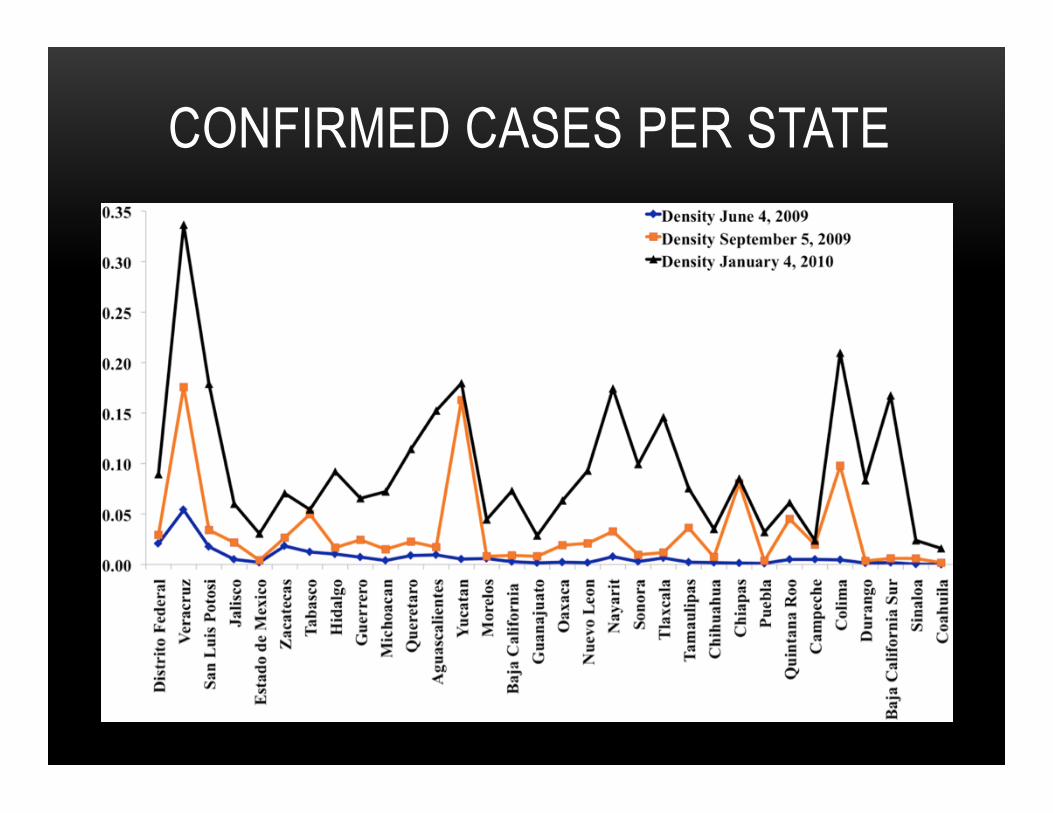
CONFIRMED CASES PER STATE
CONCLUSIONS • Transport and the partition of the population into weakly and strongly
connected states induces a delay in the dynamics.
• The modulation of the infection rate by social-distancing, school closures and the academic calendar is enough to explain the emergence of the multiple waves of infection.
• Early arrival of the vaccine will have had a significant impact on the time course of the epidemic if they where available.
• The intervention at the beginning of the April outbreak did mitigate the spread of the disease, but as a consequence generate two more waves and hence determined the shape of the data collected.
Scilab
SIMULATIONS
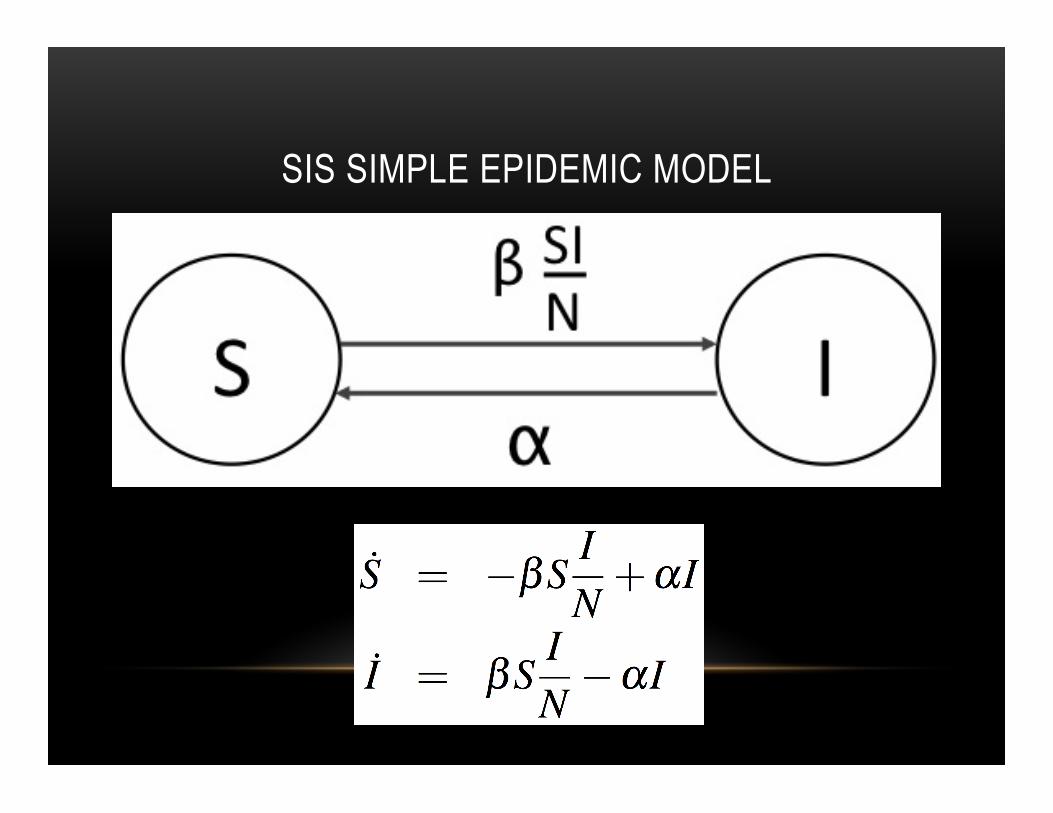
SIS SIMPLE EPIDEMIC MODEL

SIS MODEL SIMULATION
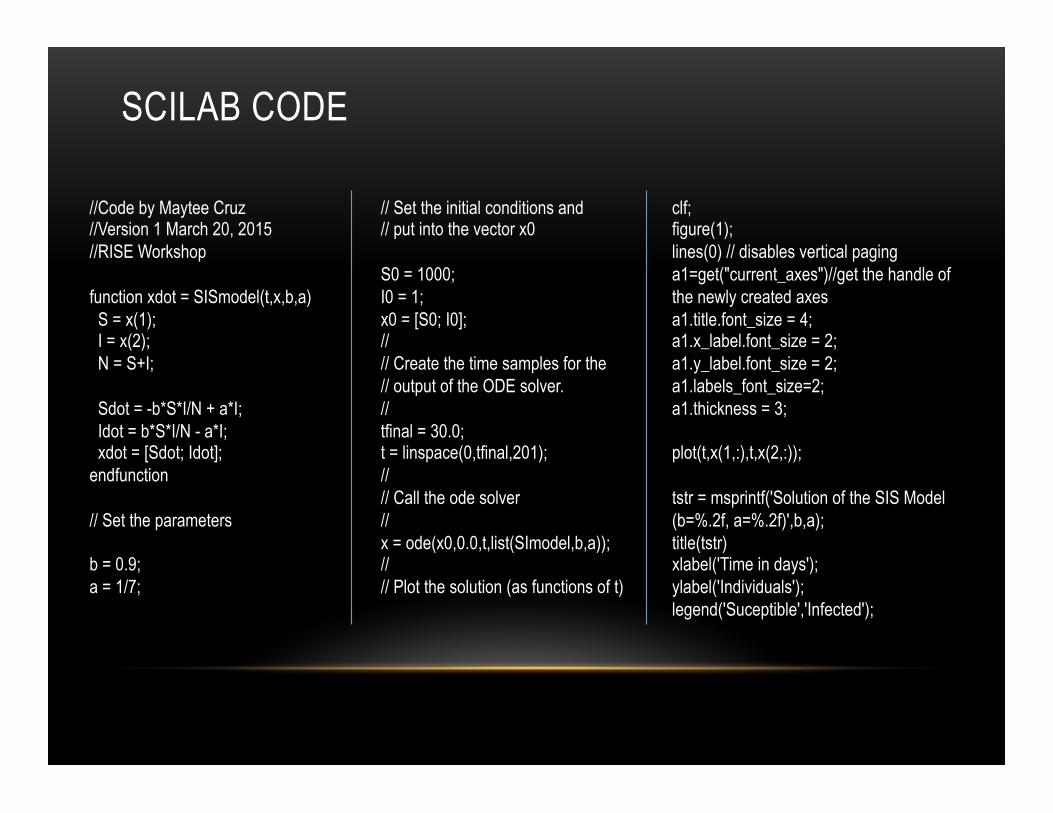
SCILAB CODE
//Code by Maytee Cruz //Version 1 March 20, 2015 //RISE Workshop function xdot = SISmodel(t,x,b,a) S = x(1); I = x(2); N = S+I; Sdot = -b*S*I/N + a*I; Idot = b*S*I/N - a*I; xdot = [Sdot; Idot]; endfunction // Set the parameters b = 0.9; a = 1/7;
// Set the initial conditions and // put into the vector x0 S0 = 1000; I0 = 1; x0 = [S0; I0]; // // Create the time samples for the // output of the ODE solver. // tfinal = 30.0; t = linspace(0,tfinal,201); // // Call the ode solver // x = ode(x0,0.0,t,list(SImodel,b,a)); // // Plot the solution (as functions of t)
clf; figure(1); lines(0) // disables vertical paging a1=get("current_axes")//get the handle of the newly created axes a1.title.font_size = 4; a1.x_label.font_size = 2; a1.y_label.font_size = 2; a1.labels_font_size=2; a1.thickness = 3; plot(t,x(1,:),t,x(2,:)); tstr = msprintf('Solution of the SIS Model (b=%.2f, a=%.2f)',b,a); title(tstr) xlabel('Time in days'); ylabel('Individuals'); legend('Suceptible','Infected');
ACTIVITY • With the basic SIR Model construct an SEIR model and add the
necessary lines of code to produce a graph with the 4 compartments.
• Think of a situation you want to model. Construct a model either epidemiological or social and identify the compartmental definitions and parameters needed for it.

http://www.phdcomics.com/comics.php?f=1789