California Energy Commission 2015 EPIC Annual Report Project ...

E P I C F i n a l R e p o r t
Program Electric Program Investment Charge (EPIC)
Administrator San Diego Gas & Electric Company
Project Number EPIC-2, Project 4
Project Name System Operations Development and Advancement
Date December 31, 2017

System Operations Development and Advancement Demonstration
ii
Attribution
This comprehensive final report documents the work done in this EPIC project.
The project team for this work included the following individuals, listed alphabetically by last name.
Internal SDG&E Staff:
Alexander Jay Bick
Mike Espinoza
Frank Goodman
Zoltan Kertay
Iman Mazhari
Prajwal Raval
Kevin Roll
Amin Salmani
Marvin Zavala-Iraheta
Quanta Technology:
Ali Bidram
Shadi Chuangpishit
Masoud Davoudi
Farid Katiraei
Bahman Koosha
Dino Lelic
Zhuoning Liu
Ahmadreza Momeni
Baharak Soltani
Nima Yousefpoor
Amin Zamani
Smarter Grid Solutions:
Chad Abbey
Craig Breaden
Fraser Watson
Richard West

System Operations Development and Advancement Demonstration
iii
EXECUTIVE SUMMARY
This executive summary outlines the work performed and findings of EPIC-2, Project 4, System Operations Development and Advancement.
Project Objective and Focus The objective of this project was to support continued modernization of SDG&E’s power system via demonstrations of improved capabilities in system operations. The project demonstrated a systematic process for the realignment of operating practices with advances in technology, software, and standards used in the power system.
The chosen focus of this project was a pre-commercial demonstration of prospective changes in the control structure of distribution systems under the presence of distributed energy resources (DERs) to address new monitoring and control requirements, including (but not limited to):
From control perspective: DER production control, DER reactive power control, and voltage and reactive power (Volt/VAr) optimization on the secondary side of distribution service transformers.
From monitoring and recording perspective: intermittent and firm power production monitoring, short-term generation forecasting, reserve capacity estimate, and aggregation of centralized and distributed resources.
This project focused on a distributed, autonomous, and scalable architecture, which includes robust communication architecture and a hardware and software platform for aggregating and dispatching coordinated net-load resources (the difference between the load and power from DER in localized regions of the distribution system). The architecture includes a concept of Localized Residential Aggregation and Monitoring (LRAMs) and Regional Aggregation, Monitoring and Circuit Optimizer (RAMCOs) for control and aggregation of customer-owned distributed generation and controllable loads on distribution systems.
Project Methods A project team was formed, which consisted of internal SDG&E technical staff, a contractor, and a subcontractor. The project team prepared the functional requirements for a distributed control platform and two new aggregation methods for managing large numbers of DERs of various nature (firm and variable) and of different sizes, distributed across the system and connected at primary and/or secondary systems. The functional requirements were discussed with various stakeholders to ensure broad agreement and acceptance among planning engineers and system operators.
A scaled down version of the control platform involving two RAMCOs and eight LRAMs was designed and implemented in the laboratory environment (pre-commercial demonstration system) to evaluate the proposed operating procedures and feasibility of aggregating and remote control in a coordinated fashion to achieve the assigned regional and/or local active and reactive targets. Several use cases were defined and tested to assess various proposed operating procedures and near-real time control and monitoring functionalities of the aggregation platform.
Conclusions and Key Findings In this project, a highly distributed and modularly scalable control platform for monitoring, aggregation and control of DERs was proposed and demonstrated.

System Operations Development and Advancement Demonstration
iv
Through use cases and evaluation of test results, it was concluded that DERs in secondary systems can play an essential role in supporting primary DERs for the purpose of emergency dispatch, voltage and reactive power control. One of the salient features of the proposed control platform was the ability to control and utilize DERs on the secondary of service transformers (secondary systems). It was concluded that the proposed control platform can provide a promising solution for aggregating and managing control and operating of non-conventional resources – both utility-owned and non-utility-owned - such as solar PV systems, ESS units, electric vehicles, and controllable loads. The control platform is able to control and monitor the primary and secondary DERs in the system and provides a separate communication path from SCADA to DERs, which results in the improved reliability of control system.
Two of the secondary Volt/VAr regulating devices were successfully type tested and reviewed. Type testing of secondary system technologies showed that secondary Volt/VAr regulating devices from two different vendors provide promising solutions for secondary voltage regulation, localized reactive power compensation, and interaction with customer resources downstream of services transformers.
Recommendations The key recommendations are:
It is recommended that the operating practices introduced in this project be further examined
for their commercial viability. The investigation should cover both utility-owned and non-utility
assets to specify proper circuit level and service level aggregators and associated
control/operation functions. A business case would need to be developed.
To transition the proposed aggregation system to the product stage for deployment and
operation in real-world distribution systems, the following steps are recommended.
o Integration between DMS/SCADA and DER aggregation platform at control center level is
recommended, so data and target system configuration and topology can be seamlessly
exchanged between the field aggregators and control center platforms to avoid adverse
effect on system operation, power quality and device to device coordination.
o For the above-mentioned points, it is recommended to develop requirements for standard
platforms for integrating DMS/SCADA and DER aggregation as part of the control center
functions to properly utilize the existing controls, models, databases and the two-way
status communications.
o It is recommended to incorporate the proposed DER aggregation system into a field
message bus platform that can accommodate all DER assets and the platform can be easily
scaled up.
o A pilot project incorporating part of distribution systems is recommended to learn
unknown (field specific) challenges and to test real-world issues. The pilot project would
also clarify the skills development and training requirements needed for widespread
commercial adoption of the demonstrated concepts.
As a next step, it is recommended to assess performance of various control and monitoring schemes of the proposed aggregation platform from the real-world field deployment perspective to examine the scalability and reliability requirements in an actual distribution system environment.

System Operations Development and Advancement Demonstration
v
TABLE OF CONTENTS
EXECUTIVE SUMMARY .......................................................................................................... III
LIST OF ACRONYMS AND ABBREVIATIONS ............................................................................ XI
1 INTRODUCTION ............................................................................................................ 13
1.1 Project Objective .................................................................................................................... 13
1.2 Project Focus .......................................................................................................................... 13
1.3 Summary of Project’s Scope of Work and Approach ............................................................. 14
Project Plan ............................................................................................................... 14
Approach Utilized in Undertaking this Project .......................................................... 14
2 DESIGN AND TESTING ................................................................................................... 19
2.1 Baseline Evaluation and Analysis ........................................................................................... 19
Present Architecture of Distribution System Control and Operation ....................... 19
Future Needs and Advancement of System Operation ............................................ 24
2.2 Concept of Operations (CONOPS) .......................................................................................... 24
System Architecture .................................................................................................. 24
DSO Operating Principles .......................................................................................... 25
Use Cases .................................................................................................................. 30
2.3 Design of Test System ............................................................................................................ 33
Circuit Selection Criteria ........................................................................................... 33
Test System Development and Layout ..................................................................... 37
2.4 Test System Setup and Integration ........................................................................................ 40
Type Testing of Secondary System Technologies ..................................................... 40
Factory Acceptance Test (FAT) .................................................................................. 43
Site Acceptance Test (SAT) ........................................................................................ 45
2.5 Demonstration of Control and Operation Concept ............................................................... 48
3 PROJECT RESULTS ......................................................................................................... 50
3.1 Sample Test Results ............................................................................................................... 52
Case 1-5: Variable market price (Load Management/Near Real Time-Resource Aggregation) .............................................................................................................. 53
Case 2-3-1: Change of DSO target (Emergency Dispatch of DERs) ........................... 57
Case 2-4-1: LRAM dispatching when all primary DERs are off (Emergency Dispatch of DERs) ...................................................................................................... 62
Case 3-1: Reactive power management: .................................................................. 67
4 KEY FINDINGS AND OPERATIONAL PROCEDURE EVALUATION ....................................... 70
4.1 Key Findings ........................................................................................................................... 70
4.2 System Operation Procedure Evaluation ............................................................................... 72

System Operations Development and Advancement Demonstration
vi
5 SUMMARY OF RECOMMENDATIONS AND NEXT STEPS .................................................. 74
6 METRICS AND VALUE PROPOSITION .............................................................................. 75
6.1 Metrics ................................................................................................................................... 75
6.2 Primary Value Proposition ..................................................................................................... 78
Greater Reliability ..................................................................................................... 78
Lower Costs ............................................................................................................... 78
6.3 Secondary Value Proposition ................................................................................................. 78
Increased Safety and/or Enhanced Environmental Sustainability ............................ 78
Adaptability to other utilities and/or the broader industry...................................... 78
7 REFERENCES ................................................................................................................. 79
8 APPENDICES ................................................................................................................. 80
8.1 Appendix A: RAMCO/LRAM Priority Stacks for Emergency Dispatch of DERs for Demand Side Management Use Case .................................................................................... 80
8.2 Appendix B: Test Plan and Results for Type Tests of Secondary Regulating Devices ............ 83
Type Test Plan ........................................................................................................... 84
Type Test Results ...................................................................................................... 89
8.3 Appendix C: FAT Test Plan and Results .................................................................................. 96
FAT Test Plan ............................................................................................................. 96
FAT Test Results ........................................................................................................ 98
8.4 Appendix D: Demonstration Test Results ............................................................................ 104
Use Case 1: Load Management ............................................................................... 104
Use Case 2: Emergency Dispatch of DERs ............................................................... 122
Use Case 3: Reactive Power Management ............................................................. 141

System Operations Development and Advancement Demonstration
vii
List of Figures
Figure 2-1. Simplistic Representation of Conventional Distribution Control System ................................. 20 Figure 2-2. Proposed Aggregator-Base Architecture .................................................................................. 26 Figure 2-3. Simplified Single Line Diagram of Selected Circuits .................................................................. 35 Figure 2-4. Proposed Digital Simulation Platform and PHIL Testbed Configuration for Demonstration of RAMCO/LRAM Concept .............................................................................................................................. 38 Figure 2-5. Testbed Installed at ITF ............................................................................................................. 39 Figure 2-6 Type test system layout ............................................................................................................. 42 Figure 2-7. Illustration of Test Setup for FAT .............................................................................................. 44 Figure 3-1. DSO HMI in case 1-5-2: energy price is $170 per MWh ........................................................... 54 Figure 3-2. DSO HMI in case 1-5-2: energy price is $40 per MWh.............................................................. 55 Figure 3-3. Setpoints and measurements for RAMCO 1 bulk resources in case 1-5-2 ............................... 55 Figure 3-4. RAMCO 1 real power target and response, and response of primary connected assets associated with price drop .......................................................................................................................... 56 Figure 3-5. BESS11 power measurements in case 1-5-2 ............................................................................. 56 Figure 3-6. BESS21 power measurements in case 1-5-2 ............................................................................. 57 Figure 3-7. DSO HMI in case 2-3-1: DSO target is 12 MW .......................................................................... 58 Figure 3-8. RAMCO 1 HMI: Plot for RAMCO 1 power setpoint in case 2-3-1 ............................................. 58 Figure 3-9. RAMCO 2 HMI: Plot for RAMCO 2 power setpoint in case 2-3-1 ............................................. 59 Figure 3-10. BESS11 and BESS21 P measurements in case 2-3-1 ............................................................... 60 Figure 3-11. PV11, PV21, and FG21 P measurements in case 2-3-1 ........................................................... 60 Figure 3-12. LRAMs 1 to 4 real power target and responses for DSO contribution target change from 12 MW to -4MW .............................................................................................................................................. 61 Figure 3-13. RAMCO HMI in case 2-3-1 ...................................................................................................... 62 Figure 3-14. DSO HMI in case 2-4-1: DSO target is 250kW ......................................................................... 63 Figure 3-15. RAMCO 1 HMI: Plot for RAMCO 1 power setpoint in case 2-4-1 ........................................... 63 Figure 3-16. RAMCO 2 HMI: Plot for RAMCO 2 power setpoint in case 2-4-1 ........................................... 64 Figure 3-17. RAMCO 1 HMI in case 2-4-1 .................................................................................................... 66 Figure 3-18. LRAM 24 setpoints in case 2-4-1............................................................................................. 66 Figure 3-19. Primary DERs reactive power target and measurement for each RAMCO ............................ 68 Figure 3-20. HMI screenshot for RAMCO2 LRAMs with DSO Q target at -7 MVAr ..................................... 69 Figure 3-21. Reactive power contribution measurement for RAMCO 1 & 2 .............................................. 69 Figure 8-1. RMS Voltage Measurements for DUT A: Drop Off Voltage Test............................................... 90 Figure 8-2. RMS Voltage Measurements for DUT A: Voltage Ramp Test ................................................... 91 Figure 8-3. Phase 1 P, Q & PF Measurements of Power Factor Regulation Test ........................................ 91 Figure 8-4. RMS Voltage Measurements for DUT B: Drop Off Voltage Test ............................................... 93 Figure 8-5. RMS Voltage Measurements for DUT B: Voltage Ramp Test ................................................... 94 Figure 8-6. Active and Reactive Power Measurements for DUT B: Reactive Power Test ........................... 95 Figure 8-7. RMS Voltage Measurements for DUT B Reactive Power Test .................................................. 95 Figure 8-8. Snapshot of DSO HMI (Top) and RAMCO HMI (Bottom) for the selected Case ..................... 101 Figure 8-9. Snapshot of DSO HMI (Top) and RAMCO HMI (Bottom) for Target=4MW ............................ 102 Figure 8-10. Snapshot of DSO HMI (Top) and RAMCO HMI (Bottom) for Target=6MW .......................... 103 Figure 8-11. DSO HMI in case 1-1-1 .......................................................................................................... 105 Figure 8-12. RAMCO 1 HMI in case 1-1-1 .................................................................................................. 105 Figure 8-13. RAMCO 2 HMI in case 1-1-1 .................................................................................................. 106 Figure 8-14. RAMCO 1 HMI: Plot for RAMCO 1 power setpoint in case 1-1-1 ......................................... 106 Figure 8-15. RAMCO 2 HMI: Plot for RAMCO 2 power setpoint in case 1-1-1 ......................................... 106

System Operations Development and Advancement Demonstration
viii
Figure 8-16. DSO HMI in case 1-1-2 .......................................................................................................... 107 Figure 8-17. RAMCO 1 HMI in case 1-1-2 .................................................................................................. 107 Figure 8-18. RAMCO 2 HMI in case 1-1-2 .................................................................................................. 108 Figure 8-19. RAMCO 1 HMI: Plot for RAMCO 1 power setpoint in case 1-1-2 ......................................... 108 Figure 8-20. RAMCO 2 HMI: Plot for RAMCO 2 power setpoint in case 1-1-2 ......................................... 108 Figure 8-21. DSO HMI in case 1-2-1 .......................................................................................................... 109 Figure 8-22. RAMCO 1 HMI in case 1-2-1 .................................................................................................. 110 Figure 8-23. RAMCO 2 HMI in case 1-2-1 .................................................................................................. 110 Figure 8-24. RAMCO 1 HMI: Plot for RAMCO 1 power setpoint in case 1-2-1 ......................................... 110 Figure 8-25. RAMCO 2 HMI: Plot for RAMCO 2 power setpoint in case 1-2-1 ......................................... 111 Figure 8-26. DSO HMI in case 1-2-2 .......................................................................................................... 111 Figure 8-27. RAMCO 1 HMI in case 1-2-2 .................................................................................................. 112 Figure 8-28. RAMCO 2 HMI in case 1-2-2 .................................................................................................. 112 Figure 8-29. RAMCO 1 HMI: Plot for RAMCO 1 power setpoint in case 1-2-2 ......................................... 112 Figure 8-30. RAMCO 2 HMI: Plot for RAMCO 2 power setpoint in case 1-2-2 ......................................... 113 Figure 8-31. DSO HMI in case 1-3-1 .......................................................................................................... 114 Figure 8-32. RAMCO 1 HMI in case 1-3-1 .................................................................................................. 114 Figure 8-33. RAMCO 2 HMI in case 1-3-1 .................................................................................................. 115 Figure 8-34. RAMCO 1 HMI: Plot for RAMCO 1 power setpoint in case 1-3-1 ......................................... 115 Figure 8-35. RAMCO 2 HMI: Plot for RAMCO 2 power setpoint in case 1-3-1 ......................................... 115 Figure 8-36. DSO HMI in case 1-3-2 .......................................................................................................... 116 Figure 8-37. RAMCO 1 HMI in case 1-3-2 .................................................................................................. 116 Figure 8-38. RAMCO 2 HMI in case 1-3-2 .................................................................................................. 117 Figure 8-39. RAMCO 1 HMI: Plot for RAMCO 1 power setpoint in case 1-3-2 ......................................... 117 Figure 8-40. RAMCO 2 HMI: Plot for RAMCO 2 power setpoint in case 1-3-2 ......................................... 117 Figure 8-41. DSO HMI in case 1-4-1 .......................................................................................................... 118 Figure 8-42. RAMCO 1 HMI in case 1-4-1 .................................................................................................. 119 Figure 8-43. RAMCO 2 HMI in case 1-4-1 .................................................................................................. 119 Figure 8-44. RAMCO 1 HMI: Plot for RAMCO 1 power setpoint in case 1-4-1 ......................................... 119 Figure 8-45. RAMCO 2 HMI: Plot for RAMCO 2 power setpoint in case 1-4-1 ......................................... 120 Figure 8-46. DSO HMI in case 1-4-2 .......................................................................................................... 120 Figure 8-47. RAMCO 1 HMI in case 1-4-2 .................................................................................................. 121 Figure 8-48. RAMCO 2 HMI in case 1-4-2 .................................................................................................. 121 Figure 8-49. RAMCO 1 HMI: Plot for RAMCO 1 power setpoint in case 1-4-2 ......................................... 121 Figure 8-50. RAMCO 2 HMI: Plot for RAMCO 2 power setpoint in case 1-4-2 ......................................... 122 Figure 8-51. DSO HMI in case 2-1-1 .......................................................................................................... 123 Figure 8-52. RAMCO 1 HMI in case 2-1-1 .................................................................................................. 123 Figure 8-53. RAMCO 2 HMI in case 2-1-1 .................................................................................................. 124 Figure 8-54. DSO HMI in case 2-1-2 .......................................................................................................... 124 Figure 8-55. RAMCO 1 HMI in case 2-1-2 .................................................................................................. 125 Figure 8-56. RAMCO 2 HMI in case 2-1-2 .................................................................................................. 125 Figure 8-57. RAMCO 1 HMI: Plot for RAMCO 1 power setpoint in case 2-1-2 ......................................... 125 Figure 8-58. RAMCO 2 HMI: Plot for RAMCO 2 power setpoint in case 2-1-2 ......................................... 126 Figure 8-59. DSO HMI before and after PV profile change in case 2-2 ..................................................... 127 Figure 8-60. RAMCO 1 HMI before and after PV profile change in case 2-2 ............................................ 128 Figure 8-61. RAMCO 2 HMI before and after PV profile change in case 2-2 ............................................ 129 Figure 8-62. RAMCO 1 HMI: Plot for RAMCO 1 power setpoint in case 2-2 ............................................. 129 Figure 8-63. RAMCO 2 HMI: Plot for RAMCO 2 power setpoint in case 2-2 ............................................. 130

System Operations Development and Advancement Demonstration
ix
Figure 8-64. RAMCO 1 HMI: Plot for RAMCO 1 power setpoint in case 2-3-2 ......................................... 131 Figure 8-65. RAMCO 2 HMI: Plot for RAMCO 2 power setpoint in case 2-3-2 ......................................... 131 Figure 8-66. RAMCO 1 HMI in case 2-4-2 .................................................................................................. 133 Figure 8-67. RAMCO 2 HMI in case 2-4-2 .................................................................................................. 133 Figure 8-68. RAMCO 1 HMI: Plot for RAMCO 1 power setpoint in case 2-4-2 ......................................... 134 Figure 8-69. RAMCO 2 HMI: Plot for RAMCO 2 power setpoint in case 2-4-2 ......................................... 134 Figure 8-70. DSO HMI for Circuit Topology 1 in case 2-5 .......................................................................... 135 Figure 8-71. DSO HMI when Circuit Topology changes from 1 to 2 in case 2-5 ....................................... 136 Figure 8-72. DSO HMI when the Circuit Topology changes from 2 to 1 in case 2-5 ................................. 136 Figure 8-73. DSO HMI when the Circuit Topology changes from 1 to 3 in case 2-5 ................................. 137 Figure 8-74. DSO HMI before and after PV11 outage in case 2-6 ............................................................. 138 Figure 8-75. RAMCO 1 HMI before and after PV11 outage in case 2-6 .................................................... 139 Figure 8-76. RAMCO 2 HMI before and after PV11 outage in case 2-6 .................................................... 140 Figure 8-77. RAMCO 1 HMI: Plot for RAMCO 1 power setpoint in case 2-6 ............................................. 140 Figure 8-78. RAMCO 2 HMI: Plot for RAMCO 2 power setpoint in case 2-6 ............................................. 140 Figure 8-79. RAMCO 2 HMI in case 3-2 ..................................................................................................... 141 Figure 8-80. RAMCO 1 HMI: Plot for RAMCO 1 power setpoint in case 3-2 ............................................. 142 Figure 8-81. RAMCO 2 HMI: Plot for RAMCO 2 power setpoint in case 3-2 ............................................. 142

System Operations Development and Advancement Demonstration
x
List of Tables
Table 2-1. Voltage Ranges for CVR and Non-CVR Circuits .......................................................................... 22 Table 2-2. DSO Operating Principles ........................................................................................................... 27 Table 2-3. DERs and LRAMs Designations in Topology 1 ............................................................................ 36 Table 2-4. DERs and LRAMs Designations in Topology 2 ............................................................................ 36 Table 2-5. DERs and LRAMs Designations in Topology 3 ............................................................................ 36 Table 2-6. Test Summary for FAT Test Categories ...................................................................................... 44 Table 2-7. Test Plan for Use Case 1 (Load Management/NRT Resource Aggregation) .............................. 46 Table 2-8. Test Plan for Use Case 2 (Emergency Dispatch of DERs) ........................................................... 47 Table 2-9. Test Plan for Use Case 3 (Reactive Power Management) .......................................................... 48 Table 3-1. Summary of Findings for Load Management Test Cases ........................................................... 50 Table 3-2. Summary of Findings for Emergency Dispatch Test Cases ........................................................ 51 Table 3-3. Summary of Findings for Reactive Power Management Test Cases .......................................... 52 Table 3-4. Settings for Case 1-5-2 ............................................................................................................... 53 Table 3-5. Setpoints for Case 1-5-2, price is $170/MWh ............................................................................ 53 Table 3-6. Setpoints for Case 1-5-2, price is $40/MWh .............................................................................. 54 Table 3-7. Changes in LRAM settings and their resources in case 2-4-1 .................................................... 64 Table 3-8. Summary of reactive power targets for each RAMCO and primary DERs ................................. 67 Table 6-1. Project Metrics ........................................................................................................................... 75 Table 8-1. Priority Stack of RAMCO1 in Topology 1 .................................................................................... 80 Table 8-2. Priority Stack of RAMCO1 in Topology 2 .................................................................................... 80 Table 8-3. Priority Stack of RAMCO1 in Topology 3 .................................................................................... 81 Table 8-4. Priority Stack of RAMCO2 in Topology 1 .................................................................................... 81 Table 8-5. Priority Stack of RAMCO2 in Topology 2 .................................................................................... 82 Table 8-6. Priority Stack of RAMCO2 in Topology 3 .................................................................................... 82 Table 8-7. Priority Stack of a typical LRAM ................................................................................................. 83 Table 8-8. Type Test Results Summary of DUT A for Each Test Category ................................................... 89 Table 8-9. Type Test Results Summary of DUT B for Each Test Category ................................................... 92 Table 8-10. Definition of Load and PV Profiles for Testing ......................................................................... 96 Table 8-11. Results of FAT for Communication Tests ................................................................................. 98 Table 8-12. SCADA Model Verification Test Cases .................................................................................... 100 Table 8-13. DSO/RAMCO Verification Test Cases ..................................................................................... 100 Table 8-14. Case 1-1 Category Test Cases ................................................................................................. 104 Table 8-15. Case 1-2 Category Test Cases ................................................................................................. 108 Table 8-16. Case 1-3 Category Test Cases ................................................................................................. 113 Table 8-17. Case 1-4 Category Test Cases ................................................................................................. 118 Table 8-18. Case 2-1 Category Test Cases ................................................................................................. 122 Table 8-19. Case 2-3 Category Test Cases ................................................................................................. 130 Table 8-20. Case 2-4 Category Test Cases ................................................................................................. 132

System Operations Development and Advancement Demonstration
xi
LIST OF ACRONYMS AND ABBREVIATIONS
ADMS Advanced DMS
AMI Advanced Metering Infrastructure
BESS Battery Energy Storage Systems
CAISO California ISO
CONOP Concept of Operation
CONOPS Concept of Operations
CVR Conservation Voltage Reduction
DER Distributed Energy Resources
DERMS Distributed Energy Resource Management System
DERS Distributed Energy Resources
DMS Distribution Management System
DOP Distribution Operation Procedures
D-SCADA Distribution SCADA
DSO Distribution System Operator
DUT Device under Test
DVC Dynamic Voltage Controller
EDO Electric Distribution Operation
EPIC Electric Program Investment Charge
ESS Energy Storage Systems
EV Electric Vehicle
EVSE Electric Vehicle Supply Equipment
FAT Factory Acceptance Test
FES Front End System
FG Firm Generation
FLISR Fault Location, Isolation, and Service Restoration
GIS Global Information System
HIL Hardware in-the-Loop
HMI Human–Machine Interface
IEC International Electro Technical Commission
IED Intelligent Electronic Devices
IG Intermittent Generation
ISO Independent System Operators
ITF Integrated Test Facility
kV Kilo Volts
kW Kilo Watt
LRAM Local Resource Aggregation and Monitoring

System Operations Development and Advancement Demonstration
xii
LTC Load Tap Changers
LV Low Voltage
MW Mega Watt
MWh Mega Watt Hour
NA Not Applicable
NMS Network Management System
NRT Near Real-Time
OMS Outage Management System
P.U. Per Unit
PEV Plug-in Electric Vehicles
PF Power Factor
PHIL Power Hardware-in-Loop
POI Point of Interconnection
PV Photovoltaic
RAMCO Regional Aggregation, Monitoring and Circuit Optimizers
RFP Request for Proposal
RMS Root-Mean Square
SAT Site Acceptance Test
SCADA Supervisory Control And Data Acquisition
SCOM System Communications
SDG&E San Diego Gas & Electric
SOC State of Charge
SVVR Secondary Volt/VAr Regulating
VAr Volt Ampere Reactive
VR Voltage Regulators
VVC Volt/VAr Control
VVO Volt/VAr Optimization

System Operations Development and Advancement Demonstration
13
1 INTRODUCTION
1.1 Project Objective
The objective of this project was to support continued modernization of SDG&E’s power system via demonstrations of improved capabilities in system operations. The project demonstrated a systematic process for the realignment of operating practices with advances in technology, software, and standards used in the power system. The realignment was broad, and addressed system integration issues, training programs, worker skill sets, and workforce readiness.
1.2 Project Focus
The focus of this project was to evaluate and demonstrate the changes in the control structure of distribution systems under the presence of Distributed Energy Resources (DERs) to address control objectives such as active and reactive power control and Volt/r control at both medium voltage level (primary system) and the secondary side of service transformers (secondary systems). For this purpose, the addition of aggregators to the distribution system control structure at both regional and local levels was proposed. The introduction of Regional Aggregation, Monitoring and Circuit Optimizers (RAMCO) and Local Resource Aggregation and Monitoring (LRAM) platforms enabled the proposed distribution control methodology to effectively coordinate and manage the operation of existing legacy and future control devices.
RAMCOs were envisioned to control large DERs that are directly connected to primary distribution feeders such as centralized MW size PV systems, and feeder/substation level battery energy storage systems (BESSs). LRAMs were designed to control and interact with smaller size DERs connected to the secondary side of service transformers in residential and small commercial level (secondary systems). In other words, LRAMs had autonomous control over the local resources to meet the RAMCO assigned targets.
The locations of RAMCOs and LRAMs were determined based on the concentration of DERs, energy storage systems, controllable loads and electric vehicle supply equipment (EVSE). In the hierarchical control structure of distribution systems, Distribution System Operator (DSO) stands as the first hierarchy that forecasts the real-time available capacities in each region, determines the requirements to provide ancillary services accordingly, and sends out the capacity request signals to RAMCOs. Based on the received capacity signals, RAMCOs are responsible for determination and optimization of control points for DERs and LRAMs.
At the secondary systems level, LRAMs were responsible for managing the service transformers’ loading by controlling DERs, switchable loads, and charging level of Plug-in Electric Vehicles (PEVs). LRAMs use the aggregate charging demand, local production levels, and dynamic rating of service transformers to take effective actions to meet the RAMCO published target. In addition, they need to properly manage resources if the loading of service transformers gets close to its dynamic rating.

System Operations Development and Advancement Demonstration
14
1.3 Summary of Project’s Scope of Work and Approach
Project Plan
This project was completed in two phases:
Phase 1 covered the tasks associated with selection of project technical lead, the project team,
development of project plan, and selection of the contractor.
Phase 2 had two parts: part 1 baseline evaluation and analysis, development of concept of
operations, and designing the test system. Part 2 - aimed to setup and integrate the test system,
conduct pre-commercial demonstration, evaluate the operational procedure, perform data
assimilation and analysis, and prepare a comprehensive final report.
Each phase included frequent discussion sessions and review meetings with the SDG&E project team and stakeholders, as well as a final report and presentation to SDG&E. Monthly status updates and reports were also provided in a pre-defined format.
Approach Utilized in Undertaking this Project
This section provides a detailed description of the work approach and methodology, and the required outcome and deliverables of each task.
The tasks associated with Phase 1 were:
Phase 1 - Task 1 - Team Formation and Project Plan
The SDG&E EPIC program manager identified the technical lead for the project based on experience and technical expertise. Later, the internal project team was formed by identification of technical skills and expertise available within the organization. After forming the internal project team, the task to develop the project plan was given to the technical lead. The technical lead with the help of the project team wrote the project plan as per the guidance provided by the SDG&E EPIC program manager adhering to EPIC guidelines.
Phase 1 - Task 2 - Procurement of Contractor Services
Scope of the work was identified and written for the part of the project that needed to be contracted out to the engineering consulting firm. Standard company practices were followed for contractor selection.
The tasks associated the Phase 2 were:
Task 1 - Project Kickoff Meeting, Stakeholder Consultations, and Work Plan
This task involved an in-person Project Kickoff Meeting between SDG&E stakeholders and project team to discuss and finalize project details. This meeting was arranged immediately with SDG&E's Project Technical Lead after confirmation of project approval and included internal project team and stakeholders (intended uses of project results), and key contractors and subcontractor personnel. The

System Operations Development and Advancement Demonstration
15
two main aspects discussed were project execution considerations and interfacing with the SDG&E project team.
Below is the summary of the outcomes and deliverables for this task:
Specification document was created for covering the project execution and interfacing logistics aspects discussed in the Kickoff Meeting (including project objectives, methodology, scheduling and resourcing plan, interface procedures, financial considerations, etc.). Additionally, a data request document was created for requesting details regarding SDG&E systems and practices.
Technology transfer aspect was given the highest priority. Throughout the project, key stakeholders and engineers from various department were included in the design and testing of the control system. The system operators and distribution planning group were key contributors in the development of the visualization screen, concept of operation document, and determination of priority stacks for managing DERs. In addition, several workshop and knowledge sharing sessions were held with the utility engineers and system operators to ensure they are fully informed about the system features and trained on utilizing the demonstration system. Below is a summary of various knowledge transfer sessions. The following meetings and workshops were held to share the information with various stakeholders and public:
Stakeholder fact finding workshop (April 2017): People from several department attended the workshop, discussing needs, gaps, and requirements of new systems.
Three full days of training and testing of the control platform in the lab as part of the acceptance testing and scheme verifications (July 2017): 3 people attended extensive acceptance testing.
Demonstration workshop of the tools and methodology (Oct 2017): workshop and knowledge transfer session at SDG&E on the project findings and recommendations.
It is proposed to share the project information in various workshop and taskforces focusing on DERs and voltage/reactive power management of the systems.
In addition, to further benefit the public, there are plans to publish conference papers and present at public forums on the project results.
Task 2 – Baseline Evaluation and Analysis
This task was performed in the following three stages:
Review and assessment of SDGE’s existing control strategies and operational practices
Assessment and prioritization of existing and futuristic operational practices in industry
Identification and selection of a circuit for test system
Task 3 – Concept of Operations (CONOPS)
This task involved the development of the overall concept of operations for the proposed aggregator-based technology including:
Developing a conceptual system architecture
Proposing system operational requirements
Developing use cases

System Operations Development and Advancement Demonstration
16
Proposing the control approaches
Determining the information exchange among system components
Task 4 – Design Test System
This task involved the development of the test plan and specification of the testbed with which to execute the test plan. This task was broken down into three distinct sub-tasks:
Development of testing aspects, requirements, and implementation for the evaluation and demonstration of the Concept of Operations defined in Task 3. Included in this was the definition of the devices and controls which were investigated in the testing procedure to implement the plan.
Type testing of the technologies which were included in the demonstration, to characterize and quantify performance and capability in a stand-alone environment (performance results of these devices are included in the following parts of this report).
Development of testbed for demonstration of CONOPS in a fully integrated system and hardware testbed environment.
Below is the summary of the outcomes and deliverables for this task:
Overview of the test plan and how it addresses the aspects and operational goals stated in the Concept of Operations from Task 3
Control algorithms to be used in the devices
Details on the test plan and use cases
Report on stand-alone type testing of hardware devices under investigation
Proposed PHIL testbed system architecture including:
Required hardware resources for construction of testbed and plan for integration
Distribution feeder model development and verification
Description of interfaces and intermediaries between software model and physical hardware
Task 5 –Test System Setup and Integration
This task involved the construction and integration of the proposed and agreed-upon PHIL testbed from Task 4. The following aspects were discussed:
Required hardware resources including digital simulation platform racks and I/O cards, grid simulators, load banks, DER, etc.
Efforts required for integration of hardware elements
Development of interfaces and intermediaries between hardware elements and the digital simulation platform
Testing efforts required to validate the testbed
Timeline and access considerations
Coordination and scheduling for the shipping of required hardware to the SDG&E testing facility
Coordination and scheduling for demonstrations
System Operations Development and Advancement Demonstration
17
In particular, various aspects of the test system development implementation were coordinated closely with the SDG&E Project Team to ensure that required resources, lab access schedule, and test demonstrations requirements were mutually agreed upon. Several validation tests were conducted on the hardware testbed to ensure that all hardware and software components and elements were correctly integrated. Once the test system setup and integration was finalized, the final site acceptance test (SAT) was performed at the SDG&E test facility.
Below is the summary of the outcomes and deliverables for this task:
Successful construction and integration of the software and hardware testbed proposed in Task 4 at SDGE’s Integrated Test Facility
Report on validation tests to ensure proper assembly and integration of the testbed
Coordination with SDG&E Project Team for evaluation and demonstration tests of the devices under investigation
Task 6 – Conduct Pre-Commercial Demonstration
This task covered the execution of the test plan developed in Task 4 to evaluate and demonstrate the capabilities and performance of the RAMCO/LRAM and control methodology. For each test, data gathering methodologies and procedures were defined. Included in the test plan were milestone tests; each of which defined when a particular operational aspect had been conclusively demonstrated, or whether further testing was required. The SDG&E Project Team were provided with the test plan prior to the scheduled demonstration tests.
Below is the summary of the outcomes and deliverables for this task:
Test plan applicability to Concept of Operations developed in Task 4
Development, integration, and validation of testbed and simulation assets
Test plan for validation and demonstration of operational concepts
Methodologies for analysis
Analysis of test results
Preliminary findings on viability of deployment of RAMCO/LRAM control methodology
Task 7 – Operational Procedure Evaluation and Advancement
This task utilized the knowledge gained and observations obtained from all other investigations and tests in the previous tasks to develop operating procedures and standards for the operation of the next generation of smart utilities. As a result of the new technologies and procedures, the distribution system design and planning methodology may need to be revisited and enhanced to incorporate some features offered by new technologies, particularly the value-added proposition of the aggregator-based control structure to increase the utilization factor of distribution-level DER assets.
Task 8 – Data Assimilation, Analysis, Formulation of Findings, Conclusions, and Recommendations
The project team collected data during testing performed at SDG&E ITF, and performed detailed analysis using the captured data, including functionality of control methodologies in the distribution system. The study also investigated the benefits, costs, challenges, and impact of adopted control structure on SDG&E distribution systems and equipment, particularly with respect to operational situations (use case

System Operations Development and Advancement Demonstration
18
scenarios). The analysis also covered the possible effects on system reliability, financial impacts, and improved service quality for customers.
The project team assessed the impacts of the deployed control structure on the interoperability, reliability, power quality, power losses, financial impacts, and improved/deteriorated service quality for customers. The project team used the measurements of power quality, and improvements in electrical efficiency and ability to meet conservation voltage reduction targets as metrics in the project.
Below is the summary of the outcomes and deliverables for this task:
Data analysis approach/methodology
Data analysis
Findings, conclusions, and recommendations
Key algorithms and parameter selections
Task 9 – Comprehensive Final Report
This final report was developed, which is a comprehensive record of the work, findings, and recommendations. The report is intended to enable stakeholders to understand and use the project’s output.

System Operations Development and Advancement Demonstration
19
2 DESIGN AND TESTING
This section discusses the work performed to design and prepare the control architecture and test system utilized in the project. As one of the initial tasks of the project, a comprehensive baseline evaluation and analysis was performed on the present architecture of distribution system control and operation in SDG&E to identify the future needs and advancement of system operation under the presence of DERs and controllable assets on the secondary systems. Based on the outcomes of baseline evaluation and analysis, the concept of operations for the demonstration system was prepared to propose the control architecture and define the use cases that meet the identified requirements of distribution systems in presence of DERs. One of the major tasks of this project was to design and setup the demo test system that fully meets the project objectives and requirements. The test system was envisioned to include DERs and controllable assets in both primary and secondary systems. In particular, for secondary systems, two of commercially available secondary system Volt/VAr regulation devices were selected and type tested to ensure that they fully fit into the project functional requirements. Factory Acceptance Test (FAT) was performed to verify the basic functionality of the proposed aggregator-based architecture. The project was involved with a final Site Acceptance Test (SAT) at SDG&E testing facility to ensure the proper operation of RAMCOs and LRAMs and the rest of the testbed for the final demonstration.
In the following subsections, first, baseline evaluation and analysis of present architecture of distribution system control and operation in the SDG&E context is discussed. Then, the project Concept of Operations are presented. Next, the test system design and circuit selection criteria are described. Finally, the type testing, acceptance test plans and results of the pre-commercial demonstrations are presented.
2.1 Baseline Evaluation and Analysis
The first part of this section provides information about the architecture of distribution system control and operation. Then, in the second part, the future needs and advancement of system operation is elaborated to address the ongoing changes in the control structure of distribution systems under the presence of DERs and controllable assets on the secondary of service transformers (secondary systems). Based on these requirements, an aggregator-based architecture is proposed which is able to control and utilize all controllable assets on primary and secondary systems. Finally, the criteria used to select the candidate circuits for testing the proposed architecture are summarized.
Present Architecture of Distribution System Control and Operation
Conventional distribution control systems tend to be centralized in nature. As shown in Figure 2-1 below, a central control center, namely SCADA, communicates with an array of substation and field-based Intelligent Electronic Devices (IEDs) – polling them on a periodic basis to extract digital and analog data, and issuing commands to control primary apparatus and reconfigure the system, as and when human operators deem it necessary. In this architecture, primary assets located on the primary side of service transformers (e.g., 12 kV level) are the main players that are monitored and controlled [1].

System Operations Development and Advancement Demonstration
20
Figure 2-1. Simplistic Representation of Conventional Distribution Control System
Generally speaking, SDG&E has been one of the early adopters of distribution system SCADA (D-SCADA) to achieve real-time monitoring and control of distribution substations and field assets as part of the primary distribution circuits. It should be noted that SDG&E uses a completely different package and vendor product for transmission SCADA. Hence, the term D-SCADA is used in this report to specifically refer to the distribution SCADA. D-SCADA coverage can be summarized as follows:
Over 80% of the distribution substations are covered by D-SCADA.
Not all the field devices are connected through SCADA.
Almost all protective devices at substations or on the circuits (such as circuit breakers and reclosers), and some tie-switches and sectionalizing switches are SCADA-enabled switching devices.
There are about 130 SCADA controlled capacitor banks on the distribution circuits. Only voltage measurement is available on some older generations of pole-mounted SCADA capacitors and some pad-mounted capacitors when they are in submersed Vault.
There are a few SCADA-enabled line voltage regulators; they only provide voltage measurement (neither the current nor tap position is monitored).
SDG&E also utilizes the Network Management System (NMS) platform that brings together the Outage Management System (OMS) and Distribution Management System (DMS). This OMS/DMS platform interfaces with D-SCADA for processing the monitored data points and for executing the control commands issued by the operators or automatically generated through automation schemes or group functions.
The D-SCADA is like a Front-End System (FES) for the NMS; it communicates bi-directionally with the substation and field devices and provides data to, and accepts controls from, the NMS. The NMS is the primary interface for the operators to control and monitor the system. However, because the D-SCADA

System Operations Development and Advancement Demonstration
21
preceded the NMS and was once used by the operators for control and monitoring, and since this functionality was never disabled, the D-SCADA can be used as a back-up to the NMS for operator control. In addition, the handling of some emergency situations, like rolling black-outs, fire threats, (involving disabling auto reclosers in the fire potential areas), or primary load shedding are strictly implemented in and executed from the D-SCADA.
The communications infrastructure that is presently used to enable D-SCADA control for the field devices has the following typical characteristics:
Serial communications are dominantly applied, one or a maximum of two substations presently using IP-based communications,
A mix of radio, T-lines, and in some cases fiber connections, are used for D-SCADA,
SCADA Caps work with 900MHz radio with fixed channel which supports multiple addresses,
There are no radio communications devices inside substations,
SCADA for circuit devices on distribution systems including SCADA Caps are based on legacy protocols (SCOM) and in some cases using DNP3 protocol; the plan is to convert all communications to DNP3,
SCADA measurements provide report by exception and at a fixed interval,
Information from SCADA goes to DMS/OMS and they get archived in PI Historian database.
The key control and automation functions are described below.
2.1.1.1 Localized (Circuit Based) Voltage and Reactive Power Control
The general approach for circuit voltage control and regulation under varying load conditions is based on using:
Load Tap Changers (LTC) on transformer banks at substation,
Fixed or switched shunt capacitors on circuits, close to load centers,
Line voltage regulators,
Shunt capacitors at substation.
From the design consideration, to maintain voltages, the primary solution is to install capacitors on the circuits near the load centers. The voltage regulators and LTCs are also used on long circuits and when multiple circuits are supplied from a single transformer bank. Urban dense circuits may only have one or two fixed and/or switched shunt capacitors, while long rural circuits can have a combination of several shunt capacitors (up to 4 or 5 switched capacitors) and two or three line voltage regulators per backbone to maintain voltage levels within permissible ranges.
SDG&E presently categorizes the distribution circuits in two types from the voltage control view:
a. Conservation voltage reduction (CVR) circuits b. Non-CVR circuits
The main difference between a CVR and Non-CVR circuit is the operating voltage range. The permissible voltage range for CVR and non-CVR circuits (normal circuit configuration) is given in the table below.
System Operations Development and Advancement Demonstration
22
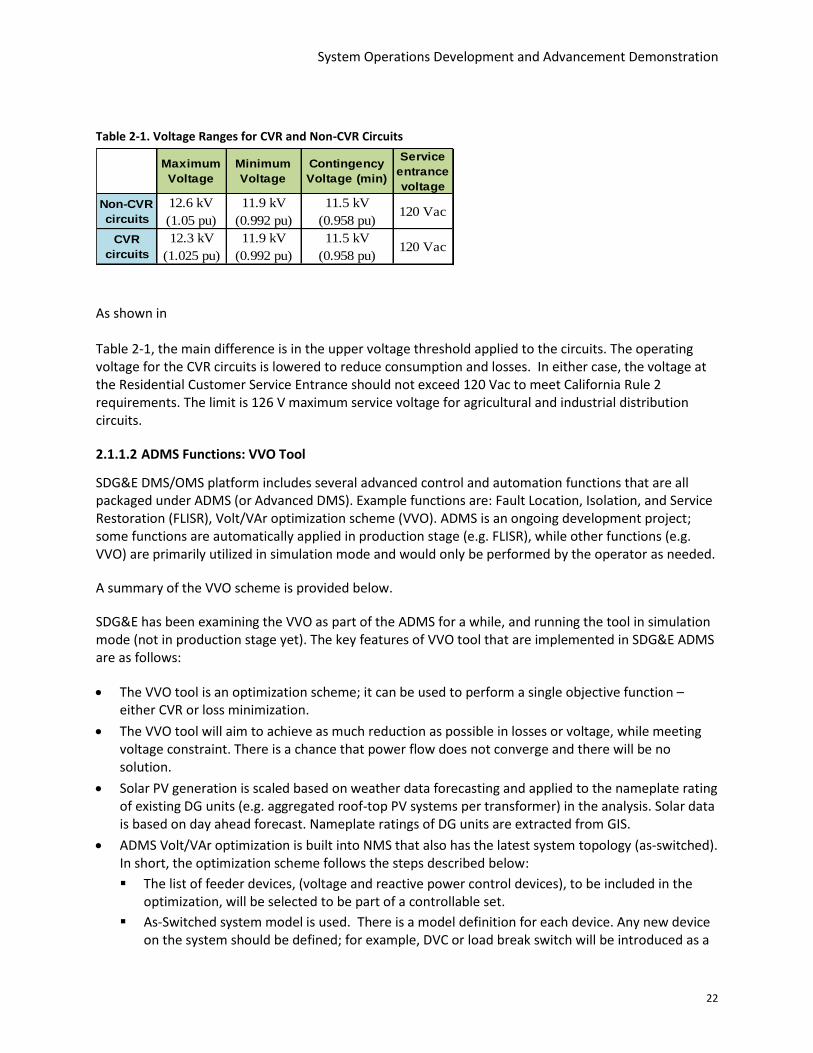
Table 2-1. Voltage Ranges for CVR and Non-CVR Circuits
As shown in Table 2-1, the main difference is in the upper voltage threshold applied to the circuits. The operating voltage for the CVR circuits is lowered to reduce consumption and losses. In either case, the voltage at the Residential Customer Service Entrance should not exceed 120 Vac to meet California Rule 2 requirements. The limit is 126 V maximum service voltage for agricultural and industrial distribution circuits.
2.1.1.2 ADMS Functions: VVO Tool
SDG&E DMS/OMS platform includes several advanced control and automation functions that are all packaged under ADMS (or Advanced DMS). Example functions are: Fault Location, Isolation, and Service Restoration (FLISR), Volt/VAr optimization scheme (VVO). ADMS is an ongoing development project; some functions are automatically applied in production stage (e.g. FLISR), while other functions (e.g. VVO) are primarily utilized in simulation mode and would only be performed by the operator as needed.
A summary of the VVO scheme is provided below.
SDG&E has been examining the VVO as part of the ADMS for a while, and running the tool in simulation mode (not in production stage yet). The key features of VVO tool that are implemented in SDG&E ADMS are as follows:
The VVO tool is an optimization scheme; it can be used to perform a single objective function – either CVR or loss minimization.
The VVO tool will aim to achieve as much reduction as possible in losses or voltage, while meeting voltage constraint. There is a chance that power flow does not converge and there will be no solution.
Solar PV generation is scaled based on weather data forecasting and applied to the nameplate rating of existing DG units (e.g. aggregated roof-top PV systems per transformer) in the analysis. Solar data is based on day ahead forecast. Nameplate ratings of DG units are extracted from GIS.
ADMS Volt/VAr optimization is built into NMS that also has the latest system topology (as-switched). In short, the optimization scheme follows the steps described below:
The list of feeder devices, (voltage and reactive power control devices), to be included in the optimization, will be selected to be part of a controllable set.
As-Switched system model is used. There is a model definition for each device. Any new device on the system should be defined; for example, DVC or load break switch will be introduced as a
Maximum
Voltage
Minimum
Voltage
Contingency
Voltage (min)
Service
entrance
voltage
Non-CVR
circuits
12.6 kV
(1.05 pu)
11.9 kV
(0.992 pu)
11.5 kV
(0.958 pu)120 Vac
CVR
circuits
12.3 kV
(1.025 pu)
11.9 kV
(0.992 pu)
11.5 kV
(0.958 pu)120 Vac

System Operations Development and Advancement Demonstration
23
library model using an existing template. Each model incorporates the basic nameplate data and control/operation characteristics.
Options for load profile, (real time 3 week rolling average, with specific load scaling factors to be incorporated), and voltage limits are considered:
Every transformer has profiles; load profile gets adjusted based on measurement at feeder head which will be applied to all loads.
Specific periods can be analyzed; it can look at daily peak or annual peak condition.
Scaling factor for load growth is considered; it can set desired voltage limits for the entire circuit.
Load model is based on 50% constant power and 50% impedance (profile has P and Q, scale each individual P and Q according to SCADA on feeder head).
Load profile for analysis is the key point:
Load per transformer is updated and adjusted to reflect contribution of distributed resources at the service transformer; this is the same planning load data that will be also used for any load restoration or load shedding purpose.
Load data is based on historical information, which is updated every day early morning for the representation of the power flow for that day.
Load data and transformer size are used to project secondary level voltage on 120V base for evaluation.
Real time and forecasted power flow solutions will take into account 48 hours of weather forecast data, or AMI data (imported once daily at 5:30am), for PV.
Based on ratings and types of DG the amount of generation is predicted; then, based on transformer profile, load is adjusted.
All solar PV systems are adjusted based on weather forecast (any size).
Batteries have profiles assigned to them based on applications, for instance a peak shaving profile.
All distributed resources are aggregated at service transformers
The plan is to run optimization every hour to obtain and update status of SCADA field devices (LTC, capacitors and voltage regulators).
To apply optimization data to the field, SCADA devices should be in manual mode to receive new commands, for instance, for tap position.
SCADA response for controlling field devices is about 3 to 5 seconds round trip; this includes status verification that a command was received by a field device.
Device actions and changes are determined from a priority list; for instance, tap changing has priority over capacitor switching. Priority selection is by assigning a number, a lower number means a higher priority.
The key aspect to consider is that VVO is an optimization tool that has to be executed by request or according to a pre-specified time schedule (for example, every day or every hour). The tool does not have the capability to be alerted of a high or low voltage situation, and initiate optimization to correct voltage issue within the given time schedule; however, an operator can re-run the tool on demand. Operators receive voltage alerts in SCADA and can re-run the VVO as needed.

System Operations Development and Advancement Demonstration
24
2.1.1.3 Field-Based Controls: DERMS
DERMS is considered as a control platform for monitoring and managing DERs that are SDG&E owned or third party owned and operated as parts of the key automation applications such as microgrids in the field. An example of DERMS is presently under implementation and testing within the SDG&E territory. This DERMS is specifically designed for substation microgrid. It primarily controls two diesel generators and battery energy storage systems (BESSs). The coordination between DERMS and D-SCADA is performed through a substation automation controller at the substation level. For the specific purpose of an application such as microgrid, if DERMS needs to open or close a primary feeder device (e.g. a recloser or a switched capacitor), the command has to be executed through the associated automation controller unit following pre-established distribution operation procedures (DOPs).
Future Needs and Advancement of System Operation
Due to the presence of DERs in distribution systems and controllable assets on the secondary systems, the addition of DSO and aggregators to the distribution system control structure at both regional and local levels is proposed. The introduction of RAMCOs and LRAMs is expected to enable the proposed distribution control methodology to effectively coordinate and manage the operation of existing legacy and future control devices.
RAMCOs are designed to control large DERs that are directly connected to primary distribution feeders such as centralized MW size PV systems, and feeder/substation level BESSs. LRAMs are designed to control and interact with smaller size DERs connected to the secondary side of service transformers in residential and small commercial level (secondary systems). In the hierarchical control structure of distribution systems, DSO, a supplement to SCADA and DMS, stands as the first hierarchy that forecasts the real-time available capacities in each region, determines the requirements to provide ancillary services accordingly, and sends out the capacity request signals to RAMCOs. It should be noted that DERMS is an intermediate step toward developing a full and comprehensive DSO integrated into SCADA. Based on the received capacity signals, RAMCOs are responsible for determination and optimization of control points for DERs and LRAMs. RAMCOs are envisioned to have peer-to-peer communication with each other and shall update their reserve capacity level and information at DSO level.
At the secondary systems level, LRAMs are envisioned to be responsible for managing the service transformers’ loading by controlling DERs, switchable loads and charging level, and the sequence and/or timing of charging for Plug-in Electric Vehicles (PEVs). LRAMs use the aggregate charging demand, local production levels, and dynamic rating of service transformers, and take effective actions to meet the RAMCO published target. In addition, they need to properly manage resources if the loading of service transformers gets close to its dynamic rating.
2.2 Concept of Operations (CONOPS)
System Architecture
The overall architecture of proposed aggregator-based control is shown in Figure 2-2. This architecture includes three main levels; control center, RAMCOs, and LRAMs, which are elaborated as follows:
Control Center: The control center brings together the Distribution Management System (DMS) and Distribution System Operator (DSO) which interface with the distribution SCADA (D-SCADA) system for processing the monitored data points and enables executing the control commands issued by the

System Operations Development and Advancement Demonstration
25
operators or automatically generated through automation schemes or group functions. The control center sits at the top of the control hierarchy, which consists of the DSO, the DMS and the SCADA. The DMS acts as a decision support system to assist the control room and field operating personnel with the monitoring and control of the electric distribution system. Improving the reliability and quality of service in terms of reducing outages, minimizing outage time, maintaining acceptable frequency and voltage levels are the key deliverables of a DMS. No forecasting is done at the DSO. The DSO receives load forecast from DMS/SCADA and resource estimate from RAMCOs. SCADA is the front-end system for the control center that handles all of the communications to field devices (i.e. RAMCOs), and the market operator. For the purposes of the project, the control center is modeled as a basic representation of the DSO and SCADA that allows manual changes to setpoints and control modes, and provides basic visualization of real-time values. Ultimately, this representation would need to be reflected in the deployed NMS to enable interaction with a field-deployed RAMCO [2].
RAMCO: The RAMCOs act as aggregators, providing an interface between upstream entities (e.g. a utility operation center or another aggregator), and various downstream DERs and customer loads. They receive the signals from the DSO and manage the control and optimization of the operating points of the primary DERs in the medium voltage level of distribution system, as well as the LRAMs, for meeting the capacity request command – for both real time capacity (power level) and reserve capacity (energy level on 5 minute basis).
RAMCOs are envisioned to control large DERs that are directly connected to primary distribution feeders, such as centralized utility size PV systems, feeder/substation level energy storage systems (ESSs), and downstream LRAMs. RAMCOs are assigned regionally according to the divisions defined by geographical or operating service similarities.
LRAM: LRAMs are envisioned to have autonomous control over the local resources to meet the assigned targets by the corresponding RAMCO. LRAMs are designed to control and interact with smaller size secondary DERs connected to the secondary side of service transformers at residential and small commercial levels (secondary systems). LRAMs are also responsible for managing thermal loading and any reverse power flow constraint on associated service transformers. In general, LRAMs deal with resources connected to secondary systems at a low-voltage side of service transformers, while RAMCOs manage a set of LRAMs and any individually controlled large-scale centralized DERs connected directly to medium voltages of a distribution system.
DSO Operating Principles
Table 2-2Error! Reference source not found. summarizes the principles that drive the DSO control commands to ensure a smooth and safe operation of the network. This table covers the proposed operating principles for the DSO. In this project, two overall operating modes are considered for DSO:
Normal: This mode is normally enabled under normal operating conditions when the control
actions requested by the DSO can be taken in a relatively longer time.
Emergency: In this mode, requested control actions from the controllers (RAMCO, LRAM, etc.)
should be taken in a shorter time frame than that of Normal mode. In other words, there is a
defined time from the instant the request is issued until it is executed.

System Operations Development and Advancement Demonstration
26
Figure 2-2. Proposed Aggregator-Base Architecture
RAMCO2 RAMCOnRAMCO1
Third Party Agg.
PV DR
EV
PV BESSPV BESS PV PV PV
LRAM3LRAM1
DES
PVPV
DRLRAM2
EV
DSO: Distribution System OperatorRAMCO: Regional Aggregation, Monitoring and Circuit Optimizers (at primary voltage)LRAM: Local Resource Aggregator (at service transformer)PV: Solar PhotoVoltaic DEREV: Electric VehicleDR: Loads as part of Demand ResponseBESS: Battery Energy Storage SystemDES: Distributed Energy StorageThird party aggregator
Secondary System
Technology
…
Secondary System
Technology
DSODMS
SCADA Head-End
RTU Field IEDs . . .
Control Center
Market Operator

System Operations Development and Advancement Demonstration
27
Table 2-2. DSO Operating Principles
DSO Mode Normal Emergency
Use case Near real-time resource aggregation
Circuit reconfiguration
Load management
Reactive power management for VVC on secondary system
Near real-time resource aggregation
Circuit reconfiguration
Emergency dispatch of DERs for demand side management
Triggering Event Every 5 min update in DSO
Switching device status (Tie Switch and reclosers 1 and 2)
Operator Operator Every 5 min update in DSO
Switching device status (Tie Switch and reclosers 1 and 2)
• Operator • Thermal limit violation (SCADA notification) • Load shedding request by CAISO
Act
or
DSO
Monitoring and resource aggregation on RAMCOs
Monitor the status of switching devices through SCADA and send appropriate Topology ID to RAMCOs.
• Receiving the market price signal • Calculating the overall reserve capacity (%) • Defining the contribution targets and SOC targets for RAMCOs
• Defining the reactive power contribution targets for RAMCOs • Defining the voltage target for RAMCOs (e.g., for CVR)
Monitoring and resource aggregation on RAMCOs
Monitor the status of switching devices through SCADA and send appropriate Topology ID to RAMCOs.
Defining the active power contribution target for RAMCOs considering thermal limits.
RA
MC
O
Monitoring and resource aggregation on primary DERs and LRAMs.
Use the lookup table and define LRAM IDs based on the Topology ID received from DSO.
• Define the active power contribution targets for LRAMs and primary DERs • Define SOC targets for LRAMs & primary BESS • Set the DER Q control to power factor control (pf=1 is target).
• Defining the reactive power contribution targets for LRAMs and primary DERs • Defining the voltage target for LRAMs (e.g., for CVR).
• Monitoring and resource aggregation on primary DERs and LRAMs • Set the DER Q control to V-Q droop at POI
Use the appropriate circuit topology lookup table based on the Topology ID received from DSO.
• Defining the active power contribution targets for LRAMs and primary DERs • Set the DER Q control to V-Q droop at POI
Pri
mar
y P
V
Primary PVs are in dynamic power factor control mode with the unity pf target at POI (12kV).
Primary PVs are in dynamic power factor control mode with the unity pf target at POI (12kV).
• Curtailment/restoration of active power based on the RAMCO command. • Reactive power of primary PVs are set at zero to meet unity power factor at POI (pf=1).
Primary PVs are in power factor control mode to meet the reactive power setpoint defined by RAMCO.
Primary PVs are utilized in V-Q droop control mode.
Primary PVs are utilized in V-Q droop control mode.
• Curtailment/restoration of active power based on RAMCO command. • Reactive power setpoint is defined by V-Q droop control.

System Operations Development and Advancement Demonstration
28
DSO Mode Normal Emergency
Use case Near real-time resource aggregation
Circuit reconfiguration
Load management
Reactive power management for VVC on secondary system
Near real-time resource aggregation
Circuit reconfiguration
Emergency dispatch of DERs for demand side management
Pri
mar
y B
ESS
BESS units are in dispatch mode with reactive power setpoint set at zero.
BESS units are in dispatch mode with reactive power setpoint set at zero.
• Charge/discharge based on RAMCO command • Alarm if SOC targets are violated. • Reactive power target is zero or defined by RAMCO (depending on DSO Ctrl Mode).
BESS units are in dispatch mode to meet the reactive power setpoint defined by RAMCO.
BESS units are utilized in Q-V droop control mode.
BESS units are utilized in Q-V droop control mode.
• Charge/discharge based on RAMCO commands • Reactive power setpoint is defined by V-Q droop control.
Pri
mar
y FG
Reactive power setpoint of primary FGs at POI (12kV) is set at zero.
Reactive power setpoint of primary FGs at POI (12kV) is set at zero.
• Primary FG units are used in dispatch mode to follow RAMCO P command • Reactive power setpoint of FGs is set at zero or defined by RAMCO (based on DSO Ctrl Mode)
FG units are in dispatch mode to meet the reactive power setpoint defined by RAMCO.
No reactive power control is done on FG units in emergency mode.
No reactive power control is done on FG units in emergency mode.
• Primary FG units are used in dispatch mode to meet RAMCO P command • No reactive power control by FG units in emergency mode.
LRAM
• Secondary voltage control at the customer terminal (pre-set voltage target is 118V-123V secondary). • Power factor should be maintained at unity at the secondary of service transformer (voltage control has the priority) * Monitoring and resource aggregation on secondary systems
• Secondary voltage control at the customer terminal (pre-set voltage target is 118V-123V secondary). • Power factor should be maintained at unity at the secondary of service transformer (voltage control has the priority) • Monitoring and resource aggregation on secondary systems
• Defining the targets for secondary DERs to meet the active power target defined by RAMCO (Load shedding is not allowed). • Secondary voltage control at the customer terminal (The voltage target is defined by RAMCO or is the preset voltage reference depending on DSO control mode). • Determine the SOC target for secondary ES. • Reactive power control at the secondary of service transformer to meet the target defined by RAMCO, or unity power factor (based on DSO control mode)
• Secondary voltage control at the customer terminal (voltage target is defined by RAMCO). • Reactive power control at the secondary of service transformer (Reactive power target of LRAMs is defined by RAMCO).
• Secondary voltage control at the customer terminal (pre-set voltage target is 118V-123V secondary). • Power factor should be maintained at unity at the secondary of service transformer (voltage control has priority) * Monitoring and resource aggregation on secondary systems
• Secondary voltage control at the customer terminal (pre-set voltage target is 118V-123V secondary). • Power factor should be maintained at unity at the secondary of service transformer (voltage control has priority) * Monitoring and resource aggregation on secondary systems
• Defining the targets for secondary DERs to meet the RAMCO active power target (non-critical load shedding is allowed) • Secondary voltage control at the customer terminal (pre-set voltage reference). • Power factor should be maintained at unity at the secondary of service transformer (voltage control has priority)

System Operations Development and Advancement Demonstration
29
DSO Mode Normal Emergency
Use case Near real-time resource aggregation
Circuit reconfiguration
Load management
Reactive power management for VVC on secondary system
Near real-time resource aggregation
Circuit reconfiguration
Emergency dispatch of DERs for demand side management
Secondary PV
Secondary PVs are in power factor control mode, controlled by LRAM (Q setpoint).
Secondary PVs are in power factor control mode, controlled by LRAM (Q setpoint).
Secondary PVs are in power factor control mode, controlled by LRAM (curtailment/restoration and VAr control).
Secondary PVs are in power factor control mode, controlled by LRAM (Q setpoint).
Secondary PVs are in power factor control mode, controlled by LRAM (Q setpoint).
Secondary PVs are in power factor control mode, controlled by LRAM (Q setpoint).
Secondary PVs are in power factor control mode, controlled by LRAM (curtail/restore and VAr control).
Secondary DES
Secondary DESs are in dispatch mode with reactive power controlled by LRAM (Q setpoint).
Secondary DESs are in dispatch mode with reactive power controlled by LRAM.
Secondary DESs are in dispatch mode and their P and Q are controlled by LRAM.
Secondary DESs are in dispatch mode, and their reactive power is controlled by LRAM.
Secondary DESs are in dispatch mode, and their reactive power is controlled by LRAM.
Secondary DESs are in dispatch mode, and their reactive power is controlled by LRAM.
Secondary DESs are in dispatch mode and their P and Q are controlled by LRAM.
Level 2&3 EVSE
NA NA NA NA NA NA Throttling down the charging rate

System Operations Development and Advancement Demonstration
30
Use Cases
This project addressed the following three use cases further described in the subsequent sections:
Near Real-Time Resource Aggregation,
Emergency Dispatch of DERs for Demand Management, and
Volt/VAR Management on Secondary System.
2.2.3.1 Near Real-Time Resource Aggregation
2.2.3.1.1 Problem description
DSOs are mainly responsible for operating, maintaining and developing an efficient electricity distribution system; however, they are also taking a new role of facilitating effective and well-functioning retail markets that give options to the customers to choose the best supplier and allow suppliers to offer the best services to customers.
In this new role as neutral market facilitators, DSOs are evolving towards information hubs to perform a reliable and swift change of suppliers. In addition, a DSO should have near real-time information about available and estimated resources, (all controllable/switchable and intermittent/variable generation, energy storage, and loads), on a 5 minute basis. Such a role requires the DSO be aware of the real-time supply information in each control region.
To that end, it is essential for the DSO to collect and process appropriate information from the devices and/or subsystems within the distribution grid; this information is utilized by the DSO to perform operational/market optimizations.
2.2.3.1.2 Proposed Solution
The flow of information for this use case is from the secondary-level assets (through LRAMs) up to the RAMCOs, and from there to the DSO. More specifically, each LRAMs collects the near real-time (NRT) information of the resources which are under its control. The information is then sent to the upper-level control tier, i.e. RAMCO, which in turn collects and analyzes the NRT resource information of all the LRAMS that it is coordinating. After the analysis, the RAMCO provides the DSO with NRT resource availability information at 5-minute intervals.
The current and estimated resource capacity information was categorized by the type of the resources, including:
Dispatch-able generation or firm generation (FG): conventional generators (e.g. rotating machine based generators) and/or non-conventional inverter-based generators, (e.g., fuel cell);
Energy storage systems (ESSs) and available energy level (state of charge), future/forecasted state of charge (SOC) based on schedules, and control modes of the ESSs;
Intermittent generation (IG): such as PV systems or wind turbine generators that can be curtailed;
Switchable/controllable loads (demand response); and
Critical (sensitive) and non-critical (non-sensitive) loads.

System Operations Development and Advancement Demonstration
31
The estimated resource capacity contribution and potential reserve capacity should also include any curtailed resources and time-adjustable loads.
In the normal operating mode of DSO, RAMCOS and LRAMs are expected to operate in the load management mode. In this mode, DSO adjusts the RAMCO active power contribution targets such that their reserve capacity is always above a specific target. Additionally, the contribution targets are calculated such that the state of charge (SOC) of BESS units in each RAMCO region is above a specific target that is determined by electricity market price.
2.2.3.2 Emergency Dispatch of DER for Demand Management
2.2.3.2.1 Problem description
With the proliferation of distributed energy resources (DERs) in distribution systems, it is imperative to involve them in managing the network demand in an effective and coordinated manner. In particular, since smart inverters offer several control functionalities (such as dynamic Volt/VAr control, soft-start reconnection, adjustable power factor, emergency ramp rate control, etc.), they can help with the distribution system load management. This, however, requires the dispatch setpoints of the DERs to be determined properly.
One of the DSO functions is to deal with flexible demand and operate networks that accommodate dispatch-able resources such as DERs. Local DER controllers might fail to achieve proper dispatch and demand management in distribution systems due to the lack of network-wide observability. For example, increased feed-in of DERs can lead to the reverse power flow, voltage violation, and/or other power quality issues. On the other hand, DER locations are not always ideal, and they may not be close enough to large loads to efficiently alleviate peak demands. Therefore, in modern distribution systems, the DSO along with its regional agents (RAMCOs) needs to analyze the network-wide information and effectively involve DERs in various control aspects of the system.
2.2.3.2.2 Proposed Solution
The DSO is the system operator that defines the contribution targets for all RAMCOs in order to meet its own contribution target dictated by the ISO (Market Operator). The DSO utilizes resource aggregation and estimation data from RAMCOs, as well as day-ahead load forecasting data from DMS/SCADA, to define the contribution targets for each RAMCO (one lump power/MW value). Based on these targets, RAMCOs might curtail or increase the amount of power generated in their own region and/or enforce load shedding through secondary systems (partial load reduction). RAMCOs utilize LRAMs and/or primary DERs in their region to meet these requirements. On the other hand, LRAMs receive the contribution target from their supervising RAMCO and determine the appropriate control setpoints for secondary DERs (generation/curtailment) and/or controllable loads (load shedding) to achieve the target.
If power curtailment controlled by a RAMCO is required in the region, the following actions should be taken:
The priority is given to energy storage systems (ESSs) in both primary and secondary systems. ESSs are requested to charge as much as possible until the power curtailment target is met. The priority stack for ESSs is first to charge customer EVs, then utility storage units, then customer owned storage.

System Operations Development and Advancement Demonstration
32
If charging ESSs cannot meet the power curtailment target, PV systems are curtailed to achieve the target. The priority stack for variable generation is to curtail utility generation before customer generation.
If a RAMCO requires increasing the generation level in its region by utilizing reserve capacity, the following actions should be taken:
The priority is given to the already curtailed PV systems from that region in both primary and secondary system; the goal is to fully utilize these PV systems and restore the curtailed portion of their generated power.
This is followed by discharge of ESSs in both primary and secondary systems until the RAMCO contribution target is met.
If after ESS discharging, the contribution target is not met yet, the reserve capacity of FG units are utilized to compensate for the unmet portion of RAMCO contribution target.
Finally, if the target is still not fulfilled, the LRAMs have the ability to shed some loads in order to manage the demand (primarily EVs).
The priority stacks for RAMCOs and LRAMs are listed in Appendix A.
2.2.3.3 Volt/VAr Management
2.2.3.3.1 Problem description
The project work included demonstrating required changes in the control structure of distribution systems under the presence of DERs; to address integrated required changes in the control structure of distribution systems under the presence of DERs; to address integrated Volt/VAr control for the secondary systems (customer service entrance); and to utilize DER capabilities to provide reactive power support for transmission and sub-transmission systems. To achieve these objectives, an operating mode is defined for the DSO to deal with reactive power management for distribution systems and to coordinate voltage adjustment on secondary systems. In this mode, DSO is responsible for the reactive power management of DERs in the primary system (12 kV level) as well as DERs on the secondary side of service transformers.
For the purpose of secondary system controls, LRAMs are envisioned to autonomously provide Volt/VAr management by using the resources on secondary systems and/or through power electronic devices specifically installed to control voltage and reactive power. In other words, LRAMs should determine the reactive power setpoints of secondary-side DERs such as PV systems and Distributed Energy Storage (DES) units as well as dedicated power electronic-based Volt/VAr regulating devices (if available) in order to meet the reactive power contribution target and to regulate voltages of the secondary side of service transformers within an acceptable range(s).
The voltage and reactive power contribution targets of the LRAMs for the secondary systems are either fixed setpoints or defined through RAMCOs. Under normal conditions, LRAMs need to maintain unity power factor at the service transformer secondary side. If reactive power support from secondary system is needed, RAMCO sends reactive power factor setpoints to LRAMs. However, active or reactive power contribution in support of the primary systems or in response to RAMCOs should be performed independent of voltage control on secondary systems, where a secondary Volt/VAr regulating (SVVR) device exists. In other words, the secondary voltage setpoint has to be maintained by the LRAM’s SVVR

System Operations Development and Advancement Demonstration
33
device before or during contribution to RAMCO. Secondary voltage control should be given the highest priority to any active or reactive power contribution, particularly considering the statutory voltage limits.
As part of this use case, the DSO may send a request to all RAMCOs to reduce the voltages by some percentage (e.g. 4% reduction) across the secondary system (e.g. from 123V to 118V). The voltage reduction request would also be sent to LTC at the substation through SCADA controls. The DSO also determines the reactive power contribution for the grid that should be managed through RAMCOs.
2.2.3.3.2 Proposed Solution
The reactive power control strategy for primary DERs and LRAMs in the distribution circuit depends on the DSO operating mode.
In the normal case, the reactive power contribution from secondary systems is assumed to be zero (i.e., unity power factor at the point of interconnection (POI) of secondary system to the primary system). However, LRAM might be asked by RAMCOs to provide reactive power contribution to the upstream circuit; in this case, the reactive power contribution target should be defined by the RAMCO.
In the proposed control architecture, each LRAM is responsible for the controllable assets located at the secondary side of its service transformer. In this use case, the secondary Volt/VAr control (SVVC) system controls the following secondary assets:
1. An SVVR device or
2. Control of residential and commercial PV systems, energy storages, and controllable loads, where possible.
In the event, there is no SVVR device, the LRAM attempts to meet the reactive power target from the RAMCO, assuming this would not lead to a high or low voltage. For LRAMs with SVVR, both reactive power setpoints and voltage targets can be met, assuming the limits of the assets have not been met.
2.3 Design of Test System
In this task, the demonstration test system was designed. For this purpose, first, the appropriate circuits for demonstrating the performance of RAMCOs and LRAMs were selected. Then, the demonstration testbeds were designed to meet SDG&E requirements of demonstrating ten (10) aggregator devices.
Circuit Selection Criteria
The demonstration system included two of the SDG&E circuits connected to 12kV level substations. Figure 2-3 illustrates the simplified single-line diagram of the circuits selected. The criteria for selecting these circuits were as follows:
Resource management and power quality issues
High penetration of DERs (PVs and BESSs)
Noticeable number of secondary systems
Possibility of having different circuit topologies

System Operations Development and Advancement Demonstration
34
The demonstration system modelled in digital simulation platform included the model of Load Tap Changers (LTC), capacitator banks, Voltage Regulators (VR), breakers, and reclosers. To take the presence and impact of large battery energy storage systems (BESSs) into consideration, a 2MW BESS unit has been added to each circuit. Additionally, a biogas generator has been added to one of the circuits representing a Firm Generation (FG) unit. RAMCO1 is responsible for controlling the DERs in North Circuit, and RAMCO2 is responsible for controlling DERs in South Circuit. The location of LRAMs in each circuit is highlighted by Node number using “ij” identifier as a subscript. Additionally, the controllable primary DERs in each circuit are highlighted as controllable nodes in Figure 2-3.
Tie Switch and reclosers 1 and 2 facilitate the investigation of the impacts of circuit configuration changes on the performance of proposed control system. Depending on the status of Tie Switch and reclosers 1 and 2, these two circuits can potentially create three different circuit topologies. Depending on the circuit topology RAMCO coverage may vary. The DERs and LRAMs designations for each topology are summarized in Table 2-3 to Table 2-5. As seen, when the circuit topology changes from Topology 1 to Topology 2, LRAM13 which was under RAMCO1 falls under RAMCO2 coverage. In Topology 3, LRAM22, LRAM23, and FG21 fall under RAMCO1 coverage.

System Operations Development and Advancement Demonstration
35
Figure 2-3. Simplified Single Line Diagram of Selected Circuits
CB
BUS102
PV12
137.60 kW
LTC
BESS2
1
70.20 kW
69kVSource
28.00 MVA69.00 kV/ 12.00 kV
R
BUS103
1030L1
1200 kVAr @ 12 kV
C
BUS104
1030L2
BUS105
1030L3
1030-810G
VRR
1030-809G
VR R
BUS108
1030L4
BUS114
1030L6
BUS115
1030L7
1200 kVAr @ 12 kV
C
1030-927G
VR
BUS110
1030L5
BUS101 BUS106 BUS107
BUS109
BUS111
BUS112 BUS113
BUS116
1200 kVAr @ 12 kV
C
600 kVAr @ 12 kV
C
12.00 kV/ 0.48 kV
70.20 kVA12.00 kV/ 0.48 kV
4.00 MVAR Cap “A”
capBKa
CB
PV11
7500 kW1030-95M
BUS117
7500.00 kVA12.00 kV/ 0.48 kV
PV13
BUS205
1200 kVAr @ 12 kV
C597-448G
VR
BUS201 BUS204
597-451G
VR
BUS207 BUS208
597L5
BUS206
597L4
BUS202
1200 kVAr @ 12 kV
C
597L3
597L1
PV21
BUS212
12.00 kV/ 0.48 kV
1216 kWAggregated
PV22
12.00 kV/ 0.48 kV
114.1 kWAggregated
BUS211
BUS210
50 kVA
50 kVA
C1030 #1: 1030_160434_OH
C1030 #3: 1030_166565_OH
50 kVA
C1030 #5: 1030_166700_OH
50 kVA
C1030 #4: 1030_173379_OH
BUS119s
BUS120sPT
BUS121s BUS122s
50 kVA
C597 #3: 597_197078_BR
BUS216s50 kVA
C597 #2: 597_241981_BR
BUS215s
50 kVA
C597 #4: 597_556003_OH
BUS217s
50 kVA
C597 #6: 597_1106037_BR
BUS218s
LTC69kVSource
28.00 MVA69.00 kV/ 12.00 kV
4.00 MVAR Cap “C”
capBKc
CB
CB597
CB
597L6
R
Tie Switch
T
BUS213
20
00
kW
2000.00 kVA12.00 kV/ 0.48 kV
597L2
Node21 Node22
Node23
Node12
Node11Node13
BESS21 Node
PV11 Node
BUS203 BUS209
PV,NCL,ESPV,NCL,ES
PV,NCL,ES
PV,NCL,ESPV,NCL,ES
PV,NCL,ES
PV21 Node
FG21
BUS214
12.00 kV/ 0.48 kV
2000 kW
BUS118
12.00 kV/ 0.48 kV
2000 kW
FG21 Node
Node24
Node14BUS02
BUS04
PV,NCL,ES
PV,NCL,ES
P = 2983 kWQ = 1576 kVAr
P = 1701 kWQ = 556 kVAr
P = 118 kWQ = 38 kVAr
P = 690 kWQ = 345 kVAr
P = 3112 kWQ = 1568 kVAr
P = 479 kWQ = 473 kVAr
P = 954 kWQ = 853 kVAr
P = 1993 kWQ = 1707 kVAr
P = 566 kWQ = 536 kVAr
P = 391 kWQ = 372 kVAr
BESS11
BESS11 Node
597L0
P = 879 kW @ 12 kVQ = 294 kVAr @ 12 kV
CB
Equivalent to Other 5 Circuits
P = 9500 kW @ 12 kVQ = 3122 kVAr @ 12 kV
CB
Equivalent to Other 3 Circuits
P = 8550 kW @ 12 kVQ = 2810 kVAr @ 12 kV
1200 kVAr @ 12 kV
C
1030L0
P = 879 kW @ 12 kVQ = 294 kVAr @ 12 kV
AB
BC
AC
AB
ABAC
BC
AB
L1L2
L1L2
L1L2
L1L2
L1L2
L1L2
L1L2
L1L2
3.4 mile 0.5 mile 0.7 mile 1.5 mile
1.5 mile 2.0 mile0.4 mile
2.9 mile 0.7 mile 2.1 mile 1.1 mile 0.8 mile
1.3
mile
Circuit1
Circuit2
Recloser1
Recloser2

System Operations Development and Advancement Demonstration
36
Table 2-3. DERs and LRAMs Designations in Topology 1
Topology 1 (Normal), Topology_ID=1
Switch Tie Switch Recloser 1 Recloser 2
Status Open Closed Closed
RAMCO1 RAMCO2
Actor ID Actor ID
LRAM11 1 LRAM21 2
LRAM12 1 LRAM22 2
LRAM13 1 LRAM23 2
LRAM14 1 LRAM24 2
PV11 1 PV21 2
BESS11 1 BESS21 2
FG21 2
Table 2-4. DERs and LRAMs Designations in Topology 2
Topology 2 (Transfer 1), Topology_ID=2
Switch Tie Switch Recloser 1 Recloser 2
Status Closed Open Closed
RAMCO1 RAMCO2
Actor ID Actor ID
LRAM11 1 LRAM21 2
LRAM12 1 LRAM22 2
LRAM13 2 LRAM23 2
LRAM14 1 LRAM24 2
PV11 1 PV21 2
BESS11 1 BESS21 2
FG21 2
Table 2-5. DERs and LRAMs Designations in Topology 3
Topology 3 (Transfer 2), Topology_ID=3
Switch Tie Switch Recloser 1 Recloser 2
Status Closed Closed Open
RAMCO1 RAMCO2
Actor ID Actor ID
LRAM11 1 LRAM21 2
LRAM12 1 LRAM22 1
LRAM13 1 LRAM23 1
LRAM14 1 LRAM24 2
PV11 1 PV21 2
BESS11 1 BESS21 2
FG21 1

System Operations Development and Advancement Demonstration
37
Test System Development and Layout
The testbed for the evaluation and demonstration of the proposed system architecture is an integrated software and hardware environment consisting of the digital simulation platform operating in conjunction with Power Hardware-in-Loop (PHIL). The digital simulation platform was used to represent the distribution circuits used for demonstration, allowing for representation of operating conditions and provision of an environment which accurately recreates field conditions for the hardware devices in the demonstration system. Furthermore, the hardware response of devices was fed back into the digital simulation platform to allow for accurate power system response to hardware performance and control schemes.
For the integration of the devices, a power amplifier was utilized to convert the digital simulation platform representation of system parameters to a form that the hardware can use. The hardware output can then be returned to the digital simulation platform, allowing the demonstration circuit to respond realistically.
For the demonstration of the RAMCO/LRAM operation concept, the following system components were represented as follows:
DSO – represented in a software platform
12kV distribution feeder, substation, and corresponding protective devices – represented in software digital simulation platform model
12kV DERs – represented in software digital simulation platform model
12kV/LV transformer – six of them simulated in digital simulation platform and two of them represented as hardware grid simulator
RAMCO/LRAM – represented as hardware
Secondary LV DERs and loads – represented as both hardware and in software digital simulation platform model
The selected 12kV distribution feeders were modeled and simulated in the digital simulation platform environment to generate real-time system parameters including voltages, currents, and power flow. Modeled circuits incorporated models of the conventional voltage and reactive power control devices on the circuits that are used to set the base-line voltage of the circuits, such as LTCs, voltage regulators, and shunt capacitors; they autonomously (locally) respond to system variations due to changes in daily loads and PV profiles.
Digital simulation platform modeling by necessity of limited computing capacity was approached where important points of system (including generation, storage, or switching and circuit device locations) were explicitly modeled, and sections of the circuit in between these points were lumped. Loads were lumped to the next downstream bus. Time-variant circuit aspects such as loads and generation were incorporated in the models through representative profiles.
Verifications were achieved through comparison of voltage, power flow, and fault current parameters with the reference circuit models provided by SDG&E to ensure model accuracy. Feeder and substation devices such as capacitors, regulators, protection were included in the digital simulation platform model, as discussed with the SDG&E Project Team.

System Operations Development and Advancement Demonstration
38
The hardware components such as RAMCO/LRAM were interfaced with digital simulation platform through input/output signal modules or through intermediary power amplifier devices such as grid simulators. Two LRAMs, covering pre-commercial offerings from two partner vendors, were interacting with two fully implemented hardware secondary networks, including residential load, PV, and EV charging stations. To meet SDG&E requirements of ten (10) aggregator devices, an additional six (6) LRAMs were interacting with secondary networks modeled within the digital simulation platform. An overview of the proposed testbed is shown in Figure 2-4. The testbed installed at ITF is shown in Figure 2-5.
Figure 2-4. Proposed Digital Simulation Platform and PHIL Testbed Configuration for Demonstration of RAMCO/LRAM Concept
SCADA(controls all primary assets)
Monitoring
DSOResource Aggregation/Monitoring
(controls all primary and secondary DERs)
PMU Monitoring
Control Center
Day ahead Load Forecasting Data
Monitoring of P/Q/V in secondary systems and primary DERs
MX45Grid Simulator
Z
Residential Customers
PVLoad Bank
EVC
Z Z
Secondary control
device 2
ESS
LRAM24RS90
Grid Simulator
Secondary control device 1
LRAM14
Z
Residential Customers
PVLoad Bank
EVC
Z Z
ESS
Hardwire to switch off NCL
Hardwire to switch off NCL
Local controller 2
LRAM11LRAM12LRAM13
Local controller 4
LRAM21LRAM22LRAM23
Local controller 3Primary DER control
(Circuit2)
Local controller 1Primary DER
control (Circuit1)
RAMCO2REST
Wireless
System Simulator
Gateway
Rad
io
GPS Clock
RAMCO1
Rad
io
Circuit ReconfigurationEmergency Dispatch
RAMCO1 RAMCO2PT-RAMCO1 PT-RAMCO2
QT-RAMCO1 QT-RAMCO2
Regional Aggregation
Local Aggregation

System Operations Development and Advancement Demonstration
39
Figure 2-5. Testbed Installed at ITF

System Operations Development and Advancement Demonstration
40
2.4 Test System Setup and Integration
Once the demo test system was designed, a three-stage testing process was conducted to ensure the readiness of test system for final demonstration:
Type testing of secondary system technologies: The test system was envisioned to include DERs
and controllable assets in both primary and secondary systems. In particular, for secondary
systems, two of commercially available secondary system Volt/VAr regulation devices were
selected and type tested to ensure that they fully fit into the project functional requirements.
Factory Acceptance Test (FAT): The purpose of FAT was to demonstrate the basic functionality
of the proposed aggregator-based architecture.
Site Acceptance Test (SAT): The project was involved with a SAT at SDG&E testing facility to
ensure the proper operation of RAMCOs and LRAMs and rest of the testbed for the final
demonstration.
Type Testing of Secondary System Technologies
For secondary systems, two of commercially available secondary system Volt/VAr regulation devices were selected and type tested to ensure that they fully fit into the project functional requirements. Technologies for managing voltage and reactive power on secondary circuits are expected to dynamically control voltages and compensate reactive power for power factor correction when installed on the secondary of a service transformer suppling multiple residential customers. The key features include (but not limited to):
Load Voltage Regulation: directly bucks and boosts voltage across a wide range during forward and reverse power flow
Reactive Power Compensation: regulates power factor by dynamically injecting or absorbing reactive power
Operational Flexibility: operates autonomously with options for remote management and visibility
The objective of the type testing was to evaluate the operation and performance of the secondary system technologies through a laboratory testbed setup, including a simple test circuit in digital simulation platform, grid simulator, load banks, and PV inverters to represent residential loads. Devices from two different vendors were selected as Device Under Test (DUTs) for the type test purpose. Both of the DUTs selected have similar functions for secondary voltage regulation, reactive power compensation or power factor correction. Main control specifications of the two DUTs are described below:
DUT A:
Dynamic voltage regulation (cycle by cycle up to +/- 24V on 240V basis) toward a programmable setpoint (typically fixed at 240V RMS, but is dynamically settable)
Providing up to additional +/- 5 kVAr support (or alternatively, set to power factor mode where it injects/absorbs up to 5kVAr to reach the desired power factor)
DNP3 communication capability to dynamically change voltage and reactive power (or power factor), as well as direct retrieval of monitoring parameters and applying configuration changes.

System Operations Development and Advancement Demonstration
41
DUT B:
Dynamic voltage regulation (up to +/- 10V on 120V basis) toward a programmable setpoint (typically fixed at 120V RMS, but is dynamically settable)
Providing up to additional +/- 10 kVAr support to regulate the power factor at source side at unity power factor.
SSH communication capability to dynamically change voltage and reactive power (or power factor), as well as direct retrieval of monitoring parameters and applying configuration changes.
The hardware testbed for type test was set up and operated at the SDG&E ITF. Type test preparation consisted of a number of stages, including:
Test system design based on SDG&E ITF configuration and equipment rating
Test rack design and assembly for DUTs installation and connection preparation
ITF Layout for accommodating equipment for the type test
Testbed setup including equipment wiring and measurements connection
Test communication setup
The layout of the testbed is illustrated in Figure 2-6, consisting of the following components:
Digital simulation platform: used to represent the simplified 12kV power system including: a source, line impedances, loads, and interconnection transformers that represent service transformer.
Grid Simulator (90kVA): used to emulate the voltage at the 240V side of the interconnection transformer.
DUTs: Device Under Test (DUT) used for voltage regulation, sag/swell mitigation, reactive power compensation and power factor correction.
Impedance Box: used for representing the service cables between residential customers and service transformer.
Load Banks Racks: Two 10 kW and one 20 kW (70 kW capability at 240V) resistive load banks used for representing residential customer load downstream of the device under test. Two load banks are applied per line to neutral in order to individually change the loading on various lines and to create unbalanced conditions.
PV Inverter: two 6 kW inverters used for representing residential PV system.
Automation controller: used for communicating with DUT for remote control.
Power analyzer monitors voltage and current at both the source and load side of DUTs for instantaneous waveform, RMS measurements, and power quality analysis

System Operations Development and Advancement Demonstration
42
Figure 2-6 Type test system layout
Several test categories and groups were considered for the type test in order to evaluate different aspects of DUTs’ operation, mainly focusing on:
1) Initialization and start up test: The purpose of this test category is to test the operating threshold and limits of DUTs. Voltage output
from grid simulator was reduced or increased until DUTs cannot regulate load voltage and stops or
follows the voltage, to determine the drop off voltages.
2) Voltage regulation performance test: The purpose of this test category is to verify the ability of DUTs to regulate the load voltage at a desired
setpoint. Changes in system voltages are performed in this category, as well as load changes, to test the
devices ability to regulate voltage at the load side.
3) Reactive power compensation / Power factor control performance test: The purpose of this test category is to test DUTs’ ability to compensate reactive power or regulate the
power factor at desired setpoint of unity.
4) Communication test: The purpose of this test category is to test the DUTs’ communication capability for remote configuration/
setting change or monitoring.
The aforementioned tests are performed in different system operation modes besides the normal condition, such as off-nominal system frequency, reverse power flow, and unbalanced loading conditions, to account for abnormal system operations.
For all the tests performed in each category, test results were evaluated based on the following criteria:
Impedance Box
Impedance Box
120 V
-120 V
120 V
-120 V
DUT
PV Inverter Load Bank
Grid Simulator
Axion

System Operations Development and Advancement Demonstration
43
The detailed type test plan is provided in Appendix B.
Factory Acceptance Test (FAT)
The primary objective of the FAT was to demonstrate the basic functionality of the proposed aggregator-based architecture; this was done by first verifying end-to-end connectivity between devices in the aforementioned hierarchies, and then demonstrating that specific use cases can be implemented in an automated fashion with minimal user intervention.
There was a total of three use cases to be studied during the execution of this project:
Near Real-Time Resource Aggregation and Monitoring
Emergency Dispatch of DERs and Demand Side Management
Reactive power Management: Secondary Volt/VAr control
For the FAT, a simplified version of the first two use cases was tested as the remainder were under development at the time. However, all three use cases were verified during the SAT.
The FAT tests system, shown in Figure 2-7 , covered a portion of the full test system to ensure the proper operation and communication among different hierarchies of control system. As seen, the FAT test system covered one RAMCO and all LRAMs and the DER site controllers in that RAMCO region. One of the LRAMs (LRAM14) was controlling a physical Electric Vehicle (EV) charger and a PV inverter to facilitate hardware-in-the-loop (HIL) testing.
Throughout the FAT, communications among various major blocks in the proposed control architecture were tested and verified. Moreover, the performance of the control functions implemented in DSO, RAMCOs and LRAMs were evaluated through the execution of selected use cases.
Pass Test result shows correct/expected operation behavior of device under test
Fail Test result shows incorrect/unexpected operation behavior of device under test
Inconsistent Test result shows inconsistent for certain test cases with pass or fail test results

System Operations Development and Advancement Demonstration
44
Figure 2-7. Illustration of Test Setup for FAT
To access the performance of the proposed system architecture during the acceptance testing. Two main test categories were considered: Verification Test Cases and Application Test Cases.
Table 2-6. Test Summary for FAT Test Categories
Test Category
Test Description Test groups Test Results
1 Verification Test
Communication Test PASS
SCADA/digital simulation platform Model Verification Test
PASS
DSO/RAMCO Performance Verification Test
PASS
PMU/Alarm Verification Test PASS
2 Application Test
Near Real Time Resource Aggregation Test
PASS
Emergency Dispatch of DERs and Demand Side Management Test
PASS
Several sample test cases were selected for validating the basic functionalities of the proposed system architecture. The summary of FAT test plan and results is provided in Appendix C.

System Operations Development and Advancement Demonstration
45
Site Acceptance Test (SAT)
For SAT, the integrated testbed with software and hardware environment consisting of the digital simulation platform operating in conjunction with Power Hardware-in-Loop (PHIL) was implemented to validate the test system for final demonstration. The testbed included:
Control center (DSO and SCADA) – represented in a software platform
12kV distribution feeder, substation, and corresponding protective devices – represented in software digital simulation platform model
12kV DERs – represented in software digital simulation platform model
12kV/LV transformer – six of them simulated in digital simulation platform and two of them represented as hardware grid simulator
RAMCO/LRAM – represented as hardware
Secondary LV DERs and loads – represented as both hardware and in software digital simulation platform model
The selected 12kV distribution feeder was modeled and simulated in the digital simulation platform environment to generate real-time system parameters including voltages, currents, and power flow. Modeled circuits incorporated models of the conventional voltage and reactive power control devices on the circuits that are used to set the base-line voltage of the circuits, such as LTCs, voltage regulators, and shunt capacitors; they autonomously (locally) respond to system variations due to changes in daily loads and PV profiles.
The hardware components such as RAMCO/LRAM were interfaced with digital simulation platform through input/output signal modules or through intermediary power amplifier devices such as grid simulators. Two LRAMs, covering pre-commercial offerings from two partner vendors, were interacting with two fully hardware secondary networks, including residential load, PV, and EV charging stations. An overview of the proposed testbed is shown in Figure 2-4, the testbed installed at ITF is shown in Figure 2-5.
For SAT, all three use cases were selected, implemented and tested in the laboratory environment - at the SDG&E testing facility – to cover and demonstrate various operation aspects of the proposed system architecture:
Load Management/NRT Resource Aggregation: Update the DSO about the latest available resources in each region controlled by a RAMCO, allowing the DSO to use near real-time (NRT) information/constraints in its optimization algorithms.
Emergency Dispatch of DERs: Proper dispatch of DERs under emergency conditions in the proposed aggregator-based architecture.
Reactive power management: Effectively manage voltage and/or reactive power at primary-side DERs as well as service transformer level.
The test plan for each of the use cases performed are shown in Table 2-7 to Table 2-9. For each use case, a number test cases were selected to verify the proper operation of demonstration test system for all three use cases under different conditions. The SAT results verified the performance of test system for the project final demonstration. These test cases were later performed in project final demonstration.

System Operations Development and Advancement Demonstration
46
Table 2-7. Test Plan for Use Case 1 (Load Management/NRT Resource Aggregation)
Use Case 1 (Load Management/NRT-Resource Aggregation)
Use cases & Test Cases DSO Targets
Market Price
Reserve Capacity
Forecasted Load
Initial SOC (%)
PV (%)
Case 1-1: High Market Price/Minimum Reserve Capacity=0.25/PV Profile=70%, topology 1
NA High 25%
Case 1-1-1: Initial SOC = 70% NA $170 25% 10 70% 70%
Case 1-1-2: Initial SOC = 70% (Initial value in digital simulation platform), PV drops to 20% (cloud condition) and keep for a few minutes, back to 70%.
NA $170 25% 10 70% 70% to 20% to 70%
Case 1-2: Low Market Price/Minimum Reserve Capacity=0.25/PV Profile=70%, topology 1
NA Low 25%
Case 1-2-1: Initial SOC = 70% NA $40 25% 10 70% 70%
Case 1-2-2: Initial SOC = 70%, PV drops to 20% (cloud condition) and keep for a few minutes, back to 70%.
NA $40 25% 10 70% 70% to 20% to 70%
Case 1-3: High Market Price/Minimum Reserve Capacity=0.35/PV Profile=70%, topology 1
NA High 35% NA NA
Case 1-3-1: Initial SOC = 70% NA $170 35% 10 70% 70%
Case 1-3-2: Initial SOC = 70% (Initial value in digital simulation platform), PV drops to 20% (cloud condition) and keep for a few minutes, back to 70%.
NA $170 35% 10 70% 70% to 20% to 70%
Case 1-4: Low Market Price/Minimum Reserve Capacity=0.35/PV Profile=70%, topology 1
NA Low 35%
Case 1-4-1: Initial SOC = 70% NA $40 35% 10 70% 70%
Case 1-4-2: Initial SOC = 70%, PV drops to 20% (cloud condition) and keep for a few minutes, back to 70%.
NA $40 35% 10 70% 70% to 20% to 70%
Case 1-5: Variable price NA High to Low
25% 10 0.7 0.7
Case 1-5-1: Variable price; price drops from $170 to $40, SOC = 70%
NA 170 to 40
25% 10 70% 0.7
Case 1-5-2: Variable price; price drops from $170 to $40, SOC = 70%
NA 170 to 40
35% 10 70% 0.7

System Operations Development and Advancement Demonstration
47
Table 2-8. Test Plan for Use Case 2 (Emergency Dispatch of DERs)
Use Case 2 (Emergency Dispatch of DERs)
Use cases & Test Cases DSO Targets
Market Price
Reserve Capacity
Forecasted Load
Initial SOC (%)
PV (%)
Case 2-1: DSO Contribution Target = 8MW, Test under different Generation Profiles
8 MW NA NA NA
Case 2-1-1: PV= 0.7p.u., BESS SOC=70% 8 MW NA NA NA 70% 70%
Case 2-1-2: PV= 0.2p.u., BESS SOC=70% 8 MW NA NA NA 70% 20%
Case 2-2: Initial SOC = 5% (Initial value in digital simulation platform), PV at 70%, then drop PV to 20%
8 MW NA NA NA 5% 70 to 20%
Case 2-3: Change of DSO target and load profile 0 MW NA NA NA 70% 70%
Case 2-3-1: Change DSO Contribution Target from 12MW to -4MW in steps
variable NA NA NA 70% 70%
Case 2-3-2: DSO Contribution Target= 12MW, change load level in steps from 1 to 0.2
12 MW NA NA NA 70% 70%
Case 2-4: Test dispatching in LRAMs when all primary DERs are off
NA NA NA NA
Case 2-4-1: Change P target in 50kW steps from 250kW to -200kW
variable NA NA NA NA 100%
Case 2-4-2: Changing P target and then PV profile: P_T changes from 150 to 50. Then PV changes to 0.1
variable NA NA NA NA variable
Case 2-5: Test Under different circuit topologies: DSO Contribution Target = 3MW, PV Profile = 0.2p.u., BESS SOC=30%
3 MW NA NA NA 30% 20%
Case 2-5-1: Change circuit topology from 1 to 2 3 MW NA NA NA 30% 20%
Case 2-5-2: Change circuit topology from 2 to 1 3 MW NA NA NA 30% 20%
Case 2-5-3: Change Pricing and verify that target does not change
3 MW NA NA NA 30% 20%
Case 2-5-4: Change circuit topology from 1 to 3 3 MW NA NA NA 30% 20%
Case 2-6: Test when PV11 is tripped suddenly (start with DSO Contribution Target = 4MW, PV Profile = 0.85p.u., BESS SOC=60%)
4 MW NA NA NA 70% 70%

System Operations Development and Advancement Demonstration
48
Table 2-9. Test Plan for Use Case 3 (Reactive Power Management)
Use Case 3 (Secondary Volt/VAr Control)
Use Cases & Test Cases DSO Targets
Market Price
Reserve Capacity
Forecasted Load
Initial SOC (%)
PV (%)
Case 3-1: DSO reactive power target change from 7 MVAr to -7MVAr (7, 4, 1, 0, -1,-7MVAr)
2 MVAr NA NA NA 70% 70%
Case 3-2: Voltage target reduction test: start with Q target of 0 MVAr and change the voltage reduction setpoint as 0%, 1%, and 5%, then change the Q target to 2 MVAr and set the voltage reduction target to 5%.
variable NA NA NA 70% 70%
2.5 Demonstration of Control and Operation Concept
In order to demonstrate the performance of the system for all three use cases several test cases were
performed. These test cases are summarized in Section 2.4.3, Table 2-7 to Table 2-9. A brief explanation
of test cases in each category is presented below. The demonstration test results are discussed in
Section 3.
Use Case 1 (Load Management/Near Real Time-Resource Aggregation):
In this use case, the focus is on updating the DSO with the latest available resources in each region controlled by a RAMCO. Therefore, the DSO would use near real-time (NRT) information/constraints in its optimization algorithms. Such information includes the status and measurements of resources like intermittent generation units, energy storage units and their available energy level (State of charge), switchable / shed-able loads, critical loads, etc. The flow of information for this use case is from the secondary-level assets (through LRAMs) up to the RAMCOs, and from there to the DSO. In order to verify the proper operation of this use case, various operating conditions including PV profile, feeder loads, forecasted load, market price, etc. are considered in several tests. Additionally, DSO can perform load management on the circuits by utilizing DERs based on the latest energy price. For example, if the energy price is changed from a high to a low value, DSO should assign new setpoints for each RAMCO based on the information it receives from RAMCOs. This new setpoint is then assigned to the resources in the feeder though primary DER site controllers and LRAMs. It is expected for the resources to contribute to the market more than the previous stage, as the price is decreased.
Use Case 2 (Emergency Dispatch of DERs):
The objective of this use case is to ensure the proper dispatch of DERs under emergency conditions in the proposed aggregator-based architecture. For this purpose, flow of the commands in the hierarchy is as follows: Based on the information received from RAMCOs, DSO updated contribution targets for each RAMCO. These targets are then used to restore/curtail primary PVs, charge/discharge primary BESS

System Operations Development and Advancement Demonstration
49
units, and determine contribution targets for LRAMs. Final level of the hierarchy is when each LRAM sets new targets for each secondary PV and distributed energy storage (DES) system. In order to evaluate the performance of the Emergency Dispatch use case, the modeled demonstration system is tested under various operating scenarios. A combination of load and PV generation profiles and initial state of charge of batteries are applied to the test system to create these operating conditions. The verification process is to ensure that targets generated by DSO are properly incorporated by RAMCOs through the proper dispatch of primary and secondary DERs.
Use Case 3 (Secondary Volt/VAr Control):
The objective of this use case is to effectively manage voltage and/or reactive power of service transformers, using the available resources on the secondary systems. In the proposed control architecture, effective control of primary-side DERs are given to RAMCOs. On the other hand, the responsibility of each LRAM is to manage controllable assets located at the secondary side of its service transformer to meet the assigned setpoint from DSO based on the optimization goals considered. Consequently, the RAMCO determines the active and reactive power setpoints of DERs connected to the medium-voltage (primary) level of distribution systems, which further supports the SCADA control of primary utility assets such as shunt capacitors, voltage regulator, and load tap changers to enhance voltage profile or reactive power flow in primary feeders. Moreover, the setpoint sent by DSO to LRAMs are assigned to the controllable secondary assets such as a dedicated power electronic-based Volt/VAr regulating device, or used to control the operation and status of residential and commercial PV systems, energy storage, and loads.

System Operations Development and Advancement Demonstration
50
3 PROJECT RESULTS
In the following tables, the detailed findings for all the test cases performed during final demonstration are summarized. For each test case associated with use cases, the summary results and observations are provided.
Table 3-1. Summary of Findings for Load Management Test Cases
Use Case 1 (Load Management/NRT-Resource Aggregation)
Use cases & Test Cases Observation
Case 1-1: High Market Price/Minimum Reserve Capacity=0.25/PV Profile=70%, topology 1
Case 1-1-1: Initial SOC = 70% At high market prices, batteries start to discharge as expected.
Case 1-1-2: Initial SOC = 70% (Initial value in digital simulation platform), PV drops to 20% (cloud condition) and keep for a few minutes, back to 70%.
At high market prices, batteries start to discharge as expected. FG unit in RAMCO2 also starts to contribute.
Case 1-2: Low Market Price/Minimum Reserve Capacity=0.25/PV Profile=70%, topology 1
Case 1-2-1: Initial SOC = 70% At low market prices, batteries start to charge as expected.
Case 1-2-2: Initial SOC = 70%, PV drops to 20% (cloud condition) and keep for a few minutes, back to 70%.
At low market prices, batteries start to charge as expected. The PV radiation drop does not impact the charging of batteries.
Case 1-3: High Market Price/Minimum Reserve Capacity=0.35/PV Profile=70%, topology 1
Case 1-3-1: Initial SOC = 70% At high market prices, batteries start to discharge as expected. The 35% minimum reserve capacity target is met.
Case 1-3-2: Initial SOC = 70% (Initial value in digital simulation platform), PV drops to 20% (cloud condition) and keep for a few minutes, back to 70%.
At high market prices, batteries start to discharge as expected. The 35% minimum reserve capacity target is met.
Case 1-4: Low Market Price/Minimum Reserve Capacity=0.35/PV Profile=70%, topology 1
Case 1-4-1: Initial SOC = 70% At low market prices, batteries start to charge as expected. The 35% minimum reserve capacity target is met.
Case 1-4-2: Initial SOC = 70%, PV drops to 20% (cloud condition) and keep for a few minutes, back to 70%.
At low market prices, batteries start to charge as expected. The 35% minimum reserve capacity target is met.

System Operations Development and Advancement Demonstration
51
Use Case 1 (Load Management/NRT-Resource Aggregation)
Use cases & Test Cases Observation
Case 1-5: Variable price, price drops from $170 to $40, SOC = 70%
Initially with the high market price, batteries are discharging; after the price change, they start to charge as expected.
Table 3-2. Summary of Findings for Emergency Dispatch Test Cases
Use Case 2 (Emergency Dispatch of DERs)
Use cases & Test Cases Observation
Case 2-1: DSO Contribution Target = 8MW, Test under different Generation Profiles
Case 2-1-1: PV= 0.7p.u., BESS SOC=70% The requested 8 MW target by DSO is met. BESS 11 in RAMCO1 is charging while BESS 21 I RAMCO2 is discharging (due to smaller size PV in RAMCO 2)
Case 2-1-2: PV= 0.2p.u., BESS SOC=70% The requested 8 MW target by DSO is met. After PV radiation drop, BESS11 in RAMCO1 also starts to discharge to help RAMCO1 meet the target requested by DSO.
Case 2-2: DSO Contribution Target = 8MW, Initial SOC = 5% (Initial value in digital simulation platform), PV at 70%, then drop PV to 20%
Batteries do not discharge because their SOC is below the minimum allowable SOC (10%). With PV profile of 70% the DSO target is met. However, with 20% of PV profile, there are not enough resources available to meet the DSO target.
Case 2-3: Change of DSO target and load profile
Case 2-3-1: Change DSO Contribution Target from 12MW to -4MW in 2MW steps
Summary of observations for each target change step: 12MW to 10MW: BESS11 and 21 are discharging less as targets is decreasing. 10MW to 8MW: BESS11 is discharging less as targets is decreasing. BESS21 started charging. 8MW to 6MW: BESS 11 started to charge. 6MW to 4MW: PV 11 started to curtail. 4MW to 0MW: FG21 is curtailed, but PV21 is not curtailed yet. 0MW to -2MW: Still PV21 is not curtailed. -4MW: PV21 and some LRAMs started curtailing.
Case 2-3-2: DSO Contribution Target= 12MW, change load level in steps from 1 to 0.2
The target is successfully met regardless of load changes.
Case 2-4: Test dispatching in LRAMs when all primary DERs are off

System Operations Development and Advancement Demonstration
52
Use Case 2 (Emergency Dispatch of DERs)
Use cases & Test Cases Observation
Case 2-4-1: Change P target in 50kW steps from 200kW to -200kW
LRAM successfully meet the targets and successfully priorities the devices for dispatching. As the target was decreasing EVSE started to charge at a higher rate.
Case 2-4-2: Changing P target and then PV profile: P_T changes from 150 to 50. Then PV changes to 0.1
LRAM successfully meet the targets and successfully priorities the devices for dispatching. As the target was decreasing EVSE started to charge at a higher rate.
Case 2-5: Test Under different circuit topologies: DSO Contribution Target = 3MW, PV Profile = 0.2p.u., BESS SOC=30%
Case 2-5-1: Change circuit topology from 1 to 2
LRAM13 is successfully moved to RAMCO2 coverage.
Case 2-5-2: Change circuit topology from 2 to 1
LRAM13 is back to RAMCO1 coverage.
Case 2-5-3: Change Pricing and verify that target does not change
The pricing in emergency dispatch mode is not effective.
Case 2-5-4: Change circuit topology from 1 to 3
FG unit that was under the coverage of RAMCO2, is now controlled and monitored by RAMCO1.
Case 2-6: Test when PV11 is tripped suddenly (start with DSO Contribution Target = 4MW, PV Profile = 0.85p.u., BESS SOC=60%)
BESS 11 was being charged. After PV11 is tripped, it starts to discharge. BESS 21 also discharges at a higher rate.
Table 3-3. Summary of Findings for Reactive Power Management Test Cases
Use Case 3 (Secondary Volt/VAr Control)
Use cases & Test Cases Observation
Case 3-1: DSO reactive power target change from 7 MVAr to -7MVAr (7, 4, 1, 0, -1,-7MVAr)
Primary DERs and LRAMs successfully share the reactive power target requested by DSO.
Case 3-2: Voltage target reduction test: start with Q target of 0 MVAr and change the voltage reduction setpoint as 0%, 1%, and 5%, then change the Q target to 2 MVAr and set the voltage reduction target to 5%.
Voltage reduction targets are successfully transferred to LRAMs. Secondary Volt/VAr control technology successfully controls the voltage of LRAM based on new target. Reactive power sharing is successfully performed by all DERs and LRAMs.
3.1 Sample Test Results
In this section, the test results for some sample test cases are presented to demonstrate three different
DSO modes of operation. For this purpose, the DSO readings are compared against RAMCO

System Operations Development and Advancement Demonstration
53
measurements and setpoints. The following four tests are presented as a scaled-down demonstration of
the control concept, while more test results are presented in the Appendix D.
Case 1-5: Variable market price (Load Management/Near Real Time-Resource
Aggregation)
In this test, PV profile is 70%, and initial SOC of the batteries is 70%. Full detail of the settings for this
test are as follows:
Table 3-4. Settings for Case 1-5-2
Control mode
Market Price Reserve Capacity
Forecast Load
Initial SOC (%)
PV (%) Load in feeders
11 $170/MWh to $40 35% 10 70% 70% 1 p.u.
Price of energy is initially set at $170 per MWh. In this case, the setpoints of the bulk resources of each
RAMCO are as follows:
Table 3-5. Setpoints for Case 1-5-2, price is $170/MWh
setpoint (kW) measurement (kW)
RAMCO 1
BESS11 634 632
PV11 5250 5250
RAMCO 2
BESS21 866 863
PV21 851 846
FG21 1088 1068
The DSO page setting is as follows, which shows the kW measurement of Energy Storage in RAMCO1 and RAMCO 2 separately, confirming their discharge status.

System Operations Development and Advancement Demonstration
54
Figure 3-1. DSO HMI in case 1-5-2: energy price is $170 per MWh
After the market price is changed to $40 per MWh, it is expected for them to charge as the energy price is low. This is guaranteed with setting a higher minimum SOC target in lower energy prices compared to higher prices. When the SOC of batteries is 70%, they are meeting the required minimum SOC target at high price. When the energy price drops, the minimum SOC target is not met and hence the batteries start to charge to reach to this level. Setpoints of bulk resources of each RAMCO are presented in Table 3-6.
Table 3-6. Setpoints for Case 1-5-2, price is $40/MWh
setpoint (kW) measurement (kW)
RAMCO 1
BESS11 -1685 -1678
PV11 5250 5250
RAMCO 2
BESS21 -897 -893
PV21 851 846
FG21 1088 1068

System Operations Development and Advancement Demonstration
55
The DSO HMI setting is as shown below, and confirms that both Energy Storage systems in RAMCO1 and RAMCO 2 are charging:
Figure 3-2. DSO HMI in case 1-5-2: energy price is $40 per MWh
As can be confirmed, batteries are now charging after the energy price has dropped. This can also be seen in the RAMCO HMI. Snapshot of RAMCO 1 HMI is shown below, and the response of RAMCO 1 to the price drop is shown in Figure 3-4.
a) Setpoints and measurements at price=$170 per MWh b) Setpoints and measurements at price=$40 per MWh
Figure 3-3. Setpoints and measurements for RAMCO 1 bulk resources in case 1-5-2

System Operations Development and Advancement Demonstration
56
Figure 3-4. RAMCO 1 real power target and response, and response of primary connected assets associated with price drop
BESS11 and BESS21 active power measurements are shown in both energy prices in Figure 3-5 and Figure 3-6, and demonstrate that the battery changes status from discharge to charge after the new energy price signal is received.
Figure 3-5. BESS11 power measurements in case 1-5-2

System Operations Development and Advancement Demonstration
57
Figure 3-6. BESS21 power measurements in case 1-5-2
Case 2-3-1: Change of DSO target (Emergency Dispatch of DERs)
In this test, DSO Contribution Target is changed from 12MW to -4MW in 2MW steps. Load profile of the feeders is set at 1 p.u., PV profile is at 70%, and SOC of the batteries is at 70%. Changing the DSO contribution target is sent to RMACOs, and then to the individual resources. Initially, DSO target is set at 12 MW, as can be seen in Figure 3-7. The requested target is sent to the RAMCOs and the total system is capable of meeting the requested target, as seen by summing the generation of Total DERs in both feeders:

System Operations Development and Advancement Demonstration
58
Figure 3-7. DSO HMI in case 2-3-1: DSO target is 12 MW
Changes in setpoints sent from DSO to each RAMCO can be seen below, which shows that each RAMCO has successfully responded to the DSO setpoint, as the Measured Power has well placed in between the desired thresholds.
Figure 3-8. RAMCO 1 HMI: Plot for RAMCO 1 power setpoint in case 2-3-1

System Operations Development and Advancement Demonstration
59
Figure 3-9. RAMCO 2 HMI: Plot for RAMCO 2 power setpoint in case 2-3-1
The following text summarizes observations when the DSO target is changed in steps:
Target= 10 MW: BESS11 and BESS21 are discharging at a lower rate.
Target= 8 MW: BESS21 started charging.
Target= 6 MW: BESS 11 started to charge.
Target= 4 MW: PV 11 is curtailed.
Target= 0 MW: FG 21 is curtailed
Target= -2 MW: FG 21 is curtailed.
Target= -4 MW: PV 21 started curtailing
Plots of active power generation of PV11, PV21, and FG21 and plots of charging/discharging status of BESS11, BESS2 are presented below. As can be seen, each device is responding to the setpoint received from its respective RAMCO. Moreover, the case illustrates how the priority stack automatically selects the preferred resource to meet the target. The primary connected BESS is used in priority until it reaches its maximum charging capacity of -2000 kW, at which time curtailment of PV is required in order to maintain the target.

System Operations Development and Advancement Demonstration
60
Figure 3-10. BESS11 and BESS21 P measurements in case 2-3-1
Figure 3-11. PV11, PV21, and FG21 P measurements in case 2-3-1
Moreover, LRAMs are also contributing to the new setpoint during the test. The LRAMs are used once the primary PV is fully curtailed. As can be noted in Figure 3-12, each individual LRAM is provided different targets, depending on the capabilities of the individual LRAMs and their resources.

System Operations Development and Advancement Demonstration
61
Figure 3-12. LRAMs 1 to 4 real power target and responses for DSO contribution target change from 12 MW to -4MW
A similar case is seen with RAMCO 2. Setpoints and measurements for the primary and secondary resources on the second feeder, controlled by RAMCO2, are seen in Figure 3-13 for two snapshots: when DSO target is 12 MW and when it is -4 MW. As can be seen, for instance, SMA inverter in LRAM24 is curtailed moving from 12 MW DSO setpoint to -4 MW. Also, Battery and EV on LRAM21 that were discharging/ curtailed when the DSO target was 12 MW are charging when DSO target is changed to -4 MW.
a) DSO target is 12 MW

System Operations Development and Advancement Demonstration
62
b) DSO target is -4 MW
Figure 3-13. RAMCO HMI in case 2-3-1
Case 2-4-1: LRAM dispatching when all primary DERs are off (Emergency Dispatch of
DERs)
In this test, which is also performed when the DSO operating mode is Emergency, the primary assets were disconnected in order to isolate the responses of the LRAMs. In this fashion the RAMCO targets are allocated directly to the LRAMs. DSO Contribution Target is changed from 250kW to -200kW in steps. Load profile of the feeders is set at 1 p.u. and PV profile is at 100%. Like the previous case, each DSO contribution target is sent to RMACOs, and then to the individual resources. Since the primary DERs are tripped, LRAMs are responsible for providing the required generation target using their resources.
Initially, DSO target is set at 250kW, as can be seen in Figure 3-14. The requested target is sent to the RAMCOs and the total system is capable of meeting the requested target, as seen by summing the generation of Total DERs in both feeders:
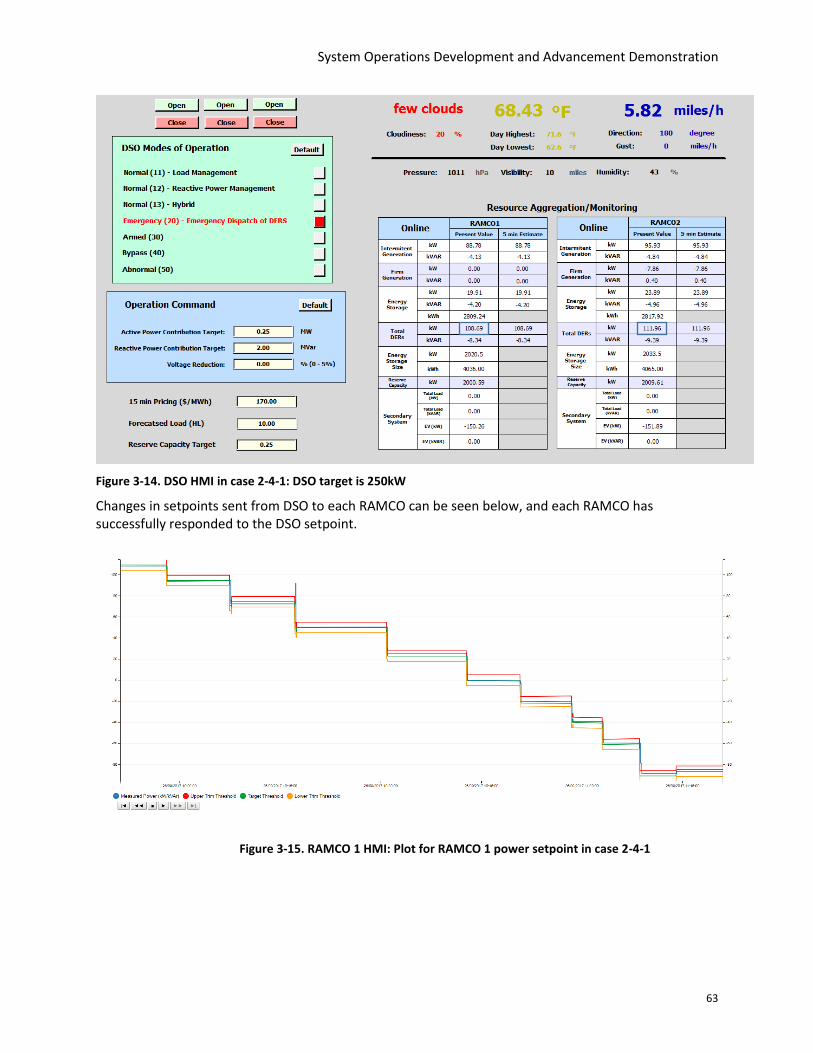
System Operations Development and Advancement Demonstration
63
Figure 3-14. DSO HMI in case 2-4-1: DSO target is 250kW
Changes in setpoints sent from DSO to each RAMCO can be seen below, and each RAMCO has successfully responded to the DSO setpoint.
Figure 3-15. RAMCO 1 HMI: Plot for RAMCO 1 power setpoint in case 2-4-1

System Operations Development and Advancement Demonstration
64
Figure 3-16. RAMCO 2 HMI: Plot for RAMCO 2 power setpoint in case 2-4-1
Table 3-7 summarizes observations when the DSO target is changed in steps.
Table 3-7. Changes in LRAM settings and their resources in case 2-4-1
DSO target (kW)
Changes in LRAMs
250 - PVs are at full generation - Batteries are being discharged at full rate - EVs are curtailed
200 & 150
- PVs are being curtailed - Batteries are either curtailed or started charging - EVs are curtailed
100 & 50
- PVs are curtailed - Batteries are all charging - EVs are curtailed
0 to -100
- PVs are curtailed - Batteries are being discharged at full rate - Some EVs started charging
-150 & -200
- EVs are charging

System Operations Development and Advancement Demonstration
65
Snapshots of the RAMCO 1 HMI are shown in Figure 3-17, which verify the changes mentioned in this table. Similar behavior is seen in RAMCO 2. As can be seen, results of this use case illustrate that as LRAM target reduces, the LRAM allocates the target according to a similar priority stack: first bringing the BESS into a charging state, followed by curtailment of PV when the storage enters a fully maximum charging setpoint. The EV charging is brought on once the PV has been curtailed, enabling additional capacity, which allows the PV to be released.
a) DSO target is 250 kW
b) DSO target is 0 kW
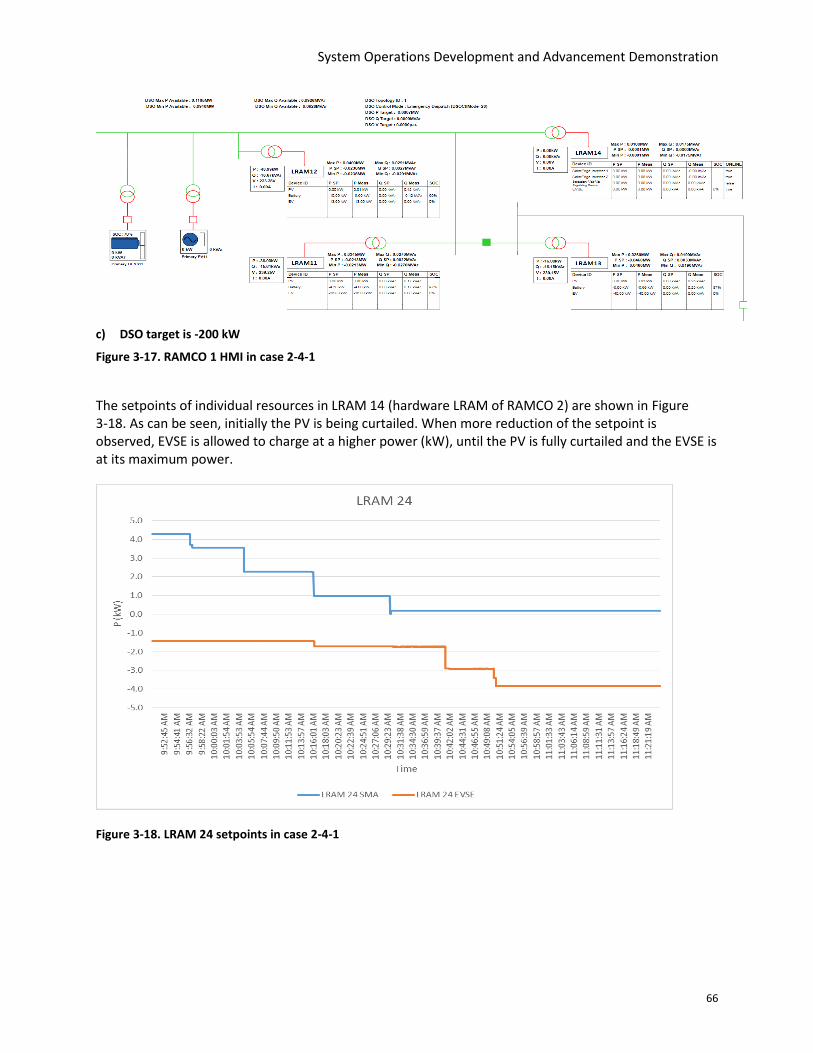
System Operations Development and Advancement Demonstration
66
c) DSO target is -200 kW
Figure 3-17. RAMCO 1 HMI in case 2-4-1
The setpoints of individual resources in LRAM 14 (hardware LRAM of RAMCO 2) are shown in Figure 3-18. As can be seen, initially the PV is being curtailed. When more reduction of the setpoint is observed, EVSE is allowed to charge at a higher power (kW), until the PV is fully curtailed and the EVSE is at its maximum power.
Figure 3-18. LRAM 24 setpoints in case 2-4-1

System Operations Development and Advancement Demonstration
67
Case 3-1: Reactive power management:
In this use case, DSO is set to reactive power management mode to send the reactive power contribution target requests to all RAMCOs. Based on these targets, RAMCOs should define the reactive power contribution targets for primary DERs and LRAMs in their operating region. The initial SOC of the primary batteries were set at 70% and PV profile was set at 70%. The reactive power contribution target from DSO was reduced in steps from 7MVAr to -7MVAr to assess the responses from RAMCOs and LRAMs.
Table 3-8 shows data recorded from the DSO for reactive power target of each RAMCO and primary DER. As can be observed, when DSO sent request for new reactive power contribution target, the target for RAMCO1 and RAMCO2 were updated based on this latest request. Reactive power contribution for each primary DER was also calculated and updated by each RAMCO to meet the target. The response illustrates the overall contribution is dominated by the primary assets that share the contribution in a pro-rata fashion.
Table 3-8. Summary of reactive power targets for each RAMCO and primary DERs
Timestamp DSO Q Target
RAMCO1 Q Target
RAMCO1_Batt Q Target
RAMCO1_PV Q Target
RAMCO2 Q Target
RAMCO2_Batt Q Target
RAMCO2_FG Q Target
RAMCO2_PV Q Target
Sep 27 2017 13:56
7.00 4.23 1.00 3.20 2.77 1.81 0.00 0.92
Sep 27 2017 14:07
4.00 2.42 0.50 1.89 1.58 1.07 0.00 0.55
Sep 27 2017 14:15
1.00 0.60 0.01 0.57 0.40 0.31 0.00 0.12
Sep 27 2017 14:22
0.00 0.00 -0.17 0.14 0.00 0.06 0.00 -0.03
Sep 27 2017 14:26
-1.00 -0.60 -0.35 -0.29 -0.40 -0.20 0.00 -0.18
Sep 27 2017 14:32
-7.00 -4.23 -1.12 -3.11 -2.77 -1.77 0.00 -0.95
Figure 3-19 shows the primary DERs reactive power measurements compared to the targets. It can be observed that for each step change from the DSO Q target, RAMCO1 and RAMCO2 could successfully send the updated Q target to the corresponding DERs, and reactive power measurements from each DER matched the target very well.

System Operations Development and Advancement Demonstration
68
Figure 3-19. Primary DERs reactive power target and measurement for each RAMCO
Figure 3-20 below shows a sample snapshot of RAMCO2 HMI interface to present the LRAM responses for the reactive power contribution. It can be observed that RAMCO 2 has sent the Q setpoint to each of the LRAMs, and then LRAMs determine the reactive power setpoints of secondary assets. Measurements show that reactive power contribution from the secondary assets meets the LRAM targets.

System Operations Development and Advancement Demonstration
69
Figure 3-20. HMI screenshot for RAMCO2 LRAMs with DSO Q target at -7 MVAr
Figure 3-21 shows the HMI reactive power measurements for each RAMCO. As can be observed, at RAMCO level, for each of the reactive power contribution target change from DSO, RAMCO target was updated based on the request and overall contributions from primary DERs and LRAMs could meet the contribution target.
Figure 3-21. Reactive power contribution measurement for RAMCO 1 & 2
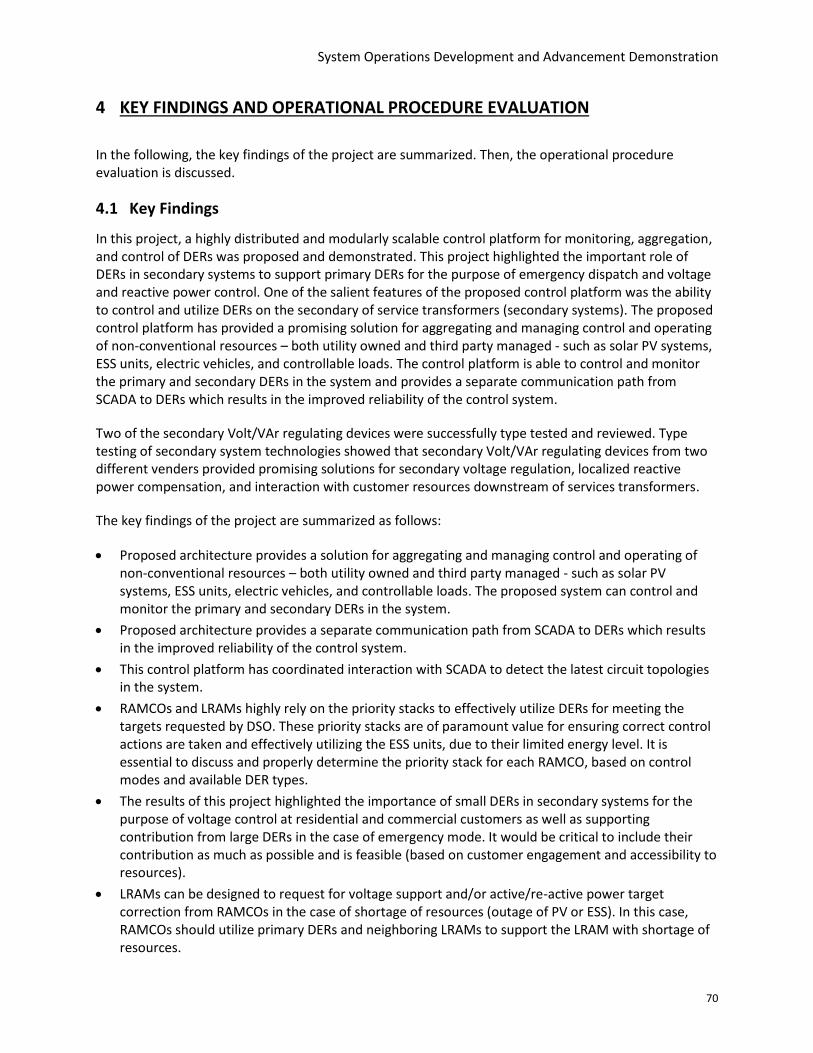
System Operations Development and Advancement Demonstration
70
4 KEY FINDINGS AND OPERATIONAL PROCEDURE EVALUATION
In the following, the key findings of the project are summarized. Then, the operational procedure evaluation is discussed.
4.1 Key Findings
In this project, a highly distributed and modularly scalable control platform for monitoring, aggregation, and control of DERs was proposed and demonstrated. This project highlighted the important role of DERs in secondary systems to support primary DERs for the purpose of emergency dispatch and voltage and reactive power control. One of the salient features of the proposed control platform was the ability to control and utilize DERs on the secondary of service transformers (secondary systems). The proposed control platform has provided a promising solution for aggregating and managing control and operating of non-conventional resources – both utility owned and third party managed - such as solar PV systems, ESS units, electric vehicles, and controllable loads. The control platform is able to control and monitor the primary and secondary DERs in the system and provides a separate communication path from SCADA to DERs which results in the improved reliability of the control system.
Two of the secondary Volt/VAr regulating devices were successfully type tested and reviewed. Type testing of secondary system technologies showed that secondary Volt/VAr regulating devices from two different venders provided promising solutions for secondary voltage regulation, localized reactive power compensation, and interaction with customer resources downstream of services transformers.
The key findings of the project are summarized as follows:
Proposed architecture provides a solution for aggregating and managing control and operating of non-conventional resources – both utility owned and third party managed - such as solar PV systems, ESS units, electric vehicles, and controllable loads. The proposed system can control and monitor the primary and secondary DERs in the system.
Proposed architecture provides a separate communication path from SCADA to DERs which results in the improved reliability of the control system.
This control platform has coordinated interaction with SCADA to detect the latest circuit topologies in the system.
RAMCOs and LRAMs highly rely on the priority stacks to effectively utilize DERs for meeting the targets requested by DSO. These priority stacks are of paramount value for ensuring correct control actions are taken and effectively utilizing the ESS units, due to their limited energy level. It is essential to discuss and properly determine the priority stack for each RAMCO, based on control modes and available DER types.
The results of this project highlighted the importance of small DERs in secondary systems for the purpose of voltage control at residential and commercial customers as well as supporting contribution from large DERs in the case of emergency mode. It would be critical to include their contribution as much as possible and is feasible (based on customer engagement and accessibility to resources).
LRAMs can be designed to request for voltage support and/or active/re-active power target correction from RAMCOs in the case of shortage of resources (outage of PV or ESS). In this case, RAMCOs should utilize primary DERs and neighboring LRAMs to support the LRAM with shortage of resources.

System Operations Development and Advancement Demonstration
71
RAMCOs can be designed to request for support from each other in the case of sudden outage of primary DERs.
A linkage between NMS and the DSO platform was proven to be beneficial and recommended to be implemented. The scheme can be used to coordinate the actions requiring both control systems working jointly. For instance, if the requested voltage reduction is not do-able, DSO can be designed to ask for SCADA help to change the voltage level of circuit by utilizing LTC and voltage regulators.
Proposed architecture was tested and proven to properly operate in three different modes:
Load management: based on changes in the electricity market prices, while maintaining a reserve capacity.
Reliable aggregation and monitoring of resources
Fast response to market price changes to ensure the economical utilization of ESS units, FG units, and PV systems
Coordinated utilization of resources by monitoring ESS units’ energy level, PV systems generation, and FG units’ generation schedule.
Reactive power management and secondary voltages:
Reactive power control mode change on primary DERs:
◦ Unity power factor control mode
◦ Reactive power control mode
◦ Q-V droop control mode
Coordinated reactive power sharing among DERs/LRAMs
◦ DERs are asked for reactive power contribution according to their reactive power ratings.
Successfully enforces conservative voltage reduction on all primary DERs and LRAMs.
◦ Use of secondary devices to successfully regulate the secondary voltages based on the setpoints send by DSO.
◦ Successful utilization of secondary system Volt/VAr regulation technologies.
Emergency dispatch:
Successful utilization of resources with following priority stacks:
◦ For releasing power:
‐ Releasing the curtailed power of PVs
‐ Releasing the curtailed power of FG units
‐ Discharging ESS units
◦ For curtailing power:
‐ Charging ESS units
‐ Curtailment of PVs if required
‐ Curtailment of FG units if required
Successful utilization of LRAMS:
◦ LRAMs performance were tested by turning off all primary DERs.
Primary DERs successfully switching to Q-V droop control mode to locally control their terminal voltage in emergency mode.

System Operations Development and Advancement Demonstration
72
4.2 System Operation Procedure Evaluation
One of the key focus of the project was to propose practical operating procedures for the DER aggregation platform to ensure acceptance and coordination with commonly utilized procedures by system operators. In planning and performing this demonstration, several challenges needed to be addressed. The concept of operation was developed to address some of the challenges, both from the design perspective and operational procedures. The concept of operation was validated and adjusted as needed. Based on the test results and use cases, the final observations and conclusions were reflected in the proposed operating procedures, which covered several topics related to the design, technology selection and deployment, including:
Field area broadband communications for data exchange among RAMCO units (at selected regions) and LRAM units (at selected service transformers).
Design aspect 1: the demo system design incorporated wireless radio devices to reflect the possible field challenges of dealing with wireless communications including: delays, latencies, and packet drops.
Design aspect 2: data reporting, commanding, and confirmation of the data receipt (handshaking) were handled in certain time steps and over pre-defined intervals that are long enough to ensure setpoints and status are properly exchanged, yet, the expected contribution targets are met within the market clearing time. For the real-time market, to avoid any penalties due to the lack of performances, the targets need to be confirmed within 5-minute intervals. In certain conditions, the setpoint changes as fast as 1 minute would be required. Hence, the time step of executing control signals and retrieving estimated values are managed to be in 30 second time frame.
Scaling of the control architecture involving several RAMCO devices (for instance, 50 to 100 units), and thousands of LRAM devices (for instance, 100 LRAM units per RAMCO x 50 RAMCO units = 5000 devices). In addition, there will be several primary connected large DERs that would also have associated site controllers integrated into RAMCO devices. In other words, the control system has to be able to easily manage over 10,000 units.
Design aspect 3: the possible limitations in the ultimate number of devices that can be handled by the aggregation architecture depends on the vendor product capabilities. The demo system incorporated 10 physical hardware devices (control nodes) to investigate challenges that may rise from the scaling aspect; however, additional evaluation will be required to observe and resolve any limitations.
Establish operating procedures to ensure separation of controls and monitoring for the aspects associated with managing DERs and participation in the energy and ancillary service markets, from conventional day-to-day operation system operation to supplying electricity to the customers.
Operating procedure 1: The design incorporated two distinct parts for the control center platform, namely: SCADA/DMS, and DSO. The SCADA/DMS will be primarily in charge of system operation (load and voltage management, circuit switching, and control of feeder devices). On the other hand, DSO is responsible for market interaction with ISO and determination of the contribution targets for the RAMCO units, based on the commands from SCADA and market price signals.
Operating procedure 2: Both RAMCO and LRAM design and operation procedures need to incorporate proper investigation of failsafe requirements, and provisions to mitigate adverse impact of DER products on the power quality of the distribution systems. The failsafe actions may vary by the type of the device and locations on the system; this does not necessarily mean

System Operations Development and Advancement Demonstration
73
it would be a continuation of operation based on previous setpoint, and/or reverting to a default setpoint. This has to be decided and evaluated based on the system operating conditions and resource availability. To avoid adverse impact of DER production on the circuit voltages, especially during the emergency conditions, the voltage-droop control mode was suggested and evaluated in the demo system. Voltage-droop method ensures that reactive power of the DER units are dynamically adjusted to maintain voltages within permissible range.
Operating procedures 3: Frequent charge and discharge of the energy storage units in response to market signals (especially regulation signals) and intermittent nature of large renewable energy resources can create other power quality concerns such as flicker issues or high frequency harmonic pollutions. These aspects were not investigated in the demo system, but they would require careful considerations in systems that include large number of DER units.
Other operational procedures need to be considered to assure proper involvement of and communications among third party (non-utility) aggregators at RAMCO or LRAM levels. Although the proposed architecture is capable of managing the third-party aggregators, this aspect was not covered in the scope of the demo system.
The project introduced and evaluated the proposed distributed control platform, and two new aggregation methods for managing large number of DERs of various nature (firm and variable) and of different sizes, distributed across the system and connected at primary and/or secondary systems. From the testing, demonstration, key findings and result analysis, it can be concluded that, the Regional Aggregation, Monitoring and Circuit Optimizers (RAMCO) and Local Resource Aggregators (LRAMs) can effectively coordinate and manage the operation of existing legacy and future control devices by utilizing the proposed distribution control methodology.
Several performance metrics were introduced and evaluated to address the level of aggregation, resource estimation and controllability required for a system with level of DER penetration. From these performance metrics and evaluation, it was demonstrated and concluded that the proposed control platform was able to perform DER dispatch and follow the contribution request based on various operating scenarios during normal and contingency conditions to effectively engage various types of energy resources on the system in managing circuit loading and voltage/reactive power profiles. In lab testing and pre-commercial demonstration results concluded and demonstrated that, the operator’s ability to monitor and control DERs across the system with greater details and to make informed decisions, additional levels of complexity, increase in penetration and integration of customer technologies, will not become a barrier for deployment of DERs. It was also demonstrated that same level of reliability and efficiency can be achieved for a system with high penetration of DERs.

System Operations Development and Advancement Demonstration
74
5 SUMMARY OF RECOMMENDATIONS AND NEXT STEPS
The recommendations and next steps are summarized as follows:
It is recommended that the operating practices introduced in this project be further examined
for their commercial viability. The investigation should cover both utility-owned and non-utility
assets to specify proper circuit level and service level aggregators and associated
control/operation functions. A business case would need to be developed.
To transition the proposed aggregation system to the product stage for deployment and
operation in real-world distribution systems, the following steps are recommended.
o Integration between DMS/SCADA and DER aggregation platform at control center level is
recommended, so data and target system configuration and topology can be seamlessly
exchanged between the field aggregators and control center platforms to avoid adverse
effect on system operation, power quality and device to device coordination.
o For the above-mentioned points, it is recommended to develop requirements for standard
platforms for integrating DMS/SCADA and DER aggregation as part of the control center
functions to properly utilize the existing controls, models, databases and the two-way
status communications.
o It is recommended to incorporate the proposed DER aggregation system into a field
message bus platform that can accommodate all DER assets and the platform can be easily
scaled up.
o A pilot project incorporating part of distribution systems is recommended to learn
unknown (field specific) challenges and to test real-world issues. The pilot project would
also clarify the skills development and training requirements needed for widespread
commercial adoption of the demonstrated concepts.
o It is also recommended to implement and evaluate other grid supporting applications of
aggregated DER controls such as creation of a distributed primary frequency control
approach to compensate for the absence of conventional generators with rotating mass.
It is recommended to consider various control and monitoring schemes of the proposed control platform from the real-world deployment perspective and scalability required for real world implementation. The design and verifications as part of the pre-commercial demonstration in the laboratory environment incorporated various considerations on this subject, primarily from the perspective of using wireless communications (radio modems), and adding multiple control agents to assess any impact of latency and packet losses on the performance of the schemes. Additional considerations and testing in the field environment will be needed to ensure proper design evaluation.
To publicize the proposed control platform and share the findings with the industry, SDG&E will widely announce the availability of the project report. Additionally, the project team will seek publication in top ranking journals and panel presentation on the topic in conference venues. The publications and presentation will focus on discussing key features of the concept of operation and demonstration results.

System Operations Development and Advancement Demonstration
75
6 METRICS AND VALUE PROPOSITION
This section describes the metrics used in the project for evaluation of the results and performance of the aggregated control platform and secondary system Volt/VAr management technologies. In addition, the value proposition associated with the project is described in this section.
6.1 Metrics
The metrics in the Table 6-1 were identified for this project and are referenced to the appropriate section.
Table 6-1. Project Metrics
List of Proposed Metrics and Potential Areas of Measurement (as applicable to a specific project or
investment area in applied research, technology demonstration, and market facilitation) – See EPIC
document for reference.
Remark & Reference
1. Potential energy and cost savings
a. Number and total nameplate capacity of distributed generation facilities
Included & verified;
15 sites were included in the demo system and tested
For more information, refer to section 2.
e. Peak load reduction (MW) from summer and winter programs
Included & verified;
One of the implemented use cases was focused on Circuit Level Load Management and Emergency Dispatch. Based on aggregated resources, up to 20% load reduction was achieved
For more information refer to section: 3
3. Economic benefits
c. Reduction in electrical losses in the transmission and distribution system
Included & verified;
The demonstrated method incorporated Volt/VAR management at primary and secondary level, to reduce kVA and losses; up to 3% in the tested case

System Operations Development and Advancement Demonstration
76
List of Proposed Metrics and Potential Areas of Measurement (as applicable to a specific project or
investment area in applied research, technology demonstration, and market facilitation) – See EPIC
document for reference.
Remark & Reference
For more information refer to section: 3
d. Number of operations of various existing equipment types (such as voltage regulation) before and after adoption of a new smart grid component, as an indicator of possible equipment life extensions from reduced wear and tear
The propose method utilizes fast action of DERs and secondary resources to reduce voltage and load fluctuations, and enhance life cycle assessment. Unnecessary tap operations were eliminated. Cap switching was prevented.
For more information refer to section: 2.
5. Safety, Power Quality, and Reliability (Equipment, Electricity System)
b. Electric system power flow congestion reduction Included & verified;
In emergency mode of the control platform, the circuit level power flow and demand were managed through control of aggregated resources to prevent congestion.
For more information refer to section: 3
i. Increase in the number of nodes in the power system at monitoring points
Real time monitoring and 5 min or 10 min system prediction were included as the integral part of the platform design. PMU system provided also high-resolution data for enhanced visualization.
For more information refer to section: 2
7. Identification of barriers or issues resolved that prevented widespread deployment of technology or strategy
b. Increased use of cost-effective digital information and control technology to improve reliability, security, and efficiency of the electric grid (PU Code § 8360)
Included & verified;
Integration between SCADA/DMS and the DER Aggregation platform was identified as a key cost-effective

System Operations Development and Advancement Demonstration
77
List of Proposed Metrics and Potential Areas of Measurement (as applicable to a specific project or
investment area in applied research, technology demonstration, and market facilitation) – See EPIC
document for reference.
Remark & Reference
solution to ensure integrity of the system.
For more information refer to section: 3
f. Deployment of cost-effective smart technologies, including real time, automated, interactive technologies that optimize the physical operation of appliances and consumer devices for metering, communications concerning grid operations and status, and distribution automation (PU Code § 8360)
Included and verified;
Grid-edge devices at secondary level, and integration/aggregation platform for distributed controls were introduced as part of the proposed control system.
For more information, refer to section: 2
8. Effectiveness of information dissemination
d. Number of information sharing forums held Included and Performed;
Multiple meetings and workshop held with stakeholders and team.
For more information, refer to sections: 1 and 2
e. Stakeholders attendance at workshops Included and performed;
Stakeholder from various departments and group related to operation and planning were selected and invited to workshops.
For more information, refer to sections: 1 and 2
f. Technology transfer Plan was made for knowledge transfer through open forum and conferences. A panel presentation was offered in DistribuTECH 2018, in San Antonio, TX.
For more information, refer to section: 4.4

System Operations Development and Advancement Demonstration
78
6.2 Primary Value Proposition
EPIC provides project funding for applied research and development, technology demonstration and deployment, and market facilitation for clean energy resources. To be approved, the projects must provide value to customers. This project has provided multiple values by supporting benefits related to improved reliability, lower costs, safety improvement, and environmental benefits.
Greater Reliability
Higher level of awareness and greater reliability indices are expected from a system that can effectively utilize DERs across the system to manage loads and generation locally and provide near real-time estimates of system status to the operator. It can be shown that system stability and reserve margins are greatly improved, by properly dispatching large centralized resources, as well as tapping into the resources on the secondary systems (low voltage level) that were previously neglected in the overall stability and performance assessment of the system. Instead of dropping loads, the resource estimate can be utilized during emergency to compensate for the load curtailment.
Lower Costs
Effective use of resources at local and regional scale will allow for proper reactive power flow management, voltage control, and localized load balancing, all of which will support reduction in losses and increase in system efficiency. In addition, enabling participation in wholesale market and optimizing the use of the resources based on variation in the price signal might bring in additional revenue for the ratepayers.
6.3 Secondary Value Proposition
This secondary value propositions for the project are safety improvement and environmental benefits.
Increased Safety and/or Enhanced Environmental Sustainability
Because the focus of the proposed advanced operating system is on improving the system visibility and dispatchability, as well as providing faster and more reliable methods for operating the system, safety and integrity enhancement of the system will be the main target. Fast actions are becoming possible based on processing and visualizing high resolution of field data in near real-time, and access to DERs for managing reserve capacity and production level. In addition, because the system becomes more observable and controllable, more customer system installation requests and interconnection applications can be processed to expedite the integration and increase the penetration levels.
Adaptability to other utilities and/or the broader industry
The findings and recommendations on the control system architecture and concept of operation procedures are relevant to various activities of other IOUs in California and elsewhere. Many utilities are focusing on developing remote dispatch and control capabilities for growing levels of DERs in their service territory. The initiatives are based on adding new control functions to existing DMS/SCADA, or introducing new DERMS concept. Either approach will be able to benefit from common aspects of this project and lessons learned on considerations for scalability and aggregation at two levels.

System Operations Development and Advancement Demonstration
79
7 REFERENCES
[1] J. D. Taft and A. Becker-Dippmann, “Grid Architecture,” A report by Pacific Northwest National
Lab (PNNL), Jan. 2015.
[2] L. Kristoff and P. de Martini, "21st Century Electric Distribution System Operations,", May 2014

System Operations Development and Advancement Demonstration
80
8 APPENDICES
8.1 Appendix A: RAMCO/LRAM Priority Stacks for Emergency Dispatch of DERs for
Demand Side Management Use Case
RAMCOs and LRAMs use a priority stack to utilize the DERs depending on the command received from the DSO. Depending on the DSO target update RAMCO might need to curtail or release DERs contribution. Depending on the contribution release or curtail request, RAMCO should use appropriate priority stack to effectively utilize DERs. In Error! Reference source not found. to Table 8-6, the priority stacks of RAMCO1 and RAMCO2 are summarized for different circuit configurations. The location of primary DERs and LRAMs is shown in Figure 2-3. Table 8-7 shows the priority stack used for a typical LRAM.
Table 8-1. Priority Stack of RAMCO1 in Topology 1
RAMCO1 - Topology1 - (Power Curtail)
Priority
1 BESS11
2 PV11
3 LRAM11 LRAM12 LRAM13 LRAM14
RAMCO1 - Topology1 - (Power Release)
Priority
1 PV11
2 BESS11
3 LRAM11 LRAM12 LRAM13 LRAM14
Table 8-2. Priority Stack of RAMCO1 in Topology 2
RAMCO1 - Topology2 - (Power Curtail)
Priority
1 BESS11

System Operations Development and Advancement Demonstration
81
2 PV11
3 LRAM11 LRAM12 LRAM14
RAMCO1 - Topology2 - (Power Release)
Priority
1 PV11
2 BESS11
3 LRAM11 LRAM12 LRAM14
Table 8-3. Priority Stack of RAMCO1 in Topology 3
Table 8-4. Priority Stack of RAMCO2 in Topology 1
RAMCO2 - Topology1 - (Power Curtail)
Priority
1 BESS21
2 FG21
Priority
1 BESS11
2 FG21
3 PV11
4 LRAM11 LRAM12 LRAM13 LRAM14 LRAM22 LRAM23
Priority
1 PV11
2 FG21
3 BESS11
4 LRAM11 LRAM12 LRAM13 LRAM14 LRAM22 LRAM23
RAMCO1 - Topology3 - (Power Curtail)
RAMCO1 - Topology3 - (Power Release)

System Operations Development and Advancement Demonstration
82
3 PV21
4 LRAM21 LRAM22 LRAM23 LRAM24
RAMCO2 - Topology1 - (Power Release)
Priority
1 PV21
2 FG21
3 BESS21
4 LRAM21 LRAM22 LRAM23 LRAM24
Table 8-5. Priority Stack of RAMCO2 in Topology 2
Table 8-6. Priority Stack of RAMCO2 in Topology 3
RAMCO2 - Topology3 - (Curtail)
Priority
1 BESS21
2 FG21
3 PV21
4 LRAM21 LRAM22 LRAM23 LRAM24 LRAM13
Priority
1 PV21
2 FG21
3 BESS21
4 LRAM21 LRAM22 LRAM23 LRAM24 LRAM13
RAMCO2 - Topology2 - (Curtail)
RAMCO2 - Topology2 - (Release)

System Operations Development and Advancement Demonstration
83
Priority
1 BESS21
2 PV21
3 LRAM21 LRAM24
RAMCO2 - Topology3 - (Release)
Priority
1 LRAM21 LRAM24
2 PV21
3 BESS21
Table 8-7. Priority Stack of a typical LRAM
Priority Power Curtail Power Release
1 Connect Non-Critical Load Release PV if already curtailed
2 Charge EV Discharge Batt
3 Charge Batt Discharge EV
4 Curtail PV Disconnect Non-Critical Load
8.2 Appendix B: Test Plan and Results for Type Tests of Secondary Regulating Devices
The objective of the type testing was to evaluate the operation and performance of the secondary system technologies through a laboratory testbed setup, including a simple test circuit in digital simulation platform, grid simulator, load banks, and PV inverters to represent residential loads. Devices from two different vendors were selected as DUTs for the type test purpose. Both of the DUTs selected have similar functions for secondary voltage regulation, reactive power compensation or power factor correction.

System Operations Development and Advancement Demonstration
84
Type Test Plan
Based on the devices’ specification, the following test categories and cases were considered in the test plan and performed during type test.
8.2.1.1 Category 1: DUT initialization and start up test
The purpose of this test category was to test the operating threshold and limits of DUT. DUT was connected with a fixed 5kW resistive load bank on each phase. Voltage output from grid simulator was reduced or increased until DUT cannot regulate load voltage and stops or follows the voltage, to determine the drop off voltages.
Case 1-1: Set device voltage setpoint at nominal voltage, reduce grid simulator voltage by 5% step (12V) with 30 seconds interval between each step, until the system voltage went below the device drop off voltage, to test the drop off low voltage.
Case 1-2: Set device voltage setpoint at nominal voltage, increase grid simulator voltage by 5% step (12V) with 30 seconds interval between each step, until the system voltage went above the device cut off voltage, to test the drop off high voltage.
8.2.1.2 Category 2: Voltage regulation performance test
The purpose of this test category was to test whether DUTs could regulate the load voltage at a desired setpoint. The following operating modes were considered based on the devices’ specification and availability:
Voltage regulation only
Voltage regulation + reactive power adjustment
Voltage regulation + power factor adjustment
Several test groups were considered in this test category.
8.2.1.2.1 Group1: Performance test with upstream voltage changes
Group 1 test is designed for voltage regulation test at setpoint with different upstream voltages. The tests were repeated for each of the three service transformer locations (A, B, and C). Set the voltage reference for device under test at 120V line to neutral / 240V line to line.
1) Upstream voltage variation (higher/lower than the DUT’s setpoint) with downstream resistive load banks:
o Light load condition (5 kW downstream resistive load on each phase) Case 2-1-1: 5% / 10% step voltage increase at the source for 20 seconds, then
change to initial value for 10 seconds, and then following by 5% / 10% voltage decrease for 20 seconds
Case 2-1-2: ramp up the voltage at the source by 5% / 10% with a ramp rate of 1% per second, following a sudden drop to initial value
Case 2-1-3: ramp down the voltage at the source by 5% / 10% with a ramp rate of -1% per second, following a sudden increase to initial value
o Heavy load condition (20 kW downstream load on each phase)

System Operations Development and Advancement Demonstration
85
Case 2-1-4: 5% / 10% step voltage increase at the source for 20 seconds, then change to initial value for 10 seconds, and then following by 5% / 10% voltage decrease for 20 seconds
Case 2-1-5: ramp up the voltage at the source by 5% / 10% with a ramp rate of 1% per second, following a sudden drop to initial value
Case 2-1-6: ramp down the voltage at the source by 5% / 10% with a ramp rate of -1% per second, following a sudden increase to initial value
2) Upstream voltage variation (higher/lower than the DUT’s setpoint) with reverse power flow created by PV inverter
o 5KW PV inverter reverse power flow: Case 2-1-7: 5% / 10% step voltage increase at the source for 20 seconds, then
change to initial value for 10 seconds, and then following by 5% / 10% voltage decrease for 20 seconds
Case 2-1-1 to 2-1-7 were also repeated for a higher voltage step change (10-15%) to evaluate the performance when input voltage exceeds devices’ voltage regulation capability.
3) Voltage variations under off-nominal frequency test: Test cases with system frequency from 59.7Hz to 60.3Hz.
o Set the source frequency at 59.7 Hz. Repeat test cases 2-1-4 to 2-1-7
o Set the source frequency at 60.3 Hz Repeat test cases 2-1-4 to 2-1-7
o Set downstream load at 40 kVA, ramp up the frequency at the source from 59.7Hz to 60.3Hz with a ramp rate of 0.03Hz per second, following a sudden drop to initial value
8.2.1.2.2 Group2: Performance test with downstream Load variation
Group 2 test was designed for voltage regulation test at setpoint with downstream load variation. The tests were performed for service transformer location C. Each designed test cases were repeated 3 times for test results validation.
1) Resistive downstream loads: load variation with resistive loads step change o Case 2-2-1: 5 kW initial load on each phase with 5 kW step load increase of resistive
load bank until 20 kW on each phase, and 10 second interval between each step change.
2) Load variation with change in the load flow direction o Case 2-2-2: 2.5 kW resistance load on each phase for 10 second, then switch on 5 kW
PV inverter (unit power factor) for 30 seconds, then switch off PV inverter. o Case 2-2-3: 1.5 kW resistance load on each phase for 10 second, then switch on 5 kW
PV inverter (unit power factor) for 30 seconds, then switch off PV inverter. o Case 2-2-4: 0.5 kW resistance load on each phase for 10 second, then switch on 5 kW
PV inverter (unit power factor) for 30 seconds, then switch off PV inverter. o Case 2-2-5: 0.5 kW resistance load on each phase for 10 second, then switch on 5 kW
PV inverter (0.8 power factor leading) for 30 seconds, then switch off PV inverter. o Case 2-2-6: 0.5 kW resistance load on each phase for 10 second, then switch on 5 kW
PV inverter (0.8 power factor lagging) for 30 seconds, then switch off PV inverter.

System Operations Development and Advancement Demonstration
86
8.2.1.2.3 Group3: Performance test with system disturbance (sag/swell) at upstream
Group 3 test was designed for voltage regulation test at setpoint with system disturbance (voltage sag/swell) at upstream. The tests were repeated for each of the three service transformer locations (A, B and C). Digital simulation platform was used to simulate the voltage sag/swell at the upstream system. Set the voltage reference for device under test at 120 V per line (240 V line to line).
1) Voltage sag test: o Light load condition:
Case 2-3-1: Nominal source voltage with 5 kW resistive load bank on each phase for 10 second, then apply voltage sag of 80% of nominal voltage at source lasting 10 second and go back to nominal voltage.
Case 2-3-2: Nominal source voltage with 5 kW resistive load bank on each phase, and 5 kW PV inverter for 10 second, then apply voltage sag of 80% of nominal voltage at source lasting 10 second and go back to nominal voltage.
Case 2-3-3: Nominal source voltage with 5 kW resistive load bank on each phase for 10 second, then apply voltage sag of 70% of nominal voltage at source lasting 0.5 second and go back to nominal voltage.
Case 2-3-4: Nominal source voltage with 5 kW resistive load bank on each phase, and 5 kW PV inverter for 10 second, then apply voltage sag of 70% of nominal voltage at source lasting 0.5 second and go back to nominal voltage.
o Heavy load condition: Case 2-3-5: Nominal source voltage with 20 kW resistive load bank on each phase
for 10 second, then apply voltage sag of 80% of nominal voltage at source lasting 10 second and go back to nominal voltage.
Case 2-3-6: Nominal source voltage with 20 kW resistive load bank on each phase, and 5 kW PV inverter for 10 second, then apply voltage sag of 80% of nominal voltage at source lasting 10 second and go back to nominal voltage.
Case 2-3-7: Nominal source voltage with 20 kW resistive load bank on each phase for 10 second, then apply voltage sag of 70% of nominal voltage at source lasting 0.5 second and go back to nominal voltage.
Case 2-3-8: Nominal source voltage with 20 kW resistive load bank on each phase, and 5 kW PV inverter for 10 second, then apply voltage sag of 70% of nominal voltage at source lasting 0.5 second and go back to nominal voltage.
2) Voltage swell test: o Light load condition:
Case 2-3-9: Nominal source voltage with 5 kW resistive load bank on each phase for 10 second, then apply voltage swell of 120% of nominal voltage at source lasting 0.5 second and go back to nominal voltage.
Case 2-3-10: Nominal source voltage with 5 kW resistive load bank on each phase, and 5 kW PV inverter for 10 second, then apply voltage swell of 120% of nominal voltage at source lasting 0.5 second and go back to nominal voltage.
o Heavy load condition: Case 2-3-11: Nominal source voltage with 20 kW resistive load bank on each
phase for 10 second, then apply voltage swell of 120% of nominal voltage at source lasting 0.5 seconds and go back to nominal voltage.

System Operations Development and Advancement Demonstration
87
Case 2-3-12: Nominal source voltage with 20 kW resistive load bank on each phase, and 5 kW PV inverter for 10 second, then apply voltage swell of 120% of nominal voltage at source lasting 0.5 seconds and go back to nominal voltage.
8.2.1.3 Category 3: Reactive power compensation performance test
The purpose of this test category was to test whether DUT could inject/absorb reactive power, or regulate the power factor at desired setpoints. The tests were performed at service transformer locations C (or any location deemed sensitive to group 1 tests).
The following test groups were considered in this test category.
8.2.1.3.1 Group1: Performance test with reactive power injection/absorption (based on DUTs’
capability)
Group 1 test was designed to test devices’ reactive power injection/absorption capability at setpoint. For group 1 test, the source voltage was set to 120 V per line (240 V line to line).
1) 5 kVAr VAr injection/absorption setting with resistive load step change o Case 3-1-1: 5 kVAr injection setting of DUT, 5 kW step load increase of resistive load
bank on each phase until 20 kW per phase, with 10 second interval between each step change.
o Case 3-1-2: 5 kVAr absorption setting of DUT, 5 kW step load increase of resistive load bank on each phase until 20 kW per phase, with 10 second interval between each step change.
2) 5 kVAr VAr injection/absorption setting with PV inverter switching o Case 3-1-3: 5 kVAr injection setting of DUT, with 3 kW resistance load on each phase for
10 second, then switch on 5 kW PV inverter with 0.8 power factor lagging for 30 seconds, then switch off PV inverter.
o Case 3-1-4: 5 kVAr injection setting of DUT, with 3 kW resistance load on each phase for 10 second, then switch on 5 kW PV inverter with 0.8 power factor leading for 30 seconds, then switch off PV inverter.
o Case 3-1-6: 5 kVAr absorption setting of DUT, with 3 kW resistance load on each phase for 10 second, then switch on 5 kW PV inverter with 0.8 power factor lagging for 30 seconds, then switch off PV inverter.
o Case 3-1-7: 5 kVAr absorption setting of DUT, with 3 kW resistance load on each phase for 10 second, then switch on 5 kW PV inverter with 0.8 power factor leading for 30 seconds, then switch off PV inverter.
8.2.1.3.2 Group2: Performance test with power factor regulation
Group 2 test was designed for downstream power factor regulation at setpoint. For group 2 test, the source voltage was set to the source voltage was set to 120 V per line (240 V line to line).
1) Power factor setting at 0.85 lagging: load variation with resistive loads step change o Case 3-2-1: 1 kW step load increase of resistive load bank on each phase until 5 kW per
phase, with 20 second interval between each step change. 2) Power factor setting at 0.85 leading: load variation with resistive loads step change

System Operations Development and Advancement Demonstration
88
o Case 3-2-2: 1 kW step load increase of resistive load bank on each phase until 5 kW per phase, with 20 second interval between each step change.
3) Unity power factor setting with PV inverter switching o Case 3-2-3: Unity power factor setting of DUT 1, with 3 kW resistance load on each
phase for 10 second, then switch on 5 kW PV inverter with 0.8 power factor lagging for 30 seconds, then switch off PV inverter.
o Case 3-2-4: Unity power factor setting of DUT 1, with 3 kW resistance load on each phase for 10 second, then switch on 5 kW PV inverter with 0.8 power factor leading for 30 seconds, then switch off PV inverter.
8.2.1.4 Category 4: Operation performance test (communication test)
The purpose of this test category was to test whether DUT could be controlled by communication. Device control settings were set through communication with LRAM device:
1) Voltage regulation setting test: Voltage setpoint/bandwidth change through communication o Case 4-1: Set initial voltage reference at 120V / 240V, send a setting command through
LRAM to change the reference to125V / 250 V, and record the time it takes to apply reference.
o Case 4-2: Set initial voltage reference at 120V / 240V, send a setting command through LRAM to change the reference to 115V / 230 V, and record the time it takes to apply reference
2) Reactive power setting test: reactive power setpoint change through communication o Case 4-3: Set initial reactive power reference at 0 kVAr, send a setting command
through LRAM to change the reference to 1 kVAr, and record the time it takes to apply reference
o Case 4-4: Set initial reactive power reference at 0 kVAr, send a setting command through LRAM to change the reference to -1 kVAr, and record the time it takes to apply reference
3) Power factor setting test: power factor setpoint change through communication o Case 4-5: Set initial reactive power factor reference at 1 (unit PF), send a setting
command through LRAM to change the reference to 0.9 lagging, and record the time it takes to apply reference
o Case 4-6: Set initial reactive power factor reference at 1 (unit PF), send a setting command through LRAM to change the reference to 0.9 leading, and record the time it takes to apply reference
o Case 4-7: Set Device initial operation mode at voltage regulation with power factor correction off, with 5 kW PV inverter with 0.8 power factor leading for 30 seconds. Then send a setting command through LRAM to change DUT to voltage regulation mode with power factor correction on. Record the time it takes to apply the change.
o Case 4-4: Set DUT initial operation mode at voltage regulation with power factor correction on, with 5 kW PV inverter with 0.8 power factor leading for 30 seconds. Then send a setting command through LRAM to change GDUT to voltage regulation mode with power factor correction off. Record the time it takes to apply the change.

System Operations Development and Advancement Demonstration
89
Type Test Results
8.2.2.1 DUT A
Throughout most experiments, DUT A was successful in regulating the load side voltage, compensating the reactive power and/or correcting the power factor to the desired setpoint if possible, or using its maximum available capacity toward satisfying the aforementioned setpoints, as expected. Reverse power flow and off-nominal system frequency (59.7Hz to 60.3Hz considered in the test) show no impact on the performance with regard to voltage regulation, reactive power compensation, and power factor correction.
Table 8-8. Type Test Results Summary of DUT A for Each Test Category
Test Category Test Description Test groups Test results
1 Initialization and start up test
PASS
2 Voltage regulation performance test
Source voltage change ( Step change / Voltage Ramp)
PASS
Voltage sag / swell PASS
Load step change PASS
Reverse power flow PASS
Off-nominal Frequency PASS
3 Reactive power compensation performance test
Reactive power generation / Absorption
PASS
Power factor correction PASS
Off-nominal Frequency PASS
4 Communication test Dynamic setting change PASS
Initialization and startup test
Set DUT A voltage reference at 240V, grid simulator starting voltage at 240V.
Reduce grid simulator voltage by 2.5% - 5% step (6-12V), with about 30 seconds interval between each step, to test the drop off low voltage (Input voltage range is 132V to 300V).
Figure 8-1 shows the RMS voltage variation measurements for phase 1. Source voltage was reduced step by step and DUT A load side voltage was monitored. As can be observed, when source voltage stayed above 66V (0.55 p.u.), DUT A boosted the voltage by around 10% of the nominal value (12 V per phase). Immediately when the source voltage went below 0.55p.u. (65.36V 1 phase, 0.545 p.u.), DUT A entered bypass mode and source voltage was bypassed to the load side. A 6V bandwidth was observed to exit bypass mode due to low voltage. When the source voltage increased to greater than 0.6 p.u. (72V per phase), DUT A exited bypass mode after 55 seconds, and started to boost voltage by 10% (12 V).

System Operations Development and Advancement Demonstration
90
Figure 8-1. RMS Voltage Measurements for DUT A: Drop Off Voltage Test
Voltage ramp test:
Ramp down the voltage at the source by 15% with a ramp rate of -1.5% per second, following a sudden increase to initial value.
Figure 8-2 shows the RMS voltage measurements of source and load voltage for the test case. As can be observed, before source voltage started to ramp down, load voltage was regulated very close to 120V. When phase 1 source voltage started to ramp down, since source voltage after 15% ramp up was out of the 10% regulation range, the load side voltage was regulated at round 120V and started to follow the source voltage after source voltage was lower than 90% of nominal voltage. An approximate 12V difference between source and load voltage could be observed after source voltage was below 90% of nominal voltage; similar performance was observed on phase 2.

System Operations Development and Advancement Demonstration
91
Figure 8-2. RMS Voltage Measurements for DUT A: Voltage Ramp Test
Power factor regulation test:
0.85 PF lagging setting of DUT A , step load increase of resistive load bank on each phase until 7 kW per phase, with 10 second interval between each step.
Figure 8-3 shows the RMS voltage measurements of DUT A source and load voltage, power and PF measurements at source side for Phase 1. As can be observed, during the load switching from 1kW to 7kW, since DUT A was set to PF regulation at 0.85 generating VAr, it can be observed that when resistive load was below 4kW (2.5 kVAr demand for 0.85 PF), power factor could be regulated at 0.85. When the load was increased to 5 kW, since the maximum VAr generation from DUT A is 2.5 kVAr per phase, DUT A remained the maximum VAr generation and power factor started to increase. A slow adjustment on the power factor to setpoint could be observed.
Figure 8-3. Phase 1 P, Q & PF Measurements of Power Factor Regulation Test

System Operations Development and Advancement Demonstration
92
8.2.2.2 DUT B
Throughout most experiments, DUT B was successful in regulating the load side voltage, and correcting the power factor to unity power factor at source side. Reverse power flow and off-nominal system frequency (59.7Hz to 60.3Hz considered in the test) show no impact on the performance of voltage regulation and power factor correction.
Table 8-9. Type Test Results Summary of DUT B for Each Test Category
Test Category
Test Description Test groups Test results
1 Initialization and start up test PASS
2 Voltage regulation performance test
Source voltage change (Step change / Voltage Ramp)
PASS
Voltage sag / swell PASS
Load step change PASS
Reverse power flow PASS
Off-nominal Frequency PASS
3 Reactive power compensation performance test
Power factor correction PASS
Off-nominal Frequency PASS
4 Communication test Dynamic setting change PASS
Initialization and startup test:
Set DUT B voltage reference at 120V per phase, grid simulator starting voltage at 120V.
Reduce grid simulator voltage by 2.5% - 5% step (6-12V), with about 30 seconds interval between each step, to test the drop off low voltage (Input voltage range is 100V to 138V per phase).
Figure 8-4 shows the RMS voltage variation measurements for Phase 1. Source voltage was reduced step by step and DUT B load side voltage was monitored. As can be observed, when source voltage stayed above 100V, DUT B boosted the voltage by around 10V. When the source voltage went between 84V and 100V per phase, DUT B entered bypass mode and source voltage was bypassed to the load side after about 1 second. When the source voltage increased to greater than 103V, DUT B exited bypass mode after 5 minutes, and started to boost voltage by 10V per phase. When the source voltage went below 84V per phase, DUT B entered bypass mode and source voltage was bypassed to the load side after 1 cycle.

System Operations Development and Advancement Demonstration
93
Figure 8-4. RMS Voltage Measurements for DUT B: Drop Off Voltage Test
Voltage ramp test:
Ramp down the voltage at the source by 10% with a ramp rate of -1% per second, following a sudden increase to initial value.
In this test, voltage setpoint was 118 V for phase 2 and 122 V for phase 1. A 10% ramp down change in the source voltage was performed. Also, unbalanced loads were considered for this case, with 6 kW on phase 1 and 1 kW phase 2. As can be seen, DUT B regulated the voltage as expected. At point A, source voltage on phase 1 went below the 10 V difference with the DUT B voltage setpoint of phase 1; hence, the load voltage started to deviate from the setpoint. Similar condition is seen at point B for phase 2.

System Operations Development and Advancement Demonstration
94
Figure 8-5. RMS Voltage Measurements for DUT B: Voltage Ramp Test
Reactive power test:
10 kW reverse power flow, change PF (for both PV inverters) from 1 to 0.8 lagging, then change to 0 (pushing 13 kVAr back to system), then follow the same process with leading power factor of inverter.
Figure 8-6 shows the active power measurement of both phases combined (total active power) at the source side, as well as the total reactive power at the source and load side. As can be seen in this figure, in cases where satisfying the unity power factor at the source side required less than 10 kVAr reactive support from DUT B, it kept the source power factor at unity. When the PV inverters power factor changed to zero, the reactive power injected to/absorbed from the system was around 13 kVAr. As can be seen, DUT B was capable of absorbing /providing 10 kVAr of this amount from/to the system. During this test, voltage of the load has been regulated at the desired setpoint, as seen in Figure 8-7.

System Operations Development and Advancement Demonstration
95
Figure 8-6. Active and Reactive Power Measurements for DUT B: Reactive Power Test
Figure 8-7. RMS Voltage Measurements for DUT B Reactive Power Test

System Operations Development and Advancement Demonstration
96
8.3 Appendix C: FAT Test Plan and Results
FAT Test Plan
This section outlines the proposed test cases and steps taken to assess the performance of the project system architecture during the FAT. The test cases were categorized into two main categories, namely Verification Test Cases and Application Test Cases.
8.3.1.1 Verification Test Cases
8.3.1.1.1 Communication Test Cases
A number of tests were performed to verify communications among different players. The communication paths that were tested in FAT are shown in Figure 2-7.
For each communication path, the steps below were taken for verifying communication:
1. IP/Port number verification: In this test, connectivity between two devices was established
through verification of IP and port numbers.
2. Analogue input (measurements) readings: This test verified that master device can read
measurements from the slave device.
3. Analogue output (setpoints) writing by master device: This test verified that master device can
write setpoints on the slave device.
4. Binary input (status) reading by master device: This test verified that master device can read
status from the slave device.
5. Binary output (commands) writing by master device: This test verified that master device can
write commands on the slave device (physical or digital simulation platform devices).
8.3.1.1.2 SCADA/Digital Simulation Platform Model Verification Test Cases
A number of tests were performed to ensure the validity of SCADA model with respect to the digital simulation platform model of study system. For this purpose, a number of tests were performed for different load and generation profiles (See Table 8-10).
Table 8-10. Definition of Load and PV Profiles for Testing
Load Profile
Name Description
Low Winter profile – low season
High Summer profile – high season
Generation (PV) Profile
Low 4pm to 6:30pm Profile, when the solar radiation is moderate
High 11am to 1:30pm Profile, when the solar radiation is high
The following steps were taken to verify the model in SCADA system:
1. Compare the voltage measurement at some random buses in SCADA with the actual
measurements in digital simulation platform model.

System Operations Development and Advancement Demonstration
97
2. Compare the active and reactive power measurements at the main circuit breaker of each
circuit as well as some random branches with the actual measurements in digital simulation
platform model.
3. Change the status of breakers, reclosers, Tie Switch, and capacitor banks in digital simulation
platform model and verify the status change in SCADA.
4. Send open/close command for breakers, reclosers, Tie Switch, and capacitor banks from SCADA
and verify the status change in digital simulation platform model.
8.3.1.1.3 DSO/RAMCO Performance Verification Test Cases
A number of tests were performed to verify the performance of DSO modelled in Eventa and RAMCO1. The steps below were taken to verify DSO and RAMCO performance:
1. Change the circuit topology from SCADA and verify that DSO and RAMCO1 can properly detect
the new circuit topology.
2. Change the operating mode of DSO from DSO HMI and verify that RAMCO1 can properly detect
the latest DSO operating mode.
3. Change the active power contribution target in DSO and verify that RAMCO1 can properly detect
the latest active power contribution target.
4. Verify the RAMCO measurements on primary DERs and LRAMs with digital simulation platform
model.
5. Verify the DSO readings on aggregated resource data with RAMCO measurements.
8.3.1.2 Application Test Cases
8.3.1.2.1 Near Real-Time Resource Aggregation Test Cases
This case was mainly devised to evaluate the performance of DSO and RAMCO for the purpose of Near Real-Time Resource Aggregation use case. The test cases included the following:
1. Case 1-1: Test when Circuit1 load = 0.1p.u., Circuit1 PV profile = 0.85p.u., Circuit2 load = 1p.u.,
Circuit2 PV profile = 0.85p.u., DSO active power contribution target = 5 MW.
2. Case 1-2: Test when PV11 is outaged suddenly: Start with Circuit1 load = 0.6p.u., Circuit1 PV
profile = 0.6p.u., Circuit2 load = 0.6p.u., Circuit2 PV profile = 0.6p.u., DSO active power
contribution target = 3 MW.
8.3.1.2.2 Emergency Dispatch of DERs and Demand Side Management Test Cases
This case was mainly devised to evaluate the performance of DSO and RAMCO for the purpose of Near Real-Time Resource Aggregation use case. The test cases included the following:
1. Case 2-1: Test under different load and generation profiles:
a) Case 2-1-1: Test when Circuit1 load = 1p.u., Circuit1 PV profile = 0.85p.u., Circuit2 load
= 1p.u., Circuit2 PV profile = 0.85p.u., DSO active power contribution target = 5 MW.

System Operations Development and Advancement Demonstration
98
b) Case 2-1-2: Test when Circuit1 load = 0.21p.u., Circuit1 PV profile = 0.2p.u., Circuit2
load = 0.3p.u., Circuit2 PV profile = 0.2p.u., DSO active power contribution target = 5
MW.
2. Case 2-2: Test under the DSO contribution target changes:
a) Case 2-2-1: Test when Circuit1 load = 1p.u., Circuit1 PV profile = 0.85p.u., Circuit2 load
= 1p.u., Circuit2 PV profile = 0.85p.u., Initial BESS11 SOC = 40%, DSO active power
contribution target change = 4 to 6 MW.
b) Case 2-2-2: Test when Circuit1 load = 1p.u., Circuit1 PV profile = 0.4p.u., Circuit2 load =
1p.u., Circuit2 PV profile = 0.4p.u., Initial BESS11 SOC = 40%, DSO active power
contribution target change = 4 to 6 MW.
c) Case 2-2-3: Test when Circuit1 load = 1 p.u., Circuit1 PV profile = 0.85p.u., Circuit2 load
= 1p.u., Circuit2 PV profile = 0.85p.u., Initial BESS11 SOC = 40%, DSO active power
contribution target change = 4 to 2 MW.
d) Case 2-2-4: Test when Circuit1 load = 1p.u., Circuit1 PV profile = 0.85p.u., Circuit2 load
= 1p.u., Circuit2 PV profile = 0.85p.u., Initial BESS11 SOC = 100%, DSO active power
contribution target change = 4 to 2 MW.
3. Case 2-3: Test when PV11 is outaged suddenly: Start with Circuit1 load = 1p.u., Circuit1 PV
profile = 0.85p.u., Circuit2 load = 1p.u., Circuit2 PV profile = 0.85p.u., Initial BESS11 SOC =
100%, DSO active power contribution target = 2 MW
4. Case 2-4: Test when all primary DERs are off: Start with Circuit1 load = 0.21p.u., Circuit1 PV
profile = 0.85p.u., Circuit2 load = 0.3p.u., Circuit2 PV profile = 0.85p.u., DSO active power
contribution target = 58 kW.
FAT Test Results
A detailed description of the FAT cases was provided in previous section. In this section, the results of the acceptance tests are presented.
8.3.2.1 Verification Test Results
8.3.2.1.1 Communication Test Results
Several tests were executed to verify communications amongst main entities involved in the test setup, i.e., digital simulation platform, LRAMs, RAMCO, and control center. The following table reports a summary of the results for these tests.
Table 8-11. Results of FAT for Communication Tests
Communication Test Cases Status Remark
DSO – RAMCO Communications
IP/Port number verification Done
Analogue input (measurements) reading by DSO DSO can read measurements from RAMCO
Analogue output (setpoints) writing by substation controller DSO can send setpoints to RAMCO
SCADA – digital simulation platform gateway Communications
IP/Port number verification Done
Analogue input (measurements) reading by SCADA SCADA can read measurements
System Operations Development and Advancement Demonstration
99
Analogue output (setpoints) writing by SCADA SCADA can send setpoints to digital simulation platform
Binary input (status) reading by SCADA SCADA can read statuses (switches, breakers, cap banks, etc.)
Binary output (commands) writing by SCADA SCADA can send commands to digital simulation platform (switches, breakers, cap banks, etc.)
RAMCO – digital simulation platform gateway Communications
IP/Port number verification Done
Analogue input (measurements) reading by RAMCO RAMCO can read measurements
Analogue output (setpoints) writing by RAMCO RAMCO can send setpoints to LRAM and DER site controllers and LRAMs and DER site controllers send the setpoints to digital simulation platform.
RAMCO – Automation Controller Communications
IP/Port number verification Done
Analogue input (measurements) reading by RAMCO RAMCO can read measurements
Analogue output (setpoints) writing by RAMCO RAMCO can send setpoints to Automation Controller
Automation Controller – SolarCity inverter and Schneider Electric EVC Communications
IP/Port number verification Done
Analogue input (measurements) reading by Automation Controller
Automation Controller can read measurements
Analogue output (setpoints) writing by Automation Controller Automation Controller can send setpoints to SolarCity inverter and Schneider Electric EVC

System Operations Development and Advancement Demonstration
100
8.3.2.1.2 SCADA/Digital Simulation Platform Model Verification Test Results
The developed digital simulation platform model was verified against the pre-existing model of feeders in a planning software tool to ensure that power flow and short circuit value match in both models (base load case). To verify the developed SCADA model, a number of tests were performed against the digital simulation platform model which are summarized as follows:
Table 8-12. SCADA Model Verification Test Cases
SCADA Model Verification Test Cases Status Remark
Measurements Verification
Bus voltage measurement verification Voltage measurements in SCADA were compared and verified against the voltage values in digital simulation platform.
Active and reactive power measurement verification Discrepancies were observed for two reclosers. The found issues were corrected and verified on the second day of FAT.
Status/Commanding Verification
Change the status of breakers, reclosers, Tie Switch, and capacitor banks in digital simulation platform model and verify the status change in SCADA
Done
Send open/close command for breakers, reclosers, Tie Switch, and capacitor banks from SCADA and verify the status change in digital simulation platform model
It was noticed that the open/close command for one of cap banks is not transferred to digital simulation platform. The issue was solved and verified on the second day of FAT.
8.3.2.1.3 DSO/RAMCO Performance Verification Test Results
A number of tests were performed to verify the performance of DSO modelled in Eventa and RAMCO1. The steps below were performed to verify DSO and RAMCO performance:
Table 8-13. DSO/RAMCO Verification Test Cases
DSO/RAMCO Model Verification Test Case Status Remark
Change the circuit topology from SCADA and verify that DSO and RAMCO1 can properly detect the new circuit topology
DSO and RAMCO1 could successfully detect the latest circuit topology.
Change the operating mode of DSO from DSO HMI and verify that RAMCO1 can properly detect the latest DSO operating mode
RAMCO1 could successfully detect the DSO operating mode.
Change the active power contribution target in DSO and verify that RAMCO1 can properly detect the latest active power contribution target
RAMCO1 could successfully receive the active power contribution target.
Verify the RAMCO measurements on primary DERs and LRAMs with digital simulation platform model
RAMCO1 measurements on primary DERs and digital simulation platform model were verified successfully.
Verify the DSO readings on aggregated resource data with RAMCO measurements
DSO readings on verified against RAMCO measurements.

System Operations Development and Advancement Demonstration
101
8.3.2.2 Application Test Results
8.3.2.2.1 Near Real-Time Resource Aggregation Test:
In the following the verification results for one of the test cases (Case 1-1) is provided. In order to verify the performance of control systems for the purpose of near real-time resource aggregation use case, the DSO readings were compared against RAMCO measurements for the following test cases:
Test when circuit load = 1p.u., PV profile = 0.85p.u., DSO active power contribution target = 5 MW:
The DSO and RAMCO HMI screenshots for this test case are shown in the below figure. As seen in this figure, the reported aggregated data in DSO for intermittent generation units (PV) and energy storage systems matches with the summation of RAMCO measurements for PV and energy storage units (in primary and secondary systems).
Figure 8-8. Snapshot of DSO HMI (Top) and RAMCO HMI (Bottom) for the selected Case

System Operations Development and Advancement Demonstration
102
8.3.2.2.2 Emergency Dispatch of DERs and Demand Side Management Test
In the following, the verification results for one of the test cases (Case 2-2-1) is provided:
Test when circuit load = 1p.u., circuit PV profile = 0.85p.u., Initial BESS11 SOC = 40%, DSO active power contribution target change = 4 to 6 MW
The goal of this test case is to test the response of the control system with respect to the changes in contribution target. For this purpose, the DSO and RAMCO screenshots, shown in the figures below, were captured before and after the contribution target change. As seen, the control system can properly respond to the change of contribution target.
Figure 8-9. Snapshot of DSO HMI (Top) and RAMCO HMI (Bottom) for Target=4MW

System Operations Development and Advancement Demonstration
103
Figure 8-10. Snapshot of DSO HMI (Top) and RAMCO HMI (Bottom) for Target=6MW
8.3.2.2.3 Priority Stack Verification Test
One of the last portions of the FAT was to move the DSO target through minimum and maximum targets ranges to and back again to determine if the RAMCO/LRAM priority stacks were working as expected. For this purpose, the DSO is set in the emergency operating mode, and the setpoint is incrementally changed to trigger the dispatching of the next incremental DER. Initial observations verified that the primary assets were controlled by the RAMCOs as expected, shutting off battery charging first, dispatching maximum renewable generation second, dispatching battery storage third, and then finally dispatching the FG units. The LRAMS however, were not behaving in an optimal fashion initially. The primary issue was the LRAMs themselves were prioritized versus the assets downstream being treated with the same priority, (i.e. the generation on LRAM 1 was biased before LRAM 2 instead of being applied equally to eliminate customer discrimination). These issues were highlighted in the FAT and Resolved in time for implementing in the SAT.

System Operations Development and Advancement Demonstration
104
8.4 Appendix D: Demonstration Test Results
In this Appendix, the results of demonstration test cases performed in SDG&E testing facility are presented. The detailed demonstration test plan and summary of test cases are summarized in Table 3-1 to Table 3-3.
Use Case 1: Load Management
Summary of test cases for Use Case 1 is provided in Table 3-1. In the following, the test results for Case 1-1, 1-2, 1-3, and 1-4 categories are discussed. The test results for Case 1-5 are discussed in the main body of report (Section 3.1.1).
8.4.1.1 Case 1-1: High Market Price/Minimum Reserve Capacity=0.25/PV Profile=70%, topology 1
Two test cases, namely Case 1-1-1 and Case 1-1-2, were performed in this test category. The details of each test case are summarized in Table 8-14. The control center HMI, RAMCO 1 and 2 HMIs, and RAMCO 1 and 2 power setpoint tracking graphs for Case 1-1-1 and Case 1-1-2 are shown in Figure 8-11 to Figure 8-20. The control center and RAMCO HMIs show that RAMCOs take appropriate actions to utilize DERs according to the market price. Since the energy market price is relatively high, batteries are expected to discharge as seen in these figures. The power setpoint tracking graphs verify that the setpoints issued by DSO are all met by RAMCOs. In Case 1-1-2, as the PV irradiance decreases from 70% to 20%, Firm Generation unit in RAMCO2 starts to generate to compensate for the loss of PV power.
Table 8-14. Case 1-1 Category Test Cases
Use cases & Test Cases DSO Targets
Market Price
Reserve Capacity
Forecasted Load
Initial SOC (%)
PV (%)
Case 1-1: High Market Price/Minimum Reserve Capacity=0.25/PV Profile=70%, topology 1
NA High 25%
Case 1-1-1: Initial SOC = 70% NA $170 25% 10 70% 70%
Case 1-1-2: Initial SOC = 70%, PV drops to 20% (cloud condition) and keep for a few minutes, back to 70%.
NA $170 25% 10 70% 70% to 20% to 70%

System Operations Development and Advancement Demonstration
105
Figure 8-11. DSO HMI in case 1-1-1
Figure 8-12. RAMCO 1 HMI in case 1-1-1

System Operations Development and Advancement Demonstration
106
Figure 8-13. RAMCO 2 HMI in case 1-1-1
Figure 8-14. RAMCO 1 HMI: Plot for RAMCO 1 power setpoint in case 1-1-1
Figure 8-15. RAMCO 2 HMI: Plot for RAMCO 2 power setpoint in case 1-1-1

System Operations Development and Advancement Demonstration
107
Figure 8-16. DSO HMI in case 1-1-2
Figure 8-17. RAMCO 1 HMI in case 1-1-2

System Operations Development and Advancement Demonstration
108
Figure 8-18. RAMCO 2 HMI in case 1-1-2
Figure 8-19. RAMCO 1 HMI: Plot for RAMCO 1 power setpoint in case 1-1-2
Figure 8-20. RAMCO 2 HMI: Plot for RAMCO 2 power setpoint in case 1-1-2
8.4.1.2 Case 1-2: Low Market Price/Minimum Reserve Capacity=0.25/PV Profile=70%, topology 1
Two test cases, namely Case 1-2-1 and Case 1-2-2, were performed in this test category. The details of each test case are summarized in Table 8-15. The control center HMI, RAMCO 1 and 2 HMIs, and RAMCO 1 and 2 power setpoint tracking graphs for Case 1-2-1 and Case 1-2-2 are shown in Figure 8-21 to Figure 8-30. The control center and RAMCO HMIs show that RAMCOs take appropriate actions to utilize DERs according to the market price. Since the energy market price is relatively low, batteries are expected to charge as seen in these figures. The power setpoint tracking graphs verify that the setpoints issued by DSO are all met by RAMCOs. As seen in Case 1-2-2, the PV irradiance drop from 70% to 20% does not impact the charging rate of batteries.
Table 8-15. Case 1-2 Category Test Cases

System Operations Development and Advancement Demonstration
109
Figure 8-21. DSO HMI in case 1-2-1
Use cases & Test Cases DSO Targets
Market Price
Reserve Capacity
Forecasted Load
Initial SOC (%)
PV (%)
Case 1-2: Low Market Price/Minimum Reserve Capacity=0.25/PV Profile=70%, topology 1
NA Low 25%
Case 1-2-1: Initial SOC = 70% NA $40 25% 10 70% 70%
Case 1-2-2: Initial SOC = 70%, PV drops to 20% (cloud condition) and keep for a few minutes, back to 70%.
NA $40 25% 10 70% 70% to 20% to 70%

System Operations Development and Advancement Demonstration
110
Figure 8-22. RAMCO 1 HMI in case 1-2-1
Figure 8-23. RAMCO 2 HMI in case 1-2-1
Figure 8-24. RAMCO 1 HMI: Plot for RAMCO 1 power setpoint in case 1-2-1

System Operations Development and Advancement Demonstration
111
Figure 8-25. RAMCO 2 HMI: Plot for RAMCO 2 power setpoint in case 1-2-1
Figure 8-26. DSO HMI in case 1-2-2

System Operations Development and Advancement Demonstration
112
Figure 8-27. RAMCO 1 HMI in case 1-2-2
Figure 8-28. RAMCO 2 HMI in case 1-2-2
Figure 8-29. RAMCO 1 HMI: Plot for RAMCO 1 power setpoint in case 1-2-2

System Operations Development and Advancement Demonstration
113
Figure 8-30. RAMCO 2 HMI: Plot for RAMCO 2 power setpoint in case 1-2-2
8.4.1.3 Case 1-3: High Market Price/Minimum Reserve Capacity=0.35/PV Profile=70%, topology 1
Two test cases, namely Case 1-3-1 and Case 1-3-2, were performed in this test category. The details of each test case are summarized in Table 8-16. The control center HMI, RAMCO 1 and 2 HMIs, and RAMCO 1 and 2 power setpoint tracking graphs for Case 1-3-1 and Case 1-3-2 are shown in Figure 8-31 to Figure 8-40. The control center and RAMCO HMIs show that RAMCOs take appropriate actions to utilize DERs according to the market price. Compared to Case 1-1, Case 1-3 is asking for a higher reserve capacity target (35%). Comparing Figure 8-31 and Figure 8-36 with Figure 8-11 and Figure 8-16, one can see that with a higher reserve capacity target batteries in RAMCO 1 and 2 have either stopped discharging or continued discharging at a lower rate which results in a higher reserve capacity.
Table 8-16. Case 1-3 Category Test Cases
Use cases & Test Cases DSO Targets
Market Price
Reserve Capacity
Forecasted Load
Initial SOC (%)
PV (%)
Case 1-3: High Market Price/Minimum Reserve Capacity=0.35/PV Profile=70%, topology 1
NA High 35% NA NA
Case 1-3-1: Initial SOC = 70% NA $170 35% 10 70% 70%
Case 1-3-2: Initial SOC = 70%, PV drops to 20% (cloud condition) and keep for a few minutes, back to 70%.
NA $170 35% 10 70% 70% to 20% to 70%

System Operations Development and Advancement Demonstration
114
Figure 8-31. DSO HMI in case 1-3-1
Figure 8-32. RAMCO 1 HMI in case 1-3-1

System Operations Development and Advancement Demonstration
115
Figure 8-33. RAMCO 2 HMI in case 1-3-1
Figure 8-34. RAMCO 1 HMI: Plot for RAMCO 1 power setpoint in case 1-3-1
Figure 8-35. RAMCO 2 HMI: Plot for RAMCO 2 power setpoint in case 1-3-1

System Operations Development and Advancement Demonstration
116
Figure 8-36. DSO HMI in case 1-3-2
Figure 8-37. RAMCO 1 HMI in case 1-3-2

System Operations Development and Advancement Demonstration
117
Figure 8-38. RAMCO 2 HMI in case 1-3-2
Figure 8-39. RAMCO 1 HMI: Plot for RAMCO 1 power setpoint in case 1-3-2
Figure 8-40. RAMCO 2 HMI: Plot for RAMCO 2 power setpoint in case 1-3-2

System Operations Development and Advancement Demonstration
118
8.4.1.4 Case 1-4: High Market Price/Minimum Reserve Capacity=0.35/PV Profile=70%, topology 1
Two test cases, namely Case 1-4-1 and Case 1-4-2, were performed in this test category. The details of each test case are summarized in Table 8-17. The control center HMI, RAMCO 1 and 2 HMIs, and RAMCO 1 and 2 power setpoint tracking graphs for Case 1-4-1 and Case 1-4-2 are shown in Figure 8-41 to Figure 8-50. The control center and RAMCO HMIs show that RAMCOs take appropriate actions to utilize DERs according to the market price. Compared to Case 1-2, Case 1-4 is asking for a higher reserve capacity target (35%). Comparing Figure 8-41 and Figure 8-46 with Figure 8-21 and Figure 8-26, one can see that with a higher reserve capacity target, batteries in RAMCO 1 and 2 are charging at a higher rate which results in a higher reserve capacity.
Table 8-17. Case 1-4 Category Test Cases
Figure 8-41. DSO HMI in case 1-4-1
Use cases & Test Cases DSO Targets
Market Price
Reserve Capacity
Forecasted Load
Initial SOC (%)
PV (%)
Case 1-4: Low Market Price/Minimum Reserve Capacity=0.35/PV Profile=70%, topology 1
NA Low 35%
Case 1-4-1: Initial SOC = 70% NA $40 35% 10 70% 70%
Case 1-4-2: Initial SOC = 70%, PV drops to 20% (cloud condition) and keep for a few minutes, back to 70%.
NA $40 35% 10 70% 70% to 20% to 70%

System Operations Development and Advancement Demonstration
119
Figure 8-42. RAMCO 1 HMI in case 1-4-1
Figure 8-43. RAMCO 2 HMI in case 1-4-1
Figure 8-44. RAMCO 1 HMI: Plot for RAMCO 1 power setpoint in case 1-4-1

System Operations Development and Advancement Demonstration
120
Figure 8-45. RAMCO 2 HMI: Plot for RAMCO 2 power setpoint in case 1-4-1
Figure 8-46. DSO HMI in case 1-4-2

System Operations Development and Advancement Demonstration
121
Figure 8-47. RAMCO 1 HMI in case 1-4-2
Figure 8-48. RAMCO 2 HMI in case 1-4-2
Figure 8-49. RAMCO 1 HMI: Plot for RAMCO 1 power setpoint in case 1-4-2

System Operations Development and Advancement Demonstration
122
Figure 8-50. RAMCO 2 HMI: Plot for RAMCO 2 power setpoint in case 1-4-2
Use Case 2: Emergency Dispatch of DERs
A summary of test cases for Use Case 2 is provided in Table 3-2. In the following, the test results for Case 2-1 to 2-6 categories are also discussed.
8.4.2.1 Case 2-1: DSO Contribution Target = 8MW, Test under different Generation Profiles
Two test cases, namely Case 2-1-1 and Case 2-1-2, were performed in this test category. The details of each test case are summarized in Table 8-18. The control center HMI, RAMCO 1 and 2 HMIs, and RAMCO 1 and 2 power setpoint tracking graphs for Case 2-1-1 and Case 2-1-2 are shown in Figure 8-51 to Figure 8-58. The DSO and RAMCO HMI screenshots verify that RAMCOs are utilizing DERs properly to meet the 8 MW contribution target requested by DSO. The power setpoint tracking graphs verify that the setpoints issued by DSO are all met by RAMCOs. As seen, in Case 2-1-2 the PV profile drops to 20% which forces RAMCOs to utilize BESS units more.
Table 8-18. Case 2-1 Category Test Cases
Use cases & Test Cases DSO Targets
Market Price
Reserve Capacity
Forecasted Load
Initial SOC (%)
PV (%)
Case 2-1: DSO Contribution Target = 8MW, Test under different Generation Profiles
8 MW NA NA NA
Case 2-1-1: PV= 0.7p.u., BESS SOC=70% 8 MW NA NA NA 70% 70%
Case 2-1-2: PV= 0.2p.u., BESS SOC=70% 8 MW NA NA NA 70% 20%

System Operations Development and Advancement Demonstration
123
Figure 8-51. DSO HMI in case 2-1-1
Figure 8-52. RAMCO 1 HMI in case 2-1-1

System Operations Development and Advancement Demonstration
124
Figure 8-53. RAMCO 2 HMI in case 2-1-1
Figure 8-54. DSO HMI in case 2-1-2

System Operations Development and Advancement Demonstration
125
Figure 8-55. RAMCO 1 HMI in case 2-1-2
Figure 8-56. RAMCO 2 HMI in case 2-1-2
Figure 8-57. RAMCO 1 HMI: Plot for RAMCO 1 power setpoint in case 2-1-2

System Operations Development and Advancement Demonstration
126
Figure 8-58. RAMCO 2 HMI: Plot for RAMCO 2 power setpoint in case 2-1-2
8.4.2.2 Case 2-2: Initial SOC = 5% (Initial value in digital simulation platform), PV at 70%, then drop PV to 20%
The control center HMI, RAMCO 1 and 2 HMIs, and RAMCO 1 and 2 power setpoint tracking graphs for this case are shown in Figure 8-59 to Figure 8-63. The power setpoint tracking graphs verify that the setpoints issued by DSO are all met by RAMCOs. As seen, batteries do not discharge because their SOC is below the minimum allowable SOC (10%). With PV profile of 70% the DSO target is met. However, with 20% of PV profile, there are not enough resources available to meet the DSO target.

System Operations Development and Advancement Demonstration
127
with 70% PV Profile
with 20% PV Profile
Figure 8-59. DSO HMI before and after PV profile change in case 2-2

System Operations Development and Advancement Demonstration
128
with 70% PV Profile
with 20% PV Profile
Figure 8-60. RAMCO 1 HMI before and after PV profile change in case 2-2

System Operations Development and Advancement Demonstration
129
with 70% PV Profile
with 20% PV Profile
Figure 8-61. RAMCO 2 HMI before and after PV profile change in case 2-2
Figure 8-62. RAMCO 1 HMI: Plot for RAMCO 1 power setpoint in case 2-2

System Operations Development and Advancement Demonstration
130
Figure 8-63. RAMCO 2 HMI: Plot for RAMCO 2 power setpoint in case 2-2
8.4.2.3 Case 2-3: Change of DSO Target and Load Profile
The purpose of this test case was to verify the response of RAMCOs with respect to the DSO target and load level changes. Two test cases, namely Case 2-3-1 and Case 2-3-2, were performed in this test category. The details of each test case are summarized in Table 8-19. The test results for Case 2-3-1 were already discussed in Section 3.1.2. Herein, the RAMCO 1 and 2 power setpoint tracking graphs for Case 2-3-2 are shown in Figure 8-64 to Figure 8-65. These figures show that RAMCOs can effectively meet DSO targets under load profiles changes.
Table 8-19. Case 2-3 Category Test Cases
Use cases & Test Cases DSO Targets
Market Price
Reserve Capacity
Forecasted Load
Initial SOC (%)
PV (%)
Case 2-3: Change of DSO target and load profile 0 MW NA NA NA 70% 70%
Case 2-3-1: Change DSO Contribution Target from 12MW to -4MW in steps
variable NA NA NA 70% 70%
Case 2-3-2: DSO Contribution Target= 12MW, change load level in steps from 1 to 0.2
12 MW NA NA NA 70% 70%

System Operations Development and Advancement Demonstration
131
Figure 8-64. RAMCO 1 HMI: Plot for RAMCO 1 power setpoint in case 2-3-2
Figure 8-65. RAMCO 2 HMI: Plot for RAMCO 2 power setpoint in case 2-3-2
8.4.2.4 Case 2-4: Test Dispatching in LRAMs When All Primary DERs Are Off
Two test cases, namely Case 2-4-1 and Case 2-4-2, were performed in this test category. The details of each test case are summarized in Table 8-20. The test results for Case 2-4-1 were already discussed in Section 3.1.3. Herein, the results for Case 2-4-2 are presented. The RAMCO 1 and 2 HMIs, and RAMCO 1 and 2 power setpoint tracking graphs are shown in Figure 8-66 to Figure 8-69. The HMI screens are illustrated for three different cases, namely, when DSO P target is 150 kW, when DSO P target drops to 50 kW, and when the PV profile drops to 10% with 50 kW of DSO target.

System Operations Development and Advancement Demonstration
132
Table 8-20. Case 2-4 Category Test Cases
DSO P target equal to 150kW
DSO P target drops to 50kW
Use cases & Test Cases DSO Targets
Market Price
Reserve Capacity
Forecasted Load
Initial SOC (%)
PV (%)
Case 2-4: Test dispatching in LRAMs when all primary DERs are off
NA NA NA NA
Case 2-4-1: Change P target in 50kW steps from 250kW to -200kW
variable NA NA NA NA 100%
Case 2-4-2: Changing P target and then PV profile: P_T changes from 150 to 50. Then PV changes to 0.1
variable NA NA NA NA variable

System Operations Development and Advancement Demonstration
133
PV profile drops to 10%
Figure 8-66. RAMCO 1 HMI in case 2-4-2
DSO P target equal to 150kW
DSO P target drops to 50kW
PV profile drops to 10%
Figure 8-67. RAMCO 2 HMI in case 2-4-2

System Operations Development and Advancement Demonstration
134
Figure 8-68. RAMCO 1 HMI: Plot for RAMCO 1 power setpoint in case 2-4-2
Figure 8-69. RAMCO 2 HMI: Plot for RAMCO 2 power setpoint in case 2-4-2
8.4.2.5 Case 2-5: Test under Different Circuit Topologies: DSO Contribution Target = 3MW, PV Profile = 0.2p.u., BESS SOC=30%
The purpose of this test case is to verify the performance of the demonstration system in response to the changes in the circuit configuration. As discussed in Section 2.3.1, according to the status of reclosers and Tie switch, three different circuit configurations can be applied to the demonstration test system. Depending on the circuit topology RAMCO coverage may vary. The DERs and LRAMs designations for each topology are summarized in Table 2-3 to Table 2-5. The testing started with Topology 1. Using SCADA interface, Recloser 1 was opened and Tie Switch was closed to switch to Topology 2. Then, the circuit topology was switched back to Topology 1. Finally, to see the response of demonstration system in Topology 3, Recloser 2 was opened and Tie Switch was closed to switch to Topology 3. It is expected that when the circuit topology changes from Topology 1 to Topology 2, LRAM13 which is under RAMCO1 falls under RAMCO2 coverage. This can be seen in Figure 8-71

System Operations Development and Advancement Demonstration
135
compared to Figure 8-70. As seen, RAMCO2 contribution has slightly increased which shows that LRAM13 is utilized by RAMCO2. When the circuit topology changes from Topology 1 to Topology 3, LRAM22, LRAM23, and FG21 should fall under RAMCO1 coverage. This is illustrated in Figure 8-73 compared to Figure 8-72. As seen, RAMCO1 contribution has significantly increased and RAMCO2 contribution has decreased in Topology 3. More specifically, it can be noticed that, in Topology 3, Firm Generation unit contribution is reported under RAMCO1 instead of RAMCO2.
Figure 8-70. DSO HMI for Circuit Topology 1 in case 2-5

System Operations Development and Advancement Demonstration
136
Figure 8-71. DSO HMI when Circuit Topology changes from 1 to 2 in case 2-5
Figure 8-72. DSO HMI when the Circuit Topology changes from 2 to 1 in case 2-5

System Operations Development and Advancement Demonstration
137
Figure 8-73. DSO HMI when the Circuit Topology changes from 1 to 3 in case 2-5
8.4.2.6 Case 2-6: Test when PV11 is suddenly tripped (Start with DSO Contribution Target = 4MW, PV Profile = 0.85p.u., BESS SOC=60%)
The purpose of this test case is to verify the performance of demonstration system in response to the sudden trip of large DERs in the RAMCO regions. For this purpose, the large PV system in RAMCO1 is suddenly tripped to verify the reaction of RAMCO1 and RAMCO2 under this condition. The control center HMI, RAMCO 1 and 2 HMIs, and RAMCO 1 and 2 power setpoint tracking graphs are shown in Figure 8-74 to Figure 8-78. As seen in these figures, after the PV11 is outaged, DSO sends updated targets to RAMCOs and RAMCOs are forced to utilize batteries to compensate for the shortage of generation caused by PV11 outage.

System Operations Development and Advancement Demonstration
138
before PV11 outage
after PV11 outage
Figure 8-74. DSO HMI before and after PV11 outage in case 2-6

System Operations Development and Advancement Demonstration
139
before PV11 outage
after PV11 outage
Figure 8-75. RAMCO 1 HMI before and after PV11 outage in case 2-6
before PV11 outage

System Operations Development and Advancement Demonstration
140
after PV11 outage
Figure 8-76. RAMCO 2 HMI before and after PV11 outage in case 2-6
Figure 8-77. RAMCO 1 HMI: Plot for RAMCO 1 power setpoint in case 2-6
Figure 8-78. RAMCO 2 HMI: Plot for RAMCO 2 power setpoint in case 2-6

System Operations Development and Advancement Demonstration
141
Use Case 3: Reactive Power Management
Table 2-9 lists the Use Case 3 test cases. The results for Case 3-1 were discussed in Section 3.1.4. Herein, the results for Case 3-2 are provided. The purpose of this test case is to verify the performance of the demonstration system for the purpose of secondary Volt/VAr control. DSO initially sets the reactive power and voltage reduction targets as zero. Then, the voltage reduction target is changed to 1% and 5% into two consecutive steps. Finally, the reactive power target changes to 2 MVAr while the voltage reduction target remains at 5%. The RAMCO2 (RAMCO2 includes secondary Volt/VAr regulator) HMI is shown in Figure 8-79. As seen, as the voltage reduction in DSO is updated, the secondary Volt/VAr regulator under RAMCO2 gets the updated voltage target and regulates the secondary system voltage accordingly. Additionally, Figure 8-80 and Figure 8-81 verify that RAMCO1 and RAMCO2 successfully follow the reactive power targets updates by DSO. As seen, once the DSO reactive power target increases to 2 MVAr, DSO updates the individual reactive power targets for each RAMCO and RAMCOs respond to the new targets in a timely manner.
when voltage reduction target = 0%
when voltage reduction target = 1%
when voltage reduction target = 5%
Figure 8-79. RAMCO 2 HMI in case 3-2

System Operations Development and Advancement Demonstration
142
Figure 8-80. RAMCO 1 HMI: Plot for RAMCO 1 power setpoint in case 3-2
Figure 8-81. RAMCO 2 HMI: Plot for RAMCO 2 power setpoint in case 3-2