
EPIC Final Reportwebarchive.sdge.com/sites/default/files/regulatory/EPIC-2 Project 6... · Aided...
115
EPIC Final Report Program Electric Program Investment Charge (EPIC) Administrator San Diego Gas & Electric Company Project Number EPIC-2, Project 6 Project Name Collaborative Programs in RD&D Consortia Module Name Unmanned Aerial Systems Data Lifecycle Management and Deep Learning Demonstration Date December 31, 2017
Transcript of EPIC Final Reportwebarchive.sdge.com/sites/default/files/regulatory/EPIC-2 Project 6... · Aided...

E P I C F i n a l R e p o r t
Program Electric Program Investment Charge
(EPIC)
Administrator San Diego Gas & Electric Company
Project Number EPIC-2, Project 6
Project Name Collaborative Programs in RD&D
Consortia
Module Name
Unmanned Aerial Systems Data Lifecycle
Management and Deep Learning
Demonstration
Date December 31, 2017

ii
Attribution
This comprehensive final report documents the work done in this EPIC project. The project
team for this work included the following individuals from SDG&E, listed alphabetically by last
name.
Akau, Don
Alapati, Gayatri
Asaro, Christine
Bui, Ngoc
Edalia, Olivo-Gomez
Goodman, Frank
Hobbib, Tom
Katmale, Hilal
Mazhari, Iman
Murphy, Lisa
Myott, Sean
Shiffman, Nadav
Smith, Drew
Surbey, Chris
Thiemsuwan, Jade
Ubinas, Hector
Webb, Jimmie
Willie, Thomas
The project team also included representatives of the following organizations:
Gis Surveyors Inc
GE/Avitas
Harris Corporation
Network Mapping
PricewaterhouseCoopers
iii
Executive Summary
The objective of EPIC-2, Project 6 (Collaborative Programs in RD&D Consortia) is to
accomplish highly leveraged demonstration work through industry collaborative R&D
organizations. The focus of this project module was to demonstrate tools that ingested and
analyzed data collected by means of Unmanned Aircraft Systems (UAS), existing Red, Green &
Blue (RGB) imagery, Geographic Information Systems (GIS), Power Line Systems – Computer
Aided Design and Drafting (PLS-CADD) and other various inspection data types. The project
team demonstrated the tools’ ability to automatically identify and tag assets shown in RGB
imagery, specifically avian covers, in real-world locations through machine learning. Additional
identification of vegetation modeled using Light Imaging Detection and Ranging (LiDAR) data
that encroached into vendor determined zone(s) around electrical wires which provided a road
map for future proactive vegetation maintenance efforts. The project’s findings suggested
potential Imagery Data Management Platforms (IDMP) which would improve current asset
management and data lifecycle management processes, producing a roadmap that would enable
integration of the technology used by each vendor.
Unmanned Aerial Systems (UAS) have provided a unique opportunity for SDG&E to obtain,
disseminate and use aerial sensor data that provides benefits such as cost savings to its ratepayers
and lower physical risks to SDG&E personnel while increasing public safety. The primary
project objective was to demonstrate platforms that could integrate with existing and future
SDG&E infrastructure, software applications and legacy data sets with the ability to ingest, store,
analyze and report on SDG&E assets derived from GIS, PLS-CADD, UAS collected data and
other various sources.
The project scope included identification of the vendors’ proposed IDMP and demonstration of
their tool’s Data Lifecycle Management (DLM) workflow process and how it integrates with
existing and future SDG&E platforms. The vendors approach was based on stakeholders’ current
workflows and data requirements. The test segment consisted of a SDG&E 1.25-mile segment
of a distribution circuit that included 30 electrical distribution poles. The test segment was
selected due to previous LiDAR data collection as part of the Fire Risk Management (FiRM)
program and provided an accurate representation of minimally accessible terrain.
The three test cases identified for the project addressed Proof of Concept (POC) on the
following:
1. Avian Cover Identification – Test case to evaluate the identification of assets (avian
cover) through advanced analytics on RGB images and demonstrate value for continual
maintenance and visual inspection.
iv
2. Vegetation Encroachment Identification – Test case to evaluate identification of
vegetation encroachment within a buffer zone around power lines, thereby assisting in
identification of trees for maintenance and trimming.
3. Cataloging and Remote Asset Management – Test case to demonstrate ingestion of data
from various data sources and cataloging metadata information of existing assets that
enables remote visualization and management of assets.
The results of the three test cases were presented and demonstrated to SDG&E stakeholders to
give them the ability to examine and compare the vendors’ tools for usability and functionality.
None of the vendor tools were developed to a point where they could be integrated without
modification to current SDG&E systems, but the POC’s were clearly demonstrated by all
vendors.
The EPIC project was successful in demonstrating the ability of vendors to utilize tools that
ingested existing, new operational, and inspection data sets to perform analysis on spatial data
and metadata to be viewed by users on a cloud-based platform. Assets were viewed remotely
with attached metadata for analysis and measurement in a 3-dimensional environment. Machine
learning was used to analyze LiDAR and imagery data for automated identification of
encroaching vegetation and avian covers. It was also clearly identified there would be an
immediate increase in efficiencies and utilization by providing access to data sets currently
collected and analyzed by individual stakeholders. Efficiency would also increase by providing
LiDAR, imagery and other UAS data collected during design and as-built phases of engineering
to other stakeholders or a data management tool for analysis and inspection.
It is recommended that SDG&E pursue additional evaluation of UAS technology for stakeholder
groups within the company that will benefit from the aggregation of various sources of data into
a data management platform that also provides advanced analytical capabilities. The evaluation
should also focus on developing requirements for integration of this data management platform
into the SDG&E information technology environment. While the project successfully
demonstrated the value of advanced analytics using UAS data, additional evaluation is required
before operational deployment of the data management platform.

v
Table of Contents 1.0 Introduction .......................................................................................................................... 1
Project Objective .............................................................................................................. 1 1.1
Issue/Problem Being Addressed....................................................................................... 1 1.2
Project Task Summary ..................................................................................................... 2 1.3
1.3.1 Phase 1 – SDG&E Internal Project Work Prior to Contractor Procurement ............ 2
1.3.2 Phase 2 – Project Development Activities ................................................................ 3
1.3.3 Phase 3 – SDG&E Internal Project Work prior to project conclusion ..................... 5
2.0 ASD Operations Assessment ............................................................................................... 7
ASD Operations Summary ............................................................................................... 7 2.1
2.1.1 ASD UAS Data Collection ..................................................................................... 11
2.1.2 Contractor UAS Data Collection ............................................................................ 11
Stakeholder Summaries .................................................................................................. 13 2.2
2.2.1 Vegetation Management ......................................................................................... 13
2.2.2 Electric System Planning, Engineering and Construction ...................................... 15
2.2.3 Environmental Planning.......................................................................................... 16
2.2.4 Land Management .................................................................................................. 19
2.2.5 GIS Group ............................................................................................................... 21
Use Case Summary ........................................................................................................ 22 2.3
Project Baseline Data Set ............................................................................................... 22 2.4
Test Case Summary ........................................................................................................ 23 2.5
2.5.1 Avian Cover Identification ..................................................................................... 23
2.5.2 Vegetation Encroachment Identification ................................................................ 24
2.5.3 Cataloging and Remote Asset Management ........................................................... 24
3.0 Vendor Tools and Test/Use Case Results .......................................................................... 25
Vendor Tool Overview................................................................................................... 25 3.1
3.1.1 Vendor A ................................................................................................................. 25
3.1.2 Vendor B ................................................................................................................. 25
3.1.3 Vendor C ................................................................................................................. 26
3.1.4 Vendor D ................................................................................................................. 26
Test/Use Case Results .................................................................................................... 27 3.2
3.2.1 Avian Cover Identification ..................................................................................... 27
3.2.2 Vegetation Encroachment Identification ................................................................ 46
vi
3.2.3 Cataloging and Remote Asset Management ........................................................... 63
3.2.4 System Setup and Integration with PLS-CADD and GIS ...................................... 75
3.2.5 Demonstrate Data Lifecycle Management.............................................................. 81
4.0 Project Outcome................................................................................................................. 94
Key Findings .................................................................................................................. 94 4.1
Recommendations and Next Steps ................................................................................. 94 4.2
5.0 Technology Transfer Plan .................................................................................................. 96
SDG&E Technology Transfer Plan for Project Results ................................................. 96 5.1
Adaptability to Other Utilities and Industry ................................................................... 96 5.2
6.0 Metrics and Value Proposition........................................................................................... 97
Metrics ............................................................................................................................ 97 6.1
Value Proposition ........................................................................................................... 97 6.2
7.0 Appendices ......................................................................................................................... 99
Appendix A: Aviation Services Department UAS Workflow ....................................... 99 7.1
Appendix B: Vendor-Stakeholder Use Case Matrix. ................................................... 101 7.2
Appendix C: Proposed DMP ........................................................................................ 103 7.3
7.3.1 Proposed DMP Architecture Diagram .................................................................. 103
7.3.2 Proposed DMP Architecture Diagram Reference Chart ....................................... 105

vii
List of Tables Table 1. ASD Services .................................................................................................................... 8
Table 2. Data Utilization by Stakeholders ...................................................................................... 9
Table 3. Sensors from ASD and SDG&E UAS Contractors ........................................................ 10
Table 4. Potential Applications for UAS Data .............................................................................. 12
Table 5. Potential Stakeholder Participants .................................................................................. 13
Table 6. Accuracy Measurements for the Detection of Avian Covers ......................................... 30
Table 7. Pole Count....................................................................................................................... 38
Table 8. Results of precision ......................................................................................................... 44
Table 9. Ability of vendors to identify the avian covers............................................................... 45
Table 10. Vendor Results Comparison ......................................................................................... 63
Table 11. Additional Applications of UAS Data For Asset Management .................................... 72
List of Figures
Figure 1. Example of Avian Cover Detection .............................................................................. 28
Figure 2. Example of Pole Detection with No Avian Cover Detection ........................................ 29
Figure 3. Advanced Search ........................................................................................................... 31
Figure 4. Visual Map of the Avian Cover Detection .................................................................... 31
Figure 5. Example of Closest Pole Image ..................................................................................... 32
Figure 6. Example of Avian Cover Detected ................................................................................ 32
Figure 7. Image Containing an Avian Cover ................................................................................ 35
Figure 8. A selection of Avian Covers From the UAV imagery .................................................. 35
Figure 9. A selection of Avian Covers from the UAV imagery Continued ................................. 36
Figure 10. Image Segmentation Via Machine Learning Platform ................................................ 37
Figure 11. The Display of Avian Covers Alongside Contextual LIDAR & Image data .............. 38
Figure 12. The Display of Avian Cover Symbols To Enable Rapid Review Of The Line Status 39
Figure 13. Target Parameters ........................................................................................................ 40
Figure 14. Example of Pylon Head With Avian Cover Label ...................................................... 41
Figure 15. Example of Pylon head Without Avian Cover Label .................................................. 42
Figure 16. Bounding Boxes Based on Trained Model .................................................................. 43

viii
Figure 17. Vegetation Encroachment Zone Definitions ............................................................... 46
Figure 18. Link 3 Closest Vegetation Assets ................................................................................ 47
Figure 19. Encroachment Workflow Diagram.............................................................................. 48
Figure. 20 Advanced Search ......................................................................................................... 49
Figure 21. Visual Map of Detected Vegetation Encroachments ................................................... 49
Figure 22. Sample LiDAR Views of Encroachments ................................................................... 50
Figure 23. Classified Vegetation Encroachments. ........................................................................ 52
Figure 24. Comparison of Tree Detection Results from Algorithm A ......................................... 56
Figure 25. Comparison of Algorithm A and B Results ................................................................ 57
Figure 26. Comparison of Tree Detection Results (red) and SDG&E Dataset (yellow). ............. 57
Figure 27. Calculation of the Three-Dimensional Distance between Vegetation and Wire ......... 58
Figure 28. LiDAR Point Cloud Colored by Class ........................................................................ 59
Figure 29. Dangerous Vegetation Detection in LiDAR Point Cloud (shown in red) ................... 60
Figure 30. Buffers showing trees within them .............................................................................. 61
Figure 31. Buffers Around Pylons and Vectored Pylons .............................................................. 61
Figure 32. Example of Vendor A Home Screen ........................................................................... 64
Figure 33. Feature Coded LiDAR Derived From UAS ................................................................ 66
Figure 34. The supplied vectors from the PLS-CADD model...................................................... 66
Figure 35. UAS LIDAR Alongside Extracted CAD Model. ........................................................ 67
Figure 36. Oblique UAS Image .................................................................................................... 67
Figure 37. The UAV-Derived Structure Images ........................................................................... 68
Figure 38. Example of Vendor D Home Screen ........................................................................... 71
Figure 39. Example of File Attachment Screen ............................................................................ 71
Figure 41. Example of File Attachment Screen ............................................................................ 85
Figure 42. Role Based Access Control Component Diagram....................................................... 87

ix
Abbreviations & Acronyms
Acronym Definition
AI Artificial Intelligence
AOM Aviation Operations Manual
API Application Programming Interface
APM Asset Performance Monitoring
ASD Aviation Services Department
BAK Backup File
BOM Bill of Material
CAD Computer Aided Design
CAPP Computer Aided Process Planning
CIP Critical Infrastructure Protection
CR Change Request
DLM Data Lifecycle Management
DMP Data Management Platform
DSM Digital Surface Model
DTM Digital Terrain Model
DXF Drawing Exchange Format
EAM Enterprise Asset Management
EPIC Electric Program Investment Charge
ERP Enterprise Resource Planning
Esri Environmental Systems Research Institute
FAA Federal Aviation Administration
FiRM Fire Risk Management
FMV Full Motion Video
FTP File Transfer Protocol
GIS Geographic Information System
GPS Global Positioning System
IDMP Image Data Management Platform
IR Infrared
IT Information Technology
KML Keyhole Markup Language
KMZ Keyhole Markup language Zipped
LAS Log ASCII Standard

x
LDAP Lightweight Directory Access Protocol
LiDAR Light Imaging Detection and Ranging
NCR Non-Conformance Report
NERC North American Electric Reliability Corporation
OGC Open Geospatial Consortium
PLM Product Life Cycle Management
PLS-CADD Power Line Systems - Computer Aided Design and Drafting
POC Proof of Concept
PPK Post Processed Kinematic
PS Part Shortage
PSEP Pipeline Safety Enhancement Plan
QR Quality Report
RACI Responsible, Accountable, Consulted, Informed
RBAC Role Based Access Control
RD&D Research, Demonstration and Deployment
RGB Red, Green, Blue
RoW Right-of-Way
RTK Radio To Kinetic
SDG&E San Diego Gas & Electric
SHP Shape file
SMS Safety Management System
SN Serial Number
SOP Standard Operating Procedures
SPARC SDG&E Portal for Awareness and Real-time Collaboration
SRTM Shuttle Radar Topography Mission
SQL Sequential Query Language
TIFF Tag Image File Format
TL Transmission Line
T&D Transmission and Distribution
UAS Unmanned Aerial Systems
UAV Unmanned Aerial Vehicle
UV Ultraviolet
WCS Web Coverage Service
WFS Web Feature Service
WMS Web Map Service
1
1.0 Introduction
Project Objective 1.1
The objective of EPIC-2, Project 6 (Collaborative Programs in RD&D Consortia) is to
accomplish highly leveraged demonstration work through industry collaborative R&D
organizations. The focus of this project module on Unmanned Aerial Systems (UAS) Data
Lifecycle Management and Deep Learning Demonstration was to demonstrate cloud-based
platforms that could integrate with existing and future San Diego Gas and Electric (SDG&E)
infrastructure, software applications and legacy data sets with the ability to ingest, store, analyze
and report on SDG&E assets derived from Geographic Information System (GIS), Power Line
Systems - Computer Aided Design and Drafting (PLS-CADD), UAS-collected data, and various
other sources. The purpose for the research was to assist in identifying potential uses for the data
among stakeholders. The goal was to determine an appropriate data lifecycle management plan
that benefits most stakeholders and incorporates planning, design, construction and maintenance.
Other goals included process improvements in UAS data collection and insight into standardized
requirements based on usage and tool criteria. SDG&E also desired a plan for integration with
Environmental Systems Research Institute (Esri) GIS and PLS-CADD programs, along with
legacy stakeholder platforms such as PowerWorkz and the SDG&E Portal for Awareness and
Real-time Collaboration (SPARC) used by Vegetation Management and GIS. In this project
module, SDG&E aimed to provide the Proof of Concept (POC) that machine learning tools have
the ability to ingest various data sets and perform tasks such as asset identification through image
analysis and spatial proximity determined by analysis of Light Imaging Detection and Ranging
(LiDAR), and imagery or full motion video.
The end goal was to identify process improvements creating a more reliable network with
increased safety and lower risk, while lowering overall operational costs and passing these
savings on to customers.
Issue/Problem Being Addressed 1.2
SDG&E currently collects LiDAR, Red, Green, Blue (RGB) video and imagery, Infrared (IR)
and Ultraviolet (UV) data for the company’s electrical system each year, for a multitude of
business cases. All aerial data collection is coordinated through the Aviation Services
Department (ASD) group. Data is collected for distribution and transmission line design, as-
built, line/assets inspection, marketing, sales and operational efforts. The UAS imagery data is
subsequently provided directly back to the requesting stakeholder without the capabilities for
dissemination to other potential end users.
The current workflow has resulted in large collections of useable data being stored on individual
department’s storage drive, not accessible by other stakeholders within SDG&E. Storage drives
are managed by permission only to individual personnel within each department thus preventing

2
other groups from accessing data and duplicating the information in storage. There is currently
no IDMP in place to link all the storage drives, enrich data with other attribute information,
manage the lifecycle of data or become accessible by others within the company. Resulting silos
of data sources and the high-level assessment of ASD operations are described and diagramed in
more detail in Section 2.0 below.
The standardized collection and dissemination of data sets have the potential to provide
substantial increases in productivity and efficiency throughout SDG&E, resulting in an overall
decrease in total cost to ratepayers. Increased sharing of data through an Image Data
Management Platform (IDMP) available to all company groups would mitigate safety concerns
for personnel accessing remote assets or difficult access issues where SDG&E is unsuccessful in
gaining entrance. It would also allow stakeholders with limited staff resources to focus their
efforts through automated identification and reporting of an assets’ status or location based on
specified criteria or thresholds.
Project Task Summary 1.3
The project was implemented in three phases:
Phase 1 – SDG&E Internal Project Work Prior to contractor procurement that includes
o Task 1: Development of Project Plan
o Task 2: Contractor Procurement
Phase 2 – Project Development Activities
o Task 3: Baseline Analysis (Evaluate existing infrastructure)
o Task 4: Requirements Elicitation and Design
o Task 5: Test System Setup and Integration
o Task 6: Demonstrate Data Lifecycle Management
o Task 7: Display Vendor Tools with GIS and PLS-CADD
o Task 8: Advanced Analytics Demonstration
Phase 3 – SDG&E Internal Project Work prior to project conclusion
o Task 9: Finalize Project Report for External Release
o Task 10: Technology Transfer Plan
A summary of each of the tasks performed during the execution of the project follows. Each of
the tasks were performed with direction and input from representatives of each of the
participating stakeholder groups described in Section 2.2 below. SDG&E engaged four vendors
to utilize their data management platforms to undertake pre-commercial demonstration of the test
cases. Due to time constraints, not all the tasks were performed by all vendors, though the POC
for the test cases described in Section 3.2 below were demonstrated by each vendor.
1.3.1 Phase 1 – SDG&E Internal Project Work Prior to Contractor Procurement
Task 1 – Development of Project Plan

3
Objective – Develop detailed work plan for the project.
Approach – The project team met with SDG&E stakeholders to conduct a review of existing
processes of data capture from UAS and other applications of data capture. The project team
identified conceptual vision for the proposed test platform that could demonstrate multiple use
cases leveraging UAS data analytics. The project plan identified staffing requirements for the
project, both internal and contracted, with definition of needed skills. Required equipment and
other resources were also identified,
Output - Project work plan including technical scope definition, schedule, budget, and staffing
requirements was developed
Task 2 – Contractor Procurement
Objective – Procurement of contractor services under contract with Supply Management.
Approach – The project team engaged with a set of contractors. The selected contractors had data
management platforms that were uniquely qualified to demonstrate the test cases that were
envisioned in the conceptual vision for the proposed test platform. The objective was to leverage
multiple vendor platforms in a collaborative manner that would help SDG&E determine the
requirements for a UAS data management platform under various operational and business
scenarios. The following documents were developed and finalized as part of the contracts
package for the four vendors that were selected.
Detailed scope of work
Detailed project schedule
Detailed Project Budget
Professional services agreement
Output – Contract agreements were finalized with SDG&E supply management and four UAS
platform providers that are referenced in the attribution page upfront in the document. A fifth
contractor was selected to perform engineering services for the project team to achieve the
desired project objectives.
1.3.2 Phase 2 – Project Development Activities
Task 3: Baseline Analysis (Evaluate existing infrastructure)
Objective –Identify existing infrastructure for data collection, storage and dissemination.
Approach – The project team met with SDG&E stakeholders to identify existing and potential
UAS workflows and data requirements. Current practices related to flight planning, contractor
vetting, quality control, data management and other aviation services functional operations were
assessed to make recommendations for areas of improvement.

4
Output - A 1.25-mile segment of circuit containing 30 poles was selected for analysis on this
project and the baseline data set was developed for testing purposes.
Task 4: Requirements Elicitation and Design
Objective – The objective of this task was to develop requirements and design the ingestion of
the data provided in the baseline data set or collected independently into a data management
platform.
Approach – The project team met with SDG&E stakeholders to assess the requirements for data
usage and ingestion for the use cases. These use cases are described in detail, by applicable
stakeholder, in Section 2.2 below. Through various meetings, various processes were identified
in collection requirements, technological limitations and data overlap between stakeholders.
Output – Test cases were developed from the previously identified use cases using the
respondent stakeholders input regarding the possibilities of substantial impact to SDG&E
stakeholders, potential benefit to ratepayers and the feasibility of completion within the short
duration of the project. A test plan was developed independently by vendors for each test case.
The results for test cases are described in further detail in Section 3.2 below.
Task 5: Test System Setup and Integration
Objective – The project team ingested new and existing data sources including still imagery, full
motion video, LiDAR, along with other design and inspection data to a replicated IDMP for
analysis by various tools.
Approach – Data sources were organized, cataloged and data reported from various data sources
such as (but not limited to) LiDAR, RGB imagery with Global Positioning System (GPS)
metadata and SDG&E GIS records to organize and catalog assets with minimal human
interaction. They were also asked to demonstrate the ability to reconcile records from different
data sources on the same asset and report any discrepancies back to SDG&E’s GIS group to
allow for database corrections. This task also included installing, configuring and testing tools
after the ingestion and analysis of the provided data sets.
Output – The project team setup the various tools and integrated the dataset into the test system.
Task 6: Demonstrate Data Lifecycle Management
Objective –Demonstrate the lifecycle of the data within the tools using automated data lifecycle
workflow to manage/purge/archive data according to stakeholder defined policies and SDG&E
Information Technology (IT) Security protocols.
Approach – The test system was demonstrated with functionality using a web browser or thin
user client for SDG&E stakeholders and the EPIC 2 Project #6 Team. A live session
5
demonstration was provided by vendors to stakeholders for end users to gain experience with the
vendor tool and proposed test cases. Lightweight documentation specific to test/use cases,
functionalities, workflows and datatypes were created by vendors and delivered to SDG&E.
Output – The results for data lifecycle management are described in further detail in Section
3.2.5 below.
Task 7: Display Vendor Tools with GIS and PLS-CADD
Objective – Develop a plan to integrate vendor tools with GIS and PLS-CADD..
Approach – The vendors were requested to provide a plan for integration of their tools with GIS
that captures the technology, business practices, and configurations required for future
integration. Vendors were also requested to provide a workflow or show the ability to display
LiDAR data and other PLS-CADD design components in their respective tools, and provide a
method for query and/or download if possible. All vendors cataloged and ingested various GIS
data sets and display them within their tools. Vendor B, Vendor C and Vendor D ingested PLS-
CADD exports for visualization in their respective tools. Vendor C demonstrated the ability to
export PLS-CADD specifications and 3D models for visualization and analysis in Vendor C
Tool.
Output – The results for GIS and PLS-CADD integration are described in further detail in
Section 3.2.4 below.
Task 8: Advanced Analytics Demonstration
Objective – Demonstrate deep learning analytics using UAS collected imagery and LiDAR data
sets.
Approach – The project team demonstrated avian cover identification and the level of confidence
for each identification. Demonstrated the ability to automatically detect vegetation within a
specified encroachment zone to facilitate focused and proactive vegetation management.
Output – The results of avian cover detection are described in further detail in Section 3.2.1
below and the results of vegetation encroachment identification are described in further detail in
Section 3.2.2 below
1.3.3 Phase 3 – SDG&E Internal Project Work prior to project conclusion
Task 9: Comprehensive Final Report
Objective – Develop comprehensive final report
Approach - A final report will be written to align with a final report outline developed by the
project team at the start of the project. The outline should not conflict with the guidelines for
final reports developed by the utility administrators of EPIC, but it should be more complete and

6
follow a storyline of what occurs sequentially in the project. It should be prepared as a draft in
MS Word for review and comments and a revision into final form, based on comments received
on the draft. The final report is the crucial documentation of the project work, needed to assure
that the information developed in the project does not get lost and is available to prospective
users.
Output - Comprehensive final report as presented in this document
Task 10: Technology Transfer Plan
Objective – Develop technology transfer plan to share results with all stakeholders
Approach - A technology transfer plan was developed to share the results with SDG&E
stakeholders and with other stakeholders in the industry that would benefit from this pre-
commercial demonstration
Output - Technology transfer plan as documented in Section 5 of this report

7
2.0 ASD Operations Assessment The ASD within SDG&E manages all aviation operations. They are responsible for coordination
of flights for manned aircraft, UAS operations, updating SDG&E’s Aviation Operations Manual
(AOM), and vetting contractors using Unmanned Aerial Vehicles (UAVs) for data collection
efforts. ASD is continually looking for process improvements to increase efficiencies and safety.
Vendors were requested to evaluate current ASD operations and provide input to guide aerial
data governance as well as overall processes and procedures.1
ASD Operations Summary 2.1
SDG&E’s ASD currently handles all requests for UAS data from the stakeholders. ASD
currently staffs 7 people that handle UAS operations. ASD informs stakeholders that UAS
services are available through an internal bi-monthly newsletter that is distributed to all
stakeholders. Stakeholders request data from ASD through request via SDG&E web portal or the
“Aviation In-Box”, which is an e-mail address that ASD has set up specifically for incoming
requests. The current ASD workflow is summarized in Appendix A: Aviation Services
Department.
1 Portions of Section 2 were developed and/or quoted directly from vendor presentation or reports given to the EPIC-2 Project #6 team.

8
ASD provides support to all SDG&E stakeholders and performs UAS and helicopter aerial data
collection for the specific needs of a project. Table 1 contains a sample of services that
ASD has provided via UAS, manned aircraft and contractors:
Table 1. ASD Services
ASD Services
Contractor Vetting Line Inspection QC Inspection of Pole
Tension
Dam Inspection Overhead Patrols Structure Assessment
Demo Flights Photo/Video for Marketing UAS Training Flights
Flight Demos for Public
Affairs
Photo/Video of Security
Gates
Video of Gas Valve
Restoration for Pipeline
Safety Enhancement Plan
(PSEP)
Imagery for Preconstruction Photos of High Voltage
Signs
Video of Mission Control
Fence Lines
Inspection of High Pressure
Gas Line Photos/Videos Video of TL on CNF
Landscape Projects Pole Assessment Yard Inspection

9
The services ASD provides to stakeholders and their use of the data varies greatly. Table 2
depicts the different types of data utilized by stakeholders that requested data from the ASD at
the time of this project.
Table 2. Data Utilization by Stakeholders
Stakeholder
RG
B I
mager
y
RG
B V
ideo
LiD
AR
Infr
are
d
Ult
ravio
let
PL
S-C
AD
D
Transmission/Distribution
Maintenance X X X
Transmission/Distribution
Engineering X X X X
Electric Standards X X
Environmental X X
Emergency Services X X
Facilities X X X
Legal X X
Construction Supervisors X X
Media & Public Relations X X X
Vegetation Management X X

10
After the review of incoming requests from stakeholders, the decision is made whether data
acquisition would be better handled by ASD or a contractor primarily based on scope, schedule,
data type, equipment and available personnel requirements. If it is determined that the data
acquisition should be executed by ASD further review is initiated to determine the appropriate
method for data collection, UAS or helicopter. If the data is being acquired by a contractor, the
appropriate vendor is selected based on sensor requirements and availability. The following table
shows the types of sensors available from ASD and SDG&E UAS contractors:
Table 3. Sensors from ASD and SDG&E UAS Contractors
R
GB
Im
ager
y
RG
B V
ideo
LiD
AR
Infr
are
d
Ult
ravio
let
SDG&E Aviation Services
Department X X X X
AES X X
Burns & McDonnell X X
Flight Evolved X X X X
Skyscene X X X X
Unmanned Aerial X X X
WH Pacific X X
Birdseye Aerial X X X
UAS data collected with these types of sensors has many potential uses for various stakeholders.
Some of the additional applications identified by the ASD group and vendors which were not
tested during this project are described as follows:
3D pole modeling for structural alignment providing the added benefit of pole integrity
risk management.
Thermal Scanning would be beneficial for component and line assessments. Thermal
scanning can provide identification of hot spots and this process has the potential of being
automated utilizing machine learning.
Corona Scanning can provide condition assessments on SDG&E facility components for
early identification of failing components to provide proactive mitigation of risks.
Emergency Planning & Response, UAS has the unique ability to access areas that would
be hazardous for personnel to enter. UAS can give a “bird’s eye” view of terrain

11
enabling enhanced planning, management and decision making.
2.1.1 ASD UAS Data Collection
If UAS is found to be best suited for the stakeholder data acquisition, ASD begins a risk
assessment by accessing available data on the internet using resources like “Google Earth”.
While performing the risk assessment ASD looks for things like schools, livestock, homes, etc.
ASD also checks to ensure that the flight will be compliant with current Federal Aviation
Administration (FAA) regulations for the area where they are anticipating data collection via
UAS. ASD has waivers in place through the FAA to remain in compliance with Part 107 of
Federal Regulations when flying in controlled airspaces. Homeowners that have property that
fall within the flight path of the UAS are given notice using the existing SDG&E Public
Outreach phone system. If these factors cannot be safely mitigated, the flight will be postponed,
and the request is declined. Mobilization from the ASD is achieved within hours of receipt of
stakeholder request. On-site the ASD UAS team goes through pre-flight checklists to ensure
safety, review scope, perform hazard analysis, etc. The UAV is flown by an FAA Part 107
Certified Remote Pilot and the data is collected. ASD has provided RGB photos and videos to
stakeholders using this process.
Data is collected and processed by ASD. Once processed the data is delivered via thumb drive or
email directly to the stakeholder. The data is also stored on an ASD laptop computer which is
currently not accessible to other SDG&E stakeholders.
2.1.2 Contractor UAS Data Collection
Contractors provide various data sets including RGB imagery, LiDAR, IR, UV and PLS-CADD
files as needed by requests from stakeholders via ASD request process. Contractors are also
required to be vetted by ASD which is executed in three phases:
2.1.2.1 Phase 1 - Documentation:
ASD personnel distributes to potential contractors a packet indicating the necessary
documentation to proceed in the vetting process. This information is to be completed and sent
back to the ASD via email as the first step in becoming a ASD approved vendor for SDG&E.
Contractors must provide the following documentation to ASD:
FAA Part 107 Certificate (or Part 61 if operating under a Section 333 exemption)
Certificate of Insurance for $10M
Type of UAS to be flown
Logbook/Pilot Resume/Experience flying for utilities
Proof of FAA registration
If available, provide the following documents
Checklists
Safety Management System manual

12
Maintenance practices
Risk assessment worksheet
2.1.2.2 Phase 2 – In-person Interview:
Meet with vendor to introduce/review the following:
SDG&E AOM
SDG&E Safety Policy
Risk Assessment
TracPlus and flight following procedures
Contractor notification form
2.1.2.3 Phase 3 – Flight Operations:
Vetting Flight - After a vendor is approved to provide UAS services for ASD, they must submit
their flight plan to ASD before executing any UAS mission. Upon approval the vendor
mobilizes, follows pre-flight procedures for safety and accuracy, acquires and processes the data.
Data is delivered directly to the stakeholder in this workflow as well.
SDG&E solicited its stakeholders to gauge interest in UAS data collection services and they
were informed that the focus of this project would be on UAS and field data collection in the
areas shown in table 4 below:
Table 4. Potential Applications for UAS Data
Potential Applications for UAS Data
Construction and
Maintenance Fire Risk Mitigation
Design
Vegetation Management
GIS Environmental Transmission & Distribution
Operations
Grid Operations Land Management Transmission & Distribution
Design

13
The SDG&E stakeholders identified for potential participation and solicitation on this project are
included below in table 5:
Table 5. Potential Stakeholder Participants
Potential Stakeholder Participants
Electric Transmission and
Distribution Engineering Vegetation Management Operating Districts
Electric System Operations Land Management Fire and First Responder
Coordination
Distributions Planning Fire Risk Mitigation Environmental Resources
Transmission Planning Project Management Asset and Data Analytics
Stakeholder Summaries 2.2
SDG&E stakeholders were identified by project leadership with the intent to review and
document each group’s workflow processes and specific requirements for data usage and
ingestion. The stakeholders that were identified for participation based on project interest
staffing resources were Vegetation Management, Electric Distribution Planning, Environmental
Planning, Land Management and the GIS group. Each participating stakeholder was interviewed
and/or contacted through questionnaire to identify their data usage and ingestion, required file
types and software platforms used during daily processes. Use cases developed from this
information were later refined to specific cases tested during the EPIC 2 Project #6. Specific test
cases and POCs were designed to meet the requirements for the identified stakeholders.
Additionally, use cases and future applications of the data and software were documented to help
guide future test cases. Select file formats were identified based on stakeholder needs to ensure
the data collection efforts and resulting products met those requirements.
Like the vendors, stakeholders were asked to provide existing and potential use cases for the
project. Stakeholders responding to the initial request for participation in the project included
Vegetation Management, Electric Distribution Planning, Environmental Planning, Land
Management and GIS groups. The results of the inquiry are diagrammed in Appendix B:
Vendor-Stakeholder Use Case Matrix.
2.2.1 Vegetation Management
The Vegetation Management team is directly responsible for ensuring that vegetation growth
within SDG&E territory is identified and documented for yearly maintenance. It is critical for
Vegetation Management to perform routine maintenance for public safety and to be in
compliance with regulations set forth by the CPUC. The maintenance prevents vegetation
encroachment near power lines. SDG&E has a mission to prevent and reduce power outages for
their customers. Power outages are commonly caused by vegetation encroachment as overgrown

14
and diseased vegetation and trees near power lines contact SDG&E structures and energized
conductors.
Vegetation Management department currently uses handheld measuring devices to identify
vegetation growth, often times in treacherous conditions. From a safety perspective, vegetation
encroachment not only causes power outages, but can also spark wildfires. SDG&E employs
certified arborists and tree pruning crews year-round to inspect and maintain vegetation
clearance standards by ensuring trees and vegetation are cut back to the appropriate distance
from distribution power lines. SDG&E currently utilizes a work management application,
PowerWorkz, to track the inspection and maintenance schedule of all surrounding trees and their
conditions. The implementation of the system has significantly reduced power outages.
Leveraging UAS capabilities to gather data regarding vegetation and plant conditions will further
enhance work management applications to benefit ratepayers, improve safety, and improve
SDG&E’s core business.
Use cases for UAS data within Vegetation Management include:
1. Vegetation Encroachment Identification. See Test Case in Section 2.5.2 below.
2. Corrected Locations of Current GIS Assets. Within SDG&E GIS database there are
geographic locations for assets including vegetation. These locations can be erroneous up
to a couple hundred feet for certain SDG&E assets. Through data collection using UAS
technology these locations could be corrected in the GIS database.
3. Change Detection on Subsequent Data Sets. Vegetation Management has a database
cataloging species and growth rates vegetation within regulatory limits of SDG&E
transmission and distribution assets. Vegetation classification and measurements are
observed and recorded by SDG&E field employees on the ground. Vegetation
Management is interested in utilizing UAS captured data couple with analysis tools to
determine vegetation location, species and separation from SDG&E above ground
electrical assets. Additionally, UAS captured data integration into this process would
alleviate the necessity of manned field observations to monitor vegetation encroachments
and growth rates.
Currently Vegetation Management does not use nor has access to the imagery and
LiDAR data captured through the siloed stakeholder based ASD process. Vegetation
management has expressed an interest in having access to collected data along with
gaining notification for future UAS capture missions. The group could provide input on
collection parameters prior to UAS missions which would allow for vegetation
observations and analytics. Additionally, a centralized database for all captured imagery
products and LiDAR would allow the vegetation management team to view conditions
and plan future projects. Vegetation Management would also like an automated

15
notification process for changes to assets that require monitoring and maintenance by the
group.
4. Sag and Sway Calculations for Encroachments. Electrical load, ambient temperatures
and wind speed create sag and sway in overhead electrical lines and facilities. There are
minimum distances between wires, poles, the ground and buildings. These distances are
codified in state electrical codes. Sag and sway potential must be calculated as part of
considerations for Vegetation Management.
PLS-CADD currently provides calculations based on existing components to determine
sag and sway potential. In a future state, the Vegetation Management group would like to
see a platform that can identify encroachments into the sag and sway encroachment area.
These areas can vary based on type of line and what equipment is being used.
5. Identification of Protected Vegetation and Wildlife Species. The Vegetation
Management group is responsible for ensuring that protected species of wildlife and
vegetation is not impacted by the operations within their group. Protected vegetation and
wildlife species are cataloged in an internal database within the Vegetation Management
group.
Data collected by UAS could positively impact the way Vegetation Management catalogs
and assesses potential impact of its operations on these protected species of wildlife and
vegetation.
6. Use Asset Metadata to Predict Growth Rates. Vegetation Management identified a
potential opportunity for leveraging metadata that currently exists within SDG&E
databases to predict growth rates of vegetation. The stakeholder group would like to see a
future state development of technology to automatically identify potential growth in areas
that may come into contact with SDG&E lines.
7. Use Repetitive Data Sets to Predict Growth Rates. By collecting repetitive datasets
Vegetation Management foresees an opportunity to better predict growth rates of
vegetation that has potential to come into contact with SDG&E lines.
2.2.2 Electric System Planning, Engineering and Construction
Executes preliminary planning of electrical distribution lines, prior to engineering. This
stakeholder used PLS-CADD format files for distribution pole planning in areas that are often
inaccessible to regular ground inspection. Potential uses and impacting transmission and
distribution engineering, design, construction standards, materials and project management.
Use Cases Identified for Electric Distribution Planning:

16
1. Cataloging and Remote Asset Management. See Test Case Section 2.5.3 below.
2. Remote access. SDG&E has transmission and distribution lines that can be found in
treacherous terrain that is difficult for field crews to access. These environments can
present many safety concerns that could be mitigated with UAS technology.
By utilizing UAS technology some of these risks can be alleviated. Field crews will not
have to travel by foot as far into unfavorable terrain if the data can be collected by
UAS. Pole inspections would require less hiking as a UAS could be launched from a
nearby access road and flown to inspect SDG&E assets and collect imagery data on the
assets
3. PLS-CADD integration. PLS-CADD is a sophisticated three-dimensional
engineering model. This model includes the terrain, the structures and all the wires.
The model can be viewed in a number of different ways: profile views, plan views,
plan & profile sheets, 3-D views, staking lists. PLS-CADD is software used to draft
and model SDG&E powerlines. Integration of PLS-CADD was identified from the
onset of this project as something each vendor would be required to exhibit within
their respective platform.
2.2.3 Environmental Planning
The Environmental Planning group at SDG&E is responsible for the stewardship of the Earth’s
natural resources and conserving plant and animal species along with their natural habitats. It is
their responsibility to protect the wellbeing of SDG&E employees, the public, and the
environment and promotes sustainable energy production to meet the needs of the present
without impacting the ability of future generations to meet their needs.
The Environmental Planning Group identified the benefit of collecting LiDAR and image data
via UAS platform to provide current geospatially accurate electrical equipment and terrain data.
The data would be an enhancement to the existing process where the team is using imagery and
assets within the Esri GIS environment. Electrical assets within Esri GIS database are based
amalgamation of source data derived from records and field measurements. The source data
ranges from digitizing facilities from historical paper maps to survey grade geodetic positions.
For this reason, and the inclusion of errors due to manual digitizing, projection transformations,
some pole and wire locations derived from the GIS database can be off the actual location by a
hundred feet or so. The Enterprise GIS Solutions team will correct and re-digitize GIS data, and
push the updates to GIS databases, that can be accessed by other departments through GIS
applications. With access to current data, the environmental team can complete effective
desktop reviews by aligning accurate electrical equipment positions with current photography,
cultural resources, water features, vegetation and land ownership. The enhanced desktop
reviews will decrease project turnaround time to schedule, approve and execute projects.

17
Additional benefits would be to limit vehicle and personnel incursions into environmentally
sensitive areas.
Use cases identified for Environmental Planning:
1. Asset cataloging. See Test Case Section 3.2.3 below
2. Avian covers. See Test Case Section 3.2.1 below
3. Corrected locations of current GIS assets. The Environmental Planning group for
SDG&E would benefit from accurate locations of assets that are mapped and databased
within the enterprise GIS environment. When the UAS derived LiDAR and photography
data for transmission and distribution circuits is coupled with positional constraints, the
assets can be verified via an office review with a high level of confidence. The asset
information currently available lacks overall positional confidence to allow for effective
environmental planning. If the information available to the Environmental Planning
group was accurate, it would create an ability to conduct effective internal desktop
reviews of projects. Increasing data accuracy would also increase stakeholder confidence
that the pole and associated data locations are accurate in relation to surrounding features.
There are several types of features that would be of interest to the Environmental group
including vegetation, cultural resources, water features, land ownership, etc.
Having the ability to quickly access data through the desktop review process would allow
the Environmental group to more efficiently review and release projects. Increased data
accuracy would reduce the need for site inspections and surveys. These procedures would
save time, reduce costs, limit impacts on the environment and improve system reliability.
4. Access to recent imagery via GIS – In a similar vein to the use case described above,
the Environmental group would benefit greatly from having access to recent imagery in
GIS. One potential use for this would be to examine the surroundings of a pole that might
need service work performed to minimize impact on the environment in that area.
Recent imagery provided by GIS would also assist the Environmental group with
enhanced ability to provide a desktop review of an area that might have land use conflicts
with sensitive locations. Enabling review of hard to access locations like flooded access
roads or no access roads.
5. Annual or Bi-Annual update of assets. The Environmental Planning group currently
relies on existing imagery data as it exists in the GIS database. As UAS practices grow
and develop the Environmental Planning group would see an immediate benefit to
collecting asset data via UAS on a regular basis, annually or bi-annually. Having recent

18
imagery can help the group determine what the environmental status of any asset
locations that may require a field visit by SDG&E field crews.
6. Accurate GIS parcel layer. Parcel layers currently being utilized by the Environmental
group can have positional inaccuracies. For projects that deal with sensitive boundary
lines, UAS data can be combined with a field survey to provide an accurate parcel lines
and existing conditions imagery.
7. Identifying physical encroachments. SDG&E GIS has location data on field assets.
However, this data can be inaccurate (sometimes up to hundreds of feet). Having the
ability to view recent, accurate orthorectified imagery will help the Environmental group
identify physical encroachments into environmentally sensitive areas or other SDG&E
assets.
8. Best practices for Data Management. Data management is an important component
necessary for successful implementation of UAS collected data. SDG&E has “silos” of
data when it comes these types of datasets. When a group asks for imagery to be
collected it is delivered only to the group requesting these services.
SDG&E would benefit greatly from a unified data management platform. The UAS data
collected from the various internal groups and vendors could be ingested into a single
platform. The platform could serve as the repository for the UAS data and the source for
access to the many stakeholder groups within the company. There would be a standard
for data storage and dissemination companywide that would better serve the stakeholders.
9. Identification of protected vegetation and wildlife species. SDG&E is committed to
protecting the natural resources of California including protected vegetation and wildlife
species. Identifying vegetation is currently done manually by field crews on the ground.
Identified species are cataloged and put into a database where they can be monitored and
viewed via GIS. Wildlife species and nests are identified in a similar manner and
stakeholders can view areas that have wildlife concerns.
In a future state the Environmental group would see a benefit in having a platform that
can natively locate and identify wildlife and vegetation through deep learning
classification. This would provide a cost benefit by deterring the use of field crews for
certain applications. By utilizing machine deep learning a future state platform could
potentially locate vegetation and wildlife a field visit might miss. By reducing the amount
of field crew utilization this would also prevent exposure to possible safety hazards in
environments that can be difficult to access on foot or by vehicle.

19
10. Standardization of collection requirements. Data collection via UAS or fixed wing
methods can often produce similar results. Sometimes the data collected is in the correct
location for the Environmental group to utilize but the imagery is not captured from a
compatible altitude, angle, orientation, etc. Another problem indicated by the
Environmental group is that the data being viewed is too old to be used for the group’s
purposes.
By establishing standards for the collection of UAS data there would be guidance for how
the data is collected, when it is collected and with a standard orientation that would work
for the environmental group. Some vendors associated with this project have addressed
the issue of too low a pixel count associated with this use case. Having a standard camera
setting or distance while capturing data based on the abilities of the UAS and safety
factors would be a benefit to SDG&E.
If these use cases were pursued and implemented the Environmental group has indicated the
following applications that are pertinent to their group: high resolution aerial photography
and 360-degree video of proposed projects (i.e., transmission lines, distribution lines, re-
conductor, fiber line, access road, staging yard, etc.). This would be similar to an airborne
version of Google Street View for a proposed project. This photography and video could
assist Environmental in the following ways:
Desktop review for land use conflicts and sensitive locations.
Desktop review of hard-to-access locations such as flooded access roads and
overgrown access roads or no access roads.
Preliminary environmental habitat evaluations. Photography/video of entire
pole/facility would capture conditions of the surrounding pole and provide a
baseline for desktop review.
Pre-construction condition of the land and surrounding areas that could be
compared to post-construction conditions to avoid disputes from land owners
(staging yard land owners, county/city roads, etc.). Updated data could also assist
in identifying vacant land for potential laydown/staging yards.
Emergency Assessment Video/photography after a fire to see conditions of
electric transmission/distribution facilities and surrounding vegetation.
2.2.4 Land Management
Land Management handles all land issues related to SDG&E, such as easement encroachment
enforcement, conflict detection for development proposals, resolving customer disputes, securing
SDG&E project staging yards and land rights interpretation. No test cases were put in place for
this group.
Use cases identified for Land Management:

20
1. Right-of-way/property encroachments Land Management is charged with identifying
Right-of-Way and property encroachments as related to SDG&E assets. Types of
encroachments include: buildings, vehicles, storage of materials, etc. Currently they are
relying on outdated and often excessively inaccurate GIS data to view SDG&E assets.
Accurate and up-to-date UAS imagery that is easily accessible would be a benefit to the
Land Management group. The group could view the imagery and compare it with the
existing base maps to identify potential right-of-way and property encroachments. This
type of data would enable the Land Management group to view recent data remotely from
a desktop station. The remote evaluation would reduce mobilization and onsite
investigations associated with project planning.
2. Erosion detection. Land Management is interested in utilizing UAS collected data to
identify potential erosion problems that might impact assets. Currently, erosion issues are
primarily brought up by customer complaints and field crews. Utilizing accurate, recent
imagery, Land Management will be able to assess areas that might be prone to erosion
problems. By contrasting imagery observed over an interval of time, Land Management
could detect erosion from the overlaid images.
3. Locating homeless encampments. The Land Management Group is interested in
deploying UAS technology to identify and map homeless encampments within or
adjacent to facilities and easements. Imagery and other multi-spectral sensor technology
can detect and identify both people and structures from the remote UAS platform without
incursion into the encampments. The technology will provide an increased level of safety
for SDG&E and consultant evaluation teams. Newer data could be compared with
historic data to compare the changes in the camps over time.
4. Temporal data storage to identify changes over time. The Land Management group is
interested in the development of a historical UAS image and data repository. Temporal
imagery is a useful tool to identify changes over time. Some applications include right of
way encroachment management, erosion detection and asset management. Currently
there is no infrastructure in place to identify changes in assets, environment or facilities
within SDG&E.
By using UAS data and a central data management platform for temporal data storage
Land Management could leverage historic data to report any changes to SDG&E assets
over time.
5. Accurate GIS parcel layer. SDG&E GIS currently contains raster data obtained through
contractors and vendors data. SDGE is currently pursuing the options to add this raster
data as reference to advanced analytics and GIS feature location accuracy. Land
21
Management can view GIS data to give them an idea of where the parcels and facilities
are located in a general area, but it is often not accurate enough to utilize for any kind of
meaningful decision making.
By incorporating UAS data into Land Management’s parcel data it would give the group
a clearer picture of what the conditions are like on the ground and how they compare to
the parcel lines. This application would also be useful in identifying encroachments.
6. Corrective Maintenance Program. Although Land Management is not responsible for
managing the Corrective Maintenance Program, they are often heavily involved. A
common example is when maintenance needs to be performed on a SDG&E pole, but the
landowner has placed fences or structures around the pole preventing access to the pole.
LM will get involved, research easements, utilize current and historical aerial
photography and resolve the access issue with the landowner.
By utilizing UAS data, Land would be able to better track what the encroachment looks
like and when it may have started happening. Historical information and photographs of
facilities are always useful for these types of issues.
2.2.5 GIS Group
The GIS Group interacts and support many stakeholders in their business processes. The
groups included but are not limited to the Analysis Group, Enterprise GIS Solutions, GIS
Business Solutions, Transmission Engineering, Electrical Distribution Operations, Planning,
Engineering, Emergency Operations Center, Vegetation Management and
Environmental/Cultural. Much of their GIS data is available through the SPARC interface
(SDG&E’s proprietary GIS portal application relating to Transmission, Distribution, Emergency
Operations Center, etc.).
SDG&E’s GIS team receives monthly GIS base data updates via contract surveyors and GIS
vendors. Additionally, the group has a very active data editing and management effort,
performing daily reconciling and posting of edits. On any given week, nearly all circuits have
some sort of edit work performed on them. Knowing of updated and current imagery for a given
area would assist in both accurate visualization and editing.
The GIS group does not currently request UAS support from the ASD group, though they are
aware that the option is available. The GIS team would like to incorporate data generated by
UAVs across the board, they have specific interest in the vegetation management use case as
well as asset tagging. The group would like to be able to have an automated process to determine
images that relate to field assets and tag them or link them to the GIS feature class.
To keep the online GIS portals running at acceptable speeds, the GIS group would like to have a
feature layer that could be queried that shows the extent of UAV data without returning the

22
imagery until it is specifically requested. The feature layer would be updated as needed as field
data is collected and made available to the portal(s). Also, the GIS team would like to get the
Ortho-rectified imagery added to the GIS applications as base maps, to provide accurate location,
and elevation reference to the Editor group for digitizing the assets.
Use Case Summary 2.3
Interviews with stakeholders and assessments of workflows, user platforms, and data
management platforms many use cases were identified. Those use cases also helped to identify
potential benefits common to multiple stakeholders and their need to catalog and manage assets
remotely, such as the ingestion of meta-data tagged RGB imagery or shape files, and the ability
to be able to query by asset or geographic location. The used cases identified have impacts to
staff and public safety, data lifecycle management, file storage and end user access.
These use cases were reviewed by the EPIC 2 Project #6 Team and test cases described in
Section 3.2 below were developed to showcase vendors ability ingest, analyze and report on
UAS data and SDG&E assets. See Appendix B: Vendor-Stakeholder Use Case Matrix. for a
matrix of use cases identified per stakeholder.
Project Baseline Data Set 2.4
To perform the test cases a data set including the necessary files to complete the tests was
developed. This test segment consisted of a SDG&E 1.25-mile segment of a distribution circuit
including 30 poles. The test segment was selected due to previous LiDAR data collection as part
of the FiRM program. To improve the test segment data supplementation of oblique and grid
RGB photos was performed which increased the analysis performed by vendors. The baseline
data set of LiDAR flight data, RGB photos, GIS data, PLS-CADD data, design and construction
documents along with other various reports and exports was provided to each vendor allowing
them to perform analysis, develop tools, and generate necessary reports for the EPIC 2 Project #6
Team. From the given data set vendor were also able to evaluate SDG&E’s existing IDMP,
collection methods, standards and procedures for design, construction, as-built and maintenance
efforts. Vendors that were not able to collect their own RGB imagery due to various project
constraints were provided with additional oblique and grid photos for analysis. The project
baseline data set included the following:
PLS-CADD models of design and as-built conditions, including Drawing Exchange
Format (DXF) exports of the line and pole facilities, LiDAR cloud and stringing charts.
GIS electric distribution poles and vegetation data in database and shape file formats.
Log ASCII Standard (LAS) file of LiDAR point cloud.
Documentation including SDG&E standards, pole identification lists, construction plans,
Keyhole Markup language Zipped files (KMZs) and various reports.
RGB imagery collected during flight mission for PLS-CADD design.
Additional RGB imagery from other circuits for avian cover analysis totaling
approximately 3000 photos.
23
Additional RGB oblique and nadir imagery collected at project start was provided to
Vendor B, Vendor C and Vendor D only as Vendor A utilized their self-acquired
imagery.
Test Case Summary 2.5
UAV, LiDAR and RGB data collection technology has advanced sufficiently so that it may be
applied to address specific applications that currently are being implemented through costly field
visits and manned aviation assets. By using machine learning and other processing algorithms
many of these tasks can be accomplished for less overall expense and on a regularly scheduled
basis. By having assets automatically cataloged from high resolution imagery, a more accurate
inventory of both assets and asset condition can be maintained. Future applications can then
focus on predicting failure based on asset condition as detected by UAS in the normal course of
flying SDG&E facilities. In the same manner, vegetation growth and health can be more
effectively cataloged, monitored and predictive algorithms can be used to target areas where the
growth will soon encroach on the safe zone around the facilities.
A review and assessment of SDG&E’s existing UAS operational technologies and practices as
applied to their electrical distribution and transmission business was conducted. From the review
and assessment, three test cases were developed to collect data via UAVs and apply it to
software solutions to satisfy the needs of the use case. All vendors were provided with the
SDG&E baseline dataset described in Section 2.4 above. Vendor A chose to utilize their own
UAV to collect data for the test cases. Vendor B, Vendor C, and Vendor D were provided with
additional oblique and nadir RGB imagery collected by an SDG&E contractor not involved with
this EPIC 2 Project #6.
A portion of SDG&E line circuit containing 30 poles was selected for the purposes of testing
three use cases.
2.5.1 Avian Cover Identification
Vendors were tasked with ingesting existing RGB data into the vendor proposed platform and
demonstrate the platform’s capability to identify avian covers, specifically the existence or
absence of avian covers where they are required. The long-term goal of this test case is to be able
to capture significantly more detailed asset management data and condition assessment with
automated machine learning analytics.
This test case was established to evaluate each vendors ability to develop and train machine
models that can continuously learn to automatically identify avian covers as new imagery data is
introduced to the platform. The model can then be applied to drone captured data to assess
whether avian covers are present or need repair/replacement in potential future state.
24
2.5.2 Vegetation Encroachment Identification
The Vegetation Management Group is responsible for the maintenance and trimming of
approximately 4,500 trees and the validation of trimming work performed by contractors on
these assets. These services are currently done through physical inspection with hand held
measuring devices, often in remote locations and treacherous conditions. This test case was
developed to test the ability of vendors to accurately identify vegetation encroaching within a
buffer zone around power lines.
2.5.3 Cataloging and Remote Asset Management
SDG&E leadership expressed a desire to use LiDAR and imagery to catalog assets in remote
areas and demonstrate change management for those assets. Vendors were also asked to
demonstrate extra metadata tagging for relevant data as they relate to assets identified by UAS.
This test case was developed to evaluate each vendors ability to ingest SDG&E distribution pole
GIS asset metadata into the vendor tool; associate and assign imagery collected via the UAS
platform to the GIS asset then demonstrate the ability view, edit and analyze imagery and
metadata within the vendors tool.

25
3.0 Vendor Tools and Test/Use Case Results The test cases described in Section 2.5 above and baseline data set described in Section 2.4
above were provided to each vendor in order to develop a standardized assessment of each
vendor tool. The results for each test case are described in this section.2
Vendor Tool Overview 3.1
3.1.1 Vendor A
The Vendor A visualization tool used for this project was Vendor A Tool. This tool
demonstrated the ability to ingest and display all files provided in the baseline data set except for
the PLS-CADD model file. The demonstration was performed using Chrome web browser.
The tool provides a 2D home page with a map displaying symbols for assets and machine
learning analysis results with an option for downloading assets. The tool is also equipped with a
3D reviewer workstation for performing spatial analysis, reviewing asset associated imagery and
downloading 3D data sets.
The system allowed control of data sets such as filtered LiDAR point cloud, imagery, video, and
annotations in 2D and 3D views. There were also measurement functions such as angle, height,
distance, area and volume with different methods for selection. The Vendor A Tool can be
installed behind SDG&E’s security firewall.
3.1.2 Vendor B
The Vendor B visualization tool used for this project was Vendor B Tool. This tool demonstrated
the ability to ingest and display all files provided in the baseline data set including the ability to
ingest PLS-CADD model file exports. The demonstration was performed using Google Chrome
web browser. Vendor B identified compatibility with Chrome 55 or higher and Firefox 50.1.0 or
higher (tested using Windows 8.1 or higher).
The tool provides a 3D home page with color coded symbols representing tree assets ingested
from GIS data and avian covers missing or detected. Vegetation encroachments are identified as
polygons for the limits of encroachment.
The system allowed specific data sets to be turned on and off through an asset dropdown tree
along with discover, search and upload functionality.
2 Portions of Section 3 were developed and/or quoted directly from vendor presentation or reports given to the EPIC-2 Project #6 team.

26
3.1.3 Vendor C
The Vendor C visualization tool used for this project was Vendor C Tool. This tool demonstrated
the ability to ingest and display all files provided in the baseline data set including the ability to
ingest PLS-CADD model file exports. The demonstration was performed using Internet Explorer
web browser.
Inside the portal a 3D representation of the network is displayed, from terrain and base imagery
through to high resolution LiDAR and asset images. These can all be layered up to provide a
rich, detailed view of the as built, as surveyed conductors, structures, vegetation and condition.
Vendor C Tool operates using pre-optimized datasets generated following any processing to,
allow fast loading, and reduced data volumes to be distributed across the internet whilst maintain
the visual quality required for review and condition assessment in the portal. This method was
chosen as opposed to the alternative on the fly compression or distributing uncompressed data, as
this leads to reduced server load – meaning more users can access the data concurrently, and the
amount of data that needs to be handled at any given point, resulting in a smoother user
experience.
Vendor C Tool revolves around a central store that then feeds data into the web viewer, this
central store can provide feeds into other systems and vice versa. 2D data layers can be fed into
other software like Esri ArcMap, ArcGIS Online, QGIS, PLS-CADD as standard Web Feature
Service (WFS) / Web Map Service (WMS) feeds that are fully Open Geospatial Consortium
(OGC) compliant. Conversely, existing feeds can be fed into Vendor C Tool, allowing data to be
integrated into the system, bringing everything into one place, maximizing the amount of
information available to inform intelligent business decisions. Once again, this includes standard
WFS / WMS feeds and a range of tabular database connections.
3.1.4 Vendor D
The Vendor D visualization tool used for this project was Vendor D Tool. This tool
demonstrated the ability to ingest and display all files provided in the baseline data set except for
the PLS-CADD model file. The demonstration was performed using Chrome web browser, the
Vendor D Tool and CloudCompare software.
The tool provides features including:
2D cartometric representation of terrain in the vicinity of power lines using
orthophotomap,
Representation of altitudes of the terrain and objects above ground level by Digital
Surface Model (DSM) and Digital Terrain Model (DTM),
Distance, altitude, area, and volume measurements based on orthophotomap and
DTM/DSM (e.g., conducting measurements of distances between the power lines and
objects close to them or distances between poles or other devices),

27
Ability to attach files like high resolution images and movies showing details of devices
installed on the poles (e.g., avian covers), PDF files with documents (e.g., work orders),
and notes generated directly in the Vendor D Tool with additional information,
Establishment of vector data layers for performing analysis by comparison with raster
maps layers (e.g., orthophotomap, DTM, DSM) and presentation of the results of GIS
analysis performed in external software,
Generation of vector objects by drawing directly in the Vendor D Tool,
3D view for presentation of 3D model of the terrain with or without objects above ground
level, based on DTM or DSM with textures made from orthophotomaps and other raster
and vector layers with the ability to perform measurements,
3D point cloud view for presentation and analysis of 3D point clouds acquired using
LiDAR or generated during photogrammetric image processing.
The Vendor D Tool is a cloud based platform which does not require any investments in advance
or installation processes due to the fact that it is operated via web browser or mobile app on
mobile devices. The platform’s dedication to store, analyze, and share image data combined with
its personalized functionalities, configuration, and analytics, make the platform a robust solution
for supporting daily tasks related to asset management across SDG&E.
Test/Use Case Results 3.2
3.2.1 Avian Cover Identification
This section describes in detail the results for the test case defined in Section 2.5.1 above. The
remainder of this section will discuss the approach, accuracy, recommendations for a future state
presented by each vendor and a comparison of vendor results and the EPIC 2 Project #6 Team
recommendations.
3.2.1.1 Vendor A Results
3.2.1.1.1 Approach
For this test case Vendor A analyzed their RGB nadir and oblique imagery collected during their
two UAS flight missions flown by the vendor under supervision by SDG&E personnel. These
images provided a much higher resolution than those provided as part of the baseline data set.
The images were ingested into a IDMP where work orders were created for annotators to review
the images and visually identify avian covers. The vector outlines of the annotations were
ingested back to the IDMP and pushed to the Vendor A deep learning tool. In the deep learning
tool, a model was trained to identify the objects inside the vector outlines and create a catalog of
the objects.
3.2.1.1.2 Results
The Artificial Intelligence (AI) Workbench identified the avian covers with an accuracy of 85%
at a confidence level of 80%. As seen in the vendor demonstration, images containing an avian
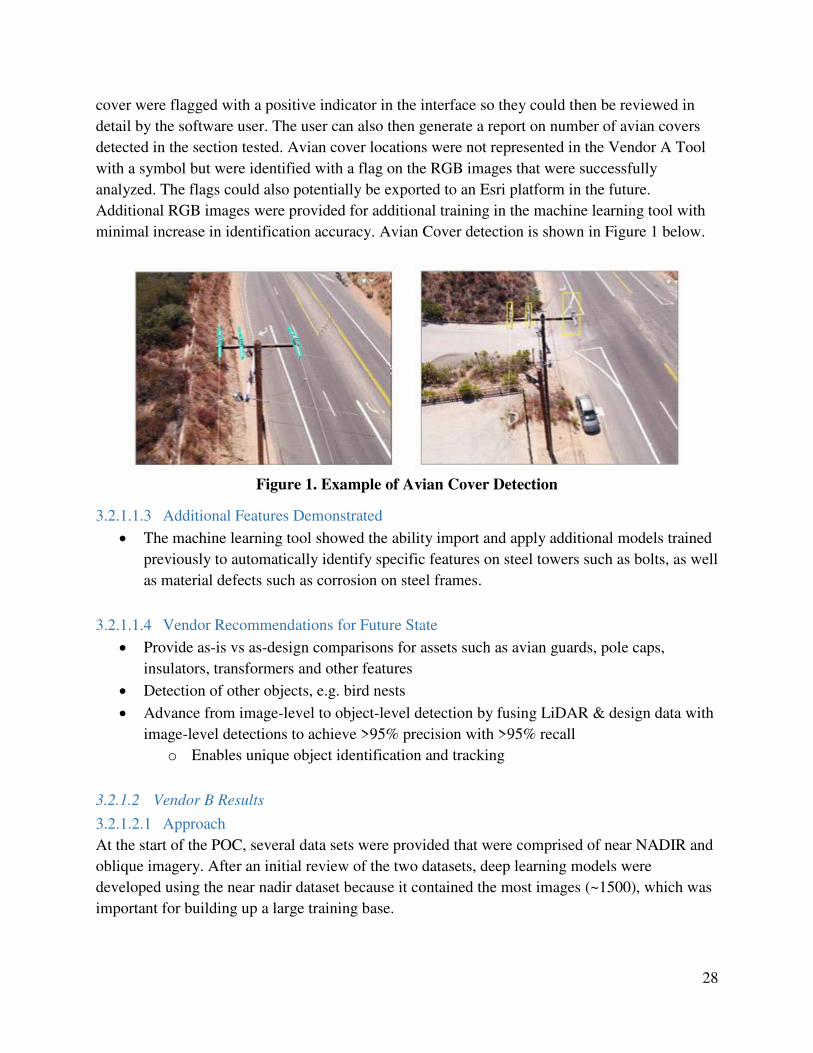
28
cover were flagged with a positive indicator in the interface so they could then be reviewed in
detail by the software user. The user can also then generate a report on number of avian covers
detected in the section tested. Avian cover locations were not represented in the Vendor A Tool
with a symbol but were identified with a flag on the RGB images that were successfully
analyzed. The flags could also potentially be exported to an Esri platform in the future.
Additional RGB images were provided for additional training in the machine learning tool with
minimal increase in identification accuracy. Avian Cover detection is shown in Figure 1 below.
Figure 1. Example of Avian Cover Detection
3.2.1.1.3 Additional Features Demonstrated
The machine learning tool showed the ability import and apply additional models trained
previously to automatically identify specific features on steel towers such as bolts, as well
as material defects such as corrosion on steel frames.
3.2.1.1.4 Vendor Recommendations for Future State
Provide as-is vs as-design comparisons for assets such as avian guards, pole caps,
insulators, transformers and other features
Detection of other objects, e.g. bird nests
Advance from image-level to object-level detection by fusing LiDAR & design data with
image-level detections to achieve >95% precision with >95% recall
o Enables unique object identification and tracking
3.2.1.2 Vendor B Results
3.2.1.2.1 Approach
At the start of the POC, several data sets were provided that were comprised of near NADIR and
oblique imagery. After an initial review of the two datasets, deep learning models were
developed using the near nadir dataset because it contained the most images (~1500), which was
important for building up a large training base.
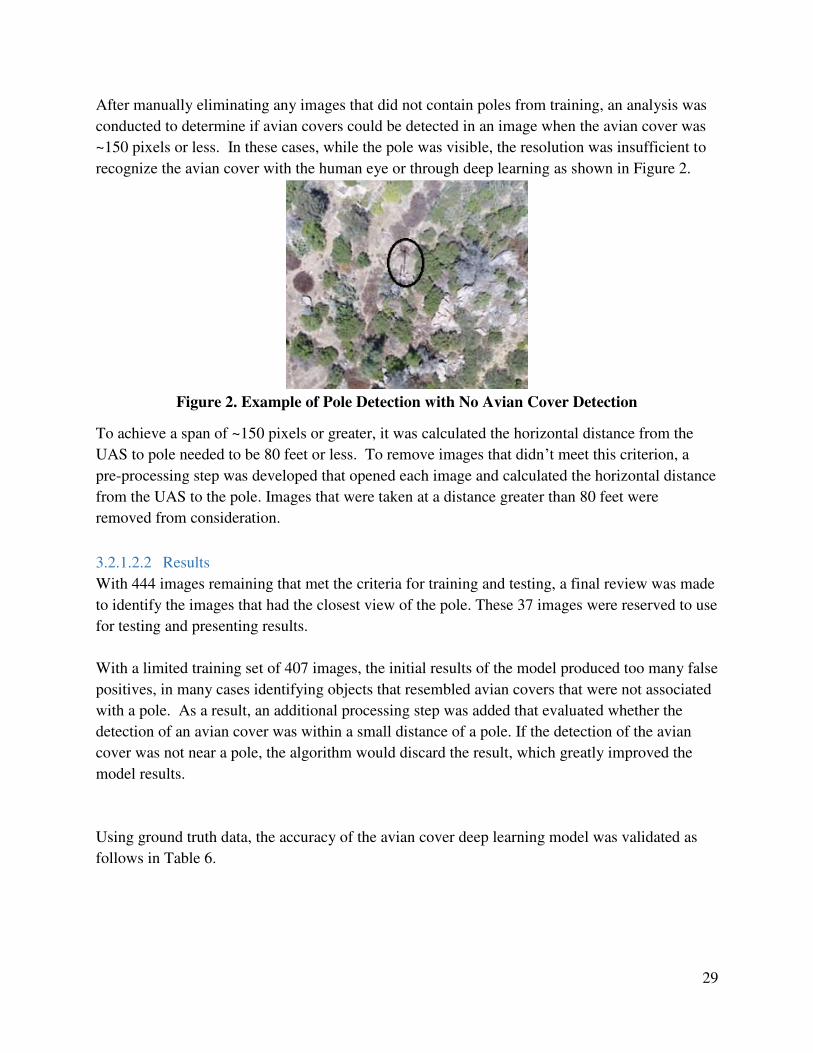
29
After manually eliminating any images that did not contain poles from training, an analysis was
conducted to determine if avian covers could be detected in an image when the avian cover was
~150 pixels or less. In these cases, while the pole was visible, the resolution was insufficient to
recognize the avian cover with the human eye or through deep learning as shown in Figure 2.
Figure 2. Example of Pole Detection with No Avian Cover Detection
To achieve a span of ~150 pixels or greater, it was calculated the horizontal distance from the
UAS to pole needed to be 80 feet or less. To remove images that didn’t meet this criterion, a
pre-processing step was developed that opened each image and calculated the horizontal distance
from the UAS to the pole. Images that were taken at a distance greater than 80 feet were
removed from consideration.
3.2.1.2.2 Results
With 444 images remaining that met the criteria for training and testing, a final review was made
to identify the images that had the closest view of the pole. These 37 images were reserved to use
for testing and presenting results.
With a limited training set of 407 images, the initial results of the model produced too many false
positives, in many cases identifying objects that resembled avian covers that were not associated
with a pole. As a result, an additional processing step was added that evaluated whether the
detection of an avian cover was within a small distance of a pole. If the detection of the avian
cover was not near a pole, the algorithm would discard the result, which greatly improved the
model results.
Using ground truth data, the accuracy of the avian cover deep learning model was validated as
follows in Table 6.

30
Table 6. Accuracy Measurements for the Detection of Avian Covers
Status Avian Covers
Actual 36
Detected 32
Missed 4
False positives 8
Precision 80%
Recall 89%
In deep learning methodologies, there are two primary ways of measuring the accuracy of a
model: Recall measures the percentage of avian covers that were successfully detected; Precision
is a measure of the number of false positives, e.g. 80% precision would mean that a 1/5 of the
detections were not of avian covers.
Even with the extremely small training set, the results were excellent - 89% of the avian covers
were detected. With more training data both the recall and precision values would be improved.
3.2.1.2.2.1 Discovering and Reviewing Results
Once the deep learning models were created, they were applied to the reserved data set as a pre-
processing step. The images and results were ingested into the Vendor B asset management
platform which provides users across the organization the ability to quickly identify poles with
missing avian covers.
Search and Discovery of Results
There are two methods to quickly locate assets and the results of the analytics in the asset
management platform:
1. “Discover” – Users are presented a map and icon indicating the location of assets as
shown in Figure 3 below. Upon clicking on the icon the interface will zoom into the
circuit and display the poles on a map. Red indicates no avian covers were detected
on the pole. Yellow indicates a single avian cover was located. Green indicates
that two or more covers were found.
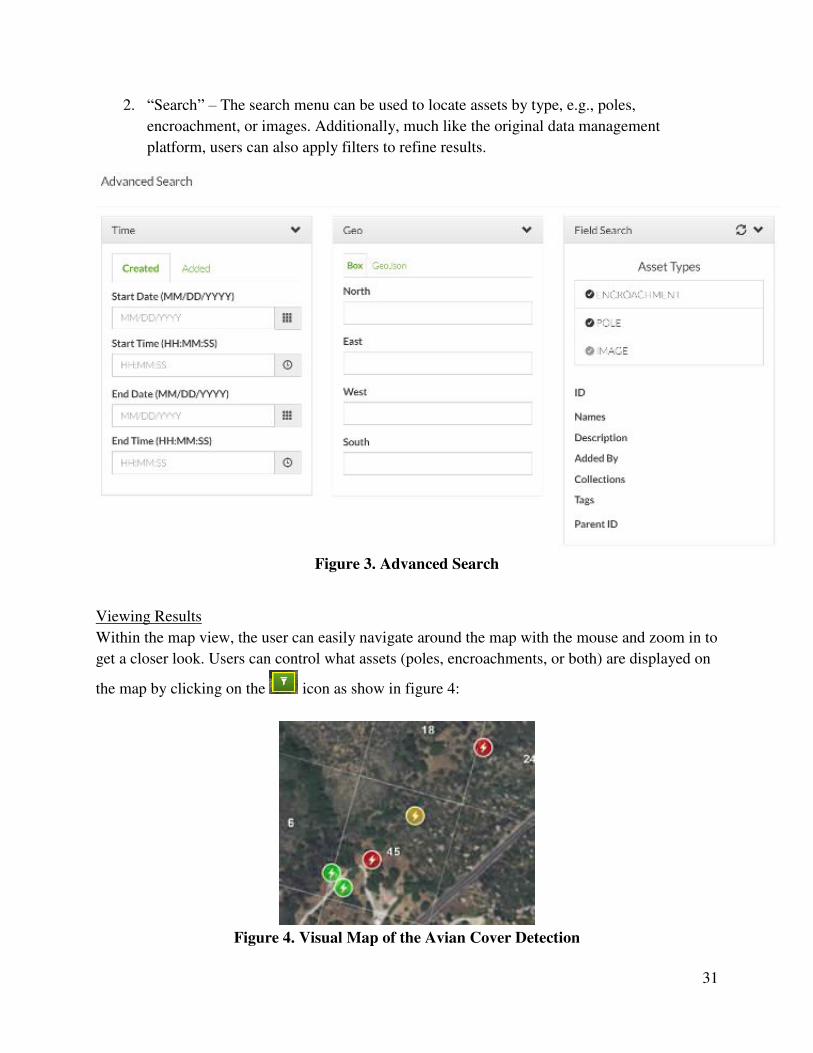
31
2. “Search” – The search menu can be used to locate assets by type, e.g., poles,
encroachment, or images. Additionally, much like the original data management
platform, users can also apply filters to refine results.
Figure 3. Advanced Search
Viewing Results
Within the map view, the user can easily navigate around the map with the mouse and zoom in to
get a closer look. Users can control what assets (poles, encroachments, or both) are displayed on
the map by clicking on the icon as show in figure 4:
Figure 4. Visual Map of the Avian Cover Detection
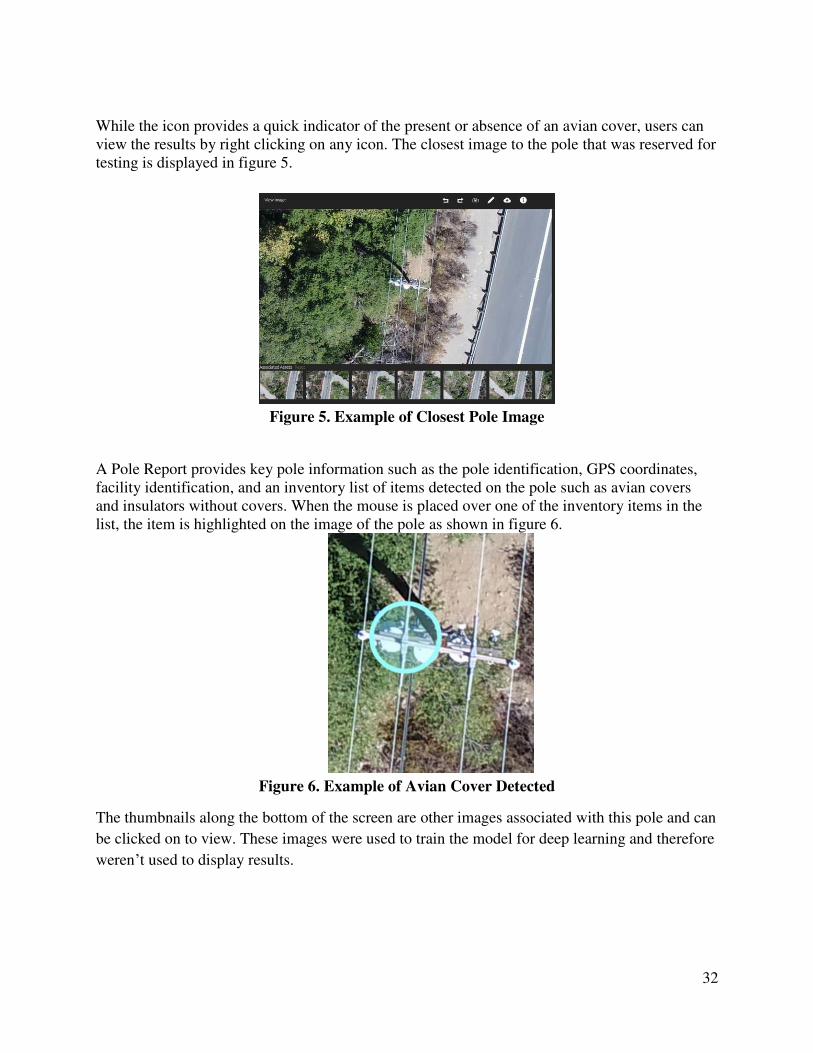
32
While the icon provides a quick indicator of the present or absence of an avian cover, users can view the results by right clicking on any icon. The closest image to the pole that was reserved for testing is displayed in figure 5.
Figure 5. Example of Closest Pole Image
A Pole Report provides key pole information such as the pole identification, GPS coordinates, facility identification, and an inventory list of items detected on the pole such as avian covers and insulators without covers. When the mouse is placed over one of the inventory items in the list, the item is highlighted on the image of the pole as shown in figure 6.
Figure 6. Example of Avian Cover Detected
The thumbnails along the bottom of the screen are other images associated with this pole and can
be clicked on to view. These images were used to train the model for deep learning and therefore
weren’t used to display results.

33
3.2.1.2.3 Additional Features Demonstrated
None
3.2.1.2.4 Vendor Recommendations for Future State
Vendor B’s deep learning technology is a viable and dependable solution for T&D asset
management workflows including the detection of anomalies on assets such as the avian cover
example. To maximize results in an operational environment, the following recommendations
should be considered:
3.2.1.2.4.1 Camera and Sensor Settings
Most image collection platforms offer multiple settings which can affect the quality and accuracy
of the analytics run downstream. The following guidelines will help improve results.
1. Capture imagery using the camera’s full resolution.
a. Avoid cropping images or modifying the aspect ratio of the image.
2. Turn the camera orientation metadata settings on.
a. When using oblique imagery, the camera’s orientation metadata (roll/pitch/yaw)
is useful in determining if the collected imagery meets collection requirements.
3. When looking for damage types such as a linear fracture (thin line), using the camera’s
RAW uncompressed format is recommended, which will prevent thin lines from blurring.
3.2.1.2.4.2 Flight/Capture Techniques
The technique used to capture data can greatly affect the probability of success for locating poles
and assets as well as identifying anomalies. To maximize results, consider the following when
developing a standardized flight plan:
1. Maintain a consistent distance to the pole.
2. Maintain a persistent look angle upon the pole.
a. Deep learning analytics operate on the original images without considering the
look angle or where the image fits in the larger mosaic. For this reason, it helps to
have a consistent view of the pole in all the images so that the algorithm can more
effectively “learn”.
b. The camera used during the proof of concept had excellent resolution. At that
resolution, the UAVs could fly 30-50 feet away from the pole and identify objects
or damages with a size greater than 4mm. This distance should be sufficient to
detect most damage types.
c. Before embarking on a major collection, it is recommended that test flights be
performed at varying altitudes to determine if the desired object or damage can be
identified at that height.
3. Utilize a data validation tool when collecting data.

34
a. A data validation tool will help reduce costs and ensure the data collected in the
field meets downstream analytic requirements. Data validation tools provide
pilots feedback in the field to ensure:
i. The resolution required for analysis is met.
ii. Proper focus is maintained throughout the capture.
iii. All required metadata is present and within specified criterial for the
capture.
iv. Proper overlap and coverage for stitching and analysis purposes.
4. Provide the orientation metadata such as roll/pitch/yaw with the imagery.
a. The orientation metadata is useful when capturing oblique imagery. The camera
orientation can quickly determine if the data meets the analysis requirements.
5. Wait for GPS uncertainty to be reduced before starting image capture
a. FLT log files from the GPS can take a minute to obtain low error bounds. To
ensure accurate GPS coordinates, it is recommended that a few minutes be given
between when the GPS is turned on and data capture begins.
6. Avoid capturing imagery in poor weather conditions (low light or wet objects change
color and can reduce detection results).
7. Avoid capturing imagery in poor lighting conditions (excessive shadows or low sun
angles can reduce the pixel range over objects thus affecting detection results).
3.2.1.3 Vendor C Results
3.2.1.3.1 Approach
3.2.1.3.1.1 Manual Identification
Vendor C did not perform automated asset identification using machine learning. For this test
case, a range of manual assessment methods were tested and evaluated. This was focused on
understanding the consistency and limitations in the asset photos and using human assessment to
identify presence on a selection of lines. This was expected to be highly accurate and thus serve
as both a verification and training set for later method testing. It would also be used to
demonstrate the display of avian cover locations in the online system. See figure 7 below:

35
Figure 7. Image Containing an Avian Cover
A review of the available images saw significant variability in the quality that was available,
which made identification difficult in some instances but always possible. Initial indications
were that the imagery was not going to be suitable for automated analysis without significant
work or error rates. Figure 8 and 9 below shows the imagery of the Avian covers.
Figure 8. A selection of Avian Covers From the UAV imagery

36
Figure 9. A selection of Avian Covers from the UAV imagery Continued
3.2.1.3.1.2 Automated Identification
Having reviewed the supplied data and considered the manual methods available for identifying
the avian covers, the next stage is to explore a way of automatically detecting their presence. The
most appropriate methodology in this case, given the variability of the data inputs, is a machine
learning approach. The principle is to create a machine learning system that will accurately
identify the presence of the covers and collate this information in a way that it can be used. A
prerequisite of this approach is the automated matching of photography to the asset and a degree
of consistency in the way in which photographs are taken – considering resolution, perspective
and color balance.
The online 3D system used to show the results is not optimized for data analysis – it acts as a
portal to link and explore the data and the results, not the analysis itself. As a result, were further
time available in this trial, the chosen method would have been the detailed use of the internal
machine learning group. Following engagement with the relevant technical specialists from this
group, it appears to have the right mechanisms to rapidly train a machine-learning derived
system (using object-based recognition) which can be used to identify a desired set of survey
objects fast and effectively. In order to achieve this, we must prepare the system through the
provision of an extensive library of target images - these images must include visual
representations of the target object in a multitude of different conditions as depicted in figure 10.

37
Figure 10. Image Segmentation Via Machine Learning Platform
In the case of SDG&E’s avian covers, the first hurdle would be to manually filter the full set of
existing poles present in the supplied imagery which included avian covers and then to apply a
range of image manipulation techniques to generate an appropriate training set. These could
include the use of cropping and contrast adjustment to highlight the appropriate section of the
tower – the avian cover.
3.2.1.3.2 Results
Vendor C did not perform automated asset identification using machine learning. For the trial,
based on some simple business rules, technicians reviewed the set of images that had been
georeferenced and stored in the online system. The presence of a cover was noted along with the
number of phases that included.

38
Table 7 shows the sample area:
Table 7. Pole Count
Pole Count
Number of poles 28
Photographed poles 21
Uncovered 11
1 Cover 1
2 Covers 7
3 Covers 2
Unknown 7
3.2.1.3.2.1 Display in the online system
The asset images themselves were displayed for the trial by using two elements:
1. Figure 11 is displaying based on the image capture location and using a ‘hovering
thumbnail’ to enable the user to intuitively relate the photo to the nearest asset.
Figure 11. The Display of Avian Covers Alongside Contextual LIDAR & Image data
2. Creating a colored coded symbol for each image (that related to a single pole) which
represented the cover status – that is 0-3 phases covered (white being no cover and dark
blue being all three phases) as shown in figure 12 below.
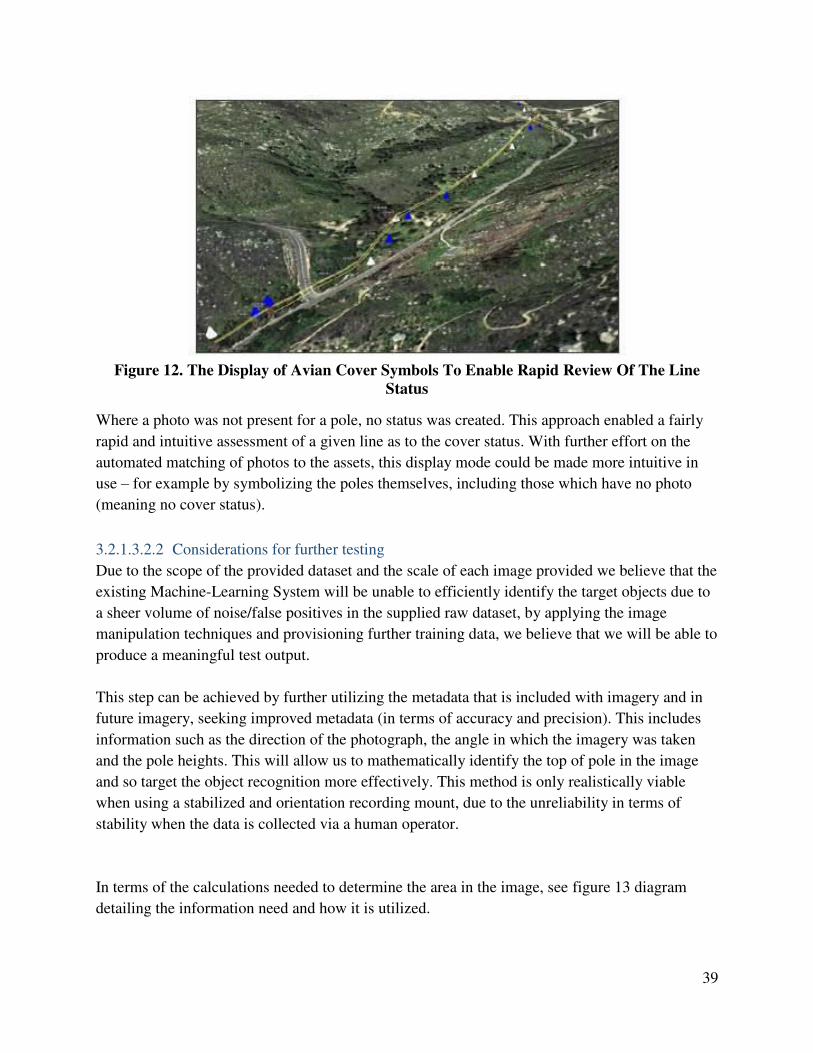
39
Figure 12. The Display of Avian Cover Symbols To Enable Rapid Review Of The Line
Status
Where a photo was not present for a pole, no status was created. This approach enabled a fairly
rapid and intuitive assessment of a given line as to the cover status. With further effort on the
automated matching of photos to the assets, this display mode could be made more intuitive in
use – for example by symbolizing the poles themselves, including those which have no photo
(meaning no cover status).
3.2.1.3.2.2 Considerations for further testing
Due to the scope of the provided dataset and the scale of each image provided we believe that the
existing Machine-Learning System will be unable to efficiently identify the target objects due to
a sheer volume of noise/false positives in the supplied raw dataset, by applying the image
manipulation techniques and provisioning further training data, we believe that we will be able to
produce a meaningful test output.
This step can be achieved by further utilizing the metadata that is included with imagery and in
future imagery, seeking improved metadata (in terms of accuracy and precision). This includes
information such as the direction of the photograph, the angle in which the imagery was taken
and the pole heights. This will allow us to mathematically identify the top of pole in the image
and so target the object recognition more effectively. This method is only realistically viable
when using a stabilized and orientation recording mount, due to the unreliability in terms of
stability when the data is collected via a human operator.
In terms of the calculations needed to determine the area in the image, see figure 13 diagram
detailing the information need and how it is utilized.
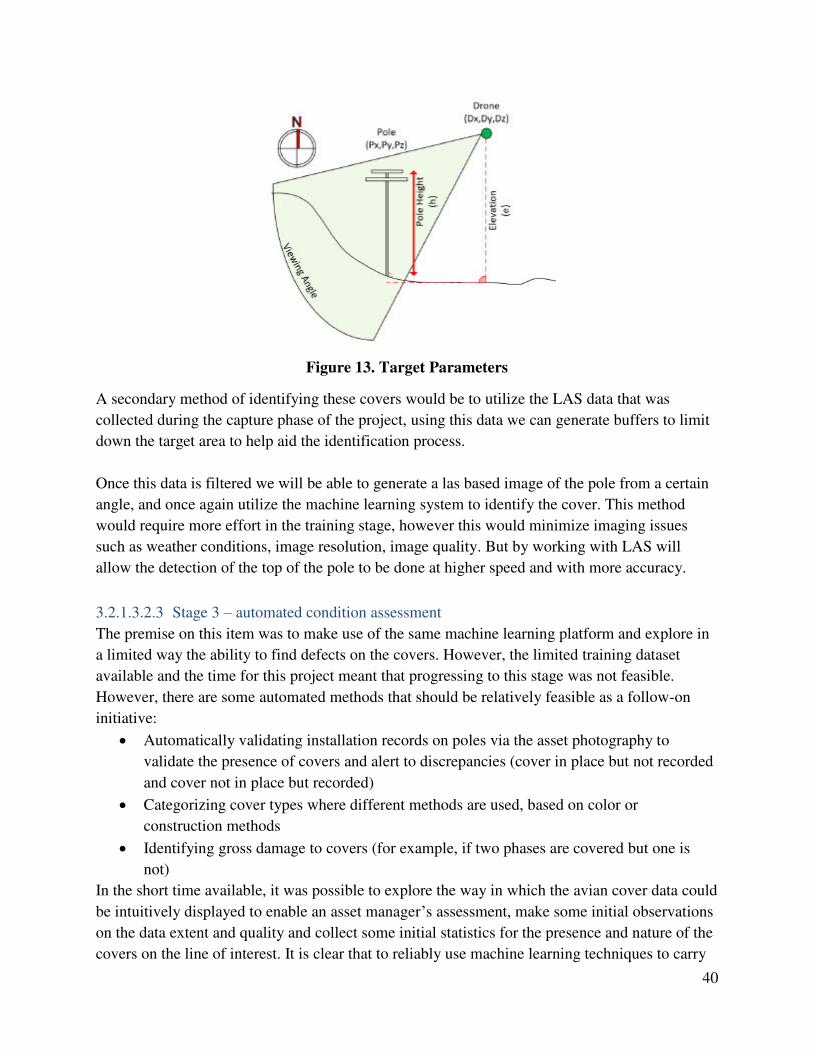
40
Figure 13. Target Parameters
A secondary method of identifying these covers would be to utilize the LAS data that was
collected during the capture phase of the project, using this data we can generate buffers to limit
down the target area to help aid the identification process.
Once this data is filtered we will be able to generate a las based image of the pole from a certain
angle, and once again utilize the machine learning system to identify the cover. This method
would require more effort in the training stage, however this would minimize imaging issues
such as weather conditions, image resolution, image quality. But by working with LAS will
allow the detection of the top of the pole to be done at higher speed and with more accuracy.
3.2.1.3.2.3 Stage 3 – automated condition assessment
The premise on this item was to make use of the same machine learning platform and explore in
a limited way the ability to find defects on the covers. However, the limited training dataset
available and the time for this project meant that progressing to this stage was not feasible.
However, there are some automated methods that should be relatively feasible as a follow-on
initiative:
Automatically validating installation records on poles via the asset photography to
validate the presence of covers and alert to discrepancies (cover in place but not recorded
and cover not in place but recorded)
Categorizing cover types where different methods are used, based on color or
construction methods
Identifying gross damage to covers (for example, if two phases are covered but one is
not)
In the short time available, it was possible to explore the way in which the avian cover data could
be intuitively displayed to enable an asset manager’s assessment, make some initial observations
on the data extent and quality and collect some initial statistics for the presence and nature of the
covers on the line of interest. It is clear that to reliably use machine learning techniques to carry

41
out a simple presence identification, then the imagery would need to be more consistent in terms
of angle and resolution. The use of LiDAR-derived geometries and capture angle/position
information for the photos would help to target the machine learning approach by focusing on
certain aspects of the image to reduce noise. Further work could test these ideas and also identify
the minimum resolution needed to identify the different types of damage that occur. It could also
explore the use of ‘geopointing’ UAV cameras based on LiDAR/model derived targets to enable
pole top photography from the UAV platform that was of very high resolution and quality.
3.2.1.4 Vendor D Results
3.2.1.4.1 Approach
For this test case Vendor D analyzed the RGB nadir and oblique imagery collected during the
two UAS flight missions that were flown as part of the project. Acquired data was used for deep
learning models training. The analysis team utilized images taken during drones’ free flights,
oblique imagery of poles, and image data gathered in single and double grid autonomous flights.
Additionally, the team gathered images of avian covers from handheld cameras for training.
All image data were labeled with an open-source graphical image annotation tool called
LabelImg. Labels were stored in .xml files, and were applied to objects representing the
following classes:
Pylon head with avian cover - Heads of energy (distribution) poles with minimum one
avian cover on the energy lines shown in figure 14 below
Figure 14. Example of Pylon Head With Avian Cover Label
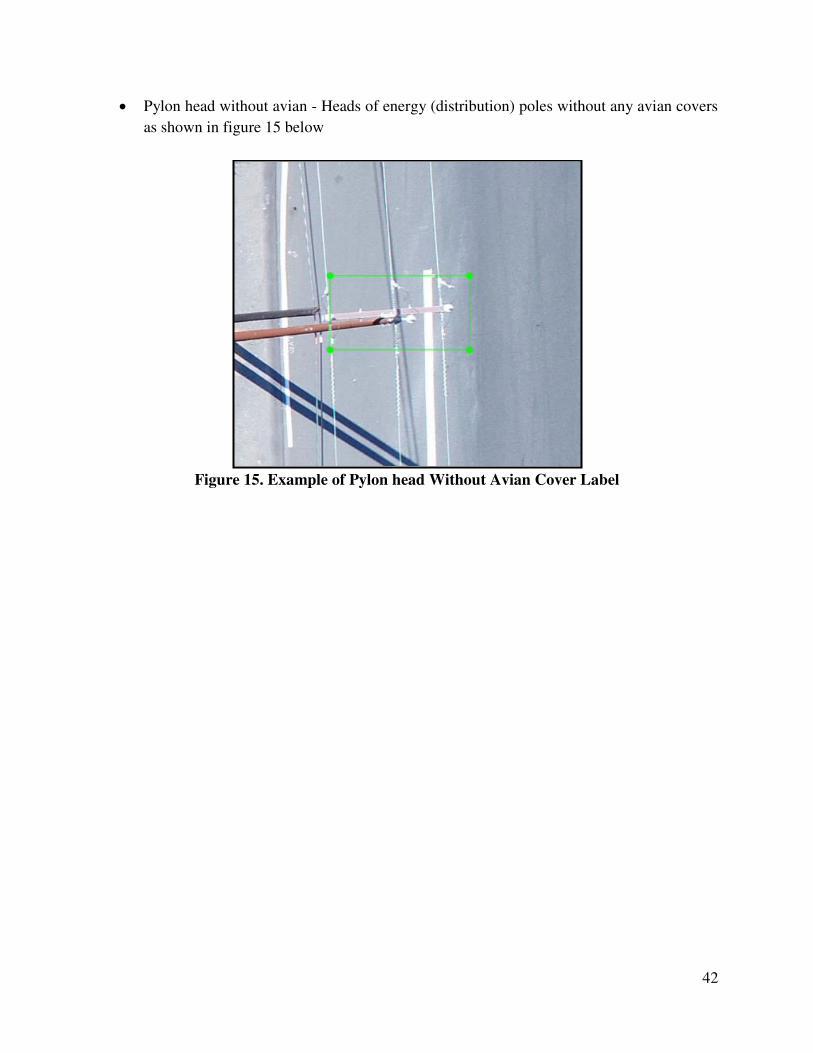
42
Pylon head without avian - Heads of energy (distribution) poles without any avian covers
as shown in figure 15 below
Figure 15. Example of Pylon head Without Avian Cover Label

43
3.2.1.4.2 Results
After 800,000 steps of training, all of the models gave results of almost 100% accuracy. The
model was tested on the additional test dataset provided (one that has not been involved in any
phase of training) and proved its high accuracy as shown in figure 16
Figure 16. Bounding Boxes Based on Trained Model

44
Accuracy checks were made both analytically and visually and detailed results of precision are
shown below:
Table 8. Results of precision
Model Overall Precision Pylon head with
avian Precision
Pylon head
without avian
Precision
Avian cover
Precision
All data 0.9908 0.9961 0.9993 0.9769
Handheld 0.9948 0.9992 0.9999 0.9856
Free flight 0.9973 0.9995 0.9999 0.9924
Single grid 0.9990 0.9999 0.9999 0.9971
Double grid 0.9958 0.9978 0.9999 0.9898
3.2.1.4.3 Additional Features Demonstrated
Detected 2 assets essentially, avian cover and distribution poles.
3.2.1.4.4 Vendor Recommendations for Future State
The chosen methodology to evaluate avian cover inventory added accuracy and efficiency, and
demonstrated a potential for cost reduction when auditing grid elements. The machine learning
techniques used for computer vision were an effective way for detecting and inventorying not
only avian covers, but a host of additional grid elements. SDG&E should consider the following
recommendations for additional machine learning benefits:
Expand upon systems developed during use case.
o Systems may be expanded to utilize additional features which can contribute to
automation of detection processes, therefore increasing its effectiveness and
decreasing SDG&E’s costs regarding fines for absence of avian covers on the
power lines.
Review all field work processes.
o SDG&E should review all of its processes concerning field work connected with
power lines inventory, maintenance, monitoring, and vegetation management to
assess which processes can be improved with deep learning and computer vision
algorithms carried out on a low altitude aerial image data.
o It would also be beneficial for SDG&E to check how trained models perform on
image data acquired with the use of different platform.
*Note: Several tasks concerning the developed deep learning system extension must be
completed before the system is complete and usable:
1. Testing of cropping images with different dimension and stride:
o Changing the parameters of the imagery used for model training may affect the
training time and accuracy.
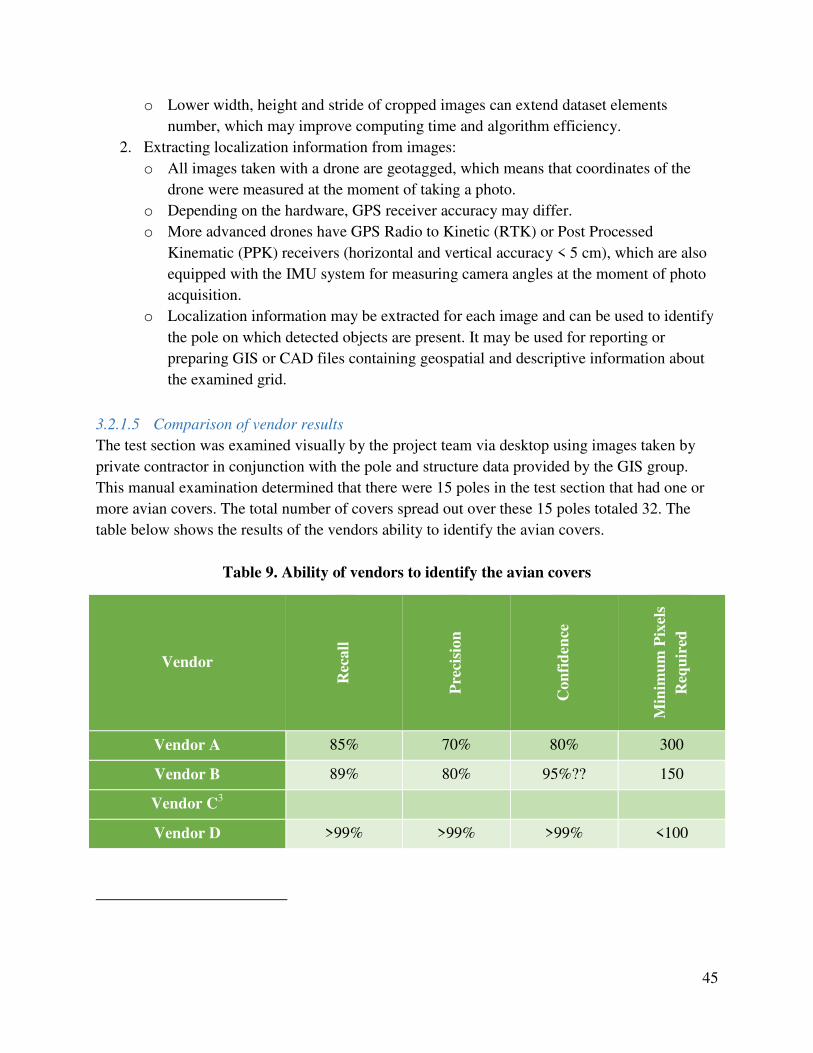
45
o Lower width, height and stride of cropped images can extend dataset elements
number, which may improve computing time and algorithm efficiency.
2. Extracting localization information from images:
o All images taken with a drone are geotagged, which means that coordinates of the
drone were measured at the moment of taking a photo.
o Depending on the hardware, GPS receiver accuracy may differ.
o More advanced drones have GPS Radio to Kinetic (RTK) or Post Processed
Kinematic (PPK) receivers (horizontal and vertical accuracy < 5 cm), which are also
equipped with the IMU system for measuring camera angles at the moment of photo
acquisition.
o Localization information may be extracted for each image and can be used to identify
the pole on which detected objects are present. It may be used for reporting or
preparing GIS or CAD files containing geospatial and descriptive information about
the examined grid.
3.2.1.5 Comparison of vendor results
The test section was examined visually by the project team via desktop using images taken by
private contractor in conjunction with the pole and structure data provided by the GIS group.
This manual examination determined that there were 15 poles in the test section that had one or
more avian covers. The total number of covers spread out over these 15 poles totaled 32. The
table below shows the results of the vendors ability to identify the avian covers.
Table 9. Ability of vendors to identify the avian covers
Vendor
Rec
all
Pre
cisi
on
Co
nfi
den
ce
Min
imu
m P
ixel
s
Req
uir
ed
Vendor A 85% 70% 80% 300
Vendor B 89% 80% 95%?? 150
Vendor C3
Vendor D >99% >99% >99% <100
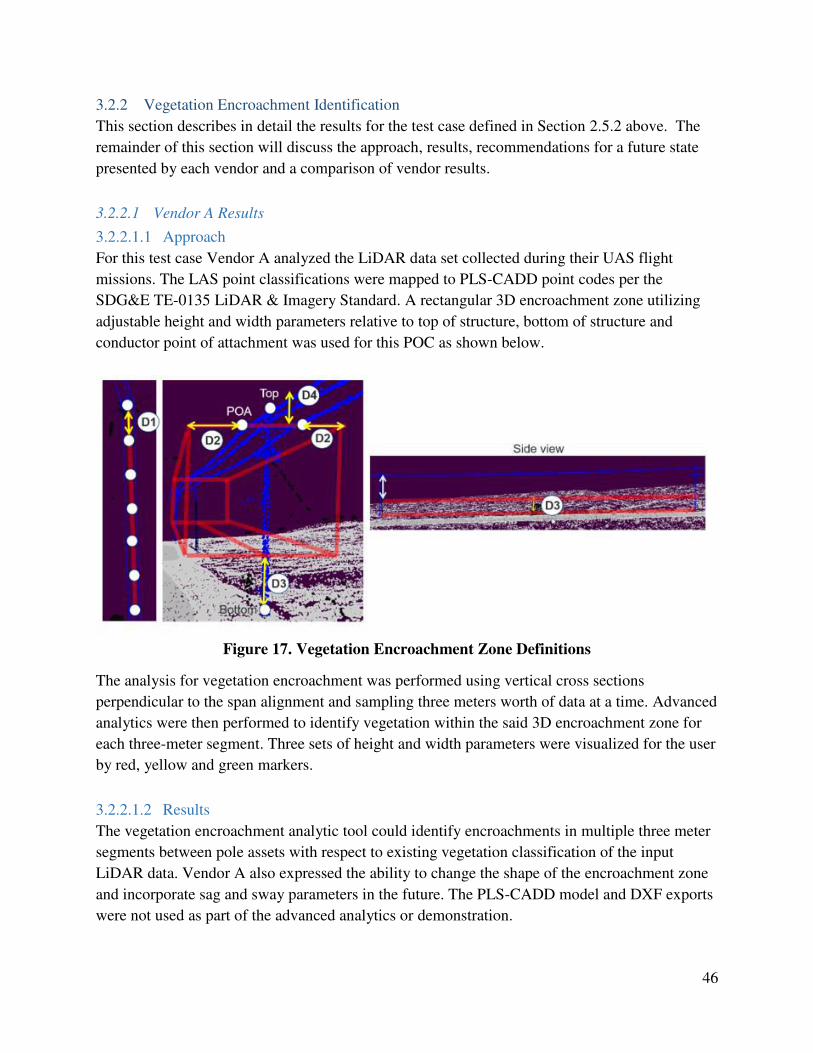
46
3.2.2 Vegetation Encroachment Identification
This section describes in detail the results for the test case defined in Section 2.5.2 above. The
remainder of this section will discuss the approach, results, recommendations for a future state
presented by each vendor and a comparison of vendor results.
3.2.2.1 Vendor A Results
3.2.2.1.1 Approach
For this test case Vendor A analyzed the LiDAR data set collected during their UAS flight
missions. The LAS point classifications were mapped to PLS-CADD point codes per the
SDG&E TE-0135 LiDAR & Imagery Standard. A rectangular 3D encroachment zone utilizing
adjustable height and width parameters relative to top of structure, bottom of structure and
conductor point of attachment was used for this POC as shown below.
Figure 17. Vegetation Encroachment Zone Definitions
The analysis for vegetation encroachment was performed using vertical cross sections
perpendicular to the span alignment and sampling three meters worth of data at a time. Advanced
analytics were then performed to identify vegetation within the said 3D encroachment zone for
each three-meter segment. Three sets of height and width parameters were visualized for the user
by red, yellow and green markers.
3.2.2.1.2 Results
The vegetation encroachment analytic tool could identify encroachments in multiple three meter
segments between pole assets with respect to existing vegetation classification of the input
LiDAR data. Vendor A also expressed the ability to change the shape of the encroachment zone
and incorporate sag and sway parameters in the future. The PLS-CADD model and DXF exports
were not used as part of the advanced analytics or demonstration.

47
3.2.2.1.3 Additional Features Demonstrated
Ability to link three closest tree assets to vegetation encroachment notifications to show
potential increase in efficiencies identifying corrected asset locations.
Figure 18. Link 3 Closest Vegetation Assets
Demonstrated ability to select a point in the LiDAR cloud and query images showing the
location using geotagging and orientation of photos.
Vendor expressed the ability to use tubular encroachment zones along the wires with
multiple zones of analysis.
3.2.2.1.4 Vendor Recommendations for Future State:
Full integration with PowerWorkz and nightly syncs to track asset characteristics:
species, growth rate, up to date height.
o Click & comment to update/track historical data & status for the asset.
Point and Click image display functionality to include vegetation assets.
Work order based image ingestion for trimming documentation & verification.
Customized encroachment zones based on regulatory and SDG&E practices to integrate
with worst-case sag and sway analysis.
3D encroaching vegetation volume assessment and RGB image verification for costing
analysis.
Rule-based risk score computation based on volume, species growth rates, conductor type
and sag/sway analysis.
3.2.2.2 Vendor B Results
3.2.2.2.1 Approach
For this test case Vendor B used two datasets provided that included a classified LiDAR point
cloud (in LAS or LAZ format) and a PLS-CADD model of the conductor lines that were
exported as a DXF file. The datasets single LAS file contained approximately 20 million points.
The points were classified into a number of feature classes.
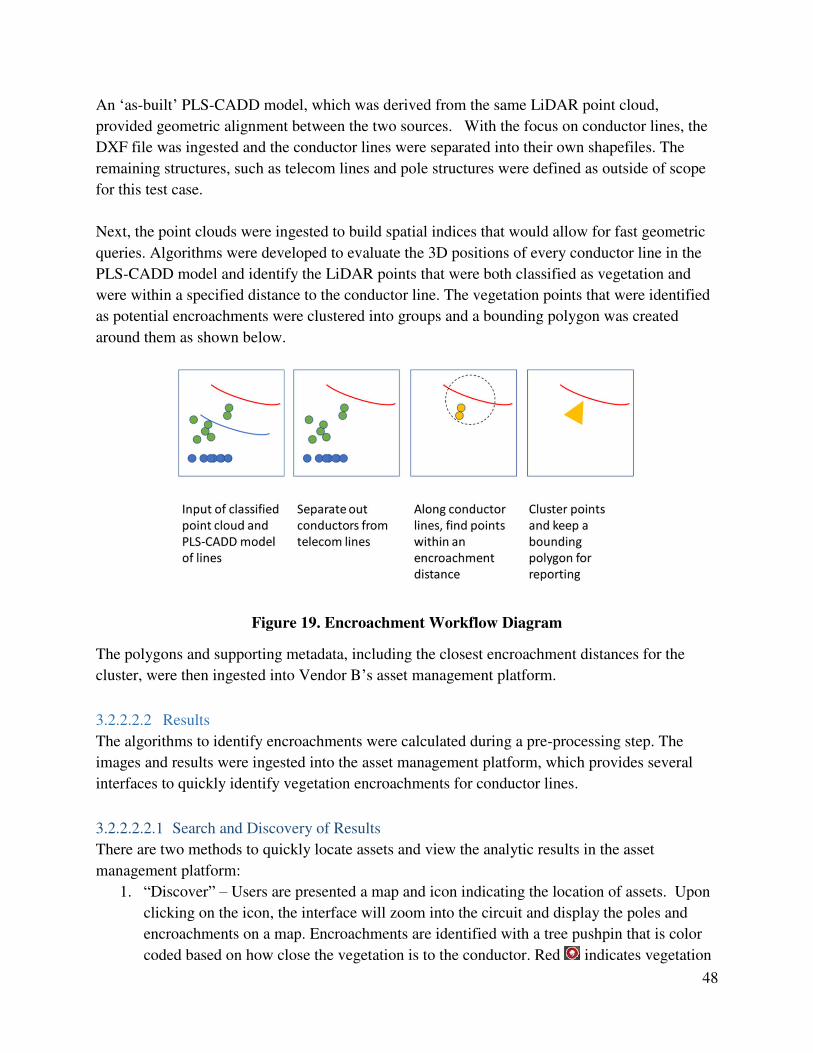
48
An ‘as-built’ PLS-CADD model, which was derived from the same LiDAR point cloud,
provided geometric alignment between the two sources. With the focus on conductor lines, the
DXF file was ingested and the conductor lines were separated into their own shapefiles. The
remaining structures, such as telecom lines and pole structures were defined as outside of scope
for this test case.
Next, the point clouds were ingested to build spatial indices that would allow for fast geometric
queries. Algorithms were developed to evaluate the 3D positions of every conductor line in the
PLS-CADD model and identify the LiDAR points that were both classified as vegetation and
were within a specified distance to the conductor line. The vegetation points that were identified
as potential encroachments were clustered into groups and a bounding polygon was created
around them as shown below.
Figure 19. Encroachment Workflow Diagram
The polygons and supporting metadata, including the closest encroachment distances for the
cluster, were then ingested into Vendor B’s asset management platform.
3.2.2.2.2 Results
The algorithms to identify encroachments were calculated during a pre-processing step. The
images and results were ingested into the asset management platform, which provides several
interfaces to quickly identify vegetation encroachments for conductor lines.
3.2.2.2.2.1 Search and Discovery of Results
There are two methods to quickly locate assets and view the analytic results in the asset
management platform:
1. “Discover” – Users are presented a map and icon indicating the location of assets. Upon
clicking on the icon, the interface will zoom into the circuit and display the poles and
encroachments on a map. Encroachments are identified with a tree pushpin that is color
coded based on how close the vegetation is to the conductor. Red indicates vegetation

49
was detected within 10 feet. Yellow indicates within 10- 12 feet, and green
indicates within 12 - 15 feet.
2. “Search” -- The Search menu can be used locate assets by type, e.g., encroachment,
poles, or both. Additionally, much like the original data management platform, users can
also apply filters to refine results.
Figure. 20 Advanced Search
3.2.2.2.2.2 Viewing Results
Using the mouse, users can easily navigate and zoom into assets on the map. Using the
icon, users can control what assets (poles, encroachments, or both) are displayed on the map.
Along with the location of the encroachments, a 2D polygon is also shown that highlights the
footprint of the encroachment area as shown in figure 21.
Figure 21. Visual Map of Detected Vegetation Encroachments
Users can view the encroachment results by right-clicking the vegetation encroachment pushpin.
A 3D point cloud viewer is opened with the camera pointed at the selected encroachment. By
pressing the “x” key, users are taken on an automated orbital flight of the encroachment. During
the flight, users can pause and resume the flight by pressing the “x” key. Users can also

50
manually view the results using the mouse to navigate the point cloud (hold down shift to slow
the speed at which the camera moves) as shown below.
Figure 22. Sample LiDAR Views of Encroachments
3.2.2.2.2.3 Findings
Using LiDAR point cloud data and PLS-CADD models, algorithms were successfully developed
to locate and categorize vegetation encroachments that were of potential risks to conductor lines.
During this effort, the following observations were made:
Encroachment detection can be accomplished reliably. Furthermore, given the
computational efficiency, processing of large areas can be scaled up using distributed
computations.
The resulting encroachment areas can be made searchable and accessible across a large
geographic area.
The LiDAR collection, point classification, and derived PLS-CADD models resulted in
inputs of high enough resolution to support vegetation encroachment detection. The
LiDAR was of good quality and density.
Encroachments can be associated to individual spans and physical assets.
While not within scope of this test case, stakeholders indicated there was a desire to
enable tracing of encroachments back to specific and known trees. Unfortunately, it was
determined that the locations of known trees in the GIS were not sufficiently aligned with
the LiDAR data to support tracing encroachments back to specific trees. Further data
collection and analysis could lead to a solution to address this need.
LiDAR and PLS-CADD based solutions offer opportunities for automated solutions to
detect vegetation encroachments as well as potential clearance violations.
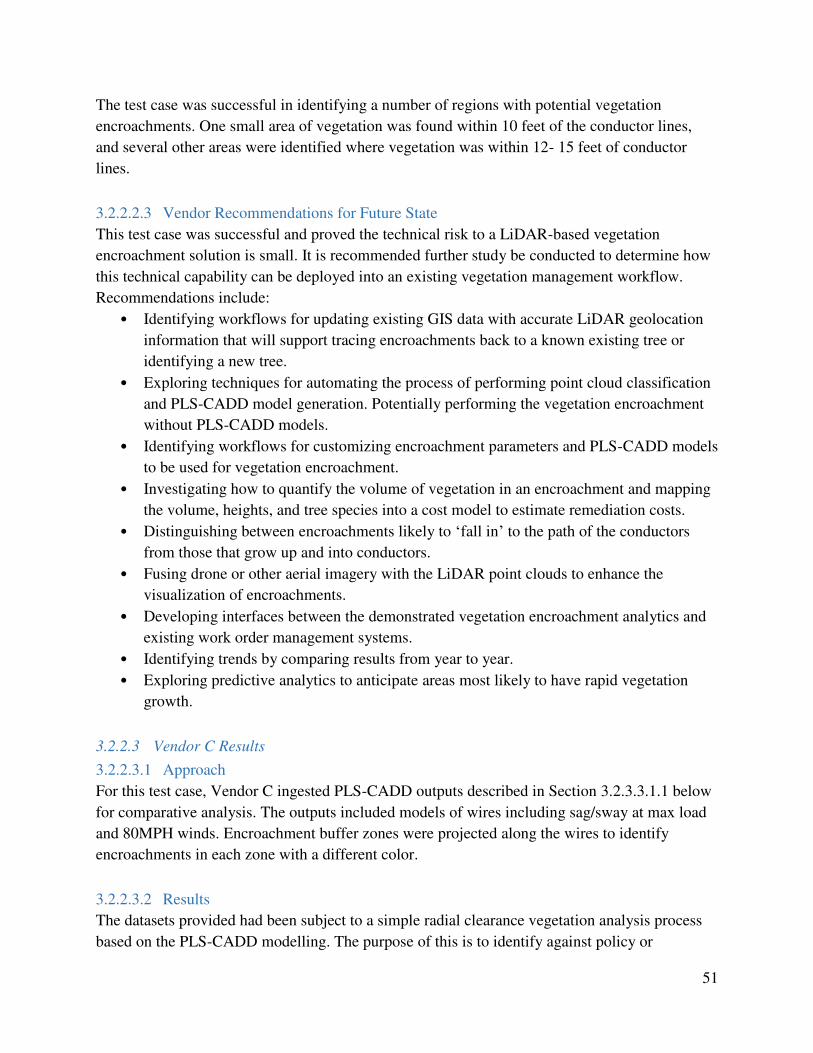
51
The test case was successful in identifying a number of regions with potential vegetation
encroachments. One small area of vegetation was found within 10 feet of the conductor lines,
and several other areas were identified where vegetation was within 12- 15 feet of conductor
lines.
3.2.2.2.3 Vendor Recommendations for Future State
This test case was successful and proved the technical risk to a LiDAR-based vegetation
encroachment solution is small. It is recommended further study be conducted to determine how
this technical capability can be deployed into an existing vegetation management workflow.
Recommendations include:
• Identifying workflows for updating existing GIS data with accurate LiDAR geolocation
information that will support tracing encroachments back to a known existing tree or
identifying a new tree.
• Exploring techniques for automating the process of performing point cloud classification
and PLS-CADD model generation. Potentially performing the vegetation encroachment
without PLS-CADD models.
• Identifying workflows for customizing encroachment parameters and PLS-CADD models
to be used for vegetation encroachment.
• Investigating how to quantify the volume of vegetation in an encroachment and mapping
the volume, heights, and tree species into a cost model to estimate remediation costs.
• Distinguishing between encroachments likely to ‘fall in’ to the path of the conductors
from those that grow up and into conductors.
• Fusing drone or other aerial imagery with the LiDAR point clouds to enhance the
visualization of encroachments.
• Developing interfaces between the demonstrated vegetation encroachment analytics and
existing work order management systems.
• Identifying trends by comparing results from year to year.
• Exploring predictive analytics to anticipate areas most likely to have rapid vegetation
growth.
3.2.2.3 Vendor C Results
3.2.2.3.1 Approach
For this test case, Vendor C ingested PLS-CADD outputs described in Section 3.2.3.3.1.1 below
for comparative analysis. The outputs included models of wires including sag/sway at max load
and 80MPH winds. Encroachment buffer zones were projected along the wires to identify
encroachments in each zone with a different color.
3.2.2.3.2 Results
The datasets provided had been subject to a simple radial clearance vegetation analysis process
based on the PLS-CADD modelling. The purpose of this is to identify against policy or
52
regulatory requirements, vegetation that infringes the minimum clearance distance or is within a
cut-back requirement as seen below.
Figure 23. Classified Vegetation Encroachments.
3.2.2.3.3 Additional Features Demonstrated
Vendor C Tool demonstrated the ability to identify encroachments using customized
outputs from PLS-CADD.
Multiple outputs of PLS-CADD could be ingested during the standard workflow to
represent different load and weather conditions.
LAS files ingested contain PLS-CADD feature coding per SDG&E standards
Vendor C expressed the ability to automate work orders with specific requirements and
integrate attributes collected in the field such as updated geographic locations.
3.2.2.3.4 Vendor Recommendations for Future State
3.2.2.3.4.1 Data Integration and Management
The Vendor C Tool environment provides the opportunity to integrate many different data
sources from internal departments with external datasets:
Integrating vegetation management intelligence with asset condition or engineering
information through a platform widely available to personnel throughout a company can
facilitate communication and cooperation. With this in mind Vendor C Tool could help
identify situations where resources for inspection activities (by different departments)
could be shared, potentially helping to cut costs associated for multiple departments.
We can also split the LiDAR vegetation canopy into more manageable units of single or
small groups of trees. Work could be completed to transform these canopy objects into
3D object within Vendor C Tool. This would allow the synergy of existing valuable

53
vegetation records, such as tree species or date of last cut, recorded in the field, to be
integrated and made accessible through these objects. These records could then be
augmented and updated as required, to ensure the information stored in the Vendor C
Tool system remains current.
o Integration of spectrally rich airborne or satellite based imagery into Vendor C
Tool could be used to provide the capability to aid identification of stressed
vegetation, at a greater risk of fall or catching fire.
o The integration of external datasets, such as spatial representations of high fire-
risk areas, or the location of high traffic transport routes or high value assets could
also be attributed and visualized. These could be used to gain a deeper
understanding of the consequence should a vegetation hazard occur, allowing
managers to make more risk based management decisions.
o There is capability to develop interactive interrogation of the databases behind
Vendor C Tool, allowing for fully configurable queries. This could provide
flexibility to be utilized business-wide, tailoring queries to different management
goals in the different aspects of the business, ensuring full utilization of the data.
Holding multiple datasets in one platform with spatial relations and joins, ensures datasets are
current, removes issues of data duplication and makes viewing and generating vegetation related
reports more efficient, saving costs in time and duplicated data entry effort.
3.2.2.4 Vendor D Results
3.2.2.4.1 Approach
The purpose of developing the proof of concept on vegetation management with UAS was to
identify potential applications of LiDAR point cloud, aerial images, and derivative
photogrammetry products to form an approach for most effectively utilizing each type of data.
By creating a synergistic approach to using different types of data, data will be thoroughly
utilized and reusable, resulting in cost savings for SDG&E.
The major considerations during use case development were:
Most effective algorithm for locating vegetation to be cut down.
Possibility of performing fully autonomous detection of powerlines and trees on LiDAR
point clouds and drone images, and quality of detection.
Data type that is best suited for the use case (LiDAR vs. aerial image, or combination)
Combination of data types to obtain best results from the technical and economical point
of view.
The data used to develop the Vegetation Management proof of concept are as follows:
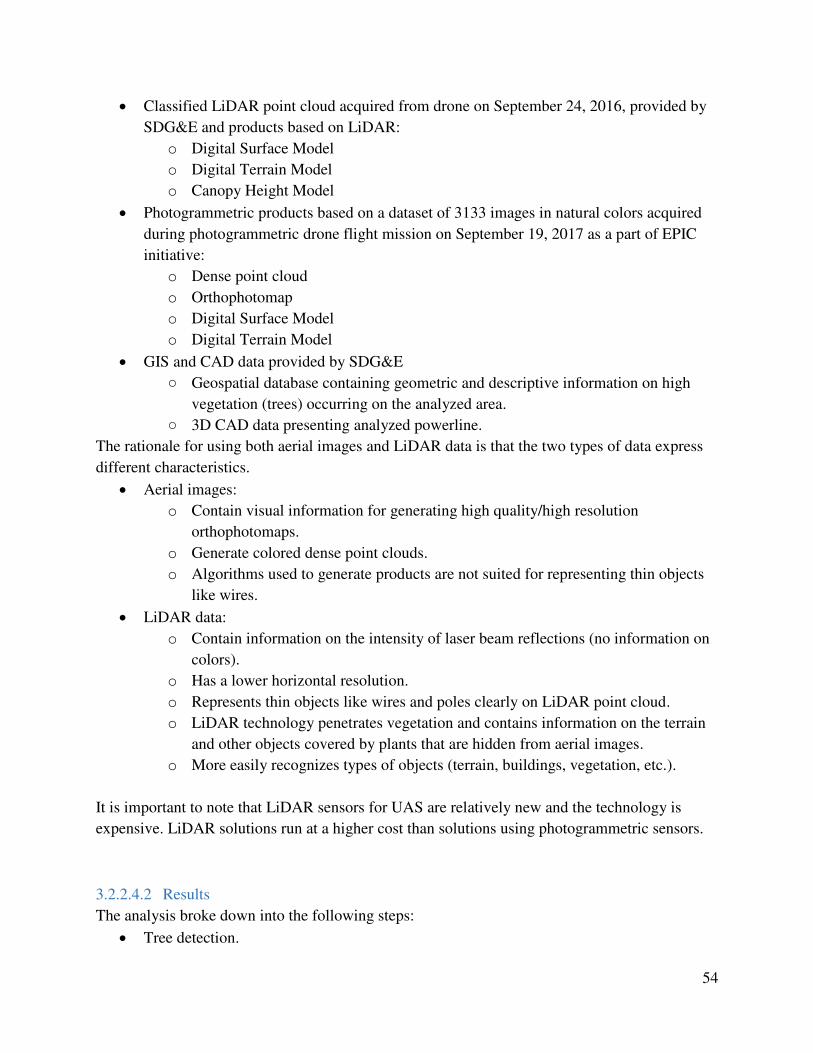
54
Classified LiDAR point cloud acquired from drone on September 24, 2016, provided by
SDG&E and products based on LiDAR:
o Digital Surface Model
o Digital Terrain Model
o Canopy Height Model
Photogrammetric products based on a dataset of 3133 images in natural colors acquired
during photogrammetric drone flight mission on September 19, 2017 as a part of EPIC
initiative:
o Dense point cloud
o Orthophotomap
o Digital Surface Model
o Digital Terrain Model
GIS and CAD data provided by SDG&E
○ Geospatial database containing geometric and descriptive information on high
vegetation (trees) occurring on the analyzed area.
○ 3D CAD data presenting analyzed powerline.
The rationale for using both aerial images and LiDAR data is that the two types of data express
different characteristics.
Aerial images:
o Contain visual information for generating high quality/high resolution
orthophotomaps.
o Generate colored dense point clouds.
o Algorithms used to generate products are not suited for representing thin objects
like wires.
LiDAR data:
o Contain information on the intensity of laser beam reflections (no information on
colors).
o Has a lower horizontal resolution.
o Represents thin objects like wires and poles clearly on LiDAR point cloud.
o LiDAR technology penetrates vegetation and contains information on the terrain
and other objects covered by plants that are hidden from aerial images.
o More easily recognizes types of objects (terrain, buildings, vegetation, etc.).
It is important to note that LiDAR sensors for UAS are relatively new and the technology is
expensive. LiDAR solutions run at a higher cost than solutions using photogrammetric sensors.
3.2.2.4.2 Results
The analysis broke down into the following steps:
Tree detection.

55
Calculation of the distance between detected trees and wires.
Direct calculation of the distances in the point cloud.
Identification of the trees which are either too close to the wire or higher than the distance
to the wire.
Recording of the trees to be taken out due to creation of potential firebreaks.
Tree detection
The first step of point cloud processing was automatic detection of trees. The accuracy of the
results mainly depends on the type of the landscape and the quality of the data acquired. Two
different algorithms were deployed in order to define the best approach in this particular case.
Algorithm A is a modification of the approach proposed by Eysn et al. (2012) developed in
ArcMap while algorithm B is implemented in Global Mapper.
The workflow in Algorithm A consisted of the following steps:
● Digital Terrain Model calculation from Ground LiDAR class.
● Digital Surface Model calculation from High vegetation class.
● Canopy Height Model calculation from DTM and DSM.
● Local maximum height calculation.
● Detection of tree tips.
● Selection of trees higher than the defined threshold.
● Conversion of raster to shapefile.
A leading practice for successfully detecting trees is to adjust the parameters that describe the
spread and height of trees. Since these values vary for different landscapes and locations, it is
crucial to perform tests on real data. In algorithm A, two parameters were altered:
● Search radius for calculation of local maximum height (can be identified as the maximum
spread of the tree).
● Minimum height of the tree.
Six sets of parameters were tested on LiDAR point cloud for the purpose of this report. The
results were then assessed visually in comparison to the point cloud and orthophotomap for a
chosen test area. Comparison to the orthophoto was also performed because it is challenging to
identify singular trees in LiDAR cloud manually. There are noticeable difference because the
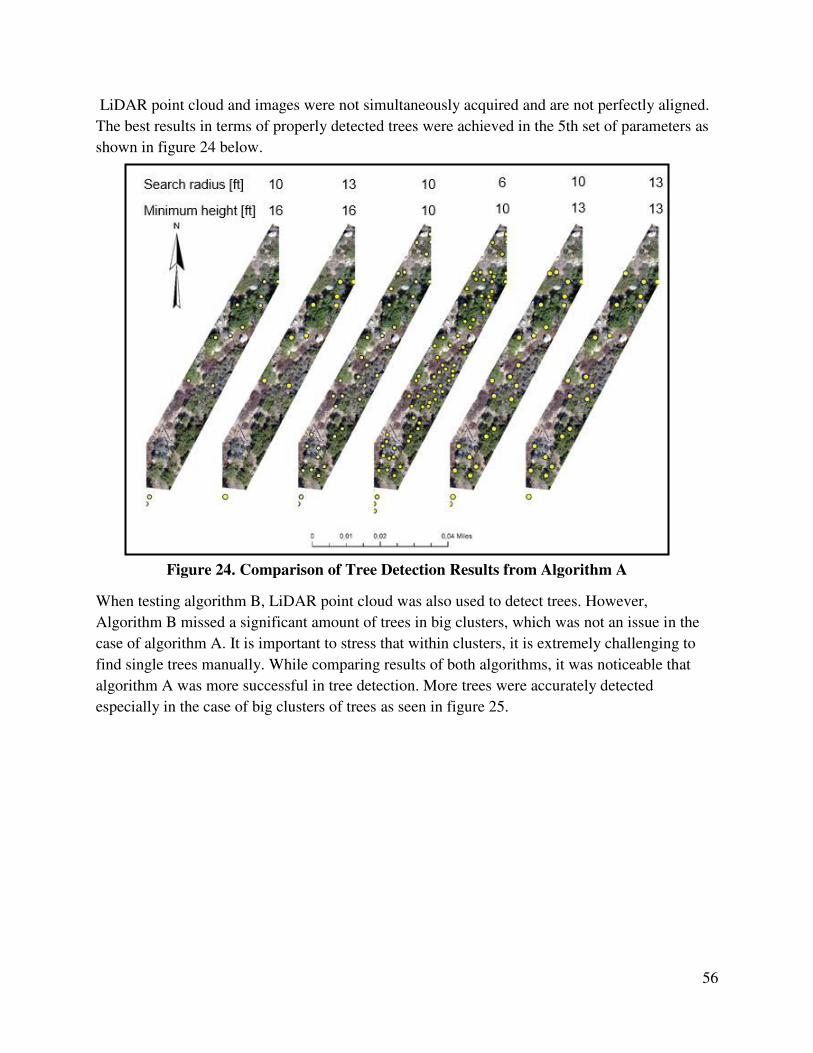
56
LiDAR point cloud and images were not simultaneously acquired and are not perfectly aligned.
The best results in terms of properly detected trees were achieved in the 5th set of parameters as
shown in figure 24 below.
When testing algorithm B, LiDAR point cloud was also used to detect trees. However,
Algorithm B missed a significant amount of trees in big clusters, which was not an issue in the
case of algorithm A. It is important to stress that within clusters, it is extremely challenging to
find single trees manually. While comparing results of both algorithms, it was noticeable that
algorithm A was more successful in tree detection. More trees were accurately detected
especially in the case of big clusters of trees as seen in figure 25.
Figure 24. Comparison of Tree Detection Results from Algorithm A

57
The analysis team then compared algorithm A to the SDG&E vegetation dataset. Since the
SDG&E vegetation data mostly contained trees higher than 20 feet, the same threshold was
applied on the algorithm A’s dataset. Results of the comparison are shown below:
Figure 26. Comparison of Tree Detection Results (red) and SDG&E Dataset (yellow).
Figure 25. Comparison of Algorithm A and B Results

58
It is clear from the above analysis that trees can be detected in a point cloud and provide accurate
results. Algorithm A was quite successful in this case, but it is important to keep in mind that
deploying it requires performing multiple comparative analyses to find the best parameters for
certain types of vegetation and landscape. However, it can be seen as worth the investment as it
enables wire sag and growth modeling in the process of hazard detection.
Distance between detected trees and wires
Once the trees are detected, it becomes possible to calculate the distance between trees and
wires. PLS-CADD has a built-in layer which contains not only X and Y coordinates of the line
but also its height as weather and loading conditions allow.
The analysis team first established the planar distance between points representing trees and lines
representing wires. In addition to calculation of the distance, height difference between trees and
wires can also be determined by the coordinates. Once the planar distance and height differences
are known it is possible to calculate three-dimensional distance in the design as shown in Figure
27 below
LiDAR point cloud is classified into categories representing different objects and elements of a
landscape. Layered data can be used to measure distance between objects in varying classes. It is
possible to measure distance from points located on a tree and points on a wire or a pylon by
using point cloud acquired by laser scanner or created from images. Taking into account all of
this information and measurements, it is possible to identify the trees that are too close to the
Figure 27. Calculation of the Three-Dimensional Distance between Vegetation and Wire

59
infrastructure based on a defined threshold in a colored by class point Cloud LiDAR image as
seen in Figure 28 below.
Figure 28. LiDAR Point Cloud Colored by Class
Distance measurements only describe the situation at the time of the measurement (for specific
value of the wire sag). Since the sag value is influenced by multiple variables such as tension,
loading, or temperature, there is a need to take these changes into consideration. Knowing the
situation at the time of the measurement, tension, loading, and temperature maximum change in
the wire sag can be defined based on a stringing chart report.
Thin objects like wires may not be well represented in a point cloud derived from images, since
the thickness of the wire is relatively small when compared to the Ground Sampling Distance of
images. As it often results in gaps in the 3D representation of the wire, LiDAR survey is
recommended to collect the data. Since the route of power lines does not vary over time and the
only variable that is changing is the sag of the wire, it is possible to use the same point cloud for
a few years.
The 3D model of vegetation is reconstructed well on both types of point cloud data, therefore
photogrammetric point cloud can also be used for this purpose. Since the structure of vegetation
changes often, data gathering should be more frequent. It is possible to merge part of the
LiDAR point cloud that represents the wire, with vegetation information from either LiDAR or
image point cloud to identify unwanted vegetation. The red in Figure 29 shows the dangerous
vegetation that was detected.
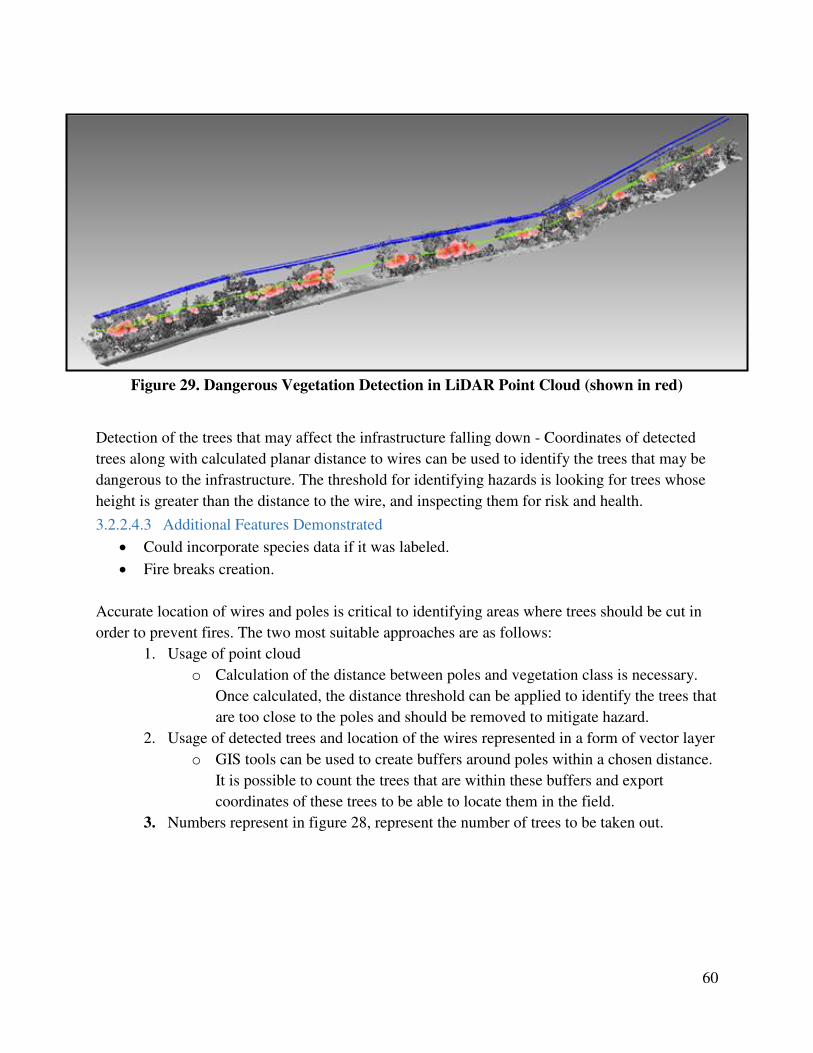
60
Detection of the trees that may affect the infrastructure falling down - Coordinates of detected
trees along with calculated planar distance to wires can be used to identify the trees that may be
dangerous to the infrastructure. The threshold for identifying hazards is looking for trees whose
height is greater than the distance to the wire, and inspecting them for risk and health.
3.2.2.4.3 Additional Features Demonstrated
Could incorporate species data if it was labeled.
Fire breaks creation.
Accurate location of wires and poles is critical to identifying areas where trees should be cut in
order to prevent fires. The two most suitable approaches are as follows:
1. Usage of point cloud
o Calculation of the distance between poles and vegetation class is necessary.
Once calculated, the distance threshold can be applied to identify the trees that
are too close to the poles and should be removed to mitigate hazard.
2. Usage of detected trees and location of the wires represented in a form of vector layer
o GIS tools can be used to create buffers around poles within a chosen distance.
It is possible to count the trees that are within these buffers and export
coordinates of these trees to be able to locate them in the field.
3. Numbers represent in figure 28, represent the number of trees to be taken out.
Figure 29. Dangerous Vegetation Detection in LiDAR Point Cloud (shown in red)
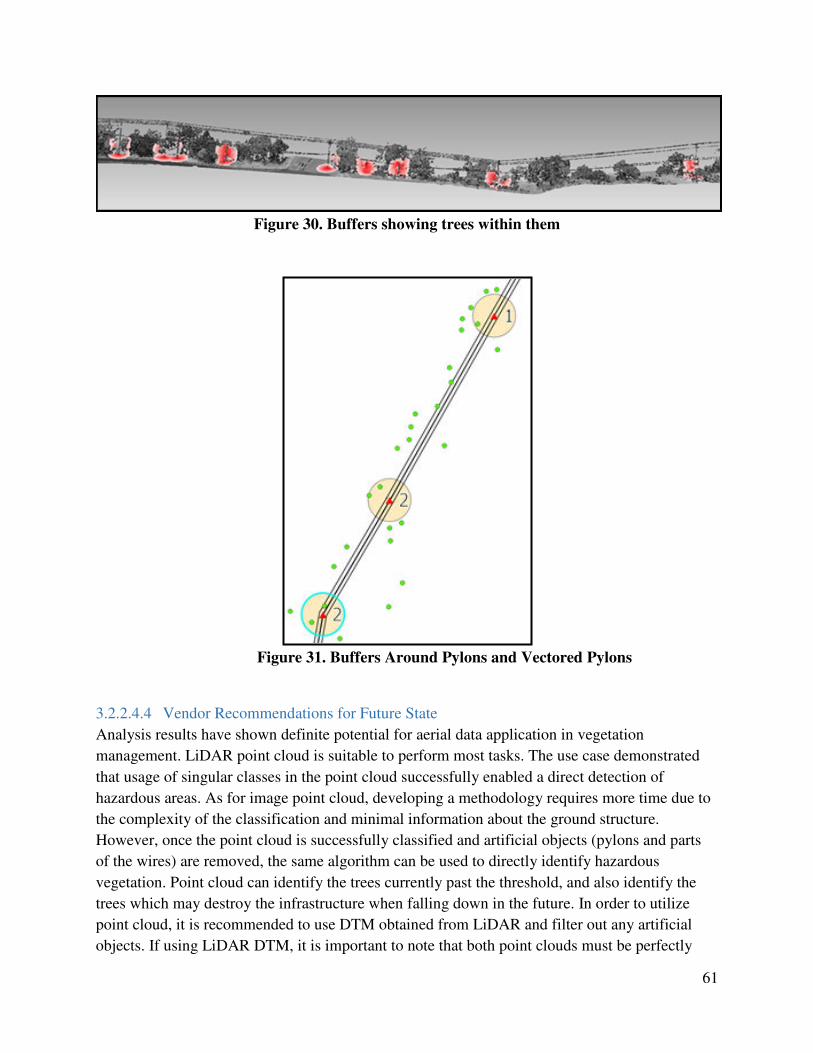
61
Figure 30. Buffers showing trees within them
3.2.2.4.4 Vendor Recommendations for Future State
Analysis results have shown definite potential for aerial data application in vegetation
management. LiDAR point cloud is suitable to perform most tasks. The use case demonstrated
that usage of singular classes in the point cloud successfully enabled a direct detection of
hazardous areas. As for image point cloud, developing a methodology requires more time due to
the complexity of the classification and minimal information about the ground structure.
However, once the point cloud is successfully classified and artificial objects (pylons and parts
of the wires) are removed, the same algorithm can be used to directly identify hazardous
vegetation. Point cloud can identify the trees currently past the threshold, and also identify the
trees which may destroy the infrastructure when falling down in the future. In order to utilize
point cloud, it is recommended to use DTM obtained from LiDAR and filter out any artificial
objects. If using LiDAR DTM, it is important to note that both point clouds must be perfectly
Figure 31. Buffers Around Pylons and Vectored Pylons

62
aligned. Below are two potential opportunities for UAS data application at SDG&E that were
identified by this vendor:
Investigate value in combined vegetation images with predictive modeling based on tree
species growth rates to enable strategic management work-planning; algorithm
development can be explored as an option for automated tree species classification.
o Utilizing an algorithm for tree detection from a point cloud will build an accurate
and complete database.
o An automatic method for distance calculation will enable instant and accurate
identification of the trees to be trimmed or removed.
Investigate the use of near IR imaging to identify trees in poor health that are at risk of
falling into infrastructure
o Aerial data can inform and enhance SDG&E’s current data on trees’ locations and
GIS layers of infrastructure.
o Photogrammetric point cloud is particularly useful in detecting trees, and can be
used to not only accurately detect the location but also the number of trees in
SDG&E’s vegetation dataset.
o Photogrammetric point cloud can also provide additional information on attributes
of objects (e.g., height of the trees).
Investigate integration with PowerWorkz system.
o Integration can drive efficient work-planning while leveraging existing platforms.
The following proposed UAS application will improve the workload on the Vegetation
Management teams and minimize the field work that has to be performed. Distances calculated
based on the point cloud will be more accurate and can be utilized to measure trees at any height
of choice. Long term, the calculations and measurements can be repeated or improved without
conducting field trips.

63
3.2.2.5 Comparison of vendor results
Table 10. Vendor Results Comparison
Vendor
En
croach
men
t
Iden
tifi
cati
on
Bu
ffer
Zon
e
Sh
ap
e U
tili
zed
PL
S-C
AD
D
Sag/S
way
Ab
ilit
y
Vendor A Positive Rectangular Negative
Vendor B Positive Tubular Positive
Vendor C Positive Tubular Positive
Vendor D Positive Distance
Parameters Negative
3.2.3 Cataloging and Remote Asset Management
This section describes in detail the results for the test case defined in Section 2.5.3 above. The
remainder of this section will discuss the approach, results, recommendations for a future state
presented by each vendor and a comparison of vendor results.
3.2.3.1 Vendor A Results
3.2.3.1.1 Approach
For this test case Vendor A ingested from the baseline data set and vendor collected UAS data
various forms of data including Esri GIS, Shapefile (SHP), LAS, imagery and more. The data
sets were organized in an enterprise IDMP and loaded to the vendor tool to allow users the
ability to access, visualize and analyze the data. The Vendor A Tool demonstrated the following
product features:
Asset on-boarding through shapefiles and as-built DXF.
Data ingestion of as-built LiDAR, RGB/IR/video archives and orthoimages.
Data sorting and association based on metadata.
2D/3D visualization with 3D click and display.
Collaboration tools for comments, annotations, uploads and downloads.
3.2.3.1.2 Results
The Vendor A Tool successfully ingested data from different sources and associated imagery and
metadata to SDG&E assets for remote viewing and analysis.
The platform features 2D home, 3D review workstation, reports and data ingestion pages for
users to perform various forms of analysis, measurements, annotations and data transfer
functions. It includes navigation and controls for here location, zoom and full screen display.

64
The home page displays a low-resolution background with symbols for various assets and
advanced analytics notifications. Selected assets display any desired attribute information and a
link to review the asset in the 3D workstation if applicable. This page also provides a summary
for inspection notifications that can be tied to the appropriate work orders and allows specific
layers of data to be toggled off and on as shown below.
Figure 32. Example of Vendor A Home Screen
The review workstation provides 3D workspace for analysis of metadata, LiDAR and imagery. It
includes a hierarchy structure for client, site, asset and date for filtering and selection purposes.
There are tools for navigating views, selection of objects and measurement tools such as
distance, height, area, volume and more. Users that select a point in the LiDAR cloud or a
specific asset will be shown all images displaying that specific point in 3D space. Users have the
ability to toggle on and off annotations and specific LAS point cloud classifications, adjust
camera position and change other view settings.
3.2.3.1.3 Additional Features Demonstrated
Vendor A also demonstrated addition features such as those identified below:
The baseline data set was added to the Vendor A Tool as an additional project for
visualization and analysis but was not integrated with UAS data collected by the vendor
for change management or comparison purposes.
Images contained in an analytics query result were identified with a flag in the corner, i.e.
avian cover detection.

65
3.2.3.2 Vendor B Results
Results for Vendor B included in Section 3.2.5 below
3.2.3.3 Vendor C Results
3.2.3.3.1 Approach
3.2.3.3.1.1 Upload and configuration processes
Data supplied from the various sources required review, post-processing and transformation
before upload to the online system was possible. The following lists each data type and the work
undertaken to create suitable outputs for ingestion into the system.
Ortho-rectified imagery (stock, where available) - No further work required. Conversion of 622
ECW (≈700 MB) into a proprietary format optimized for internet streaming (especially important over variable connections).
Time to convert: 60 minutes (automated process).
LiDAR Point Cloud: Required exploration in order to make robust assumptions on the
classification schema, the accuracy and suitability of the classification and any filtering that may
have been undertaken. Required conversion to a format that was optimized for streaming over an
internet connection.
Conversion of LAS into Compressed Point Format – 12 GB.
Time to convert: 30 minutes
Digital Terrain Model (DTM): There is a need to convert and smooth the high-Resolution
corridor DTM derived from the LiDAR with low resolution terrain data derived from a third
party. This is to enable the fusing of the contextual terrain outside of the narrow powerline
corridor. In this case, the ground points from the point cloud were used to create a DTM which
was then fused with terrain from the Shuttle Radar Topography Mission (SRTM) elevation
dataset.
Time to convert: 30 minutes
PLS-CADD Exports - PLS-CADD can produce an extensive collection of reports and network
analytics. Certain features, such as conductors at a given loading and weather condition, can be
extracted on demand and then formatted such that it enables display on the online system. For
this dataset we were instructed to assess the following factors:
Vector information - Extract wires from PLS-CADD at different conditions.
Max Op. (167 °F)
Blowout (85 mph)
Vegetation reports
o Grow in @ Max Op.
o Grow in @ Blowout
o Fall in @ Max Op.
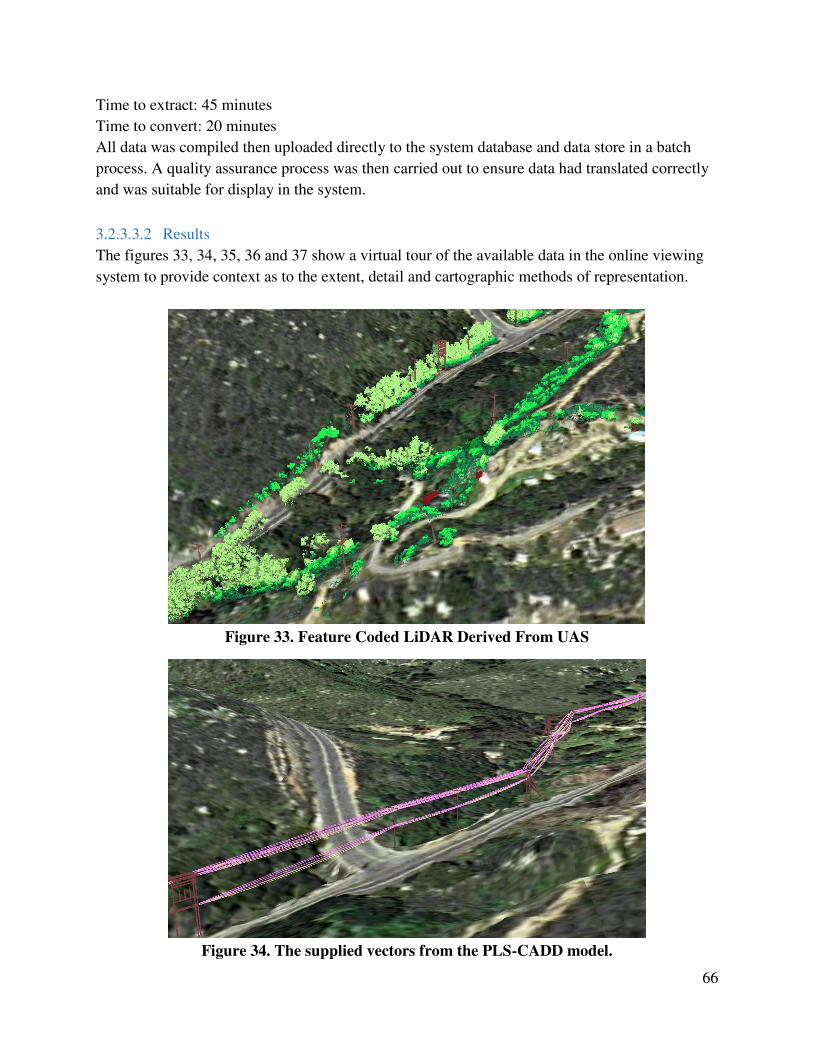
66
Time to extract: 45 minutes
Time to convert: 20 minutes
All data was compiled then uploaded directly to the system database and data store in a batch
process. A quality assurance process was then carried out to ensure data had translated correctly
and was suitable for display in the system.
3.2.3.3.2 Results
The figures 33, 34, 35, 36 and 37 show a virtual tour of the available data in the online viewing
system to provide context as to the extent, detail and cartographic methods of representation.
Figure 33. Feature Coded LiDAR Derived From UAS
Figure 34. The supplied vectors from the PLS-CADD model.
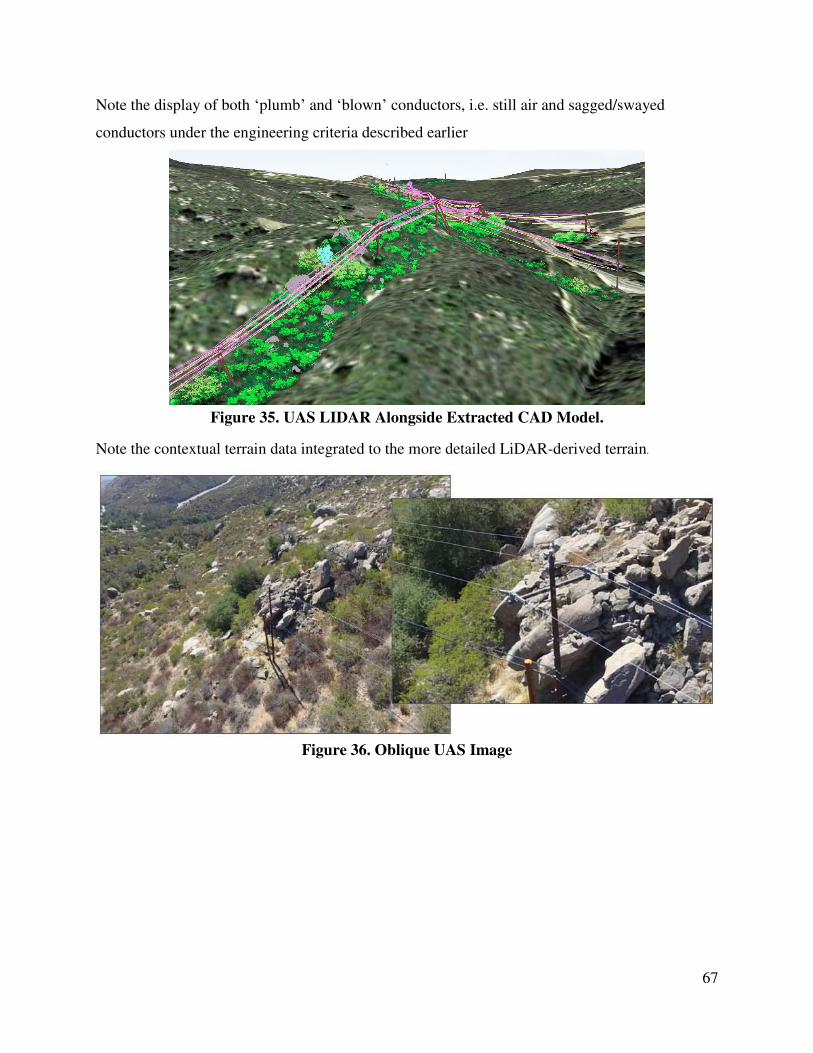
67
Note the display of both ‘plumb’ and ‘blown’ conductors, i.e. still air and sagged/swayed
conductors under the engineering criteria described earlier
Figure 35. UAS LIDAR Alongside Extracted CAD Model.
Note the contextual terrain data integrated to the more detailed LiDAR-derived terrain.
Figure 36. Oblique UAS Image

68
Figure 37. The UAV-Derived Structure Images
3.2.3.3.3 Vendor Recommendations for Future State
Standardization of data structures and formats to enable more efficient sorting and
loading
A greater consistency in the UAV imagery in particular
Metadata files giving an overview of the available data and its spatial extents (including
areas such as the point classification schema)
Vendor C also provided recommendations for future use cases including:
3.2.3.3.3.1 Data & system integration
The work undertaken showed how the ability to display disparate sources of data (being LiDAR,
models and images) can add value in terms of improving access to information for planning and
other benefits. Further benefit could be realized by:
Exploring the options for live-linking GIS and asset data on a read-only basis to ensure
that those using the 3D platform could have access to more detailed attribution and up-to-
date information.
Looking at the ways in which users can interact with the 3D environment and start to feed
changes and updates back to the connected asset and work management systems, using
the virtual environment as the user interface for work recording.
The expansion to start taking on a greater range of external data sources – taking in new
line designs, models from other Computer Aided Design (CAD) systems, GIS data from
state and other open sources and a greater depth within the existing corporate GIS.
The exposure of the online system to external work contractors and other authorized
parties such that they have access to more relevant information to enable them to better
carry out maintenance and construction tasks.

69
The benefits in this case stem from the removal of a requirement to access multiple systems to
get information or complete a task and the improvement of information provided to those
working on the physical network. The means by which this could be tested and validated is
through a series of pilot tests which focus on specific user cases (such as integrating the internal
vegetation work management system to the online viewer using UAS-derived LiDAR
infringements).
3.2.3.3.3.2 Exploring future asset management opportunities
The data used in the trial and the capabilities provided by the online access platform provide
significant future potential for asset management. In no specific order are a range of areas that
could be explored in future work:
Dynamic visualization of status per span via cartographic methods (i.e. color according to
category) – including last inspection, ground clearance, vegetation status, asset type, risk
rating, etc. Enabling reviews of lines and areas to criteria of interest to form an intuitive
assessment or enable work planning.
Virtual line patrols on images and LiDAR for features of interest – then targeting ground
patrols directly to areas of interest/concern. Could include vegetation management
(including fall-in trees), areas with a greater risk of public safety or assets with certain
attributes, enabling the access to all key datasets and records.
Ground and building change detection to identify potential network risks or change to
safety status based on hard object encroachment – showing the location and then enabling
assessment from the desktop.
Connection to investment and asset maintenance optimization platforms based on access
to the results of analysis, third party data, internal data and a range of criteria.
3.2.3.4 Vendor D Results
3.2.3.4.1 Approach
Traditionally, geospatial products have been seen as supplementary tools that aid asset
inspections on an ad-hoc basis. However, technological advancements have enabled the
incorporation of aerial data (e.g., images, photogrammetry, LiDAR), turning geospatial products
into a source of reliable and accessible information for companies’ comprehensive asset
management platforms. Drone based solutions accelerate the processes of inventorying and
creating digital asset registers, improves situational awareness of power grid assets, and enhances
prediction and reaction capabilities to events that may interfere with the network performance.
Asset management typically requires RGB cameras to produce raw photos, point cloud, and 3D
models.
The analysis team used aerial data collected during drone inspections over energy lines located in
California. The data received from SDG&E consisted of raw images, LiDAR data, and additional
vector GIS and CAD data. These were used to develop:

70
DSMs and DTMs (from both image and LiDAR data).
RGB orthophotomap.
LiDAR reflection intensity orthophotomap.
PDF files with additional information related to examine assets (attached in Vendor D
Tool to relevant dataset).
Due to its features and characteristics, the Vendor D Tool was chosen as a proprietary aerial data
platform for the study.
The Vendor D analysis team reviewed utility company leading practices and analyzed ways in
which geospatial products enhanced asset management processes. The team concluded that
utilizing digital maps of a company’s operational radius is the best way to aggregate and
visualize multiple sources of data concerning linear utility assets. Adding aerial data to digital
representations of governed assets enables companies to retrieve information related to the assets
more accurately and efficiently. This not only improves inventory processes but also facilitates
asset maintenance in terms of necessary repairs and restorations.
3.2.3.4.2 Results
The Vendor D Tool successfully ingested data from different sources and associated imagery and
metadata to SDG&E assets for remote viewing and analysis. The platform features 2D home
page, with buttons to switch to 3D navigation and select projects, analysis tools for users and
navigation controls.
The home page displays an overall low-resolution background with high-resolution
orthophotomap along the test segment corridor. There are dots representing different assets with
labels for identification, e.g. trees are labeled with a green dot and the type. The navigation
controls include north orientation of screen, split screen view, zoom and navigation history. The
tools for analysis include layer controls for all the types of data ingested from the baseline data
set. Tools for measurement include distance, area, height, height difference, volume and
coordinates. Different icons represent different file attachments and the associated data is
displayed when the icon is selected. Figure 38 is an example of Vendor D’s home screen.

71
Figure 38. Example of Vendor D Home Screen
There are also tools to add a note or attach a new file as shown in figure 39 below:
Figure 39. Example of File Attachment Screen
3.2.3.4.3 Additional Features Demonstrated
Orthophotomap created from RGB nadir imagery for high resolution background.
PLS-CADD model represented from DXF export included in baseline data set.
Displayed oblique images taken for pole documentation purposes during baseline data set
acquisition.
Additional applications of UAS data in terms of asset management and related maintenance
proposed by the vendor are as follows:

72
Table 11. Additional Applications of UAS Data For Asset Management
Application Suitable Geospatial
Product
Cataloging assets, verifying quantity and location of inventor or mounted
elements
Examples:
Analyzing vectored paths of wires to detect areas where avian covers are
needed
Combining buffer and intersect tools to automatically detect areas where
problems may appear
Manually measuring problem areas on oblique images or LiDAR point
cloud
Raw photos
Point cloud
3D model
Performing visual assessments to evaluate condition of:
Pole structures (e.g., concrete losses, condition of welds, rivets, coating)
Support structures
Insulators and wires (e.g., wire fixings on the poles)
Oblique image presenting top of the distribution pole including elements such as avian
cover, wire fixings, and insulators
RGB/IR
photos and
videos

73
Controlling the position of a pole relative to the ground by measuring deviation
from the vertical position and identifying abnormalities in construction to prevent
poles from falling over.
LiDAR point cloud presenting position of a distribution pole relative to the ground
Point cloud
3D model
Performing wire sag analysis to enable efficient wire transfer of energy.
Visual representation of wire sag
LiDAR
Automatically calculating the distance between SDG&E 2nd level and 3rd level
wires or/and third party wires.
LiDAR point cloud presenting two types of SDG&E wires and one third-party wire
Classified
LiDAR

74
Gathering data on the condition of energy power lines in case of natural disasters.
Helpful in identifying damages, planning repair services, and mapping current
state of natural environment
Image representing conditions on the ground
Orthophotomaps
Creating and enhancing information database for asset data. If the location of a
particular pole can be determined by the user on the digital map in the asset
management platform, related PDF files with additional information on such asset
will be available in the same place for users from different departments to utilize.
Example of asset information represented from a database
PDF files (as a
non geospatial
product)

75
3.2.3.4.4 Vendor Recommendations for Future State
Broad use of geospatial products based on aerial data can provide SDG&E with objective and
reliable information related to governed infrastructure. Below are recommendations that will
enable streamlined daily operations and crucial business processes connected with asset
inventory and maintenance:
Adopt aerial data lifecycle governance framework.
o Adopting the framework can:
reduce duplicates among documentation and databases related to the same
asset,
fill the gaps in the system related to certain assets or areas of interest,
enhance work orders for maintenance purposes with actual images of
particular devices to be replaced or inspected manually, and
support asset history with objective aerial data evidence to track faults and
outages for service restoration and reporting purposes, which ultimately
increases overall energy network reliability and responsiveness of
maintenance teams.
o Elevated level of internal situational awareness can drive improved Key
Performance Indicators, savings (e.g., prevention of costly breakdowns) and
translate into higher customer satisfaction.
Adopt Vendor D Tool.
o In order to streamline internal processes connected with asset management and
governance over critical energy infrastructure, SDG&E needs a technically robust
and universal platform to effectively fulfill their daily tasks.
o Vendor D Tool integrates functionalities tailored to requirements of a given
industry or developed in collaboration with a particular client – In SDG&E’s case,
it can analyze and present 3D point clouds from LiDAR or photogrammetric
images.
3.2.3.5 Comparison of vendor results
All vendors demonstrated the ability to ingest UAS data including RGB imagery and LiDAR and
display them in their individual platforms for user visualization and inspection. Each vendor also
demonstrated the ability to ingest various types of metadata provided by SDG&E stakeholders
and then catalog those assets and tie them to related imagery and LiDAR for user analysis.
3.2.4 System Setup and Integration with PLS-CADD and GIS
This section describes in detail the results for the request to provide a plan for integration with
PLS-CADD and GIS. The remainder of this section will discuss the approach, results,
recommendations for a future state presented by each vendor and a comparison of vendor results.

76
3.2.4.1 Vendor A Results
3.2.4.1.1 Approach
For this POC Vendor A approach was to ingest PLS-CADD and GIS data types from the
baseline data set to a potential IDMP structure and show how it would integrate with the Vendor
A Tool and user interface platforms like GIS and PLS-CADD.
3.2.4.1.2 Results
3.2.4.1.2.1 GIS Integration
Vendor A was successful in demonstrating POC that GIS data sets could be ingested to a IDMP
and loaded to the Vendor A Tool for cataloging, visualization and analysis. Although there was
not an attempt to integrate with SDG&E GIS, the vendor ensured the ability to provide live
updates import/export with Esri GIS databases as needed in a future state.
3.2.4.1.2.2 PLS-CADD Integration
Vendor A did not have the ability at the time of this report to fully integrate with PLS-CADD.
The POC covered the LiDAR data file ingestion process, mostly as it related to feature code
extraction for the purposes of vegetation encroachment analysis. LiDAR data was presented in
the Vendor A Tool to show that LiDAR and DXF data could be readily viewed and queried in
their platform but it could not currently ingest and disseminate those files from the PLS-CADD
model. Vendor A proposed the standard process for PLS-CADD data ingestion below:
3.2.4.2 Vendor B Results
3.2.4.2.1 Approach
Vendor B did not perform this task but made recommendations as stated in Section 3.2.4.2.4
below.
3.2.4.2.2 Vendor Recommendations for Future State
3.2.4.2.2.1 GIS Integration
GIS represents one of the key operational systems that must interact with the asset management
system. Primary interactions between asset management system and GIS could include:
Supporting mission planning by accessing the GIS data representing the distribution
infrastructure to create/update flight plans.
Automatically tagging assets on ingest with GIS information such as asset IDs and other
basic metadata (similar to the workflow demonstrated in the data management test case
except deriving the information directly from GIS).
Inserting hyperlinks to specific images of assets in the GIS data records, allowing
seamless access to current and historical images of assets from within the GIS. The
platform facilitates downloading the asset data, that can be used in GIS, as the formats
are OGC compatible and universally consumed by all geospatial applications.
Creating workflows to update GIS assets with information derived from analytics.
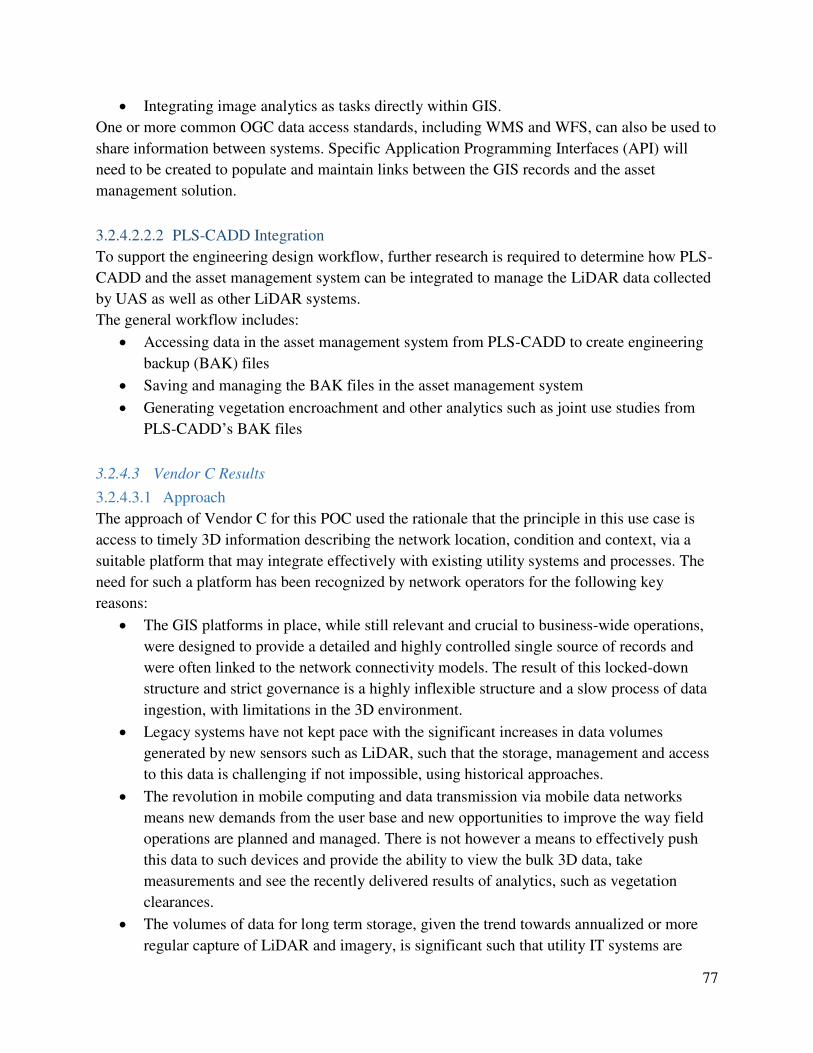
77
Integrating image analytics as tasks directly within GIS.
One or more common OGC data access standards, including WMS and WFS, can also be used to
share information between systems. Specific Application Programming Interfaces (API) will
need to be created to populate and maintain links between the GIS records and the asset
management solution.
3.2.4.2.2.2 PLS-CADD Integration
To support the engineering design workflow, further research is required to determine how PLS-
CADD and the asset management system can be integrated to manage the LiDAR data collected
by UAS as well as other LiDAR systems.
The general workflow includes:
Accessing data in the asset management system from PLS-CADD to create engineering
backup (BAK) files
Saving and managing the BAK files in the asset management system
Generating vegetation encroachment and other analytics such as joint use studies from
PLS-CADD’s BAK files
3.2.4.3 Vendor C Results
3.2.4.3.1 Approach
The approach of Vendor C for this POC used the rationale that the principle in this use case is
access to timely 3D information describing the network location, condition and context, via a
suitable platform that may integrate effectively with existing utility systems and processes. The
need for such a platform has been recognized by network operators for the following key
reasons:
The GIS platforms in place, while still relevant and crucial to business-wide operations,
were designed to provide a detailed and highly controlled single source of records and
were often linked to the network connectivity models. The result of this locked-down
structure and strict governance is a highly inflexible structure and a slow process of data
ingestion, with limitations in the 3D environment.
Legacy systems have not kept pace with the significant increases in data volumes
generated by new sensors such as LiDAR, such that the storage, management and access
to this data is challenging if not impossible, using historical approaches.
The revolution in mobile computing and data transmission via mobile data networks
means new demands from the user base and new opportunities to improve the way field
operations are planned and managed. There is not however a means to effectively push
this data to such devices and provide the ability to view the bulk 3D data, take
measurements and see the recently delivered results of analytics, such as vegetation
clearances.
The volumes of data for long term storage, given the trend towards annualized or more
regular capture of LiDAR and imagery, is significant such that utility IT systems are

78
rapidly exceeded in capacity. This challenge is further exacerbated by the complexity in
managing the millions of files and thousands of terabytes of data that are generated by
utility line mapping programs.
3.2.4.3.1.1 Objectives and architecture
The objectives of this type of system are achieved by:
Using a cloud hosted solution – to enable hosting near to the customer (minimizing lag)
and in a rapidly scalable environment (generally this means Amazon Web Services,
Azure or Rackspace in the closest datacenter).
A focus on the web browser, such that the use of the system is intuitive and simple
without the need for complex installations
The implementation of high compression rates for data transfer, enabling a rich user
experience (i.e. sufficient detail without data loading lag) without the need to excessively
‘thin’ the data.
The use of open format databases to enable flexibility in connecting to other sources and
tailoring the outputs to each customer, particularly crucial to enable the use of existing
GIS information and other asset or process control databases.
3.2.4.3.2 Results
3.2.4.3.2.1 Generic system attributes
Based on user feedback, practical experience and the understanding of the network operator in
this case, the following are implemented to realize the objectives:
Inside the portal a 3D representation of the network is displayed, from terrain and base
imagery through to high resolution LiDAR and asset images. These can all be layered up
to provide a rich, detailed view of the as-built, as surveyed conductors, structures,
vegetation and condition.
The system is configured to use pre-optimized to allow fast loading, and reduced data
volumes to be distributed across the internet whilst maintain the visual quality required
for review and condition assessment in the portal. This method was chosen as opposed to
the alternative on the fly compression or distributing uncompressed data, as this leads to
reduced server load – meaning more users can access the data concurrently, and the
amount of data that needs to be handled at any given point, resulting in a smoother user
experience.
The system revolves around a central store that then feeds data into the web viewer, this
central store can provide feeds into other systems and vice versa. In a future state the
platform will have 2D data layers can be fed into other software like Esri ArcMap,
ArcGIS Online, QGIS, PLS-CADD as standard WFS / WMS feeds that are fully OGC
compliant. Currently only asset data layers (Imagery, metadata, and GIS shapefile) are
downloadable and can be used in other software like GIS etc.

79
Conversely, existing feeds can be fed into the system, allowing data to be integrated into
the system, bringing everything into one place, maximizing the amount of information
available to inform intelligent business decisions. Once again, this includes standard
WFS / WMS feeds and a range of tabular database connections.
Variable user demand (managing peaks) is implemented by the use of a horizontal
scaling approach, using automated scripts to initiate new instances and access additional
computation to ensure performance does not become limited.
The vendor also brought up an ability of the platform to create new shapefiles from
analytics that can be imported into GIS. This feature was not demonstrated.
3.2.4.3.2.2 Data input requirements
The system, based on its intended purpose, is designed to be the overarching platform that
collates, organizes and streams a large variety of datasets to end users within utilities. It is
designed to work with a multitude of data formats that get converted into standard stream
friendly formats for distribution across the internet. However, when it comes to providing an
accurate and user-friendly 3D model of the powerline alongside the analytics results, experience
has led Vendor C to develop some specific requirements. This includes but is not limited to the
import file formats, data thinning/filtering and the types of geometrics in spatial files. These may
not be specific to other industry systems however the principles are likely to be similar.
The common datasets to make a 3D Powerline model for ingestion to the system, and similar
systems, are:
Orthoimagery – georeferenced and mosaicked orthometric photos.
Digital Terrain Model (DTM) – Generated from a classified LiDAR point cloud.
Digital Surface Model (DSM) – Generated from a classified LiDAR point cloud.
LiDAR point clouds – collected from an appropriate aerial or ground-based platform and
filtered via point classification.
Vector features (Wires, Towers, Poles, Cables, Transformers, Disconnectors etc.) – as
generated from a PLS-CADD or other CAD format model, according to the analysis
parameters required by the project aims (i.e. thermal rating, vegetation).
Infringement Information – including but not limited to LiDAR points representing
ground, vegetation and building infringements according to statutory distances.
Each of these datasets have a variety of options for import, depending on capture methods and
the formats that have been used to store the data. For pre-processing, we recommend utilizing
Tag Image File Format (TIFF) files for the Orthos, DTM and DSM. The TIFF format allows
additional geospatial information to be captured within the file, meaning there are no additional
reference files.
LAS data is stripped of most of its “meta” data when loaded into the system for streaming, inside
LAS files there is a large number of additional attributes that are unnecessary for visualization

80
purposes, so this is removed. Attributes like scan angle, GPS Time, Flight line, Scanner
specification can all be removed from the points before streaming. Instead the only information
remaining is the XYZ position of the point, and the RGB value it should be displayed as. For
ingestion into the system LAS 1.2 Point Type 3 is preferred, as this includes the RGB values
enabling easy extraction and conversion. Other LAS specifications are accepted and can be
included within the platform; however these require an additional processing step.
For vector features, a wide range of inputs can be used; it is recommended to use Esri Shapefile
or SQLite/Spatialite as this ensures a trouble-free import into the database. Vector features are
stored inside a PostgreSQL/PostGIS database which enables fast queries, and the ability to store
vast amounts of attribution, while giving us the flexibility of a database for searching, reviewing
and updating all within a geospatial aware environment. The tables within the database are then
streamed into the platform via WFS, which also provides the flexibility to utilize the WFS feeds
within other packages, ArcGIS, QGIS and PLS-CADD.
Vegetation infringement information is extracted from PLS-CADD models or from external
analytics comparing the distances between conductor and vegetation. These calculations can then
be displayed visually within the system, and styled appropriately to provide additional contextual
information. It is important to note that there is a deliberate separation between the analytics and
the display of results: the computational requirements, interfaces and software needs are
sufficiently different that tailored analytics for multiple projects are best done separately and fed
into the generic platform.
3.2.4.3.3 Vendor Recommendations for Future State
The online platform is designed to meet a range of utility objectives and the software effort is
driven by the direct requirements of existing and potential commercial users. In this context,
being a publicly available document and with the content being generically applicable, it would
not be appropriate to share a detailed software roadmap. However, the following are objectives
in the short to medium term:
Enabling the utility user to search among the large number of asset and GIS fields
available, to ensure rapid and effective navigation across large continuous datasets – via
typed search, data sorting and user type profiling.
More closely integrating the sources of spatial data and imagery with the network GIS
and asset data, via loose linkages/integrations – to facilitate a seamless view across
disparate sources of information.
Align the display, configuration and user interactions more closely with the different use
cases, particularly vegetation management and asset management.
Further improving performance as relates to supported devices, operating systems and the
speed of access on less robust data connections.
Longer term:
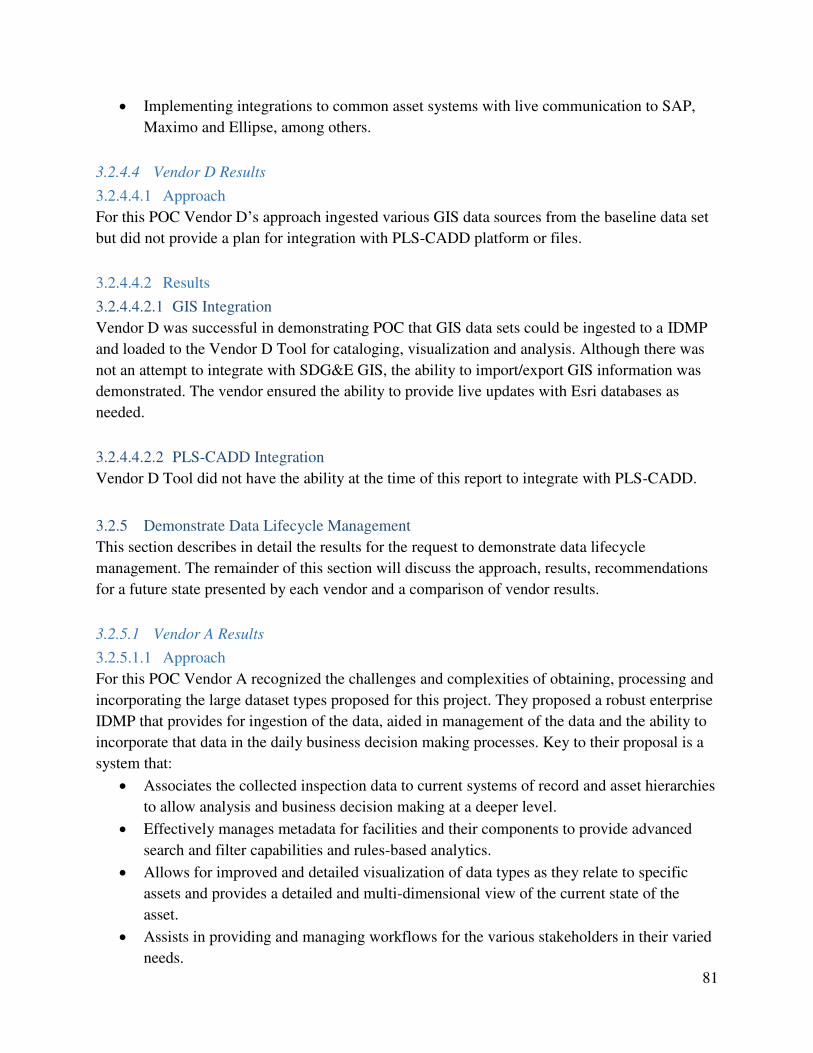
81
Implementing integrations to common asset systems with live communication to SAP,
Maximo and Ellipse, among others.
3.2.4.4 Vendor D Results
3.2.4.4.1 Approach
For this POC Vendor D’s approach ingested various GIS data sources from the baseline data set
but did not provide a plan for integration with PLS-CADD platform or files.
3.2.4.4.2 Results
3.2.4.4.2.1 GIS Integration
Vendor D was successful in demonstrating POC that GIS data sets could be ingested to a IDMP
and loaded to the Vendor D Tool for cataloging, visualization and analysis. Although there was
not an attempt to integrate with SDG&E GIS, the ability to import/export GIS information was
demonstrated. The vendor ensured the ability to provide live updates with Esri databases as
needed.
3.2.4.4.2.2 PLS-CADD Integration
Vendor D Tool did not have the ability at the time of this report to integrate with PLS-CADD.
3.2.5 Demonstrate Data Lifecycle Management
This section describes in detail the results for the request to demonstrate data lifecycle
management. The remainder of this section will discuss the approach, results, recommendations
for a future state presented by each vendor and a comparison of vendor results.
3.2.5.1 Vendor A Results
3.2.5.1.1 Approach
For this POC Vendor A recognized the challenges and complexities of obtaining, processing and
incorporating the large dataset types proposed for this project. They proposed a robust enterprise
IDMP that provides for ingestion of the data, aided in management of the data and the ability to
incorporate that data in the daily business decision making processes. Key to their proposal is a
system that:
Associates the collected inspection data to current systems of record and asset hierarchies
to allow analysis and business decision making at a deeper level.
Effectively manages metadata for facilities and their components to provide advanced
search and filter capabilities and rules-based analytics.
Allows for improved and detailed visualization of data types as they relate to specific
assets and provides a detailed and multi-dimensional view of the current state of the
asset.
Assists in providing and managing workflows for the various stakeholders in their varied
needs.
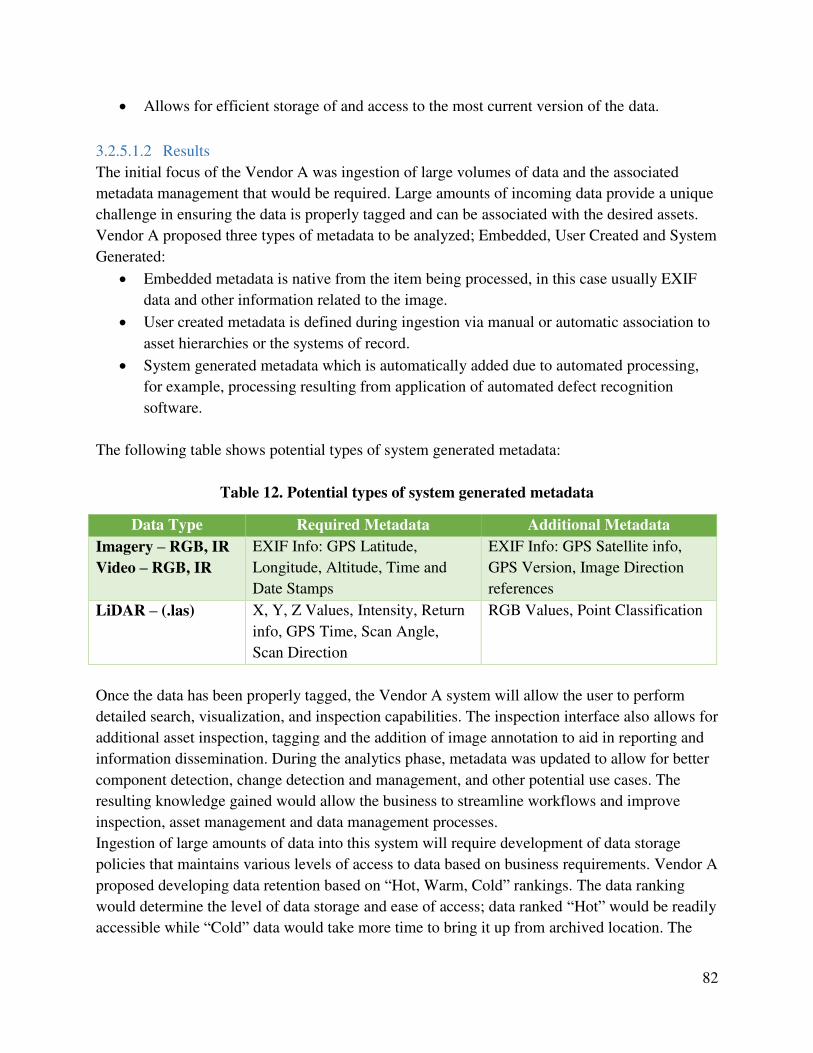
82
Allows for efficient storage of and access to the most current version of the data.
3.2.5.1.2 Results
The initial focus of the Vendor A was ingestion of large volumes of data and the associated
metadata management that would be required. Large amounts of incoming data provide a unique
challenge in ensuring the data is properly tagged and can be associated with the desired assets.
Vendor A proposed three types of metadata to be analyzed; Embedded, User Created and System
Generated:
Embedded metadata is native from the item being processed, in this case usually EXIF
data and other information related to the image.
User created metadata is defined during ingestion via manual or automatic association to
asset hierarchies or the systems of record.
System generated metadata which is automatically added due to automated processing,
for example, processing resulting from application of automated defect recognition
software.
The following table shows potential types of system generated metadata:
Table 12. Potential types of system generated metadata
Data Type Required Metadata Additional Metadata
Imagery – RGB, IR
Video – RGB, IR
EXIF Info: GPS Latitude,
Longitude, Altitude, Time and
Date Stamps
EXIF Info: GPS Satellite info,
GPS Version, Image Direction
references
LiDAR – (.las) X, Y, Z Values, Intensity, Return
info, GPS Time, Scan Angle,
Scan Direction
RGB Values, Point Classification
Once the data has been properly tagged, the Vendor A system will allow the user to perform
detailed search, visualization, and inspection capabilities. The inspection interface also allows for
additional asset inspection, tagging and the addition of image annotation to aid in reporting and
information dissemination. During the analytics phase, metadata was updated to allow for better
component detection, change detection and management, and other potential use cases. The
resulting knowledge gained would allow the business to streamline workflows and improve
inspection, asset management and data management processes.
Ingestion of large amounts of data into this system will require development of data storage
policies that maintains various levels of access to data based on business requirements. Vendor A
proposed developing data retention based on “Hot, Warm, Cold” rankings. The data ranking
would determine the level of data storage and ease of access; data ranked “Hot” would be readily
accessible while “Cold” data would take more time to bring it up from archived location. The

83
following workflow image outlines how the data collection and retention workflow might look
based on collection and data retention rules.
Vendor A proposed the following “typical user” workflow:
User logs in to enterprise system and performs a query on a system asset.
Vendor A Tool queries its database and associated other databases. This query is internal
to the could-based platform.
Query results returned to User.
If new, unprocessed data is available, import of that data is commenced.
Initial system-added metadata is created for the contents.
Data approval workflow is run, in which data is ingested, tagged with additional available
metadata and, upon approval by reviewing parties, is released for use by end users.
System continues to perform analytics to process data, identify features, defects, etc.
Image analytics are run to determine if additional GIS data/assets can be cross referenced.
User is presented with the results of the analysis.
User then reviews any alerts or notifications generated via analysis.
If necessary, system will launch additional applications for user(s) to process and update
relevant files.
If available, historical imagery is related to new imagery to add to the temporal data
repository.
User performs any necessary updates to as-designed or as-built files. Approval process is
launched for revisions.
In summary, Vendor A proposed a browser based platform that allows users to process and
review new and previously processed imagery and LiDAR products; this system is linked in
various ways back to PLS-CADD and GIS data and systems internal to SDG&E. Machine deep
learning and analytics would be performed in the cloud-based Vendor A Tool, providing
enhanced workflows and long-term data management solutions necessary to be able to
effectively distribute and use such a large amount of imagery and LiDAR data. Better storage,
access and analysis of such a data collection will allow the business stakeholders to make better
and timelier decisions on time critical business processes, resulting in improved service to the
customers and a safer and more cost-effective operation.
3.2.5.2 Vendor B Results
3.2.5.2.1 Approach
The approach of Vendor B for this POC recommended using the Vendor B’s scalable web-based
UAS data management platform, upload imagery from the field and transform the data into
information that enables users across the organization to quickly locate areas of concern, assess
the situation, and make informed decisions.

84
3.2.5.2.2 Results
3.2.5.2.2.1 Ingesting and Cataloging Data
There are several methods available to ingest UAS data into the Vendor B IDMP, ranging from
uploading files to consuming the output of a streaming service, which is most often used with
Full Motion Video (FMV). With the emphasis of this POC focused on still imagery, two
common ingest approaches were used - manually uploading data and using an automated process
for an entire data collection.
1. In order to upload a file or set of files, the user must have the appropriate permissions
which are managed and authenticated through the data management platform. Using any
device that has a web browser, users can select a file and upload it to the system. The user
will be prompted to enter details about the asset such as a description, expiration criteria,
collection details, or any keyword tags they will be used to associate similar data. If the
imagery’s metadata contains date, time, latitude, longitude, altitude, etc., this information
will be automatically catalogued upon ingest as well.
2. Using an http-based RESTful interface, an automated process can be used to ingest and
associate related imagery. For example, in this POC a process was developed that
determined each image’s GPS coordinates and compared its location to a Keyhole
Markup Language (KML) file of pole locations ingested from the GIS. Using these
locations, the process identified the pole closest to the image’s location, allowing the
ingest process to automatically determine and assign a tag to the imagery metadata with
the pole id for each image. As a result, users can easily query by pole ID to easily locate
all related imagery. See figure below.

85
Figure 41. Example of File Attachment Screen
3.2.5.2.2.2 Discovering and Disseminating Data
As utilities capture and consume mass amounts of data, one of the keys to any system is the
ability for users to locate data quickly. With Vendor B’s UAS data management platform there
are several options that can be used to locate assets. They range from entering specific
coordinates, drawing a geo-bounding box on a map, or filtering on keywords, platform types,
tags, metadata, date and time, or asset types. Additionally, users can either search for specific
values or utilize wildcard searches to locate their assets.
Results are presented back to the user grouped by time/start time and ordered with the newest
assets first.
A variety of actions can then be performed such as:
• Opening image(s) in image viewer
• Adding assets to a library or workbook
• Executing analytics
• Generating a Google Earth KML file that contains all selected assets
• Downloading the assets to a local machine

86
3.2.5.2.2.3 Archiving and Deleting Data
Data is automatically archived as part of the ingest process. If the images are processed, the
original image is preserved and archived.
To aid in data management there are several techniques for archiving and deleting assets within
the UAS data management platform. Three examples of how data can be removed from the
system include:
1. Assets can be manually purged by users with System Administrator privileges.
2. An expiration timeframe can be assigned to the asset. For example, if a company policy
is to remove data from the system once it reaches an age of five years, an expiration
timeframe of 5*365 = 1825 days can be assigned to the asset. Once that expiration period
has been met the asset is automatically deleted from the system.
3. The system can be configured to monitor disk space so that when a predetermined
threshold of available disk space is reached, the oldest files are automatically removed.
System administrators can manage what assets should be considered for deletion, which
ones should not be removed, as well as how many days an asset should be retained before
it is eligible for deletion.
In the event a delete activity fails, administrators have access to logs that identify the affected
files and are provided the ability to flag them for deletion or save and archive the assets.
3.2.5.2.3 Additional Features Demonstrated
3.2.5.2.3.1 Managing Users and Permissions
User access to the UAS data management platform can be managed several ways. User accounts
and groups can be configured to use an internal or external Authentication Server or Microsoft
Active Directory (using Lightweight Directory Access Protocol (LDAP) queries).
System administrators can also control what specific users can do within the system by setting up
Role Based Access Controls (RBAC). RBAC provides administrators with the ability to create
roles, assign groups of users within that role, and define access privileges. This process allows
administrators to control what types of actions groups of users can take within the system (e.g.,
restrict one group of users to viewing data while allowing others the ability to read and write data
to the system). Figure 42 shows the users role based on access control.
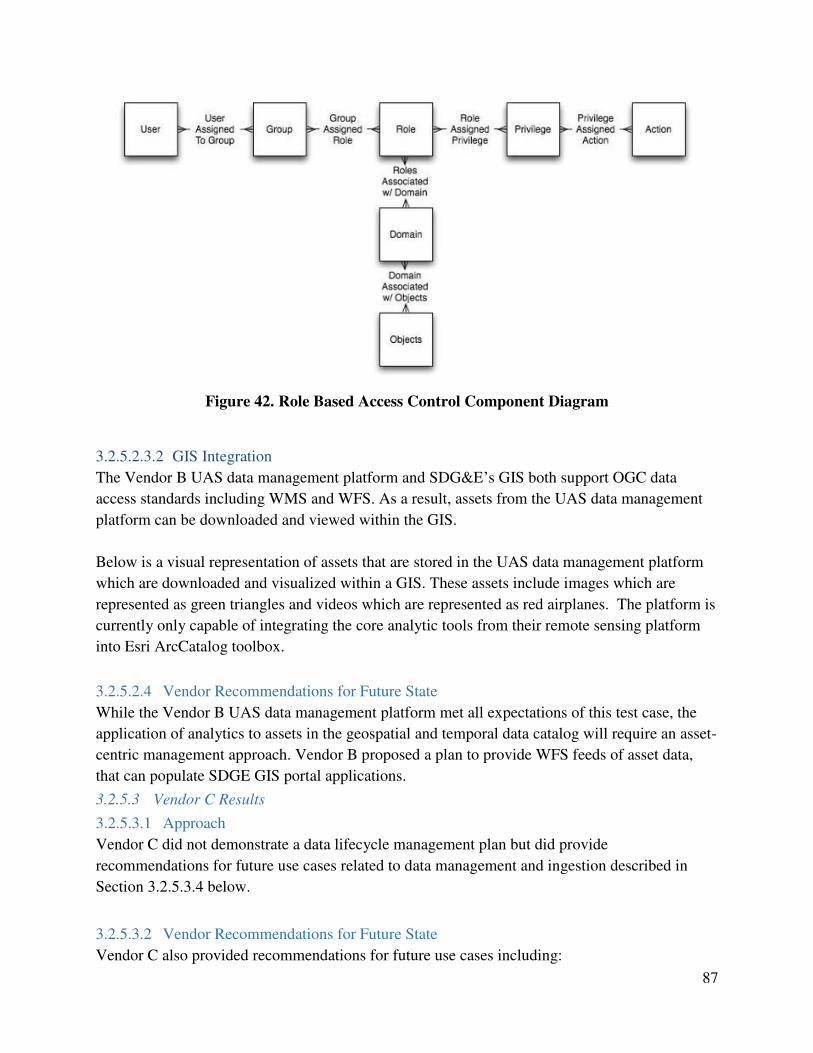
87
Figure 42. Role Based Access Control Component Diagram
3.2.5.2.3.2 GIS Integration
The Vendor B UAS data management platform and SDG&E’s GIS both support OGC data
access standards including WMS and WFS. As a result, assets from the UAS data management
platform can be downloaded and viewed within the GIS.
Below is a visual representation of assets that are stored in the UAS data management platform
which are downloaded and visualized within a GIS. These assets include images which are
represented as green triangles and videos which are represented as red airplanes. The platform is
currently only capable of integrating the core analytic tools from their remote sensing platform
into Esri ArcCatalog toolbox.
3.2.5.2.4 Vendor Recommendations for Future State
While the Vendor B UAS data management platform met all expectations of this test case, the
application of analytics to assets in the geospatial and temporal data catalog will require an asset-
centric management approach. Vendor B proposed a plan to provide WFS feeds of asset data,
that can populate SDGE GIS portal applications.
3.2.5.3 Vendor C Results
3.2.5.3.1 Approach
Vendor C did not demonstrate a data lifecycle management plan but did provide
recommendations for future use cases related to data management and ingestion described in
Section 3.2.5.3.4 below.
3.2.5.3.2 Vendor Recommendations for Future State
Vendor C also provided recommendations for future use cases including:

88
3.2.5.3.2.1 Enterprise data management
The project in this instance looked at a snapshot in time on a portion of the network. It is the
experience of Vendor C that:
Much data is collected each year by different groups within the utility.
This data may not be easily accessible (or in some cases, not widely known that the data
exists).
The data is increasingly becoming unwieldy and difficult to manage due to file sizes and
a range of standards and formats.
There is willingness to do things like machine learning or change detection, but the ‘data
management infrastructure’ has not been designed with this in mind.
Assuming these challenges may be overcome, there is much potential to be found in exploiting
and making available a wider set of data to the organization and analytics partners in order to
facilitate:
The detection of topographical and asset changes based on geospatial datasets such as
imagery and LiDAR (understanding what is happening around the assets and the Right-
of-Way (RoW)).
The creation of large multi-year training datasets for a range of machine learning
applications, by making available the results of raw data, analysis and models to enable
training processes to be completed in an automated fashion.
The ability to start understanding asset degradation and change via the images of those
assets, as far back as is needed.
The ability to go back in time to understand a situation in a given location in cases of
liability or understanding early asset failure.
This may be facilitated by designing a 3-tiered data management and access infrastructure, which
considers:
1. Raw/bulk data storage – with the input datasets being photos, aerial images, LiDAR,
meteorological observations, loading data and so on. This is structured around the
topology of the datasets and the networks to enable a logical organization and is managed
via automated tools.
2. An access portal to provide visibility to the data location and metadata – showing what is
in the store, when and how it was collected and providing direct access. An example of
this platform is the Trimble data marketplace, a general toolset based on cloud
infrastructure. In particular, this tier is the enabling software toolset that extracts data for
analytics process and for the final tier.
3. An access portal for the ‘latest cut’ of the data, enabling an understanding of the sort of
data that does exist and automatically provisioning the most up to date information for
the wider user base. A 3D platform, this might also provide a user interface for Tier 2,
enabling a more seamless user experience.

89
This case, which is about enabling infrastructure for some of the more in-depth analysis and
applications, is something that could be explored via processes such as detailed data audits, data
standards harmonization and test and development of platforms supporting each of the three
tiers.
3.2.5.4 Vendor D Results
3.2.5.4.1 Approach
The approach of Vendor D for this POC suggested that in order to manage the various types of
gathered aerial data and geospatial products in an efficient manner within the structure of a large
organization, it is essential to establish appropriate aerial data governance principles by
providing a clear foundation and guidelines. Establishing a framework of data governance starts
with defining the concept of data governance.
Data governance is the practice of defining the standard processes an organization will leverage
to manage gathered aerial data in support of its operations in an efficient and organized manner.
A thorough and effective data governance and lifecycle management strategy addresses
regulatory requirements, enables business continuity, and enables collection of necessary data by
stakeholder in a timely, cost effective manner.
Exercising aerial data governance across the organization is critical for long-term success,
sustainability, and execution of the organization’s mission. Such transformation requires a strong
foundation in each identified component of aerial data governance.
Successful facilitation of aerial data governance requires a cross-section of people, data and
technology. All three elements play a crucial role in enabling effective usage of aerial data across
the organization.
3.2.5.4.2 Results
Once the data governance policy has been defined and put into place, Vendor D sets out what
they feel are necessary pieces in the data lifecycle management process. The following outlines
the steps they see in this process, their evaluation of the current state of the process at SDG&E,
and any recommendations they see that would help improve the overall process:
Tasking – Defining the requirements for the type of data to be collected and employing
either internal or external assets as necessary to facilitate the data collection.
Currently Vendor D feels SDG&E has limited standards and documentation on collection
and dissemination of aerial data. The following steps are recommended for improvement
of standards on handling data:
o Development of guidelines based on data and operational needs
o Establishing a list of use cases across all departments and stakeholders.
Collecting – Imagery, video, or LiDAR is captured using the appropriate system and
delivered for processing to be applied to the user’s use case.

90
Currently SDG&E possesses a good set of risk and safety policies regarding aerial data
collection, whether by internal company assets or external vendors.
Recommendations –
o Development of an SOP defining when to use internal or external collection
resources based on cost-benefit.
o Develop SOP defining technology requirements for data collection.
Processing – Conversion of the raw data into usable data products and stored in
accordance with the data governance policies in place.
SDG&E has limited capabilities for processing data products in-house.
Recommendations –
o Develop SOP that details the cost-benefit analysis for in-house versus external
processing and includes specifications for processing data, either internally or
externally.
Exploiting – Performing analysis and extraction of value-added and relevant information
required to support the use case in question or the key stakeholders in their daily work.
SDG&E currently uses PLS-CADD and Esri GIS software to display and analyze GIS,
CAD and collected aerial imagery products.
Recommendations –
o Development of web-based tools and analytics that will assist in processing
collected data for use in defined business cases.
o Development of an SOP for data analysis.
Disseminating – Ensure the data, analysis and results are shared among the stakeholders
in support of the business decision making processes.
SDG&E currently uses ineffective measures to transfer and share collected aerial data
products, usually Electronic Data Transfer, File Transfer Protocol (FTP) or physical
devices (thumb drives or portable hard drives). While they possess security policies and
technological capabilities in terms of hardware and software that provides adequate
guidance, they lack the additional policies and storage media to effectively incorporate
regular use of aerial data products.
Recommendations –
o Document current policies for working with aerial data.
o Develop a centrally managed platform for ingestion, storage and analysis.
o Develop a storage and maintenance SOP
o Develop a data retention policy
Vendor D provides a robust and detailed analysis of the data governance needs and lifecycle
management requirements in order for SDG&E to take their collection and analysis of data to the
next level.

91
3.2.5.4.3 Vendor Recommendations for Future State
Transforming the aerial data governance from a reactive level to a governed level is a long-term,
continuous improvement effort that requires a transformation roadmap. The following steps are
recommended to build a strong foundation for successful data governance within SDG&E:
Aerial Data Governance Recommendations:
Establish a project management structure around data governance transformation.
o Define clear roles and provide strong backing and sponsoring from the executive
level.
o The steering committee should have a holistic view over the process.
o Data stewards should be established in order to effectively control aerial data
governance progress and usage across departments.
Identify and quantify the opportunities and benefits that aerial data bring to the
organization.
o Consider the savings it enables, especially compared to current processes.
These benefits must be regularly and repeatedly communicated to all stakeholders.
Develop aerial data governance strategy.
o Based on deep assessment of current maturity, the future state of aerial data
management capabilities must be established, and a long-term roadmap developed
and accepted.
Develop consistent data definitions, architecture, standards, policies and procedures.
o Rules and security levels for data usage must be established. All key users should
be trained and accountable for the data and metadata.
Establish metrics and reporting structure to control and gather feedback about the aerial
data usage, data needs and requirements across the organization.
o Milestones and thresholds should be identified in order to measure is the project
objectives has been met.
Aerial Data Lifecycle Recommendations:
Tasking Recommendations:
Identify appropriate organizational leadership to drive program standup.
o Leadership will maintain momentum and provide the business case for a
requirement driven approach that enhances core business activities and maintains
regulatory compliance (e.g., federal and state).
Define internal process for defining and routinely communicating UAS data collection
requirements from organizational leadership to operations groups.
o Supplement with appropriate governance and tools (e.g., PowerWorkz or
equivalent) to enable access to current taking and both downward and upward
sharing of leading practices and lessons learned.
Develop guidelines for defining data requirements per operation type.
o Data requirements will later inform the type of UAS and sensor needed.
Establish a list of all use cases of aerial data usage across all departments.

92
o Prioritize use cases according to technical feasibility (hardware and tools), as well
as cost-benefit analysis.
Collecting Recommendations:
Define and document collection process.
o Processes that meet leadership defined requirements.
Determine collection cadence.
o E.g., How often to fly UAS to meet both regulatory requirements and provide
preventative maintenance return on investment.
Perform cost-benefit analysis.
o Analysis on performing UAS collection using external sub-providers vs. standing
up wholly owned program capabilities
Define and document process for sending collected data from UAS to appropriate next
step user.
o Both who and how needs to be defined on both ends
o The collection and receiving teams needs to identify the people in charge of
sending receiving and on the method (i.e., physical passing of memory cards vs.
leveraging cloud based solutions such as Esri Drone2map, which is compatible
with current SDG&E GIS platforms)
Develop a procedure for conducting collection cost-benefit analysis based on defined
criteria to drive future decision making.
o Analysis will determine which type of operations require in-house or outsourced
data collection.
Develop procedures for defining and selecting technology requirements (e.g., what UAS
and sensor types create return on investment).
o Requirements will inform the type of UAS and sensor needed.
Processing Recommending:
Define and document process for proper processing.
o Validate that routine processing aligns with original requirements, that right data
type is being captured for inputs, and that outputs enable expected exploitation.
Identify necessary software solutions (e.g., machine learning).
o Assess whether these activities she be performed by sub-providers or internally.
Develop procedure for conducting processing cost-benefit analysis (i.e., what types return
value).
o Analysis will determine the most optimal way for processing depending on the
use case and resolution/accuracy requirements.
Develop procedure for processing data.
o Define and document the process for each type of data processing to be performed
(e.g., categorizing and cataloging images)

93
o Include guidelines on properly generating orthophotomaps, 3D point clouds,
Digital Terrain Models (DTM), Digital Surface Models (DSM), and list technical
requirements for final products.
Define and document for transferring processed data to end users.
o End users will receive properly transferred data.
Exploiting Recommendations:
Define the business activities to be supported by collected data.
o Include guidance on activities for all types of aerial data and guidelines for
properly utilizing all analysis tools to drive efficiencies.
Develop routine process to assess whether or not data is having desired impact.
o Process will promote enhancement of data as needed.
Disseminating Recommendations:
Document all current processes of working with aerial data.
o Documentation will enable design of new workflow with aerial data processes
embedded within.
Develop centrally managed platform to discover, gather, analyze, and store aerial data.
Setup appropriate access for key stakeholders.
o The architecture and functionalities must be designed together with key users.
o Provide easy access to all data linked to a certain geographic location so that all
stakeholders can easily find and retrieve all relevant information.
o Facilitate easy integration with other software solutions across the organization
via web services such as Web Map Service (WMS), Web Feature Service (WFS)
or Web Coverage Service (WCS), common spatial databases, or file systems.
o Allow integration with Deep Learning models.
o Design and choice of central data storage must be performed in parallel.
Develop procedure for data maintenance.
o If SDG&E chooses to use internal servers, the governing directives for its use
should contain detailed instructions for their own employees as well as third-party
vendors.
o If platform will be deployed on the cloud, the governing directives for its use
should only include information necessary for SDG&E employees to upload and
archive data on the cloud.
Develop data retention policy.
o Typically propose an average of 6-24 months.
o The above average duration of storing data on cloud or server to be between 6 to
24 months. However, period of time should be set during internal evaluation
process by analyzing employees needs as well as costs of storing data.
Perform stakeholder analysis.
o Analysis will identify key data needs and enable definition of supporting
processes.

94
4.0 Project Outcome
Key Findings 4.1
The tools evaluated in this project were demonstrated in use cases that would improve system
reliability, safety and potentially create operational cost savings. Remotely sensed UAS
technology when combined with geospatial analytics provides an effective tool for
accomplishing some of the key metrics defined in the EPIC guidelines. Vendors successfully
demonstrated the following POC analytics:
1. Avian Covers – The use case provided guidance on UAS imagery collection
procedure and resolution along with proving machine learning is a viable option to
identify and asses T&D electrical assets.
2. Vegetation Encroachment Identification – The use case provided guidance on UAS
collected LiDAR data and proved that vegetation and electrical facilities can be
measured and modeled with remotely sensed data.
3. Sage, cataloging and management of UAS data - The results of this use case included
providing a data management platform for the data collected, applying analytics to
answer specific questions, and delivering analytics results to end users.
4. Web-based asset management platform as detailed in this document will enable
organization-wide UAS data management which will allow users across the
organization to quickly and easily locate critical information to make informed
decisions.
The project learning involved understanding the use of advanced analytics on images collected
from UAS and other sources that could be used to automatically identify equipment of power
lines. The identification and cataloging of assets remotely presents an opportunity to SDG&E
and other utilities to undertake cost-effective remote inspections that would otherwise require
personnel in the field, driving up costs. It also ensures personnel safety during inspections which
could be compromised when inspections are done in treacherous terrains. Vegetation
encroachment identification presents an opportunity for SDG&E and other utilities to effectively
manage down power lines due to falling trees and effectively estimate the growth of trees in
relation to the power lines. Through this demonstration, the project team learned of the wide
array of use cases that could be developed to serve multiple stakeholder groups within utilities
that are ultimately responsible to provide safe and reliable power to their customers.
Recommendations and Next Steps 4.2
It is recommended that SDG&E pursue additional evaluation of UAS technology for stakeholder
groups within the company that will benefit from the aggregation of various sources of data into
a data management platform that also provides advanced analytical capabilities. The evaluation
should also focus on developing requirements for integration of this data management platform
into the SDG&E information technology environment. While the project successfully

95
demonstrated the value of advanced analytics using UAS data, additional evaluation is required
before operational deployment of the data management platform.
The project team recommends an IDMP architecture diagrammed in Appendix C. This
architecture diagram depicts one proposed Data Management Platform (DMP) structure that
would provide storage and access to stakeholder platform and data requirements. Other elements
to consider include:
Responsible, Accountable, Consulted, Informed (RACI) matrix for data governance
A project management structure should be created that focuses on data governance
transformation.
Identify and quantify the opportunities and benefits aerial data can bring to the business.
Develop a comprehensive data governance strategy.
Based on the governance and user needs, develop a set of standards, policies and
procedures and from that a system architecture capable of managing the data and policies.
Ensure that metrics are gathered that allow measurement of the program success and the
ability to change to meet future needs.
Data retention policy based on use case needs.
Develop UAS data collection standards that include image collection specifications for
all types of UAS data.
Diagram existing data management architecture and identify gaps and overlaps for all
stakeholders.
Develop use cases summaries and for all stakeholders.
Develop user workflows and platform requirements for interaction with vendor tool.
Develop cost benefit analysis comparing current and proposed processes along with UAS
data sources and newly developed collection requirements standards.
Develop a more accurate risk-based analysis for proactive vegetation management
including species, growth rate, health and conditions like weather and wind models.
Investigate vendor tool bandwidth and browser requirements for field and office end
users.
96
5.0 Technology Transfer Plan
SDG&E Technology Transfer Plan for Project Results 5.1
A primary benefit of the EPIC program is the technology and knowledge sharing that occurs
both internally within SDG&E and across the industry. To facilitate this knowledge sharing,
SDG&E will share the results of this project by widely announcing to industry stakeholders that
this report is available on the SDG&E EPIC website, by submitting papers to technical journals
and conferences, and by presentations in EPIC and other industry workshops and forums.
SDG&E will also conduct formal presentations of the results to internal stakeholders to
encourage adoption, as per the recommendations.
Adaptability to Other Utilities and Industry 5.2
As technology evolves utilities are poised to leverage UAS and other data collection
technologies to capture high resolution imagery. In some cases, these images have been stored in
silos in different business units within the organizations, used by individual stakeholders for their
own purposes. This EPIC project demonstrated the value of having a central repository (data
management platform) to store, catalog, and sort data that could be used by multiple stakeholders
concurrently. It also allows the stakeholders to perform deep learning analytics on the vast
amount of data to provide actionable results to important test cases ranging from auto
identification of equipment on poles to tracking vegetation encroachment on power lines. These
are just a few of the use cases that the data captured from UAS will enable stakeholders to
leverage. All these cases will enable the utilities to perform virtual asset inspection that enhances
safety and reliability of power system equipment.
97
6.0 Metrics and Value Proposition
Metrics 6.1
The project metrics used to evaluate and test UAS technology and vendor machine learning tools
and software as they related to three specific test cases are listed in Section 3.0 above. In
addition to the use cases covered earlier, the following describes additional metrics:
Habitat area disturbance reductions - UAS technologies allow for a remotely operate vehicle to
access sensitive habits without impacting the land through vehicular are personnel incursions.
The use cases demonstrated a process to capture and analyze electrical facilities, surrounding
vegetation and terrain features from an aerial drone. The UAS technology can reduce habitat
area disturbance by replacing some required physical inspections with UAS derived inspections.
Wildlife fatality reductions (electrocutions, collisions) - This report studied the feasibility of
combining UAS derived imagery with deep learning analytics to determine the location and
condition of avian covers on electrical facilities. The avian covers provide a level of protection
against electrocution for birds with large wing spans resting on electrical distribution and
transmission poles. Currently the avian covers are assessed by physical inspection taken from
ground observation on scheduled maintenance intervals. UAS data capture and associated deep
learning analytics could provide increase inspections, improved evaluation of the presence and
condition of avian covers resulting in reducing the risk to wildlife.
Utility work safety improvement and hazardous exposure reduction - This report studied several
uses case for utilizing UAS technology and machine learning analytics to remotely observe,
measure and catalog electrical facilities and surrounding terrain. The technology and process
remove utility workers from making physical inspection where in many cases required access
through hazardous terrain and complete inspections in close proximity to energized facilities and
equipment.
Value Proposition 6.2
The purpose of EPIC funding is to support investments in R&D projects that benefit the
electricity customers of SDG&E, PG&E, and SCE. The primary principles of EPIC are to invest
in technologies and approaches that provide benefits to electric ratepayers by promoting greater
reliability, lower costs, and increased safety. This EPIC project contributes to these primary and
secondary principles in the following ways:
Safety – The use of UAS technology enables remote asset management thereby helping
utility field crew with tools that promote their safety. During emergencies such as fire or
other natural disasters UAS technology can act as a first line of defense in monitoring and
tracking remotely, thereby ensuring safety of personnel and limiting harm to people and
property.
Reliability – Greater reliability of systems can be achieved with using UAS and other
data collected and running deep learning analytics on the data to identify issues before

98
they occur. It also helps various stakeholder groups (e.g vegetation, environmental and
other groups in utilities) to effectively plan asset management activities, thereby
improving reliability of service.
Efficient use of ratepayer monies – Asset inspection costs can be reduced using advanced
technology such as UAS that complements on field inspections by field crew. Crews can
be deployed more effectively and in a cost effective manner, thereby making efficient use
of ratepayer monies.

99
7.0 Appendices
Appendix A: Aviation Services Department UAS Workflow 7.1
Workflow depicting the current ASD process for collection of aerial sensor data.

100

101
Appendix B: Vendor-Stakeholder Use Case Matrix. 7.2
This matrix depicts the used cases identified by each stakeholder in Section 2.2 above which is
cross-referenced with the platforms existing capability to demonstrate the use case as part of this
pre-commercial demonstration.
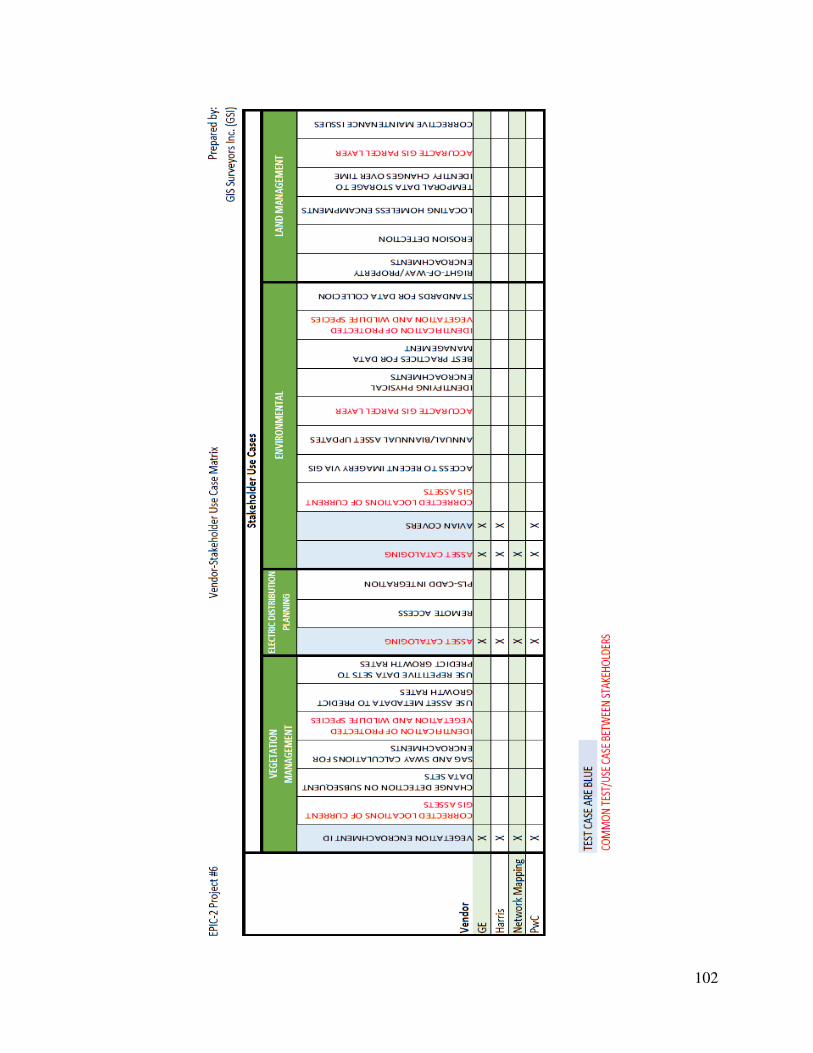
102

103
Appendix C: Proposed DMP 7.3
7.3.1 Proposed DMP Architecture Diagram
This architecture diagram depicts one proposed DMP structure that would provide storage and
access to stakeholder platform and data requirements.

104

105
7.3.2 Proposed DMP Architecture Diagram Reference Chart
This table identifies the potential data types, format criteria, sources and targets for many of the
data sets collected by the ASD group for various stakeholders.
Data
Flow
Reference
Number
Data Type(s) Data Criteria Source Target
1 RGB, LiDAR, IR,
UV, Video RGB - 20Mp, LiDAR +/- 50 mm, IR, UV,
Video HD mp4 UAV, Field Service PLM
2 SHP, LAS PLS-CADD Session PLM
3 SHP, LAS PLM PLS-CADD Session
4 PLM
5 Power Works Session
6 GPS GIS Session PLM, EAM
7 GPS PLM, EAM GIS Session
8 Word, Excel, PPT,
TXT .docx, .pptx, .xlsx, pdf Engineering Session PLM
9 TXT ASCII PLM Session 10 TXT ASCII PLM 11 TXT ASCII PLM Session
12 TXT, XLS, CSV ASCII Requirements Mgt.
Tool PLM
13 TXT, RGB, Video,
LiDAR RGB - 20Mp, LiDAR +/- 50 mm, IR, UV,
Video HD mp4, ASCII Session EAM
14 TXT, RGB RGB - 20Mp EAM Session
15 RGB, LiDAR, IR,
UV, Video RGB - 20Mp, LiDAR +/- 50 mm, IR, UV,
Video HD mp4 Session EAM
16 RGB, LiDAR, IR,
UV, Video RGB - 20Mp, LiDAR +/- 50 mm, IR, UV,
Video HD mp4 EAM Session
17 CR, BOM, CAPP PLM ERP
18 BOM, QR ERP PLM
19 BOM, Prod. Order ERP EAM
20 BOM, SN, QR, PS EAM ERP
21 BOM, CAPP PLM EAM
22 SN, BOM, NCR,
QR EAM PLM
23 GIS, SHP, TXT,
PW,* PLM APM System
24 BOM, RGB, PS EAM APM System
25 <<ALL>> APM System Display 26 SQL, TXT ASCII Input APM System 27 <<Result>> Display Printer
28 BOM, CAPP, Date ERP Printer