EPIC - Cape Townresource.capetown.gov.za/documentcentre/Documents/City...i Introduction This is the...
23
EPIC Economic Performance Indicators for Cape Town 2019: Quarter 1 (January - March)
Transcript of EPIC - Cape Townresource.capetown.gov.za/documentcentre/Documents/City...i Introduction This is the...
EPIC Economic Performance Indicators for Cape Town
2019: Quarter 1 (January - March)
i
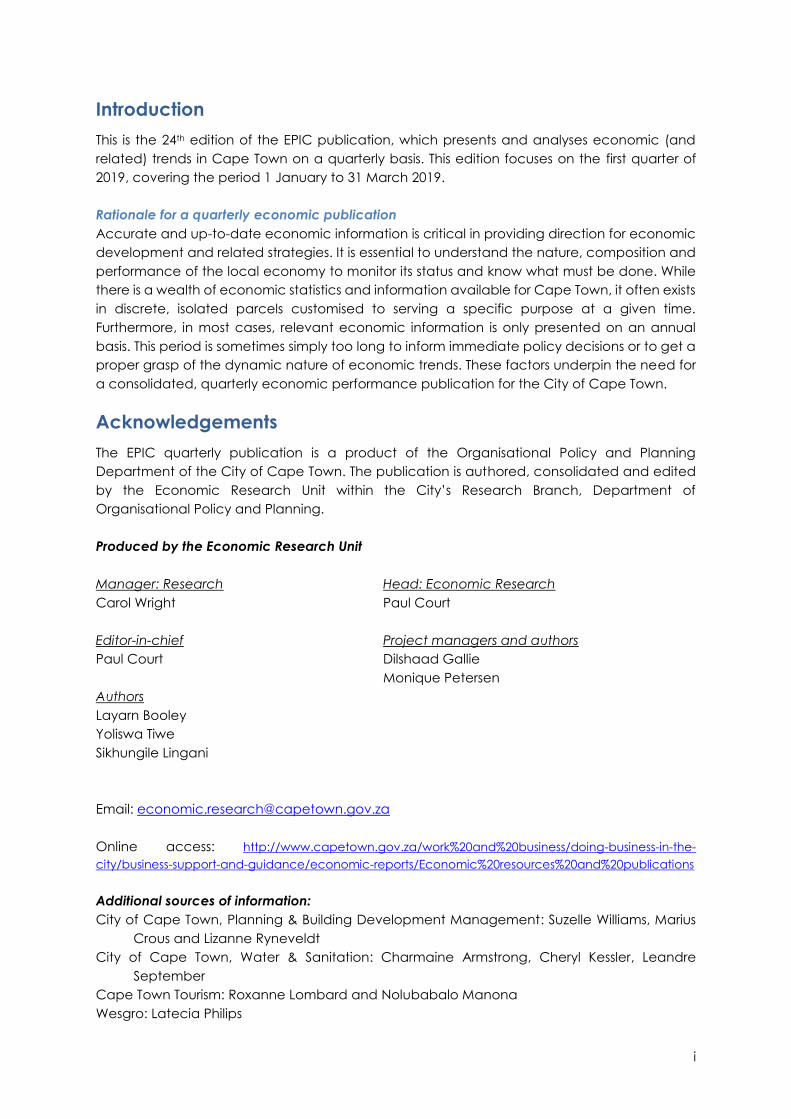
Introduction
This is the 24th edition of the EPIC publication, which presents and analyses economic (and
related) trends in Cape Town on a quarterly basis. This edition focuses on the first quarter of
2019, covering the period 1 January to 31 March 2019.
Rationale for a quarterly economic publication
Accurate and up-to-date economic information is critical in providing direction for economic
development and related strategies. It is essential to understand the nature, composition and
performance of the local economy to monitor its status and know what must be done. While
there is a wealth of economic statistics and information available for Cape Town, it often exists
in discrete, isolated parcels customised to serving a specific purpose at a given time.
Furthermore, in most cases, relevant economic information is only presented on an annual
basis. This period is sometimes simply too long to inform immediate policy decisions or to get a
proper grasp of the dynamic nature of economic trends. These factors underpin the need for
a consolidated, quarterly economic performance publication for the City of Cape Town.
Acknowledgements
The EPIC quarterly publication is a product of the Organisational Policy and Planning
Department of the City of Cape Town. The publication is authored, consolidated and edited
by the Economic Research Unit within the City’s Research Branch, Department of
Organisational Policy and Planning.
Produced by the Economic Research Unit
Manager: Research Head: Economic Research
Carol Wright Paul Court
Editor-in-chief Project managers and authors
Paul Court Dilshaad Gallie
Monique Petersen
Authors
Layarn Booley
Yoliswa Tiwe
Sikhungile Lingani
Email: [email protected]
Online access: http://www.capetown.gov.za/work%20and%20business/doing-business-in-the-
city/business-support-and-guidance/economic-reports/Economic%20resources%20and%20publications
Additional sources of information:
City of Cape Town, Planning & Building Development Management: Suzelle Williams, Marius
Crous and Lizanne Ryneveldt
City of Cape Town, Water & Sanitation: Charmaine Armstrong, Cheryl Kessler, Leandre
September
Cape Town Tourism: Roxanne Lombard and Nolubabalo Manona
Wesgro: Latecia Philips
ii
Contents
Introduction ................................................................................................................................................... i
Acknowledgements .................................................................................................................................... i
1. Economic Growth .............................................................................................................................. 3
a. Quarter-on-quarter GDP-R growth rate .................................................................................... 3
b. Sectoral drivers of economic growth in the Western Cape ................................................. 3
2. Inflation ................................................................................................................................................ 5
a. Inflation overview........................................................................................................................... 5
b. Geographical inflation ................................................................................................................. 6
3. Labour Market .................................................................................................................................... 7
a. Cape Town’s labour market performance .............................................................................. 7
b. Employment comparison of metros ........................................................................................... 8
c. Unemployment in Cape Town .................................................................................................... 9
d. Sector employment trends for Cape Town .............................................................................. 9
4. Infrastructure ..................................................................................................................................... 10
a. Container handling ..................................................................................................................... 10
b. Airport statistics ............................................................................................................................. 11
c. Water .............................................................................................................................................. 13
5. Tourism ................................................................................................................................................ 14
6. Additional Indicators ....................................................................................................................... 16
a. Building developments ............................................................................................................... 16
b. Commercial property developments ...................................................................................... 17
c. New vehicle sales ........................................................................................................................ 18
Reference List ............................................................................................................................................ 19
Abbreviations ............................................................................................................................................ 20
List of tables Table 1: Official (strict) versus expanded (broad) unemployment rates........................................................... 9
Table 2: Income derived from tourist accommodation, Quarter 1, 2018 versus Quarter 1, 2019 ............... 15
List of figures Figure 1: Real GGP growth for the Western Cape, Quarter 1, 2008 to Quarter 1, 2019 .................................. 3
Figure 2: Sectoral real GDP-R growth rates in the Western Cape, Quarter 1, 2019 ......................................... 4
Figure 3: CPI and PPI trends for South Africa, January 2013 to March 2019 ..................................................... 6
Figure 4: CPI inflation rate at a provincial level, January to March 2019 .......................................................... 6
Figure 5: Employment comparison with other metros, Quarter 4, 2018 versus Quarter 1, 2019 .................... 8
Figure 6: Quarterly and annual change in employment per sector for Cape Town, Quarter 1, 2019 ...... 10
Figure 7: Total containers handled, January 2015 to March 2019 .................................................................... 11
Figure 8: Total (monthly) passenger movements at South Africa’s major airports, Quarter 1, 2014 to
Quarter 1, 2019 ........................................................................................................................................................... 12
Figure 9: Daily average water production (7 day average) in Cape Town, January 2017 to March 2019
....................................................................................................................................................................................... 13
Figure 10: Potable water consumption by use category (2017/2018) ............................................................. 14
Figure 11: Total (monthly) visits to the top 5 tourist destinations of Cape Town, Quarter 1, 2013 to Quarter
1, 2019 .......................................................................................................................................................................... 15
Figure 12: Building plans submitted to the City of Cape Town, 2012-2019 ...................................................... 17
Figure 13: Office/banking space sector developments, Quarter 1, 2017 to Quarter 1, 2019 ...................... 18
1 EPIC | Economic Performance Indicators for Cape Town | 2019: Quarter 1
a, c. At constant 2010 prices. Source: Quantec, 2019.
b, d, i. At current prices. Source: IHS Markit, 2019.
e, f. Source: Statistics South Africa (StatsSA), 2019.
h. GGP at current prices. Source: IHS Markit, 2019.
g. Source: IHS Markit, 2019.
j. Source: Cape Town Tourism and Wesgro, 2019.
k. Cape Town, OR Tambo and King Shaka.
l. Source: ACSA, 2019.
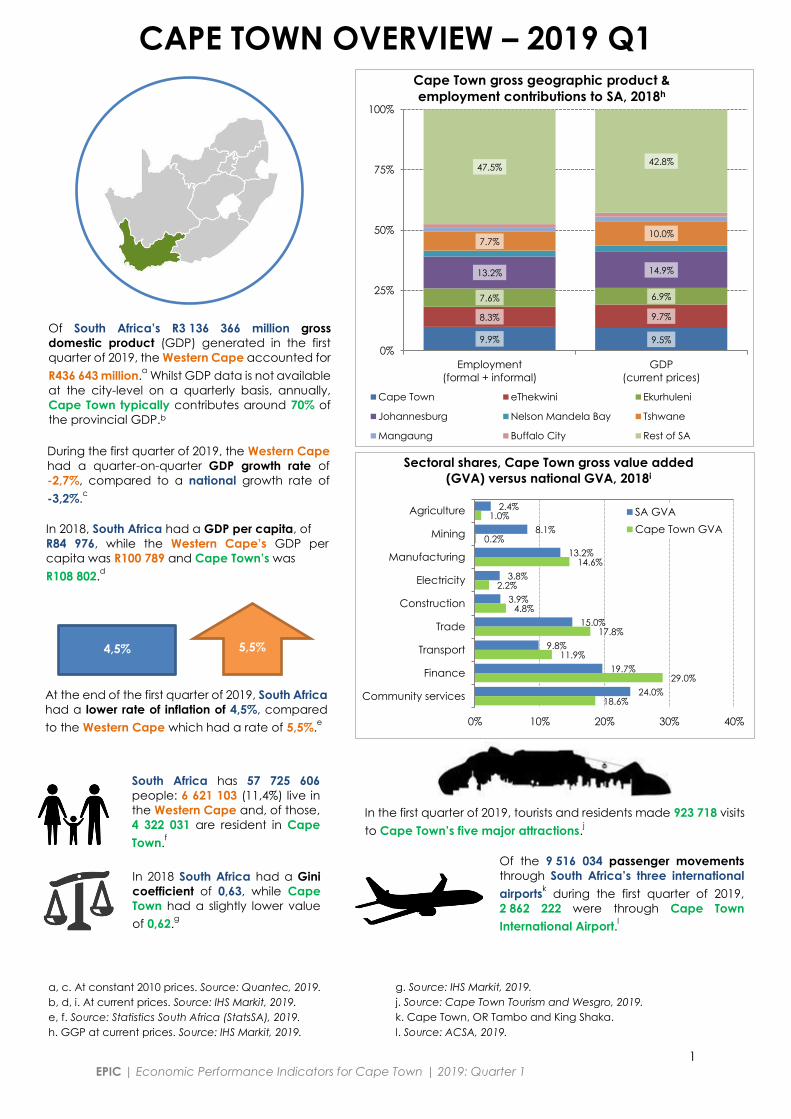
Of South Africa’s R3 136 366 million gross
domestic product (GDP) generated in the first
quarter of 2019, the Western Cape accounted for
R436 643 million.a Whilst GDP data is not available
at the city-level on a quarterly basis, annually,
Cape Town typically contributes around 70% of
the provincial GDP.b
During the first quarter of 2019, the Western Cape
had a quarter-on-quarter GDP growth rate of
-2,7%, compared to a national growth rate of
-3,2%.c
In 2018, South Africa had a GDP per capita, of
R84 976, while the Western Cape’s GDP per
capita was R100 789 and Cape Town’s was
R108 802.d
At the end of the first quarter of 2019, South Africa
had a lower rate of inflation of 4,5%, compared
to the Western Cape which had a rate of 5,5%.e
South Africa has 57 725 606
people: 6 621 103 (11,4%) live in
the Western Cape and, of those,
4 322 031 are resident in Cape
Town.f
In 2018 South Africa had a Gini
coefficient of 0,63, while Cape
Town had a slightly lower value
of 0,62.g
In the first quarter of 2019, tourists and residents made 923 718 visits
to Cape Town’s five major attractions.j
Of the 9 516 034 passenger movements
through South Africa’s three international
airportsk during the first quarter of 2019,
2 862 222 were through Cape Town
International Airport.l
5,5% 4,5%
CAPE TOWN OVERVIEW – 2019 Q1
2.4%
8.1%
13.2%
3.8%
3.9%
15.0%
9.8%
19.7%
24.0%
1.0%
0.2%
14.6%
2.2%
4.8%
17.8%
11.9%
29.0%
18.6%
0% 10% 20% 30% 40%
Agriculture
Mining
Manufacturing
Electricity
Construction
Trade
Transport
Finance
Community services
Sectoral shares, Cape Town gross value added
(GVA) versus national GVA, 2018i
SA GVA
Cape Town GVA
9.9% 9.5%
8.3% 9.7%
7.6% 6.9%
13.2% 14.9%
7.7%10.0%
47.5%42.8%
0%
25%
50%
75%
100%
Employment
(formal + informal)
GDP
(current prices)
Cape Town gross geographic product &
employment contributions to SA, 2018h
Cape Town eThekwini Ekurhuleni
Johannesburg Nelson Mandela Bay Tshwane
Mangaung Buffalo City Rest of SA

2 EPIC | Economic Performance Indicators for Cape Town | 2019: Quarter 1
2019 Quarter 1 South Africa Cape Town
Recorded Q-on-Q Y-on-Y Recorded Q-on-Q Y-on-Y
Nu
mb
er
(th
ou
san
ds,
‘00
0’s
)
Working-age population 38 283 149 605 2 940 14 555
Labour Force 22 492 -176 134 2 010 -16 -39
Employed: total 16 291 -238 -86 1 584 -13 -6
Employed: Formal sector 11 220 -126 -135 1 303 -18 16
Employed: Informal sector 2 933 -68 32 187 14 -2
Unemployed 6 201 62 220 426 -3 -33
Not economically active 15 791 325 470 930 30 95
Discouraged work-seekers 2 997 156 210 24 7 9
Other not economically active 12 793 169 260 906 23 85
Ra
te
(pe
rce
nta
ge
, %
)
Official/strict unemployment 27,6 0,5 0,9 21,2 – 0,0 -1,2
Broad/expanded Unemployment 38,0 1,0 1,3 23,4 0,3 -0,4
Absorption 42,6 -0,7 -0,9 53,9 -0,7 -1,2
Labour Force Participation 58,8 -0,6 -0,5 68,4 -0,8 -2,6
increase decrease improvement deterioration – No change (due to rounding)
LABOUR OVERVIEW – 2019 Q1
The Working-Age
Population is all persons
aged 15-64 years old.
The Strictly Unemployed
includes only people
who are actively
seeking work (i.e.
‘searching
unemployed’). The Labour Force comprises
all persons who are
employed plus
unemployed.
A ‘discouraged job seeker’ is a person who was not employed during the
reference period, was available, but did not take active steps to find work
during the last 4 weeks.
The Broadly
Unemployed includes
the ‘searching
unemployed’ as well as
‘discouraged’ and
‘other non-searching’
job seekers.
Source: Statistics South Africa, Quarterly Labour Force Survey, 2019 Quarter 1, May 2019.
Note:
- A ‘quarter-on-quarter’ comparison is between the current quarter and the previous quarter (for example: Quarter 1, 2019 versus Quarter
4, 2018).
- A ‘year-on-year’ comparison is between the same quarters in two consecutive years (for example: Quarter1, 2019 versus Quarter1, 2018).
The Employed are those
who, during a reference
week, did any work for at
least 1 hour or had a job or
business (even if
temporarily absent).
3 EPIC | Economic Performance Indicators for Cape Town | 2019: Quarter 1
1. Economic Growth
a. Quarter-on-quarter GDP-R growth rate
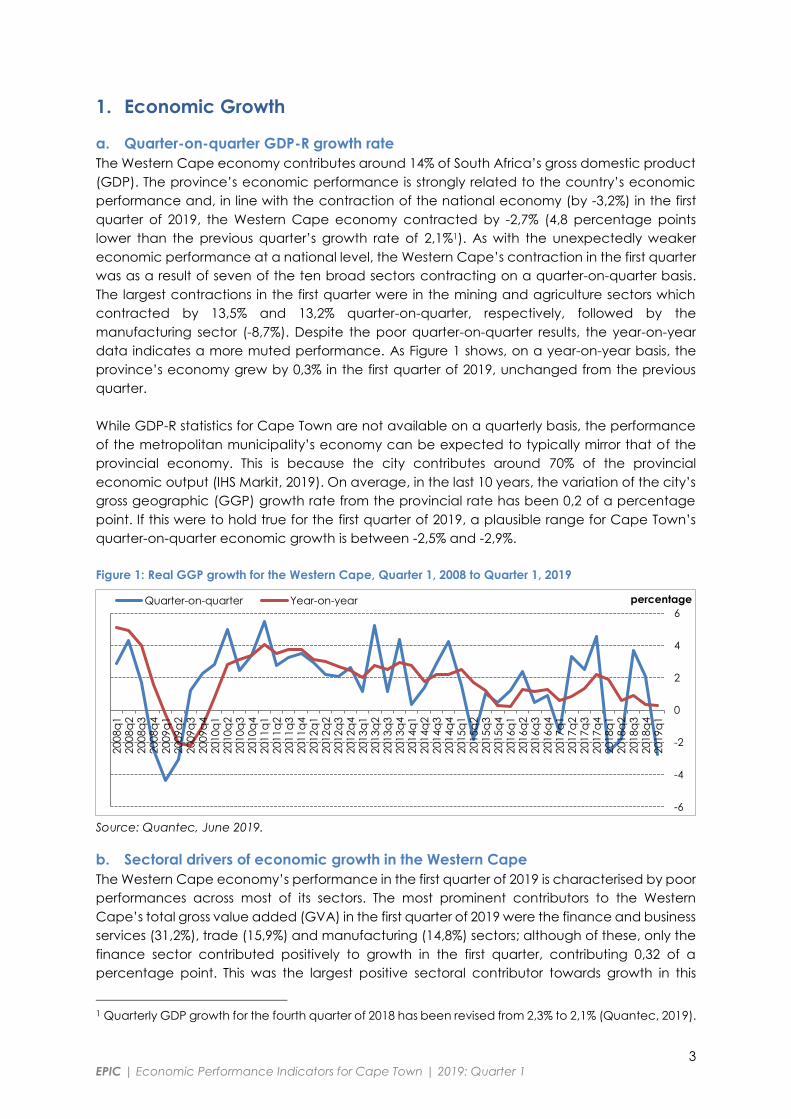
The Western Cape economy contributes around 14% of South Africa’s gross domestic product
(GDP). The province’s economic performance is strongly related to the country’s economic
performance and, in line with the contraction of the national economy (by -3,2%) in the first
quarter of 2019, the Western Cape economy contracted by -2,7% (4,8 percentage points
lower than the previous quarter’s growth rate of 2,1%1). As with the unexpectedly weaker
economic performance at a national level, the Western Cape’s contraction in the first quarter
was as a result of seven of the ten broad sectors contracting on a quarter-on-quarter basis.
The largest contractions in the first quarter were in the mining and agriculture sectors which
contracted by 13,5% and 13,2% quarter-on-quarter, respectively, followed by the
manufacturing sector (-8,7%). Despite the poor quarter-on-quarter results, the year-on-year
data indicates a more muted performance. As Figure 1 shows, on a year-on-year basis, the
province’s economy grew by 0,3% in the first quarter of 2019, unchanged from the previous
quarter.
While GDP-R statistics for Cape Town are not available on a quarterly basis, the performance
of the metropolitan municipality’s economy can be expected to typically mirror that of the
provincial economy. This is because the city contributes around 70% of the provincial
economic output (IHS Markit, 2019). On average, in the last 10 years, the variation of the city’s
gross geographic (GGP) growth rate from the provincial rate has been 0,2 of a percentage
point. If this were to hold true for the first quarter of 2019, a plausible range for Cape Town’s
quarter-on-quarter economic growth is between -2,5% and -2,9%.
Figure 1: Real GGP growth for the Western Cape, Quarter 1, 2008 to Quarter 1, 2019
Source: Quantec, June 2019.
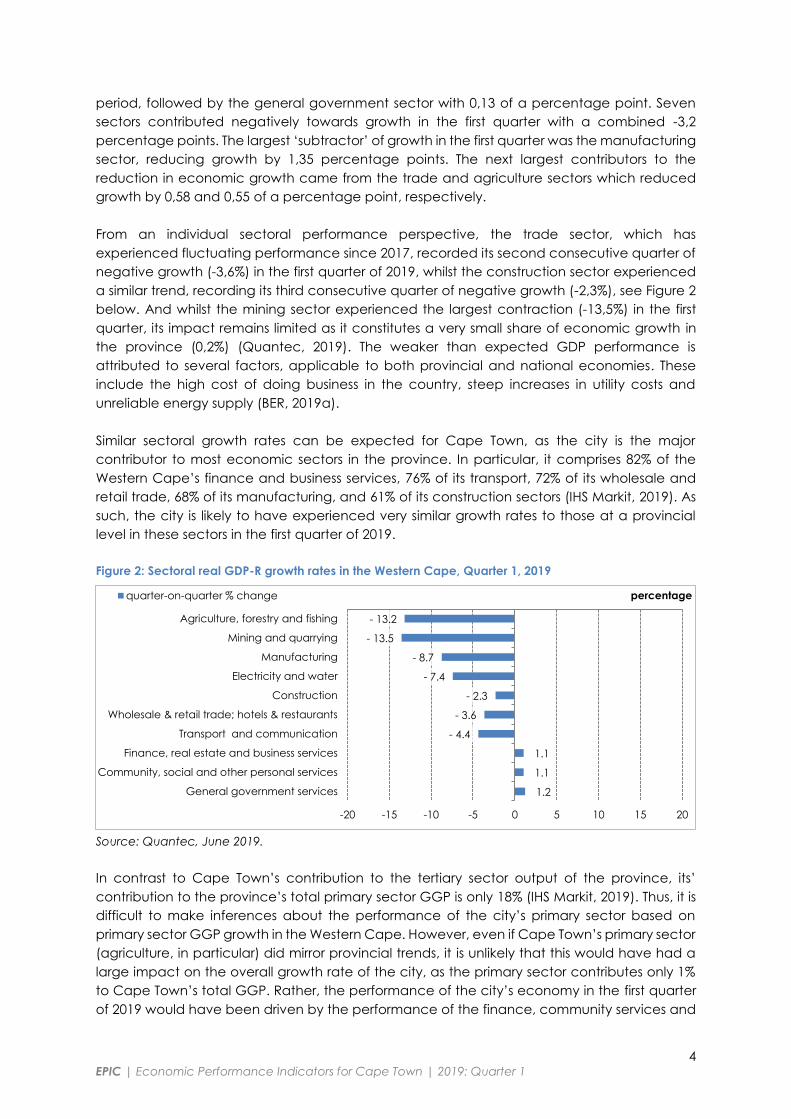
b. Sectoral drivers of economic growth in the Western Cape
The Western Cape economy’s performance in the first quarter of 2019 is characterised by poor
performances across most of its sectors. The most prominent contributors to the Western
Cape’s total gross value added (GVA) in the first quarter of 2019 were the finance and business
services (31,2%), trade (15,9%) and manufacturing (14,8%) sectors; although of these, only the
finance sector contributed positively to growth in the first quarter, contributing 0,32 of a
percentage point. This was the largest positive sectoral contributor towards growth in this
1 Quarterly GDP growth for the fourth quarter of 2018 has been revised from 2,3% to 2,1% (Quantec, 2019).
-6
-4
-2
0
2
4
6
200
8q
12
00
8q
22
00
8q
32
00
8q
42
00
9q
12
00
9q
22
00
9q
32
00
9q
42
01
0q
12010q
22
01
0q
32
01
0q
42
01
1q
12
01
1q
22
01
1q
32
01
1q
42
01
2q
12
01
2q
22
01
2q
32
01
2q
42
01
3q
12
01
3q
22
01
3q
32
01
3q
42
01
4q
12
01
4q
22
01
4q
32
01
4q
42015q
12
01
5q
22
01
5q
32
01
5q
42
01
6q
12
01
6q
22
01
6q
32
01
6q
42
01
7q
12
01
7q
22
01
7q
32
01
7q
42
01
8q
12
01
8q
22
01
8q
32
01
8q
42
01
9q
1
percentageQuarter-on-quarter Year-on-year
4 EPIC | Economic Performance Indicators for Cape Town | 2019: Quarter 1
period, followed by the general government sector with 0,13 of a percentage point. Seven
sectors contributed negatively towards growth in the first quarter with a combined -3,2
percentage points. The largest ‘subtractor’ of growth in the first quarter was the manufacturing
sector, reducing growth by 1,35 percentage points. The next largest contributors to the
reduction in economic growth came from the trade and agriculture sectors which reduced
growth by 0,58 and 0,55 of a percentage point, respectively.
From an individual sectoral performance perspective, the trade sector, which has
experienced fluctuating performance since 2017, recorded its second consecutive quarter of
negative growth (-3,6%) in the first quarter of 2019, whilst the construction sector experienced
a similar trend, recording its third consecutive quarter of negative growth (-2,3%), see Figure 2
below. And whilst the mining sector experienced the largest contraction (-13,5%) in the first
quarter, its impact remains limited as it constitutes a very small share of economic growth in
the province (0,2%) (Quantec, 2019). The weaker than expected GDP performance is
attributed to several factors, applicable to both provincial and national economies. These
include the high cost of doing business in the country, steep increases in utility costs and
unreliable energy supply (BER, 2019a).
Similar sectoral growth rates can be expected for Cape Town, as the city is the major
contributor to most economic sectors in the province. In particular, it comprises 82% of the
Western Cape’s finance and business services, 76% of its transport, 72% of its wholesale and
retail trade, 68% of its manufacturing, and 61% of its construction sectors (IHS Markit, 2019). As
such, the city is likely to have experienced very similar growth rates to those at a provincial
level in these sectors in the first quarter of 2019.
Figure 2: Sectoral real GDP-R growth rates in the Western Cape, Quarter 1, 2019
Source: Quantec, June 2019.
In contrast to Cape Town’s contribution to the tertiary sector output of the province, its’
contribution to the province’s total primary sector GGP is only 18% (IHS Markit, 2019). Thus, it is
difficult to make inferences about the performance of the city’s primary sector based on
primary sector GGP growth in the Western Cape. However, even if Cape Town’s primary sector
(agriculture, in particular) did mirror provincial trends, it is unlikely that this would have had a
large impact on the overall growth rate of the city, as the primary sector contributes only 1%
to Cape Town’s total GGP. Rather, the performance of the city’s economy in the first quarter
of 2019 would have been driven by the performance of the finance, community services and
- 13.2
- 13.5
- 8.7
- 7.4
- 2.3
- 3.6
- 4.4
1.1
1.1
1.2
-20 -15 -10 -5 0 5 10 15 20
Agriculture, forestry and fishing
Mining and quarrying
Manufacturing
Electricity and water
Construction
Wholesale & retail trade; hotels & restaurants
Transport and communication
Finance, real estate and business services
Community, social and other personal services
General government services
percentagequarter-on-quarter % change
5 EPIC | Economic Performance Indicators for Cape Town | 2019: Quarter 1
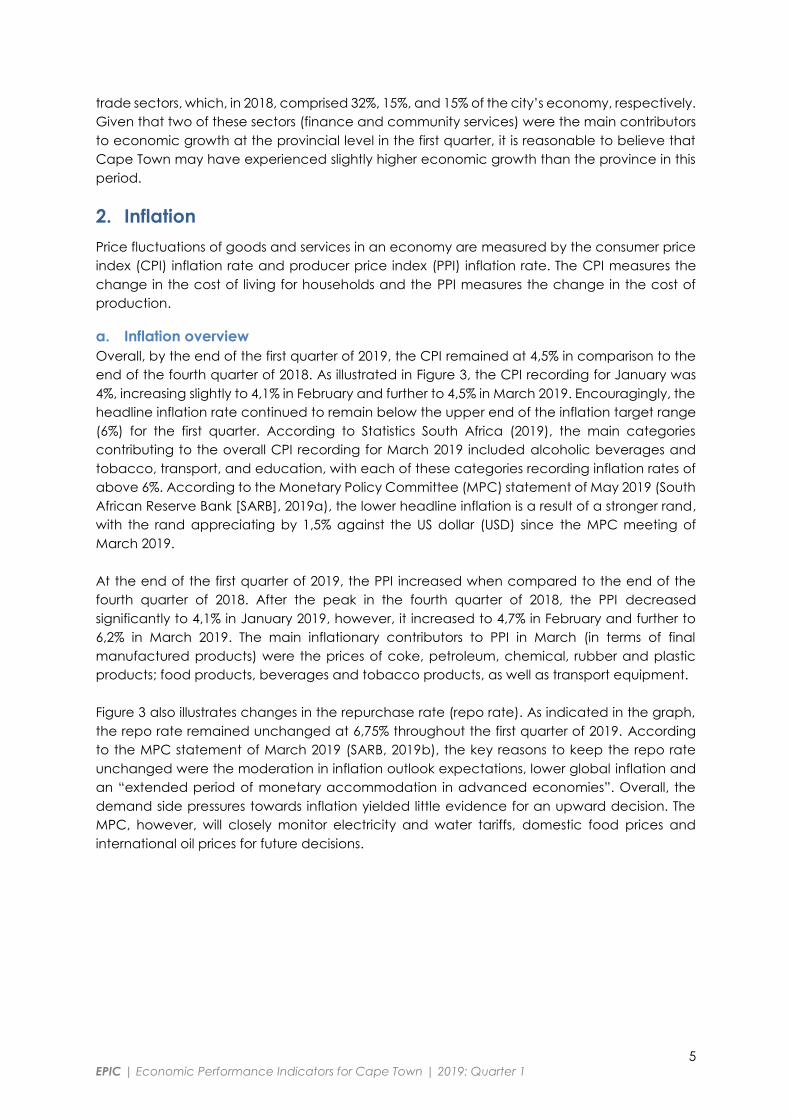
trade sectors, which, in 2018, comprised 32%, 15%, and 15% of the city’s economy, respectively.
Given that two of these sectors (finance and community services) were the main contributors
to economic growth at the provincial level in the first quarter, it is reasonable to believe that
Cape Town may have experienced slightly higher economic growth than the province in this
period.
2. Inflation
Price fluctuations of goods and services in an economy are measured by the consumer price
index (CPI) inflation rate and producer price index (PPI) inflation rate. The CPI measures the
change in the cost of living for households and the PPI measures the change in the cost of
production.
a. Inflation overview
Overall, by the end of the first quarter of 2019, the CPI remained at 4,5% in comparison to the
end of the fourth quarter of 2018. As illustrated in Figure 3, the CPI recording for January was
4%, increasing slightly to 4,1% in February and further to 4,5% in March 2019. Encouragingly, the
headline inflation rate continued to remain below the upper end of the inflation target range
(6%) for the first quarter. According to Statistics South Africa (2019), the main categories
contributing to the overall CPI recording for March 2019 included alcoholic beverages and
tobacco, transport, and education, with each of these categories recording inflation rates of
above 6%. According to the Monetary Policy Committee (MPC) statement of May 2019 (South
African Reserve Bank [SARB], 2019a), the lower headline inflation is a result of a stronger rand,
with the rand appreciating by 1,5% against the US dollar (USD) since the MPC meeting of
March 2019.
At the end of the first quarter of 2019, the PPI increased when compared to the end of the
fourth quarter of 2018. After the peak in the fourth quarter of 2018, the PPI decreased
significantly to 4,1% in January 2019, however, it increased to 4,7% in February and further to
6,2% in March 2019. The main inflationary contributors to PPI in March (in terms of final
manufactured products) were the prices of coke, petroleum, chemical, rubber and plastic
products; food products, beverages and tobacco products, as well as transport equipment.
Figure 3 also illustrates changes in the repurchase rate (repo rate). As indicated in the graph,
the repo rate remained unchanged at 6,75% throughout the first quarter of 2019. According
to the MPC statement of March 2019 (SARB, 2019b), the key reasons to keep the repo rate
unchanged were the moderation in inflation outlook expectations, lower global inflation and
an “extended period of monetary accommodation in advanced economies”. Overall, the
demand side pressures towards inflation yielded little evidence for an upward decision. The
MPC, however, will closely monitor electricity and water tariffs, domestic food prices and
international oil prices for future decisions.
6 EPIC | Economic Performance Indicators for Cape Town | 2019: Quarter 1
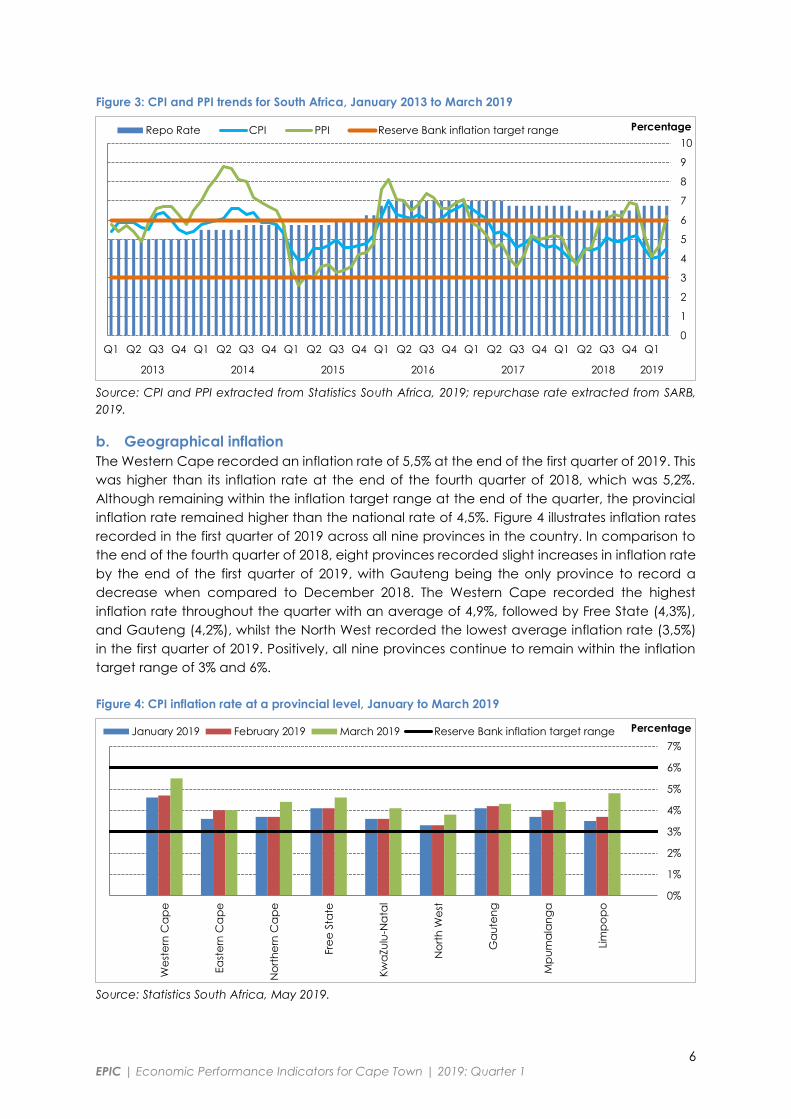
Figure 3: CPI and PPI trends for South Africa, January 2013 to March 2019
Source: CPI and PPI extracted from Statistics South Africa, 2019; repurchase rate extracted from SARB,
2019.
b. Geographical inflation
The Western Cape recorded an inflation rate of 5,5% at the end of the first quarter of 2019. This
was higher than its inflation rate at the end of the fourth quarter of 2018, which was 5,2%.
Although remaining within the inflation target range at the end of the quarter, the provincial
inflation rate remained higher than the national rate of 4,5%. Figure 4 illustrates inflation rates
recorded in the first quarter of 2019 across all nine provinces in the country. In comparison to
the end of the fourth quarter of 2018, eight provinces recorded slight increases in inflation rate
by the end of the first quarter of 2019, with Gauteng being the only province to record a
decrease when compared to December 2018. The Western Cape recorded the highest
inflation rate throughout the quarter with an average of 4,9%, followed by Free State (4,3%),
and Gauteng (4,2%), whilst the North West recorded the lowest average inflation rate (3,5%)
in the first quarter of 2019. Positively, all nine provinces continue to remain within the inflation
target range of 3% and 6%.
Figure 4: CPI inflation rate at a provincial level, January to March 2019
Source: Statistics South Africa, May 2019.
0
1
2
3
4
5
6
7
8
9
10
Q1 Q2 Q3 Q4 Q1 Q2 Q3 Q4 Q1 Q2 Q3 Q4 Q1 Q2 Q3 Q4 Q1 Q2 Q3 Q4 Q1 Q2 Q3 Q4 Q1
2013 2014 2015 2016 2017 2018 2019
PercentageRepo Rate CPI PPI Reserve Bank inflation target range
0%
1%
2%
3%
4%
5%
6%
7%
We
ste
rn C
ap
e
Ea
ste
rn C
ap
e
No
rth
ern
Ca
pe
Fre
e S
tate
Kw
aZu
lu-N
ata
l
No
rth
We
st
Ga
ute
ng
Mp
um
ala
ng
a
Lim
po
po
PercentageJanuary 2019 February 2019 March 2019 Reserve Bank inflation target range
7 EPIC | Economic Performance Indicators for Cape Town | 2019: Quarter 1
The higher overall inflation rate at the provincial level (compared to the national level) for the
first quarter of 2019 can largely be attributed to housing and utilities’ price inflation which was
recorded at 7,6% in March for the Western Cape and 4,6% at the national level. Within this
category the disparity between prices at the provincial and national levels was notable in
owners’ equivalent rent2 and actual rentals for housing which were recorded at 7,4% and 7,5%,
respectively, for the province, compared to 2,6% and 3,4%, respectively, at the national level.
Water and other services’3 price inflation in the Western Cape remained high in the first quarter,
although declined slightly from 9,8% in February, to 9,7% in March. This was lower than the
inflation rate in this category at a national level which was 10,9% in March 2019.
Food price inflation in the Western Cape increased minimally from 1,7% in February to 1,9% in
March 2019. Similarly, food price inflation on a national level increased from 2,3% in February
to 2,5% in March. This marks one of the first quarters that the Western Cape recorded lower
food price inflation than that experienced nationally. Large disparities in inflation rates
between the Western Cape and the country as a whole were also observed within the non-
alcoholic beverages’ price inflation (7,7% and 10,2%, respectively) and in alcoholic
beverages’ price inflation (7,1% and 6,4%, respectively) at the end of March 2019. The Western
Cape also recorded a higher restaurants and hotels price inflation (7,1%) than that recorded
at a national level (4,5%) at the end of the first quarter of 2019.
Following a significant decline in the last month of the fourth quarter of 2018, private transport
fuel price inflation further decreased in the beginning of the first quarter but increased
significantly in the last month of the quarter. From recording 8,4% in December 2018, private
transport fuel price inflation in the Western Cape decreased to -1,5% in January, thereafter
increasing slightly to 0,7% in February 2019 and substantially to 9,2% in March, mirroring national
trends. This is reflective of the decrease in fuel price in January and the smaller subsequent
increases in both February and March which contributed towards the cumulative decrease of
41 cents on the price of petrol in the first quarter of 2019 (Automobile Association of South
Africa, 2019). The volatile performance in fuel price inflation could also be attributed to the
increases in oil prices as well as the stronger rand performance, as noted by the MPC (SARB,
2019a).
3. Labour Market
The labour market is the point at which economic production meets human development. As
such employment creation and unemployment reduction are top priorities for all spheres of
government. Labour market performance is tracked through a variety of indicators, many of
which are reflected on in this section.
a. Cape Town’s labour market performance
Cape Town’s working age population (2,9 million) increased on both a quarter-on-quarter and
year-on-year basis. The labour force decreased on a quarter-on-quarter (15 866) and year-on-
year (39 056) basis to a total of 2 million individuals. Employment, also, decreased by 13 317
individuals on a quarter-on-quarter basis and by 5 745 when compared to the first quarter of
2018. This marks the second consecutive decline in Cape Town’s quarterly employment
2 As defined by Statistics South Africa, the category “owners’ equivalent rent” measures the opportunity
cost to the owners of forgoing a rental income by living in rather than renting out the house they own
(Statistics South Africa, 2017). 3 As defined by Statistics South Africa, the category “water and other services” includes water supply,
rates, taxes and levies (Statistics South Africa, 2017).

8 EPIC | Economic Performance Indicators for Cape Town | 2019: Quarter 1
growth. The increase in the working-age population and decrease in employment for this
quarter resulted in the labour absorption rate decreasing to 53,9% from 54,6% in the previous
quarter. Similarly, the labour force participation rate declined by 0,8 of a percentage point to
68,4% for the first quarter of 2019.
Formal employment recorded a decrease of 18 493 quarter-on-quarter, while increasing on a
year-on-year basis (16 079) to 1,3 million individuals. Contrastingly, informal employment
increased on a quarterly basis (13 792), while decreasing on a year-on-year basis (1 899) to
record a total of 186 695 individuals in the first quarter. The share of total employment
contributed by informal employment increased to 11,8% from a previous recording of 10,8% in
the fourth quarter of 2018.
b. Employment comparison of metros
To measure Cape Town’s job creation performance, a comparison with other metropolitan
municipalities (metros) in the country is helpful. In the first quarter of 2019, Cape Town had the
second largest number of employed people, with 1,58 million people employed in the city,
second only to Johannesburg where 2 million people were employed. This is to be expected
as Johannesburg has a significantly larger population.
Turning attention to employment trends in the first quarter of 2019, four metros displayed
negative employment growth, while two metros recorded positive employment growth on a
quarter-on-quarter basis (refer to Figure 5). Tshwane (with an increase of 2 915 in employment)
and Ekurhuleni (with an increase of 26 489 in employment) were the only metros to have
added jobs for this quarter when compared to the fourth quarter of 2018. Nelson Mandela Bay
shed the most jobs (with a reduction of 27 965 in employment) followed by Johannesburg (with
a reduction of 21 134 in employment), eThekwini (18 791 jobs shed) and Cape Town (13 317
jobs shed). On a year-on-year level there was a slightly better performance by the metros with
three metros increasing their employment whilst three metros displayed negative employment
growth. Similar to their quarterly performance, Tshwane (68 446 jobs created) and Ekurhuleni
(41 562 jobs created) added the most jobs followed by Johannesburg (7 444 jobs created).
Following their poor quarterly performance, eThekwini and Nelson Mandela Bay shed the most
jobs with 45 148 and 23 495, respectively, while Cape Town shed 5 745 jobs on a year-on-year
basis.
Figure 5: Employment comparison with other metros, Quarter 4, 2018 versus Quarter 1, 2019
Source: Statistics South Africa, Quarter Labour Force Survey, 2019 Quarter 1, May 2019.
0.0
0.5
1.0
1.5
2.0
Cape Town Tshwane Nelson Mandela Bay Johannesburg Ekurhuleni eThekwini
Employment
(millions)2018:Q4 2019:Q1
9 EPIC | Economic Performance Indicators for Cape Town | 2019: Quarter 1
c. Unemployment in Cape Town
Encouragingly, the number of unemployed people in Cape Town decreased on both a
quarter-on-quarter (2 549) and a year-on-year (33 311) basis to record a total of 426 130
unemployed individuals at the end of the first quarter. The increase in employment coupled
with minimal change in unemployment for this quarter resulted in no change in the strict
unemployment rate (21,2%) when compared to the previous quarter. On a year-on-year basis,
the larger decrease in unemployment outweighed the decrease in employment and resulted
in a decrease in the strict unemployment rate, from 22,4% recorded in the first quarter of 2018.
The youth unemployment rate in Cape Town, defined as the strict unemployment rate for
individuals aged 15 to 24, was estimated at 44,7% in the first quarter of 2019, having increased
slightly from 44,4% in the previous quarter, however decreasing from 45,5% in the first quarter
of 2018. While this is below the national youth unemployment rate of 55,2% (increasing from
54,7% in the previous quarter), it is nonetheless markedly high by developing-country standards
and continues to pose a key challenge to economic policymakers in the city.
Whilst traditional comparisons of Cape Town’s unemployment trends with that of South Africa
as a whole are important, it is perhaps more revealing to compare these trends to other metros
that have similar labour market dynamics (see Table 1). Encouragingly, Cape Town had the
lowest strict (21,2%) and expanded (23,4%) unemployment rates when compared to all other
metros for the first quarter of 2019, albeit increasing marginally compared to the previous
quarter. Nelson Mandela Bay, on the other hand, had the highest strict (38,2%) and expanded
(38,3%) unemployment rates for this quarter. Nelson Mandela Bay also had the largest increase
in both strict and expanded unemployment rates (each by 2,3 percentage points) when
compared to the fourth quarter of 2018, whilst Tshwane had the largest decrease in both
unemployment rates (by 1,5 and 0,9 percentage points, respectively). Notably, Table 1
indicates the large differences in the relationship between strict and expanded
unemployment rates in each of the six metros, with Nelson Mandela Bay recording 0,1 of a
percentage point difference between the two rates of unemployment, whereas eThekwini
recorded a 5,9 percentage points difference. Cape Town continues to record relatively low
differences between the two rates of unemployment (2,2 percentage points difference). This
can be attributed to the city having a relatively small number of discouraged work-seekers in
the metro (second lowest after Nelson Mandela Bay metro).
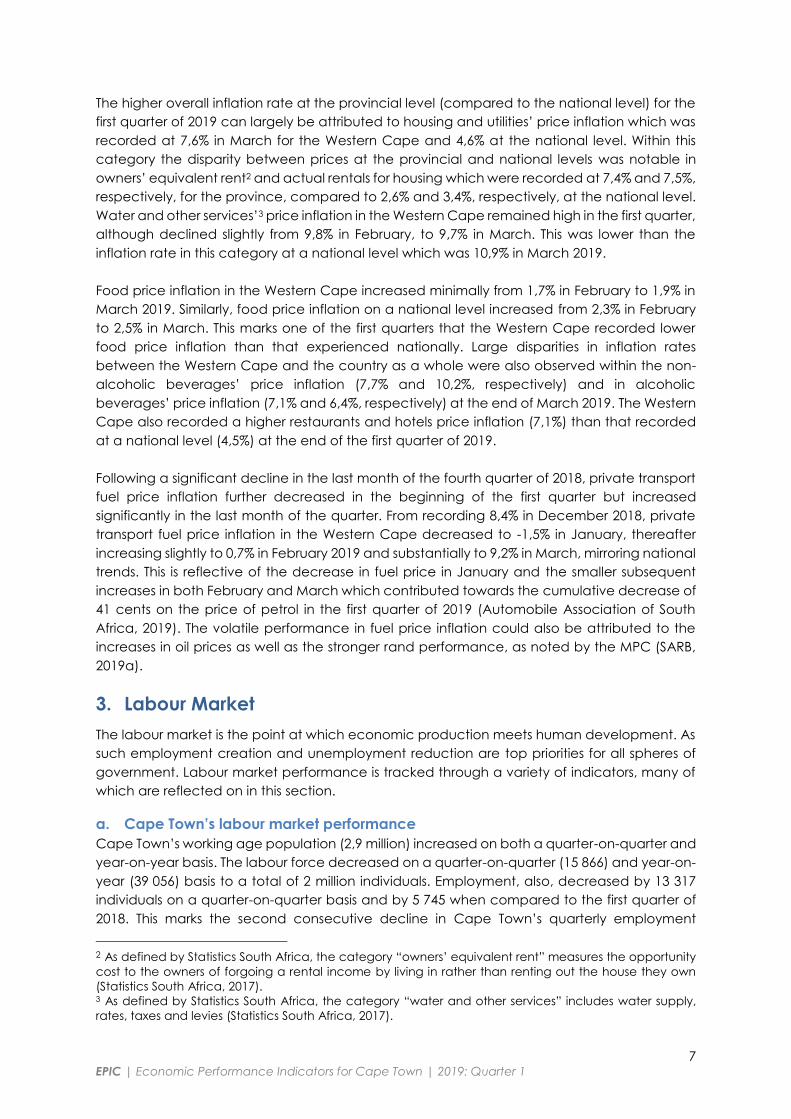
Table 1: Official (strict) versus expanded (broad) unemployment rates
Metro Official (strict) Expanded (broad)
2019: Q1 2018: Q4 2018: Q1 2019: Q1 2018: Q4 2018: Q1
Cape Town 21,2 21,2 22,4 23,4 23,1 23,8
eThekwini 23,0 21,8 20,3 28,9 29,7 27,4
Ekurhuleni 30,1 31,2 30,9 35,0 35,5 34,9
Johannesburg 29,8 29,0 28,8 31,7 31,2 31,4
Nelson Mandela Bay 38,2 35,9 36,3 38,3 36,0 36,4
Tshwane 26,4 28,0 26,0 31,4 32,3 33,5
Source: Statistics South Africa, Quarterly Labour Force Survey, 2019 Quarter 1, May 2019.
d. Sector employment trends for Cape Town
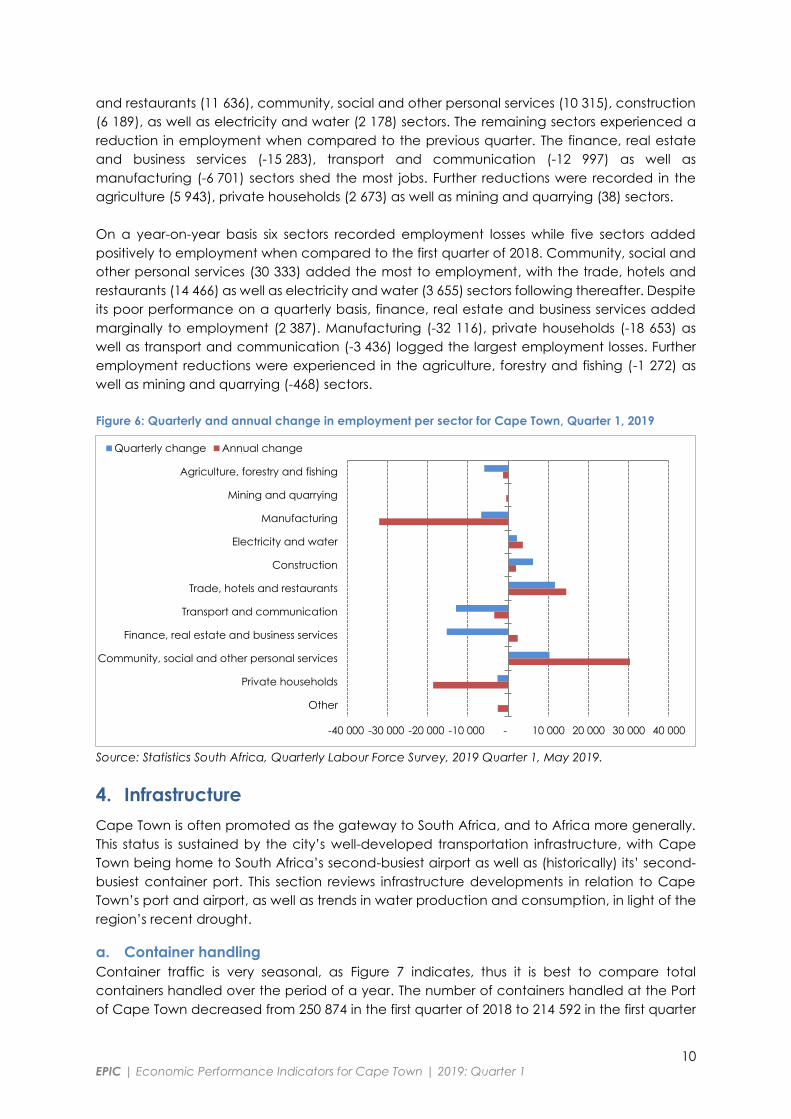
Figure 6 presents the change in the level of employment by sector within Cape Town in the
first quarter of 2019. Four sectors made a positive contribution to employment creation when
compared to the previous quarter, with the highest contributions recorded in the trade, hotels
10 EPIC | Economic Performance Indicators for Cape Town | 2019: Quarter 1
and restaurants (11 636), community, social and other personal services (10 315), construction
(6 189), as well as electricity and water (2 178) sectors. The remaining sectors experienced a
reduction in employment when compared to the previous quarter. The finance, real estate
and business services (-15 283), transport and communication (-12 997) as well as
manufacturing (-6 701) sectors shed the most jobs. Further reductions were recorded in the
agriculture (5 943), private households (2 673) as well as mining and quarrying (38) sectors.
On a year-on-year basis six sectors recorded employment losses while five sectors added
positively to employment when compared to the first quarter of 2018. Community, social and
other personal services (30 333) added the most to employment, with the trade, hotels and
restaurants (14 466) as well as electricity and water (3 655) sectors following thereafter. Despite
its poor performance on a quarterly basis, finance, real estate and business services added
marginally to employment (2 387). Manufacturing (-32 116), private households (-18 653) as
well as transport and communication (-3 436) logged the largest employment losses. Further
employment reductions were experienced in the agriculture, forestry and fishing (-1 272) as
well as mining and quarrying (-468) sectors.
Figure 6: Quarterly and annual change in employment per sector for Cape Town, Quarter 1, 2019
Source: Statistics South Africa, Quarterly Labour Force Survey, 2019 Quarter 1, May 2019.
4. Infrastructure
Cape Town is often promoted as the gateway to South Africa, and to Africa more generally.
This status is sustained by the city’s well-developed transportation infrastructure, with Cape
Town being home to South Africa’s second-busiest airport as well as (historically) its’ second-
busiest container port. This section reviews infrastructure developments in relation to Cape
Town’s port and airport, as well as trends in water production and consumption, in light of the
region’s recent drought.
a. Container handling
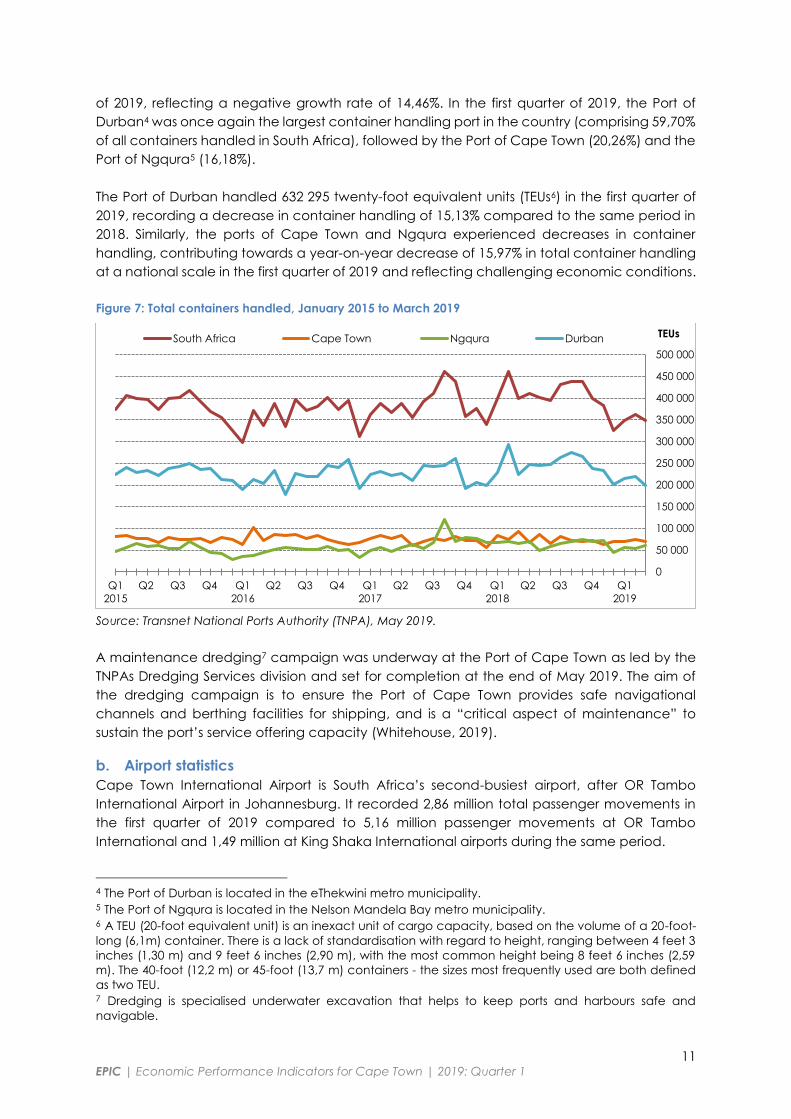
Container traffic is very seasonal, as Figure 7 indicates, thus it is best to compare total
containers handled over the period of a year. The number of containers handled at the Port
of Cape Town decreased from 250 874 in the first quarter of 2018 to 214 592 in the first quarter
-40 000 -30 000 -20 000 -10 000 - 10 000 20 000 30 000 40 000
Agriculture, forestry and fishing
Mining and quarrying
Manufacturing
Electricity and water
Construction
Trade, hotels and restaurants
Transport and communication
Finance, real estate and business services
Community, social and other personal services
Private households
Other
Quarterly change Annual change
11 EPIC | Economic Performance Indicators for Cape Town | 2019: Quarter 1
of 2019, reflecting a negative growth rate of 14,46%. In the first quarter of 2019, the Port of
Durban4 was once again the largest container handling port in the country (comprising 59,70%
of all containers handled in South Africa), followed by the Port of Cape Town (20,26%) and the
Port of Ngqura5 (16,18%).
The Port of Durban handled 632 295 twenty-foot equivalent units (TEUs6) in the first quarter of
2019, recording a decrease in container handling of 15,13% compared to the same period in
2018. Similarly, the ports of Cape Town and Ngqura experienced decreases in container
handling, contributing towards a year-on-year decrease of 15,97% in total container handling
at a national scale in the first quarter of 2019 and reflecting challenging economic conditions.
Figure 7: Total containers handled, January 2015 to March 2019
Source: Transnet National Ports Authority (TNPA), May 2019.
A maintenance dredging7 campaign was underway at the Port of Cape Town as led by the
TNPAs Dredging Services division and set for completion at the end of May 2019. The aim of
the dredging campaign is to ensure the Port of Cape Town provides safe navigational
channels and berthing facilities for shipping, and is a “critical aspect of maintenance” to
sustain the port’s service offering capacity (Whitehouse, 2019).
b. Airport statistics
Cape Town International Airport is South Africa’s second-busiest airport, after OR Tambo
International Airport in Johannesburg. It recorded 2,86 million total passenger movements in
the first quarter of 2019 compared to 5,16 million passenger movements at OR Tambo
International and 1,49 million at King Shaka International airports during the same period.
4 The Port of Durban is located in the eThekwini metro municipality. 5 The Port of Ngqura is located in the Nelson Mandela Bay metro municipality. 6 A TEU (20-foot equivalent unit) is an inexact unit of cargo capacity, based on the volume of a 20-foot-
long (6,1m) container. There is a lack of standardisation with regard to height, ranging between 4 feet 3
inches (1,30 m) and 9 feet 6 inches (2,90 m), with the most common height being 8 feet 6 inches (2,59
m). The 40-foot (12,2 m) or 45-foot (13,7 m) containers - the sizes most frequently used are both defined
as two TEU. 7 Dredging is specialised underwater excavation that helps to keep ports and harbours safe and
navigable.
0
50 000
100 000
150 000
200 000
250 000
300 000
350 000
400 000
450 000
500 000
Q1
2015
Q2 Q3 Q4 Q1
2016
Q2 Q3 Q4 Q1
2017
Q2 Q3 Q4 Q1
2018
Q2 Q3 Q4 Q1
2019
TEUsSouth Africa Cape Town Ngqura Durban
12 EPIC | Economic Performance Indicators for Cape Town | 2019: Quarter 1
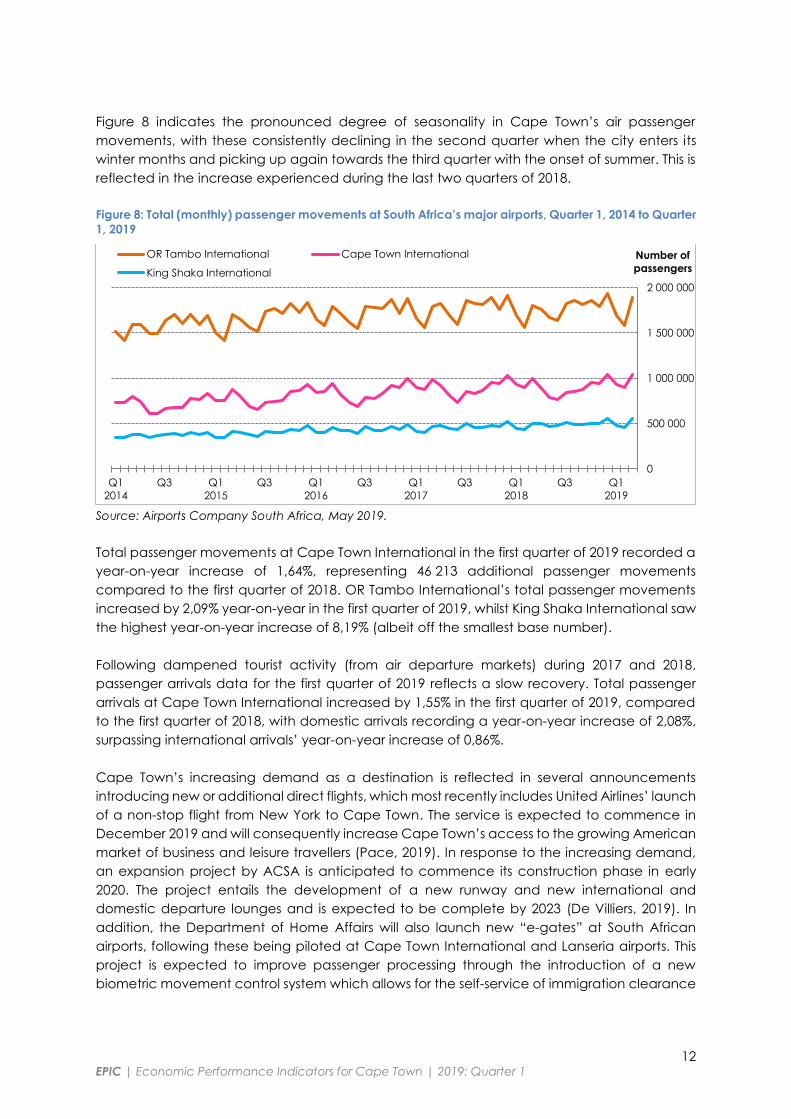
Figure 8 indicates the pronounced degree of seasonality in Cape Town’s air passenger
movements, with these consistently declining in the second quarter when the city enters its
winter months and picking up again towards the third quarter with the onset of summer. This is
reflected in the increase experienced during the last two quarters of 2018.
Figure 8: Total (monthly) passenger movements at South Africa’s major airports, Quarter 1, 2014 to Quarter
1, 2019
Source: Airports Company South Africa, May 2019.
Total passenger movements at Cape Town International in the first quarter of 2019 recorded a
year-on-year increase of 1,64%, representing 46 213 additional passenger movements
compared to the first quarter of 2018. OR Tambo International’s total passenger movements
increased by 2,09% year-on-year in the first quarter of 2019, whilst King Shaka International saw
the highest year-on-year increase of 8,19% (albeit off the smallest base number).
Following dampened tourist activity (from air departure markets) during 2017 and 2018,
passenger arrivals data for the first quarter of 2019 reflects a slow recovery. Total passenger
arrivals at Cape Town International increased by 1,55% in the first quarter of 2019, compared
to the first quarter of 2018, with domestic arrivals recording a year-on-year increase of 2,08%,
surpassing international arrivals’ year-on-year increase of 0,86%.
Cape Town’s increasing demand as a destination is reflected in several announcements
introducing new or additional direct flights, which most recently includes United Airlines’ launch
of a non-stop flight from New York to Cape Town. The service is expected to commence in
December 2019 and will consequently increase Cape Town’s access to the growing American
market of business and leisure travellers (Pace, 2019). In response to the increasing demand,
an expansion project by ACSA is anticipated to commence its construction phase in early
2020. The project entails the development of a new runway and new international and
domestic departure lounges and is expected to be complete by 2023 (De Villiers, 2019). In
addition, the Department of Home Affairs will also launch new “e-gates” at South African
airports, following these being piloted at Cape Town International and Lanseria airports. This
project is expected to improve passenger processing through the introduction of a new
biometric movement control system which allows for the self-service of immigration clearance
0
500 000
1 000 000
1 500 000
2 000 000
Q1
2014
Q3 Q1
2015
Q3 Q1
2016
Q3 Q1
2017
Q3 Q1
2018
Q3 Q1
2019
Number of
passengers
OR Tambo International Cape Town International
King Shaka International
13 EPIC | Economic Performance Indicators for Cape Town | 2019: Quarter 1
of low-risk travellers, thus better equipping local airports to efficiently manage increasing
passenger movements (BusinessTech, 2019).
c. Water
Cape Town recently experienced its worst drought in recorded history, with the economy still
recovering from some of the related negative impacts. The City of Cape Town (City/CCT) has
had a range of demand and supply-side management instruments in place for a number of
years to enable the sustainable provision of water; however, in light of the severity of the
drought and the impact this had on dam levels, a number of these measures had to be
accelerated. The City continues to work on determining the best approach for securing water
resilience for the water supply system, which has culminated in the recent drafting of a Water
Strategy for Cape Town (CCT, 2019a).
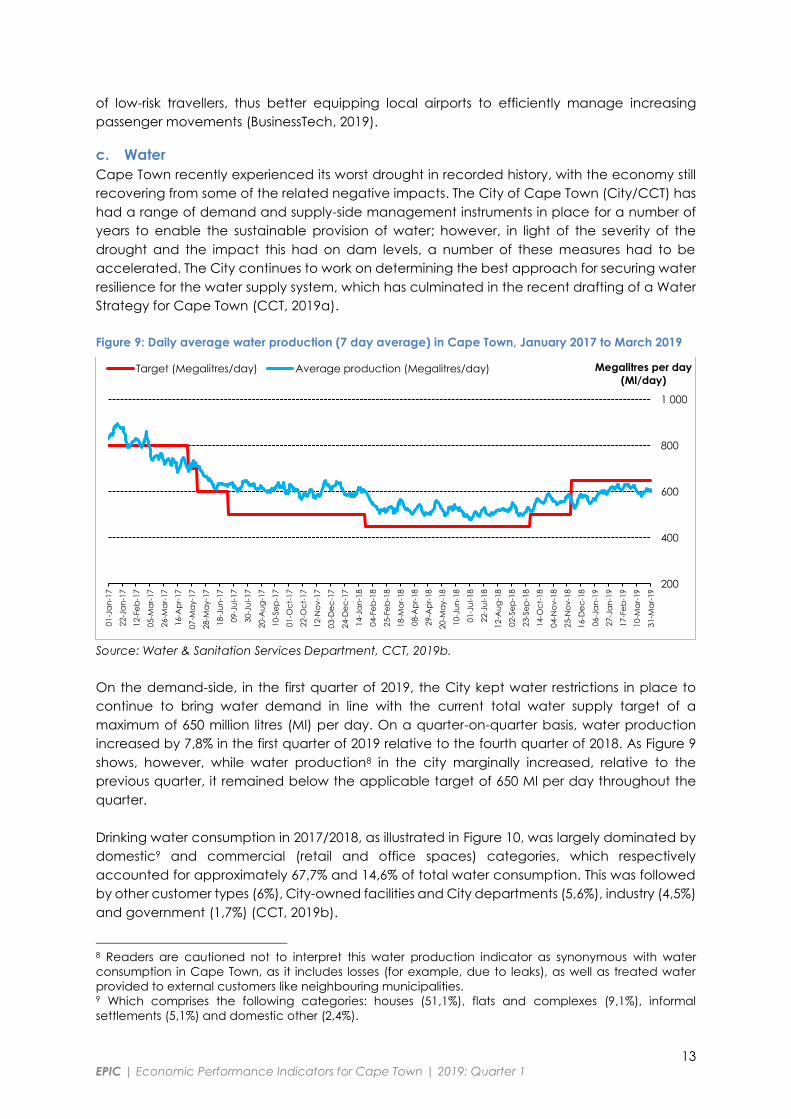
Figure 9: Daily average water production (7 day average) in Cape Town, January 2017 to March 2019
Source: Water & Sanitation Services Department, CCT, 2019b.
On the demand-side, in the first quarter of 2019, the City kept water restrictions in place to
continue to bring water demand in line with the current total water supply target of a
maximum of 650 million litres (Ml) per day. On a quarter-on-quarter basis, water production
increased by 7,8% in the first quarter of 2019 relative to the fourth quarter of 2018. As Figure 9
shows, however, while water production8 in the city marginally increased, relative to the
previous quarter, it remained below the applicable target of 650 Ml per day throughout the
quarter.
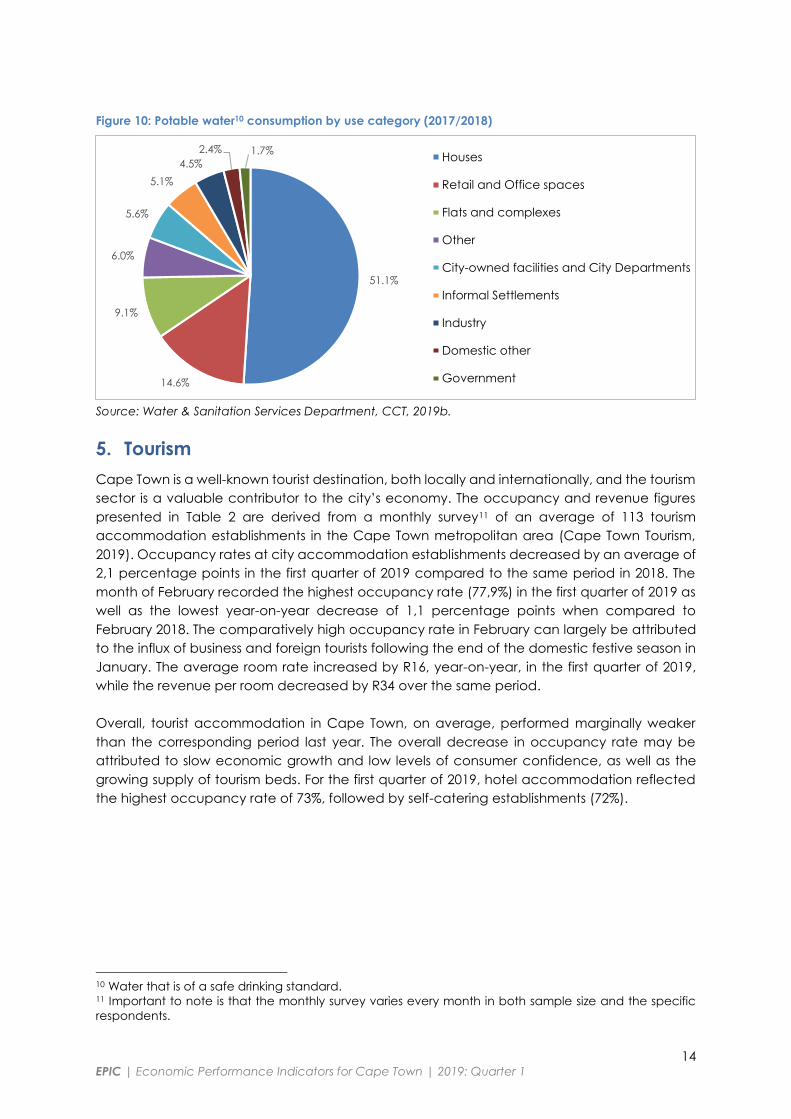
Drinking water consumption in 2017/2018, as illustrated in Figure 10, was largely dominated by
domestic9 and commercial (retail and office spaces) categories, which respectively
accounted for approximately 67,7% and 14,6% of total water consumption. This was followed
by other customer types (6%), City-owned facilities and City departments (5,6%), industry (4,5%)
and government (1,7%) (CCT, 2019b).
8 Readers are cautioned not to interpret this water production indicator as synonymous with water
consumption in Cape Town, as it includes losses (for example, due to leaks), as well as treated water
provided to external customers like neighbouring municipalities. 9 Which comprises the following categories: houses (51,1%), flats and complexes (9,1%), informal
settlements (5,1%) and domestic other (2,4%).
200
400
600
800
1 000
01-J
an
-17
22-J
an
-17
12-F
eb
-17
05-M
ar-
17
26-M
ar-
17
16-A
pr-
17
07-M
ay-1
7
28-M
ay-1
7
18-J
un
-17
09-J
ul-1
7
30-J
ul-1
7
20-A
ug
-17
10-S
ep
-17
01-O
ct-
17
22-O
ct-
17
12-N
ov-1
7
03-D
ec
-17
24-D
ec
-17
14-J
an
-18
04-F
eb
-18
25-F
eb
-18
18-M
ar-
18
08-A
pr-
18
29-A
pr-
18
20-M
ay-1
8
10-J
un
-18
01-J
ul-1
8
22-J
ul-1
8
12-A
ug
-18
02-S
ep
-18
23-S
ep
-18
14-O
ct-
18
04-N
ov-1
8
25-N
ov-1
8
16-D
ec
-18
06-J
an
-19
27-J
an
-19
17-F
eb
-19
10-M
ar-
19
31-M
ar-
19
Megalitres per day
(Ml/day)Target (Megalitres/day) Average production (Megalitres/day)
14 EPIC | Economic Performance Indicators for Cape Town | 2019: Quarter 1
Figure 10: Potable water10 consumption by use category (2017/2018)
Source: Water & Sanitation Services Department, CCT, 2019b.
5. Tourism
Cape Town is a well-known tourist destination, both locally and internationally, and the tourism
sector is a valuable contributor to the city’s economy. The occupancy and revenue figures
presented in Table 2 are derived from a monthly survey11 of an average of 113 tourism
accommodation establishments in the Cape Town metropolitan area (Cape Town Tourism,
2019). Occupancy rates at city accommodation establishments decreased by an average of
2,1 percentage points in the first quarter of 2019 compared to the same period in 2018. The
month of February recorded the highest occupancy rate (77,9%) in the first quarter of 2019 as
well as the lowest year-on-year decrease of 1,1 percentage points when compared to
February 2018. The comparatively high occupancy rate in February can largely be attributed
to the influx of business and foreign tourists following the end of the domestic festive season in
January. The average room rate increased by R16, year-on-year, in the first quarter of 2019,
while the revenue per room decreased by R34 over the same period.
Overall, tourist accommodation in Cape Town, on average, performed marginally weaker
than the corresponding period last year. The overall decrease in occupancy rate may be
attributed to slow economic growth and low levels of consumer confidence, as well as the
growing supply of tourism beds. For the first quarter of 2019, hotel accommodation reflected
the highest occupancy rate of 73%, followed by self-catering establishments (72%).
10 Water that is of a safe drinking standard. 11 Important to note is that the monthly survey varies every month in both sample size and the specific
respondents.
51.1%
14.6%
9.1%
6.0%
5.6%
5.1%
4.5%
2.4% 1.7%Houses
Retail and Office spaces
Flats and complexes
Other
City-owned facilities and City Departments
Informal Settlements
Industry
Domestic other
Government
15 EPIC | Economic Performance Indicators for Cape Town | 2019: Quarter 1
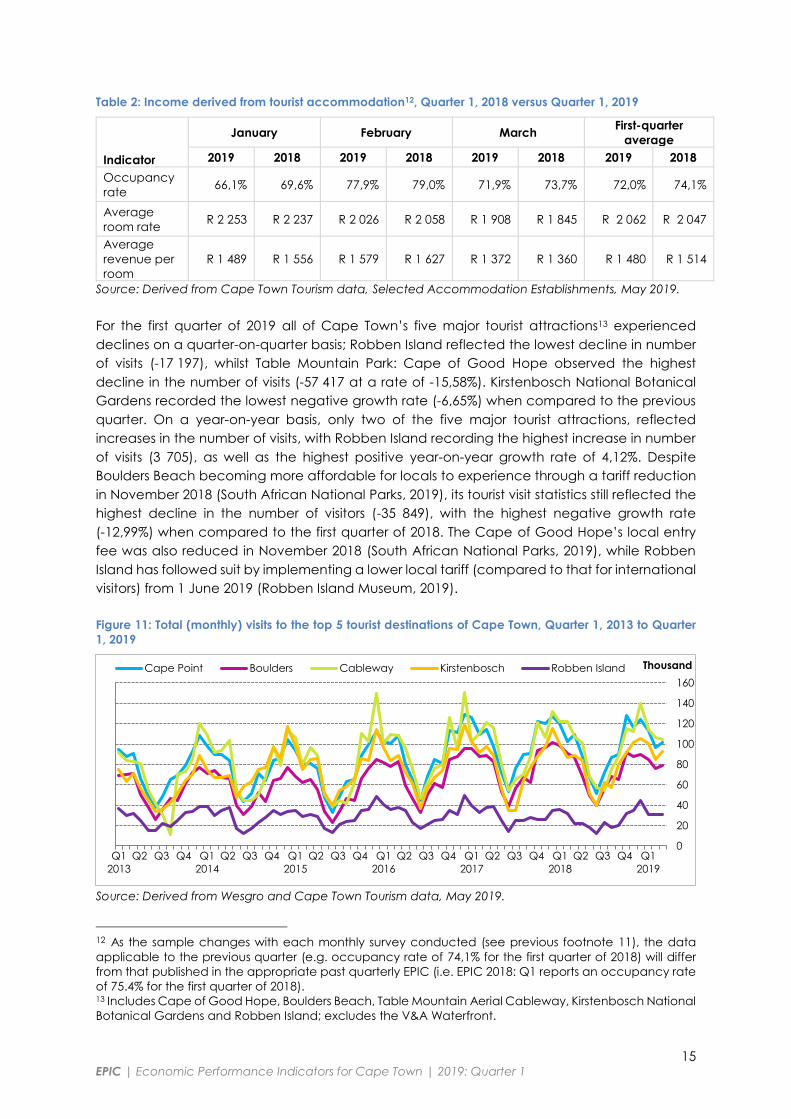
Table 2: Income derived from tourist accommodation12, Quarter 1, 2018 versus Quarter 1, 2019
Indicator
January February March First-quarter
average
2019 2018 2019 2018 2019 2018 2019 2018
Occupancy
rate 66,1% 69,6% 77,9% 79,0% 71,9% 73,7% 72,0% 74,1%
Average
room rate R 2 253 R 2 237 R 2 026 R 2 058 R 1 908 R 1 845 R 2 062 R 2 047
Average
revenue per
room
R 1 489 R 1 556 R 1 579 R 1 627 R 1 372 R 1 360 R 1 480 R 1 514
Source: Derived from Cape Town Tourism data, Selected Accommodation Establishments, May 2019.
For the first quarter of 2019 all of Cape Town’s five major tourist attractions13 experienced
declines on a quarter-on-quarter basis; Robben Island reflected the lowest decline in number
of visits (-17 197), whilst Table Mountain Park: Cape of Good Hope observed the highest
decline in the number of visits (-57 417 at a rate of -15,58%). Kirstenbosch National Botanical
Gardens recorded the lowest negative growth rate (-6,65%) when compared to the previous
quarter. On a year-on-year basis, only two of the five major tourist attractions, reflected
increases in the number of visits, with Robben Island recording the highest increase in number
of visits (3 705), as well as the highest positive year-on-year growth rate of 4,12%. Despite
Boulders Beach becoming more affordable for locals to experience through a tariff reduction
in November 2018 (South African National Parks, 2019), its tourist visit statistics still reflected the
highest decline in the number of visitors (-35 849), with the highest negative growth rate
(-12,99%) when compared to the first quarter of 2018. The Cape of Good Hope’s local entry
fee was also reduced in November 2018 (South African National Parks, 2019), while Robben
Island has followed suit by implementing a lower local tariff (compared to that for international
visitors) from 1 June 2019 (Robben Island Museum, 2019).
Figure 11: Total (monthly) visits to the top 5 tourist destinations of Cape Town, Quarter 1, 2013 to Quarter
1, 2019
Source: Derived from Wesgro and Cape Town Tourism data, May 2019.
12 As the sample changes with each monthly survey conducted (see previous footnote 11), the data
applicable to the previous quarter (e.g. occupancy rate of 74,1% for the first quarter of 2018) will differ
from that published in the appropriate past quarterly EPIC (i.e. EPIC 2018: Q1 reports an occupancy rate
of 75.4% for the first quarter of 2018). 13 Includes Cape of Good Hope, Boulders Beach, Table Mountain Aerial Cableway, Kirstenbosch National
Botanical Gardens and Robben Island; excludes the V&A Waterfront.
0
20
40
60
80
100
120
140
160
Q1
2013
Q2 Q3 Q4 Q1
2014
Q2 Q3 Q4 Q1
2015
Q2 Q3 Q4 Q1
2016
Q2 Q3 Q4 Q1
2017
Q2 Q3 Q4 Q1
2018
Q2 Q3 Q4 Q1
2019
ThousandCape Point Boulders Cableway Kirstenbosch Robben Island
16 EPIC | Economic Performance Indicators for Cape Town | 2019: Quarter 1
Figure 11 illustrates that Cape Town’s attractions are subject to strong seasonality, with peak
visitor activity occurring in the summer period from November to March. The lowest tourist visitor
numbers occur during the period May to July, which are Cape Town’s winter months. Overall,
total visits to the five major attractions decreased by 5,09% in the first quarter of 2019 compared
to the same period in 2018.
6. Additional Indicators
In addition to macroeconomic indicators, administrative data capture specific consumer
trends and provide strong indications of the performance of the local economy. In particular,
building plan statistics and property development are key indicators of the levels of
confidence in the economy, while passenger vehicle sales mirror trends in the business cycle
and are regarded as a leading indicator of GDP growth.
a. Building developments
The economic growth data for the first quarter of 2019 highlights that output at a national level
in the construction industry declined by 2,2% quarter-on-quarter - the sector’s third consecutive
quarter of negative growth. On a year-on-year basis the sector recorded its eighth
consecutive contraction (-0,8%). Mirroring national trends, the Western Cape’s construction
industry contracted by 2,3% quarter-on-quarter and 0,9% year-on-year in the first quarter of
2019 (Quantec, 2019). After dropping to 32 points in the fourth quarter of 2018, the First National
Bank (FNB)/BER composite Building Confidence Index (BCI)14 (BER, 2019b) declined by a further
7 points to record 25 index points in the first quarter of 2019, its lowest recording in nearly eight
years. According to the BER, the drop in the index was largely driven by the declining sentiment
among building material manufacturers and retailers of hardware. Despite the poorer index,
two of its six sub-sectors registered improved confidence levels, namely, the architects and
quantity surveyors sub-sectors.
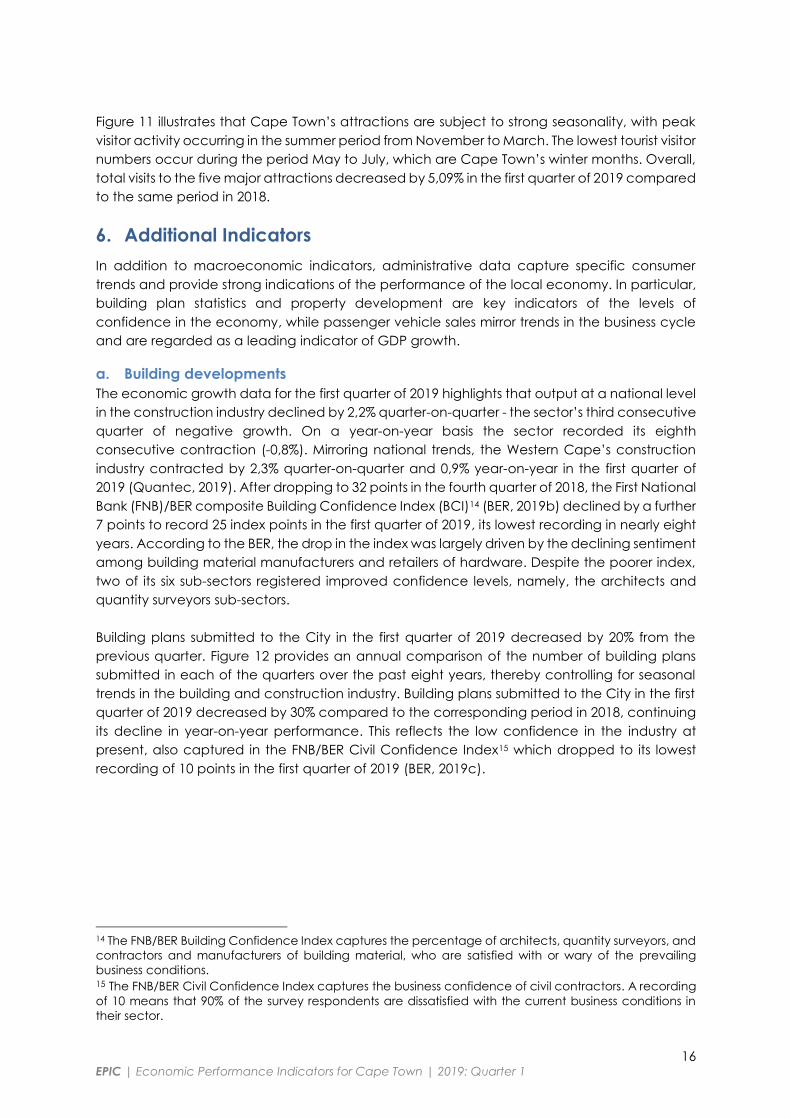
Building plans submitted to the City in the first quarter of 2019 decreased by 20% from the
previous quarter. Figure 12 provides an annual comparison of the number of building plans
submitted in each of the quarters over the past eight years, thereby controlling for seasonal
trends in the building and construction industry. Building plans submitted to the City in the first
quarter of 2019 decreased by 30% compared to the corresponding period in 2018, continuing
its decline in year-on-year performance. This reflects the low confidence in the industry at
present, also captured in the FNB/BER Civil Confidence Index15 which dropped to its lowest
recording of 10 points in the first quarter of 2019 (BER, 2019c).
14 The FNB/BER Building Confidence Index captures the percentage of architects, quantity surveyors, and
contractors and manufacturers of building material, who are satisfied with or wary of the prevailing
business conditions. 15 The FNB/BER Civil Confidence Index captures the business confidence of civil contractors. A recording
of 10 means that 90% of the survey respondents are dissatisfied with the current business conditions in
their sector.
17 EPIC | Economic Performance Indicators for Cape Town | 2019: Quarter 1
Figure 12: Building plans submitted to the City of Cape Town, 2012-2019
Source: Planning & Building Development Management Department, CCT, May 2019.
b. Commercial property developments
The performance of the commercial property market can be tracked in a number of ways. An
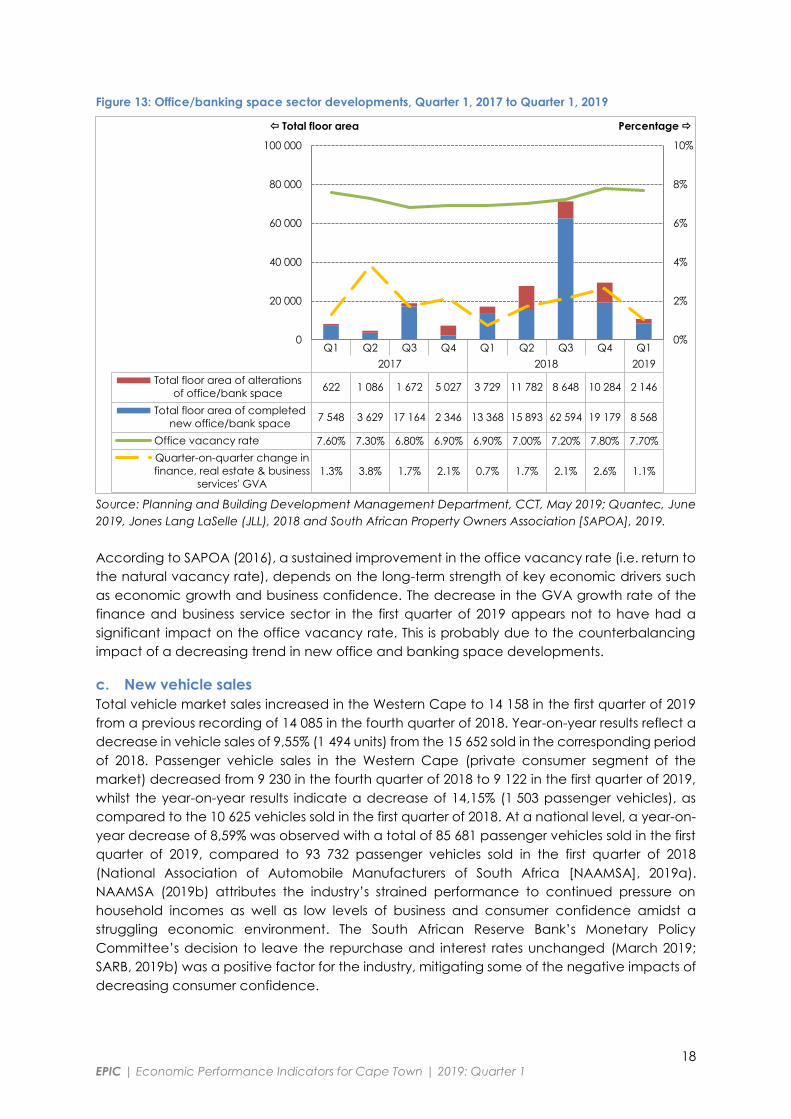
indicative trend analysis is provided in Figure 13 by review of: the observed variation in the
quarterly office vacancy rate; the total floor area of completed office buildings added to the
office property stock; the total floor area of completed office building alterations and the
quarter-on-quarter percentage change in provincial GVA for the finance and business
services sector. The finance, business and real estate services sector is the largest in Cape Town
and as such property developments in this sector are a useful measure of economic activity.
In the first quarter of 2019, construction of 8 568 m2 of new office or banking space was reported
to have been completed in Cape Town, as well as 2 146 m2 of office or banking space
alterations. In terms of new office or banking space for the first quarter of 2019, declines were
observed both a quarter-on-quarter and year-on-year basis. The quarter also marked the
lowest square meterage of new office or banking space completed since the fourth quarter
of 2016.
As Figure 13 shows, Cape Town’s office vacancy rate decreased by 0,1 of a percentage point
to 7,70% in the first quarter of 2019, and remains the lowest vacancy rate across the five largest
metropolitan municipalities (SAPOA, 2019). The lower office vacancy rate may be attributed
to the continued demand for office and banking space coupled with the low number of new
developments completed within the first quarter. However, developments planned to be
completed in the forthcoming quarters may put upward pressure on the vacancy rate.
6.0
6.0
6.6 6.8
6.3
7.7
7.2 7
.5
7.1
5.2
7.7 8
.0
6.6 6
.9
6.4
6.9
6.3
7.2
6.8
7.5
6.9
8.1
6.9
8.0
7.3
7.3
6.6
6.4
5.1
0
1
2
3
4
5
6
7
8
9
January-March (Q1) April-June (Q2) July-September (Q3) October-December (Q4)
Thousand2012 2013 2014 2015 2016 2017 2018 2019
18 EPIC | Economic Performance Indicators for Cape Town | 2019: Quarter 1
Figure 13: Office/banking space sector developments, Quarter 1, 2017 to Quarter 1, 2019
Source: Planning and Building Development Management Department, CCT, May 2019; Quantec, June
2019, Jones Lang LaSelle (JLL), 2018 and South African Property Owners Association [SAPOA], 2019.
According to SAPOA (2016), a sustained improvement in the office vacancy rate (i.e. return to
the natural vacancy rate), depends on the long-term strength of key economic drivers such
as economic growth and business confidence. The decrease in the GVA growth rate of the
finance and business service sector in the first quarter of 2019 appears not to have had a
significant impact on the office vacancy rate. This is probably due to the counterbalancing
impact of a decreasing trend in new office and banking space developments.
c. New vehicle sales
Total vehicle market sales increased in the Western Cape to 14 158 in the first quarter of 2019
from a previous recording of 14 085 in the fourth quarter of 2018. Year-on-year results reflect a
decrease in vehicle sales of 9,55% (1 494 units) from the 15 652 sold in the corresponding period
of 2018. Passenger vehicle sales in the Western Cape (private consumer segment of the
market) decreased from 9 230 in the fourth quarter of 2018 to 9 122 in the first quarter of 2019,
whilst the year-on-year results indicate a decrease of 14,15% (1 503 passenger vehicles), as
compared to the 10 625 vehicles sold in the first quarter of 2018. At a national level, a year-on-
year decrease of 8,59% was observed with a total of 85 681 passenger vehicles sold in the first
quarter of 2019, compared to 93 732 passenger vehicles sold in the first quarter of 2018
(National Association of Automobile Manufacturers of South Africa [NAAMSA], 2019a).
NAAMSA (2019b) attributes the industry’s strained performance to continued pressure on
household incomes as well as low levels of business and consumer confidence amidst a
struggling economic environment. The South African Reserve Bank’s Monetary Policy
Committee’s decision to leave the repurchase and interest rates unchanged (March 2019;
SARB, 2019b) was a positive factor for the industry, mitigating some of the negative impacts of
decreasing consumer confidence.
Q1 Q2 Q3 Q4 Q1 Q2 Q3 Q4 Q1
2017 2018 2019
Total floor area of alterations
of office/bank space622 1 086 1 672 5 027 3 729 11 782 8 648 10 284 2 146
Total floor area of completed
new office/bank space7 548 3 629 17 164 2 346 13 368 15 893 62 594 19 179 8 568
Office vacancy rate 7.60% 7.30% 6.80% 6.90% 6.90% 7.00% 7.20% 7.80% 7.70%
Quarter-on-quarter change in
finance, real estate & business
services' GVA1.3% 3.8% 1.7% 2.1% 0.7% 1.7% 2.1% 2.6% 1.1%
0%
2%
4%
6%
8%
10%
0
20 000
40 000
60 000
80 000
100 000
Percentage Total floor area
19 EPIC | Economic Performance Indicators for Cape Town | 2019: Quarter 1
Reference List
Airports Company South Africa (ACSA), 2019, Passenger movements.
Bureau for Economic Research (BER), 2019a, GDP comment: Another Q1 GDP shocker erases
hope of 1% growth in 2019, 4 June 2019.
Bureau for Economic Research (BER), 2019b, FNB/BER Building Confidence Index, Quarter 1,
2019.
Bureau for Economic Research (BER), 2019c, Construction, First quarter 2019.
BusinessTech, 2019, South African airports to get new e-gates – here’s what you need to know,
BusinessTech, 8 March 2019, Available:
https://businesstech.co.za/news/lifestyle/304336/south-african-airports-to-get-new-e-
gates-heres-what-you-need-to-know/, [2019, June 10].
Cape Town Tourism, 2019a, Accommodation Performance Review and Forecast Report,
January to March 2019.
Cape Town Tourism, 2019b, Highlights and Monthly Dashboards, January to March 2019.
City of Cape Town, 2019a, Cape Town Water Strategy, Available:
http://resource.capetown.gov.za/documentcentre/Documents/City%20strategies,%20
plans%20and%20frameworks/Cape%20Town%20Water%20Strategy.pdf, [2019, June 10].
City of Cape Town, 2019b, Water production and consumption, July 2012 to March 2019, Water
and Waste: Water and Sanitation Services Department.
City of Cape Town, 2019c, Building developments, January 2011 to March 2019, Spatial
Planning and Environment: Planning and Building Development Management
Department.
de Villiers, J., 2019, South Africa’s first ever e-visas are now available in New Zealand – visitors
can now print visas at home, Business Insider, 9 April 2019, Available:
https://www.businessinsider.co.za/south-africa-e-visas-implemented-new-zealand-
western-cape-tourism-numbers-climb-2019-4, [2019, May 16].
IHS Markit, 2019, Regional eXplorer.
Jones Lang LaSalle (JLL), 2018, Cape Town City Report, September 2018.
National Association of Automobile Manufacturers of South Africa (NAAMSA), 2019a, New
vehicle sales, January 2008 to March 2019.
National Association of Automobile Manufacturers of South Africa (NAAMSA), 2019b, Press
Release, 01 April 2019, Available: https://www.exportersec.co.za/wp-
content/uploads/2019/04/20190401-NAAMSA-March-2019-Sales-Stats-Press-
Release.pdf, [2019, May 28].
Pace, A., 2019, This is the cost to fly from Cape Town to New York, Cape Town Etc, 2 May 2019,
Available: https://www.capetownetc.com/news/this-is-the-cost-to-fly-from-cape-town-
to-new-york/, [2019, May 16].
Quantec, 2019, EasyData.
Robben Island Museum, (2019), Press release: Robben Island Museum introduces two-tier
pricing, Available: http://www.robben-island.org.za/files/press/Robben-Island-Museum-
Introduces-Two-Tier-Pricing-2019-Release.pdf [2019, May 28].
20 EPIC | Economic Performance Indicators for Cape Town | 2019: Quarter 1
South African National Parks (2019), Table Mountain National Park: Tariffs, Available:
https://www.sanparks.org/parks/table_mountain/tourism/tariffs.php [2019, May 28].
South African Property Owners Association (SAPOA), 2016, Office Vacancy Report, Q2 - June
2016.
South African Property Owners Association, 2019, Office Vacancy Report, April 2019.
South African Reserve Bank (SARB), 2019a, Statement of the Monetary Policy Committee, 23
May 2019.
South African Reserve Bank (SARB), 2019b, Statement of the Monetary Policy Committee, 28
March 2019.
Statistics South Africa, 2019, various publications.
The Automobile Association of South Africa, 2019, Fuel Pricing, Available:
https://www.aa.co.za/fuel-pricing, [2019, May 22].
Transnet National Ports Authority of South Africa, 2019, Transnet Port Terminals: Ports Statistics.
Wesgro, 2019, Cape Town attractions: January to March 2019.
Whitehouse, B., 2019, Maintenance Dredging Campaign Soon Underway at Duncan Dock in
the Port of Cape Town, Southern Africa Shipping News, 1 April 2019, Available:
http://www.sashippingnews.com/2019/04/01/maintenance-dredging-campaign-soon-
underway-at-duncan-dock-in-the-port-of-cape-town/, [2019, May 22].
Abbreviations
ACSA: Airports Company South Africa
BCI: Building Confidence Index
BER: Bureau for Economic Research
CCT/City: City of Cape Town
CPI: consumer price index
EPIC: Economic Performance Indicators for
Cape Town
e-gate: electronic gate
FNB: First National Bank
GDP: gross domestic product
GDP-R: regional gross domestic product
GGP: gross geographic product
GVA: gross value added
JLL: Jones Lang LaSalle
Ml: million litres
MPC: Monetary Policy Committee
NAAMSA: National Association of
Automobile Manufacturers of South Africa
PPI: producer price index
SAPOA: South African Property Owners
Association
SARB: South African Reserve Bank
TEU: twenty-foot equivalent unit
USD: United States dollar
V&A Waterfront: Victoria and Alfred
Waterfront