EPI Review- 2013 MOH Area:…………………………….. Background information 1-MOH area...
22
EPI Review- 2013 MOH Area:…………………………….
-
Upload
melvin-harrison -
Category
Documents
-
view
225 -
download
0
Transcript of EPI Review- 2013 MOH Area:…………………………….. Background information 1-MOH area...
EPI Review- 2013
MOH Area:…………………………….

Background information 1-MOH area
2-DPDHS area
3-Estimated Population for the year 2013
4-Actual Population for the year 2013
5-Reasons for differences in actual and estimated populations
6-Crude Birth Rate for District 2013
7-Crude Birth Rate for Province 2013
8-Estimated Number of Births in the year 2013
Based on the Actual Population
Based on the Estimated Population
District BR
Provincial BR
9-Number of Immunizations performed in the year 2013 (institutions and field) (Sum of relevant data from four Q/ EPI returns, 2013)
PVV1 PVV2 PVV3
10-Number of pregnant mothers registered for the area in 2013
11-Number of actual births reported for the area in 2013
12- Number of infants registered for the area in 2013
13-The most probable number of births for the MOH area*
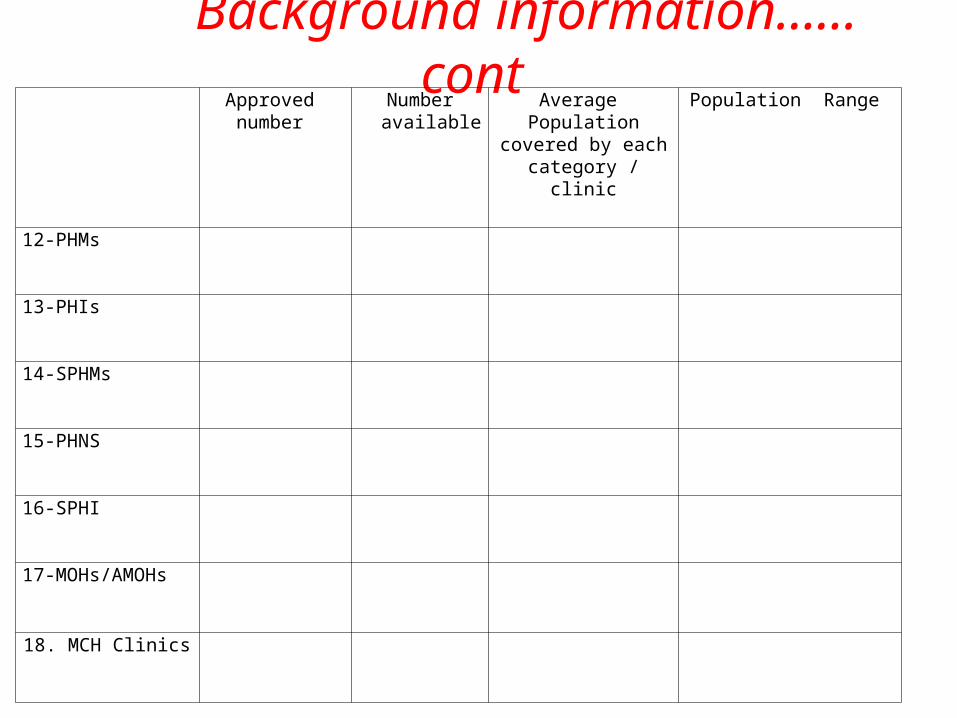
Background information……cont Approved number
Number available
Average Population covered by each category / clinic
Population Range
12-PHMs
13-PHIs
14-SPHMs
15-PHNS
16-SPHI
17-MOHs/AMOHs
18. MCH Clinics
Area Map indicating access to immunization(Please present a map indicating immunization clinics and population served by each clinic )

Coverage of BCG vaccination among infants born between 1st of January 2013 to 31st of December 2013 and the protection of their mothers from Tetanus and Rubella vaccination at the time of delivery
Number of registered infants under care*
(A)
A = (V+W+X) - (Y+-Z)
Number of infants born between 1st of January 2013 to 31st of December 2013
Registered within 3 months of birth
(V)****
Registered after 3 months of birth to date^^
(W)****
Came newly into the area & registered to date^^
(X)
Left the areato date^^
(Y)
Died to date^^
(Z)

Coverage of OPV1 /PVV 1 vaccination among infants born between 01st of November 2012 to 31st of October 2013
Number of registered infants under care*
(A)
A = (V+W+X) - (Y+-Z)
Number of infants born between 1st of November 2012 to 31st of October 2013
registered within 3 months of birth
(V)****
registered after 3 months of birth to
date^^
(W)****
came newly into the area registered to
date^^(X)
left the areato date^^
(Y)
Died to date^^
(Z)

Coverage of LJEV vaccination among infants born between 01st of April 2012 to 31st of March 2013
Number of registered infants under care*
(A)
A = (V+W+X) - (Y+-Z)
Number of infants born between 1st of April 2012 to 31st of March 2013
registered within 3 months of birth
(V)****
registered after 3 months of birth to
date^^
(W)****
came newly into the area registered to
date^^(X)
left the areato date^^
(Y)
Died to date^^
(Z)

Coverage of MMR1 vaccination among infants born between 1st of January 2012 to 31st of December 2012
Number of registered infants under care*
(A)
A = (V+W+X) - (Y+-Z)
Number of infants born between 1st of January 2012 to 31st of December 2013 registered within 3
months of birth
(V)****
registered after 3 months of birth to
date^^ (W)****
came newly into the area registered to
date^^(X)
left the areato date^^
(Y)
Died to date^^
(Z)

Coverage of DPT4/OPV4 vaccination among infants born between 1st of July 2011 to 30th June 2012
Number of registered infants under care*
(A)
A = (V+W+X) - (Y+-Z)
Number of infants born between 1st of January 2011 to 30th of June 2012 registered within 3
months of birth
(V)****
registered after 3 months of birth to date^^
(W)****
came newly into the area registered to
date^^(X)
left the areato date^^
(Y)
Died to date^^
(Z)

Coverage of MMR2 vaccination among infants born between 1st of January 2010 to 31st of December 2010
Number of registered infants under care*
(A)
A = (V+W+X) - (Y+-Z)
Number of infants born between 1st of January 2010 to 31st of December 2010registered within 3
months of birth
(V)****
registered after 3 months of birth to date^^
(W)****
came newly into the area registered to
date^^(X)
left the areato date^^
(Y)
Died to date^^
(Z)
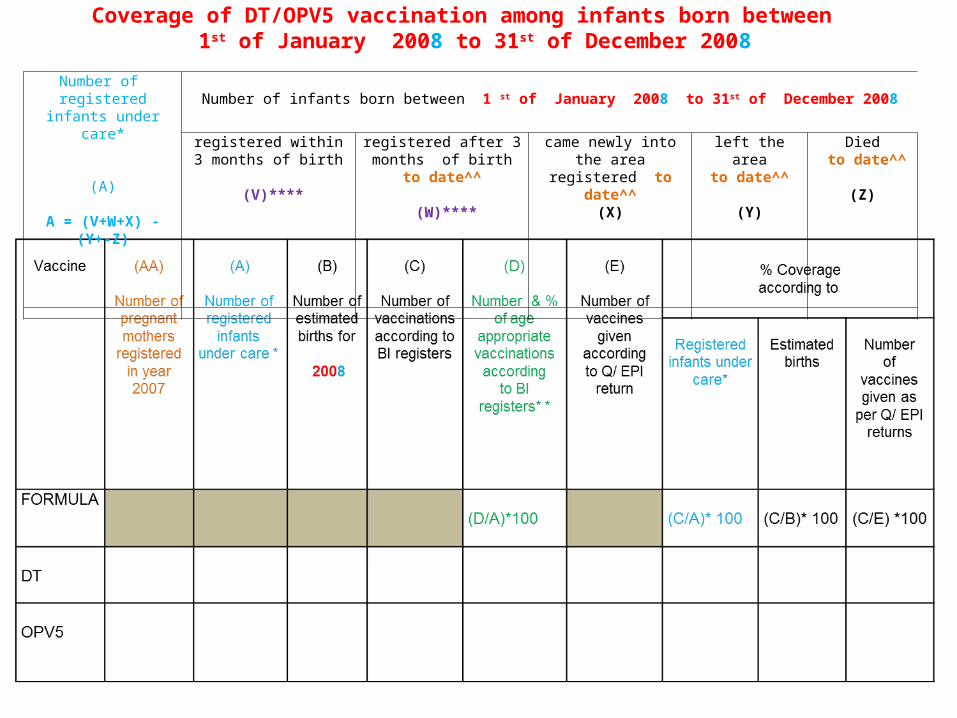
Coverage of DT/OPV5 vaccination among infants born between 1st of January 2008 to 31st of December 2008
Number of registered infants under care*
(A)
A = (V+W+X) - (Y+-Z)
Number of infants born between 1 st of January 2008 to 31st of December 2008registered within 3
months of birth
(V)****
registered after 3 months of birth to date^^
(W)****
came newly into the area registered to
date^^(X)
left the areato date^^
(Y)
Died to date^^
(Z)
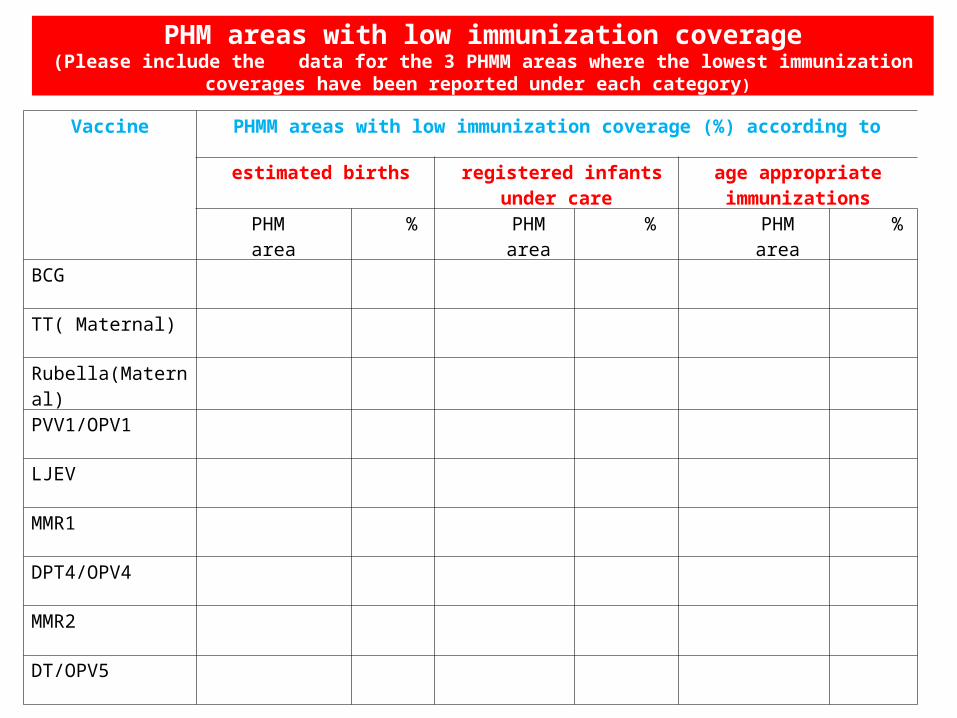
Vaccine PHMM areas with low immunization coverage (%) according to
estimated births registered infants under care age appropriate immunizations
PHM area % PHM area % PHM area %
BCG
TT( Maternal)
Rubella(Maternal)
PVV1/OPV1
LJEV
MMR1
DPT4/OPV4
MMR2
DT/OPV5
PHM areas with low immunization coverage(Please include the data for the 3 PHMM areas where the lowest immunization coverages have been reported
under each category)
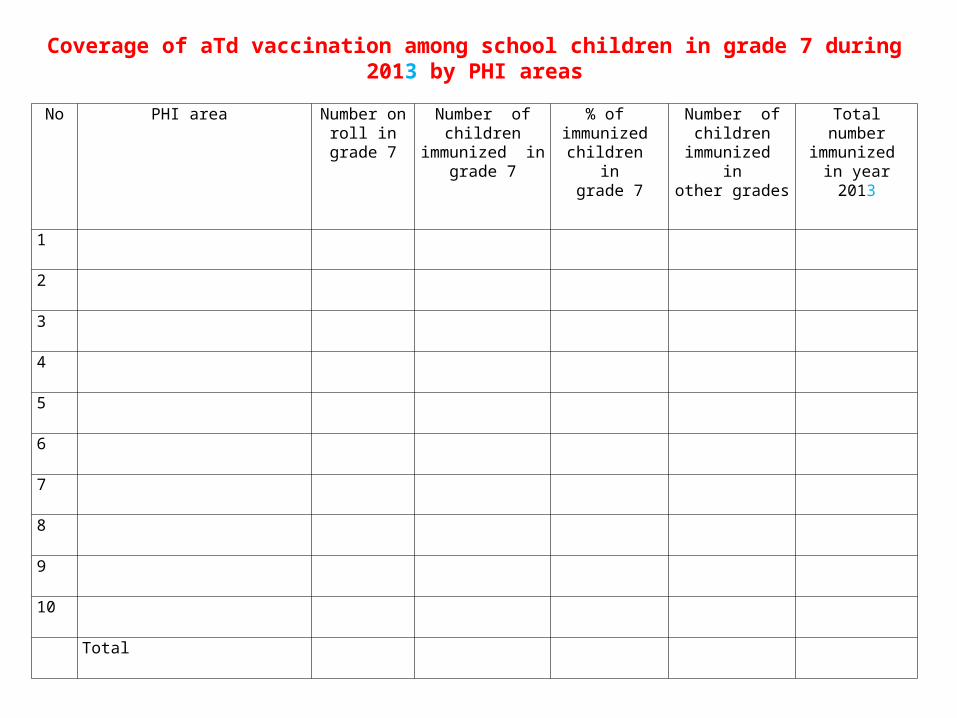
Coverage of aTd vaccination among school children in grade 7 during 2013 by PHI areas
No PHI area Number on roll in
grade 7
Number of children
immunized ingrade 7
% of immunized children in
grade 7
Number of children
immunized inother grades
Total number immunized in
year 2013
1
2
3
4
5
6
7
8
9
10
Total

Comparison of coverage’s of antigens according to the advancing birth cohorts

Number of immunizations performed and difference against the antigen which ever has the highest number of immunizations(PVV1, PVV2, PVV3) during infancy ( 1st year of life) in MOH area by antigen in 2013
Number of Immunizations Performed & Difference aginst DPT1Immunizations in MOH Division …………………………………., 2004
18,188
14565
18891 18640 18413 19,13618274
15,975 16,345
10,100
14,108
-703
-4326
-251 -478
245
-617
-2,916 -2,546
-8,791
-4,783
-10,000
-5,000
0
5,000
10,000
15,000
20,000
TT+ BCG DPT1 DPT2 DPT3 Measles DPT4 MR DT aTd Rub. 8-15
Antigen
Co
vera
ge
No. of Immunizations
Difference aginst DPT1
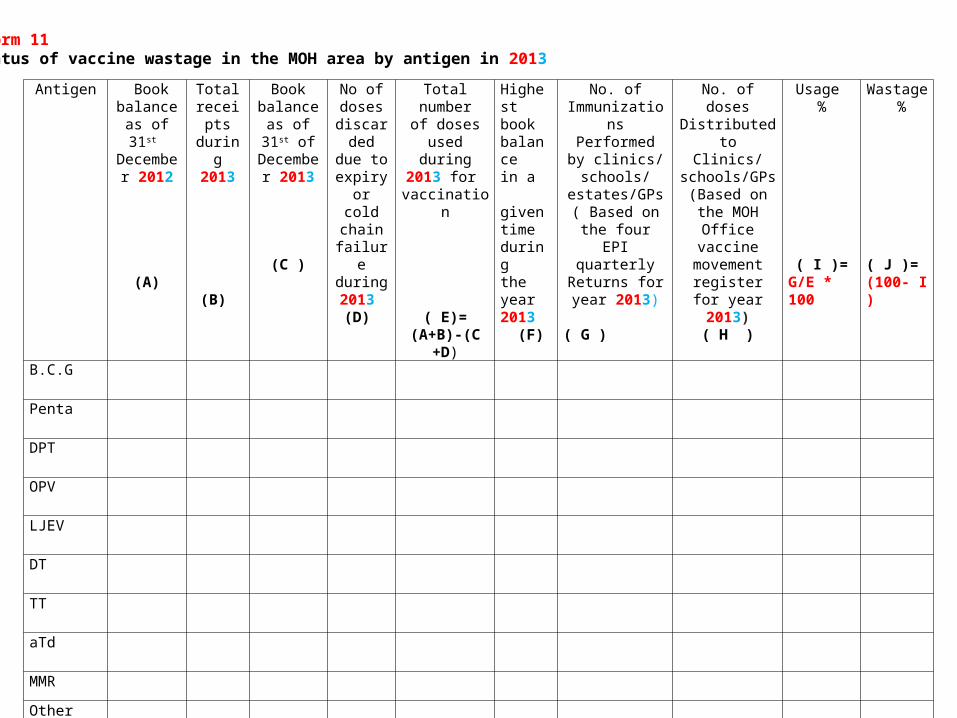
Antigen Book balance
as of 31st December
2012
(A)
Total receipts during 2013
(B)
Book balance as of 31st
of December
2013
(C )
No of doses
discarded due to expiry or
cold chain failure during 2013 (D)
Total number of doses
used during 2013 for
vaccination
( E)=(A+B)-(C +D)
Highest book balance in a given time during the year 2013 (F)
No. ofImmunizationsPerformed by
clinics/ schools/ estates/GPs
( Based on the four EPI quarterly
Returns for year 2013)
( G )
No. of dosesDistributed to
Clinics/schools/GPs
(Based on the MOH Office
vaccine movement register for year 2013)
( H )
Usage %
( I )=G/E * 100
Wastage %
( J )=(100- I )
B.C.G
Penta
DPT
OPV
LJEV
DT
TT
aTd
MMR
Other
Form 11 Status of vaccine wastage in the MOH area by antigen in 2013

Adverse events following immunization (A.E.F.I.)No. of Monthly AEFI Returns expected to be sent to the Epidemiological Unit during 2013 12
No. of Monthly AEFI Returns sent
No. of Monthly AEFI Returns sent in time
No of “Nil” returns sent
Type of AEFI Number Reported No Investigated % Investigated
Injection site abscess
BCG lymphadenitis
Severe local reactions
Encephalitis/Encephalopathy
Meningitis
Seizures (Febrile + Afebrile)
Anaphylaxis
Persistent Screaming
HHE
Types of AEFIs reported during 2013
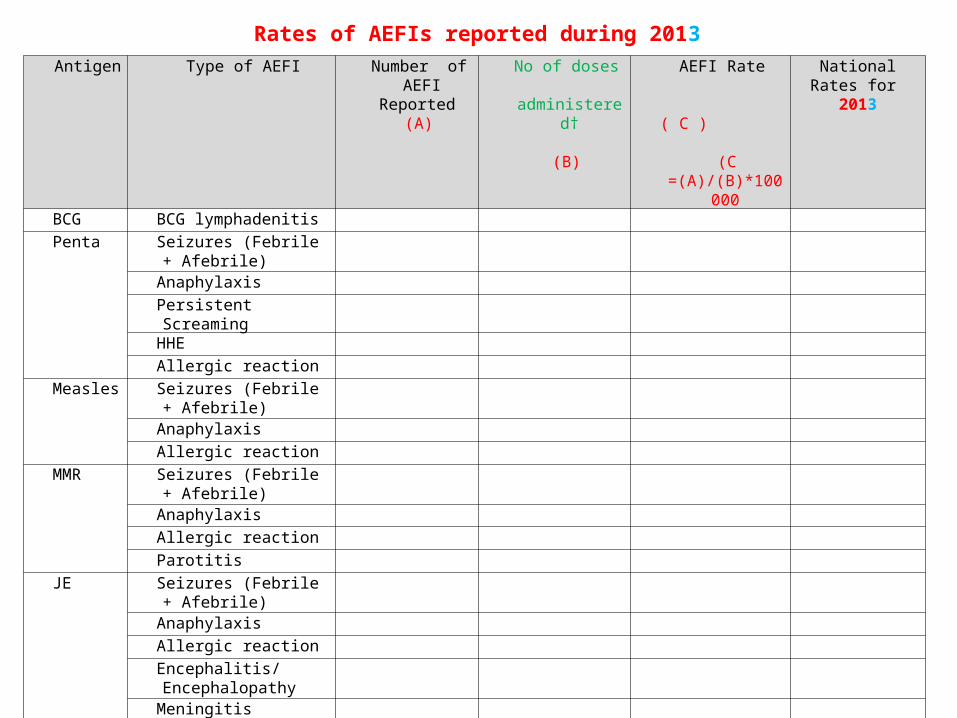
Antigen Type of AEFI Number of AEFI
Reported (A)
No of doses administered†
(B)
AEFI Rate
( C ) (C
=(A)/(B)*100000
National Rates for 2013
BCG BCG lymphadenitisPenta Seizures (Febrile +
Afebrile)AnaphylaxisPersistent ScreamingHHEAllergic reaction
Measles Seizures (Febrile + Afebrile)
AnaphylaxisAllergic reaction
MMR Seizures (Febrile + Afebrile)
AnaphylaxisAllergic reaction
ParotitisJE Seizures (Febrile +
Afebrile)AnaphylaxisAllergic reactionEncephalitis/Encephalopathy
MeningitisOther*
Rates of AEFIs reported during 2013
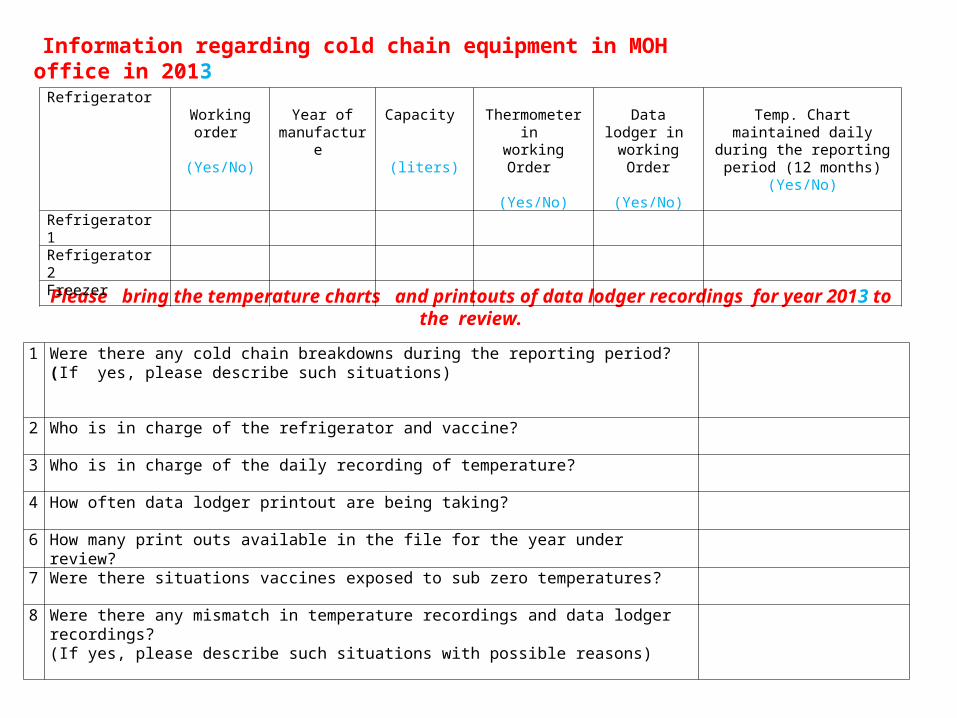
Information regarding cold chain equipment in MOH office in 2013
Please bring the temperature charts and printouts of data lodger recordings for year 2013 to the review.
Refrigerator Working order
(Yes/No)
Year of manufacture
Capacity
(liters)
Thermometer in working Order
(Yes/No)
Data lodger in working Order
(Yes/No)
Temp. Chart maintained daily during the reporting
period (12 months)(Yes/No)
Refrigerator 1
Refrigerator 2
Freezer
1 Were there any cold chain breakdowns during the reporting period?(If yes, please describe such situations)
2 Who is in charge of the refrigerator and vaccine?
3 Who is in charge of the daily recording of temperature?
4 How often data lodger printout are being taking?
6 How many print outs available in the file for the year under review?
7 Were there situations vaccines exposed to sub zero temperatures?
8 Were there any mismatch in temperature recordings and data lodger recordings?(If yes, please describe such situations with possible reasons)
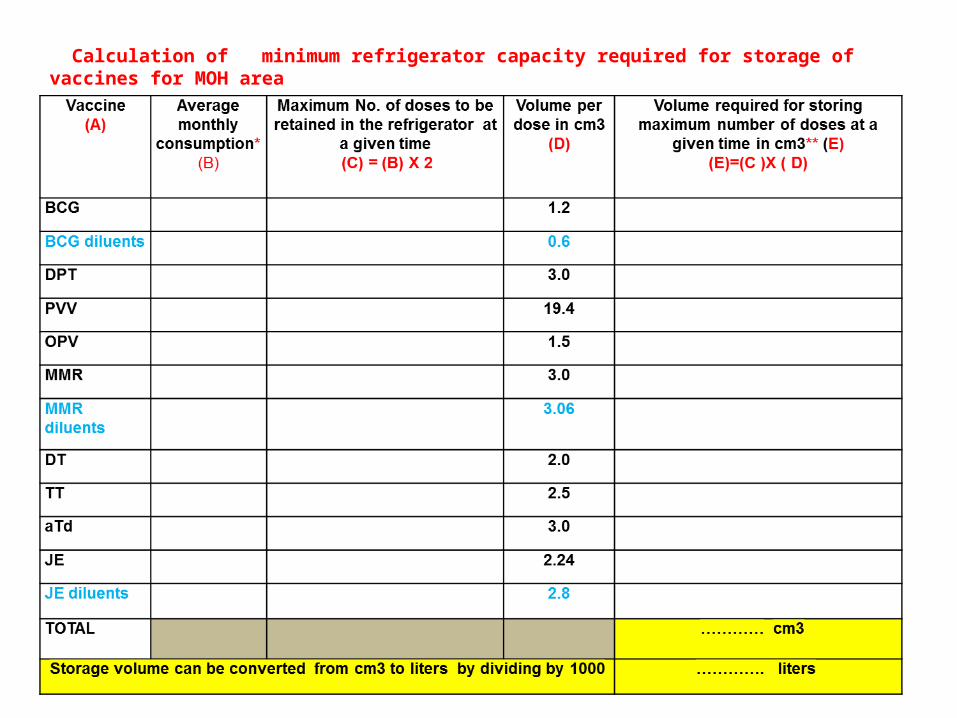
Calculation of minimum refrigerator capacity required for storage of vaccines for MOH area
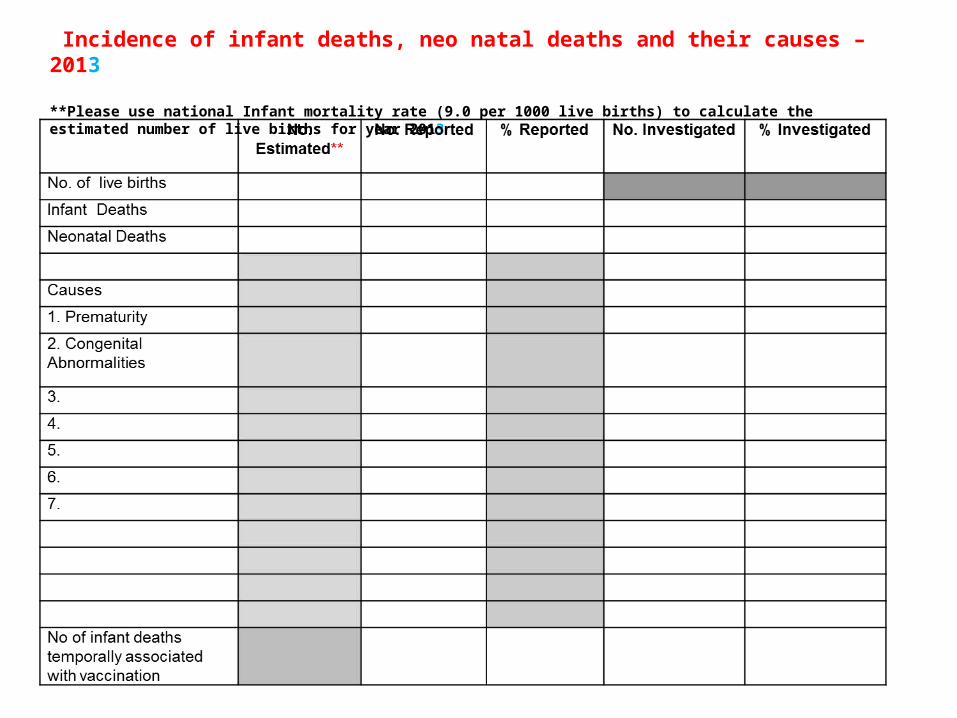
Incidence of infant deaths, neo natal deaths and their causes – 2013 **Please use national Infant mortality rate (9.0 per 1000 live births) to calculate the estimated number of live births for year 2013
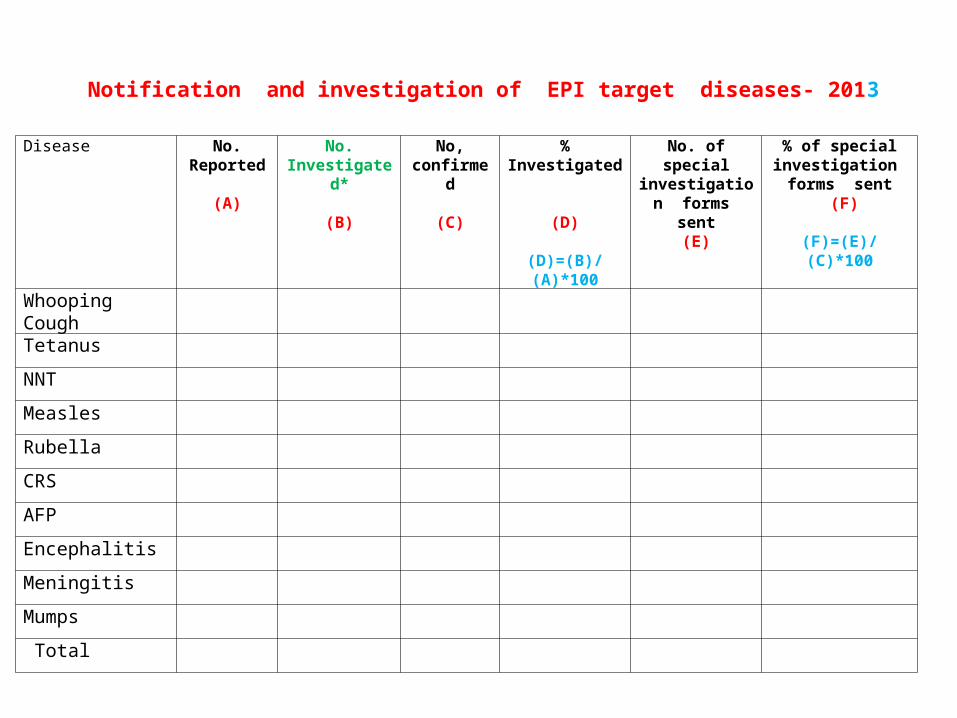
Notification and investigation of EPI target diseases- 2013
Disease No. Reported
(A)
No. Investigated*
(B)
No, confirmed
(C)
% Investigated
(D)
(D)=(B)/(A)*100
No. of special investigation forms sent
(E)
% of special investigation forms sent
(F)
(F)=(E)/(C)*100Whooping Cough
Tetanus
NNT
Measles
Rubella
CRS
AFP
Encephalitis
Meningitis
Mumps
Total