EPA’s Proposal to Repeal the Clean Power Plan: Benefits ...
23
EPA’s Proposal to Repeal the Clean Power Plan: Benefits and Costs Updated February 28, 2018 Congressional Research Service https://crsreports.congress.gov R45119
Transcript of EPA’s Proposal to Repeal the Clean Power Plan: Benefits ...

EPA’s Proposal to Repeal the Clean Power
Plan: Benefits and Costs
Updated February 28, 2018
Congressional Research Service
https://crsreports.congress.gov
R45119
EPA’s Proposal to Repeal the Clean Power Plan: Benefits and Costs
Congressional Research Service
Summary In 2015, when the U.S. Environmental Protection Agency (EPA) promulgated the Clean Power
Plan to reduce greenhouse gas emissions from fossil-fueled electric power plants, it concluded
that the benefits of reducing emissions would outweigh the costs by a substantial margin under
the scenarios analyzed. EPA estimated benefits ranging from $31 billion to $54 billion in 2030
and costs ranging from $5.1 billion to $8.4 billion in 2030, when the rule would be fully
implemented.
In proposing to repeal the rule in October 2017, EPA revised the estimates of both its benefits and
costs, finding in most cases that the benefits of the proposed repeal would outweigh the costs of
the proposed repeal. However, EPA found that under other assumptions, the costs of the proposed
repeal would outweigh the benefits of the proposed repeal. This report examines the changes in
EPA’s methodology that led to the revised conclusions about how benefits compare to costs.
Three changes to the benefits estimates of the proposed repeal drive the agency’s new
conclusions.
First, it considered only domestic benefits of the Clean Power Plan in its main
analysis, excluding benefits that occur outside the United States.
Second, it used different discount rates, including one higher rate, than the 2015
analysis to state the present value of future climate benefits expected from the
Clean Power Plan.
Third, the analysis reduced some estimates of the human health “co-benefits”—
that is, the benefits resulting from pollutant reductions not directly targeted by the
Clean Power Plan. Specifically, several scenarios assumed no health benefits
below specified thresholds for some air pollutants.
EPA also changed the accounting treatment of demand-side energy efficiency savings. EPA’s
2015 analysis treated savings from energy efficiency measures as a negative cost, whereas the
2017 analysis treated them as a benefit. Using the terminology of the proposed repeal, EPA
moved energy savings from the cost savings estimate to the forgone benefits estimate. There was
no change in the difference between benefits and costs because the benefits and costs increased
by the same amount. This change took on more significance in a separate analysis that EPA
conducted to analyze the cost savings of the proposed repeal.
EPA based one set of benefit-cost estimates of the proposed repeal on its 2015 power sector
modeling, which does not reflect changes that have since occurred in the power sector. EPA based
the other set of benefit-cost estimates on more recent power sector projections from the Annual
Energy Outlook 2017. The power sector changes subsequent to 2015 are potentially important
and include changes in expected electricity demand, expected growth in electricity generation by
renewable energy technologies, retirements of older generating units, changes in the prices and
availability of different fuels and renewables, and state and federal regulations. While modeling
differences render the two sets of estimates incomparable, both sets of estimates show a range of
costs exceeding benefits (i.e., net costs), and benefits exceeding costs (i.e., net benefits) of the
proposed repeal. EPA stated that it plans to update the power sector modeling and make it
available for public comment before it finalizes the proposed repeal. This forthcoming analysis
may show the extent to which updated power sector projections may change EPA’s benefit-cost
estimates.

EPA’s Proposal to Repeal the Clean Power Plan: Benefits and Costs
Congressional Research Service
Contents
Introduction ..................................................................................................................................... 1
Background on Regulatory Analysis Requirements ........................................................................ 2
Overview of 2015 Regulatory Analysis .................................................................................... 3 Overview of the 2017 Proposed Repeal .................................................................................... 5
Comparing the 2015 and 2017 Benefit-Cost Analyses .................................................................... 6
What Changed in EPA’s 2017 Benefit-Cost Analysis ..................................................................... 8
New SCC Values Lower Estimates of the Climate Benefits ..................................................... 8 EPA Develops Domestic SCC Values and Uses Higher Discount Rate ............................ 10 Climate Benefit Estimates Lower in 2017 Analysis ......................................................... 14
Thresholds Reduced Some Human Health Co-Benefit Estimates .......................................... 15 Benefits Estimate for the “Targeted Pollutant” Excluded Health Co-Benefits ................. 15 Two Thresholds Used to Adjust Forgone Health Co-Benefits .......................................... 16
Change in the Accounting Treatment of Energy Savings Impacts .......................................... 18
Concluding Observations .............................................................................................................. 18
Tables
Table 1. CPP and Proposed CPP Repeal: Estimated Net Impacts ................................................... 7
Table 2. Estimated Climate Impacts Under CPP and Proposed CPP Repeal ................................ 14
Contacts
Author Information ....................................................................................................................... 20

EPA’s Proposal to Repeal the Clean Power Plan: Benefits and Costs
Congressional Research Service R45119 · VERSION 3 · UPDATED 1
Introduction In October 2017, the U.S. Environmental Protection Agency (EPA) proposed to repeal the Clean
Power Plan (CPP),1 a rule that the agency had finalized in 2015 to limit carbon dioxide (CO2)
emissions from existing fossil-fuel-fired power plants. The CPP has been controversial since its
inception, was quickly litigated, and has not gone into effect due to a stay issued by the Supreme
Court in February 2016.2 Disagreements about the CPP have centered on the rule’s legal
justification, design, and scope.3 In addition, stakeholders have disagreed about whether the rule’s
benefits would outweigh the costs.
Under the authority of the Clean Air Act Section 111(d),4 the CPP established national CO2
emission rates measured in pounds of CO2 per megawatt-hour (MWh) of electricity generation
for existing fossil-fuel-fired power plants. Based on these national emission rates, EPA calculated
state-specific goals and gave states two compliance choices. States could demonstrate compliance
through either a “rate-based” approach, under which it would implement measures to achieve a
statewide emissions rate goal, or a “mass-based” approach, under which the state would
implement measures to achieve a statewide total emissions goal.5 This formulation, along with
other options, allowed states flexibility in how to achieve the standards while minimizing costs or
meeting other objectives. The emission reductions achieved would depend on how states chose to
comply with the rule and other factors, such as the fuel source used and quantity of electricity
generated.
Given that the CPP qualified as an economically significant regulatory action, EPA provided a
regulatory analysis of it in 2015 that analyzed the benefits and costs. In this analysis, EPA
projected a 32% reduction in total power sector CO2 emissions nationwide by the time the rule
was fully implemented in 2030.6
The proposed repeal of the CPP marks a significant change from the previous Administration’s
stance on its policy and legal issues. EPA based the proposed repeal on a change in the agency’s
interpretation of the authority it has under Section 111(d) of the Clean Air Act (42 U.S.C.
§7411(d)). Under the current Administration, EPA determined that the CPP exceeds the legal
authority under Section 111(d) by setting CO2 emission goals for existing power plants that could
1 For the proposed repeal, see EPA, “Repeal of Carbon Pollution Emission Guidelines for Existing Stationary Sources:
Electric Utility Generating Units; Proposed Rule,” 82 Federal Register 48035, October 16, 2017.
2 For more detail about the legal aspects of EPA’s proposed repeal as well as CPP litigation, see CRS Legal Sidebar
LSB10016, EPA Proposes to Repeal the Clean Power Plan, by Linda Tsang and CRS Report R44480, Clean Power
Plan: Legal Background and Pending Litigation in West Virginia v. EPA, by Linda Tsang and Alexandra M. Wyatt.
3 CRS Report R44341, EPA’s Clean Power Plan for Existing Power Plants: Frequently Asked Questions, by James E.
McCarthy et al.
4 42 U.S.C. §7411(d).
5 EPA, “Carbon Pollution Emission Guidelines for Existing Stationary Sources: Electric Utility Generating Units; Final
Rule,” 80 Federal Register 64665, October 23, 2015. See also CRS Report R44145, EPA’s Clean Power Plan:
Highlights of the Final Rule, by Jonathan L. Ramseur and James E. McCarthy.
6 EPA projected CO2 emissions in the baseline scenario (i.e., without the CPP) as a 16% reduction by 2030 compared
to 2005 levels. According to EPA’s analysis, the CO2 reductions achieved in 2030 would represent a 32% reduction in
power sector CO2 emissions compared to 2005 levels. EPA, “Carbon Pollution Emission Guidelines for Existing
Stationary Sources.” See also CRS Report R44341, EPA’s Clean Power Plan for Existing Power Plants: Frequently
Asked Questions, by James E. McCarthy et al.

EPA’s Proposal to Repeal the Clean Power Plan: Benefits and Costs
Congressional Research Service R45119 · VERSION 3 · UPDATED 2
“only realistically be” achieved using measures “that cannot be employed to, for, or at a particular
source”7—that is, a location some characterize as “outside the fence line” of the power plants.
The agency also estimated the benefits and costs of the proposed repeal because it qualified as an
economically significant regulatory action. Under the Trump EPA’s current legal interpretation—
that EPA lacked statutory authority to promulgate the CPP in 2015—the benefits and costs are not
germane to the decision about the proposed repeal. The benefit-cost analysis of the proposed
repeal is nonetheless consequential because it reveals methodological changes relative to EPA’s
2015 analysis. Such changes, which are discussed in this report, may influence the way EPA
estimates benefits and costs of other proposed regulations.
Members of Congress may have an interest in understanding EPA’s analysis of the proposed
repeal, in particular how some of the agency’s 2017 benefit-cost comparisons differ from those in
the 2015 analysis. A group of 19 Senators submitted a letter to EPA requesting more information
about the benefit-cost analysis for the proposed repeal, including about changes in the way the
agency estimated benefits and costs relative to the analysis conducted in 2015 for the final CPP
rule.8 Some of the changes in EPA’s 2017 analysis may set a precedent for the way federal
agencies account for climate benefits and human health benefits when developing regulations to
limit greenhouse gases (GHGs) or conventional pollutants, such as particulate matter.
This report summarizes the analysis that EPA conducted of the CPP’s impacts as part of its
proposed repeal. The report also identifies how the economic analysis of the 2017 proposed
repeal differs from the approach that EPA used in developing the 2015 CPP final rule. The first
section provides background on the regulatory analysis requirements for executive branch
agencies, an overview of EPA’s 2015 analysis, and a summary of the agency’s 2017 analysis. The
next section compares the conclusions of EPA’s 2015 and 2017 benefit-cost analyses. The report
then describes three primary changes in the 2017 analysis—namely, the estimation of climate
benefits, consideration of human health co-benefits, and the accounting treatment of energy
savings impact—and finishes with concluding observations. For details about EPA’s rationale for
the proposed repeal, see CRS Report R44992, Reconsidering the Clean Power Plan, by James E.
McCarthy; for details about the legal aspects of the proposed repeal, see CRS Legal Sidebar
LSB10016, EPA Proposes to Repeal the Clean Power Plan, by Linda Tsang.
Background on Regulatory Analysis Requirements EPA prepares benefit-cost analyses for significant regulatory actions, such as the CPP, in
accordance with Executive Order (E.O.) 12866 and Office of Management and Budget (OMB)
Circular A-4.9 Issued in 1993, E.O. 12866 replaced regulatory analysis directives from prior
Administrations with similar but not identical requirements. The analytical principles and
requirements for the development and review of federal regulations outlined in E.O. 12866
remain in effect today.10
7 EPA, “Repeal of Carbon Pollution Emission Guidelines for Existing Stationary Sources.”
8 U.S. Senator Tom Carper et al., letter to Honorable Scott Pruitt, Administrator, EPA, October 26, 2017,
https://www.epw.senate.gov/public/index.cfm/2017/10/senate-democrats-to-epa-show-your-work-on-clean-power-
plan-repeal.
9 Federal agencies must comply with a set of regulatory analytical requirements that have been “established
incrementally during the last 40 to 50 years through a series of presidential and congressional initiatives, including
statutes, executive orders, circulars, and other documents.” See CRS Report R41974, Cost-Benefit and Other Analysis
Requirements in the Rulemaking Process, coordinated by Maeve P. Carey.
10 Presidents have required agencies to conduct some form of regulatory analysis prior to rule promulgation since 1971.

EPA’s Proposal to Repeal the Clean Power Plan: Benefits and Costs
Congressional Research Service R45119 · VERSION 3 · UPDATED 3
In particular, E.O. 12866 directs federal agencies to examine the benefits and costs of significant
regulatory actions and ensure that the benefits justify the costs. It defines significant regulatory
actions as rules that meet any one of the following four conditions:
1. It would have an annual impact on the economy of $100 million or more;
2. It would “create a serious inconsistency or otherwise interfere with” other agency
actions;
3. It would “materially alter the budget impact of entitlements, grants, user fees, or
loan programs or the rights and obligations of recipients thereof;” or
4. It would “raise novel legal or policy issues.”11
Rules that meet the first condition are considered to be economically significant and are required
to have a more detailed regulatory analysis. Whereas E.O. 12866 articulates the principles for
regulatory analysis and the overarching requirements, a 2003 guidance document, “OMB Circular
A-4,” elaborates on what constitutes a “good regulatory analysis” and how to develop one. OMB
Circular A-4 defines a good regulatory analysis as one that (1) explicitly states the need for the
proposed regulatory action, (2) analyzes alternative approaches to the proposed regulatory option,
and (3) assesses the benefits and costs.12 The circular describes best practices and aims to
standardize the measurement and reporting of benefits and costs of economically significant
regulatory actions across federal agencies.
Consistent with E.O. 12866, OMB Circular A-4 notes that good regulatory analysis informs
consideration of whether benefits of an action “are likely to justify the costs.”13 The “justify”
criterion does not require monetized benefits to outweigh monetized costs. E.O. 12866 and
Circular A-4 recognize that quantified benefit and cost estimates may not capture all of the
anticipated benefits and costs of a regulatory proposal, because it is difficult to quantify some
impacts.14 While Circular A-4 directs agencies to quantify the benefits and costs of economically
significant regulations “whenever possible” by applying “sound and defensible values or
procedures,”15 it also directs analysts to identify which non-quantified impacts “are of sufficient
importance to justify consideration in the regulatory decision.”16
Overview of 2015 Regulatory Analysis
When it promulgated the CPP in 2015, EPA determined that the rulemaking was economically
significant and therefore prepared a regulatory analysis in accordance with E.O. 12866, OMB
Circular A-4, and the agency’s Guidelines for Preparing Economic Analyses.17 EPA calculated
For a summary of the history of the development of regulatory requirements, see CRS Report R41974, Cost-Benefit
and Other Analysis Requirements in the Rulemaking Process, coordinated by Maeve P. Carey.
11 E.O. 12866 §3(f), “Regulatory Planning and Review,” 58 Federal Register 51735, October 4, 1993.
12 OMB Circular A-4, “Regulatory Analysis,” September 17, 2003, see p. 2.
13 OMB Circular A-4, p. 2.
14 E.O. 12866 §(1)(b)(6), “Regulatory Planning and Review.”
15 OMB Circular A-4, p. 27.
16 OMB Circular A-4, p. 10.
17 EPA developed Guidelines for Preparing Economic Analyses to ensure that the agency’s economic analyses inform
the policymaking process and meet requirements set forth in relevant executive orders and guidance documents,
including E.O. 12866 and OMB Circular A-4. See National Center for Environmental Economics, Guidelines for
Preparing Economic Analyses, U.S. Environmental Protection Agency, Washington, DC, May 2014,
https://www.epa.gov/environmental-economics/guidelines-preparing-economic-analyses. EPA also noted that the
regulatory analysis served as the economic assessment required by Clean Air Act Section 317. U.S. Environmental

EPA’s Proposal to Repeal the Clean Power Plan: Benefits and Costs
Congressional Research Service R45119 · VERSION 3 · UPDATED 4
state-specific emission rate goals (pounds CO2 per megawatt hour [MWh]) for the rate-based
scenario and state-specific emission goals (tons of CO2) for the mass-based scenario.18 EPA
characterized these scenarios as illustrative in nature, noting that states could implement the CPP
in a variety of ways. EPA emphasized that while the impacts estimated under the two illustrative
scenarios were not “definitive,” the analysis nonetheless represented “EPA’s best assessment of
likely impacts of the CPP under a range of approaches that states may adopt.”19
EPA estimated emission reductions and associated compliance costs under the two scenarios
using the Integrated Planning Model (IPM), a detailed model of the U.S. power sector.20 EPA
reported compliance costs as the “projected additional cost of complying with” the CPP in a given
year. According to EPA, the compliance cost estimates were based on the
net change in the annualized cost of capital investment in new generating sources and heat
rate improvements at coal-fired steam generating units, the change in the ongoing costs of
operating pollution controls, shifts between or amongst various fuels, demand-side energy
efficiency measures, and other actions associated with compliance.21
These estimates also included the expected costs for monitoring, reporting, and recordkeeping.
EPA expected the CPP to reduce CO2 emissions as well as non-GHG emissions (sulfur dioxide
[SO2], nitrogen oxides [NOx], and directly emitted fine particulate matter [PM]). EPA used the
IPM model to estimate the reduction in CO2 emissions and then applied the social cost of carbon
(SCC) to estimate the economic value of the associated climate benefits.22 The SCC is an estimate
of the monetary value of impacts associated with changes in CO2 emissions in a given year. It
includes net changes in agricultural productivity, property damage from increased flood risk, and
changes in energy system costs, such as reduced costs for heating and increased costs for air
conditioning.23
EPA also estimated the human health benefits of reductions from non-GHG emissions and
referred to them as “co-benefits” because the CPP did not directly target those emissions.
Specifically, EPA quantified the expected reductions in SO2 and NOx emissions—precursor
emissions that contribute to the formation of PM and ozone.24 EPA then monetized the human
Protection Agency, Regulatory Impact Analysis for the Clean Power Plan Final Rule, October 23, 2015, p. 1-4, at
https://www.regulations.gov/document?D=EPA-HQ-OAR-2013-0602-37105 (hereinafter, “2015 RIA”).
18 For additional explanation and examples of how EPA developed the scenarios, see CRS Report R44341, EPA’s
Clean Power Plan for Existing Power Plants: Frequently Asked Questions, by James E. McCarthy et al.
19 2015 RIA, p. ES-3.
20 Developed by ICF International, IPM projects the economic and environmental impacts of prospective air pollution
policies. It projects emission control strategies that the power sector could employ “while meeting energy demand and
environmental, transmission, dispatch, and reliability constraints,” 2015 RIA, p. 109.
21 2015 RIA, p. ES-9.
22 For the SCC estimates, see Interagency Working Group (IWG) on Social Cost of Carbon, with participation by
Council of Economic Advisers, Council on Environmental Quality, Department of Agriculture, Department of
Commerce, Department of Energy, Department of Transportation, Domestic Policy Council, Environmental Protection
Agency, National Economic Council, Office of Management and Budget, Office of Science and Technology Policy,
and Department of the Treasury, “Technical Support Document: Technical Update of the Social Cost of Carbon for
Regulatory Impact Analysis Under Executive Order 12866,” May 2013 (revised July 2015),
https://obamawhitehouse.archives.gov/sites/default/files/omb/inforeg/scc-tsd-final-july-2015.pdf.
23 For more information about the SCC, see CRS In Focus IF10625, Social Costs of Carbon/Greenhouse Gases: Issues
for Congress, by Jane A. Leggett.
24 In this report, PM refers to fine particulate matter. EPA expected the CPP final rule to achieve reductions in directly
emitted PM but was not able to quantify those reductions. See 2015 RIA, p. ES-6.

EPA’s Proposal to Repeal the Clean Power Plan: Benefits and Costs
Congressional Research Service R45119 · VERSION 3 · UPDATED 5
health benefits expected from reduced exposure to PM and ozone by using a “benefit-per-ton”
approach for PM and for ozone. Generally speaking, the benefit-per-ton is an estimate of the
average dollar value of human health benefits associated with the reduction of one ton of a
pollutant.25 EPA calculated an average benefit-per-ton estimate in three different regions (Eastern
United States, Western United States, and California) for the CPP analysis. These estimates
represented the value of reductions in premature deaths and illnesses, such as non-fatal heart
attacks and asthma, associated with exposure to PM and ozone.26
PM health effects accounted for most of the monetized health co-benefits estimates. Nearly all of
the monetized PM health co-benefit estimates—98%—were from reductions in premature deaths
related to PM exposure. Also, most of the value of estimated PM health co-benefits came from
SO2 emission reductions. For example, the monetized health co-benefits for reductions in SO2—
as a precursor to PM—accounted for roughly 80-85% of the estimated dollar value of human
health co-benefits in the scenarios analyzed for 2030.27 Ozone health effects accounted for a
smaller share of the monetized health co-benefits—roughly 6-12% of the estimated dollar value
of human health co-benefits in the scenarios analyzed for year 2030.28
Overview of the 2017 Proposed Repeal
Two years after finalizing the CPP under the Obama Administration, EPA, under the Trump
Administration, proposed to repeal the CPP and began the same rulemaking process it had used to
promulgate the CPP. Clean Air Act Section 307(d) requires EPA to adhere to the same rulemaking
process regardless of whether the agency promulgates, revises, or repeals a rulemaking.29 The
Clean Air Act Section 307(d) requirements most relevant to the regulatory analysis are
summarizing the data serving as the basis for the repeal and specifying the methodology used to
obtain and analyze the data. While EPA based the proposed repeal on a change in its legal
interpretation of Section 111(d) of the Clean Air Act, the agency revisited the 2015 CPP
regulatory analysis, because the proposed repeal qualified as an economically significant
regulatory action. Therefore, EPA prepared a regulatory analysis in accordance with E.O. 12866,
OMB Circular A-4, and the agency’s Guidelines for Preparing Economic Analyses.30
25 EPA has used this approach in other regulatory analyses. For example, EPA used benefit-per-ton estimates in (1)
EPA, Regulatory Impact Analysis: Final Rulemaking for 2017-2025 Light-Duty Vehicle Greenhouse Gas Emission
Standards and Corporate Average Fuel Economy Standards, EPA-420-R-12-016, August 2012, https://nepis.epa.gov/
Exe/ZyPDF.cgi/P100EZI1.PDF?Dockey=P100EZI1.PDF; and (2) EPA, Regulatory Impact Analysis of the Cross-State
Air Pollution Rule (CSAPR) Update for the 2008 National Ambient Air Quality Standards for Ground-Level Ozone,
EPA-452-R-16-004, September 2016, https://www3.epa.gov/ttn/ecas/docs/ria/transport_ria_final-csapr-update_2016-
09.pdf.
26 Reductions in non-fatal heart attacks are estimated based on reduced exposure to PM. The asthma-related impacts
associated with exposure to PM are based on exacerbation of asthma symptoms in individuals with asthma. The
monetized ozone impacts account for emergency room visits for asthma. See 2015 RIA, Table ES-6, for a complete list
of the human health impacts considered.
27 This range is based on a 3% discount rate. The percentage varies by illustrative scenario (rate-based versus mass-
based) and benefit-per-ton value used. See 2015 RIA, Table 4-18 and Table 4-21. For similar estimates in year 2025,
see 2015 RIA, Figure 4-2, p. 4-36.
28 This range is based on a 3% discount rate. The percentage varies by illustrative scenario (rate-based versus mass-
based) and benefit-per-ton value used. See 2015 RIA, Table 4-18 and Table 4-21. For similar estimates in year 2025,
see 2015 RIA, Figure 4-2, p. 4-36.
29 For more information about procedural requirements, see CRS Report R44341, EPA’s Clean Power Plan for Existing
Power Plants: Frequently Asked Questions, by James E. McCarthy et al., pp. 40-41.
30 EPA also noted that the regulatory analysis serves as the economic assessment required by Clean Air Act Section
317. EPA, Regulatory Impact Analysis for the Review of the Clean Power Plan: Proposal, October 2017 (hereinafter

EPA’s Proposal to Repeal the Clean Power Plan: Benefits and Costs
Congressional Research Service R45119 · VERSION 3 · UPDATED 6
Broadly speaking, the benefits of repealing a rulemaking are the avoided costs that would have
been incurred through implementing the rule; the costs of the repeal are the forgone benefits that
would have resulted from implementing the rule. EPA defined the benefits of the proposed CPP
repeal as the “avoided compliance costs”—that is, the compliance costs that would have been
incurred to implement the CPP. EPA also refers to this category as “cost savings.” Likewise, EPA
defined the costs of the proposed CPP repeal as the forgone reductions in CO2 and non-GHG
emissions and the associated forgone climate benefits and health co-benefits, respectively.
EPA did not conduct new power sector modeling for the 2017 analysis but used two existing
power sector projections to estimate two sets of the benefits and costs of the proposed repeal. EPA
stated that it “plans to do updated modeling” using IPM, making it available for public comment
before it finalizes the proposed repeal.31
The first set of benefit-cost estimates was based on the power sector modeling EPA conducted
using IPM for the rule in 2015. Specifically, EPA used the 2015 power sector modeling results—
estimated compliance costs and estimated reductions in CO2, SO2, and NOx emissions under the
mass-based and rate-based scenarios—as the starting point to monetize the avoided compliance
costs and forgone benefits of the proposed repeal.
The second set of benefit-cost estimates was based on more recent power sector projections
published in the U.S. Energy Information Administration’s (EIA) Annual Energy Outlook (AEO)
2017. Specifically, EPA used the AEO 2017 results—estimated compliance costs and estimated
reductions in CO2, SO2, and NOx emissions under the CPP mass-based scenario—as the starting
point to monetize the avoided compliance costs and forgone benefits of the proposed repeal.
In addition, EPA changed the accounting treatment of cost savings from demand-side energy
efficiency measures. EPA counted them as a negative cost in the 2015 analysis. In 2017, EPA
moved them to the benefits side of the ledger, counting them as a positive benefit of the CPP.
Using the terminology of the proposed repeal, this means that EPA counted the energy efficiency
savings—which would not be achieved if EPA were to repeal the CPP—as a forgone benefit.
Comparing the 2015 and 2017 Benefit-Cost Analyses EPA’s 2015 analysis concluded that the monetized benefits of the CPP outweighed the monetized
costs. The 2017 analysis presented less favorable benefit-cost comparisons of the CPP.
Traditionally, benefit-cost comparisons are shown as estimates of the “net impact,” which is the
difference between total benefits and total costs. “Net benefits” result when the benefits outweigh
the costs, and “net costs” result when the costs outweigh the benefits.32
All of the net impact estimates presented in the 2015 analysis showed benefits outweighing the
costs, with the difference ranging from $25 billion to $45 billion in 2030.33 In contrast, the 2017
net impact estimates ranged from costs outweighing benefits (i.e., net costs of the proposed
repeal) to benefits outweighing costs (i.e., net benefits of the proposed repeal).34 The estimates for
“2017 RIA”), p. 27, https://www.regulations.gov/document?D=EPA-HQ-OAR-2017-0355-0110.
31 2017 RIA, p. 3.
32 While the net impact can provide a rough measure of how the estimated benefits compare to the estimated costs, it
does not necessarily determine whether the benefits justify costs. For example, the net impact does not account for
potentially important qualitative impacts.
33 These estimates are net benefits for one year—2030. This range spans estimates across the rate-based and mass-
based scenarios and two discount rates (3% and 7%).
34 Roughly one-third of the benefit-cost comparisons showed net costs of the proposed repeal, and roughly two-thirds

EPA’s Proposal to Repeal the Clean Power Plan: Benefits and Costs
Congressional Research Service R45119 · VERSION 3 · UPDATED 7
2030 ranged from $28.3 billion in net costs of the proposed repeal to $14 billion in net benefits of
the proposed repeal.35 The 2017 analysis did not explicitly state the agency’s view about whether
the benefits of the repeal are likely to outweigh the costs of the proposed repeal. Table 1 presents
the highest and lowest net impacts reported for each analysis year in the 2015 and 2017 analyses.
Table 1. CPP and Proposed CPP Repeal: Estimated Net Impacts
EPA’s range of net estimates, based on 2015 power sector modeling, by year (billions of 2011$)
Year
CPP Final Rule
Estimated Range of Net Benefits
Proposed CPP Repeal
Estimated Range: (Net Costs) to Net
Benefits
2020 $1.0 to $6.7 ($3.8) to $2.9
2025 $15 to $27 ($18.1) to $6.6
2030 $25 to $45 ($28.3) to $14.0
Source: CRS analysis of EPA’s 2015 Regulatory Impact Analysis (pp. ES-22 to ES-23) and EPA’s 2017 Regulatory
Impact Analysis (pp. 71-77).
Notes: “Net Impact” refers to the difference between total benefits and total costs: Net benefits result when
the benefits outweigh the costs, and net costs result when the costs outweigh the benefits. Parentheses in the
table signify net costs. Ranges in table show the lowest and highest estimated net impacts based on 2015 power
sector modeling and as reported in EPA’s 2015 and 2017 analyses. Each range spans estimates from the rate-
based and mass-based scenarios and two discount rates (3% and 7%).
The benefit-cost estimates derived from the AEO 2017 projections likewise showed a range of net
costs and net benefits of the proposed repeal under different assumptions. Half of these benefit-
cost comparisons showed net benefits to repeal the CPP, and the other half showed net costs to
repeal. The AEO-based benefit-cost estimates are generally the same order of magnitude as
proposed repeal estimates in Table 1, though as previously noted, they are not directly
comparable due to modeling differences. The AEO-based estimates of the proposed repeal for
2030 ranged from $30.6 billion in net costs to $14.0 billion in net benefits.36
The effect of updated power sector projections on the proposed repeal’s benefit-cost estimates is
unclear. EPA noted that the benefit-cost estimates based on its 2015 power sector modeling did
not reflect changes that have since occurred in the power sector. These changes are potentially
important and include changes in expected electricity demand, expected growth in electricity
generation by renewable energy technologies, retirements of older generating units, changes in
showed net benefits of the proposed repeal (see Tables 4-1 through 4-4 in the 2017 RIA). These estimates in the 2017
RIA were based on the power sector modeling EPA conducted in 2015 with the IPM model. As previously noted, this
was one of two sets of benefit-cost estimates. The second set of estimates—based on AEO 2017 power sector
projections—are not comparable to the EPA’s 2015 estimates due to modeling differences.
35 These estimates are the net impacts of the proposed repeal for one year—2030. The range spans estimates shown for
year 2030 in Tables 4-1 through 4-4 of the 2017 RIA, which were based on the power sector projections used in the
2015 RIA. The range covers the rate-based and mass-based scenarios and two discount rates (3% and 7%).
36 These estimates are the net impacts of the proposed repeal for one year—2030. The range spans estimates shown for
year 2030 in Tables 7-8 through 7-11 of the 2017 RIA, which were based on AEO 2017 power sector projections. The
range covers two discount rates (3% and 7%) and was based on EIA’s modeling of the CPP mass-based scenario. EPA
also reported net impacts for these scenarios in two other years—2020 and 2025. The 2020 estimated net impacts
ranged from $0.5 billion in net costs of the proposed repeal to $0.1 billion in net benefits of the proposed repeal. The
2025 estimated net impacts ranged from $5.0 billion in net costs of the proposed repeal to $14.3 billion in net benefits
of the proposed repeal. See 2017 RIA, pp. 126-130.

EPA’s Proposal to Repeal the Clean Power Plan: Benefits and Costs
Congressional Research Service R45119 · VERSION 3 · UPDATED 8
the prices and availability of different fuels and renewables, and state and federal regulations.37
The AEO 2017 projections showed a shift from higher-emitting sources to lower-emitting
sources, suggesting potentially lower CO2 emission reductions and compliance costs under the
CPP relative to 2015 estimates. EPA did not specify whether such trends would alter the agency’s
conclusions about the benefit-cost comparisons of the proposed repeal. Rather, EPA said it plans
to update its power sector modeling and make it available for public comment before it finalizes
the proposed repeal.38
The AEO 2017 projections also suggested greater SO2 reductions under the CPP than those EPA
estimated in 2015. Specifically, AEO 2017 scenarios showed higher human health co-benefits,
due to higher SO2 reductions, compared to EPA’s 2015 estimates.39 One recent study by
Resources for the Future analyzed the AEO 2017 projections by fuel type and observed that it
projected a greater reduction in coal emissions under the CPP in 2030 relative to what EPA
estimated in 2015. The study concluded that it is unclear what mechanisms are “behind the result
and to what extent the differences between models used in the 2015 regulatory impact analysis
(RIA) projections and the 2017 AEO projections play a role.”40
What Changed in EPA’s 2017 Benefit-Cost Analysis Compared to the 2015 analysis, EPA changed its analysis of the CPP’s benefits and costs in three
primary ways. Specifically, EPA:
1. Revised estimates of the SCC by (a) excluding international impacts of U.S.
emissions and (b) more strongly discounting the future benefits of CO2
reductions;
2. Assumed no human health co-benefits below set thresholds of pollution levels in
most of the benefit-cost comparisons; and
3. Counted demand-side energy efficiency savings as benefits rather than as
offsetting costs.
The first two changes accounted for the differences in the conclusions of EPA’s 2015 analysis
compared to the 2017 analysis. The third change did not alter the conclusions—whether benefits
outweigh the costs—but modified the separate estimates of the CPP compliance costs and
benefits. This section details all three changes.
New SCC Values Lower Estimates of the Climate Benefits
EPA and other federal agencies have used the SCC to value the climate benefits of CO2 reductions
from rulemakings. Typically presented as dollars per metric ton of CO2 in a given year, the SCC
is an estimate of the monetary value of impacts from a change in CO2 emissions in a given year.
37 2017 RIA, p. 17.
38 2017 RIA, p. 3.
39 The AEO 2017 scenarios showed greater particulate matter benefits due to greater reductions in SO2 emissions under
the CPP. Based on AEO 2017 projections, EPA reported that relative to the baseline, the CPP would have reduced SO2
emissions by 191,000 and 423,000 short tons in 2025 and 2030, respectively. See 2017 RIA, p. 122. The corresponding
SO2 reductions reported in 2015, based on EPA’s IPM analysis of the mass-based scenario, were lower: 185,000 and
280,000 short tons in 2025 and 2030, respectively. See 2015 RIA, p. ES-7.
40 Dallas Burtraw, “Comments to the Maryland Office of the Attorney General and the Maryland General Assembly on
the Proposed Repeal of the Clean Power Plan,” Resources for the Future, January 11, 2018, http://www.rff.org/files/
document/file/RFF-Testimony-Burtraw-Jan2018_3.pdf.
EPA’s Proposal to Repeal the Clean Power Plan: Benefits and Costs
Congressional Research Service R45119 · VERSION 3 · UPDATED 9
The impacts include net changes in agricultural productivity, property damage from increased
flood risk, and changes in energy system costs, such as reduced costs for heating and increased
costs for air conditioning. SCC values are calculated using models that translate changes in
emissions into economic impacts through a multi-step process.41 Analysts multiply the SCC
estimates for a given year by the estimated CO2 emissions reduction in that same year to estimate
the monetary value of the associated climate benefits.
In 2015, EPA estimated the climate benefits of the CPP using four SCC values developed by an
interagency working group (IWG).42 The IWG SCC estimates, which measured the global value
of CO2 reductions, were $17, $53, $77, and $160 per metric ton of CO2 emissions in 2030
(2011$).43 The first three values were based on the average SCC from the model runs at discount
rates of 5%, 3%, and 2.5%, respectively. The fourth value was the 95th percentile of the SCC from
the model runs at a 3% discount rate.
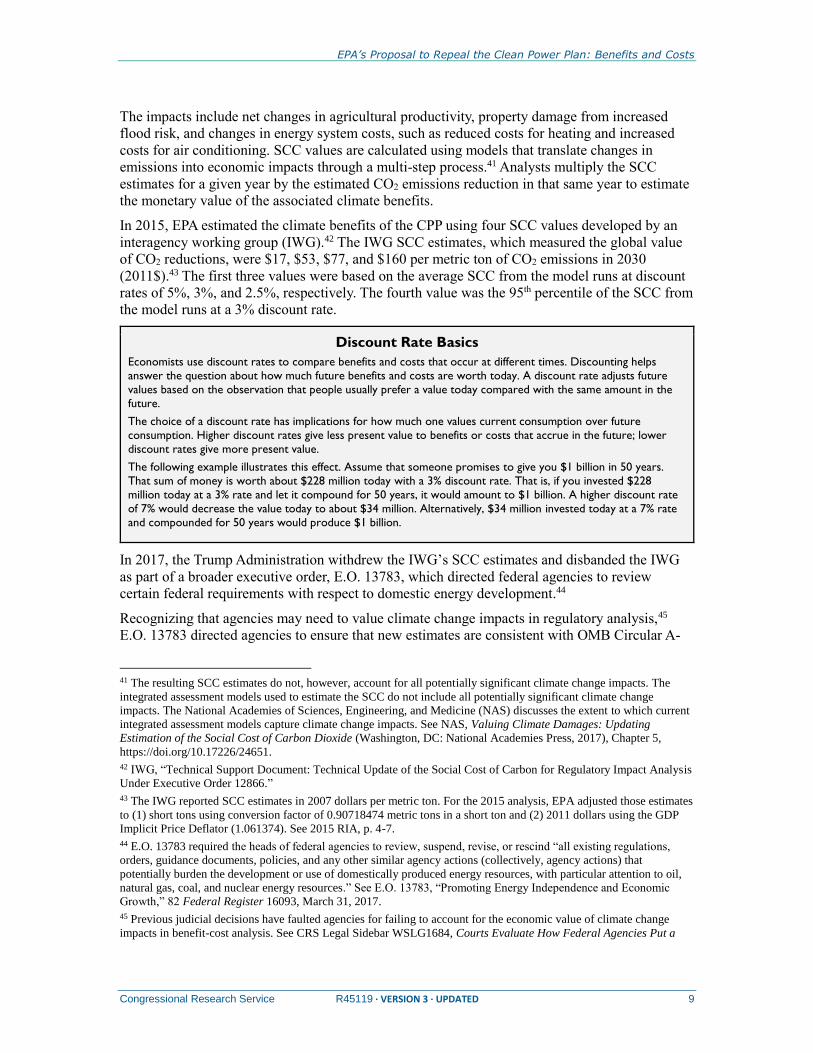
Discount Rate Basics
Economists use discount rates to compare benefits and costs that occur at different times. Discounting helps
answer the question about how much future benefits and costs are worth today. A discount rate adjusts future
values based on the observation that people usually prefer a value today compared with the same amount in the
future.
The choice of a discount rate has implications for how much one values current consumption over future
consumption. Higher discount rates give less present value to benefits or costs that accrue in the future; lower
discount rates give more present value.
The following example illustrates this effect. Assume that someone promises to give you $1 billion in 50 years.
That sum of money is worth about $228 million today with a 3% discount rate. That is, if you invested $228
million today at a 3% rate and let it compound for 50 years, it would amount to $1 billion. A higher discount rate
of 7% would decrease the value today to about $34 million. Alternatively, $34 million invested today at a 7% rate
and compounded for 50 years would produce $1 billion.
In 2017, the Trump Administration withdrew the IWG’s SCC estimates and disbanded the IWG
as part of a broader executive order, E.O. 13783, which directed federal agencies to review
certain federal requirements with respect to domestic energy development.44
Recognizing that agencies may need to value climate change impacts in regulatory analysis,45
E.O. 13783 directed agencies to ensure that new estimates are consistent with OMB Circular A-
41 The resulting SCC estimates do not, however, account for all potentially significant climate change impacts. The
integrated assessment models used to estimate the SCC do not include all potentially significant climate change
impacts. The National Academies of Sciences, Engineering, and Medicine (NAS) discusses the extent to which current
integrated assessment models capture climate change impacts. See NAS, Valuing Climate Damages: Updating
Estimation of the Social Cost of Carbon Dioxide (Washington, DC: National Academies Press, 2017), Chapter 5,
https://doi.org/10.17226/24651.
42 IWG, “Technical Support Document: Technical Update of the Social Cost of Carbon for Regulatory Impact Analysis
Under Executive Order 12866.”
43 The IWG reported SCC estimates in 2007 dollars per metric ton. For the 2015 analysis, EPA adjusted those estimates
to (1) short tons using conversion factor of 0.90718474 metric tons in a short ton and (2) 2011 dollars using the GDP
Implicit Price Deflator (1.061374). See 2015 RIA, p. 4-7.
44 E.O. 13783 required the heads of federal agencies to review, suspend, revise, or rescind “all existing regulations,
orders, guidance documents, policies, and any other similar agency actions (collectively, agency actions) that
potentially burden the development or use of domestically produced energy resources, with particular attention to oil,
natural gas, coal, and nuclear energy resources.” See E.O. 13783, “Promoting Energy Independence and Economic
Growth,” 82 Federal Register 16093, March 31, 2017.
45 Previous judicial decisions have faulted agencies for failing to account for the economic value of climate change
impacts in benefit-cost analysis. See CRS Legal Sidebar WSLG1684, Courts Evaluate How Federal Agencies Put a

EPA’s Proposal to Repeal the Clean Power Plan: Benefits and Costs
Congressional Research Service R45119 · VERSION 3 · UPDATED 10
4.46 E.O. 13783 specifically mentioned the Circular A-4 guidance for agencies to focus on
domestic benefits and costs and to use discount rates of 3% and 7%.47 Circular A-4 does not
consider issues specific to each regulation, such as those pertaining to climate change, and does
not provide guidance that explicitly references the SCC.48
EPA Develops Domestic SCC Values and Uses Higher Discount Rate
EPA developed new SCC values—labeling them as “interim values”—based on the direction
given in E.O. 13783.49 EPA used the same models and assumptions as the IWG except with
respect to the scope (domestic versus global) and discount rates.50 For example, EPA and the IWG
applied the same projections of population, income, and emissions to the models. EPA, however,
used two of the three models to directly calculate domestic SCC estimates. Given that the third
model—Dynamic Integrated Climate and Economy (DICE) 2010—generates only global values,
EPA used an approximation to adjust those global values to domestic values. Specifically, EPA
approximated the domestic SCC as 10% of the global SCC51 based on a peer-reviewed paper by
the DICE 2010 model author.52 The interim, domestic SCC estimates resulting from all three
models are $7 and $1 per metric ton of CO2 emissions in 2030 (2011 dollars) at discount rates of
3% and 7%, respectively.
Considerations for the Scope—Domestic or Global—of the SCC
The United States emits CO2 and other GHGs to the atmosphere, where the gases become well
mixed and contribute to global GHG concentrations, affect the global climate, and have
consequences for humans, economies, and natural systems in the United States and in other
countries. Most published estimates of the SCC have measured the global impact. Stakeholders,
however, have disagreed about whether federal agencies should use domestic or global SCC
values.
In 2010, the IWG recommended global values because most GHGs “contribute to damages
around the world independent of the country in which they are emitted” and concluded that the
SCC “must therefore incorporate the full (global) damages caused by GHG emissions to address
Price on Carbon, by Linda Tsang.
46 E.O. 13783 §5(c).
47 OMB Circular A-4, p. 15.
48 Circular A-4 was issued in 2003, before federal agencies developed and used SCC estimates in regulatory analyses.
Circular A-4 nonetheless includes a number of provisions relevant to assessing climate change impacts. For example, it
directs analysts to “present information on the streams of benefits and costs over time in order to provide a basis for
assessing intertemporal distributional consequences, particularly where intergenerational effects are concerned.” OMB
Circular A-4, p. 14.
49 2017 RIA, p. 42.
50 Whereas the IWG selected four SCC estimates—the average SCC at each of three discount rates (2.5%, 3%, 5%) and
the 95th percentile SCC at 3%—for use in regulatory analysis, EPA selected two SCC estimates for the 2017 CPP
analysis—the average SCC at two discount rates (3%, 7%). EPA also used the average SCC at 2.5% in a sensitivity
analysis. It did not present the 95th percentile value at 3%.
51 A hypothetical calculation illustrates this approach: A $100 global SCC value would translate to a $10 domestic
SCC. See 2017 RIA, p. 162.
52 Paper reported results from a regionalized version of DICE 2010, known as RICE 2010. See William D. Nordhaus,
“Revisiting the Social Cost of Carbon,” Proceedings of the National Academy of Sciences of the United States, vol.
114, no. 7 (2017), pp. 1518-1523.

EPA’s Proposal to Repeal the Clean Power Plan: Benefits and Costs
Congressional Research Service R45119 · VERSION 3 · UPDATED 11
the global nature of the problem.”53 EPA agreed with the IWG’s rationale in 2015 and observed
that the United States operates in a global, interconnected economy and that the potential for
spillover effects—particularly in the areas of national security, international trade, and public
health—further justified use of global SCC estimates.54
Some stakeholders supported this position. In particular, they stated that use of a domestic SCC
would understate the benefits to the United States because of spillover effects—that is, climate
impacts that occur outside U.S. borders could nonetheless affect the U.S. economy.55 Others have
observed that “U.S. emissions cause the bulk of their damages beyond U.S. borders”56 and
discussed “economic, strategic, ethical, and legal justifications”57 to focus on a global SCC. In
short, those recommending global values concluded that “no bright line between domestic and
global” climate change impacts exists.58
Other stakeholders disagreed with this position, recommending in 2015 that federal agencies use
domestic SCC estimates. These stakeholders noted that it would be consistent with OMB Circular
A-4 guidance to focus on domestic benefits and costs.59 Others questioned whether basing U.S.
climate regulations on global values would help international climate mitigation efforts.60 Some
stakeholders also criticized the comparison of impacts measured on different scales—global
benefits versus domestic costs—and concluded that using a global SCC overstates the benefits of
a country-specific rulemaking. That is, the benefit-cost comparison may seem favorable when
counting benefits that accrue to non-U.S. populations but would be less favorable when
considering only the U.S. benefits.
In the 2017 analysis of the proposed repeal, EPA pointed to direction in E.O. 13873 and OMB
Circular A-4 to explain its focus on domestic SCC estimates. Circular A-4 does not, however,
prohibit consideration of global values. Rather, A-4 states that analysis should “focus on benefits
and costs that accrue to citizens and residents of the United States” and continues to note that
when evaluating a “regulation that is likely to have effects beyond the borders of the United
States, these effects should be reported separately.”61 EPA presented global estimates as part of a
53 For the complete discussion of EPA’s rationale for using global estimates, see 2015 RIA, p. 4-7.
54 EPA, EPA’s Responses to Public Comments on the EPA’s Carbon Pollution Emission Guidelines for Existing
Stationary Sources: Electric Utility Generating Units, Docket ID EPA-HQ-OAR-2013-0602-37106, Chapter 8,
“Economic and Employment Impacts, Sections 8.7-8.9,” August 2015, p. 44.
55 For a summary of the comments recommending global SCC values and EPA’s response, see EPA, EPA’s Responses
to Public Comments on the EPA’s Carbon Pollution Emission Guidelines for Existing Stationary Sources, pp. 41-45.
56 William Pizer et al., “Using and Improving the Social Cost of Carbon,” Science, vol. 346, no. 6214 (December 5,
2014), pp. 1189-1190.
57 Peter Howard and Jason Schwartz, “Think Global: International Reciprocity as Justification for a Global Social Cost
of Carbon,” Columbia Journal of Environmental Law, vol. 42 (March 5, 2017), p. 210,
http://www.columbiaenvironmentallaw.org/think-global-international-reciprocity-as-justification-for-a-global-social-
cost-of-carbon/.
58 EPA, EPA’s Responses to Public Comments on the EPA’s Carbon Pollution Emission Guidelines for Existing
Stationary Sources, p. 43.
59 For a summary of the comments recommending domestic SCC values and EPA’s response, see EPA, EPA’s
Responses to Public Comments on the EPA’s Carbon Pollution Emission Guidelines for Existing Stationary Sources,
pp. 41-45.
60 See, for example, Ted Gayer and W. Kip Viscusi, “Determining the Proper Scope of Climate Change Policy Benefits
in U.S. Regulatory Analyses: Domestic versus Global Approaches,” Review of Environmental Economics and Policy,
vol. 10, issue 2 (July 2016), pp. 245-263, https://doi.org/10.1093/reep/rew002.
61 OMB Circular A-4, p. 15.

EPA’s Proposal to Repeal the Clean Power Plan: Benefits and Costs
Congressional Research Service R45119 · VERSION 3 · UPDATED 12
sensitivity analysis in the appendix of the 2017 regulatory analysis. It did not compare those
estimates to the avoided costs of the proposed repeal.
Experts acknowledge challenges in developing accurate estimates of the domestic SCC, which
EPA discussed in its 2017 analysis. In particular, EPA acknowledged the difficulty in capturing
the “relevant regional interactions—i.e., how climate change impacts in other regions of the
world could affect the United States, through pathways such as global migration, economic
destabilization, and political destabilization.”62 The National Academies of Sciences,
Engineering, and Medicine (NAS) presented a similar observation, stating that the current models
used to estimate the SCC do not fully capture the relevant regional interactions.63
Considerations for Discount Rates
OMB Circular A-4 discusses discount rate selection for benefit-cost analysis. OMB based the
Circular A-4 discount rate recommendations—3% and 7%—on scenarios in which a regulation
would primarily affect either consumer spending or private capital.64 In one scenario, regulations
may directly affect private consumption by, for example, raising consumer prices for goods and
services. In another scenario, regulations might displace or alter capital investments in the private
sector. The 3% rate, known as the “consumption rate,” was based on the rate that the average
saver uses to discount future consumption. Specifically, it is the real rate of return on long-term
government debt, which averaged about 3% between 1973 and 2003. The 7% rate was based on
the opportunity cost of capital—the displaced or forgone investment—and corresponded to the
growth rate of federal spending.
Discounting occurs in the last step of the SCC calculation. The models first estimate the climate
change impacts that occur over a long time period—to 2100 and beyond—following the release
of CO2 and then discount the future value of those impacts to the year of the CO2 emission.
Discounting allows for apples-to-apples comparisons of economic impacts that occur at different
times. It is generally standard practice in benefit-cost analysis.65
The intergenerational aspect of climate change makes selection of a discount rate particularly
challenging when calculating the SCC—in part because it has implications for how much the
current generation values the climate change impacts experienced by future generations. The
current generation must select a discount rate on behalf of the future generation and without the
benefit of input from the future generation. It also raises questions about the extent to which the
current generation would account for the future generation’s potential preferences, particularly if
doing so comes at the expense of the current generation.
While there is no consensus on the appropriate rate to choose in an intergenerational context, it is
well understood that higher discount rates result in lower present values and that lower discount
62 2017 RIA, pp. 45-46.
63 NAS, Valuing Climate Damages, p. 53.
64 Executive Office of the President, Council of Economic Advisers, “Discounting for Public Policy: Theory and
Recent Evidence on the Merits of Updating the Discount Rate,” January 2017, https://obamawhitehouse.archives.gov/
sites/default/files/page/files/201701_cea_discounting_issue_brief.pdf.
65 For more information about discounting generally and specifically the considerations for SCC estimation, see CRS In
Focus IF10625, Social Costs of Carbon/Greenhouse Gases: Issues for Congress, by Jane A. Leggett.

EPA’s Proposal to Repeal the Clean Power Plan: Benefits and Costs
Congressional Research Service R45119 · VERSION 3 · UPDATED 13
rates result in higher present values.66 In addition, the literature shows that SCC estimates are
highly sensitive to discount rate selection.67
OMB Circular A-4 also acknowledges the ethical implications involved when comparing benefits
and costs that span generations. Circular A-4 recommends that analysts consider conducting
sensitivity analysis that applies lower discount rates, noting that estimates of intergenerational
rates in the 1990s ranged from 1% to 3%.68
OMB Circular A-4 has not been updated since 2003.69 Under the Obama Administration, the
Council of Economic Advisers assessed the Circular A-4 discount rates in light of more recent
market data. In January 2017, the council concluded that “the evidence supports lowering these
discount rates.”70 In particular, the council suggested that the 3% rate “should be at most 2
percent” and the 7% rate “should also likely be reduced.”71
Stakeholders have expressed divergent views on discount rate selection for the SCC.
Environmental and public interest groups generally emphasized the intergenerational
considerations and recommended that the federal government use lower rates or rates that decline
over time.72 Industry groups have generally recommended higher rates, such as the 7% rate.73 The
published literature largely shows application of lower discount rates in climate change studies.
According to the NAS, the majority of climate change impacts studies cited in the
Intergovernmental Panel on Climate Change Fifth Assessment Report (2014) used rates of no
more than 5%.74
In 2010, the IWG concluded that the SCC discount rate should reflect the rate that the average
saver uses to discount future consumption (i.e., the consumption rate). The IWG therefore did not
apply the 7% rate, which was based on the opportunity cost of capital.75 As previously noted, the
IWG discounted the SCC at rates of 2.5%, 3%, and 5%. In the 2015 CPP analysis, EPA agreed
with the IWG’s selection of discount rates, characterizing them as consistent with the economics
literature and OMB Circular A-4 guidance.76
66 NAS, Valuing Climate Damages, p. 161.
67 For example, see (1) NAS, Valuing Climate Damages, p. 161; (2) K. Arrow et al., “Determining Benefits and Costs
for Future Generations,” Science, vol. 341 (July 26, 2013), pp. 349-350; and (3) Michael Greenstone, Elizabeth Kopits,
and Ann Wolverton, “Developing a Social Cost of Carbon for U.S. Regulatory Analysis: A Methodology and
Interpretation,” Review of Environmental Economics and Policy, vol. 7, no. 1 (January 2013), pp. 23-46.
68 OMB Circular A-4, pp. 35-36.
69 OMB Circular A-4, pp. 33-34.
70 Council of Economic Advisers, “Discounting for Public Policy.”
71 Council of Economic Advisers, “Discounting for Public Policy.”
72 For example, see a letter authored by four environmental groups, EPA-HQ-OAR-2013-0602-23545, at
https://www.regulations.gov. For a summary of the comments recommending lower discount rates and EPA’s response,
see EPA, EPA’s Responses to Public Comments on the EPA’s Carbon Pollution Emission Guidelines for Existing
Stationary Sources, pp. 61-65.
73 For example, see letter submitted in response to the IWG’s SCC comment solicitation, OMB-2013-0007-0141 at
http://www.regulations.gov. For a summary of the comments recommending higher discount rates and the IWG’s
response, see IWG, “Response to Comments: Social Cost of Carbon for Regulatory Impact Analysis Under Executive
Order 12866,” July 2015, https://obamawhitehouse.archives.gov/sites/default/files/omb/inforeg/scc-response-to-
comments-final-july-2015.pdf, pp. 21-22.
74 NAS, Valuing Climate Damages, p. 168.
75 IWG, “Technical Support Document: Social Cost of Carbon for Regulatory Impact Analysis Under Executive Order
12866,” February 2010, https://www.epa.gov/sites/production/files/2016-12/documents/scc_tsd_2010.pdf, p. 19.
76 See 2015 RIA, p. 339, and EPA, EPA’s Responses to Public Comments on the EPA’s Carbon Pollution Emission
EPA’s Proposal to Repeal the Clean Power Plan: Benefits and Costs
Congressional Research Service R45119 · VERSION 3 · UPDATED 14
Academics have recommended different ways to calculate a discount rate. In particular, the NAS
recommended that the federal government develop a new approach to calculate discount rates that
would better capture uncertainty over long periods of time. The NAS did not recommend a
particular rate but instead focused on the method that federal agencies should use to determine the
appropriate rate. Furthermore, the NAS suggested that the OMB Circular A-4 guidance is an
insufficient basis for choosing SCC discount rates, because it “does not fully address the issue of
discounting over long horizons or the effect of uncertainty on discount rates, both of which
directly influence” SCC estimates.77
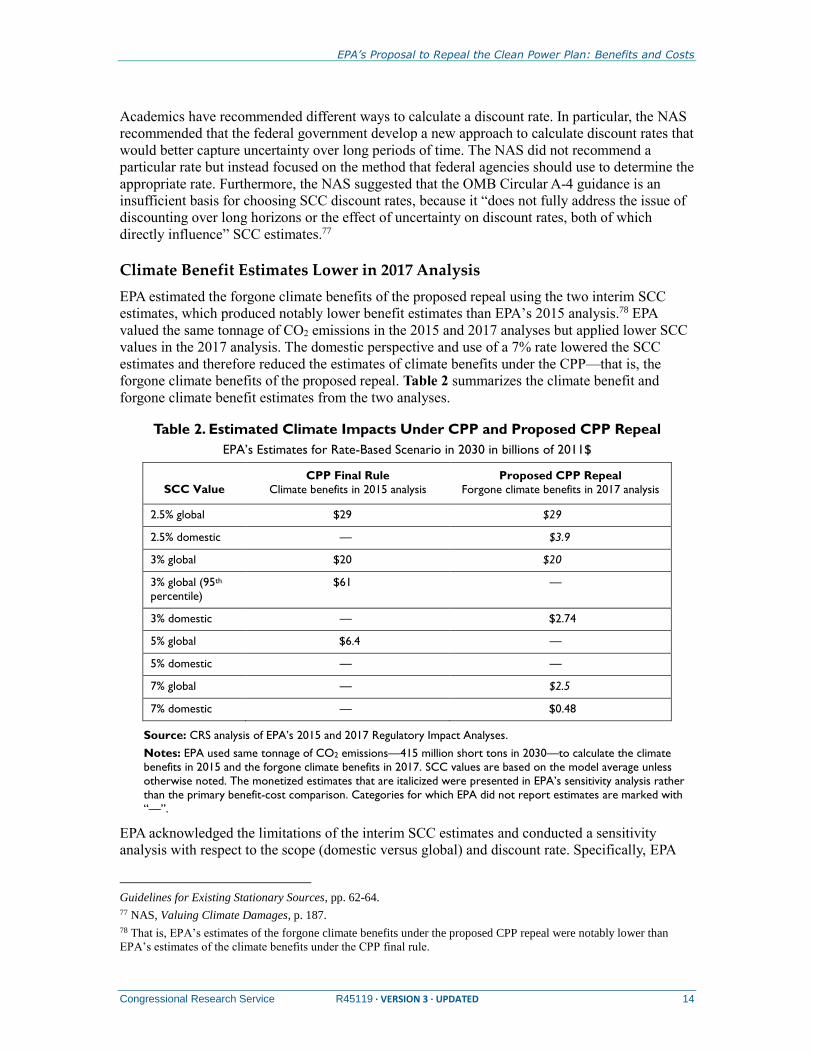
Climate Benefit Estimates Lower in 2017 Analysis
EPA estimated the forgone climate benefits of the proposed repeal using the two interim SCC
estimates, which produced notably lower benefit estimates than EPA’s 2015 analysis.78 EPA
valued the same tonnage of CO2 emissions in the 2015 and 2017 analyses but applied lower SCC
values in the 2017 analysis. The domestic perspective and use of a 7% rate lowered the SCC
estimates and therefore reduced the estimates of climate benefits under the CPP—that is, the
forgone climate benefits of the proposed repeal. Table 2 summarizes the climate benefit and
forgone climate benefit estimates from the two analyses.
Table 2. Estimated Climate Impacts Under CPP and Proposed CPP Repeal
EPA’s Estimates for Rate-Based Scenario in 2030 in billions of 2011$
SCC Value CPP Final Rule
Climate benefits in 2015 analysis
Proposed CPP Repeal
Forgone climate benefits in 2017 analysis
2.5% global $29 $29
2.5% domestic — $3.9
3% global $20 $20
3% global (95th
percentile)
$61 —
3% domestic — $2.74
5% global $6.4 —
5% domestic — —
7% global — $2.5
7% domestic — $0.48
Source: CRS analysis of EPA’s 2015 and 2017 Regulatory Impact Analyses.
Notes: EPA used same tonnage of CO2 emissions—415 million short tons in 2030—to calculate the climate
benefits in 2015 and the forgone climate benefits in 2017. SCC values are based on the model average unless
otherwise noted. The monetized estimates that are italicized were presented in EPA’s sensitivity analysis rather
than the primary benefit-cost comparison. Categories for which EPA did not report estimates are marked with
“—”.
EPA acknowledged the limitations of the interim SCC estimates and conducted a sensitivity
analysis with respect to the scope (domestic versus global) and discount rate. Specifically, EPA
Guidelines for Existing Stationary Sources, pp. 62-64.
77 NAS, Valuing Climate Damages, p. 187.
78 That is, EPA’s estimates of the forgone climate benefits under the proposed CPP repeal were notably lower than
EPA’s estimates of the climate benefits under the CPP final rule.

EPA’s Proposal to Repeal the Clean Power Plan: Benefits and Costs
Congressional Research Service R45119 · VERSION 3 · UPDATED 15
estimated the forgone climate benefits using global values and an alternative discount rate (2.5%)
and presented the results in an appendix. The agency did not, however, directly compare the
sensitivity analysis estimates to the avoided compliance costs of the proposed repeal.
Thresholds Reduced Some Human Health Co-Benefit Estimates
EPA’s 2017 analysis also diverged from the 2015 analysis by excluding the forgone human health
co-benefits from some of the benefit-cost comparisons. While one of the benefit-cost
comparisons counted all of the estimated forgone health co-benefits, another benefit-cost
comparison completely excluded the forgone health co-benefits. Two of the other benefit-cost
comparisons used a threshold that reduced the forgone health co-benefits. In those comparisons,
EPA counted only the health co-benefits that exceeded the threshold.
Benefits Estimate for the “Targeted Pollutant” Excluded Health Co-Benefits
One of the comparisons excluded the forgone health co-benefits entirely to focus on the forgone
benefits from the “targeted pollutant,” CO2. This presentation appears inconsistent with guidance
in OMB’s Circular A-4.79 EPA explained this approach as a way to focus on “the benefits due to
reductions in the target pollutant relative to the costs, and whether alternative regulatory designs
can achieve reductions in the targeted pollutants and/or the other affected pollutants more cost
effectively.”80 EPA further stated that the focus on a targeted pollutant “may be an appropriate
way to evaluate this and future regulatory actions” and requested public comment on “the extent
to which the EPA should rely on consideration of benefits due to reductions in the target pollutant
relative to the costs in the decision-making process.”81
EPA’s rationale for this breakout relates to some stakeholders’ concerns about the consideration
of co-benefits—typically from reduced exposure to PM—in analyzing regulations targeting other
pollutants.82 For example, stakeholders critical of EPA’s 2015 analysis commented that inclusion
of the monetized co-benefits made it difficult to understand the impact of the CPP on CO2. Some
stakeholders also questioned whether EPA had attributed PM benefits achieved through other
regulations to the CPP—that is, “double counted” benefits that would have occurred regardless of
the CPP.83 EPA’s 2015 analysis stated that the estimated human health co-benefits were
incremental to the baseline that included existing regulations of PM and emissions that contribute
to the formation of PM.84
Consideration of co-benefits and other indirect impacts is typically viewed as a principle of
benefit-cost analysis and consistent with federal guidance. OMB Circular A-4 directs agencies to
79 Circular A-4 states, “Identify the expected undesirable side-effects and ancillary benefits of the proposed regulatory
action and the alternatives. These should be added to the direct benefits and costs as appropriate” (p. 3). A-4 also states,
“Your analysis should look beyond the direct benefits and direct costs of your rulemaking and consider any important
ancillary benefits and countervailing risks” (p. 26).
80 2017 RIA p. 11.
81 EPA, “Repeal of Carbon Pollution Emission Guidelines for Existing Stationary Sources.”
82 For more information about stakeholder views regarding treatment of co-benefits in EPA’s economic analyses of
Clean Air Act regulations, see CRS Report R44840, Cost and Benefit Considerations in Clean Air Act Regulations, by
James E. McCarthy and Richard K. Lattanzio.
83 EPA, EPA’s Responses to Public Comments on the EPA’s Carbon Pollution Emission Guidelines for Existing
Stationary Sources, pp. 90-93.
84 EPA, EPA’s Responses to Public Comments on the EPA’s Carbon Pollution Emission Guidelines for Existing
Stationary Sources, pp. 93-94.

EPA’s Proposal to Repeal the Clean Power Plan: Benefits and Costs
Congressional Research Service R45119 · VERSION 3 · UPDATED 16
“look beyond the direct benefits and direct costs” of a rulemaking and quantify and monetize co-
benefits as well as adverse impacts not already considered in the direct cost estimates.85 Likewise,
EPA’s Guidelines for Preparing Economic Analyses recommends that the agency’s economic
analysis “include directly intended effects and associated costs, as well as ancillary (or co-)
benefits and costs.”86
OMB’s two most recent reports to Congress on the benefits and costs of federal regulations
reported that many of EPA’s Clean Air Act analyses monetize co-benefits and count them towards
the total benefits estimate. OMB observed that “the large estimated benefits of EPA rules issued
pursuant to the Clean Air Act are mostly attributable to the reduction in public exposure to fine
particulate matter” and characterized this approach as “consistent with standard accounting
practices,” noting that this practice “has long been required under OMB Circular A-4.”87
Two Thresholds Used to Adjust Forgone Health Co-Benefits
The last two benefit-cost comparisons included some but not all of the estimated forgone health
co-benefits. EPA applied a threshold to the forgone health co-benefits in each of these
comparisons, counting only the forgone health co-benefits that exceeded a defined threshold for
ambient PM levels. That is, EPA assumed that health co-benefits would equal zero for any PM
reductions beyond the defined threshold. While previous EPA analyses have explored uncertainty
in benefit estimates relative to benchmark concentrations, the 2017 analysis diverged from past
practice by using a threshold to calculate PM mortality impacts.88
EPA based one threshold on the current federal air quality standard for PM—12 micrograms per
cubic meter (μg/m3)—and assumed that there were no deaths attributable to PM below it. EPA
based the second and lower threshold on the “lowest measured level” (LML) of PM from the two
long-term studies it used to estimate deaths related to PM.89 In this second benefit-cost
comparison, EPA assumed that there were no deaths attributable to PM at or below the LML of
the Krewski et al. 2009 study (5.8 μg/m3) and the Lepeule et al. 2012 study (8 μg/m3).90
85 Circular A-4 refers to co-benefits as “ancillary benefits.” See OMB Circular A-4, p. 26.
86 EPA, National Center for Environmental Economics, Guidelines for Preparing Economic Analyses, May 2014, p.
11-2, https://www.epa.gov/environmental-economics/guidelines-preparing-economic-analyses.
87 The quoted language appears in both the 2015 report to Congress and the 2016 report to Congress. The 2015 report is
the most recent final version of this annual report. OMB published a draft 2016 report to Congress in December 2016,
but it has not been finalized. Both reports can be found at https://www.whitehouse.gov/omb/information-regulatory-
affairs/reports/. See (1) OMB, Office of Information and Regulatory Affairs, 2015 Report to Congress on the Benefits
and Costs of Federal Regulations and Agency Compliance with the Unfunded Mandates Reform Act, p. 13; and (2)
OMB, Office of Information and Regulatory Affairs, 2016 Draft Report to Congress on the Benefits and Costs of
Federal Regulations and Agency Compliance with the Unfunded Mandates Reform Act, p. 12.
88 For example, EPA’s 2015 analysis of the CPP used the lowest measured levels from published studies as a
benchmark concentration level to examine the uncertainty of the benefit estimates. The 2015 analysis clarified,
however, that EPA did not view this benchmark as a threshold below which benefits fell to zero. See 2015 RIA, p. 4-
39.
89 For more information about the federal air quality standards for PM, see CRS Report R42934, Air Quality: EPA’s
2013 Changes to the Particulate Matter (PM) Standard, by Robert Esworthy.
90 See 2017 RIA. EPA used each study to estimate benefits and the results from a range with one “low” estimate and
one “high” estimate. EPA used the LML from each study to adjust the high and low forgone benefits. See also (1) D.
Krewski et al., “Extended Follow-Up and Spatial Analysis of the American Cancer Society Linking Particulate Air
Pollution and Mortality,” Health Effect Institute Research Report, vol. 140 (2009); and (2) J. Lepeule et al., “Chronic
Exposure to Fine Particles and Mortality: An Extended Follow-Up of the Harvard Six Cities Study from 1974 to 2009,”
Environmental Health Perspectives, vol. 120, no. 7 (2012), pp. 965-70.

EPA’s Proposal to Repeal the Clean Power Plan: Benefits and Costs
Congressional Research Service R45119 · VERSION 3 · UPDATED 17
The PM air quality standard is a higher concentration than the LML and therefore served as a
higher threshold. As a result, the PM air quality standard threshold lowered the forgone co-benefit
estimates more than the LML threshold did. These thresholds also had implications for the
benefit-cost comparisons of the proposed repeal. The comparisons—whether benefits outweigh
the costs in various years and at different discount rates—were mostly favorable to the proposed
repeal when using the PM air quality standard threshold and less favorable when using the LML
as a threshold.91
EPA explained the use of these thresholds as a way to enhance transparency and “provide some
insight into the level of uncertainty in the estimated” PM benefits at lower levels.92 EPA
referenced the agency’s 2012 analysis of the rule updating the federal air quality standard for PM,
which found greater uncertainty in estimating the “magnitude and significance” of PM-related
health risks below the federal standard.93 Similarly, EPA justified its use of the LML threshold as
a way to examine uncertainty in the distribution of PM-related mortality benefits, given that the
agency has greater confidence in the estimates that fall within the “bulk of observed” PM
concentrations in the two studies.
EPA acknowledged, however, that “scientific evidence provides no clear dividing line” to set a
threshold, citing peer-reviewed studies as well as the NAS.94 One of the cited studies was the
agency’s 2009 Integrated Science Assessment for Particulate Matter,95 which evaluated the
extensive body of published literature and “concluded that the scientific literature consistently
finds that a no-threshold model most adequately portrays the PM-mortality concentration-
response relationship.”96
EPA’s 2015 analysis acknowledged lower confidence in benefits that occur from reductions at
lower concentrations of PM but did not apply a threshold. At that time, EPA stated that the federal
air quality standards are not “risk-free,” meaning that there is some risk of adverse health effects
from exposure to pollution that meets the federal standard. EPA’s 2015 analysis concluded that
“the best estimate of benefits includes benefits both above and below the levels of” the federal air
quality standard and described this practice as consistent with scientific evidence and reviews of
the independent Clean Air Scientific Advisory Committee.97
EPA’s 2017 analysis asked for comment on estimating and reporting PM impacts in this way and
described plans for further research. Specifically, EPA intends to “systematically evaluat[e] the
uncertainty” associated with the benefit-per-ton approach and compare it to other techniques in
the literature in order to better understand the “suitability” of the benefit-per-ton approach for
estimating health impacts of changes in pollutants like PM.98 EPA stated that it intends to
91 See 2017 RIA, Tables 4-3 and 4-4. When using the LML threshold, six of the benefit-cost comparisons were
favorable to the proposed repeal—that is, they showed net benefits of the proposed repeal—but 10 were not—that is,
they showed net costs of the proposed repeal. When using the PM air quality threshold, 11 of the benefit-cost
comparisons showed net benefits of the proposed CPP repeal and three showed net costs of the proposed repeal.
92 2017 RIA, p. 51.
93 2017 RIA, p. 50.
94 2017 RIA, p. 51.
95 EPA, Integrated Science Assessment for Particulate Matter, EPA-600-R-08-139F, December 2009,
https://cfpub.epa.gov/ncea/isa/recordisplay.cfm?deid=216546.
96 EPA “Clean Power Plan,” 80 Federal Register 64932, October 23, 2015.
97 EPA, EPA’s Responses to Public Comments on the EPA’s Carbon Pollution Emission Guidelines for Existing
Stationary Sources, p. 102.
98 2017 RIA, p. 91.

EPA’s Proposal to Repeal the Clean Power Plan: Benefits and Costs
Congressional Research Service R45119 · VERSION 3 · UPDATED 18
conduct, “to the extent feasible,” detailed air quality modeling that would, among other things,
inform threshold-based analysis of PM benefits.99
Change in the Accounting Treatment of Energy Savings Impacts
EPA changed the accounting treatment of demand-side energy efficiency savings. EPA’s 2015
analysis treated savings from energy efficiency measures as a negative cost,100 which reduced the
compliance cost estimates. EPA’s 2017 analysis treated them as a benefit, citing OMB guidance
that described accounting for energy efficiency savings as benefits as a common accounting
practice.101
Moving the energy savings from the cost side of the ledger to the benefits side simultaneously
increased the estimated costs and the estimated benefits by the same amount. In the analysis of
the proposed repeal, EPA removed the energy savings (as a negative value) from the total cost
estimate, which resulted in a larger cost estimate, and added the energy savings (as a positive
value) to the estimated benefits, which resulted in a larger benefits estimate. Using the
terminology of the proposed repeal, EPA moved energy savings from the cost savings estimate to
the forgone benefits estimate. There was no change in the difference between benefits and costs,
because the benefits and costs increased by the same amount.
While this accounting change did not change the difference between benefits and costs—that is,
the “net impact” of the proposed repeal—it resulted in both higher estimates of the CPP’s costs
and benefits. This change took on more significance in a cost analysis EPA conducted under E.O.
13771, “Reducing Regulation and Controlling Regulatory Costs.”102 EPA presented the results of
its E.O. 13771 analysis in the 2017 regulatory analysis but kept it separate from the benefit-cost
comparisons. E.O. 13771 specifies that “any new incremental costs associated with new
regulations shall, to the extent permitted by law, be offset by the elimination of existing costs
associated with at least two prior regulations,” but it does not mention the benefits of
regulation.103
The analysis that EPA conducted under E.O. 13771 reported the cost savings of the proposed
repeal but omitted the forgone benefits. EPA calculated the present value of avoided compliance
costs for 2020-2033, using the power sector modeling from EPA’s 2015 analysis. EPA did not
include the demand-side energy efficiency savings in this cost analysis given that the agency
viewed those savings as benefits in the 2017 analysis. Therefore, the cost savings (i.e., CPP
compliance costs) analyzed under E.O. 13771 exceeded the compliance costs that EPA considered
in the 2015 benefit-cost analysis.
Concluding Observations Benefit-cost analysis is a core tenet of the regulatory process that informs potentially complex
policy decisions. It can strengthen the effectiveness of policymaking by providing decisionmakers
99 2017 RIA, p. 91.
100 2015 RIA, p. ES-9.
101 2017 RIA, p. 38, referencing OMB, “Guidance Implementing Executive Order 13771, Titled ‘Reducing Regulation
and Controlling Regulatory Costs,’” 2017, https://www.whitehouse.gov/sites/whitehouse.gov/files/omb/memoranda/
2017/M-17-21-OMB.pdf.
102 E.O. 13771 §2(a). E.O. 13771 states that executive departments or agencies must identify at least two regulations for
repeal for each new regulation issued. For more information, see CRS Report R44840, Cost and Benefit Considerations
in Clean Air Act Regulations, by James E. McCarthy and Richard K. Lattanzio.
103 E.O. 13771 §2(c).

EPA’s Proposal to Repeal the Clean Power Plan: Benefits and Costs
Congressional Research Service R45119 · VERSION 3 · UPDATED 19
a consistent framework for evaluating the potential effects of proposed regulatory options.
Though it is informative, benefit-cost comparisons—whether the monetized benefits exceed the
costs—do not drive a decision on a regulatory proposal. First, there may be important qualitative
impacts not captured in the monetized estimates that would inform a determination as to whether
the benefits justify the costs of an action. Second, decisionmakers consider an array of factors—
including legal considerations, technical feasibility, statutory criteria, and ethical considerations—
when developing and finalizing regulatory proposals. For example, EPA based the proposed CPP
repeal on a change in the agency’s legal interpretation of Section 111(d) of the Clean Air Act and
is required to adhere to the rulemaking procedures under Section 307(d) of the act.
Quantifying and monetizing the benefits and costs of a proposed regulation can be a complex
task. It may draw upon scientific data from multiple disciplines and involve ethical or policy-
based decisions, such as the selection of an intergenerational discount rate. EPA’s analyses of the
2015 CPP and the 2017 proposed repeal provide examples of ways that changes in policy
priorities and technical information, such as updated information about dynamic factors such as
the U.S. power sector, may influence the estimation of benefits and costs. EPA’s 2017 benefit-
cost analysis reached different conclusions than the 2015 analysis due in large part to the changes
in the way it estimated economic impacts. The two changes driving the difference in conclusions
were (1) use of new SCC estimates that lowered climate benefit estimates and (2) use of
thresholds that reduced human health co-benefit estimates.
Members of Congress have taken divergent views on EPA regulatory policy, in particular the
development and promulgation of GHG-related regulations. As EPA considers its proposal to
repeal the CPP, Congress, in its oversight role, may consider the extent to which policy priorities
influence regulatory decisions. Decisions on regulations such as the CPP have the potential to
affect major industries, such as the U.S. energy sector and the health and welfare of U.S. citizens.
This report described how EPA’s assessment of the benefits and costs of the CPP changed
between two Administrations. These changes appear to reflect differences in policy priorities
between the Trump and Obama Administrations.
For example, EPA’s 2017 analysis used “interim” SCC estimates developed in response to E.O.
13783, which characterized the Obama Administration’s IWG SCC estimates as “no longer
representative of governmental policy.”104 The interim SCC estimates generally followed the
IWG’s methodology except with respect to the scope of the estimates—global versus domestic
measures of climate change impacts—and discount rates. The domestic perspective and use of a
7% rate lowered the interim SCC estimates, thereby reducing the estimated CPP climate benefits
(i.e., the forgone climate benefits of the proposed repeal).
Congress may also consider whether the withdrawal of the IWG SCC estimates—which
harmonized the way federal agencies valued GHG impacts in regulatory analysis—will lead to
differences across federal agencies in their decisions on GHG-related regulations. EPA’s 2017
analysis provided few details about next steps for the SCC and the implications, if any, for other
federal analyses. For example, EPA stated that the interim SCC estimates values were developed
“for use in regulatory analyses until an improved estimate of the impacts of climate change to the
U.S. can be developed based on the best available science and economics” but did not provide a
timeline for updates.105 It is unclear whether other agencies and departments will use the same
interim estimates in their own regulatory analyses. To date, at least one other agency—the U.S.
104 E.O. 13783 §5(b).
105 2017 RIA, p. 42.

EPA’s Proposal to Repeal the Clean Power Plan: Benefits and Costs
Congressional Research Service R45119 · VERSION 3 · UPDATED 20
Bureau of Land Management (BLM)—has followed a similar approach as the EPA.106 On the
other hand, the Department of Energy continued to use the IWG SCC estimates in one
rulemaking, which was published several months after the Administration withdrew those
estimates.107
In addition, Congress may consider whether EPA’s changes to the health co-benefits analysis will
set a precedent for future air pollution rulemakings. The human health co-benefits reported in
EPA’s 2017 analysis reflected different policy determinations than did the 2015 analysis. EPA
described the same health impacts literature in the 2015 and 2017 analyses, stating in both
analyses that while there is lower confidence in benefits occurring from PM reductions at lower
concentrations, the “scientific evidence provides no clear dividing line” to set a threshold.108
While previous EPA analyses, including the 2015 CPP analysis, explored uncertainty in benefit
estimates relative to benchmark concentrations, the 2017 analysis differed by using a threshold to
calculate PM mortality impacts. Furthermore, the exclusion of health co-benefits from one of the
benefit-cost comparisons departed from the 2015 CPP analysis and federal guidance to consider
both direct and ancillary impacts.
Author Information
Kate C. Shouse
Analyst in Environmental Policy
Disclaimer
This document was prepared by the Congressional Research Service (CRS). CRS serves as nonpartisan
shared staff to congressional committees and Members of Congress. It operates solely at the behest of and
under the direction of Congress. Information in a CRS Report should not be relied upon for purposes other
than public understanding of information that has been provided by CRS to Members of Congress in
connection with CRS’s institutional role. CRS Reports, as a work of the United States Government, are not
subject to copyright protection in the United States. Any CRS Report may be reproduced and distributed in
its entirety without permission from CRS. However, as a CRS Report may include copyrighted images or
material from a third party, you may need to obtain the permission of the copyright holder if you wish to
copy or otherwise use copyrighted material.
106 BLM used interim, domestic estimates of the social cost of methane to analyze a rulemaking that delayed certain
requirements of the 2016 Waste Prevention Rulemaking. See BLM, “Regulatory Impact Analysis for the Final Rule to
Suspend or Delay Certain Requirements of the 2016 Waste Prevention Rule,” December 2017,
https://www.regulations.gov/document?D=BLM-2017-0002-17369.
107 See, for example, Department of Energy, “Energy Conservation Program: Energy Conservation Standards for Walk-
In Cooler and Freezer Refrigeration Systems,” 82 Federal Register 31808, 31811, July 10, 2017.
108 2017 RIA, p. 51; 2015 RIA, p. 4-39.
![Sierra Club - Clean Water Rule Repeal Resources …...Sample Action Alert - Clean Water Rule Repeal Summer 2017 Email to your members, Subject line: Dear [[First_Name]], Our water](https://static.fdocuments.in/doc/165x107/5fc649ff6841cf491d0ca70b/sierra-club-clean-water-rule-repeal-resources-sample-action-alert-clean.jpg)