EPA's 33/50 Program Company Profile - Monsantoinfohouse.p2ric.org/ref/22/21106.pdf · EPA’s 33/50...
30
United States Office of Pollution 211 b 4 EPA745-K-95-008 Environmental Protection Prevention and Toxics ,&J p November 1995 Agency 7408 J" 8EPA EPA's 33/50 Program / Company Profile Monsanto 68 Printed on Recycled Paper
Transcript of EPA's 33/50 Program Company Profile - Monsantoinfohouse.p2ric.org/ref/22/21106.pdf · EPA’s 33/50...

United States Office of Pollution 211 b 4 EPA745-K-95-008 Environmental Protection Prevention and Toxics ,&J p November 1995 Agency 7408 J"
8EPA EPA's 33/50 Program / Company Profile
Monsanto
68 Printed on Recycled Paper
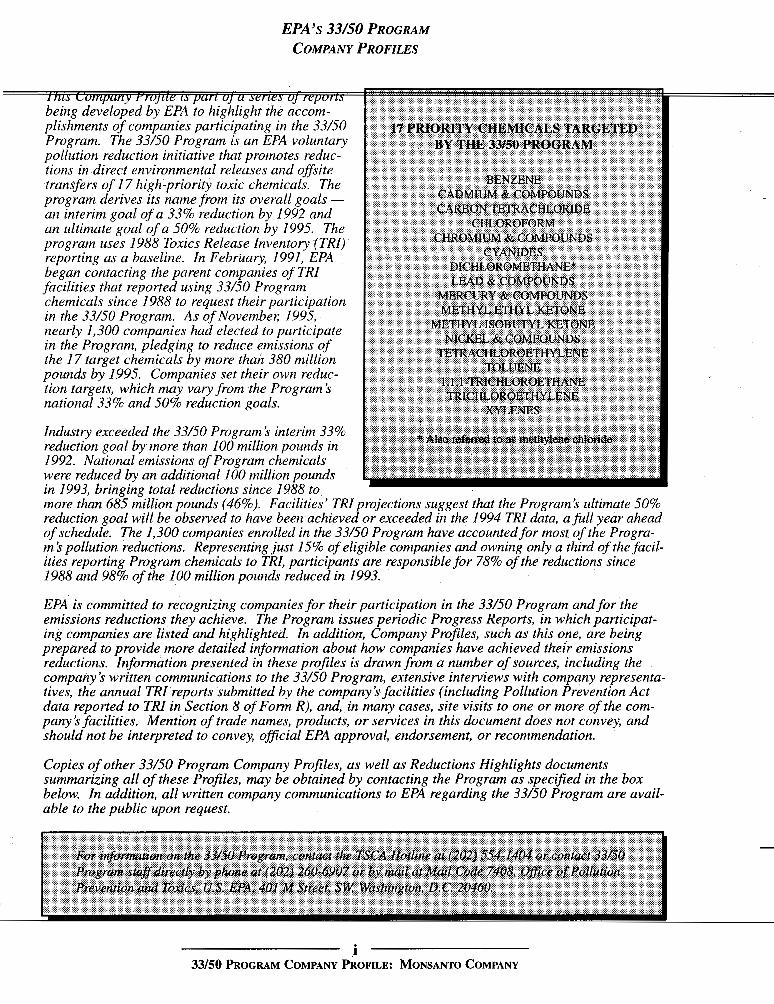
EPA’s 33/50 PROGRAM COMPANY PROFILES
reporting as a baseline. In February, 1991, EPA began contacting the parent companies of TRI facilities that reported using 33/50 Program chemicals since I988 to request their participation in the 33/50 Program. As of Novembel; 1995, nearly 1,300 companies had elected to participate in the Program, pledging to reduce emissions of the I7 target chemicals by more than 380 million pomds by 1995. Companies set their own reduc- tion targets, which may vary from the Program’s national 33% and 50% reduction goals.
Industry exceeded the 33/50 Program’s interim 33% reduction goal by more than 100 million pounds in 1992. National emissions of Program chemicals were reduced by an additional 100 million pounds in 1993, bringing total reductions since 1988 to more than 685 million pounds (46%). Facilities’ TRI projections suggest that the Program’s ultimate 50% reduction goal will be observed to have been achieved or exceeded in the 1994 TRI data, a full year ahead of schedule. The 1,300 companies enrolled in the 33/50 Program have accounted for most of the Progra- m ’s pollution reductions. Representing just 15% of eligible companies and owning only a third of the facil- ities reporting Program chemicals to TRI, participants are responsible for 78% of the reductions since 1988 and 98% of the 100 million pounds reduced in 1993.
EPA is committed to recognizing companies for their participation in the 33/50 Program and for the emissions reductions they achieve. The Program issues periodic Progress Reports, in which participat- ing companies are listed and highlighted. In addition, Company Profiles, such as this one, are being prepared to provide more detailed information about how companies have achieved their emissions reductions. Information presented in these profiles is drawn from a number of sources, including the company ’s written communications to the 33/50 Program, extensive interviews with company representa- tives, the annual TRI reports submitted by the company’s facilities (including Pollution Prevention Act data reported to TRI in Section 8 of Form R), and, in many cases, site visits to one or more of the com- pany’s facilities. Mention of trade names, products, or services in this document does not convey, and should not be interpreted to convey, oflcial EPA approval, endorsement, or recommendation.
Copies of other 33/50 Program Company Profiles, as well as Reductions Highlights documents summarizing all of these Profiles, may be obtained by contacting the Program as specified in the box below. In addition, all written company communications to EPA regarding the 33/50 Program are avail- able to the public upon request.
i 33/50 PROGRAM COMPANY PROFILE: MONSANTO COMPANY
P
SUMMARY
onsanto Company joined the 33/50 Program in May I991 with a goal M of reducing on-site releases of 33/50
Program chemicals from US. facilities by 50 percent by 1995, using 1988 as a baseline. Since then, Monsanto reduced releases of 33/50 Program chemicals by 66 percent from 2,567,783 pounds in I988 to 865,629 pounds in 1993. Monsanto also reduced off-site trans- fers of 33/50 Program chemicals by 71 percent from 2,781,569 pounds in 1988 to 817,466 pounds in 1993.
In addition, Monsanto ’s Air Emissions Reduction Program aims at reducing air emissions of TRI chemicals from all facilities worldwide by 90
COMPANY BACKGROUND
percent by the end of 1992, using 1987 as the baseline. This effort was successfully completed by the end of 1992, when a 90percent reduction in air emissions was achieved. The Company also continues in a parallel effort to reduce
,multi-media releases and transfers of toxic chemicals from 338 million pounds in the 1990 base year to less than 100 million pounds by the end of 1995. This case study provides an overview of Monsanto’s efforts to implement the 33/50 Program at its facilities in the U S . It also highlights two projects - the reduction of xylene emissions through equipment upgrades and process redesign, and the reduction of toluene emissions using vapor balancing and steam stripping.
onsanto, a Fortune 100 Company based in St. Louis, Missouri, is the fourth largest chemical company in the United States. Founded in 1901 when M Monsanto Chemical Works was established to manufacture saccharin, the
Company now employs nearly 30,000 individuals worldwide at 33 major manufacturing locations. Monsanto manufactures and markets agricultural products, prescription pharmaceuticals, food ingredients, industrial chemicals, and performance chemicals used in ccnsumer products. At the end of 1994, the Company was organized into the fol- lowing four operating units or subsidiaries:
0 The Chemical Group manufactures a range of high-performance materials including fibers, SaflexTM plastic interlayer, phosphorus and its derivatives, rubber and process chemicals, and plastics used to make consumer, household, automotive, and industrial products.
Monsanto
I
33/50 PROGRAM COMPANY PROFILE: MONSANTO COMPANY
Monsanto manufac- tures and markets agricultural prod- ucts, prescription pharmaceuticals, food ingredients, industrial chemi- cais, and perfor-
mance chemicals used in consumer
products.
The “Monsanto Pledge, yy drafted in
1992, provides a framework to guide
Monsanto’s envi- ronmental manage-
ment efforts. It also sets a structure for
continuously improving perfor- mance, protecting ,
the safety of employees, and
creating programs . that demonstrate
the company” commitment to
such/ responsibiiity.
0 The Agricultural Group manufactures herbicides, lawn-and-garden products,
serve environmental quality in agricultural, industrial and residential markets.
0 Searle, a wholly owned subsidiary of Monsanto, develops and markets pre- scription pharmaceuticals, including medications to treat infections, arthritis pain, high blood pressure, the formation of ulcers, and insomnia.
0 The NutraSweet Company is also a wholly owned subsidiary of Monsanto and man- ufactures and markets sweeteners and other food ingredients, including NutraSweetTM sweetener, EqualTM and NutraSweet SpoonfulTM brand tabletop sweeteners.
[n addition to those mentioned above, some of Monsanto’s well known brands include RoundupTM and LassoTM herbicides, OrthoTM lawn-and-garden products, Wear-DatedTM carpet, md Calm’” calcium channel blocker. In 1993, Monsanto reported net sales of $7.9 billion.
ENVIRONMENTAL STRATEGY The “Monsanto Pledge,” drafted in 1992, provides a framework to guide Monsanto’s mvironmental management efforts. It also sets a structure for continuously improving performance, protecting the safety of employees, and creating programs that demon- strate the Company’s commitment to social responsibility. The “Monsanto Pledge,’’ as mtlined in the Company’s Environmental Annual Review, is to:
0 “reduce all toxic and hazardous releases and emissions, working toward an ulti-
0 ensure no Monsanto operation poses any undue risk to employees and communities; 0 work to achieve sustainable agriculture through new technology and practices; 0 ensure groundwater safety; 0 maintain community safety awareness at manufacturing sites; 0 manage all corporate real estate, including plant sites, to benefit nature; and 0 search worldwide for technology to reduce and eliminate waste from operations,
mate goal of zero effect;
with emphasis on not generating waste in the first place.”
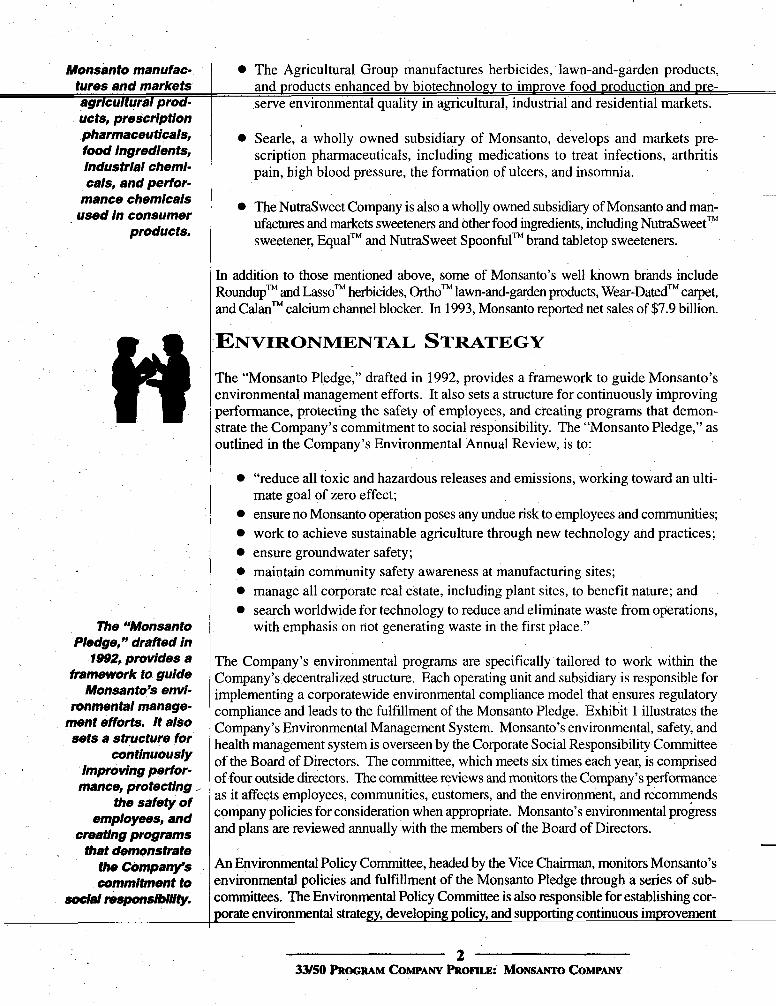
I’he Company’s environmental programs are specifically tailored to work within the clompany ’s decentralized structure. Each operating unit and subsidiary is responsible for implementing a corporatewide environmental compliance model that ensures regulatory :ompliance and leads to the fulfillment of the Monsanto Pledge. Exhibit 1 illustrates the Zompany ’s Environmental Management System. Monsanto’s environmental, safety, and iealth management system is overseen by the Corporate Social Responsibility Committee If the Board of Directors. The committee, which meets six times each year, is comprised 3f four outside directors. The committee reviews and monitors the Company’s performance zs it affects employees, communities, customers, and the environment, and recommends :ompany policies for consideration when appropriate. Monsanto’s environmental progress md plans are reviewed annually with the members of the Board of Directors.
4n Environmental Policy Committee, headed by the Vice Chairman, monitors Monsanto’s :nvironmental policies and fulfillment of the Monsanto Pledge through a series of sub- :o”ittes. The Environmental Policy Committee is also responsible for establishing cor- mate environmental strategy, developing policy, and supporting continuous improvement
2 33/50 PitOCRAM COMPANY PROFILE: MONSANTO COMPANY
I Board of Directors I I bc-er I b Comorate Social I I Responsibility Committee I
E .s 9
4 Responsible Care
Monsanto Pledge
Sustainable Development
I I 4
I I Chief Environmental
Officer b Vice Chairman Committee
E 8 CorporateEnvironmental Safe& and Health Dept.
E I &
Regulations
w 7
a 8 Operating Units Monsanto Operations -
Worldwide ES&H Departments
Compliance Process
. .= b Board of Directors b Environmental Annual Review
b Communities 0 b Environmental Policy Committee b Financial Reports
&
Employee Recognition .Awards b Rewards b Communications
of environmental, safety and health performance. The Corporate Environmental, Safe1 and Health Department oversees issues at Monsanto relating to regulatory managemen safety, toxicology, occupational medicine, quality assurance, and industrial hygiene. Tl department is responsible for conducting or overseeing periodic environmental, safety, an health audits to ensure compliance with company policy and procedures. Results of the! evaluations are reported to corporate, opemting unit, and subsidiary management. To overs the impfementation of Monsanto's environmental programs, each of the Company's foi operating units and subsidiaries appoints individuals to accept primary responsibility fc coordinating environmental operations. Monsanto has more than 1,100 employees at t€ corporate, operating group, and plant levels worldwide whose primary responsibility work on environmental, safety, and health issues.
Exhibit 1 $
Monsanto 's Environmental Management System
3 33150 PROCRAM COMPANY PRO~LE: MONSANTO COMPANY
In 1990, Monsanto established a
multi-medla pollution prevention program that targets releases and tnrnsfers of toxic ahemicas woddwlde.
In addition to par- ticipatlng in the 33/50 Program,
selected Monsanto plants also partici-
pate In the U.S. €PA% Green tights
and Waste Wise voluntary programs.
In early 1995, Monsanto announced a reorganization which led to the formation of 15
Environmental Safety & Health Division. The SBUs were formed as the Company’s business-directed profit centers to obtain business services (including those associated with environmental programs and compliance) from a corporate-wide Business Services function. Each Business Services group, one of which is the Corporate Environmental Safety & Health Division, provides its services to each of the 15 SBUs. The result of this reorganization will not affect the Company’s environmental programs and goals, however it will allow the Corporate Environmental Safety & Health Division to manage its programs in a more cost-effective and responsive manner.
IC B- (SBUs).” and the oarallel re
Reducing pollution is a primary goal in Monsanto’s operations. In 1990, Monsanto estab- lished a multi-media pollution prevention program that targets releases and transfers of toxic chemicals worldwide. The goal of this program is to reduce toxic chemical (defined by the Company as those chemicals included in the TRI) releases and trans- fers worldwide to less than 100 million pounds per year by the end of 1995, using 1990 releases and transfers of TRI chemicals as the baseline. As 1990 releases and transfers of these chemicals worldwide were 337.7 million pounds, this program represents a reduc- tion goal of just over 70 percent.
Monsanto also initiated a program targeted at reducing air emissions of toxic chemi- cals from all plants worldwide by 90 percent by the end of 1992, using 1987 as a base- line. In the United States, the program defines toxic chemicals as those included in the TRI, while for plants in other countries, the program includes TRI chemicals as well as other chemicals designated locally as chemicals of concern. As of the end of 1992, Monsanto had achieved a worldwide reduction of approximately 90 percent, a signif- icant portion of which can be attributed to the closure of a manufacturing unit in Newport, Wales, United Kingdom, where large amounts of carbon monoxide and butane (locally designated chemicals of concern) were emitted. In the United States, Monsanto achieved a reduction of 85 percent as part of this program.
[n addition to participating in the 33/50 Program, selected Monsanto plants also par- ticipate in the U.S. EPA’s Green Lights and WasteWi$e voluntary programs. The ;ompany has won a number of awards for its environmental programs, both on the national and state level. Monsanto received the Honor Roll Award from the Isaak Walton League in 1990 for its efforts to protect the environment. Monsanto also received the Honor Roll Award in 1992 from the National Environmental Development Association. rhis award was given to companies for “effective management of environmental quality, protection and enhancement of natural resources, and/or promotion of envi- ronmental responsibility both inside and outside the organization.” The following is a list of some of the awards received by Monsanto facilities at the state level:
Ohio: Recognition for past and continuous commitment to reduce air emissions, awarded by the Governor of Ohio in 1993.
Massachusetts: The 1991 Outstanding Award for Achievement in the Protection of the Environment and the Preservation of Open Space.
Tennessee: Excellence in Environmental Cleanup Award, given by the Tennessee Association of Business in 1989.
4 33/50 PROGRAM COMPANY PROFILE: MONSANTO COMPANY
Illinois: First Annual Environmental Citizenship Award, received in 1991.
Michgan: The 1993 E nvironmental Quality Award from the Michigan Chamber of Commerce.
Florida: Take Pride in Florida Award, for sponsorship of “Environmental Classroom” in 1992.
Mon!anto’s expenditures in 1993 were approximately $53 million for environmental capital projects and approximately $233 million for management of environmental programs, including the operation and maintenance of facilities for environmental control. Monsanto estimates that during 1994 and 1995 approximately $40 to $70 million per year will be spent on additional capital projects for environmental protection.
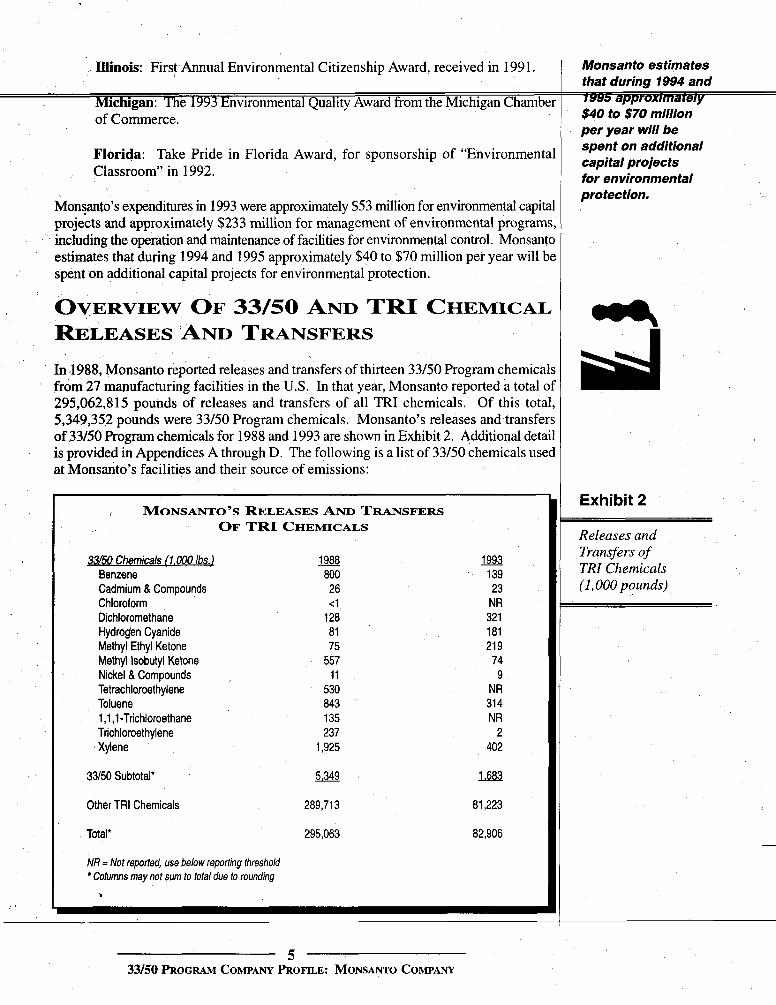
OVERVIEW OF 33/50 AND TRI CHEMICAL RELEASES AND TRANSFERS In 1988, Monsanto reported releases and transfers of thirteen 33/50 Program chemicals from 27 manufacturing facilities in the U.S. In that year, Monsanto reported a total of 295,062,815 pounds of releases and transfers of all TRI chemicals. Of this total, 5,349,352 pounds were 33/50 Program chemicals. Monsanto’s releases and transfers of 33/50 Program chemicals for 1988 and 1993 are shown in Exhibit 2. Additional detail is provided in Appendices A through D. The following is a list of 33/50 chemicals used at Monsanto’s facilities and their source of emissions:
MONSANTO’S RELEASES AND TRANSFERS OF TRI CHEMICALS
33/50 Chemicals (1.000 Ibs.) Benzene Cadmium 8, Compounds Chloroform Dichloromethane Hydrogen Cyanide Methyl Ethyl Ketone Methyl Isobutyl Ketone Nickel & Compounds Tetrachloroethylene Toluene 1 ,I ,1-Trichloroethane Trichloroethylene Xylene
m 800 26 <I
128 81 75
557 11
530 043 135 237
1,925
1993 139 23
NR 321 181 21 9 74
9 NR 31 4 NR
2 402
33/50 Subtotal’ 5.349 1.683
Other TRI Chemicals 289,713 81,223
Total’ 295,063 82,906
NR = Not reporfed, use below reporting threshold Columns may not sum to total due to rounding b
Monsanto estimates that during 1994 and
$40 to $70 million per year will be spent on additional capital projects for environmental protection.
Exhibit 2
Releases and Transfers of TRI Chemicals (1,000 pounds)
5 33/50 PROGRAM COMPANY PROFILE: MONSANTO COMPANY

Transfers Wslte for Transfers to POTW Treatmenu Disposal/
Releases to Land Surface Water Discharges
4 40%
In 1988, Monsanto
transfers of thirteen 33/50 Program
chemicals from 27 manufacturing
facilities in the U.S.
-- \ a n d \
. P
Benzene is primarily used as a building block chemical in several processes. Almost half of the chemical releases and off-site transfers were transfers to a POTW with large amounts also released as air emissions. Small quantities of benzene were also injected underground or released to land.
Cadmium & cadmium compounds are used in metal plating processes to increase resistivity and provide resistance against corrosion. They were primarily transferred off-site for treatment or disposal.
Chloroform was used as a solvent and was released as air emissions and transfers to a POW.
Dichloromethane is used as a solvent. Large quantities of the chemical were injected underground, with the remainder released as air emissions.
Hydrogen cyanide is used as a building block chemical in the production of several chemical intermediates. The majority is injected underground, and small quantities are released as air emissions.
Methyl ethyl ketone (MEK) is primarily used as a solvent in several processes. Large quantities are transferred to a P O W , with small amounts transferred off-site, and the remainder released through underground injection and air emissions.
Methyl isobutyl ketone (MIK) is also used as a solvent in several processes. Large quantities of the chemical were transferred off-site, with smaller quantities transferred to a POW, released as air emissions, and injected underground.
Nickel & nickel compounds are present in metal alloys and are used in plating processes to provide resistance against corrosion. Most nickel is injected underground, however small quantities are discharged to surface water or released to land. Nickel compounds were released to land and discharged to surface water.
Tetrachloroethylene was used as a solvent, and was primarily released as air emissions, with small quantities transferred off-site, and the remainder transferred to a POTW.
6 33/50 PROGRAM COMPANY PROFILE: MONSANTO COMPANY
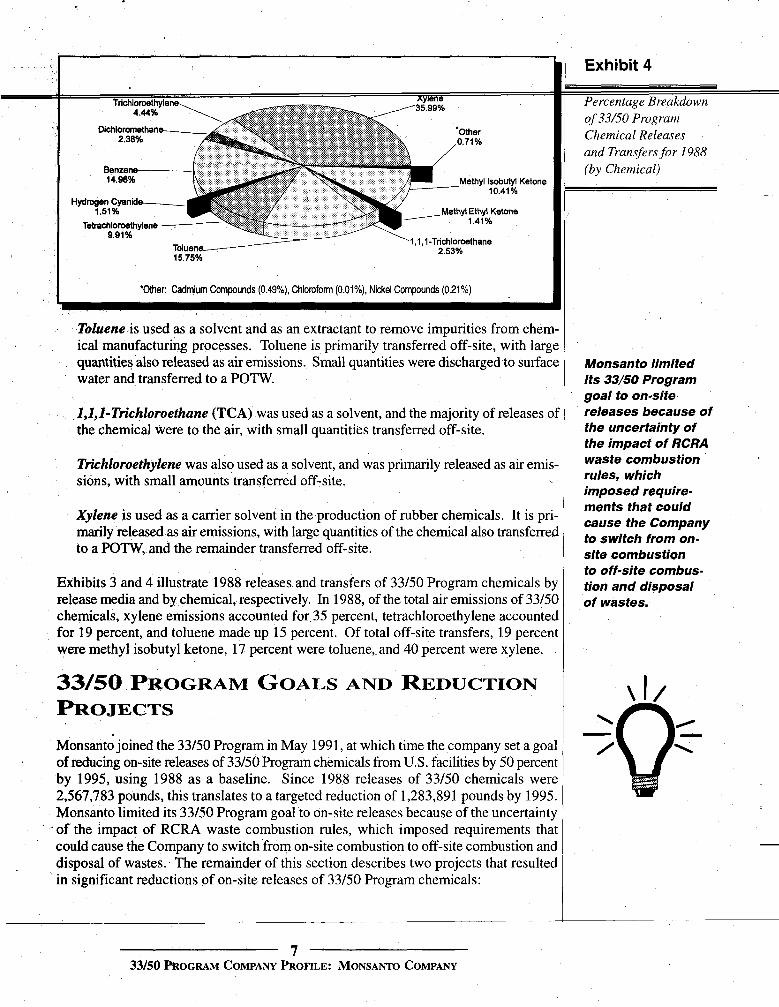
Chemical Releases and Transfers for 1988
Dichloromethan
Methyl Isobutyl Ketone .__ ~ ~
Hydrogen Cyanide--, Methyl Ethyl Ketone
Tetrachloroethylene
1,l .l-Trichloroethane
Toluene is used as a solvent and as an extractant to remove impurities from chem- ical manufacturing processes. Toluene is primarily transferred off-site, with large quantities also released as air emissions. Small quantities were discharged to surface water and transferred to a P O W .
I,l,l-Trichluroethane (TCA) was used as a solvent, and the majority of releases of the chemical were to the air, with small quantities transferred off-site.
Trichloroethylene was also used as a solvent, and was primarily released as air emis- sions, with small amounts transferred off-site.
Xylene is used as a carrier solvent in the production of rubber chemicals. It is pri- marily released as air emissions, with large quantities of the chemical also transferred to a POW, and the remainder transferred' off-site.
Exhibits 3 and 4 illustrate 1988 releases and transfers of 33/50 Program chemicals by release media and by chemical, respectively. In 1988, of the total air emissions of 33/50 chemicals, xylene emissions accounted for 35 percent, tetrachloroethylene accounted for 19 percent, and toluene made up 15 percent. Of total off-site transfers, 19 percent were methyl isobutyl ketone, 17 percent were toluene, and 40 percent were xylene.
I 33/50 PROGRAM GOALS AND REDUCTION PROJECTS Monsanto joined the 33/50 Program in May 1991, at which time the company set a goal of reducing on-site releases of 33/50 Program chemicals from U.S. facilities by 50 percent by 1995, using 1988 as a baseline. Since 1988 releases of 33/50 chemicals were 2,567,783 pounds, this translates to a targeted reduction of 1,283,891 pounds by 1995. Monsanto limited its 33/50 Program goal to on-site releases because of the uncertainty
. of the impact of RCRA waste combustion rules, which imposed requirements that could cause the Company to switch from on-site combustion to off-site combustion and disposal of wastes. The remainder of this section describes two projects that resulted in significant reductions of on-site releases of 33/50 Program chemicals:
Monsanto limited its 33/50 Program goal to on-site releases because of the uncertainty of the impact of RCRA waste combustion rules, which imposed require- ments that could cause the Company to switch from on- site combustion to off-site combus- tion and disposal of wastes.
\ I /
7 33/50 PROGRAM COMPANY PROFILE: MONSANTO COMPANY
The 4NDPA DepaHment plant
and process engi- neers followed
Monsanto’s three- tiered prlorily
approach to achieve reductions in air emisslonS of TRI
chemlcals - reduce, recycley treat.
Proiect #I: Reduction Program
The W.G. Krummrich Plant, located in Sauget, Illinois, is one of the largest Monsanto manufacturing sites supporting the Chemical Group. It produces a variety of chemical intermediates, including: paradichlorobenzene, a component of mothballs and bathroom cleaners; rubber chemicals, used in the production of tires and other rubber products; phosphorus pentasulfide, used in motor oils to prevent corrosion; monochlorobenzene,
glass coating.
Krummrich 4-nitrodiuhenvlamine (4NDPA) Xvlene Emission
used in LassoTM herbicide; and orthonitroaniline, which is used in Monsanto’s SaflexTM ~~
In 1988, Monsanto made a voluntary pledge to reduce its TRI-reported air emissions by 90 percent by the end of 1992 from a 1987 baseline. This pledge, coupled with the company’s participation in the 33/50 Program beginning in 1991, led engineers at the Krummrich plant to assess methods of reducing releases of xylene, among other chem- icals, from the plant. Prior to 1988, no major efforts had been made to reduce xylene use, primarily because of the low cost of the chemical, the complexity of the process, and a greater emphasis at the time on wastewater reduction and treatment projects.
Ninety percent of the xylene air emissions at the Krummrich plant are generated by the 4NDPA Department. This department, which opened in the early 1960’s, produces 4- nitrodiphenylamine (4NDPA). 4NDPA is not sold by Monsanto, but is an intermediate ingredient used in making additives used in rubber products like tires and hoses. Xylene is used as a carrier solvent in the manufacture of 4NDPA, but it is not consumed in the manufacturing process. In 1987, the 4NDPA Department at the Krummrich plant reported 831,000 pounds of air emissions of TRI chemicals, primarily xylene. However, sampling and tests carried out in 1991 indicated that the 1987 baseline may have been underestimated by approximately 300,000 pounds of additional xylene. It was clear from the onset that the Krummrich 4NDPA Department’s air emissions reduction program was critical to the Rubber Chemicals Division, as well as the entire Company, in ensuring that they would be able to meet Monsanto’s public pledge of a 90 percent TRI air emissions reduction.
The 4NDPA Department plant and process engineers followed Monsanto’s three-tiered priority approach to achieve reductions in air emissions of TRI chemicals - reduce, recycle, treat. The first tier included a number of xylene reduction projects, all of which included supplemental benefits of cost reductions and/or process improvements. Some of the projects undertaken to reduce the usage of xylene included the following:
0 Nitrogen system upgrades - The 4NDPA Department maintains approximately 30 nitrogen blanketing systems that were installed at various times over the last few decades. In order to reduce xylene emissions from these systems, old units were replaced and the new systems were installed in such a way as to allow for easier troubleshooting, identification of leaks, and repairs. These upgrades resulted in approximately 200,000 pounds of xylene emissions reductions.
- 0 Centrifuge replacement project - The centrifuge used by the 4NDPA Department was 25 years old and had significant mechanical reliability problems associated with its use which resulted in preventable xylene emissions. This cen- trifuge was replaced with a new unit that was designed with special features aimed
8 33/50 PROGRAM COMPANY PROFILE: MONSANTO COMPANY
~ at achieving a better seal, thereby reducing xylene emissions. The replacemen project accounted for a 200,000 pound reduction in xylene emissions.
~ ~~
0 Melt tank and screw conveyor replacement - During the 4NDPA productior process, the centrifuge discharge was moved directly to a melt tank for furthei processing. In the past, the discharge was transported between the centrifuge anc the melt tank using a screw conveyor. This process resulted in significant xylem emissions as the process was not tightly sealed. When it was necessary tc replace the melt tank, the new tank was placed directly beneath the centrifuge thereby eliminating the need to transport discharge using the screw conveyor. Due to their new proximity to one another, the centrifuge and melt tank were connectec using a tightly sealed chute. This process change resulted in a 95,000 pound reduc- tion in xylene emissions.
Agitator seal replacement project - An agitator system used to mix product5 during an intermediate processing step was difficult to maintain properly a n d resulted in significant xylene emissions through a seal at the top of the tank Engineers replaced the agitator system with a new pump and recirculation system that mixes tank contents by pumping material from the bottom of the tank to the top of the tank on a continuous basis. This new system has no seal at the top tc allow leakage and has resulted in xylene emissions reductions of 70,000 pounds
Four additional first tier projects in the 4NDPA Department resulted in reductions ranging from 2,000 to 25,000 pounds, and totalling 52,000 pounds. Therefore, reduc- tions in xylene air emissions achieved from first tier projects alone totalled more than 600,000 pounds. Implementing these first tier projects required a total capital expen- diture of $1.7 million, which yielded an average return on capital of 20 percent.
The second tier projects focused on the capture and recycling of xylene air emissions. They consisted primarily of smaller projects to link tank vents and install additional con- densers. In total, these projects resulted in a 160,000 pound reduction in xylene air emis- sions in the 4NDPA Department.
After reducing the use of xylene and recycling xylene to the maximum extent possible through the first and second tier projects, the 4NDPA Department at Krummrich under- took a third tier project to destroy remaining xylene vapors generated in the manufac- turing process. This project involved the installation of a thermal oxidizer in January 1993, which has resulted in a reduction in xylene air emissions of 180,000 pounds.
Underlying all three tiers of the xylene air emissions reduction program was the need for increased levels of preventive and routine maintenance on all equipment to prevent leakage. As a result of this increased maintenance, and the completion of the various reduction, recycling, and treatment projects, the 4NDPA Department at Monsanto’s Krummrich plant was successful in reducing xylene air emissions by almost 1,000,000 pounds. In addition, the Department achieved these reductions during a period in which production increased dramatically. During this increase, plant expansions included measures that would allow for further reductions in xylene air emissions.
As a result of increased mainte- nance, and the com- pletion of the vari- ous reduction, recy- cling, and treatment projects, the 4NDPA Department at Monsanto’s Krummrlch plant was successful in reducing xylene air emissions by almost 1,000,OOO pounds.
9 33/50 PROGRAM COMPANY PROFILE: MONSANTO COMPANY

The vapor baianc- ing technique
required ail tank vents to be tied
together and con- solidated to one
common vent.
impiementing the vapor balancing process, which required piping reinforcements,
new agitator seals, and new seal-less pumps, required a total capital invest- ment of $l,OOO,OOO.
Proiect #2: Reduce Toluene hmws wns and Ke cvcle 'Ibluene at a t - w z ~ ~ o . West Y;rpiniu usinp VaDo r Bahncint? and Steam Stn 'DDinn
The facility located in Nitro, West Virginia manufactures chemicals used in the cation of rubber tirgs. The principal chemicals prduced are sulfenamides, which are accelerators used to speed up the vulcanization process in the production of rubber chem- icals. The vulcanization process is a norireversible chemical reaction involving the use of sulphur compounds ,or other suitable catalysts to increase the elasticity of .rubber. Sodium 2-Mercaptobenzothiazole (NaMBT), a primary raw material used in the pro- duction of sulfenamides is also made at thePitro plant. During the intermediate stages of the manufacturihg process, toluene is used to extract impurities from NaMBT. Prior to process changes, toluene vapors were released from tank vents, and in 1988 the Nitro facility reported 135,000 pounds of toluene air emissions.
In order to reduce these emissions, and also recycle toluene for reuse, plant engineers and personnel from the Environmental Safety & Health Department came together to propose ideas for process modifications. The first step in the process reconfiguration was to determine the extent to which toluene was used in the process. An inventory of chemical use at the facility listed annual toluene usage at 300,000 pounds. The plant engineers considered using individual brine coo1ed"condensers on each tank to reduce toluene air emissions. Because implementing such a system involved very high costs, however, this technique was ruled out.
Engineers decided to use an approach known as vapor balancing to reduce toluene emis- sions and to recycle toluene by steam stripping. The NaMBT production process at the Nitro facility is comprised of a number of tanks and vessels which include mixers, dis- solvers, and storage tanks. The vapor balancing technique required all tank vents to be tied together and consolidated to one common vent. In a closed vent system, when liquid from one tank flows into another tank, the vapor displaced by incoming liquid flows back to the first tank to fill the volume created by emptying it. In this maruler the total pressure in all tanks is balanced at the common vent, and toluene vapor is contained within the closed vent system. Any vapor that is not balanced in the common vent is Yented through a brine cooled condenser, resulting in no significant ent loss from the vapor balancing process.
The vapor balancing project also included upgrading old agitator seals on tanks with new double mechanical seal agitators to prevent the leakage of toluene vapors from tanks m the production prbcess. Old pumps in the process were also replaced with seal-less pumps, or were fitted with double mechanical seals.
Because vapor balancing is a closed-loop system, fire safety considerations become extremely important. Should an explosion or fire occur from excessive pressure build up in one tank, the common vent could potentially act as a conduit for flames, and could cause a chain reaction throughout the entire system. To prevent such hazards from occur- ring, the system was installed with detonation arrestors in three or four places on the vent nozzles of tanks. The detonation arrestors, while maintaining an equilibrium pressure in the entire vent system, also act as safety devices in the event of a fire or explo- sion hazard. Implementing the vapor balancing process, which required piping rein- forcements, new agitator seals, and new seal-less pumps, required a total capital investment of $1 ,OOO,OOO.
1 .
10 33/50 P R 6 " COMPANY PROFILE: MONSANTO COMPANY

~~
With the adoption of vapor balancing to address toluene emissions, the plant engineer:
previous experience at a Monsanto facility in Antwerp, Belgium, the project engineers considered separating chemicals using steam stripping. After toluene is used in the man- ufacturing process to remove impurities from NaMBT, a mixture of NaMBT and toluene is stored in an extraction chamber. The steam stripping process involves sep- arating toluene from NaMBT using the “flash separation” technique. “Flash separation” is a common operation employed to separate and partially enrich a vapor-liquid mixture It occurs simply and spontaneously when a fluid passes through a pipeline restriction (usually a throttling valve) - the pressure drops, and vaporization of the toluene occurs. At this stage the toluene separates from NaMBT. The NaMBT is returned to product stohge and the toluene is passed through a condenser to a distillate tank. A dis- tillate pump transfers the tolueoe into two tanks in the main manufacturing process where it is reused.‘ For safety purposes, and prevention against fire, all flat bottom tanks and condenser outlets are nitrogen inerted (oxygen is displaced with nitrogen), and all tank vents entering the condenser header are fitted with flame arrestors.
>
Although most of the toluene is recovered in the steam stripping process, about 12 pounds/day of toluene is lost to a vent header from the stripper condenser. Implementing the steam stripping process required a total capital investment of $300,000. The annual raw material savings as a result of toluene recovery amounts to approximately $30,000.
Following the implementation of the vapor balancing and steam stripping processes in September 1992, the plant reported 22,600 pounds of toluene air emissions in 1993. This translates to over a 90 percent reduction in toluene air emissions from 1991 levels. Vapor balancing accounted for approximately 65 percent of this reduction and steam stripping accounted for approximately 25 percent. The remaining 10 percent of total reductions
,was accomplished by plugging leaks using seal-less pumps and mechanical agitator seals.
Other Proiects:
In addition to the above mentioned projects Monsanto also achieved reductions through many others, including the following projects:
0 ‘Use of an Aqueous-Clean-In-Place system, using high pressure water sprays as an altemative to solvent use in cleaning operations. This cleaning system is cur- rently used at a Searle Pharmaceuticals plant to clean reactor tanks, and has reduced toxic air emissions by 87 percent and liquid wastes by 71 percent.
0 The use of a cyclone separator to reduce toxic chemical air emissions from manufacturing processes. The separator captures the chemical in a powerful vortex and recycles the chemical into the manufacturing process. By installing this new system, Monsanto’s Ruabon plant in Wales, England eliminated more than 121,000 pounds in trichloroethylene emissions.
Implementing the steam stripping process required a total capital investment of $300,000. The annual raw material savings as a result of toluene recovery amounts to approxi- mately $30,000.
11 33/50 PROGRAM COMPANY PROFILE: MONSANTO COMPANY

Exhibit 5
Monsanto S Progress Towards Meeting
33/50 Goals
Exhibit 6
Percentage Breakdown of 33/50 Program
Chemical Releases and Transfers for 1993
(by Media)
F Y
4000
3000
‘E a,
% E 2000 0 r 8 .z 1000 I
0 - 2 u)
a, K 1988 1989 1990 1991 1992 1993
33/50 Goal: 50% Reduction in releases of 33/50 Chemicals by 1995
33/50 Goal -
53/50 PROGRESS onsanto was successful in reaching its 33/50 Program goal of a 50 percent reduc- tion in releases of 33/50 Program chemicals two years ahead of schedule, and M as of 1993 had achieved a 66 percent reduction. ’Exhibit 5 illustrates these reduc-
ons, and Exhibits 6 and 7 illustrate Monsanto’s 1993 releases and transfers of 33/50 hemicals by release media and by chemical, respectively. The major contributors to lonsanto’s success include the reductions of the following chemicals:
Benzene Toluene Trichloroethylene - 236,260 pounds (100 percent reduction) Xylene
255,083 pounds (74 percent reduction) 323,606 pounds (87 percent reduction)
644,694 pounds (80 percent reduction)
lonsanto achieved and exceeded its’33/50 Program goals largely as a result of its vol- ntary program to reduce air emissions of all TRI chemicals by 90 percent worldwide y the end of 1992. Also, the Company’s achievement towards meeting its multimedia oal by the end of 1995 provided an incentive to focus on reducing releases to, all me#a esides air emissions. Exhibit 8 shows releases and transfers of all TRI Chemicals from 988 to 1993.
Transfers Off-site for Treatment/ Disposal/
Transfers to P 24.10%
Air Emissions 27.16%
Releases to Land----- 0.02%
Surface Water Discharges Underground Injection 0.04%
24.21%
12 33/50 PROGRAM COMPANY PROFILE: MONSANTO COMPANY
,- CadmiumlCadmium 1.36%
- - - ---Methyl Ethyl Ketone
Dichloromethane..-- IS 05%
nchloroethylene--- 0.09%
Xylene 23.90% ----- Methvl lsobufvl Ketone
13.01%
--. Nickel . 4.4190 0.51%
Compounds
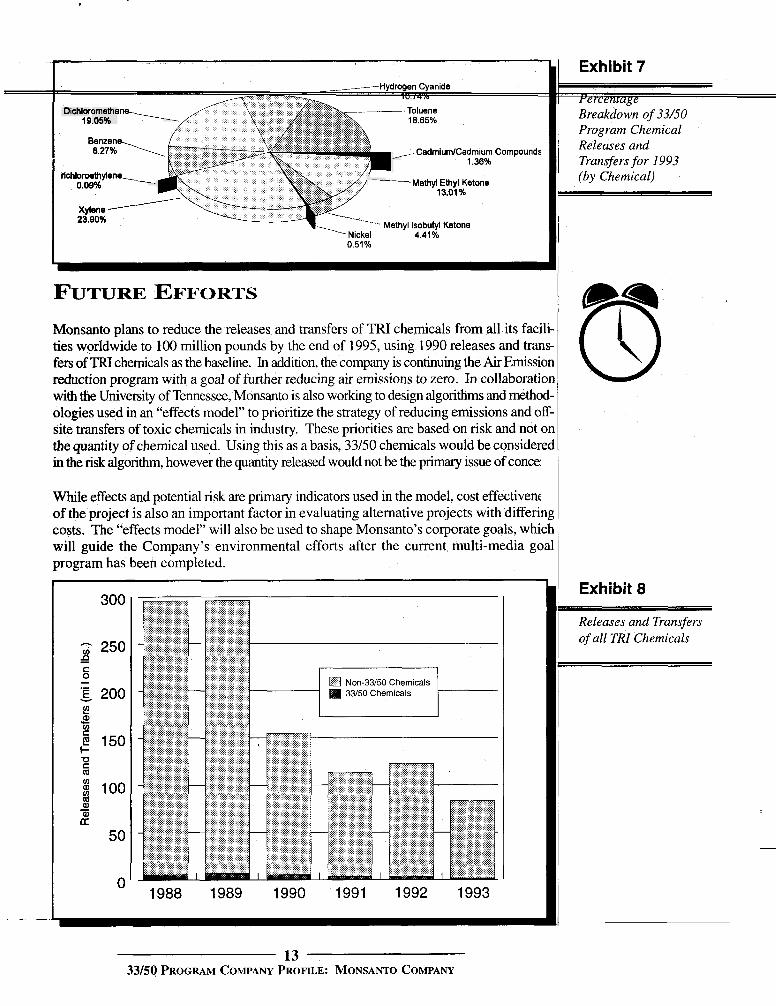
FUTURE EFFORTS Monsanto plans to reduce the releases and transfers of TRI chemicals from all its faci ties worldwide to 100 million pounds by the end of 1995, using 1990 releases and tra fen of TRI chemicals as the baseline. In addition, the company is continuing the Air Emissi reduction program with a goal of further reducing air emissions to zero. In collaborati with the University of Tennessee, Monsanto is also working to design algorithms and methc ologies used in an “effects model” to prioritize the strategy of reducing emissions and o site transfers of toxic chemicals in industry, These priorities are based on risk and not the quantity of chemical used. Using this as a basis, 33/50 chemicals would be consider in the risk algorithm, however the quantity released would not be the primary issue of concei
While effects and potential risk are primary indicators used in the model, cost effectivent of the project is also an important factor in evaluating alternative projects with differi costs. The “effects model” will also be used to shape Monsanto’s corporate goals, whi will guide the Company’s environmental efforts after the current multi-media gc program has been completed.
300
3 250 0 C 0 .- - - ‘E v 200 2 al v) - 3 150 I- U C m
100 : 0 al a: -
50
0 1988 1989 1990 1991 1992 1993
~ ~~
13 33/54 PROGRAM COMPANY PROFILE: MONSANTO COMPANY
Exhibit 7
r e r s Breakdown of 33/50 Program Chemical Releases and Transfers for 1993 (by Chemical)
__ ~~~
Exhibit 8
Releases and Transfers of all TRI Chemicals

CONTACT FOR FURTHER INFORMATION For additional information on this case study, please contact:
Mr. Dennis B. Redington Director, Regulatory Management Monsanto Company 800 N. Lindbergh Boulevard S t. Louis, MO 63 167 Tel: (314) 694-6503 Fax: (314) 694-8957
14 33/50 PROGRAM COMPANY PROFILE: MONSANTO COMPANY

Appendix A
Releases and Transfers of TRI chemiepls, 1988-1993 MonsPntoCompany *
Traosfers Percent Surface Off-Site Change
Total Air Water Underground Releases Tmnsfers forTreatment/ TotalReleases 1988-1993 Emissions Discharges Injection @Land toPOTW DisposaVoUler andTransfers TotalReleases
Chemical year @ o - w @ow&) (Pounds) @o&) @o&) (pounds) (pounds) andTransfers
Benzene
C a d ”
Cadmium compounds
Chlorofom
chro”c0mpounds
Dichloromethane
1988 1989 1990 1991 1992 1993
1988 1989 1990 1991 1992 1993
1988 1989 1990 1991 1992 1993
1988
1990
1988 1989 1990 1991 1992 1993
252,900 286,400 200,300 158,750 60,160 55,020
0 0 0 0 0 0
12 11 11 8 6 2
500
222
46,300 76,697 64,600 56,900 58,100
151,900
3 0 0 0 0 0
0 0 0
48 39 59
64 65 73 9
10 4
0
0
0 0 0 0 0 0
91,000 99,000 71,000 71,000 32,000 36,000
0 0 0 0 0 0
0 0 0 0 0 0
0
0
81,000 88,000
270,000 270,000 250,000 160,000
2,200 4,000 7,400
0 220,000
0
0 0 0
48 39 59
66 13 13 0 0 0
0
120
0 0 0 0 0 0
440,170 410,160 150,160
173 4,500
310
0 0 0 0 0 0
0 0 0 0 0 0
250
0
250 250 500
0 0 0
13,990 11,990 47,393 22,135
105,740 47,800
7,600 9,500 8,600 1,800 2,100 3,100
18,244 24,185 19,643 16,676 18,700 19,730
0
0
0 0 0 0 0
8,800
800,263 81 1,550 476,253 252,058 422,400 139,130
7,600 9,500 8.600 1,896 2,178 3,218
18,386 24,274 19,740 16,693 18,716 19,736
750
342
127,550 164,947 335,100 326,900 308,100 320,700
I
-83%
-58%
7%
151%

Appendix A Monsanto Company
Releases and Transfers of TRI Chemicals, 1988-1993
Transfa Percent Surface off-site Change
Total Air Water Underground Releases Transfa for Treatment/ Total Releases 1988-1993 Emissim Discharges Injection toLand toPOTW DisposaVOther andTramfa TotalReleases
Chemical Year (pounds) (pounds) (pounds) (pounds) (pounds) ( p o u m (pounds) andTransfa
Hydrogen cyanide 1988 1989 1990 1991 1992 1993
Lead 1989
Mercurycompounds 1989 1990 1991
Methyl ethyl ketone 1988 1989 1990 1991 1992 1993
Methyl isobutyl ketone 1988 1989 1990 1991 1992 1993
Nickel 1988 1989 1990 1991 1992 1993
26,000 30,500 15,500 2,900 1,620
10,700
1
2 2 2
6,670 4,500
17,840 20,110 10,924 2,795
14,614 15,033 31,605 33,336 31,336 20,63 1
0 0
10 0 0 0
0 0 0 0 0 0
2
4 1 1
39 36 19 73 38
120
0 0 0 0 0 a
0 0
260 540 493 490
55,000 1,800,000
960,000 390,000 200,000 170,000
0
0 0 0
0 53,000 53,000 53,000 38,000 32,000
1,400 1,600 1,300 1,600 1,600 1,600
7,100 14,000 6,100 3,100 5,200 7,800
0 0 0 0 0 0
240
0 0 0
0 0 0 0 0 0
0 0 0 0 0 0
0 0 0
250 260 340
0 0 0 0 0 0
0
0 0 0
11,750 18,800
250,000 272,000 212,000 160,000
41,000 64,000
160,000 38,000 48,000 35,000
0 0
110 0 0 0
0 0 0 0 0 0
0
0 46
320
56,750 50,401 44,180 19,959 73,056 24,076
500,000 36,000 53,000 74,000 78,500 17,000
0 0 0 0 0 0
81,000 1,830,500
975,500 392,900 201,620 180,700
243
6 49
323
75,209 126,737 365,039 365,142 334,O 18 218,991
557,014 116,633 245,905 146,936 159,436 74,23 1
7,100 14,000 6,480 3,890 5,953 8,630
123%
191%
-87%
22%

I
I
I Appendix A Momanto Company
Releases and Transfers of TRI Chemicals, 1988-1993
I Transfers Percent
Total Air Water Underground Releases Transfers for Treatmenu Total Releases 1988-1993 Emissions Discharges Injection to Land to POTW DisposaK)ther and Traosfers Total Releases
Chemical Year (pounds) (pounds) (pounds) (pounds) (pounds) (pounds) (pounds) andTransfers
Nickel compounds 1988 0 1,100 0 2,929 0 1 4,030
I Surface Off-site Change
I 1989 0 1,100 0 30 0 1 1,131 , 1990 0 1,100 0 30 0 1 1,131
Tetrachloroethylene 1988 439,000 0 0 0 14,000 77,100 530,100 1989 338,000 0 0 0 34,000 35,000 407,000 1990 308,000 0 0 0 95,000 28,000 43 1,000 1991 63,006 0 0 0 0 9,700 72,706
Toluene 1988 351,691 22,000 0 150 3,005 465,717 842,563 1989 449,833 22,000 0 150 3,505 69 1,873 1,16796 1 1990 386,868 34,000 0 160 997 399,178 82 1,203 1991 406,355 3 0 0 1,541 134,825 542,724 1992 85,685 3 0 0 722 375,667 462,077 1993 50,232 3 0 0 236 263,455 3 13,926 -63%
1,1,1 -Trichlo& 1988 119,200 17 0 1989 171,600 140 0 1990 203,000 0 0 1991 180,000 0 0 1992 128,000 0 0
Trichloroethylene 1988 1989 1990 1991 1992 1993
Xylene (mixed isomers) 1988 1989 1990 1991 1992 1993
235,930 287,240
81,040 42,400 23,000
0
796,550 736,480 844,970 836,550 634,177 165,873
330 420 72 0 0 0
14,018 16,017 13,014
23 11 1
0 0 16,100 1352 17 0 24 7,800 179,564 0 0 0 203,000 0 0 0 180,000 0 0 , 0 128,000
732,001 599,000 271,300 145,300 150,049 210,049
1,100 9,700 2,780 6,100 3,700 1,570
382,541 362,685 139,691 45,940 47,474 26,340
237,360 297,360 83,892 48,500 26,700
1,570 -99%
1,925,110 1,7 14,182 1,268,975 1,027,813
831,711 402,263 -79%
Appendix A Monsanto Company
Releases and Transfers of TIU Chemicals, 1988-1993
Transfm Percent Surface m-site Change
Total Air Water Underground Releases Transfers for Treatment/ Total Releases 1988-1993 Emions Discharges Injection t o h d toPOTW DisposaVOther andTransfm TotalReleases
(pounds) (pounds) andTransfm Chemical Year (pounds) (pounds) (pounds) (pounds) (pounds)
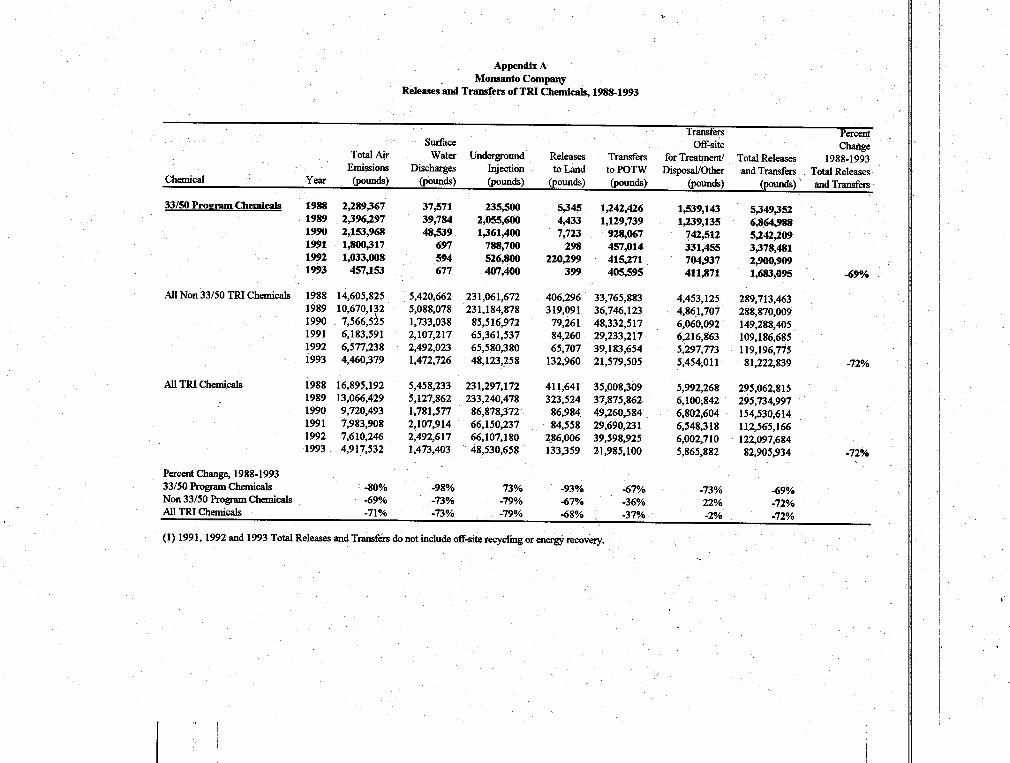
33/50 Program Chemicals 1988 2,289,367 37,571 2 3 5 9 0 5,345 1,242,426 1,539,143 5,349,352 1989 2,396,297 39,784 2,055,600 4,433 1,129,739 1,239,135 6,864,988 1990 2,153,968 48,539 1,361,400 7,723 928,067 742,512 5,242,209 1991 1,800,317 697 788,700 298 457,014 331,455 3,378,481
1993 457,153 677 407,400 399 405,595 411,871 1,683,095
All Non 33/50 TRI Chemicals 1988 14,605,825 5,420,662 231,061,672 406,296 33,765,883 4,453,125 289,713,463 1989 10,670,132 5,088,078 231,184,878 319,091 36,746,123 4,861,707 288,870,009 1990 7,566,515 1,733,038 85,516,972 79,261 48,332,517 6,060,092 149,288,405 1991 6,183,591 2,107,217 65,361,537 84,260 29,233,217 6,216,863 109,186,685 1992 6,577,238 2,492,023 65,580,380 65,707 39,183,654 5,297,773 119,196,775 1993 4,460,379 1,472,726 48,123,258 132,960 21,579,505 5,454,011 81,222,839
Ail TRI Chemicals €988 16,895,192 5,458,233 231,297,172 41 1,641 35,008,309 5,992,268 295,062,815 1989 13,066,429 5,127,862 233,240,478 323,524 37,875,862 6,100,842 295,734,997 1990 9,720,493 1,781,577 86,878,372 86,984 49,260,584 6,802,604 154,530,6 14 1991 7,983,908 2,107,914 66,150,237 84,558 29,690,231 6,548,3 18 112,565,166 1992 7,610,246 2,492,617 66,107,180 286,006 39,598,925 6,002JlO 122,097,684 1993 4,917,532 1,473,403 . 48,530,658 133,359 21,985,100 5,865,882 82,905,934
1992 1,033,008 594 526,800 220,299 415,271 704,937 2,900309 -69%
-72%
-72%
Percent Change, 1988-1993 33/50 Program Chanicals Non 33/50 Program Chemicals All TRI Chemicak
(1) 1991,1992 and 1993 Total Releases and Transfers do not include offeite recycling or energy recovery.
-80% -98?? 73% -93% -670/. -73% -69% -69% -73% -79% -67% -36% 22% -72% -7 1 ?'o -73% -79% -68% -37% -2% -72%
t
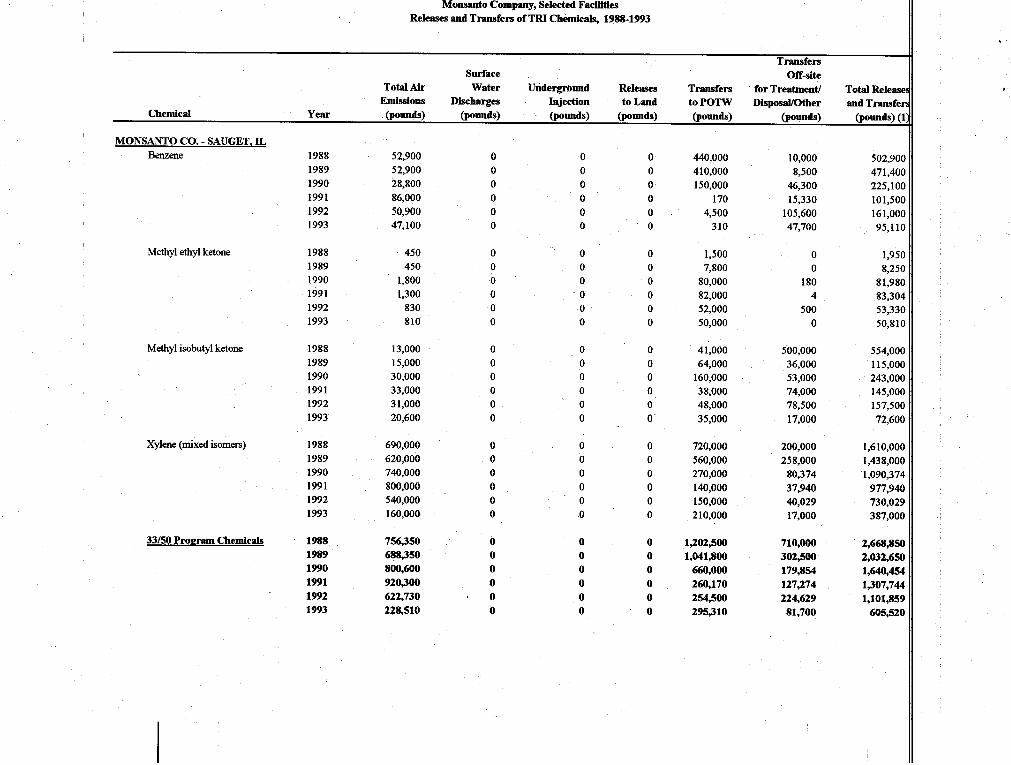
Appendix B Monsanto Comjmny, Selected Facilities
Releases and Transfers of TRI Chemicals, 1988-1993
Transfers Surface Off-site
Total Air Water Underground Releases Transfers for Treatmenu Total Releas Emissions Discharges Injection toLand toPOTW DispodOther andTransfei
(pounds) @om*) (pounds) ( Chemical Year @ounw (pound4 (pounds) (pounds)
, MONSANTO CO. - SAUGET. IL
Benzene
Methyl ethyl ketone
Methyl isobutyl ketone
Xylene (mixed isomers)
33/50 P r o e m Chemicals
1988 1989 1990 1991 1992 1993
1988 1989 1990 1991 1992 1993
1988 1989 1990 1991 1992 1993
1988 1989 1990 1991 1992 1993
1988 1989 1990 1991 1992 1993
52,900 52,900 28,800 86,000 50,900 47.100
450 450
1,800 1,300
830 810
13,000 15,000 30,000 33,000 3 1,000 20,600
690,000 6 2 0,O 0 0 740,000 800,000 540,000 160,000
756,350 688,350 800,600 920,300 622,730 228,510
0 0 0 0 0 0
0 0 0 0 0 0
0 0 0 0 0 0
0 0 0 0 0 0
0 0 0 0 0 0
0 0 0 0 0 0
0 0 0 0 0 0
0 0 0 0 0 0
0 0 0 0 0 0
0 0 0 0 0 0
0 0 0 0 0 0
0 0 0 0 0 0
0 0 0 0 0 0
0 0 0 0 0 0
0 0 0 0 0 0
440,000 41 0,000 150,000
170 4,500
310
1,500 7,800
80,000 82,000 52,000 50,000
41,000 64,000
160,000 38,000 48,000 35,000
720,000 560,000 270,000 140,000 150,000 210,000
1,202300 1,041,800
660,OOO 260,170 254,500 295,310
10,000 8,500
46,300 15,330
105,600 47,700
0 0
180 4
500 0
500,000 36,000 53,000 74,000 78,500 17,000
200,000 258,000 80,374
40,029 17,000
710,000 302,500 179,854 127,274 224,629
81,700
37,940
I
502,901 47 1,401 225,10( 101,50( 161,00( 95,11(
1,95( 8,25(
81,98( 83,30~ 53,33( 50,81(
554,00( 115,00( 243,00( 145,00( 157,50( 72,60(
1,610,00( 1,438,00( 1,090,37~
730,025 387,OOl
2,668.89 2,032,69 l,640,45r 1,30794 1,101,85!
605,52(
977,94(

Appendix B Monsanto Company, Selected Facilities
Releases and Transfers of TRI Chemicals, 1988-1993
Transfers Surface OiT-site
Total Air Water Underground Releases Transfers for Treatment/ Total Release EmispionS Discharges Injection toLand to POTW DispodOther and Transfer
Chemical Y m (pounds) (pounds) (pounds) ( p O u n d . 9 @ounw @ounw @o=nds) (1
All Non 33/50 TRI Chemicals
All TRI Chemicals
MONSANTO (20.- NITRO. WV Toluene
Trichloroethylene
Xylene (mixed isomers)
33/50 Program Chemicals’
1988 1989 1990 1991 1992 1993
1988 1989 1990 1991 1992 1993
1988 1989 1990 1991 1992 1993
1988 1989 1990
1988 1989 1990 1991 1992 1993
1988 1989 1990 ~
1991 1992 1993
3,056,728 2,738,253
985,370 774,140 857,339 696,899
3,813,078 3,426,603 1,785,970 1,694,440 1,480,069
925,409
135,000 156,000 220,000 349,000
35,000 22,600
216,800 258,800 43,000
104,000 114,000 103,000 35,000 93,000
5,500
455,800 528,800 366,000 384,000 128,000 28,100
0 0 0 0 0 0
0 0 0 0 0 0
22,000 22,000 34,000
3 3 3
330 420
72
14,000 16,000 13,000
23 11
1
36,330 38,420 47,072
26 14 4
0 0 0 0 0 0
0 0 0 0 0 0
0 0 0 0 0 0
0 0 0
0 0 0 0 0 0
0 0 0 0 0 0
t
0 0 0 0 0
4,000
0 0 0 0 0
4,000
150 150 160 0 0 0
0 0 0
0 0 0 0 0 0
150 150 160
- 0 0 0
2 1,177,141 20,7 12,341 38,462,43 1 20,319,551 33,426,450 15,103,168
22,379,641 21,754,141 39,122,431 20,579,72 1 33,680,950 15,398,478
0 0 0 0 0 0
0 0 0
0 0 0 0 0 0
0 0 0 0 0 0
257,900 288,109 658,O 18 796,980
1,109,088
967,900 590,609 837,872 924,254
1,059,586 1,190,788
834,957
0 0 0
3,700 690
3,680
0 0 0
64,000 0 0 0
410 2,680
64,000 0 0
3,700 1,100 6,360
,
24,491,769 23,738,703 40,105,819 2 1,890,671 35,118,746 16,913,155
27,160,619 25,771,353 41,746,273 23,198,415 36,220,605 17,5 18,675
157,15C 178,15C 254,16C 352,703
35,693 26,283
2 17,130
43,072
182,OOC 130,OOC 116,OOC 35,023 93,421
8,181
556,28r 567,37C 413,232 387,726 129,114 34,464
259,220
Appendix B Monsant~ Company, Selected Facilities
Releases and Transfers of TRI Chemicals, 19881993
Transfers Surface of€-sits
Total Air Water Underground Releases Transfers for Treatment/ Total Release Emissions Discharges Injection to Land to POTW DlspodOther and Transfer
ChdCal Year (pounds) (pounds) (pounds) (pounds) @omds) (pounds) (pounds) (1
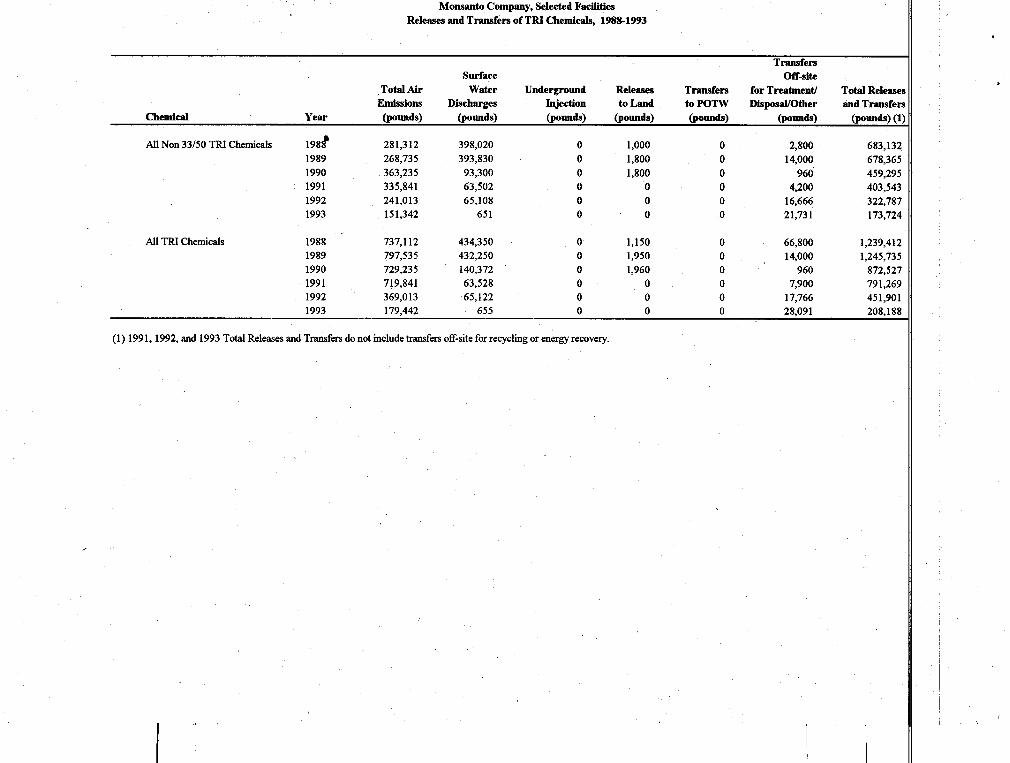
All Non 33/50 TRI Chemicals 198b 281,312 398,020 0 1,000 0 2,800 683,132 1989 268,735 393,830 0 1,800 0 14,000 678,365 1990 363,235 93,300 0 1,800 0 960 459,295 1991 335,841 63,502 0 0 0 4,200 403,543 1992 241,013 65,108 0 0 0 16,666 322,787 1993 151,342 65 1 0 0 0 21,731 173,724
All TRI Chemicals 1988 737,112 434,350 0 1,150 0 66,800 1,239,412 1989 797,535 432,250 0 1,950 0 14,000 1,245,735 1990 729,235 140,372 0 1,960 0 960 872,527 1991 719,841 63,528 0 0 0 7,900 79 1,269 1992 369,013 65,122 0 0 0 17,766 45 1,90 1 1993 179,442 655 0 0 0 28,091 208,188
(1) 1991, 1992, and 1993 Total Releases and Transfers do not include transfers off-site for recycling or energy recovery.
,

Appendh C Monsanto Company
Pollution Prevention Act Reporting, 1991-1993 Data and 19941995 Projections
PerCe Percent Total C h i
Energy Energy Change Production 1991-19! Recycled Recycled Recovery Recovery Treated Treated Quantity 1991-1995 Related Productic
On-Site off-Site On-Site Off-Site On-Site off-Site Released Quantity Wastes Relat Chemical Year (pounds) (pounds) (pounds) (pounds) (pounds) (pounds) (pounds) Released (pounds) Wast
Cadmium
Cadmium compounds
Dichloromethane
Hydrogen cyanide
Mercury compounds
1991 1992 1993 1994 1995
1991 1992 1993 1994 1995
1991 1992 1993 1994 1995
1991 1992 1993 1994 1995
1991 1992 1993 1994 1995
1991 1992 1993 1994 1995
23,000 0 0 0 0
0 0 0 0 0
0 0 0 0 0
210,000 210,000 950,000
I, 100,000 1,400,000
0 0 0
0
0 0 0 0 0
*O
0 0 0 0 0
12,000 21,000 21,000 26,000 32,000
0 0 0 0 0
5,200 4,500
0 0 0
0 0 0 0 0
0 0 0 0 0
1,100,000 560,000 50,000 180,000
0 77,000 0 0 0 0
0 0 0 0 0 0 0 0 0 0
0 0 0 0 0 0 0 0 0 0
0 0 0 0 0 0 0 0 0 0
0 0 0 0 0 0 0 0 0 0
0 0 0 0 0 0 0 0 0 0
470,000 1,750,000 1,600,004 1,600,000 1,600,000
0 0 0 0 0
0 0 0 0 0
3,500 3,500
850 600 750
2,100,000 1,800,000 2,000,000 2,100,000 2,200,000
0 0 0 0 0
21,860 103,740 48,100 48,100 48,100
0 0 0 0 0
0 0 0 0 0
0 0
8,800 0 0
0 0 0 0 0
0 0 0 0 0
215,300 315,500 90,800 59,800 56,200
1,900 2,100 3,200 3,500 3,700
16,690 18,720 19,740 20,740 22,740
325,000 304,000 310,000 240,000 300,000
390,000
180,000 180,000 180,000
200,000
2,390,160 2,399,240 1,815,904 1,707,900
-74% 1,704,300
13,900 23,100 24,200 29,500
95% 35.700
16,690 18,720 19,740 20,740
36% 22,740
543,700 522,000
1,269,650 1,340,600
-8% 1,700,750
2,490,000
2,180,000 2,280,000
2,000,000
-54% 2,380,000
330 330 330
0 0 -100%
330 330 330 0 0
-29
157
36
213'
-4
-100'
.
Appendix C Monsanto Company
Pollution Prevention Act Reporting, 1991-1993 Data and 1994-1995 Projections
Percent Percent Total Change
Energy Energy Change Production 1991-1995 Recycled Recycled Recovery Recovery Treated Treated Quantity 1991-1995 , Related Production On-Site Of€-Site On-Site Off-Site On-Site Off-Site Released Quantity Wastes Related
Chemical Year (pounds) (pounds) (pounds) (pounds) (pounds) (pounds) (pounds) Released (pounds) Wastes
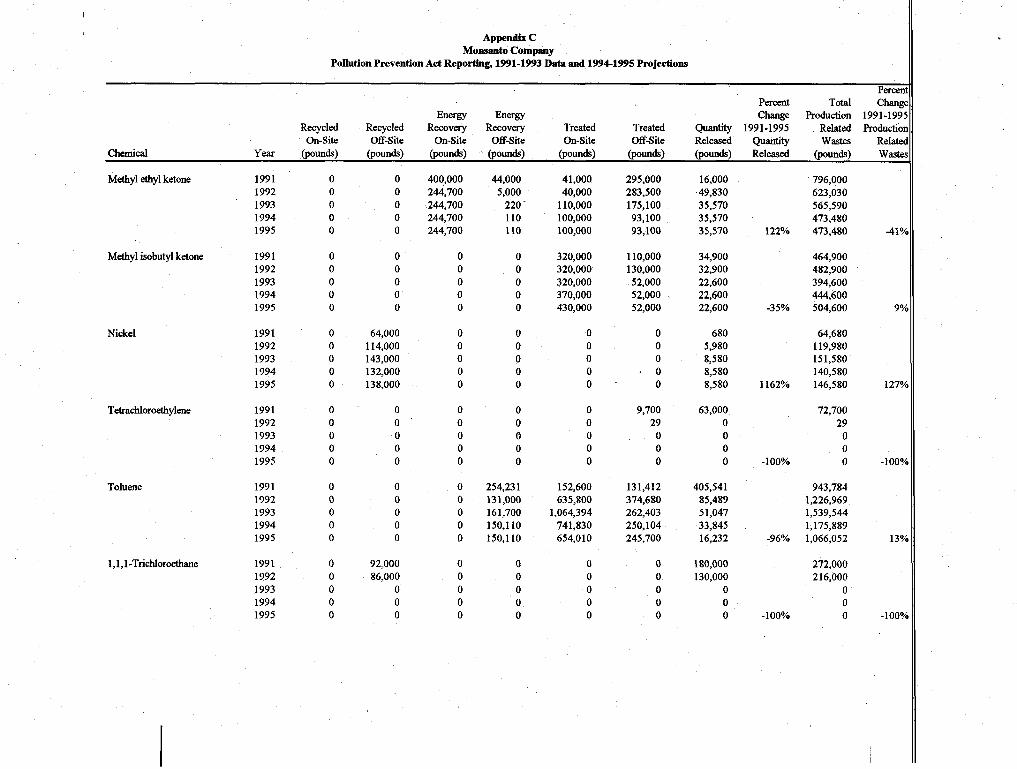
Methyl ethyl ketone 1991 0 0 400,000 44,000 41,000 295,000 16,000 796,000 1992 0 0 244,700 5,000 40,000 283,500 49,830 623,030 1993 0 0 244,700 220 110,000 175,100 35,570 565,590 1994 0 0 244,700 110 100,000 93,100 35,570 473,480 1995 0 0 244,700 110 100,000 93,100 35,570 122% 473,480 -41%
Methyl isobutyl ketone 1991 0 0 0 0 320,000 110,000 34,900 464,900 1992 0 0 0 0 130,000 32,900 482,900 320,000 1993 0 0 0 0 320,000 52,000 22,600 394,600 1994 0 0 0 0 370,000 52,000 22,600 444,600 1995 0 0 0 0 430,000 52,000 22,600 -35% 504,600 9%
Nickel 1991 0 64,000 0 0 0 0 680 64,680 1992 0 114,000 0 0 0 0 5,980 119,980 1993 0 143,000 0 0 0 0 8,580 151,580 1994 0 132,000 0 0 0 . o 8,580 140,580 1995 0 138,000 0 0 0 0 8,580 1162% 146,580 127%
Tetrachloroethylene 1991 0 0 0 0 0 9,700 63,000 72,700 1992 0 0 0 0 0 29 0 29 1993 0 0 0 0 0 0 0 0 1994 0 0 0 0 0 0 0 0 1995 0 0 0 0 0 0 0 -100% 0 -100%
Toluene 1991 1992 1993 1994 1995
1 , 1 , 1 -Tnchloroethane 199 1 1992 1993 1994 1995
92,000 86,000
0 0 0
254,231 131,000 161,700 150,110 150,110
152,600 635,800
1,064,394 741,830 654,010
131,412 374,680 262,403 250,104 245,700
405,541 85,489 5 1,047 33,845 16,232 -96%
180,000 130,000
0 0 0 -100%
943,784 1,226,969 1,539,544 1,175,889 1,066,052
272,000 216,000
0 0 0
APpendlr c MoMpnto Company
Pollution Pnvention Act Reporting, 191-1993 Data and 1994-1995 P m J e e t l o ~
3 Percent Total Chang
Recycled Recycled Recovery Recovery Treated Treated Quantity 1991-1995 Related F'roductio On-Site Off-Site &-Site Off-Site &-Site Off-Site Released Quantity Wastes Relate
Chemical Year (pounds) (pounds) (pounds) (pounds) (pounds) (pounds) (pounds) Released (pounds) Waste
Energy, Energy Change Production 1991-199
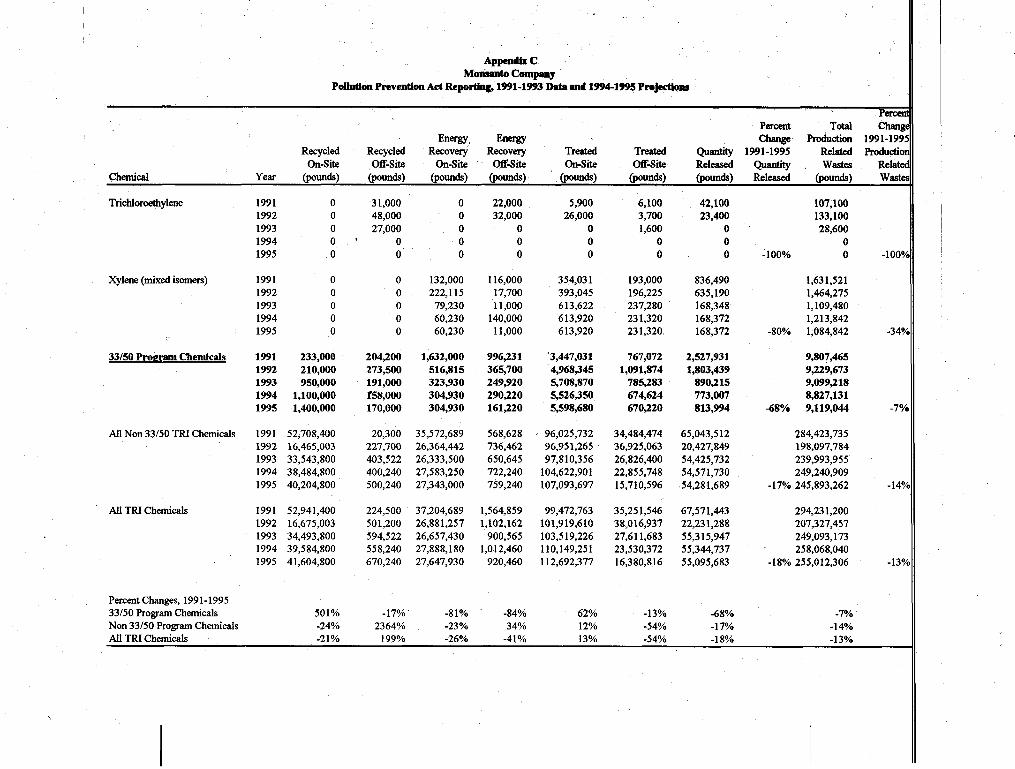
Trichloroethylene 1991 0 1992 0 1993 0 1994 0 1995 0
Xylene (mixed isomers) 1991 0 1992 0 1993 0 1994 0 1995 0
3 1,000 0 48,000 0 27,000 0
0 0 0 0
0 132,000 0 222,115 0 79,230 0 60,230 0 60,230
33/50 Program Chemicals 1991 233,000 1992 210,000 1993 950,000 1994 1,100,000 1995 1,400,000
All Non 33/50 TRI Chemicals 1991 52,708,400 1992 16,465,003 1993 33,543,800 1994 38,484,800 1995 40,204,800
All TRI Chemicals 1991 52,941,400 1992 16,675,003 1993 34,493,800 1994 39,584,800 1995 41,604,800
Percent Changes, 1991-1995 33/50 Program Chemicals 501% Non 33/50 Program Chemicals -24%
204,200 1,632,000 273,500 516,815 191,000 323,930
170,000 304,930 rs8,ooo 304,930
20,300 35,572,689 227,700 26,364,442 403,522 26,333,500 400,240 27,583,250 500,240 27,343,000
224,500 37,204,689 501,200 26,881,257 594,522 26,657,430 558,240 27,888,180 670,240 27,647,930
-17%' -81% 2364% -23%
~ ~~
All TRI Chemiials -21% 199% -26% -41% 13% -54% -18% -13%
22,000 32,000
0 0 0
116,000 17,700 11,000
140,000 11,000
996,231 365,700 249,920 290,220 161,220
568,628 736,462 650,645 722,240 759,240
1,564,859 1,102,162
900,565 1,012,460
920,460
-84% 34%
5,900 26,000
0 0 0
354,03 1 393,045 613,622 613,920 613,920
'3,447,031
5,708,870 5,526,350 5,598,680
' 96,025,732 96,951,265 97,s 10,356
104,622,901 107,093,697
99,472,763 101,919,610 1033 19,226 1 10,149,25 1 112,692,377
4,968445
62% 12%
6,100 3,700 1,600
0 0
193,000 196,225 237,280 231,320 231,320
167,072 1,091,874
785,283 674,624 670,220
34,484,474 36,925,063 26,826,400 22,855,748 15,710,596
35,251,546 38,016,937 27,611,683 23,530,372 16,3 80,s 16
-13% -54%
42,100 23,400
0 0 0
836,490 635,190 168,348 168,372 168,372
2,527,931 1,803,439
890,215 773,007 813,994
65,043,512 20,427,849 54,425,732 54,571,730 54,281,689
67,571,443 22,231,288 55,3 15,947 55,344,737 55,095,683
-68% -17%
107,100 133,100 28,600
0 -100% 0 -1003
1,63 1,521 1,464,275 1,109,480 1,213,842
-80% 1,084,842 -343
9,807,465 9,229,673 9,099,218 8,827,131
-68% 9,119,044 -79
284,423,735 198,097,784 239,993,955 249,240,909
-17% 245,893,262 -14?
294,23 1,200 207,327,457 249,093,173 258,068,040
-1 8% 255,O 12,306 -13?
-7% -14%
Appendir D Monsanto Company, Selected Facilities
Pollution Prevention Act Reporting, 1991-1993 Data and 1994-1995 Projections
Percent Total Change
Energy Energy Change Production 1991-1995 Recycled Recycled Recovery Recovery Treated Treated Quanti@ 1991-1995 Related Production
On-Site Off-Site On-Site Off-Site On-Site Off-Site Released Quantity Wastes Related Chemical , Year (pounds) (pounds) (pounds) (pounds) (pounds) (pounds) (pounds) Released (pounds) Wastes
Percent
1
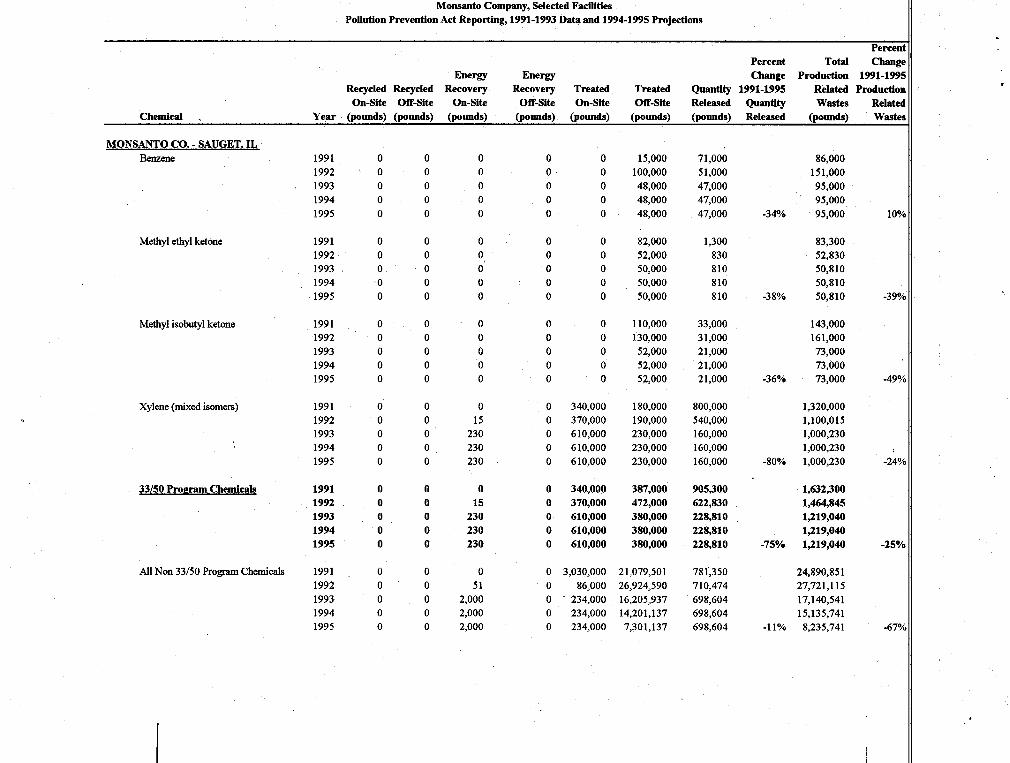
MONSANTO CO. - SAUGET. IL Benzene 1991 0 0 0 0 0 15,000 71,000 86,000
1992 I 0 0 0 0 0 100,000 5 1,000 15 1,000 1993 0 0 0 0 0 48,000 47,000 95,000 1994 0 0 0 0 0 48,000 47,000 95,000 1995 0 0 0 0 0 48,000 47,000 -34% 95,000 10%
Methyl ethyl ketone 1991 0 0 0 0 0 82,000 1,300 83,300 1992 0 0 0 0 0 52,000 830 52,830 1993 0 0 0 0 0 50,000 810 50,810 1994 0 0 0 0 0 50,000 810 50,810 1995 0 0 0 0 0 50,000 810 -38% 50,810 -39%
Methyl isobutyl ketone 1991 0 0 0 0 0 110,000 33,000 143,000 1992 0 0 0 0 0 130,000 31,000 161,000 1993 0 0 0 0 0 52,000 21,000 73,000 1994 0 0 0 0 0 52,000 21,000 73,000 1995 0 0 0 0 0 52,000 21,000 -36% 73,000 -49%
Xylene (mixed isomers) 1991 0 0 0 0 340,000 180,000 800,000 1,320,000 1992 0 0 15 0 370,000 190,000 540,000 1,100,O 15 1993 0 0 230 0 610,000 230,000 160,000 1,000,230 1994 0 0 230 0 610,000 230,000 160,000 1,000,230 1995 0 0 230 0 610,000 230,000 160,000 -80% 1,000,230 -24%
33/50 Program Chemicals 1991 0 0 0 0 340,000 387,000 905,300 1,632300 1992 0 0 15 0 370,000 472,000 622,830 1,464,845 1993 0 0 230 0 610,000 380,000 228,810 1,219,040 1994 0 0 230 0 610,000 380,000 228,810 1,219,040 1995 0 0 230 0 610,000 380,000 228,810 -75% 1,219,040 -25%
All Non 33/50 Program Chemicals 1991 0 0 0 0 3,030,000 21,079,501 781,350 24,890,851 1992 0 0 51 0 86,000 26,924,590 710,474 27,72 1,115 1993 0 0 2,000 0 234,000 16,205,937 698,604 17,140,541 1994 0 0 2,000 0 234,000 14,201,137 698,604 15,135,741 1995 0 0 2,000 0 234,000 7,301,137 698,604 -11% 8,235,741 -67%

APpendir D I
Momanto Company, selected Fadlitlea Polwion Prtvention Act Reporting, 1991-1993 Data d 19941995 ProJectbns
Percen Percent Total Chang
Energy Energy Change Production 1991-199: Recycled Recycled Recovery Recovery Treated Treated Quantity 1991-1995 Related Productioi on-site off-site on-site Off-Site &-Site Off-Site Released Quantity Wastes Reiate~
Chemical Year (pounds) (pounds) (pounds) (pounds) (pounds) (pounds) (pounds) Released (pounds) Waste
All TRI Chemicals
MONSANTO C0.- NITRO. WV Toluene
Xylene (mixed isomers)
33/50 Prorram Chemicals
All Non 33/50 Program Chemicals
All TRI Chemicals
1995
1991 1992 1993 1994 1995
1991 1992 1993 1994 1995
1991 1992 1993 1994 1995
1991 1992 1993 1994 1995
1991 1992 1993 1994 1995
1991 1992 1993 1994
0 0 0 0 0
0 0 0 0 0
0 0 0 0 0
0 0 0 0 0
0 0 0 0 0
0 0 0 0 0
0 0 0 0 0
0 0 0 0 0
0 0 0 0 0
0 0 0 0 0
0 0 0 0 0
0 0 0 0
0 66
2,230 2,230 2,230
0 0 0 0 0
80,000 220,000 79,000 60,000 60,000
80,000 220,000 79,000 60,000 60,000
26,600 58,90 1
0 3,600 3,600
106,600 278,901 79,000 63,600
0 0 0 0 0
0 0 0 0 0
62,000 14,000
140,000 11,000
11,000
62,000 14,000
140,000 11,000
11,000
43,013 8,100 5,000 10,700 10,700
105,013
16,000 150,700
22,100
3,370,000 456,000 844,000 844,000 844,000
2,600 4,300 16,000 4,300 4,300
14,000 23,000 1,500 1,800 1,800
16,600 27,300 17,500 6,100 6,100
1,970,333 2,069,280 1,214,280 1,350,680 1,348,680
1,986,933 2,096,580 1,23 1,780 1,356,780
2 1,46630 1 27,396,590 16,585,937 1438 1,137 7,681,137
0 0
2,000 1,800 1,800
0 0
570 410 410
0 0
2,570 2J10 2 4 0
4,200 9,800 10,716 11,416 11,416
4,200 9,800 13,286 13,626
1,686,650 1,333,304 927,414 927,414 927,414
350,000 36,000 24,000 16,000 10,000
35,000 93,000 7,600 8,000 8,000
385,000 129,000 31,600 24,000 18,000
395,733 312,066 162,978 144,485 154,985
780,733 441,066 194,578 168,485
-45%
-97%
-77%
-95%
-61%
26,523,15 1. 29,185,960 18,359,581 16,354,781 9,454,781
352,600 40,300 42,000 22,100 16,100
191,000 350,000 99,670 210,210 81,210
543,600 390,300 141,670 232,310 97,310
2,439,879 2,458,147 1,392,974 1,520,881 1,529,38 1
2,983,479 2,848,447 1,534,644 1,753,191
-640,
-950,
-573
-82?
-373
0 63,600 21,700 1,354,780 13,626 172,985 -78% 1,626,691 -459