EPA/600/R-16/0 | June 2016
51
EPA/600/R-16/038 | June 2016 www.epa.gov/homeland-security-research Chlorine Dioxide Fumigation of Subway Materials Contaminated with B. anthracis Surrogate Spores: Impact of Environmental Conditions and Presence of Dirt and Grime on Decontamination Efficacy Office of Research and Development National Homeland Security Research Center
Transcript of EPA/600/R-16/0 | June 2016

EPA/600/R-16/038 | June 2016www.epa.gov/homeland-security-research
Chlorine Dioxide Fumigation of Subway Materials Contaminated with B. anthracis Surrogate Spores: Impact of Environmental Conditions and Presence of Dirt and Grime on Decontamination Efficacy
Office of Research and Development National Homeland Security Research Center

EPA/600/R-16/038
Chlorine Dioxide Fumigation of Subway Materials Contaminated with B. anthracis Surrogate Spores:
Impact of Environmental Conditions and Presence of Dirt and Grime on Decontamination Efficacy
National Homeland Security Research Center Office of Research and Development
U.S. Environmental Protection Agency Research Triangle Park, NC 27711

Disclaimer
The U.S. Environmental Protection Agency, through its Office of Research and Development, managed the research described here under contract EP-C-09-027, Work Assignments 5-12 and 6-12, with ARCADIS U.S., Inc., and EP-C-15-008, Work Assignment 0-079 with Jacobs Technology, Inc. This study was funded through the Underground Transport Restoration Program by the U.S. Department of Homeland Security Science and Technology Directorate under interagency agreement (No. 7095866901).
This report has been subjected to the Agency’s peer and administrative review and has been approved for publication. Note that approval does not signify that the contents necessarily reflect the views of the Agency. Mention of trade names, products, or services does not convey official EPA approval, endorsement, or recommendation.
Questions concerning this document or its application should be addressed to:
Lukas Oudejans, Ph.D. Decontamination and Consequence Management Division National Homeland Security Research Center U.S. Environmental Protection Agency (MD-E343-06) Office of Research and Development 109 T.W. Alexander Drive Research Triangle Park, NC 27711 Phone: 919-541-2973 Fax: 919-541-0496 E-mail: [email protected]
i

Acknowledgments
This effort was completed under U.S. EPA contract EP-C-15-008, Work Assignment 0-079 with Jacobs Technology, Inc. The support and research efforts provided by ARCADIS, U.S., Inc. under EPA contract EP-C-09-027, Work assignments 5-12 and 6-12, are acknowledged.
We also thank the following entities for their assistance:
MIT Lincoln Laboratory for providing subway building materials and Lawrence Livermore National Laboratory for the collection of dirt and grime from the undercarriage of a Bay Area Rapid Transit (BART) subway car.
This effort was managed by the principal investigator (PI) from EPA ORD’s National Homeland Security Research Center (NHSRC) with input from the following project team members:
Lukas Oudejans (PI) Joseph Wood Worth Calfee
Office of Research and Development, U.S. EPA
Research Triangle Park, NC 27711
Leroy Mickelsen and Shannon Serre
Office of Land and Emergency Management, U.S. EPA
Research Triangle Park, NC 27711
Additionally, the authors would like to thank EPA Quality Assurance reviewers Eletha Brady-Roberts and Ramona Sherman for their quality assurance reviews of the QAPP and this Technical Report; and peer reviewers Francisco Cruz and Larry Kaelin (EPA Office of Emergency Management) and Marshall Gray (EPA Office of Research and Development) for their significant contributions.
ii

Executive Summary
The Department of Homeland Security’s (DHS’s) Underground Transport Restoration (UTR) Program is currently identifying potential methods for rapid characterization, cleanup, and clearance of biological contamination an underground transit system. This includes physical structures (tunnels and stations) and rolling stock (railcars). The UTR Project is expected to improve the capability for transit systems to recover rapidly from a biological release event and thereby address a high‐priority need expressed by the Transportation Security Administration (TSA) and local transit systems. As part of this UTR Project, the U.S. Environmental Protection Agency (EPA) is evaluating multiple methodologies for the decontamination of a subway contaminated by a biological agent.
This project supports the U.S. EPA Office of Research and Development’s (ORD’s) Homeland Security Research Program (HSRP) mission in that it is providing information relevant to remediation following a wide area contamination incident. More specifically, this project focuses on the decontamination of a transportation hub like a subway system, contaminated as a result of an act of terrorism. Remediation might require the use of volumetric decontamination approaches such as fumigation with chlorine dioxide (ClO2). While previous HSRP studies have shown this fumigant to be highly efficacious if applied under specific environmental (temperature and relative humidity [RH]) conditions, it is unclear what the impact of lower temperatures and the presence of dirt and grime on representative, real-world transportation system building materials would be on the fumigant efficacy. Lower temperatures affect the absolute humidity under otherwise constant RH, while the presence of dirt and grime might change the sporicidal activity of the fumigant. Both scenarios would require changes in operational fumigation conditions to reach remediation goals.
This report builds on previous research efforts that used relatively high (500-1500 parts per million volume [ppmv]) ClO2 concentrations to assess the impact of dirt and grime on the decontamination efficacy under room temperature. The primary objective of the research reported here was to evaluate the impact of temperature, RH, and dirt and grime present on subway concrete and other subway infrastructure materials on the fumigation efficacy as measured by reduction of surrogate spores on those materials. Another objective included determining which sampling procedure provides the best recovery of viable spores from grimed and cleaned concrete using a prescribed cleaning method from the New York City Metropolitan Transportation Authority (MTA).
Two sampling techniques were evaluated to determine the most suitable technique for sampling from subway type materials. The measured recovery of a sponge-stick and the polyester-rayon blend (PRB) wipe surface sampling method from inoculated grimed subway materials (glazed ceramic tile and painted steel) were evaluated in this study. The recovery from wetted PRB wipes was found similar (P-value >0.05) to recovery from sponge-sticks. Since the laboratory methods for processing wetted PRB wipesare less intensive than the laboratory methods for processing sponge-sticks, PRB wipes were used forwiping rather than the sponge-stick wipe sampling approach.
The results of this evaluation, as summarized in Table ES-1, indicate that the fumigation conditions (temperature, RH, ClO2 concentration, and fumigation time) all have a marked effect on the efficacy of the ClO2 fumigant. A reduction in RH from 75% to 50% at 24 ºC reduced the efficacy from effective (better than 6 log reduction [LR]) down to just 1 LR. Lower temperatures (11-13 °C [52-55 °F]), combined with the RH near 75%, also reduced the effectiveness of the ClO2 decontaminant dramatically. At these moderately lower temperatures, the kinetics of the spore deactivation seems to slow down, due to either
iii

Temperature (°C)
RH (%)
Concentration (ppmv)
Longest Fumigation
Time (hour [h])
Average Log Reduction
Min Max Log Reduction
Across Materials
Test ID
4.1 24 75 1490 6 3.9 3.3 – 5.2 4.2B 27 76 230 12 6.3 4.0 - 7.8 4.3 23 75 150 12 4.4 2.9 – 5.5 4.4 23 50 300 12 0.8 0.7 – 1.0 4.5 24 51 180 12 0.8 0.6 – 1.0 4.6 11 71 240 12 1.8 1.4 – 2.3 4.7 11 79 210 24 1.8 1.3 – 2.1 4.8 27 76 3460 4 5.4 3.3 – 7.5 4.9 13 68 3280 9 1.8 1.3 – 2.1
Temperature(°C)
RH(%)
Concentration(ppmv)
LongestFumigation
Time(hour (h))
Average LogReduction
Min - MaxLog Reduction
AcrossMaterials
the lower temperature and/or the lower (absolute) available amount of water vapor. These results suggest that although the target RH might be easily attained in a subway system, ClO2 fumigation might not be the best choice for subway system areas that cannot be heated to at least 24 °C.
Table ES-1-1: Summary of ClO2 Decontamination Efficacy Values under Various Environmental Conditions
As observed in earlier studies, efficacy was material dependent as indicated by the range of LR values at a specific fumigation condition. The impact of the type of grimed subway materials (concrete, ceramic tile, and painted steel) on the ClO2 decontamination efficacy was assessed by a comparison of the number of viable spores recovered from a grimed surface and from a grimed surface that was cleaned using a method adapted from the New York MTA prior to the inoculation. The mean log reduction in viable spores from cleaned surfaces was higher than from grimed surfaces for eight out of ten pairings. However, these differences were mostly not statistically significant (P-values > 0.05). Only one of the eight direct comparisons resulted in a statistically significant effect. The impact of the material itself was also less noticeable than in previous studies where clean surfaces were utilized. This observation can be explained by the dirt and grime forming a layer with which the ClO2 may interact without impact from the underlying building material. The dirt and grime may also have reduced the surface porosity.
Implications of this study:
A six (6) log reduction in viable spores can be obtained for the subway infrastructure materials by ClO2
fumigation if the temperature is at or above 24 °C combined with RH greater than 75%. These conditions occur both for 12 h fumigation at 230 ppmv ClO2 or 4 h at 3500 ppmv ClO2. No six log reduction in viable spores was observed at realistic (winter) temperatures in a subway environment (11-13 °C and 70-80% RH) for periods of fumigation that are otherwise efficacious at 24 °C/ 75% RH. Extending the fumigation time at this low temperature to 24 h at approximately 200 ppmv ClO2 or 9 h at 3300 ppmv ClO2 did not improve efficacy. Further research is recommended to identify whether efficacious ClO2 fumigation conditions may occur at low temperatures through, e.g., a pre-wetting of building surfaces immediately prior to fumigation.
Limitations:
The results reported here were obtained from a bench scale study. Extrapolation of these results to a full scale subway station fumigation process should be made with caution. Additional fumigation testing on an
iv

intermediate or large scale would assist in such extrapolation of results. Levels and composition of dirt and grime may also vary significantly throughout a subway (tunnel) system and by geographical location.
v

Contents Disclaimer ..................................................................................................................................................... i
Acknowledgments ...................................................................................................................................... ii
Executive Summary ................................................................................................................................... iii
List of Figures ............................................................................................................................................ ix
List of Tables .............................................................................................................................................. ix
Acronyms and Abbreviations ................................................................................................................... xi
1 INTRODUCTION ................................................................................................................................... 1
1.1 Background .................................................................................................................................... 1
1.2 Project Description and Objectives ................................................................................................ 1
2 MATERIALS AND METHODS .............................................................................................................. 3
2.1 Experimental Setup ........................................................................................................................ 3
2.2 General Approach and Test Matrix ................................................................................................ 4
2.2.1 Task 1: Coupon Preparation .................................................................................................. 5
2.2.1.1 Coupon Griming ............................................................................................................. 5
2.2.1.2 Coupon Cleaning............................................................................................................ 6
2.2.1.3 Greased Stubs................................................................................................................ 7
2.2.2 Task 2: Determination of Surface Sampling Method ............................................................. 7
2.2.3 Task 3: Aerosol Deposition Method ....................................................................................... 7
2.2.3.1 Surrogate Spore Preparation ......................................................................................... 7
2.2.3.2 Coupon Inoculation ........................................................................................................ 7
2.2.4 Task 4: Decontamination Tests.............................................................................................. 8
2.3 Sampling and Analytical Procedures............................................................................................ 10
2.3.1 Sample Quantities and Frequency....................................................................................... 10
2.3.2 Definition of Efficacy............................................................................................................. 11
2.3.3 Sampling Procedures ........................................................................................................... 13
2.3.3.1 Wetted PRB wipe Sampling ......................................................................................... 13
2.3.3.2 Sponge-Stick Wipe Sampling....................................................................................... 13
2.3.3.3 Extraction of Greasy Stubs........................................................................................... 13
vi
2.3.3.4 Wet Chemistry Samples............................................................................................... 14
2.4 Sample Handling and Custody..................................................................................................... 14
2.4.1 Preventing Cross Contamination during Sampling .............................................................. 14
2.4.2 Sample Identification ............................................................................................................ 14
2.5 Microbiological Methods ............................................................................................................... 15
2.5.1 Wipe Sample Extraction ....................................................................................................... 15
2.5.2 Colony Plating ...................................................................................................................... 15
2.5.2.1 Coupon Spore Enumeration......................................................................................... 16
3 RESULTS AND DISCUSSION............................................................................................................ 17
3.1 Task 2: Determination of Surface Sampling Method.................................................................... 17
3.2 Task 3: Aerosol Deposition Method ............................................................................................. 18
3.3 Task 4: ClO2 Fumigation Testing.................................................................................................. 19
3.3.1 Fumigation Conditions.......................................................................................................... 19
3.3.2 Efficacy Results.................................................................................................................... 22
3.3.2.1 Effect of Temperature at Constant RH [75%]............................................................... 22
3.3.2.2 Effect of (Relative) Humidity on Efficacy ...................................................................... 24
3.3.2.3 Effect of ClO2 Concentration ........................................................................................ 25
3.3.2.4 Effect of Washing of Grimed Coupons......................................................................... 26
3.3.2.5 Efficacy for Greasy Stubs Compared to other Materials ..............................................27
4 Quality Assurance and Quality Control........................................................................................... 28
4.1 Criteria for Critical Measurements................................................................................................ 28
4.2 Quality Control Checks................................................................................................................. 29
4.2.1 Integrity of Samples and Supplies........................................................................................ 29
4.2.2 Biocontaminant Laboratory Checks ..................................................................................... 29
4.3 QA/QC Sample Acceptance Criteria ............................................................................................ 30
4.3.1 QA/QC Test Results Validation............................................................................................ 31
4.4 Calibration of Sampling/Monitoring Equipment ............................................................................ 32
vii

4.5 Data Quality Audits....................................................................................................................... 33
4.6 Data Reduction............................................................................................................................. 33
4.7 Data Reporting ............................................................................................................................. 34
5 SUMMARY AND RECOMMENDATIONS........................................................................................... 35
6 REFERENCES .................................................................................................................................... 36
viii

List of Figures
Figure 3-1. Recovery Using Various Sampling Methods. Error Bars Represent 95% CI. ..........................17
Figure 3-3. Effect of Temperature on Efficacy for 12-h and 24-h Exposure at 200 ppmv ClO2 and
Figure 3-4. Effect of Temperature on Efficacy for 12-h Exposure at 100 ppmv ClO2 and 75% RH.
Figure 3-5. Effect of Temperature on Efficacy for 4-h and 9-h Exposure at 3300 ppmv ClO2 and
Figure 3-5. Effect of Exposure Time on Efficacy at 200 ppmv ClO2 and 11 ºC/75% RH. Error Bars
Figure 3-6. Effect of Absolute Humidity on Decontamination Efficacy after 12 h at 200 ppmv ClO2.
Figure 3-7. Effect of Chlorine Dioxide Concentration on Efficacy at 24 ºC / 75% and 4-h
Figure 3-8. The Effect of Washing on Decontamination Efficacy (Test 2B). Error Bars Represent
Figure 3-2. Recovery Using Various Settling Times. .................................................................................. 19
75% RH. Error Bars Represent the 95% CI................................................................................................ 22
Error Bars Represent the 95% CI. .............................................................................................................. 23
75% RH. Error Bars Represent the 95% CI................................................................................................ 23
Represent the 95% CI................................................................................................................................. 24
Error Bars Represent the 95% CI. .............................................................................................................. 25
Exposure. Error Bars Represent the 95% CI. ............................................................................................. 26
the 95% CI................................................................................................................................................... 27
Figure 3-9. Efficacy for Greased Stubs Compared to Other Materials. ......................................................27
List of Tables
Table ES-1-1: Summary of ClO2 Decontamination Efficacy Values under Various Environmental Conditions ............................................................................................................................. iv
Table 2-1. Fumigation Test Matrix for Each Type of Coupon Material ......................................................... 9
Table 2-2. Sample Frequency..................................................................................................................... 11
Table 2-3. Sample Identification ................................................................................................................. 15
Table 3-1. Recovery from Grimed Tile Using Various Sampling Methods .................................................17
Table 3-2. Recovery from Grimed Painted Steel Using Various Sampling Methods..................................17
Table 3-3. Recoveries at Various Settling Periods ..................................................................................... 18
Table 3-4. Student’s t-test P-values (one-sided)......................................................................................... 18
Table 3-5. Average Wet Chemistry and Photometer Readings.................................................................. 20
Table 3-6. Task 4 Fumigation ClO2 Concentration ..................................................................................... 20
Table 3-7. Task 4 Fumigation RH ............................................................................................................... 21
Table 3-8. Task 4 Fumigation Temperature................................................................................................ 21
Table 4-1. Critical Measurement Acceptance Criteria ................................................................................ 29
Table 4-2. QA/QC Sample Acceptance Criteria.......................................................................................... 30
ix

Table 4-3. Other QA/QC Acceptance Criteria............................................................................................. 31
Table 4-4. Procedural Blanks and Negative Control QA/QC Results ......................................................... 32
Table 4-5. Sampling and Monitoring Equipment Calibration Requirements...............................................33
Table 4-6. Analysis Equipment Calibration Frequency............................................................................... 33
x

CI
Acronyms and Abbreviations
ADA aerosol deposition apparatus
AH absolute humidity
ATCC American Type Culture Collection
AWWA American Water Works Association
BART Bay Area Rapid Transit
CFU colony-forming unit(s)
confidence interval
ClO2 chlorine dioxide
COC chain of custody
DAS data acquisition system
DHS Department of Homeland Security
DQI data quality indicator
DTRL Decontamination Technology Research Laboratory
EMS Environmental Monitoring System
EPA U.S. Environmental Protection Agency
h hour(s)
H2O2 hydrogen peroxide
HSRP Homeland Security Research Program
ID identification
in inch(es)
LR log reduction
MDI metered-dose inhaler
MOP miscellaneous operating procedure
mSM modified standard method
MTA Metropolitan Transportation Authority
NA not applicable
ND non-detect
NHSRC National Homeland Security Research Center
NI not included
NIST National Institute of Standards and Technology
ORD Office of Research and Development
oz ounce(s)
pAB pH-adjusted bleach
PBST phosphate-buffered saline with 0.05% Tween® 20
ppmv parts per million by volume
PRB polyester-rayon blend
xi

QA quality assurance
QAPP quality assurance project plan
QC quality control
QMP quality management plan
RH relative humidity
SD standard deviation
SE standard error
SM Standard Method
TSA Transportation Security Administration
UTR Underground Transport Restoration
xii

1 INTRODUCTION
1.1 Background
In the event of a biological incident in a transportation hub like a subway system, effective remediation might require the use of volumetric decontamination approaches such as fumigation. Previous studies, conducted under the US Environmental Protection Agency (EPA) Office of Research and Development’s (ORD) Homeland Security Research Program (HSRP), have shown that fumigants like chlorine dioxide (ClO2) and hydrogen peroxide (H2O2) gases can be highly efficacious if applied under specific environmental (temperature and relative humidity [RH]) conditions [1]. Dirt and grime on the surface of these real-world building materials, however, can potentially impact the effectiveness of these fumigation methods. The presence of dirt and grime may possibly change the sporicidal activity of fumigants requiring changes in operational fumigation conditions to reach remediation goals. Previous work [2] using concrete commonly found in a subway system focused on ClO2 concentrations of 500 to 1500 parts per million by volume [ppmv] and fumigation times up to 18 and 6h, respectively. Recent study results [3] indicate that fumigation of concrete coupons at 100 or 200 ppmv ClO2 concentrations with an 8 h or longer contact time can also be effective (defined here as better than 6 log reduction (LR) in the number of viable spores recovered from a surface). A demonstration of a ≥ 6 log inactivation of viable spores of an appropriate surrogate spore by a decontaminant is a requirement for product registration as a sporicidal product/technology against spores of B. anthracis Ames. Decontamination tests conducted within the HSRP have not addressed the impact of lower fumigation temperatures and/or lower RH. For example, the average wintertime (December–February) temperature in a Boston subway station was measured to be approximately 10 °C. The effect of such a temperature on the decontamination efficacy with ClO2 fumigation has not been established. In addition, the previous studies did not address the impact of abundant dirt and grime on ClO2 fumigation efficacy.
1.2 Project Description and Objectives
The general process investigated in this project was the decontamination of surrogate Bacillus anthracis (B. anthracis) spores from commonly encountered subway infrastructure surfaces to which grime was added. ClO2 fumigation was conducted at temperatures and RH values encountered in subways and at concentrations that may be sustainable in a subway environment. Various fumigation durations up to 24 h were considered. The impact of the grime on the fumigation efficacy was determined through comparison of results for grimed coupons that were not cleaned and grimed coupons that were cleaned prior to inoculation of spores to the surface.
Here, concrete from the floor of the New York Metropolitan Transit Authority (MTA) Old South Ferry station, glazed ceramic wall tiles from the MTA West 4th Street station, and painted steel surfaces constructed as representative of painted steel structures in a (New York) subway system were considered. Sections (coupons) of these materials were covered with grime, and a subset was cleaned before the start of the fumigation test. Dirt and grime were obtained as scrapings from the undercarriage of a Bay Area Rapid Transit (BART) subway car. Small coupons with a layer of subway car axle grease were also part of this investigation.
Coupons were inoculated with Bacillus globigii (Bg) spores, a surrogate of B. anthracis, via aerosol deposition using a metered-dose inhaler (MDI) inside an aerosol deposition apparatus (ADA) [4]. A
1

minimum amount of 1 x 10⁷ colony forming units (CFU) was inoculated to be able to demonstrate a 6 log reduction in viable spores through fumigation. The inoculation method using the ADA was originally designed to include a settling time of 18 h for spores to settle onto a 12” x 12” surface. This scheme would have required the construction and expense of essentially one ADA per coupon per test condition. As part of this project, different (shorter) settling times were considered to determine whether the settling time was a necessary component of the inoculation method, considering that the inoculated surface is only 1.5” by 1.5”.
Recovery of Bg spores from the fumigated coupons was compared to recovery from coupons that were inoculated but not fumigated (positive control coupons) to determine the ClO2 fumigation efficacy on these subway system materials. Quality control (QC) samples, such as fumigated coupons that were not inoculated (procedural blank coupons) and coupons that were neither inoculated nor fumigated (negative controls), were also included to monitor for cross contamination. All samples were analyzed for the quantitative determination of viable spores.
Initial sampling methods included sponge-stick and wetted polyester-rayon blend (PRB) wipe sampling. Both were evaluated for their ability to recover spores from grime-painted steel and grimed ceramic tiles. A decision on which sampling method to use was based on a comparison of recovered spores for each method. If both methods were found to be satisfactory, the ease of use in the extraction process determined the selection of the sampling method.
2

2 MATERIALS AND METHODS
2.1 Experimental Setup
All experimentation was conducted in an opaque chamber (830 Series glovebox, Plas-Labs, Inc., Lansing, MI, USA) used to maintain and control a leak-free fumigation atmosphere and to allow for the periodic addition and removal of sample material during fumigation. ClO2 was generated by a ClorDiSys-GMP (ClorDiSys, Inc., Lebanon, NJ, USA) system, which passes 2 % chlorine gas in nitrogen through sodium chlorite cartridges. The generator includes real-time feedback control of ClO2 concentration in the chamber atmosphere via an internal Environmental Monitoring System (EMS) (ClorDiSys, Inc.) photometric detector. The concentration of ClO2 in the test chamber was confirmed by using a modified Standard Method (SM) 4500-ClO2-B for Chlorine Dioxide [5] to collect hourly gas samples. A fan inside the chamber provided internal vapor mixing. Pressure relief valves and check valves prevented over-pressurization of the chamber.
Humidity within the chamber was controlled by a custom-built data acquisition system (DAS). A RH/temperature sensor (Vaisala, Vantaa, Finland) was used in a feedback loop to control RH. When the Vaisala RH sensor read lower than the RH set point, solenoid valves were opened to inject humid air from a gas humidity bottle (Fuel Cell Technologies, Albuquerque, NM, USA) into the chamber. The gas humidity bottle, heated to 60 °C, passed compressed air through Nafion® tubes surrounded by deionized water, creating a warm air stream saturated with water vapor. Temperature was controlled by circulation of cooling water from a refrigerating circulator (Isotemp 30165, Fisher Scientific, Waltham, MA, USA) through radiators placed inside the chamber. HOBO U10 RH sensor/loggers (Onset Computer Corporation, Bourne, MA, USA) were placed throughout the chamber to assess temperature and RH spatial variability within the chamber. Figure 2.1 shows a schematic of the configuration used for the tests.
3

Isolation chamber
ClO2 generator EMS ClO2
concentration DAS
Gas humidity
bottle Radiators
Cooling water
RH/temp sensor
Airlock
mSM-4500-B
Digital signal line
Digital control line
Heated tubing for gas flow
Cooling water line
Figure 2-1. ClO2 Fumigation System.
2.2 General Approach and Test Matrix
Four general tasks were associated with this testing:
Task 1: Coupon preparation. Coupons were either constructed or cut to size from existing materials. Grime was applied to the coupons, and a subset of coupons was washed. Coupons were then inoculated with the test organism.
Task 2: Determination of surface sampling method. New coupon types (subway tile and painted steel) were sampled using two techniques (sponge-stick wiping and wetted PRB wiping) to determine suitable sampling methods.
Task 3: Determination of settling time. A preliminary test was performed to determine if settling time is predominant for a modified aerosol deposition apparatus (ADA-2R), or if most spores are deposited by impaction.
4

Task 4: Decontamination tests using techniques from Tasks 2 and 3. Subway material coupons were fumigated and sampled to determine the fumigation efficacy.
2.2.1 Task 1: Coupon Preparation
This work was intended to explore the efficacy of ClO2 fumigant within subway systems. The concrete and tile coupon materials were taken from an actual subway system. Concrete pieces from the floor of the New York MTA Old South Ferry station and glazed ceramic wall tiles from the MTA West 4th Street station were available for this research. Painted steel coupons (2” x 2”) were fabricated using materials typical of steel support beams.
The concrete was previously tested and found not to contain substantial amounts of native grime. Ceramic wall tiles for initial tests did contain native grime, but due to a finite supply, subsequent tests were performed with subway-related grime added as discussed in the next section (Section 2.2.1.1). Painted construction steel was represented by coupons of unpolished low-carbon steel 1/8 inches (in) thick (P/N 8910K401, McMaster Carr, Atlanta, GA, USA) painted with Rust-Oleum Corporation (Vernon Hills, IL, USA) primer (P/N 249330) and an acrylic enamel (P/N 249291). Additional stainless steel coupons (2” x 2”) were used to determine the number of viable spores deposited onto the coupons and to assess the stability of the MDI used to inoculate the coupons.
2.2.1.1 Coupon Griming
Coupons without native grime were grimed from material scraped or vacuumed from the undercarriage of a BART subway car (Figure 2-2). The grime was applied to the sampling area of the coupons until either the grime was clearly visible or the coupon gained 3 mg of weight. The griming process consisted of applying the grime using a clean disposable brush, beginning with a circular motion, flattening and pressing the grime within a 1.5” x 1.5” square drawn on the coupon. The griming process continued until there was no visible change in the color or distribution of the grime with additional brushing, as illustrated in Figure 2-3. During the application of grime, each coupon was given a unique alphanumeric identification (ID). The ID was written on the side of the coupon using a permanent marker (e.g., black or silver Sharpie®). The stainless steel coupons (non-contaminated) were pre-labeled on the underside using a black Sharpie.
Figure 2-2. Scraping (left) and Vacuuming (right) of Undercarriage of a Subway Car during Maintenance.
5

Figure 2-3. Concrete Coupon after Grime Application
2.2.1.2 Coupon Cleaning
With the exception of greasy stubs, a subset of coupons was cleaned using a method adapted from the New York MTA (summarized below):
First, a cleaning solution was prepared. Tide® institutional formula floor and all-purpose cleaner (Procter & Gamble, Cincinnati, OH, USA) (4.2 g) was mixed into 1.5 liters of hot water to create a 0.28 % solution by weight. This solution was used to clean the surfaces using the following procedure:
1. Place material coupons flat in a sink with top surface facing up.
2. Spray coupons with the 0.28 % Tide solution using a foaming spray applicator such as a trigger sprayer (item # 3U603, Grainger, Lake Forest, IL, USA) connected to a 32-ounce (oz) spray bottle (item # 3U593, Grainger).
3. Scrub lightly with a 1.5-in soft pure-bristle paintbrush.
4. Rinse each coupon well under flowing tap water.
5. Stand each coupon on edge on a paper towel.
6. Blow dry the coupons with dry nitrogen to remove surface water.
7. Let each coupon dry for 24 hours (h) under normal laboratory conditions.
After cleaning, a 1.5-in x 1.5-in square was outlined on each coupon to frame the sampling area and align the ADA for inoculation.
6

2.2.1.3 Greased Stubs
Greasy stub coupons were manufactured by applying a drop of grease, collected as excessive grease near an axle of a BART subway car, to the surface of 18-mm aluminum stubs (P/N 16119, Ted Pella, Inc., Redding, CA). The grease added was sufficient to cover the stub with approximately 1/8” thick layer of grease. Greased stubs were included in five of the nine fumigation tests.
2.2.2 Task 2: Determination of Surface Sampling Method
To determine the best sampling method, six replicate grimed tile and grimed painted steel coupons were inoculated (See Section 2.2.3.2). Two previously evaluated sampling methods, sponge-stick wiping and wetted PRB wiping, were used to sample three coupons each. A successful sampling method would collect at least 1 x 10⁷ colony forming units (CFU) and have a precision of ±0.5 log. Ease of use and cost were also factors in determining the best sampling method to be used for the decontamination testing under Task 4.
2.2.3 Task 3: Aerosol Deposition Method
The aerosol deposition method was required to deliver an average of at least 1 x 10⁷ CFU and have a precision of ±0.5 log. Thus, the settling time for the deposited surrogate spore preparation targeted a deposition of 1 x 10⁷ CFU on a 1.5-in diameter portion of the subway surface. Four settling times were tested: 18 h, 1 h, 1 minute, and rapid reuse (no settling time) of the same ADA. Three coupons were used for each settling time. The coupons were sterilized before use and sampled with wetted PRB wipes.
2.2.3.1 Surrogate Spore Preparation
The test organism for this work was a powdered spore preparation of Bacillus globigii (Bg) (American Type Culture Collection [ATCC] 9372) and silicon dioxide particles. The resulting powdered matrix contained approximately 1 x 10¹¹ viable spores per gram, which was prepared by dry blending and jet milling the dried spores with the fumed silica particles (Degussa, Frankfurt am Main, Germany). This preparation was loaded into MDIs according to a proprietary protocol. Control checks for each MDI were included in the batches of coupons contaminated with a single MDI.
2.2.3.2 Coupon Inoculation
Coupons were inoculated (loaded) with the spore preparation to the targeted deposition of 1 x 10⁷ CFU using an MDI and a modified aerosol deposition apparatus (ADA-2R). The ADA-2R (Figures 2-4 and 2-5) consists of a round ADA with an O-ring gasket to clamp the ADA to the surface of coupon for inoculation. The MDI is attached to the top of the ADA and is activated though a slide on the top of the ADA. This round ADA was designed for deposition of spores onto a 1.5-in x 1.5-in square area of a piece of subway concrete. The 18-mm greasy stub coupons were inoculated using an MDI attached to an apparatus described in Lee et al. [4].
Each MDI provides 150 discharges before degradation of concentration. The number of discharges per MDI was tracked so that use did not exceed this value. Additionally, the weight of each MDI was determined after completion of the contamination of each coupon. If an MDI weighed less than 10.5 g at the start of the contamination procedure, the MDI was retired and a new MDI was used. For quality control of the MDIs, an inoculation control coupon was run as the first, middle, and last coupon inoculated with a single MDI in a single test.
7

A log was maintained for each set of coupons that were dosed. Each record in this log recorded the unique coupon identifier, the MDI unique identifier, the date, the operator, the weight of the MDI before dissemination into the coupon dosing device, the weight of the MDI after dissemination, and the difference between these two weights.
Figure 2-4. Schematic of Round ADA.
Figure 2-5. Round ADA with O-ring Gasket.
2.2.4 Task 4: Decontamination Tests
Nine fumigation scenarios were used to decontaminate triplicate coupons of two types, cleaned and not cleaned. Log reduction was calculated by comparing recovery from fumigated coupons to recovery from coupons that were inoculated but not fumigated (positive controls). The goal was to provide a 6-log reduction in CFU under fumigation conditions obtainable in the field. The test matrix is shown in Table 21. The initial focus was on fumigation at low (100 or 200 ppmv) ClO2 fumigation concentrations at 75% RH and 50% RH (Tests 2/2B – Test 5). Outcomes were compared against a medium high (1500 ppmv) ClO2 concentration fumigation test (Test 1). Subsequent Tests 6 and 7 investigated the impact of lower
8

Concentration (ppmv)
Exposure Times (h)
RH (%)
Temperature (°C)
Test ID
4.1 1500 0, 2, 4, and 6 75 24 4.2* 200 0, 4, 8, and 12 75 24 4.2B 200 0, 4, 8, and 12 75 24 4.3 100 0, 4, 8, and 12 75 24 4.4 200 0, 4, 8, and 12 50 24 4.5 100 0, 4, 8, and 12 50 24 4.6 200 0, 4, 8, and 12 75 12 4.7 200 0, 12, 18, and 24 75 12 4.8 3300 0, 2, 3, and 4 75 24 4.9 3300 0, 3, 6, and 9 75 12
Concentration(ppmv)
Exposure Times(h)
RH(%)
Temperature(°C)
temperature with up to 24 h fumigation (RH 75%). Tests 8 and 9 were conducted based on the outcomes of Tests 6 and 7.
The lower temperature fumigation conditions were selected based on the average temperature in wintertime (December–February) in a Boston subway station
Table 2-1. Fumigation Test Matrix for Each Type of Coupon Material
*: RH conditions were outside target range; test was repeated (Test 4.2B)
Testing was conducted in a modified glovebox (Figure 2-6) and proceeded as follows:
1. Three test coupons per exposure time point and coupon type and one procedural blank couponper coupon type (negative control) were loaded into the glovebox.
2. Coupons were fumigated with ClO2 using the ClorDiSys GMP system according to theparameters in Table 2-1.
3. After the exposure time was reached, the coupons were transferred to the airlock where theywere aerated before removal.
4. Coupons were immediately sampled after removal from the airlock.
5. Logical groups of samples along with chain of custody (COC) documentation were transferred tothe National Homeland Security Research Center (NHSRC) on-site biocontaminant laboratory insterile primary packaging within sterile secondary containment.
9

Figure 2-6. Modified Glovebox - ClO2 Fumigation Chamber.
All test activities were fully documented with narratives in laboratory notebooks, digital photography, and video. Where appropriate, documentation also included information such as the record of time required for each decontamination step or procedure, any deviations from the test plan, and physical impact on the materials.
2.3 Sampling and Analytical Procedures
Wipe samples were collected by sampling within a 1.5-in x 1.5-in sampling template pre-printed on the coupons prior to inoculation with approximately 1 x 10⁷ spores. For each inoculation event, additional control samples were collected from stainless steel surfaces as MDI control samples. Within a single test, surface sampling was completed first for all blank coupons before sampling any inoculated coupons.
All materials needed for sampling were prepared using aseptic techniques prior to sampling. A sample collection bin was used to transport samples to the biocontaminant laboratory. The exterior of the transport container was decontaminated by wiping all surfaces with a bleach wipe or towelette moistened with a solution of pH-adjusted bleach (pAB) prior to transport from the sampling location to the NHSRC biocontaminant laboratory.
2.3.1 Sample Quantities and Frequency
The sample quantities are outlined in Table 2.2. Concrete coupon quantities were limited by the finite amount of unpainted subway concrete available at the time of this study. Table 2.2 also lists the frequency of all samples for Task 4 fumigation tests.
10

Table 2-2. Sample Frequency Sample Type Quantity Frequency Location Purpose Test coupon 3 per coupon type
and fumigation condition
1 set per fumigation time
Glovebox (fumigated)
To determine the number of viable spores after fumigation
Negative control coupon
1 per coupon type 1 per fumigation test
Outside glovebox; same room (not fumigated)
To determine extent of cross contamination and/or sterility of coupons
Procedural blank coupon
1 per coupon type 1 per fumigation time
Glovebox (fumigated)
To determine extent of cross contamination
Positive control coupon
3 per coupon type; inoculated as the first, middle, and last coupons
1 per inoculation Outside glovebox; same room (not fumigated)
To determine the number of viable spores recoverable from the coupons
MDI control coupons (stainless steel)
3 per inoculation event; inoculated immediately before each positive control coupon
1 per inoculation Outside glovebox; same room (not fumigated)
To determine the number of viable spores deposited onto the coupons and to assess the stability of the MDI
NHSRC biocontaminant laboratory material blanks
1 per material Once per use of material
Biocontaminant laboratory
To demonstrate sterility of extraction and plating materials
ClO2 monitor 1 Real-time during ClO2 fumigations
Glovebox To determine coupon exposure
mSM* 4500-B ClO2 wet chemistry samples
Duration dependent
Once every 60 minutes
Glovebox To validate operation of ClO2 real-time monitors
RH/Temperature 1 Logged every 10 seconds
Glovebox To determine environmental conditions during fumigations
NA = not applicable *mSM = modified standard method
2.3.2 Definition of Efficacy
Efficacy is defined as the extent, by log reduction (LR), to which the agent extracted from the coupons after the treatment with the decontamination procedure is reduced below that extracted from positive control areas (not exposed to the decontamination procedure). Efficacy was calculated for each material within each combination of decontamination procedure (i) and test material (j) as follows:
(2-1) = log( ) / − log( ) / LR ij ∑ CFU ijc N ijc ∑ CFU ijk N ijk
c=1 k=1
where:
LRi = the average log reduction of spores on a specific material surface.
11

the average of the logarithm of the number of viable spores∑ log(CFU cj) / N C = (determined by CFU) recovered on the control coupons (c = control,c=1
j = coupon number, and NC is the number of coupons [1, j]).
the average of the logarithm of the number of viable spores
∑ log(CFU ) / N (determined by CFU) recovered from the surface of a S t =
k decontaminated coupon (S = decontaminated coupon, k = coupon number, and Nt is the number of coupons tested [1, k]).
The standard deviation of LRi is calculated by Eqn. 2-2:
∑Ns (x )2
ijk − LRSD
ij
= k=1 η ij Nijk −1
(2-2)
where:
SDη = standard deviation of ηi.i
LR ij = the average log reduction of spores on a specific material surface.
the average of the log reduction of each from the surface of a decontaminated Xijk =
coupon (Eqn. 2.3-3).
∑ {∑ log(CFU ) / N − log( CFU ijk )} (2-3) ijc C
k C=1x = ijk Nijk
where:
the “mean of the logs”; the average of the logarithm transformed number of viable spores (determined by CFU) recovered on the ∑ log(CFU ijc) / N ijc =
c control coupons (C = control, j = coupon number, and NC is the number of coupons [1, j])
CFU = number of CFU on the surface of the kth decontaminated coupon.
The variances (i.e., the square of the standard deviation) of the log CFUijc and log CFUijk values were also calculated for both the control and test coupons (i.e., S2ijc and S2ijk), and were used to calculate the pooled standard error (SE) for the efficacy value calculated in Equation 2-1, as follows:
12

S 2 S 2
SE = c t ij + ij ij 3 3
(2-4)
where the number 3 represents the number j of coupons in the positive control and test coupon data sets. Each efficacy result is reported as a log reduction with an associated SE value.
The significance of differences in efficacy across different coupon materials and spore types was assessed based on the 95% confidence interval (CI) of each efficacy result. The 95% confidence interval (CI) is:
95% CIij = LRij ± (1.96 × SEij) (2-5)
Differences in log reduction/efficacy were judged to be significant if the 95% CIs of the two fumigation results did not overlap.
2.3.3 Sampling Procedures
2.3.3.1 Wetted PRB wipe Sampling
The wetted PRB wipe sampling is typically used for small sample areas and is effective on nonporous smooth surfaces such as ceramic, metal, and painted surfaces. The general approach is that a moistened sterile PRB pad (Kendall Versalon Wipe, P/N 8042; Covidien, Minneapolis, MN, USA) is used to wipe a specified area to recover bacteria, viruses, and biological toxins. The protocol that was used in this project is adapted from that provided by Busher et al. [6] and Brown et al. [7], with an additional step of squeezing out excess moisture from the pad before sampling. Normally, the moisture is needed when sampling a larger surface area, but for smaller areas such as the 1.5-in x 1.5-in sample area used here, the moisture either drips off or remains on the sampling area and reduces recovery. Wetted PRB wipe samples were extracted in 20 mL of phosphate-buffered saline with 0.05% Tween® 20 (PBST, Sigma-Aldrich, P/N P-3563), sonicated, vortexed, and subjected to serial 10-fold dilution and spread-plating.
2.3.3.2 Sponge-Stick Wipe Sampling
Sponge-stick wipe (3M™ P/N SSL10NB, Saint Paul, MN, USA) sampling was used for evaluation during Task 2. Sponge-stick wipe samples were collected using two patterns: (1) Using the flat side of the sponge-stick, the surface was sampled using one or two horizontal strokes covering the entire template area. (2) The sponge-stick was flipped over to the opposite side to sample the surface in a vertical pattern covering the entire template area with one or two vertical strokes. This procedure is an abbreviated version of the method described in detail in Rose et al. [8], which was designed to sample a larger area than the area used for this study. Sponge-stick samples were extracted in 90 mL PBST using a stomacher (Seward Stomacher® bags, P/N BA6041/CLR, Davie, FL, USA) and subjected to 10-fold serial dilution and spread-plating.
2.3.3.3 Extraction of Greasy Stubs
The 18-mm aluminum stubs with grease were extracted in 10 mL PBST, sonicated, vortexed, and subjected to serial 10-fold dilution and spread-plating.
13

2.3.3.4 Wet Chemistry Samples
The concentration of ClO2 in the gas phase was determined using a modification of American Water Works Association (AWWA) Standard Method 4500-B-ClO2 [5], in which the ClO2 (and any Cl2 present) react with potassium iodide in a buffered solution. The ClO2 extractive samples were collected hourly during ClO2 fumigations. Generally, a dry gas meter box was used to pull (impinge) between 2 and 4 liters of gas through 50 mL of buffered potassium iodide solution.
2.4 Sample Handling and Custody
2.4.1 Preventing Cross Contamination during Sampling
Sampling poses a significant opportunity for cross contamination of samples. In an effort to minimize the potential for cross contamination, several management controls were included in the sampling protocol summarized below:
• In accordance with aseptic technique, a sampling team was used, made up of a sampler, asupport person, and a sample handler.
• The sample handler was the only person to handle ADAs or material coupons during thesampling event. The sampler handled only the sampling media, and the support person handledall other supplies.
• Each wipe sample was placed in an individual sterile 50-mL conical tube for primary containmentand then into sterile sampling bags for secondary containment.
• All biological samples from a single test were then placed in a sterilized container for storage andtransport to the NHSRC biocontaminant laboratory. The container was wiped with a towelettesaturated with at least 5000 ppmv hypochlorite solution by weight.
Additionally, and equally important, the order of sampling was as follows: (1) all blank coupons, (2) decontaminated coupons, and (3) positive control coupons. This order ensured that coupons werehandled in an order from lowest level of contamination to the highest.
2.4.2 Sample Identification
Each coupon was identified with a two-letter description of the material and a unique sample number. Material codes for samples from inoculated coupons were preceded by an X, as shown in Table 2.3. The sampling team maintained an explicit laboratory log that recorded each unique sample number and its associated test number, contamination application, sampling method, and the date sampled. Each coupon was marked with only the material descriptor and unique code number. Once samples were transferred to the bio-contaminant laboratory for plate counts, each sample was additionally identified by replicate number and dilution.
14

Table 2-3. Sample Identification Coupon Identification: WA-T-(X)MM-H-S-N
Category Example
Code
WA 12 Work assignment number
T (Test ID) 5 Test ID from Table 2-1
(X) MM(Material)
X Not inoculated
WC Washed (Clean) Concrete
GC Grimed Concrete
WT Washed Tile
GT Unwashed Tile
SS Stainless Steel (for QC purposes)
F Field blank
L Lab blank
H (duration of exposure) # Hours of exposure duration. Non-fumigated samples will have a 0 in this place
S (Sample Type)
P PRB Wipe
M Sponge-stick
N (Sample Number)
N Sequential numbers
DCMD Biocontaminant Laboratory Plate Identification: WA-T-(X)MM-H-S-N-R-d
WA-T-(X)MM-H-S-N As above
R (Replicate)
R A – C
d(Dilution) 1 0 to 4, for 10E0 to 10E4
2.5 Microbiological Methods
2.5.1 Wipe Sample Extraction
Wipe kits were prepared with 2.5 mL of PBST in a conical tube with the aseptic addition of wipes (Curity™ all-purpose sponges, Covedien, Minneapolis, MN, USA) to the top of the tube. This procedure kept the wipes dry until they were vortexed immediately prior to sampling, thus wetting the wipe. The wipe was then swept across the material surface in an “S” pattern to recover any bacterial spores that had adhered to the surface. The wipes were extracted in 20 mL of PBST and vortexed for two minutes using 10second bursts to dislodge the spores into the solution.
2.5.2 Colony Plating
Once extracted, the wipe samples were dilution plated using a 1:10 ratio. The plates were completed in triplicate at each dilution to determine the average CFU for each sample. The plates were incubated for
15

18–24 h at 35 °C. After incubation, the plates were manually enumerated, and dilution sets were recorded for further analysis. The countable range of CFU was between 30 and 300 spores per sample. Any samples not meeting this criterion were completed using filters to determine the lowest detection limit possible.
2.5.2.1 Coupon Spore Enumeration
The NHSRC biocontaminant laboratory quantified the number of viable spores per sample. PBST was used as the extraction buffer for all sample types. The extraction procedure used to recover spores varied depending on the different matrices (PRB wipes or sponge-sticks). Details on the PBST wetting agent and procedures for extraction of spores from PRB wipes and sponge-sticks can be found elsewhere [9,10]. Extraction of spores from the 18 mm stubs with grease followed methods described in Lee et al. [4]. After conducting the appropriate extraction procedure, the extract was subjected to a five-stage serial dilution (10-1 to 10-5) in PBST, and a 0.1 mL volume was spread-plated onto tryptic soy agar in triplicate. Plates were incubated overnight at 35 ± 2 °C and CFU were counted visually. Only plates containing between 30 and 300 CFU were utilized for recovery estimates. Extracts were diluted and replated if none of the 10-fold dilutions resulted in all three plates containing colony counts within the acceptable range. Samples that had fewer than the reportable limit of 30 CFU/plate from the undiluted sample underwent filter plating. In short, the liquid extract sample was filtered through a 0.2 µm pore-size filter, which retained the spores. The filter was then placed on medium where colony forming units were counted. All extracts were stored at 4 ± 2 °C. While there are no EPA-approved methods for spore enumeration from surfaces, the use of positive control samples as the baseline for log reduction calculations includes a built-in verification of the deposition and enumeration methods.
16

3 RESULTS AND DISCUSSION
3.1 Task 2: Determination of Surface Sampling Method
Task 2 measured the recovery of the sponge-stick wipe and the PRB wipe surface sampling methods from inoculated grimed subway materials (tile and painted steel). The same recovery test was conducted for grimed concrete as part of a previous study [3]. The results for grimed tile and grimed painted steel are displayed in Tables 3-1 and 3-2 and visualized in Figure 3-1. Stainless steel controls were sampled using the sponge-stick wipe method.
Table 3-1. Recovery from Grimed Tile Using Various Sampling Methods Sample Average Maximum Minimum RSD Sponge-sticks 1.1 x 10⁷ 1.4 x 10⁷ 7.8 x 10⁶ 28% Wetted PRB wipes 8.6 x 10⁶ 1.0 x 10⁷ 7.1 x 10⁶ 17% Stainless steel controls 1.2 x 10⁷ 1.6 x 10⁷ 8.1 x 10⁶ 34%
Table 3-2. Recovery from Grimed Painted Steel Using Various Sampling Methods Sample Average Maximum Minimum RSD Sponge-sticks 1.8 x 10⁷ 2.3 x 10⁷ 1.3 x 10⁷ 29% Wetted PRB wipes 2.8 x 10⁷ 3.4 x 10⁷ 2.1 x 10⁷ 25% Stainless steel controls 1.5 x 10⁷ 1.9 x 10⁷ 1.1 x 10⁷ 29%
Grimed Tile Grimed Painted Steel SS Reference 0.0
5.0x10⁶
1.0x10⁷
1.5x10⁷
2.0x10⁷
2.5x10⁷
3.0x10⁷
3.5x10⁷
4.0x10⁷
CFU
Rec
over
ed
Sponge-stick wipe PRB Wipe
Grim
ed T
ile te
st
Grim
ed P
aint
ed S
teel
test
Figure 3-1. Recovery Using Various Sampling Methods. Error Bars Represent 95% CI.
17

18 Hour 18 Hour 1 Hour 1 Hour 1 Minute 1 Minute RapidRapid
18 Hour 0.08 0.31 0.01 1 Hour 0.40 0.04
1 Minute 0.18 Rapid
In this study, the recovery from wetted PRB wipes was found to be similar to the recovery from sponge-sticks (Student’s t-test P>0.05 for both grimed materials). The previous recovery study [3] resulted in the use of the sponge-stick for wipe sampling of grimed concrete based on a lower relative standard deviation compared to the sampling with the wetted PRB wipe. Since the laboratory methods from processing wetted PRB wipes are less intensive than processing sponge-sticks, all surfaces were sampled using wetted PRB wipes for the rest of this study.
3.2 Task 3: Aerosol Deposition Method
The inoculation method using the ADA-2R actuators was originally designed to include a settling time (18 h) for spores settling into the surface. This approach would have required the construction and expense of essentially one ADA-2R actuator per coupon per test condition. Task 3 was designed to determine if the settling time was a necessary component of the inoculation method considering that the inoculated surface is only 1.5 in by 1.5 in. Coupons were inoculated at different times so that sampling would occur at the same time. Results of this test are shown in Table 3-3 and Figure 3-2. A comparison of the different settling times was made using a Student’s t-test with the null hypothesis that the two settling times are the same (P<0.05). One-tail P values were calculated (Table 3-4) to determine whether the mean recovery for the 18 h settling time was statistically different from the shorter settling time.
Table 3-3. Recoveries at Various Settling Periods
Replicate Recovery (CFU)
18 Hour 1 Hour 1 Minute Rapid
1 3.63E+07 3.41E+07 2.50E+07 2.66E+07
2 4.64E+07 3.52E+07 4.99E+07 3.28E+07
3 4.22E+07 3.64E+07 3.72E+07 2.76E+07
Table 3-4. Student’s t-test P-values (one-sided)
18

60
CFU
Rec
over
ed (M
illio
ns) p
er R
eplic
ate
Task 3 Recovery
50
40
30
20
10
0
Replicate
18 Hour Settling Time
1 Hour Settling Time
1 Minute Settling Time
Rapid Reuse of ADA (No settling Time)
1 2 3
Figure 3-2. Recovery Using Various Settling Times.
The results indicated that recovery following an 18-h settling time was not higher than recovery following a 1-h settling time (Student’s t-test value = 0.08), or a 1-minute settling time (Student’s t-test value = 0.31). The use of no settling time led to a significantly lower number of spores deposited when compared to the 18 h settling time (Student’s t-test value = 0.01), supporting the hypothesis that the vast majority of spores were deposited by impaction with a minimal, non-discernible, contribution by the settling of spores from the space above the coupon. Consequently, a 1-minute settling time was used as part of the inoculation procedures of these 1.5” by 1.5” surface areas. The reuse of the ADA did not lead to accumulation biases and was adopted as the method for all inoculations as part of the fumigation efficacy testing.
3.3 Task 4: ClO2 Fumigation Testing
3.3.1 Fumigation Conditions
As discussed in section 2.1, two measurement methods were used for determining the ClO2
concentration: a real-time photometer (EMS unit) and the periodic wet chemistry method based on AWWA SM 4500-ClO2 B [5]. For the duration of the wet chemistry samples, photometer samples were also collected. Table 3-5 shows an example ratio of wet chemistry to photometer readings for Task 4 tests. The temporal ClO2 concentrations, based on real-time photometer data, are listed in Table 3-6. These measurements were standardized to the wet chemistry values using the ratios listed in Table 3-5. The temporal average RH and temperatures conditions are shown in Tables 3-7 and 3-8, respectively.
19

Test No. Target Condition Target Condition (ppmv) (ppmv)
Average (±SD) ClO2 (ppmv) Average (±SD) ClO2 (ppmv)
2 h2h 4 h4h 6 h6h
4.1 1500 1482 ± 41 1482 ± 56 1487 ± 64 4 h4h 8 h8h 12 h12h
4.2* 200 258 ± 27 272 ± 32 277 ± 32 4.2B 200 230 ± 33 230 ± 33 229 ± 33
4.3 100 124 ± 20 141 ± 33 146 ± 32 4.4 200 284 ± 34 291 ± 34 298 ± 35 4.5 100 184 ± 14 184 ± 14 185 ± 14 4.6 200 251 ± 31 245 ± 32 236 ± 31
12 h12h 18 h18h 24 h24h 4.7 200 218 ± 21 214 ± 21 213 ± 20
2 h2h 3 h3h 4 h4h 4.8 3000 3449 ± 20 3454 ± 105 3456 ± 19
3 h3h 6 h6h 9 h9h 4.9 3000 3254 ± 32 3273 ± 221 3278 ± 42
Table 3-5. Average Wet Chemistry and Photometer Readings
Test No. Wet Chemistry (mg/L)
EMS Reading (mg/L) Ratio
4.1 4.05 3.67 1.10 4.2* 0.63 0.72 0.87 4.2B 0.62 0.69 0.89 4.3 0.40 0.28 1.39 4.4 0.85 0.87 0.98 4.5 0.44 0.45 0.97 4.6 0.66 0.72 0.92 4.7 0.60 0.61 0.98 4.8 9.44 8.27 1.14 4.9 9.06 8.12 1.12
*: RH conditions were outside target range; test was repeated (Test 4.2B)
Table 3-6. Task 4 Fumigation ClO2 Concentration
*: RH conditions were outside target range; test was repeated (Test 4.2B)
20

Test No. Target Condition Target Condition (°C)(°C)
Average (±SD) Temperature (°C) Average (±SD) Temperature (°C)2 h2h 4 h4h 6 h6h
4.1 24 24.1 ± 0.0 24.3 ± 0.1 24.4 ± 0.3 4 h4h 8 h8h 12 h12h
4.2* 24 23.2 ± 0.2 23.6 ± 0.4 23.7 ± 0.4 4.2B 24 26.3 ± 0.2 26.9 ± 0.5 27.0 ± 0.6
4.3 24 22.9 ± 0.0 22.9 ± 0.0 23.0 ± 0.0 4.4 24 22.3 ± 0.1 22.5 ± 0.2 22.6 ± 0.0 4.5 24 23.8 ± 0.1 23.8 ± 0.1 23.7 ± 0.0 4.6 10 11.0 ± 0.2 11.0 ± 0.2 10.9 ± 0.2
12 h12h 18 h18h 24 h24h 4.7 10 11.5 ± 0.3 11.5 ± 0.3 11.2 ± 0.5
2 h 2h 3 h3h 4 h4h 4.8 24 26.7 ± 0.2 27.0 ± 0.3 27.1 ± 0.3
3 h3h 6 h6h 9 h9h 4.9 10 12.5 ± 0.2 12.8 ± 0.4 12.9 ± 0.4
Table 3-7. Task 4 Fumigation RH
Test No. Target Condition (%)
Average (±SD) RH (%) 2 h 4 h 6 h
4.1 75 75 ± 0 75 ± 0 75 ± 0 4 h 8 h 12 h
4.2* 75 53 ± 8 65 ± 12 68 ± 11 4.2B 75 77 ± 2 76 ± 1 76 ± 2 4.3 75 75 ± 0 75 ± 0 75 ± 0 4.4 50 50 ± 0 50 ± 0 50 ± 0 4.5 50 53 ± 2 52 ± 2 51 ± 0 4.6 75 70 ± 0 70 ± 0 71 ± 1
12 h 18 h 24 h 4.7 75 78 ± 2 79 ± 2 79 ± 2
2 h 3 h 4 h 4.8 75 76 ± 0 76 ± 0 76 ± 0
3 h 6 h 9 h 4.9 75 68 ± 2 68 ± 2 68 ± 2
*: RH conditions were outside target range; test was repeated (Test 4.2B)
Table 3-8. Task 4 Fumigation Temperature
*: RH conditions were outside target range; test was repeated (Test 4.2B)
The low temperature and high humidity conditions (Tests 4.6, 4.7, and 4.9) were difficult to reach and maintain. The temperature of the cooling water and radiator was operating below the dew point of the target condition, causing condensation on cooling lines. The impact of this condensation on the efficacy test results was deemed minimal or non-existent as it only impacted the amount of water that was required to maintain the RH condition.
21

3.3.2 Efficacy Results
The aim of this study was to determine the efficacy of the different fumigation scenarios listed in Table 2-1 and evaluate the effect of each critical parameter that drives the efficacy in each of these scenarios. The results presented in this section evaluate the effect of each critical parameter while maintaining the other critical parameters constant.
3.3.2.1 Effect of Temperature at Constant RH [75%]
Reducing the temperature from 24°C to 11°C dramatically reduced the efficacy of ClO2 fumigation (Figures 3-3, 3-4, and 3-5). A 12-h exposure at 200 ppmv ClO2 (Test 4.2B) provided greater than 6 LR for most materials, but at 11 °C, the same exposure time led to only a 2 LR (Test 4.6). Extending the exposure time to 24 h (Test 4.7) did not improve efficacy. Washed painted steel and washed tile were not included in the 24 h exposure test based on limited availability of subway building materials.
0
1
2
3
4
5
6
7
8
9
Grimed Concrete Washed Concrete Grimed Painted Steel
Washed Painted Steel
Grimed Tile Washed Tile
Log
Redu
ctio
n
Test 4.2b - 24 °C - 12h
Test 4.6 - 11 °C - 12h
Test 4.7 - 11 °C - 24h
Figure 3-3. Effect of Temperature on Efficacy for 12-h and 24-h Exposure at 200 ppmv ClO2 and 75% RH. Error Bars Represent the 95% CI.
Similar results were seen at a 12-h exposure to 100 ppmv ClO2 (Test 4.3 and 4.5). At this concentration, ClO2 is not highly efficacious (3.0-5.5 LR range) at 24 °C/75% RH for 12 h but still more efficacious than at the tested 12 °C/75% RH for the same 12 h fumigation period.
22

0
1
2
3
4
5
6
7
Log
Redu
ctio
n Test 4.3 - 24 °C - 12h
Test 4.5 - 12 °C - 12h
Grimed Concrete Washed Concrete Grimed Painted Washed Painted Grimed Tile Washed Tile Steel Steel
Figure 3-4. Effect of Temperature on Efficacy for 12-h Exposure at 100 ppmv ClO2 and 75% RH. Error Bars Represent the 95% CI.
At a much higher ClO2 concentration of 3300 ppmv (Tests 4.8 and 4.9), the differences are less distinctive. Here, a 6 LR or greater was achieved for only two materials (grimed concrete and grimed tile). Nevertheless, less than 2 LR was achieved for all materials at 12 °C, even after a 9-h fumigation time.
9
Log
Redu
ctio
n
8
7
6
5
4
3
2
1
0
Test 4.8 - 24 °C - 4h
Test 4.9 - 12 °C - 9h
Grimed Concrete Washed Concrete Grimed Painted Steel Grimed Tile
Figure 3-5. Effect of Temperature on Efficacy for 4-h and 9-h Exposure at 3300 ppmv ClO2 and 75% RH. Error Bars Represent the 95% CI.
23
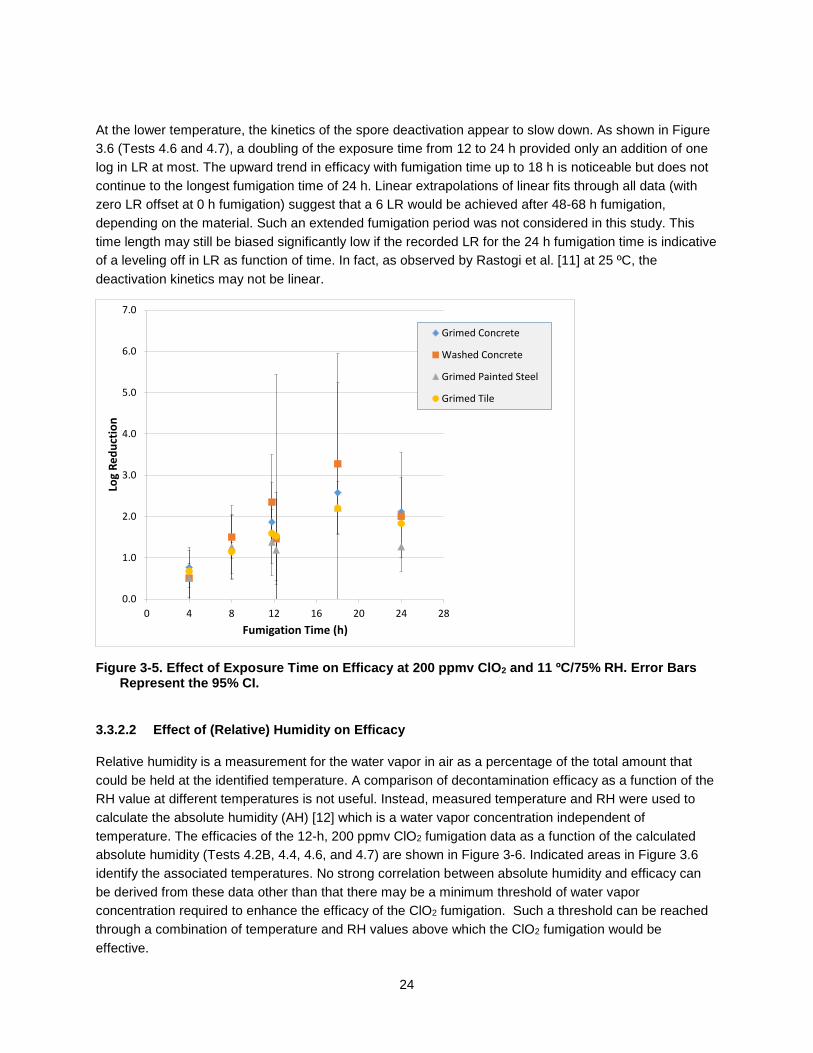
At the lower temperature, the kinetics of the spore deactivation appear to slow down. As shown in Figure 3.6 (Tests 4.6 and 4.7), a doubling of the exposure time from 12 to 24 h provided only an addition of one log in LR at most. The upward trend in efficacy with fumigation time up to 18 h is noticeable but does not continue to the longest fumigation time of 24 h. Linear extrapolations of linear fits through all data (with zero LR offset at 0 h fumigation) suggest that a 6 LR would be achieved after 48-68 h fumigation, depending on the material. Such an extended fumigation period was not considered in this study. This time length may still be biased significantly low if the recorded LR for the 24 h fumigation time is indicative of a leveling off in LR as function of time. In fact, as observed by Rastogi et al. [11] at 25 ºC, the deactivation kinetics may not be linear.
0.0
1.0
2.0
3.0
4.0
5.0
6.0
7.0
0 4 8 12 16 20 24 28
Log
Redu
ctio
n
Fumigation Time (h)
Grimed Concrete
Washed Concrete
Grimed Painted Steel
Grimed Tile
Figure 3-5. Effect of Exposure Time on Efficacy at 200 ppmv ClO2 and 11 ºC/75% RH. Error Bars Represent the 95% CI.
3.3.2.2 Effect of (Relative) Humidity on Efficacy
Relative humidity is a measurement for the water vapor in air as a percentage of the total amount that could be held at the identified temperature. A comparison of decontamination efficacy as a function of the RH value at different temperatures is not useful. Instead, measured temperature and RH were used to calculate the absolute humidity (AH) [12] which is a water vapor concentration independent of temperature. The efficacies of the 12-h, 200 ppmv ClO2 fumigation data as a function of the calculated absolute humidity (Tests 4.2B, 4.4, 4.6, and 4.7) are shown in Figure 3-6. Indicated areas in Figure 3.6 identify the associated temperatures. No strong correlation between absolute humidity and efficacy can be derived from these data other than that there may be a minimum threshold of water vapor concentration required to enhance the efficacy of the ClO2 fumigation. Such a threshold can be reached through a combination of temperature and RH values above which the ClO2 fumigation would be effective.
24

25
Figure 3-6. Effect of Absolute Humidity on Decontamination Efficacy after 12 h at 200 ppmv ClO2. Error Bars Represent the 95% CI.
9.0
8.0
7.0
6.0
ion
ct 5.0
ude R 4.0
ogL
3.0
2.0
1.0
0.00 4 8 12 16 20 24
Absolute Humidity (g/m3)
Grimed Concrete
Washed Concrete
Grimed Painted Steel
Grimed Tile24 °C
11 °C
3.3.2.3 Effect of ClO2 Concentration
Not all materials showed an increase in efficacy with increasing ClO2 concentration. Figure 3-7 shows the average LR for a 4-h exposure at 75% RH at various ClO2 concentrations. Grimed tile and grimed concrete showed the strongest concentration dependence.

26
Figure 3-7. Effect of Chlorine Dioxide Concentration on Efficacy at 24 ºC / 75% and 4-h Exposure. Error Bars Represent the 95% CI.
9.0
8.0
7.0
6.0
onict 5.0
ude R 4.0
ogL
3.0
2.0
1.0
0.00 1000 2000 3000
ClO2 Concentration (ppmv)
Grimed Concrete
Washed Concrete
Grimed Painted Steel
Grimed Tile
3.3.2.4 Effect of Washing of Grimed Coupons
A grimed and then washed material (before inoculation) appears to increase the likelihood of a successful ClO2 fumigation as illustrated in Figure 3-8 for four test conditions that resulted in an at least 3 log LR. For eight of the ten unwashed/washed material pairings, the LR is higher for the grimed and then washed coupon than the grimed coupon without washing. The variances in recovered viable spores associated with the low number of replicates (n = 3) per material are unfortunately too high to identify whether these differences are statistically significant.

0
1
2
3
4
5
6
7
8
9
24 °C/75% RH 1500 ppm - 6h
24 °C/75% RH -200 ppm - 12h
24 °C/75% RH -100 ppm - 12h
24 °C/75% RH 3300 ppm - 4h
Log
Redu
ctio
n Grimed Concrete
Washed Concrete
Grimed Painted Steel
Washed Painted Steel
Grimed Tile
Washed Tile
Figure 3-8. The Effect of Washing on Decontamination Efficacy (Test 2B). Error Bars Represent the 95% CI.
3.3.2.5 Efficacy for Greasy Stubs Compared to other Materials
Greasy stubs were not always present in every fumigation test. Fumigation results for the greasy stubs under moderately efficacious fumigation conditions are shown in Figure 3-9. The LR of spores on the greased subs was in line with the LR observed for the other materials.
0
1
2
3
4
5
6
7
8
Grimed Concrete
Washed Concrete
Grimed Painted Steel
Washed Painted Steel
Grimed Tile Washed Tile Greasy Stub
Log
Redu
ctio
n
Test 4.1 24 °C/75% RH -1500 ppm - 6h
Test 4.3 24 °C/75% RH -100 ppm - 12h
Figure 3-9. Efficacy for Greased Stubs Compared to Other Materials.
27

4 Quality Assurance and Quality Control
Quality Assurance (QA)/QC procedures were performed in accordance with the Quality Management Plan (QMP) and the Quality Assurance Project Plan (QAPP). The QA/QC procedures and results are summarized below.
All test activities were documented via narratives in laboratory notebooks and the use of digital photography. The documentation included, but was not limited to, a record for each decontamination test and any deviations from the QAPP. All tests were conducted in accordance with developed Decontamination Technologies Research Laboratory (DTRL) and NHSRC Biocontaminant laboratory Miscellaneous Operating Procedures (MOPs) to ensure repeatability and adherence to the data quality validation criteria set for this research effort.
The primary objective of this research was to evaluate the impact that environmental conditions (temperature and RH) and the dirt and grime on underground subway-related construction materials have on the ClO2 fumigation efficacy. Secondary objectives included determining which sampling procedure provides better recovery from grimed and cleaned steel and ceramic tile. This section discusses the Criteria for Critical Measurements (Section 4.1), Quality Control (QC) checks (Section 4.2), and QA/QC Sample Acceptance Criteria (Section 4.3) to accomplishing the project objectives.
4.1 Criteria for Critical Measurements
Critical measurements were identified to address the stated objectives and specify tolerable levels of potential errors associated with simulating the prescribed decontamination environments. The following measurements were deemed to be critical to accomplish part or all of the project objectives:
• Enumeration of spores/CFU on the surface of the subway material coupons;
• ClO2 concentration measurements to characterize the fumigation conditions;
• Measurement of environmental conditions during ClO2 fumigation (temperature and RH)
Data quality indicators (DQIs) for the critical measurements were used to determine if the collected data met the quality assurance objectives. A list of these DQIs can be found in Table 4-1. Failure to provide a measurement to meet these goals resulted in a rejection of results derived from the critical measurement. For instance, if the plated volume of a sample was not known (i.e., was not 100% complete), then that sample was declared invalid. If a collected sample was lost or did not meet the criteria for other reasons, then another sample was collected to take its place.
Table 4-1 lists the quantitative acceptance criteria for these critical measurements. Failure to provide a measurement method or device that met these goals would result in a rejection of results derived from the critical measurement.
28
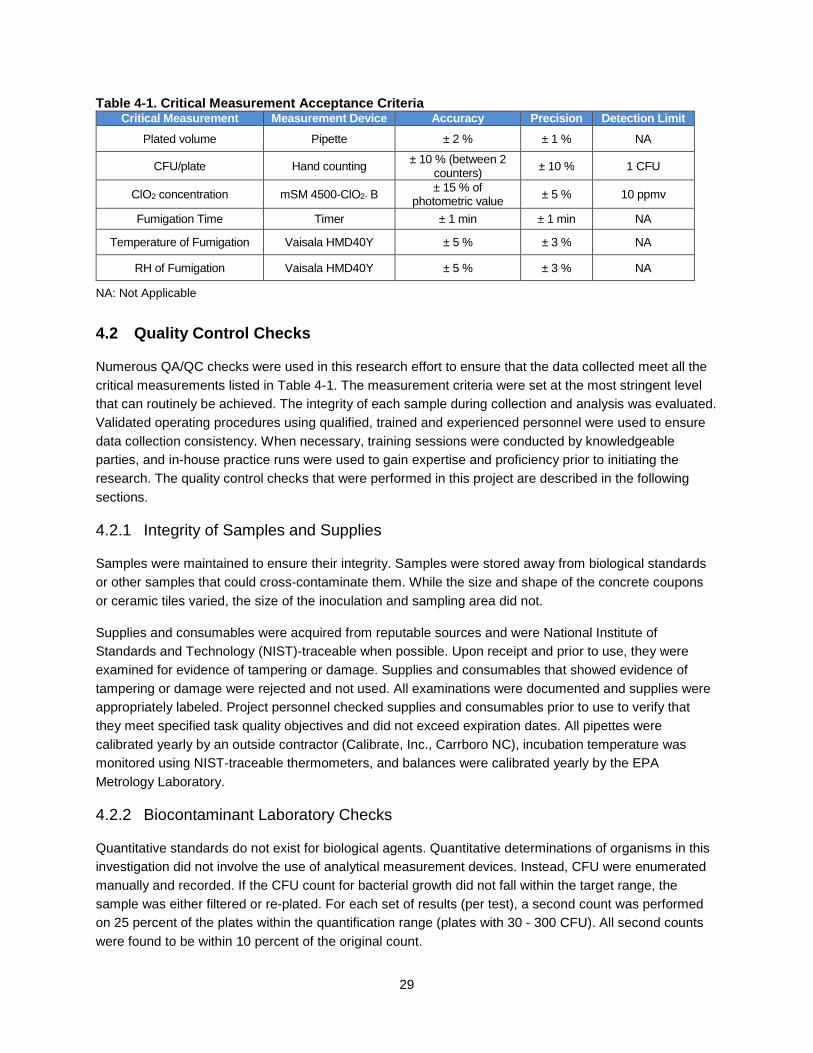
Table 4-1. Critical Measurement Acceptance Criteria Critical Measurement
Plated volume
Measurement Device Pipette
Accuracy ± 2 %
Precision ± 1 %
Detection Limit NA
CFU/plate Hand counting ± 10 % (between 2 counters) ± 10 % 1 CFU
ClO2 concentration mSM 4500-ClO2- B ± 15 % of photometric value ± 5 % 10 ppmv
Fumigation Time Timer ± 1 min ± 1 min NA
Temperature of Fumigation Vaisala HMD40Y ± 5 % ± 3 % NA
RH of Fumigation Vaisala HMD40Y ± 5 % ± 3 % NA
NA: Not Applicable
4.2 Quality Control Checks
Numerous QA/QC checks were used in this research effort to ensure that the data collected meet all the critical measurements listed in Table 4-1. The measurement criteria were set at the most stringent level that can routinely be achieved. The integrity of each sample during collection and analysis was evaluated. Validated operating procedures using qualified, trained and experienced personnel were used to ensure data collection consistency. When necessary, training sessions were conducted by knowledgeable parties, and in-house practice runs were used to gain expertise and proficiency prior to initiating the research. The quality control checks that were performed in this project are described in the following sections.
4.2.1 Integrity of Samples and Supplies
Samples were maintained to ensure their integrity. Samples were stored away from biological standards or other samples that could cross-contaminate them. While the size and shape of the concrete coupons or ceramic tiles varied, the size of the inoculation and sampling area did not.
Supplies and consumables were acquired from reputable sources and were National Institute of Standards and Technology (NIST)-traceable when possible. Upon receipt and prior to use, they were examined for evidence of tampering or damage. Supplies and consumables that showed evidence of tampering or damage were rejected and not used. All examinations were documented and supplies were appropriately labeled. Project personnel checked supplies and consumables prior to use to verify that they meet specified task quality objectives and did not exceed expiration dates. All pipettes were calibrated yearly by an outside contractor (Calibrate, Inc., Carrboro NC), incubation temperature was monitored using NIST-traceable thermometers, and balances were calibrated yearly by the EPA Metrology Laboratory.
4.2.2 Biocontaminant Laboratory Checks
Quantitative standards do not exist for biological agents. Quantitative determinations of organisms in this investigation did not involve the use of analytical measurement devices. Instead, CFU were enumerated manually and recorded. If the CFU count for bacterial growth did not fall within the target range, the sample was either filtered or re-plated. For each set of results (per test), a second count was performed on 25 percent of the plates within the quantification range (plates with 30 - 300 CFU). All second counts were found to be within 10 percent of the original count.
29

4.3 QA/QC Sample Acceptance Criteria
Critical QC checks are shown in Table 4-2. The acceptance criteria were set at the most stringent level that could be achieved routinely. Positive controls and procedural blanks were included along with the test samples in the experiments so that well-controlled quantitative values were obtained. Background checks were also included as part of the standard protocol. Replicate coupons were included for each set of test conditions. The number of replicates was limited by the availability of the subway building materials. Further QC samples were collected and analyzed to check the ability of the Biocontaminant Laboratory to culture the test organism, as well as to demonstrate that materials used in this effort did not themselves contain spores. The checks included:
• Negative control coupons: sterile coupons that underwent the same sampling process;
• Field blanks: transfer of sterile wipes from the sample tube to an empty conical tube at thedecontamination location;
• Laboratory blank coupons: sterile coupons not removed from the Biocontaminant Laboratory;
• Laboratory material coupons: includes all materials, individually, used by the BiocontaminantLaboratory in sample analysis; and
• Stainless steel positive control coupons: coupons inoculated but not fumigated.
Additional QA/QC objectives are shown in Tables 4-2 and 4.3. These QA/QC objectives provide assurances against cross contamination and other biases in the microbiological samples.
Table 4-2. QA/QC Sample Acceptance Criteria Sample Type Purpose Acceptance Criteria Corrective Actions Frequency Negative Control Coupons
Determine extent of cross-contamination
No detectable spores Values on test coupons of the same order of magnitude will be considered to have resulted from cross-contamination
1 per sample type
Field Blank Coupons Verify the process of moving coupons does not introduce contamination
No detectable spores Determine source of contamination and remove
1 per test
Laboratory Blank Coupons
Verify the sterility of coupons following autoclaving
No detectable spores Determine source of contamination and remove
3 per test
Laboratory Material Coupons
Verify the sterility of materials used to analyze viable spore count
No detectable spores Determine source of contamination and remove
3 per material per test
Blank Tryptic Soy Agar Sterility Control (plate incubated, but not inoculated)
Controls for sterility of plates
No observed growth following incubation
All plates are incubated prior to use, so any contaminated plates will be discarded
Each plate
30

Sample Type Purpose Acceptance Criteria Corrective Actions Frequency Positive Control Coupons
Used to determine the extent of inoculation on the coupons
1 x 10⁷ CFU ±0.5 log Outside target range: discuss potential impact on results and correct the loading procedure for next test and repeat depending on decided impact
3 per coupon type per test
Fumigation Extraction Blank Samples
Validated baseline of extractive techniques
Non-detect Obtain new reagents 1 per test
Inoculation Control Coupons
Used to determine drift in the MDI
The CFU recovered from the first set of positive controls must be within 0.5 log of the second set of positive controls
Reject results and repeat test
3 per inoculation
Replicate Plating of Diluted Microbiological Samples
Used to determine variability in CFU counts
The reportable CFU of triplicate plates must be within 100%. Reportable CFU are between 30 and 300 CFU per plate
Replate sample Each sample
Table 4-3. Other QA/QC Acceptance Criteria Sample Type Purpose Acceptance Criteria Corrective Actions Frequency mSM 4500-ClO2-B Wet Chemistry
Validate ClO2 concentration measurements
15% of photometric reading
Repeat or change ClO2 generator cartridges if necessary
1 per hour
Post-test Calibration of RH Sensors (Vaisala, Helsinki, Finland)
Used to validate sensor operation
The post-test calibration check readings must be within 5% of target reading
Reject results. Repeat test as deemed appropriate
1 per test
4.3.1 QA/QC Test Results Validation
Plated volume critical measurement goals were met. All pipettes are calibrated yearly.
The QA/QC control test results for the whole sampling campaign are shown in Table 4-4. All field blanks and inoculum blanks were found to be non-detects (NDs).
Procedural blanks resulted in non-detectable viable spores under fumigation conditions that led to higher (>4) LR conditions. Recovered spore amounts under less favorable fumigation conditions (e.g., Test 4.4, 4.5, and 4.6) were substantial (1E1 - 1E4 CFU/sample) which can be explained by the cross contamination caused by the resuspension of spores in the fumigation chamber during fumigation without deactivation. Under these conditions, recovered procedural blank amounts were still 1-2 orders of magnitude below the amounts recovered from test coupons. Negative control coupons had detectable spore amounts (3E0 – 3E3 CFU range) which can be attributed to the cross contamination of these coupons during the inoculation process. The negative control amounts are insignificant compared to the inoculated amount of spores (2E6-1E7 CFU range) on test and positive control coupons. The overall impact of the presence of viable spores on the procedural blanks or negative controls is considered to be minimal.
31

Table 4-4. Procedural Blanks and Negative Control QA/QC Results
Procedural Blank Recovery (CFU) Negative Control Recovery (CFU)
Test ID Material Material
Grim
ed C
oncr
ete
Was
hed
Conc
rete
Grim
ed P
aint
ed S
teel
Was
hed
Pain
ted
Stee
l
Grim
ed T
ile
Was
hed
Tile
Gre
asy
Stub
Grim
ed C
oncr
ete
Was
hed
Conc
rete
Grim
ed P
aint
ed S
teel
Was
hed
Pain
ted
Stee
l
Grim
ed T
ile
Was
hed
Tile
Gre
asy
Stub
4.1 ND ND ND ND ND ND ND 640 17 17 79 10 45 NI
4.2B NI 3 ND ND 22 ND - NI 860 1760 125 32 135 NI
4.3 ND ND ND ND ND ND ND 42 42 104 13 785 12 NI
4.4 11 ND 51 56 ND 8533 ND 413 17 8 2567 12 13 NI
4.5 1880 6183 690 1350 101 9000 9 43 97 31 42 3 32 NI
4.6 10E3 3 30 252 570 1 4820 148 42 223 123 607 63 NI
4.7 ND 105 ND - ND - - 1320 1110 740 - 540 - -
4.8 ND ND ND - ND - - 1220 3383 12 - 16 - -
4.9 ND ND ND - ND - - 22 1500 560 - 25 - -
ND: non detect (filter plating result of blank/control) NI: Not included --: Not part of test matrix
The ClO2 photometer calibrations were checked prior to each test and were within the factory specifications during each fumigation. The primary ClO2 measurements were the modified SM 4500-ClO2B extractive samples. The accuracy and precision of the titration equipment were checked using a single-point NIST-traceable standard solution.
4.4 Calibration of Sampling/Monitoring Equipment
Miscellaneous operating procedures for the maintenance and calibration of all laboratory and NHSRC Biocontaminant Laboratory equipment were followed. All equipment was verified as either being certified calibrated or having the calibration validated by EPA’s Metrology Laboratory at the time of use. The standard laboratory equipment such as balances, pH meters, biological safety cabinets and incubators were routinely monitored for proper performance. Calibration of instruments was conducted at the frequency shown in Tables 4-4 and 4-5. Any deficiencies were noted. The instrument was adjusted to meet calibration tolerances and recalibrated within 24 h. If tolerances were not met after recalibration, additional corrective action was taken, possibly including recalibration or/and replacement of the equipment. All titrants have a certification of analysis with NIST-traceable concentration values.
32

Table 4-5. Sampling and Monitoring Equipment Calibration Requirements Equipment Calibration/Certification Expected Tolerance Temperature Sensor Compare to independent NIST
thermocouple annually ± 2% full scale
RH Sensor Compare to three week
calibration salts once a ± 5%
Meter box Volume of gas is compared to NIST-traceable dry gas meter on an annual basis
± 2%
Stopwatch/Clock Compared against NIST Official time at http://www.time.gov once every 30 days
± 1 min/30 days
Buret Annual gravimetric verification of volume ± 1%
Table 4-6. Analysis Equipment Calibration Frequency Equipment Calibration Method Calibration Frequency Expected Tolerance Scale Compared to Class S weights Before each use ± 0.01% of target Pipettes Gravimetric Annually ± 1% target value Burets Gravimetric Annually ± 1% target value Pressure Manometer Compared to NIST-traceable Heiss gauge Annually ± 3% of reading Incubator thermometer Compared to NIST-traceable thermometer Annually ± 0.2 ºC
4.5 Data Quality Audits
This project was assigned QA Category III and did not require technical systems or performance evaluation audits. Data quality problems, if encountered, usually required immediate, on-the-spot corrective action. The nature of the problem and corrective steps taken were noted in the project notebook of record.
4.6 Data Reduction
Data reduction for all tests performed included the total CFU recovered from each replicate coupon, the average recovered CFU and standard deviation for each group of coupons, and LRs. For each combination of test coupon material and sample type, the groups of coupons included the following:
• Positive control coupons (replicates, average, standard deviation)
• Test coupons (replicates, average, standard deviation)
• Procedural blank coupons.
Efficacy was defined as the extent (expressed as LR) to which the number of viable spores extracted from the coupons after the fumigation was reduced in comparison to viable spores extracted from positive control coupons (not fumigated). When no viable spores were detected, the detection limit of the sample was used, and the efficacy was reported as greater than or equal to the value calculated by Eqn. 2-1. The detection limit of a sample depended on the analysis method and could therefore vary. The detection limit of a plate was assigned a value of 1 CFU, but the fraction of the sample plated varied. For instance, the
33
detection limit of a 0.1 mL plating of a 20 mL sample suspension was 200 CFU (1 CFU/0.1 mL * 20 mL), but if all 20 mL of the sample were filter-plated, the detection limit was 1 CFU.
4.7 Data Reporting
Data generated included notes recorded in a laboratory notebook (e.g., gravimetric records and assessment of decontamination solutions) and electronic files created by digital camera. Written records included observations, numerical data produced by any instrument that was not digitally recorded, and all variables specific to any experiment. Photographs were taken of each procedure and protocol conducted in general and of any unusual result. Digital files were maintained in their raw form on each of two computers in the laboratory, on desk computers used by test personnel, and on the EPA local network for backup. Processed data files were kept on desk computers and backed up on the EPA network on a biweekly basis. Two laboratory notebooks at a time were maintained for this project, one in the laboratory for notes related to the inoculation and sampling procedures, and another in the Biocontaminant Laboratory for all notes related to biological sample analysis and coupon sterilization documentation.
34

5 SUMMARY AND RECOMMENDATIONS
The primary objective of this investigation was to determine the effect of real-world (subway) environmental conditions and the presence of dirt and grime on the efficacy of ClO2 to inactivate Bacillus globigii (Bg) spores, a surrogate of Bacillus anthracis (B. anthracis) spores inoculated onto relevant subway materials (concrete, ceramic tile, and painted steel).
Two sampling techniques were evaluated to determine the most suitable sampling technique from subway type materials. The measured recovery of the sponge-stick and the PRB wipe surface sampling methods from inoculated grimed subway materials (tile and painted steel) were evaluated in this study. The recovery from wetted PRB wipes was found to be similar or superior to recovery from sponge-sticks. Since the laboratory methods for processing wetted PRB wipes are less intensive than processing sponge-sticks, wetted PRB wipes were used to sample all building material surfaces in this study.
The results of this evaluation suggest that not all ClO2 fumigation conditions may result in a 6 LR decontamination efficacy for subway materials. A ≥ 6 log inactivation of viable spores by a decontaminant is a requirement for product registration as a sporicidal product/technology against spores of B. anthracis Ames. A lower temperature of 10-12 °C and/or a reduction in RH to 50% at 24 °C were found to reduce the effectiveness of the ClO2 fumigation dramatically. Losses in LR were not recovered by doubling of the fumigation time (up to 24 h). At the lower temperature, the kinetics of the spore inactivation seem to slow down, which suggests that, although the target RH might be more easily reached in a subway system, these results indicate ClO2 fumigation might not be the best choice for subway system areas that are not heated to at least 24 °C or have lower RH. The impact of the type of subway materials on the ClO2 decontamination efficacy seems to be not very significant, which can be explained by the presence of the dirt and grime on the surface which essentially reduces the impact of the actual underlying material on efficacy. Fumigation of a cleaned grimed surface (pre-inoculation) was found to be only marginally more efficacious than fumigation of a grimed surface.
A six (6) log reduction in decontamination efficacy can be achieved for subway building materials if the decontamination conditions of temperature greater than 24°C with RH at 75% or higher and a required ClO2 concentration/exposure time of 3000 ppmv for 3 h or 200 ppmv for 12 h are achieved.
35

6 REFERENCES
1. U.S. EPA. Bio-response Operational Testing and Evaluation (BOTE) Project. U.S. EnvironmentalProtection Agency, Washington, DC, EPA/600/R-13/168, 2013.
2. U.S. EPA. Decontamination of a Mock Office Using Chlorine Dioxide Gas. U.S. EnvironmentalProtection Agency, Washington, DC, EPA/600/R-14/208, 2014.
3. U.S. EPA. Interactions of ClO2 and H2O2 Fumigants with Dirt and Grime on Subway Concrete .U.S. Environmental Protection Agency, Washington, DC, EPA/600/R-14/226, 2014.
4. Lee, S. D.; Ryan, S. P.; Snyder, E. G., Development of an aerosol surface inoculation method forBacillus spores. Applied and Environmental Microbiology 2011, 77 (5), 1638-1645.
5. Standard Method 4500- ClO2 Method B. Iodometric Method, in: A.D. Eaton, L.S. Clesceri, A.E.Greenburg, M.A.H. Franson (Eds.), Standard Methods for the Examination of Water and Wastewater,Nineteenth ed., American Public Health Association, Washington, DC, 1995.
6. Busher, A. Noble-Wang, J.; Rose L., Surface sampling, in Sampling for Biological Agents in theEnvironment. Emanuel, P.; Roos, J.W.; Niyogi, K., Eds. ASM Press: Washington, DC, 2008; p 95-131.
7. Brown, G. S.; Betty, R. G.; Brockmann, J. E.; Lucero, D. A.; Souza, C. A.; Walsh, K. S.; Boucher,R. M.; Tezak, M.; Wilson, M. C.; Rudolph, T., Evaluation of a wipe surface sample method for collection ofBacillus spores from nonporous surfaces. Applied and Environmental Microbiology 2007, 73 (3), 706-710.
8. Rose, L. J.; Hodges, L.; O'Connell, H.; Noble-Wang, J., National validation study of a cellulosesponge wipe-processing method for use after sampling Bacillus anthracis spores from surfaces. Appliedand Environmental Microbiology 2011, 77 (23), 8355-8359.
9. Calfee, M. W.; Ryan, S.P.; Wood, J.P.; Mickelsen, L.; Kempter, C.; Miller, L.; Colby, M.; Touati,A.; Clayton, M.; Griffin-Gatchalian, N.; McDonald, S.; Delafield, R. Laboratory evaluation of large‐scaledecontamination approaches. Journal of Applied Microbiology 2012 112 (5), 874-882.
10. Tufts, J. A. M.; Meyer, K. M.; Calfee, M. W.; Lee, S. D. Composite Sampling of a Bacillusanthracis Surrogate with Cellulose Sponge Surface Samplers from a Nonporous Surface. PLoS ONE2114 9 (12): e114082.
11. Rastogi, V. K.; Ryan, S. P.; Wallace, L.; Smith, L. S.; Shah, S. S.; Martin, G.B. Systematicevaluation of the efficacy of chlorine dioxide in decontamination of building interior surfaces contaminatedwith anthrax spores. Applied and Environmental Microbiology 2010, 76 (10), 3343–3351.
12. Relative humidity to absolute humidity calculator, http://planetcalc.com/2167 Last accessedFebruary 11, 2016
36

Office of Research and Development (8101R) Washington, DC 20460
Official Business Penalty for Private Use $300
PRESORTED STANDARDPOSTAGE & FEES PAID
EPAPERMIT NO. G-35