
EPA WaterSense at Work€¦ · able design that maximizes energy efficiency, ... This guidebook was...
308
WaterSense at Work Best Management Practices for Commercial and Institutional Facilities
Transcript of EPA WaterSense at Work€¦ · able design that maximizes energy efficiency, ... This guidebook was...

WaterSense at Work
Best Management Practices for Commercial and Institutional Facilities

On the Cover: Green Building at the U.S. Environmental Protection Agency’s
Region 8 Headquarters
The U.S. Environmental Protection Agency’s (EPA’s) Region 8 Headquarters building in Denver, Colorado, is LEED® Gold certified and has earned the ENERGY STAR® label. In addition to a sustain-able design that maximizes energy efficiency, improves indoor air quality, and incorporates low-impact materials, EPA’s Region 8 Headquarters saves water by using high-efficiency sanitary fix-tures, water-efficient mechanical systems design, and water-smart landscape design using sustain-able and native species. To learn more, visit www.epa.gov/region8/building.

October 2012 i
WaterSense at Work: Best Management Practices for Commercial and Institutional Facilities
Office of Water U.S. Environmental Protection Agency October 2012
EPA 832-F-12-034
This guidebook was developed by WaterSense,® a partnership program sponsored by EPA that seeks to protect the future of our nation’s water supply by offering people a simple way to use less water with water-efficient products, new homes, and services. The work was supported under contract EP-C-09-008 with Eastern Research Group, Inc.

ii October 2012
Disclaimer This document was prepared as an account of work sponsored by the United States Government. While this document is believed to contain correct information, neither the United States Government nor any agency thereof, nor any of their employees, makes any warranty, express or implied, or assumes any legal responsibility for the accuracy, completeness, or usefulness of any information, apparatus, product, or pro-cess disclosed, or represents that its use would not infringe privately owned rights. EPA hereby disclaims any liability for damages arising from the use of the document, includ-ing, without limitation, direct, indirect or consequential damages including personal injury, property loss, loss of revenue, loss of profit, loss of opportunity, or other loss. Reference herein to any specific commercial product, process, or service by its trade name, trademark, manufacturer, or otherwise does not necessarily constitute nor imply its endorsement, recommendation, or favoring by the United States Government nor any agency thereof. The views and opinions of authors expressed herein do not neces-sarily state or reflect those of the United States Government nor any agency thereof.

October 2012 iii
Table of ContentsGetting Started1.1 Introduction ............................................................................................................................ 1-21.2 Water Management Planning .......................................................................................... 1-7 Step 1. Making a Commitment ........................................................................................ 1-7 Step 2. Assessing Facility Water Use ............................................................................... 1-8 Step 3. Setting and Communicating Goals ...............................................................1-16 Step 4. Creating an Action Plan .....................................................................................1-17 Step 5. Implementing the Action Plan ........................................................................1-24 Step 6. Evaluating Progress .............................................................................................1-24 Step 7. Recognizing Achievement ................................................................................1-25
Water Use Monitoring and Education2.1 Introduction to Water Use Monitoring and Education ........................................... 2-22.2 Metering and Submetering .............................................................................................. 2-42.3 Leak Detection and Repair ................................................................................................ 2-92.4 User Education and Facility Outreach .........................................................................2-132.5 Codes, Standards, and Voluntary Programs for Water Efficiency ......................2-16
Sanitary Fixtures and Equipment3.1 Introduction to Sanitary Fixtures and Equipment .................................................... 3-23.2 Toilets ........................................................................................................................................ 3-43.3 Urinals .....................................................................................................................................3-113.4 Faucets ....................................................................................................................................3-163.5 Showerheads ........................................................................................................................3-233.6 Laundry Equipment ...........................................................................................................3-27
Commercial Kitchen Equipment4.1 Introduction to Commercial Kitchen Equipment ..................................................... 4-24.2 Commercial Ice Machines .................................................................................................. 4-44.3 Combination Ovens ...........................................................................................................4-114.4 Steam Cookers .....................................................................................................................4-154.5 Steam Kettles .......................................................................................................................4-194.6 Wok Stoves ............................................................................................................................4-234.7 Dipper Wells ..........................................................................................................................4-304.8 Pre-Rinse Spray Valves ......................................................................................................4-364.9 Food Disposals .....................................................................................................................4-404.10 Commercial Dishwashers ................................................................................................4-474.11 Wash-Down Sprayers ........................................................................................................4-52

iv October 2012
Outdoor Water Use5.1 Introduction to Outdoor Water Use ............................................................................... 5-25.2 Landscaping ........................................................................................................................... 5-45.3 Irrigation ................................................................................................................................5-115.4 Commercial Pool and Spa Equipment ........................................................................5-205.5 Vehicle Washing ..................................................................................................................5-29
Mechanical Systems6.1 Introduction to Mechanical Systems ............................................................................. 6-26.2 Single-Pass Cooling ............................................................................................................. 6-46.3 Cooling Towers ...................................................................................................................... 6-86.4 Chilled Water Systems .......................................................................................................6-186.5 Boiler and Steam Systems ...............................................................................................6-25
Laboratory and Medical Equipment7.1 Introduction to Laboratory and Medical Equipment .............................................. 7-27.2 Water Purification ................................................................................................................. 7-47.3 Vacuum Pumps ....................................................................................................................7-107.4 Steam Sterilizers ..................................................................................................................7-167.5 Glassware Washers .............................................................................................................7-247.6 Fume Hood Filtration and Wash-Down Systems .....................................................7-277.7 Vivarium Washing and Watering Systems .................................................................7-337.8 Photographic and X-Ray Equipment ...........................................................................7-38
Onsite Alternative Water Sources ..................................................... 8-1
Resources........................................................................................... 9-1
Appendix A: Case Studies Demonstrating Best Management Practices in Action .............................................. A-1A.1 Introduction to Case Studies ............................................................................................A-2A.2 Federal Agency Implements Comprehensive Water Management Strategy .......A-3A.3 Hotel Installs Water-Efficient Sanitary Fixtures ..........................................................A-6A.4 Restaurants Install Water-Efficient Commercial Kitchen Equipment .................A-9A.5 Office Complex Reduces Outdoor Water Use .......................................................... A-13A.6 Laboratory Eliminates Single-Pass Cooling ............................................................. A-15A.7 Hospital Installs Water-Efficient Laboratory and Medical Equipment ........... A-18A.8 University Makes the Most of Onsite Alternative Water Sources ..................... A-22
Appendix B: Sample Worksheets for Water Management Planning ...................................................................... B-1Table B-1. Building Water Survey Worksheet ....................................................................... B-3Table B-2. List of Water Meters Worksheet ............................................................................ B-4Table B-3. Water Consumption History Worksheet ........................................................... B-5Table B-4. Existing Plumbing Equipment Worksheet ....................................................... B-6Table B-5. Water Use Inventory Worksheet .......................................................................... B-7

Table of Contents
Getting Started
1.1 Introduction ............................................................ 1-2
1.2 Water Management Planning ........................... 1-7
Step 1. Making a Commitment ........................ 1-7
Step 2. Assessing Facility Water Use ............... 1-8
Step 3. Setting and Communicating Goals ........................................................................1-16
Step 4. Creating an Action Plan ......................1-17
Step 5. Implementing the Action Plan ........1-24
Step 6. Evaluating Progress .............................1-24
Step 7. Recognizing Achievement ................1-25

xxx
1-2 WaterSense at Work: Best Management Practices for Commercial and Institutional Facilities
1.1 Introduction
PurposeWaterSense,® a voluntary partnership program sponsored by the U.S. Environmental Protection Agency (EPA), seeks to protect the future of our nation’s water supply. By transforming the market for water-efficient products, services, and practices, Water-Sense is helping to address the increasing demand on the nation’s water supplies and reduce the strain on municipal water infrastructure across the country. WaterSense labeled products are independently certified to use at least 20 percent less water and perform as well or better than standard models. In addition, WaterSense labeled new homes incorporate water-efficient products and designs, and WaterSense labeled certification programs focus on water-efficient practices by professionals.
WaterSense has developed WaterSense at Work, a compilation of water-efficiency best management practices, to help commercial and institutional facility owners and man-agers understand and better manage their water use. WaterSense at Work is designed to provide guidance to help establish an effective facility water management pro-gram and identify projects and practices that can reduce facility water use.
In today’s economic and corporate environ-ment, there is a strong business case to be made for undertaking activities to reduce water use, which in turn can reduce energy and other operating costs. By implementing
water-efficiency best management practices, commercial and institutional facility owners and managers can:
• Achieve cost savings. Improving water efficiency can lower variable costs associ-ated with the operation and maintenance of equipment, as well as the energy embedded in the treatment, storage, heating, and movement of water through-out the facility. Organizations can often reduce associated costs of treatment chemicals, detergents, and other supplies when undertaking water-efficiency improvements. When considered together, the cost savings from water, wastewa-ter, energy, and supply bills create a greater return on investment and a shorter payback period for an improvement project, while reducing a facility’s impact on local water supplies.
• Increase competitive advantage. Demand for green buildings and sustainable products is increasing as consumers become more aware of the environmental impacts of water and energy use. By promoting tangible improvements in a facil-ity’s environmental performance, organizations can reinforce their image as a sustainable brand while reducing their environmental impact on the community.

October 2012 1-3
1.1 Introduction
1 Estimated from analyzing data in: Solley, Wayne B., et al. 1998. Estimated Use of Water in the United States in 1995. U.S. Geological Survey Circular 1200. water.usgs.gov/watuse/pdf1995/html/.
2 Created from analyzing data in: Schultz Communications. July 1999. A Water Conservation Guide for Commercial, Institutional and Industrial Water Users. Prepared for the New Mexico Office of the State Engineer. www.ose.state.nm.us/wucp_ici.html; Dziegielewski, Benedykt, et al. American Water Works Association (AWWA) and AWWA Research Foundation. 2000. Commercial and Institutional End Uses of Water; East Bay Municipal Utility District. 2008. WaterSmart Guidebook: A Water-Use Efficiency Plan Review Guide for New Businesses. www.ebmud.com/for-customers/conservation-rebates-and-services/commercial/watersmart-guidebook; AWWA. Helping Businesses Manage Water Use—A Guide for Water Utilities.
Practicing water efficiency not only enhances the public perception of the organ-ization, but can also help differentiate the organization among its competitors.
• Reduce risk. Water-efficient facilities can be less vulnerable to fluctuations in water supply and pricing by reducing their dependence on limited local water resources. This not only reduces risk, but also the burden on associated water and wastewater utility infrastructure, ensuring a more sustainable future water supply for the community.
• Demonstrate leadership. Water-efficient organizations can clearly demonstrate their commitment to the community and environmental leadership. By imple-menting projects that result in real water savings, an organization can share both quantitative and qualitative results. Water efficiency also contributes to meeting corporate sustainability goals and demonstrates an organization’s contribution to reducing demand on natural resources.
• Access opportunities in the green building marketplace. The principles of water efficiency are becoming ingrained in the commercial real estate market as an integral part of green building and sustainable event planning. Implement-ing specific measures that make a facility more water- and energy-efficient helps an organization earn recognition from local green building programs, EPA and the U.S. Energy Department’s (DOE’s) ENERGY STAR,® or the U.S. Green Building Council’s LEED® rating system. At the same time, many national, state, and local organizations have instituted environmental requirements for both their own facilities and those where meetings and conferences are held. Hotels, restaurants, and other facilities can strengthen their ability to compete in this growing mar-ket niche by undertaking specific water- and energy-efficiency measures.
Reducing facility water use not only makes sense at the facility level, but it also helps communities to delay costly infrastructure upgrades, while preserving our limited water supplies for future generations. WaterSense at Work is designed to help facility owners and managers do their part to reduce water demand and achieve organiza-tional goals in the process.
Water Use in the Commercial and Institutional Sector
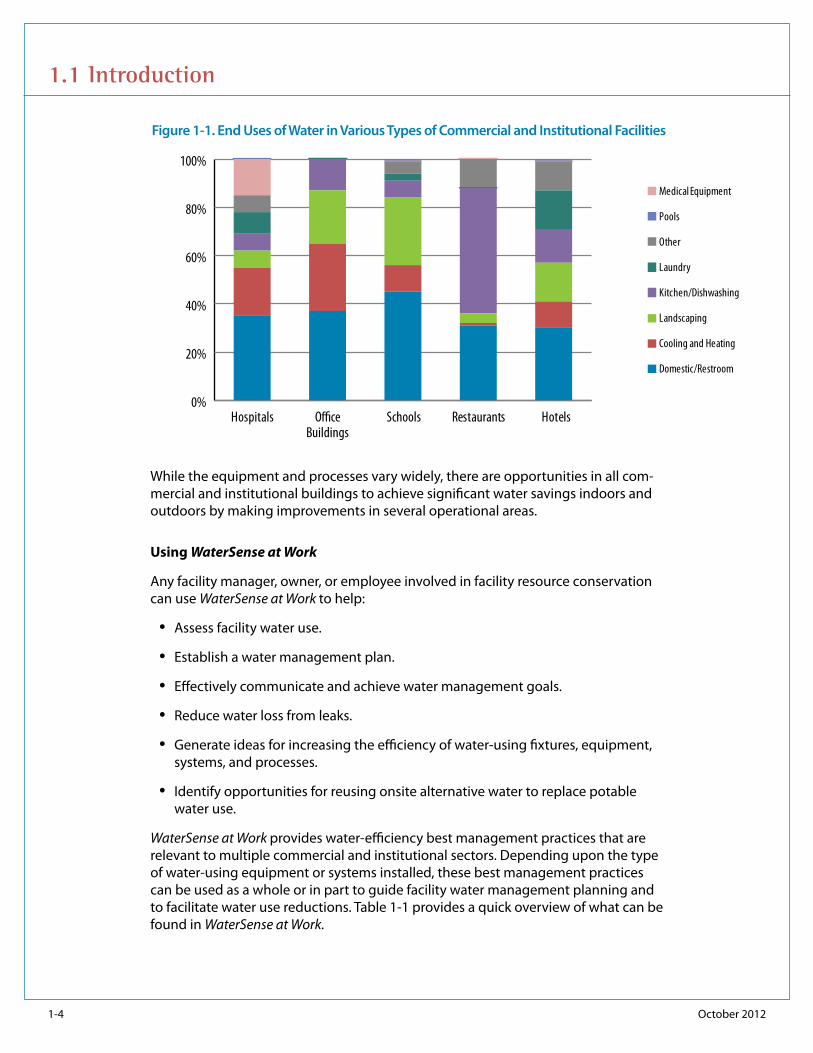
The commercial and institutional sector is the second largest consumer of publicly supplied water in the United States, accounting for 17 percent of the withdrawals from public water supplies.1 This sector includes a variety of facility types, such as hotels, restaurants, office buildings, schools, hospitals, laboratories, and government and military institutions. Each facility type has different water use patterns depend-ing upon its function and use. Figure 1-1 shows how water is used in several types of commercial and institutional facilities.2
1-4 October 2012
1.1 Introduction
Figure 1-1. End Uses of Water in Various Types of Commercial and Institutional Facilities
While the equipment and processes vary widely, there are opportunities in all com-mercial and institutional buildings to achieve significant water savings indoors and outdoors by making improvements in several operational areas.
Using WaterSense at Work
Any facility manager, owner, or employee involved in facility resource conservation can use WaterSense at Work to help:
• Assess facility water use.
• Establish a water management plan.
• Effectively communicate and achieve water management goals.
• Reduce water loss from leaks.
• Generate ideas for increasing the efficiency of water-using fixtures, equipment, systems, and processes.
• Identify opportunities for reusing onsite alternative water to replace potable water use.
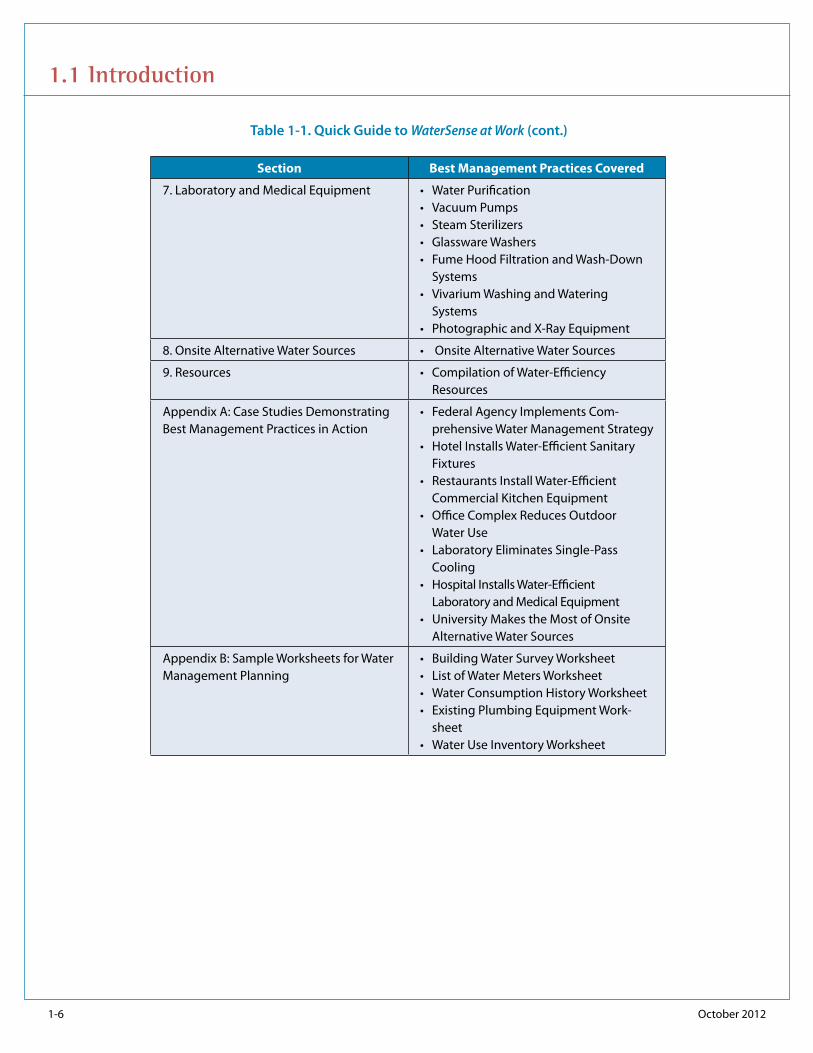
WaterSense at Work provides water-efficiency best management practices that are relevant to multiple commercial and institutional sectors. Depending upon the type of water-using equipment or systems installed, these best management practices can be used as a whole or in part to guide facility water management planning and to facilitate water use reductions. Table 1-1 provides a quick overview of what can be found in WaterSense at Work.
0%
20%
40%
60%
80%
100%
Medical Equipment
Pools
Other
Laundry
Kitchen/Dishwashing
Landscaping
Cooling and Heating
Domestic/Restroom

October 2012 1-5
1.1 Introduction
Facility owners and managers interested in better managing and reducing facility water use should review Sections 1 and 2. These sections provide overarching best management practices applicable to all facility types and outline actions that can be taken to ensure the success of any water management plan or water use reduction strategy. Sections 3 through 8 address opportunities associated with specific equip-ment and systems used at commercial and institutional facilities. Appendix A pre-sents case studies that illustrate how specific facilities have successfully implemented one or more of the best management practices described in WaterSense at Work. Appendix B provides sample worksheets to facilitate water management planning.
Table 1-1. Quick Guide to WaterSense at Work
Section Best Management Practices Covered
1. Getting Started • Water Management Planning
2. Water Use Monitoring and Education • Metering and Submetering• Leak Detection and Repair• User Education and Facility Outreach• Codes, Standards, and Voluntary
Programs for Water Efficiency
3. Sanitary Fixtures and Equipment • Toilets• Urinals• Faucets• Showerheads• Laundry Equipment
4. Commercial Kitchen Equipment • Commercial Ice Machines• Combination Ovens• Steam Cookers• Steam Kettles• Wok Stoves• Dipper Wells• Pre-Rinse Spray Valves• Food Disposals• Commercial Dishwashers• Wash-Down Sprayers
5. Outdoor Water Use • Landscaping• Irrigation• Commercial Pool and Spa Equipment• Vehicle Washing
6. Mechanical Systems • Single-Pass Cooling• Cooling Towers• Chilled Water Systems• Boiler and Steam Systems
(continued)
1-6 October 2012
1.1 Introduction
Section Best Management Practices Covered
7. Laboratory and Medical Equipment • Water Purification• Vacuum Pumps• Steam Sterilizers• Glassware Washers• Fume Hood Filtration and Wash-Down
Systems• Vivarium Washing and Watering
Systems• Photographic and X-Ray Equipment
8. Onsite Alternative Water Sources • Onsite Alternative Water Sources
9. Resources • Compilation of Water-Efficiency Resources
Appendix A: Case Studies Demonstrating Best Management Practices in Action
• Federal Agency Implements Com-prehensive Water Management Strategy
• Hotel Installs Water-Efficient Sanitary Fixtures
• Restaurants Install Water-Efficient Commercial Kitchen Equipment
• Office Complex Reduces Outdoor Water Use
• Laboratory Eliminates Single-Pass Cooling
• Hospital Installs Water-Efficient Laboratory and Medical Equipment
• University Makes the Most of Onsite Alternative Water Sources
Appendix B: Sample Worksheets for Water Management Planning
• Building Water Survey Worksheet• List of Water Meters Worksheet• Water Consumption History Worksheet• Existing Plumbing Equipment Work-
sheet• Water Use Inventory Worksheet
Table 1-1. Quick Guide to WaterSense at Work (cont.)

WaterSense at Work: Best Management Practices for Commercial and Institutional Facilities 1-7
3.2 Toilets
1.2 Water Management Planning
Overview Water management planning serves as the foundation for any successful water reduction effort. It is the first step a commercial or institutional facility owner or man-ager should take to achieve and sustain long-term water savings. Water management planning generally addresses water use reductions in four areas:3
• Reducing water losses (e.g., leaks).
• Increasing the water efficiency of fixtures, equip-ment, systems, and processes.
• Educating employees and occupants about water efficiency to encourage water-saving behaviors.
• Reusing onsite alternative water that would oth-erwise be discarded or discharged to the sewer (e.g., reusing treated gray water or rainwater to water landscape areas).
Effective water management planning is easily coupled with energy and waste man-agement. Water management follows the same framework used in the U.S. Environ-mental Protection Agency (EPA) and the U.S. Energy Department’s (DOE’s) ENERGY STAR® Guidelines for Energy Management,4 and consists of these seven basic steps:
• Step 1. Making a commitment • Step 2. Assessing facility water use • Step 3. Setting and communicating goals • Step 4. Creating an action plan • Step 5. Implementing the action plan • Step 6. Evaluating progress • Step 7. Recognizing achievement
Step 1. Making a CommitmentThe relative success of any water management program hinges on the organization’s long-term commitment to use water more efficiently. Commitment should come from all levels within an organization to ensure that appropriate water management goals are established and that continuous improvements are made. A champion is necessary to provide guidance, maintain momentum, and infuse energy into project implementation. A champion often advocates for the improvements and celebrates successes to support additional water-saving projects in the future.
3 Arizona Municipal Water Users Association (AMWUA) Regional Water Conservation Committee and Black and Veatch. August 2008. Facility Manager’s Guide to Water Management Version 2.7. Page 2. www.amwua.org/business.html.
4 U.S. Environmental Protection Agency (EPA) and U.S. Energy Department’s (DOE’s) ENERGY STAR. Guidelines for Energy Management Overview. www.energystar.gov/index.cfm?c=guidelines.guidelines_index.

1-8 October 2012
1.2 Water Management Planning
When an organization chooses to make a commitment to water efficiency, it should consider the following:
• Form a dedicated water management team of staff and other professionals, including a team leader (i.e., champion) that is responsible for overseeing and implementing the water management program. Team members should include people from all parts of the organization, including someone familiar with regulatory compliance and a facility or building manager with knowledge of the building’s infrastructure and major mechanical systems.
• Develop a water management policy that provides the structure for establishing and achieving water management goals.
• Incorporate water efficiency into long-term facility operation objectives and allocate the resources necessary to achieve goals.
• Integrate water management planning and goal tracking into company perfor-mance and sustainability reporting to elevate the importance of water efficiency and maintain accountability.
• Consider incorporating water-efficiency policies and goals into the facility’s environmental management system (EMS),5 if one has been developed, and track progress on the goals through the EMS process.
Step 2. Assessing Facility Water UseUnderstanding how water is used within a facility is critical for the water management planning process. A water assessment provides a comprehensive account of all known water uses at the facility. It allows the water management team to establish a baseline from which progress and program success can be measured. It also enables the water management team to set achievable goals and identify and prioritize specific projects based on the relative savings opportunities and project cost-effectiveness. Assessing facility water use incorporates the following steps:
• Gathering readily available information • Establishing a water use baseline • Inventorying major water-using fixtures, equipment, systems, and processes • Creating a facility water balance
Gathering Readily Available Information
The first steps in conducting an in-depth water assessment include: collecting any readily available information that can provide a basic understanding of building operational characteristics and general water use patterns; determining major uses of water within the facility; and estimating the costs of water use and sewer discharg-es. This information can be used to facilitate a more detailed investigation of facility water use and return on investment for any water-efficiency related projects.
5 EPA. Environmental Management Systems (EMS). www.epa.gov/EMS/.

October 2012 1-9
1.2 Water Management Planning
Developing an Understanding of Building Operational Characteristics
To better understand a facility’s water use patterns, consider the following:
• Survey operations and maintenance personnel to determine typical facility operating conditions (e.g., hours of operation, number of employees and visi-tors) and building characteristics (e.g., size, number of floors). Document this information using a tool such as the Building Water Survey Worksheet provided in Appendix B.
• Determine how many days the facility is operating per year and when fluctuations in water use may be expected. Facilities such as schools use less water during months when school is not in session; office buildings use less water on the week-ends; and hospitals operating 24 hours per day, 365 days per year see no daily or monthly variation.
Defining How Water Is Used at the Facility
Once the water management team has a clear understanding of the facility’s operational attributes and typical water use patterns, the next step is to determine specifically how water is used and currently tracked at the facility by doing the following:
• Identify all sources of water use at the facility. This can include: municipally sup-plied potable water, municipally supplied reclaimed water, wells or other freshwater sources, and onsite alternative water. For purposes of establishing a baseline, water sources can be more broadly grouped as potable, non-potable, onsite alternative, or purchased reclaimed water.
• Identify and record basic information for all metered sources of water, including bill-ing account numbers and meter numbers, size/type, and location. Also note whether meters are dedicated to specific end uses (e.g., irrigation, indoor water use). Docu-ment this information using a form such as the List of Water Meters Worksheet pro-vided in Appendix B. In addition, consider
Water Sources
Water sources can be defined as follows, based on the definitions developed by an interagency group working to implement requirements associated with a federal execu-tive order on sustainability:6
• Potable water: Water that is of sufficient quality for human consumption and that is obtained from public water systems or from natural freshwater sources, such as lakes, streams, and aquifers that are classified, permitted, and approved for human con-sumption.
• Non-potable water: Water that is obtained from natural freshwater sources that is not of sufficient quality for human consumption and has not been properly treated, permit-ted, or approved for human consumption.
• Onsite alternative water: Water that is not obtained from a surface water source, groundwater source, nor purchased reclaimed water from a third party. It can include rainwater or stormwater harvested on site, sump pump water harvesting, gray water, air-cooling condensate, reject water from water purification systems, water reclaimed on site, or water derived from other water reuse strategies.
• Purchased reclaimed water: Wastewater treatment plant effluent purchased from a third party that has been diverted for bene-ficial uses, such as irrigation, that substitute the use of an existing freshwater source.
6 DOE, Energy Efficiency & Renewable Energy (EERE), Federal Energy Management Program (FEMP). Federal Water Efficiency Requirements. www1.eere.energy.gov/femp/program/waterefficiency_requirements.html#eo13514.

1-10 October 2012
1.2 Water Management Planning
documenting and tracking water use information for each meter using ENERGY STAR’s Portfolio Manager.7
• Identify sources of unmetered water use.
• Work with operation and maintenance personnel to identify all submetered fixtures, equipment, systems, and processes. If available, obtain copies of internal log books or electronic records of submetered water use.
Gathering and Reviewing Water Bills to Understand Use and Cost
Collecting at least two years of water and sewer use data for the most recent timeframe possible for each identified source will help facility owners and managers better understand how much their facility’s water use costs. These data can include records or logs from source water meters and/or utility water bills. If bills are delivered to and paid off site, be sure to receive copies for track-ing and evaluating costs. In addition, consider the following:
• Water bills usually contain several separate charges, which vary by utility. Figure 1-2 provides an example bill with the charges specifically labeled. Water manag-ers should contact the utility to clarify any questions before using the informa-tion to evaluate potential water use reductions and any associated cost savings. With this information, the water management team can prioritize water-saving project opportunities.
• In addition to gathering data for metered sources, gather information necessary to estimate annual water use for any unmetered sources of water, such as well water or other source water brought on site. For example, water use may be esti-mated based on source water pumping rates or the consumption of the end uses supplied by the source.
7 EPA and DOE’s ENERGY STAR. Portfolio Manager Overview. www.energystar.gov/index.cfm?c=evaluate_performance.bus_portfoliomanager.
Water meter

October 2012 1-11
1.2 Water Management Planning
Figure 1-2. Example Information on a Water Bill
(a) Example shows an increasing block rate structure in which the utility charges a higher rate for increasing increments of water consumed. Some utilities charge a flat rate regardless of consumption volume, while other utilities charge a decreasing block rate structure. Water charges take into account total water consumption from all water meters.
(b) Charge is per amount of water discharged to sewer, which is often billed at a single rate, but could also have varying rates depending upon the quantity discharged. Oftentimes, this is based on the metered amount of water use (not a separate wastewater meter), which assumes that all water used was discharged to the sewer. In some cases, a facility can receive a sewer charge deduction for water uses that are known to not be sent to the sewer, such as cooling tower evaporation and irrigation water use. This deduction might appear on the bill.
(c) The utility could charge other fees, including fire service, stormwater, or other base or service charges. Stormwater fees can be based on the facility acreage. The base or service charge could depend upon the size of the water meter.
(d) Water usage is for the billing period for a specific water meter. In this example, water usage is reported in units of hundred cubic feet (ccf ). Other common units include gallons and liters. Note: A ccf is equivalent to approxi-mately 748 gallons.
(e) In some cases, the utility might provide historical water use information, which can help identify any large leaks or anomalies. It might also show seasonal trends in water use.
City Water and Wastewater Bill
Bill Date: October 1, 2012 Due Date: November 1, 2012 Account Number: 987654-32
Customer Name: Facility XYZ Service Address: 123 Anywhere Lane
Billing Detail:
Water Charges: (a)Tier 1 – (0-100) $2.70/ccf 100 $270.00Tier 2 – (101-250) $3.10/ccf 150 $465.00Tier 3 – (251-500) $3.73/ccf 250 $932.50Tier 4 – (500+) $4.13/ccf 50 $206.50
Total Water Charges 550 $1,874.00
Wastewater (Sewer) Charges: (b)Sewer Consumption $6.23/ccf 550 $3,426.50
Total Wastewater Charges 550 $3,426.50
Other Charges: (c) Fire Service $27.33Stormwater Charge $104.89/acre 2.1 $220.27Base/Service Charge $204.33
Total Other Charges $451.93
Total Charges $5,752.43
Summary of Charges:
Previous Balance $6,221.38Payment – Thank you $6,221.38Water, Wastewater, Other Charges $5,752.43Adjustments/Deposits $0.00
Total Charges $5,752.43
Meter ID: 12345 Current Meter Reading 33,127Prior Meter Reading 32,681Water Usage This Period (ccf ) (d) 446 Water Usage This Period Last Year 682
Meter ID: 67890 Current Meter Reading 982Prior Meter Reading 878Water Usage This Period (ccf ) 104Water Usage This Period Last Year 159
Consumption (e)
0
200
400
600
800
1000
1200
OctSepAugJulJunMayAprMarFebJanDecNovOct
Cons
umpt
ion
(ocf
)

1-12 October 2012
1.2 Water Management Planning
Establishing a Water Use Baseline
Establishing a water use baseline provides a reference point from which progress can be measured toward achieving water management goals. It is also an important component of developing a facility water balance, as discussed below. To develop a water use baseline, consider the following:
• Using the water bills gathered from one or two years prior, document the facil-ity’s water use history using a form such as the Water Consumption History Work-sheet provided in Appendix B. In addition, consider documenting and tracking water use history using ENERGY STAR’s Portfolio Manager.8
• Calculate the facility’s total annual water use for each metered and unmetered water source and total for all water sources combined. This total annual water figure will serve as the facility’s water use baseline.
• If long-term historical water use data are available, look for any anomalies that might suggest that the established water use baseline is not representative of typical facility water use (e.g., a large leak or a system or process change that occurred and temporarily skewed water use). If an anomaly is present, either adjust the baseline as appropriate or identify a different year that can serve as the baseline.
Inventorying Major Water-Using Fixtures, Equipment, Systems, and Processes
Once the baseline is established, it is critical to understand how specific fixtures, equipment, systems, and processes contribute to the overall facility water use. This process can help the water management team establish a baseline for individual end uses of water and identify potential reduction opportunities. It can also facilitate the establishment of water management planning goals. Three important components of a water assessment include: reviewing existing data, touring the facility to inven-tory water-using equipment, and verifying water use when possible.
Reviewing Existing Data
As a first step in the inventory process, plot one or two years of water use data from bills, log books, or other available sources to identify seasonal trends or abnormal-ities. Note any peaks, particularly in the summer months, which can indicate how much additional water is used for building cooling and irrigation systems. Use this analysis to estimate cooling and irrigation water use, if those sources are not subme-tered.
Touring the Facility to Inventory Water-Using Equipment and Meter Locations
Touring the facility to identify and inventory all of the major water-using fix-tures, equipment, systems, and processes is a key step in identifying how a facil-ity can improve its water efficiency. During the tour, note any obvious areas for
8 Ibid.

October 2012 1-13
1.2 Water Management Planning
improvement (e.g., leaking fixtures, single-pass cooling, outdated equipment). In addition, consider the following:
• Interview any personnel that manage water-using systems or equipment to understand how the systems and equipment are operated and maintained and to verify water use.
• Capture enough detailed information about all water-using fixtures, equipment, systems, and processes to determine how much water is consumed by each end use.
• Use survey forms or checklists, such as the Existing Plumbing Equipment and Water Use Inventory Worksheets, provided in Appendix B, to record fixture or equipment inventories, water use specifications (e.g., fixture flow rates), and water use patterns. This information can later be used to estimate water use.9 Be sure to record the hours of operation for each system or fixture to more accurate-ly calculate water use over time.
• During the tour, pay particular attention to drain lines plumbed to floor drains in building mechanical and utility spaces. Trace these drain lines back to the originating equipment to make sure they are included in the inventory.
• Identify locations of all meters and submeters if the locations were not deter-mined during the data-gathering phase. Read the meters and submeters, and check that the units and scale of the readings match water bills and internal log books.
Verifying Water Use When Possible
In some instances, it may be possible to measure or verify the water use from specific fixtures, equipment, systems, or processes. When verifying water use, consider the following:
• If discharge from water-using equipment or processes is evident during the tour, use a bucket to manually collect water use over a 15-, 30-, or 60-second time period. Measure the water use collected during that time period to determine flow rates.
• If possible, install temporary water meters or flow meters for larger water-using equipment or processes and briefly monitor water use. If the water use is fairly consistent throughout the day, water use could be measured for a period of a few minutes to estimate typical water use. If the water use fluctuates throughout the day, water use data should be collected over a 24-hour period to estimate an average water use. It is important to note the days of operation for each water use measured in order to estimate an annual water use.
Water assessor conducting a facility tour
9 AMWUA Regional Water Conservation Committee and Black and Veatch, op. cit., Page 18.

1-14 October 2012
1.2 Water Management Planning
Consult the documents referenced in the Additional Resources section at the end of this section for more specific information about conducting a water assessment.
Creating a Facility Water Balance
The facility water balance is an accounting of all water uses at the facility. It indi-cates the relative contribution of specific end uses to the facility’s overall water use (i.e., baseline) and is a powerful tool for identify-ing, evaluating, and prioritizing water-efficiency improvements. It also provides a mechanism to identify water that is unaccounted for, which might be attributed to leaks. See Tables 1-2 and 1-3 for an example of a laboratory facility water balance. It is important to develop a water balance for all types of source water that a facility might be using. The fol-lowing steps will help with creating a water balance:
• Sum the measured or estimated water use from all of the individual end uses for each water source. The sum of all end uses should roughly equal the facility’s total baseline water use.
• For metered or submetered fixtures, equipment, systems, and processes identified, calculate typi-cal annual water use from meter readings, water bills, or internal log books.
• For unmetered fixtures, equipment, systems, and processes identified, estimate the annual water use from flow rate measurements collected dur-ing the facility tour (if available) or use equip-ment specifications and patterns of use. Consult the relevant best management practices within WaterSense at Work to help develop water use estimates for specific fixtures or equipment. Most of these sections provide equations to help calculate water use of existing equipment and potential retrofits or replacements.
• In some cases, the use of onsite alternative water sources (see Section 8: Onsite Alternative Water Sources) can offset the use of potable water. Track these sources separately in the facility water balance to fully account for all sources of supplied water.
• If more than 10 percent of water use cannot be accounted for in the water bal-ance, there could be an unidentified source, a leak, or another issue warranting further investigation. Refer to Section 2.3: Leak Detection and Repair to help iden-tify and fix leaks.

October 2012 1-15
1.2 Water Management Planning
Table 1-2. Example Laboratory Facility Water Balance for Potable Water Source
Table 1-3. Example Laboratory Facility Water Balance for Air Handler Condensate Supply
Major Process Annual Water Use (gallons)
Percent of Total
Basis of Estimate
Total Annual Potable Water Supplied
4,900,000 100 Monthly Water Bills
Use 1: Sanitary (e.g., toilets, urinals, showerheads, faucets)
550,000 11 Engineering estimate of 750,000 gallons per year, subtracting onsite rainwater supply of 200,000 gallons/year
Use 2: Water-Cooled Ice Machine in Commercial Kitchen
300,000 6 Engineering estimate using manufacturer product litera-ture
Use 3: Pre-Rinse Spray Valve 50,000 1 Engineering estimate
Use 4: Steam Sterilizer (i.e., continuous discharge tempering water)
300,000 6 Instantaneous flow rate mea-surement
Use 5: Reverse Osmosis Supply
100,000 2 Metered
Use 6: Cooling Tower Make-Up Water
3,000,000 62 Metered
Use 7: Steam Boiler Make-Up Water
300,000 6 Metered
Sum of Accounted-for Potable Water Use
4,600,000 94 Summed from uses 1 through 7
Unaccounted-for Potable Water Use
300,000 6 Calculated by difference from total water use and accounted for water use (since this is less than 10 per-cent, the facility likely does not have a significant leak)
Major Process Annual Water Use (gallons)
Percent of Total
Basis of Estimate
Total Annual Air Handler Condensate Supplied
500,000 100 Metered
Use 1: Cooling Tower Make-Up Water
500,000 100 Metered (separately from city-supplied make-up water)
Sum of Accounted-for Air Handler Condensate Water Use
500,000 100 Use 1
Unaccounted-for Air Handler Condensate Water Use
0 0 Calculated by difference from total water use and accounted for water use

1-16 October 2012
1.2 Water Management Planning
Step 3. Setting and Communicating GoalsOnce the water management team understands how the facility is currently using water, the next step in the water management planning process is to gather building owners, facility management staff, senior management, and any other key decision makers to develop a list of water management goals and policy initiatives. Employ-ees from all different parts of the organization should be included in the goal-setting process to obtain a range of perspectives and promote a sense of ownership. The goals will drive the water management program and help fuel continuous improve-ment.
Once water management goals and policies have been developed, they must be communicated to the entire organization with the support of senior management or the building owners. Top-level support gives legitimacy to the initiative and informs employees that water and energy reductions are a priority. A feedback mechanism should be created to encourage input, suggestions, and reporting of problems.
Examples of water management goals might include:
• Reduce water use by a certain percentage per year for a period of years for a total target percent reduction, based upon the facility’s established water use baseline.
• Complete projects identified through the water management planning process within a set timeframe.
• Upgrade and focus on making whole areas water-efficient, such as mechanical systems, restrooms, or commercial kitchens.
• Establish a leak detection program to identify and correct any water use that is unaccounted for and could be attributed to leaks.
• Use onsite alternative water sources to replace a certain percentage of potable water use.
• Participate in a program to incentivize water use reductions (e.g., ENERGY STAR National Building Competition).10
• Obtain recognition for water reduction efforts from a federal, state, or local program (e.g., California Green Business Program, Wisconsin Green Tier Program, New Mexico Green Zia Leadership Program).11, 12, 13
• Achieve facility-level certification, such as the U.S. Green Building Council’s LEED® rating system or ENERGY STAR. State and local level certification programs can also provide benefits to commercial and institutional buildings. Sector-specific programs, such as the Michigan Green Lodging Program or the Green Restaurant Association program, are often tailored to promote significant reductions in envi-ronmental impacts.14, 15
10 EPA and DOE’s ENERGY STAR. The ENERGY STAR Challenge. www.energystar.gov/index.cfm?c=challenge.bus_challenge.11 California Green Business Program. www.greenbusinessca.org/. 12 Wisconsin Green Tier Program. dnr.wi.gov/topic/greentier/. 13 New Mexico Green Zia Leadership Program. www.nmenv.state.nm.us/P2/GreenZia/index.html.14 Green Lodging Michigan. www.michigan.gov/mdcd/0,1607,7-122-25676_25677_37026---,00.html.15 Green Restaurant Association. www.dinegreen.com/.

October 2012 1-17
1.2 Water Management Planning
When setting and communicating goals, consider the following:
• Ensure that goals are measureable and achievable. Remember that goals can always be strengthened if the organization achieves success sooner than initially anticipated.
• Establish realistic implementation timeframes and dates.
• Consider facility-specific conditions, such as long-term drought or water use restrictions, when establishing goals.
• Communicate goals to employees, building occupants, and other relevant stake-holders to gain support for future projects.
• Conduct a kickoff event to engage employees facility-wide.
Step 4. Creating an Action PlanUsing the water balance as a guide and considering any major areas for improve-ment noted during the water assessment, the water management team can create a detailed action plan. This includes solidifying water savings opportunities into spe-cific projects or operation and maintenance changes and prioritizing that project list. The action plan should determine which projects and practices can be implemented at the facility to achieve established water management goals. Creating an action plan consists of the following steps:
• Identifying projects and calculating cost and potential savings • Identifying financing sources • Calculating simple payback • Prioritizing projects • Documenting project priorities in a detailed action plan
Identifying Projects and Calculating Cost and Potential Savings
To develop an initial list of potential projects, consider the following:
• Utilize information gathered during the water assessment to determine which operation and maintenance changes and retrofit and replacement projects might be viable at the facility. Consider the largest uses of water identified from the water assessment and included in the facility water balance. These might be areas to target for the most significant water savings.
• Review the checklist in Table 1-4 to help identify potential projects and practices for inclusion in the action plan. The checklist can be filled out after the water assessment to help the facility owner or manager determine where to focus his or her efforts.
• Consider the impact of codes and standards, which may mandate or incentivize the use of certain fixtures or equipment (see Section 2.5: Codes, Standards, and Voluntary Programs for Water Efficiency).

1-18 October 2012
1.2 Water Management Planning
Once all opportunities have been evaluated, develop a final list of potential projects to prioritize, and estimate individual project costs and potential savings as follows:
• For each identified project or practice, calculate the total water, energy, and cost savings from the water and energy use reductions. Remember to include savings from other associated materials and disposal costs. Consult the relevant best management practices in Sections 2 through 8 of WaterSense at Work for assis-tance with some of these calculations.
• South Florida Water Management District’s Water Efficiency Self-Assessment Guide for Commercial and Institutional Building Facility Managers provides several equip-ment and process-specific water use and savings calculators, which can be useful for analyzing project-related water savings.16, 17
Identifying Financing Sources
As a first step, determine if the project can be funded through the facility’s operat-ing expenses or capital funding mechanisms. The following financing sources and options can also be considered:
• For larger, more expensive pieces of equipment, consider leasing the equipment from a technology vendor. ENERGY STAR provides information on a variety of lease types for energy-using equipment, many of which might apply to water-using equipment, such as commercial laundry systems or water purification systems.18
• Look for rebates and incentive programs offered by the local water utility to assist commercial and institutional building owners in making water-efficiency upgrades. Energy utilities also have rebates and incentives available to support projects that provide associated energy savings (e.g., laundry replacements, pre-rinse spray valve replacements). Rebate and incentive programs include free product distribution, partial rebates on purchases of water- and energy-efficient products, financial incentives based on total gallons of water saved from imple-menting large-scale projects, and billing offsets based on submetered water use that can account for water that is not being sent to the sewer (e.g., metering cooling tower make-up water and blowdown water to account for evaporation).
• Consider private financing, which can be obtained through performance con-tracts managed by water management service companies and energy service companies (ESCOs). The service company develops, finances, and installs proj-ects designed to improve efficiency and maintenance costs for facilities over a seven- to 10-year time period. Water management service companies and ESCOs generally act as project developers for a wide range of tasks and assume the technical and performance risk associated with the project. Water management service companies will develop and finance water-efficiency projects, and some ESCOs will also develop and fund stand-alone water-efficiency projects, although
16 South Florida Water Management District Water Supply Development Section. April 2012. Water Efficiency Self-Assessment Guide for Commercial and Institu-tional Building Facility Managers. www.sfwmd.gov/portal/page/portal/xweb%20-%20release%203%20water%20conservation/water%20conservation%20businesses#efficiency.
17 South Florida Water Management District. SFWMD Library & Multimedia. my.sfwmd.gov/portal/pls/portal/portal_apps.repository_lib_pkg.repository_browse?p_keywords=waterefficiency&p_thumbnails=no.
18 EPA and DOE’s ENERGY STAR. 2007. ENERGY STAR Building Upgrade Manual. Chapter 4: Financing. www.energystar.gov/index.cfm?c=business.bus_upgrade_manual.

October 2012 1-19
1.2 Water Management Planning
it is more common for ESCOs to bundle energy- and water-efficiency upgrades. The utility cost savings from the projects pay for the projects themselves, and any additional cost savings on top of the capital cost are shared between the service company and the facility.19,20
• Look for state-specific financing programs. Many states have made water-efficiency projects eligible for Property Assessed Clean Energy (PACE) financing programs that are carried out by local governments.21
Calculating Simple Payback
Simple payback, based on the project cost and anticipated annual water savings, can be an effective metric for prioritizing potential projects and practices for inclusion in the facility-specific action plan. In some cases, retrofitting or replacing equipment can also save energy, further reducing the simple payback period and increasing project cost-effectiveness. To calculate the simple payback for a specific project or practice, gather the following information and use Equation 1-1:
• Determine the total project cost that will come from the facility’s operating budget. If an alternative source of funding is available, such as a rebate to offset money spent from the facility’s budget, subtract it from the total project cost, as it will make the project more cost-effective. The project cost should be the total that will come directly from the facility’s budget only.
• Estimate the water savings from the project, as calculated using equations in Sec-tions 2 through 8 of WaterSense at Work.
• Identify the cost of water and wastewater. In some cases, the water utility deducts sewer charges for water that is not discharged to the sanitary sewer (e.g., water evaporated from the cooling tower or water applied to the landscape). In these cases, only consider the water cost when calculating simple payback of the project.
Equation 1-1. Simple Payback (years)
= Project Cost ÷ (Water Savings × Cost of Water and Wastewater)
Where:
• Project Cost (dollars) • Water Savings (gallons per year) • Cost of Water and Wastewater (dollars per gallon)
If the project has an associated energy impact, determine the energy source (e.g., gas or electricity) and utility cost. Calculate the energy impact and consider including it in the simple payback calculation.
19 Ibid. Page 6.20 National Association of Energy Service Companies. Resources—What is an ESCO? www.naesco.org/resources/esco.htm. 21 Database of State Incentives for Renewables & Efficiency. PACE Financing. dsireusa.org/solar/solarpolicyguide/?id=26.

1-20 October 2012
1.2 Water Management Planning
Table 1-4. Action Plan Water Use Reduction Opportunity Checklist
Water Use Reduction Opportunity/Project
Reference Section
Already Implemented
Evaluate/ Consider
Not Applicable
4 4 4
Water Use Monitoring and Education
Read water meters and record monthly water use. 2.2
Install submeters on any major water-using equipment, systems, or processes.
2.2
Implement a leak detection and repair program. 2.3
Educate facility staff, building occupants, employees, and visi-tors on water management program goals and initiatives.
2.4
Review, understand, and utilize information in codes, stan-dards, and voluntary programs for water efficiency.
2.5
Sanitary Fixtures and Equipment
Replace old tank-type toilets with WaterSense labeled models. 3.2
Replace old flushometer-valve toilets flushing greater than 1.6 gallons per flush (gpf ) with high-efficiency models, and install retrofit dual-flush conversion devices on 1.6 gpf flushometer valve toilets.
3.2
Replace old flushing urinals with WaterSense labeled models. 3.3
Replace lavatory faucets or faucet aerators (for private use) with WaterSense labeled models and install 0.5 gallons per minute (gpm) faucets or aerators in public-use settings.
3.4
Replace old showerheads with WaterSense labeled models. 3.5
Wash only full loads of laundry. 3.6
Replace old single-load clothes washers with ENERGY STAR qualified models or consider the water factor when pur-chasing larger or more industrial-sized laundry machines.
3.6
Commercial Kitchen Equipment
Replace old ice machines with ENERGY STAR qualified models. 4.2
Replace old steam cookers with ENERGY STAR qualified models.
4.4
Load steam cookers, steam kettles, and combination ovens to capacity.
4.3, 4.4, 4.5
Switch to connectionless combination ovens, steam cook-ers, and steam kettles.
4.3, 4.4, 4.5
Replace old water-cooled wok stoves with a waterless model.
4.6
Install in-line flow restrictor to reduce dipper well flow rate to 0.3 gpm.
4.7
(continued)

October 2012 1-21
1.2 Water Management Planning
Water Use Reduction Opportunity/Project
Reference Section
Already Implemented
Evaluate/ Consider
Not Applicable
4 4 4
Commercial Kitchen Equipment (cont.)
Replace existing pre-rinse spray valves with models that use 1.3 gpm or less.
4.8
Hand scrape food from dishes or install food strainers and compost food waste.
4.9
Load dishwashers to capacity. 4.10
Replace old dishwashers with ENERGY STAR qualified mod-els.
4.10
Use a broom or mop instead of a water broom or high-pressure hose to clean floors.
4.11
Outdoor Water Use
Plant native or drought-tolerant species. 5.2
Use mulch around trees and plant beds. 5.2
Install WaterSense labeled weather-based irrigation control-lers or consider irrigation controllers with rain or soil moisture sensors.
5.3
Use drip irrigation to water plant beds. 5.3
Ensure irrigation schedule is appropriate for climate, soil conditions, plant materials, grading, and season.
5.3
Have an irrigation professional certified by a WaterSense labeled program conduct an irrigation audit.
5.3
Check the position and location of spray heads to ensure that they are working properly and water is not being directed onto non-landscaped areas, such as sidewalks.
5.3
Use pool covers to control evaporation loss. 5.4
Maintain proper pool chemistry to limit pool cleaning and drainage events.
5.4
Use friction washing in vehicle washes and consider install-ing a water reclamation and reuse system.
5.5
Mechanical Systems
Eliminate single-pass cooling. 6.2
Professionally monitor cooling tower and boiler chemistry and maximize cycles of concentration.
6.2, 6.5
Install cooling tower meters and control systems to control chemical feed and blowdown based on conductivity.
6.3
(continued)
Table 1-4. Action Plan Water Use Reduction Opportunity Checklist (cont.)

1-22 October 2012
1.2 Water Management Planning
Water Use Reduction Opportunity/Project
Reference Section
Already Implemented
Evaluate/ Consider
Not Applicable
4 4 4
Mechanical Systems (cont.)
Inspect chillers and air handler coils regularly and remove dirt and scale buildup.
6.4
Regularly check and maintain boilers, steam lines, and steam traps.
6.5
Laboratory and Medical Equipment
Use water purification only when necessary. 7.2
Turn off pumps when not in use. 7.3
Install thermostatically actuated valves to control the flow of cooling water for steam sterilizer condensate discharge.
7.4
Replace old steam sterilizers and vacuum pumps with newer models that do not use single-pass cooling or con-densate discharge tempering water.
7.3, 7.4
Replace old fume hoods with a filtration system that does not require water (e.g., activated carbon).
7.6
Inspect and repair worn cage-and-rack washer valves and rinse nozzles.
7.7
Run glassware and cage-and-rack washers only when full. 7.5, 7.7
Consider converting from traditional film to digital X-ray equipment.
7.8
Onsite Alternative Water Use
Consider using onsite alternative water for irrigation, cool-ing tower make-up, toilet and urinal flushing, fume hood scrubbers, and other uses not requiring potable water.
8.0
Prioritizing Projects
All projects and practices selected should be considered in the context of achiev-ing established water management goals, as well as overall cost-effectiveness. Once water-saving opportunities have been identified, they should be prioritized using criteria, such as urgency, cost-effectiveness, amount of potential water savings, vis-ibility, and environmental impact. The water management team should address the simplest and most urgent tasks first, as follows:
• Fix any equipment that is malfunctioning or leaking to target the most urgent issues first.
• Start with simple projects and practices, particularly for new water management programs. This will help create initial positive results and gain acceptance of pro-gram goals and initiatives.
Table 1-4. Action Plan Water Use Reduction Opportunity Checklist (cont.)

October 2012 1-23
1.2 Water Management Planning
• Note where simply changing the operations and maintenance for equipment or systems will result in savings. These changes are often are low- to no-cost options that can be more cost-effective than retrofits or replacements.
Remaining projects should be prioritized based on facility goals. Depending on what the facility values most, projects can be prioritized in a variety of ways, including:
• Shortest to longest simple payback period.
• Highest to lowest potential of water savings.
• Most visibility to least visibility (e.g., implementing a landscaping project before increasing cooling tower cycles of concentration).
• Greatest to least environmental impact (e.g., implementing projects with the greatest associated energy savings before those with only water savings).
Documenting Project Priorities in a Detailed Action Plan
Documenting in order of priority the identified water-saving opportunities and spe-cific projects or operation and maintenance changes is an effective way to help ensure that projects are implemented and water management goals are reached. Remember that projects can be re-prioritized as they are completed or based on changing goals.
The water management team should also consider developing an emergency contingency plan, which can be a stand-alone document or incorporated into the facility-specific action plan. The emergency contingency plan can help the team further prioritize actions and identify ways to prepare for and respond to significant drought or other water restrictions. When developing an emergency contingency plan, consider the following tips:
• Describe how the facility will meet minimum water needs in an emergency or minimum water use requirements in a drought or water shortage. This may require determining the highest-priority water use needs at the facility and planning for how those needs will continue to be met in an emergency.
• Work with the local water utility and other regional and state associations to ensure that plans are compliant with all requirements and that water use will be reduced regionally as needed.
• Refer to the emergency water supply planning guide for water outages for hos-pitals and health care facilities developed by the Centers for Disease Control and Prevention and the American Water Works Association for examples of issues to consider when developing a facility-specific plan.22
22 Centers for Disease Control and Prevention and American Water Works Association. 2012. Emergency Water Supply Planning Guide for Hospitals and Health Care Facilities. Atlanta: U.S. Department of Health and Human Services. www.cdc.gov/healthywater/emergency/drinking_water_advisory/index.html#planningguide.
1-24 October 2012
1.2 Water Management Planning
Step 5. Implementing the Action PlanThe water management team should develop a targeted implementation strategy for the action plan, which can significantly increase project success and help achieve water management goals. This might include gathering support for specific projects and practices. To maximize the opportunities for success, consider the following:
• Ensure that the necessary resources (i.e., time, money, personnel) are available to complete projects and practices included in the action plan.
• Complete identified projects and practices in order of priority.
• Promote key components of the action plan to employees and other relevant stakeholders to gain support for specific projects.
• Create incentives to encourage staff or those responsible for specific projects and practices to take action and do their part to help achieve water management goals.
• Be creative and consider other resources that may be available to assist in imple-mentation, such as other employees, utility and government programs, interns, or engineering students.
• In the event of a drought or other water emergency, implement measures as specified in the emergency contingency plan.
Step 6. Evaluating ProgressThe water management team should periodically conduct a formal review of water use data and action plan implementation in the context of achieving the established water management goals. This review allows the organization to evaluate progress, set new goals, and continually improve. The water management team can also use the review to demonstrate and promote the success of the water management pro-gram, which can provide long-term support for the program and future projects and initiatives. Evaluations can include the following:
• Review water bills and meter and submeter readings to verify that the expected water savings are achieved. Ensuring that expected savings are seen is referred to as measurement and verification, and it is an important exercise to ensure that projects are operating as expected. DOE’s FEMP has issued guidance on how to conduct measurement and verification for water projects.23
• Review the action plan, at least on an annual basis, and revise water manage-ment goals as they are achieved.
• Use ENERGY STAR’s Portfolio Manager24 to track progress and compare water use over time. The Portfolio Manager tool is an effective way to keep track of water use data and note water reduction successes.
23 DOE, EERE, FEMP. April 2008. M&V Guidelines: Measurement and Verification for Federal Energy Projects, Version 3.0, Section 11.6. mnv.lbl.gov/keyMnVDocs/femp. 24 EPA and DOE’s ENERGY STAR, Portfolio Manager Overview, op. cit.

October 2012 1-25
1.2 Water Management Planning
• Conduct a detailed reassessment of the facility approximately every four years to develop an updated water balance and identify new water management goals and savings opportunities.
Step 7. Recognizing AchievementsTo gain and sustain support for a facility’s water management program, the water management team can consider providing recognition for water management activi-ties and achievements. This includes recognizing the contributions of those who have helped achieve the water management goals, as well as promoting the success of the program internally and to external stakeholders. Following are a few ways to recognize water management efforts:
• Establish an internal recognition program to award personnel or teams that pro-vided significant contributions toward achieving the water management goals. This might include an award for the generation of the best water-efficiency ideas or the achievement of the greatest water use reductions (if measurable on an individual basis).
• Respond to employee and staff suggestions and reports of issues to encourage all parts of the organization to participate in the efforts.
• Explore opportunities for external recognition, such as competing in ENERGY STAR’s annual National Building Competition,25 which recognizes top water savers.
• Report progress publicly to interested stakeholders to gain support for initiatives and recognition for water-efficiency achievements.
• Report progress to facility staff and building occupants by using a newsletter or other outreach means as discussed in Section 2.4: User Education and Facility Outreach.
25 EPA and DOE’s ENERGY STAR. National Building Competition. www.energystar.gov/index.cfm?fuseaction=buildingcontest.index.
Water Management Planning Case Study
To learn how EPA’s comprehensive water management strategy resulted in an 18.7 percent reduction in water use across 29 of its laboratories in just three short years, read the case study in Appendix A.

1-26 October 2012
1.2 Water Management Planning
Additional ResourcesAlliance for Water Efficiency. www.allianceforwaterefficiency.org.
Arizona Municipal Water Users Association Regional Water Conservation Committee and Black and Veatch. August 2008. Facility Manager’s Guide to Water Management Version 2.7. www.amwua.org/business.html.
Centers for Disease Control and Prevention and American Water Works Association. 2012. Emergency Water Supply Planning Guide for Hospitals and Health Care Facilities. Atlanta: U.S. Department of Health and Human Services. www.cdc.gov/healthywater/emergency/drinking_water_advisory/index.html#planningguide.
Cosaboon, David, et al. International Facility Management Association Foundation. 2010. A Comprehensive Guide to Water Conservation: The Bottom Line Impacts, Chal-lenges and Rewards. www.ifmafoundation.org/research/how-to-guides.htm.
Database of State Incentives for Renewables & Efficiency. PACE Financing. dsireusa.org/solar/solarpolicyguide/?id=26.
DOE, Energy Efficiency and Renewable Energy, Federal Energy Management Program (FEMP). April 2008. M&V Guidelines: Measurement and Verification for Federal Energy Projects, Version 3.0. Section 11.6. mnv.lbl.gov/keyMnVDocs/femp.
DOE, Energy Efficiency and Renewable Energy, FEMP. July 2010. Guidelines for Esti-mating Unmetered Landscaping Water Use. www1.eere.energy.gov/femp/program/waterefficiency_resources.html.
DOE, Energy Efficiency and Renewable Energy, FEMP. September 2011. Guidelines for Estimating Unmetered Industrial Water Use. www1.eere.energy.gov/femp/program/waterefficiency_resources.html.
East Bay Municipal Utility District. 2008. WaterSmart Guidebook—A Water-Use Efficien-cy Plan Review Guide for New Businesses. www.ebmud.com/for-customers/ conservation-rebates-and-services/commercial/watersmart-guidebook.
Environment Agency of the United Kingdom. March 2006. Waterwise—good for business, great for the environment. Page 6. cdn.environment-agency.gov.uk/geh-00406bknl-e-e.pdf.
EPA and DOE’s ENERGY STAR. Portfolio Manager Overview. www.energystar.gov/index.cfm?c=evaluate_performance.bus_portfoliomanager.
EPA and DOE’s ENERGY STAR. 2007. ENERGY STAR Building Upgrade Manual. Page 4. www.energystar.gov/index.cfm?c=business.bus_upgrade_manual.
EPA. Environmental Management Systems (EMS). www.epa.gov/EMS/.
EPA. EPA Water Management Plans. www.epa.gov/oaintrnt/water/epa_plans.htm.
National Association of Energy Service Companies. Resources—What is an ESCO? www.naesco.org/resources/esco.htm.
http://www.ebmud.com/for-customers/conservation-rebates-and-services/commercial/watersmart-guidebook

October 2012 1-27
1.2 Water Management Planning
North Carolina Department of Environment and Natural Resources, et al. May 2009. Water Efficiency Manual for Commercial, Industrial and Institutional Facilities. Page 28. savewaternc.org/bushome.php.
Schultz Communications. July 1999. A Water Conservation Guide for Commercial, Insti-tutional and Industrial Users. Prepared for the New Mexico Office of the State Engi-neer. www.ose.state.nm.us/wucp_ici.html.
South Florida Water Management District Water Supply Development Section. April 2012. Water Efficiency Self-Assessment Guide for Commercial and Institutional Building Facility Managers. www.sfwmd.gov/portal/page/portal/xweb%20-%20release%203%20water%20conservation/water%20conservation%20businesses#efficiency.
South Florida Water Management District. SFWMD Library & Multimedia. my.sfwmd.gov/portal/pls/portal/portal_apps.repository_lib_pkg.repository_browse?p_keywords=waterefficiency&p_thumbnails=no.
State of California Department of Water Resources. October 1994. Water Efficiency Guide for Business Managers and Facility Engineers. www.water.ca.gov/wateruseefficiency.

2.1 Introduction to Water Use Monitoring and Education ................................. 2-2
2.2 Metering and Submetering ............................... 2-4
2.3 Leak Detection and Repair ................................. 2-9
2.4 User Education and Facility Outreach .................................................................2-13
2.5 Codes, Standards, and Voluntary Programs for Water Efficiency .........................2-16
Water Use Monitoring and Education
Table of Contents

xxx
2-2 WaterSense at Work: Best Management Practices for Commercial and Institutional Facilities
2.1 Introduction to Water Use Monitoring and Education
Two key factors to properly managing and reducing facility water use are actively monitoring water use and effectively educating facility staff, building occupants, employees, and visitors about facility water use and water management planning goals. Monitoring and education are critical to the success of a facility’s water man-agement program because they provide the ability to track and measure progress, as well as increase awareness and build support for specific projects or user behavioral changes.
By routinely monitoring facility water use through existing water meters, building owners and operators can understand and manage facility water use. To monitor some specific activities more closely, some facilities install submeters on major end uses, such as irrigation systems and cooling towers. Metering allows a facility to quickly find and fix leaks or other unnecessary water use. It also has the added ben-efit of enabling the facility to identify cost-effective water use reduction opportuni-ties and to track project savings.
Leaks are water wasted with no intended use or purpose; once identified, leaks should be the first area to target from a water management perspective. Unfortunately, leaks often go undetected, particularly if a facility is not routinely moni-toring its water use. On average, leaks can account for more than 6 percent of a facility’s total water use. With a few simple steps, a facility can establish a comprehensive leak detection and repair program, which can save water, money, time, and expenses that would otherwise be associated with unman-aged leaks.
Once a facility has an accurate understanding of its water use and has taken steps to eliminate leaks and other unnecessary water waste, the next step is to educate building occupants, employees, and visitors about using water efficiently. Build-
ing owners and operators can raise awareness of water-efficiency efforts by commu-nicating reduction goals to their employees, guests, and other stakeholders. Much of the water use within a facility is dependent upon user behavior and proper opera-tion and maintenance of water-using products and equipment. Simple behavioral changes, such as taking shorter showers, running dishwashers only with full loads, or using a dual-flush toilet properly, can result in significant water savings. In addition, maintaining equipment and training staff to look for and report leaks can be a key component of a facility’s leak detection and repair program, helping to ensure the long-term water savings associated with any water-efficient products or equipment installed.
Another aspect of water use education is to understand the impact of national, state, and local codes, standards, and voluntary water-efficiency programs. In many cases, building and plumbing codes and standards establish the baseline for how build-ings use water and even the types of water-using products that can be installed. Voluntary programs such as the U.S. Environmental Protection Agency’s (EPA’s)
Water meter

October 2012 2-3
WaterSense® program and EPA and the U.S. Energy Department’s ENERGY STAR® have emerged to help facilities more easily implement water-efficient practices, tech-nologies, and products that go above and beyond the standards. Many water and energy utilities also offer rebates for water- and energy-efficient products, which can increase a project’s cost-effectiveness. Facility managers can use this document as a starting point for finding information regarding the codes, standards, voluntary pro-grams, and product rebates in order to better manage and more strategically employ successful water-efficiency measures and practices.
Section 2: Water Use Monitoring and Education of WaterSense at Work provides specific guidance on:
• Metering and submetering • Leak detection and repair • User education and facility outreach • Codes, standards, and voluntary programs for water efficiency
2.1 Introduction to Water Use Monitoring and Education

xxx
2-4 WaterSense at Work: Best Management Practices for Commercial and Institutional Facilities
OverviewAn important rule in water management is that you can’t manage what you don’t measure. Tracking a facility’s total water use, as well as specific end uses, is a key com-ponent of the facility’s water-efficiency efforts. Source meters measure the amount of water being supplied to the facility, while submeters measure usage for specific activities, such as cooling tower, process, or landscape water use. Accurately measur-ing water use can help facility managers identify areas for targeted reductions and to track progress from water-efficiency upgrades. Submeters can also help identify leaks and indicate when equipment is malfunctioning.
Meters and submeters can be integrated into a centralized building management sys-tem, making it easy to track usage and implement a water management plan (see Sec-tion 1.2: Water Management Planning). These systems are capable of electronically storing data from meters and submeters, reporting hourly, daily, monthly, and annual water use. They can also trigger alerts when leaks or other operational anomalies are detected.
Installing the correct meter and ensuring it functions properly are critical to accurate water measurement. There are many types and sizes of meters intended for different uses, so it is important to choose the correct one. Improper sizing or type can cause problems for the building. For example, an undersized water meter can cause exces-sive pressure loss, reduced flow, and noise. Oversized meters are not economical and do not accurately measure minimal flow rates.1 All utility-grade water meters manu-factured and installed for domestic water service by a water utility in the United States must comply with American Water Works Association (AWWA) standards. Sub-meters that are installed for water management purposes and not used for revenue purposes are not subject to such standards.
Best Practices There are several best practices for metering water use, including correctly choos-ing what to meter and submeter; selecting, installing, and maintaining meters; and reading and recording metered data to track water use and integrate it into the water management plan.
Determining What to Meter and Submeter
It’s best to meter all water conveyed to the facility, regardless of source. For example, even if a building’s water is solely supplied by an alternative source (e.g., municipally supplied reclaimed water), a source meter can still be installed to track and manage water use.2 If multiple sources of water are provided to a facility, each source should be metered and tracked separately.
2.2 Metering and Submetering
1 Smith, Timothy A. Park Environmental Equipment Company, LTD. April 22, 2008. Water-Meter Selection and Sizing. www.park-usa.com/skins/park/standard.aspx?elid=71&arl=108.
2 U.S. Green Building Council’s LEED.® November 2010. Building Design and Construction. Page 151. www.usgbc.org/ShowFile.aspx?DocumentID=8182.

October 2012 2-5
Building owners and operators should consider installing separate submeters to measure specific end uses that are permanently plumbed, as indicated in Table 2-1. For more information and additional recommendations on metering and subme-tering, review the U.S. Green Building Council’s LEED® rating system3 and the 2012 International Green Construction Code.™ 4
Table 2-1. Submetering Recommendations
2.2 Metering and Submetering
3 Ibid. 4 International Code Council. 2012 International Green Construction Code.™ www.iccsafe.org/Store/Pages/Product.aspx?id=3750S12.
Submeter Application Recommendation
Tenant Spaces Meter all tenant spaces individually.
Cooling Towers
Meter cooling tower make-up water and blowdown water supply lines. A single make-up meter and a single blowdown meter can record flows for multiple cooling towers if they are controlled with the same system. Separately controlled cool-ing towers should have separate make-up and blowdown water meters.
Heating, Ventilating, and Air Conditioning (HVAC) Systems
Individually or collectively meter HVAC systems with ag-gregate annual water use of 100,000 gallons or more or if the facility has 50,000 square feet or more of conditioned space. Metered systems should include evaporative coolers, humidifiers, mist cooling devices, and recirculating water systems with a fill water connection, such as chilled water, hot water, and dual temperature systems.
Steam Boilers
Meter the make-up water supply line to steam boilers with a rating of 500,000 British thermal units per hour (Btu/h) or greater. A single make-up meter can record flows for mul-tiple boilers.
Single-Pass Cooling Systems
Meter any systems or equipment that use single-pass cool-ing water and do not use a chilled water system or closed-loop recirculation.
Irrigation Meter irrigation systems that are automatically controlled.
Roof Spray SystemsMeter roof spray systems for irrigating vegetated roofs or thermal conditioning.
Ornamental Water Features
Meter make-up water supply lines for ornamental water features with a permanently installed water supply.
Pools and SpasMeter make-up water supply lines for indoor and outdoor pools and spas.
Industrial ProcessesIndividually meter industrial processes consuming more than 1,000 gallons per day on average.
(continued)

2-6 October 2012
Meter Selection
The first step in choosing a meter is to determine its use and select the appropriate type of meter from the list below:5
• Positive displacement meters are best suited for small commercial or institutional applications because they have high accuracy rates at low flows and can precise-ly measure peak flows.
• Compound meters are a good choice for large commercial or institutional facilities because they accurately measure low flows and high flows with their multiple-measuring chamber design.
• Turbine and propeller meters are most appropriate for continuous, high-flow applications and are inaccurate at low flows. These types of meters are not usu-ally recommended for commercial, institutional, or residential buildings because water flows are in constant fluctuation, with very low minimum flow rates.
Next, select the appropriate size of the meter. It is critical to understand the build-ing’s size, function, fixture types, usage occupancy, and peak population in order to select the appropriately sized meter. These statistics determine the minimum and maximum flow rates and will assist in the selection of a properly sized water meter.6 AWWA Manual M22, Sizing Water Service Lines and Meters, provides additional guide-lines for selecting and sizing utility-owned and installed water meters.7
Meter Installation and Maintenance
After selecting a meter, consider the following installation and maintenance best practices to ensure optimal meter operation:
• When installing a meter, follow the manufacturer’s instructions. Improper instal-lation can lead to metering inaccuracies.
• Install meters in an accessible location to allow for reading and repair. In addition, ensure that the meter location is protected from potential damage.
2.2 Metering and Submetering
Submeter Application Recommendation
Alternative Water Sources
Meter water use from alternative water sources, such as gray water, rainwater, air handler or boiler condensate, or other sources discussed in Section 8: Onsite Alternative Water Sources.
Other ProcessesMeter any other process with a projected annual water use of 100,000 gallons or more.
Table 2-1. Submetering Recommendations (cont.)
5 Smith, op. cit.6 Ibid.7 American Water Works Association (AWWA). 2004. Sizing Water Service Lines and Meters (AWWA Manual M22, Second Edition).
apps.awwa.org/eBusMAIN/Default.aspx?TabID=401&ProductId=6711.

October 2012 2-7
• To ensure uniform flow entering the meter, do not install the meter near pipe bends. In general, place the meter in a location where there is a space of straight pipe equivalent to at least 10 times the pipe diameter downstream of the meter and five times the pipe diameter upstream of the meter.8
• Create a map indicating the location of all water supply meters and submeters to be included in the facility water management plan.
• Include a strainer on all meters and submeters. Debris and sediment can enter a meter and have an adverse effect on accurate measurement. An inline strainer on the meter’s inlet will collect debris and sediment and prevent them from enter-ing the meter body.9
• Since meters deteriorate with age, test them for accuracy and calibrate them on a regular basis. AWWA recommends that utility-owned meters be tested, on aver-age, as follows:10
à Meter sizes 5/8 inch to 1 inch: Every 10 years à Meter sizes 1 inch to 4 inches: Every five years à Meter sizes 4 inches and larger: Every year
• Consider inspecting and calibrating submeters more frequently, depending upon the type and size of the meter and its application.
Water Use Tracking and Integration Into the Water Management Plan
Building owners and operators should consider installing a water meter data man-agement system with remote communication capabilities that provides instant feedback on all metered water use in a central location. This type of system makes it easier for building managers to iden-tify leaks or other abnormalities and better understand and manage water use at the facility.
If the facility is not integrating metering data into a central-ized data system, consider the following best practices:11
• Assign responsibility to track water use at least monthly.
• Ensure that staff understands how to read the meters and record data properly. Pay special attention to the units that the meter uses—gallons, cubic feet, and hun-dred cubic feet are common units for water meters. Also, ensure that staff record the numerical values properly. Meters often include one or more trailing zeros that must be added after the numerical dial reading.
2.2 Metering and Submetering
8 AWWA. 1999. Water Meters—Selection, Installation, Testing, and Maintenance (AWWA Manual M6, Fourth Edition). Pages 40-46. apps.awwa.org/eBusMAIN/Default.aspx?TabID=401&ProductId=28471.
9 Smith, op. cit.10 Georgia Environmental Protection Division. August 2007. Water Meter Calibration, Repair, and Replacement Program. Page 7. www1.gadnr.org/cws/.11 U.S. Energy Department, Energy Efficiency & Renewable Energy, Federal Energy Management Program. Best Management Practice: Water Management Planning.
www1.eere.energy.gov/femp/program/waterefficiency_bmp1.html.
A meter reads 201,670 cubic feet.

2-8 October 2012
2.2 Metering and Submetering
• Plot total water use and submetered data monthly and examine data for unex-plained fluctuations.
• Evaluate trends and investigate and resolve any unexpected deviations in water use.
Additional ResourcesAlliance for Water Efficiency. www.allianceforwaterefficiency.org.
American Water Works Association (AWWA). 1999. Water Meters—Selection, Installa-tion, Testing, and Maintenance (AWWA Manual M6, Fourth Edition). Pages 40-46. apps.awwa.org/eBusMAIN/Default.aspx?TabID=401&ProductId=28471.
AWWA. 2004. Sizing Water Service Lines and Meters (AWWA Manual M22, Second Edition). apps.awwa.org/eBusMAIN/Default.aspx?TabID=401&ProductId=6711.
International Code Council. 2012 International Green Construction Code.™ www.iccsafe.org/Store/Pages/Product.aspx?id=3750S12.
Schultz Communications. July 1999. A Water Conservation Guide for Commercial, Insti-tutional and Industrial Users. Prepared for the New Mexico Office of the State Engineer. www.ose.state.nm.us/wucp_ici.html.
State of California Department of Water Resources. October 1994. Water Efficiency Guide for Business Managers and Facility Engineers. www.water.ca.gov/wateruseefficiency.

3.2 Toilets
xxx
WaterSense at Work: Best Management Practices for Commercial and Institutional Facilities 2-9
OverviewIdentifying and repairing leaks and other water use anomalies within a facility’s water distribution system or from particular processes or equipment can keep a facility from wasting significant quantities of water. As described in Table 2-2, water leaks can add up over time.12,13
Table 2-2. Potential Losses From Water Leaks
An aggressive leak detection and repair program can help facility managers better understand building water use and save money by avoiding water waste.
Best Practices Reading meters, installing failure abatement technologies, and conducting visual and auditory inspections are important best practices to detect leaks. To reduce un-necessary water loss, all detected leaks should be repaired quickly.
3.2 Toilets
2.3 Leak Detection and Repair
MalfunctionLeaking Flow Rate (gallons per minute)
Water LossEstimated Cost of Water Loss
Leaking Toilet 0.5 gpm21,600 gallons
per month$2,100 per year
Drip Irrigation Malfunction
1.0 gpm43,200 gallons
per month$4,300 per year
Unattended Water Hose at Night
10.0 gpm5,400 gallons
per day$16,000 per year
Broken Distribution Line for:
One Day One Week One Month
15.0 gpm 15.0 gpm 15.0 gpm
21,600 gallons
151,200 gallons 648,000 gallons
Up to $64,000 per year
Tempering Water Line on a Steam Sterilizer Stuck in the On Position
2.0 gpm86,400 gallons
per month$8,600 per year
Stuck Float Valve in a Cooling Tower
5.0 gpm216,000 gallons
per month$21,000 per year
12 City of Poway, California. How to Detect a Water Leak. www.poway.org/Index.aspx?page=472.13 Estimated cost of water loss based on an average rate of $8.25 per 1,000 gallons for water and wastewater determined from data in: American Water
Works Association (Raftelis Financial Consulting). 2010. Water and Wastewater Rate Survey.

2-10 October 2012
2.3 Leak Detection and Repair
Reading Meters and Installing Failure Abatement Technologies
To reduce water loss, consider the following metering and leak detection methods:
• Read the facility water meter during off-peak hours when all water-using equip-ment can be turned off, and building occupants, employees, and visitors are not using sanitary fixtures. After all water uses have been shut off, read the meter; and then read it again an hour later. If the water meter reading significantly changed, this indicates there may be a leak somewhere within the distribution system or within the facility.
• Read water meters and water bills monthly. Pay close attention to water me-ter readings to ensure that they make sense and are consistent with expected water use trends. Compare monthly water bills to the previous month and to the same month of the previous year, keeping in mind expected seasonal water use increases (e.g., more water in the summer months for building cooling and land-scape irrigation). If water use is unexpectedly high, a significant leak might be present in the distribution lines or within the facility. Install submeters on major water-using equipment (e.g., cooling tower make-up water lines, reverse osmosis system supply lines, and irrigation systems). See Section 2.2: Metering and Subme-tering for more information. Monitor the submeter readings to identify unexpect-edly high water uses, which may indicate that equipment is malfunctioning or that a leak is present.
• Install failure abatement devices, or leak detection systems, on major water-using equipment. Failure abatement devices sense if equipment is malfunctioning or potentially leaking by detecting abnormal increases in water flow. The devices can alert a user if an issue is detected via alarm, flashing light, phone call, or other method, or they can automatically turn off the water supply to the equipment.
Visual and Auditory Inspection
In addition to metering, conduct visual and auditory inspections described in these best practices:
• Perform a water assessment of the facility once every four years, as outlined in Section 1.2: Water Management Planning. During a water assessment, all major water uses will be identified and estimated. If more than 10 percent of water use cannot be accounted for by the water assessment, the facility may have leaks in the distribution lines or from equipment, and further investigation is warranted.
• Select an irrigation professional certified through a program that has earned the U.S. Environmental Protection Agency’s (EPA’s) WaterSense® label14 to audit the landscape irrigation system for outdoor water use leaks. All audits should be con-ducted according to the Irrigation Association’s recommended audit guidelines.15
14 U.S. Environmental Protection Agency’s WaterSense program. Professional Certification Program. www.epa.gov/WaterSense/outdoor/cert_programs.html.15 Irrigation Association. Technical Resources: Irrigation Audit Guidelines. www.irrigation.org/Resources/Audit_Guidelines.aspx.

October 2012 2-11
2.3 Leak Detection and Repair
• Perform daily tours of the building, including mechanical spaces. Pay close atten-tion to all water-using equipment indoors and outdoors by listening and looking for unexpected water use, such as:
à Sanitary fixtures continuously flushing, leaking, or left running.
à Unanticipated discharge to floor drains in mechanical spaces.
à Wet spots in parking lots and grassy areas surrounding the facility. If soggy ground is unexpected, contact the water utility to determine if there is a leak in the distribution line.
• Train building occupants, employees, and visitors to report to facility mainte-nance staff any leaks that they detect in restrooms, kitchen areas, or any part of the facility. Building maintenance staff could complete these repairs without much extra effort. Immediate leak detection is vital to avoid water and monetary losses from unnecessary water waste. To encourage this feedback and build a cul-ture of reporting leaks, be sure to repair leaks in a timely manner.
Leak Repair
If a plumbing fixture or other piece of wa-ter-using equipment is leaking, repair it according to manufacturer specifications. If necessary, replace it with new, properly functioning equipment; look for Water-Sense labeled models where available.
For specific information on operation and maintenance, retrofit options, or replace-ment options, see the relevant sections for specific technologies within this document.
Additional ResourcesAmerican Society of Heating, Refrigerating, and Air Conditioning Engineers. Standard 189.1, Standard for the Design of High-Performance, Green Buildings Except Low-Rise Residential Buildings. www.ashrae.org/publications/page/927.
American Water Works Association. Water Loss Control Basics. www.awwa.org/Resources/WaterLossControl.cfm?ItemNumber=47847.
DOE, Energy Efficiency & Renewable Energy, Federal Energy Management Program. January 2009. Distribution System Audits, Leak Detection, and Repair: Kirkland Air Force Base—Leak Detection and Repair Program. www1.eere.energy.gov/femp/program/waterefficiency_csstudies.html.
16 Southern Nevada Water Authority. How to Find a Leak. www.snwa.com/3party/find_leak/main.html.
Finding and Fixing Leaks
EPA’s WaterSense program sponsors Fix a Leak Week annually in March to remind Americans to find and fix household leaks. This week is the perfect time to educate employees about finding and fixing leaks at home, as well as at the facility.
The Southern Nevada Water Authority has several leak detection and repair videos16 available on its website. Consider using these videos to further edu-cate facility staff about identifying leaks.

2-12 October 2012
2.3 Leak Detection and Repair
EPA’s WaterSense program. Fix a Leak Week. www.epa.gov/watersense/our_water/fix_a_leak.html.
Irrigation Association. Technical Resources: Irrigation Audit Guidelines. www.irrigation.org/Resources/Audit_Guidelines.aspx.
North Carolina Department of Environment and Natural Resources, et al. May 2009. Water Efficiency Manual for Commercial, Industrial and Institutional Facilities. savewaternc.org/bushome.php.
Schultz Communications. July 1999. A Water Conservation Guide for Commercial, Insti-tutional and Industrial Users. Prepared for the New Mexico Office of the State Engineer. www.ose.state.nm.us/wucp_ici.html.
Southern Nevada Water Authority. How to Find a Leak. www.snwa.com/3party/find_leak/main.html.

3.2 Toilets
xxx
WaterSense at Work: Best Management Practices for Commercial and Institutional Facilities 2-13
OverviewEducating building occupants on using water efficiently at work is essential to any organization’s water conservation efforts. This is especially true when new water-efficient technologies or methods are being implemented. Installing a retrofit device or replacing outdated technology or fixtures alone might not necessarily produce expected water savings. Operation and maintenance procedures, retrofits, and replacements are most effective when employees, contractors, and visitors all under-stand their role in using them properly. It is also important to offer building occu-pants simple, straightforward ways in which they can help reduce a facility’s water use, along with good reasons for doing so. User education is a cost-effective way to enhance your facility’s water-efficiency efforts—even small changes in user behavior can result in significant water savings.
Best PracticesTo improve water efficiency outside and within a facility, there are a number of best practices to educate employees and other building occupants on water savings to promote success.
Employee and Occupant Education
Consider the following approaches when educating employees and building occu-pants on your water-efficiency initiative:
• Share management’s commitment to water efficiency and the company’s water management program through staff meetings, posters, emails, newsletters, and other communications. Include specifics on water-efficiency goals whenever possible.
• Graph and post monthly water use figures so that building occupants can stay informed about the facility’s progress and become invested in water-efficiency efforts.
• Create point-of-use reminders to reinforce positive behaviors (e.g., place instruc-tions next to dual-flush toilets).
• Include water-efficiency messages in facility-wide events, such as fairs, open houses, or Earth Day events.
• Train maintenance personnel, operators, and supervisors on any new or revised procedures involving water efficiency. Encourage relevant custodial, cleaning, and maintenance personnel, as well as everyday users, to identify and report leaks in accordance with Section 2.3: Leak Detection and Repair. Make it easy to report problems by setting up a user-friendly communication system such as a hotline. Be sure to repair leaks promptly.
2.4 User Education and Facility Outreach

2-14 October 2012
2.4 User Education and Facility Outreach
Making Water Efficiency Fun
Following are some creative ways to get employees involved in recognizing the im-portance of water efficiency at work:
• Consider creating a “Green Team” responsible for environmental issues in and around the facility.
• Hold events related to water efficiency within the facility periodically through-out the year to educate building occupants and celebrate successes. Earth Day and Fix a Leak Week, which is sponsored by the U.S. Environmental Protection Agency’s (EPA’s) WaterSense® program, are good opportunities to bring attention to water efficiency.17
• Consider holding a contest to encourage water use reductions among building occupants. Acknowledge those who identify successful projects or provide group awards for major successes.
• Start a suggestion and incentive system to recognize and encourage water sav-ings in the facility. For best results, include a mechanism to acknowledge submis-sions and provide information on how they were addressed.
• Provide incentives to building occupants to promote water-saving success. Consider rewarding guests for participating in towel and linen reuse programs at hotels or employees for meeting challenges to reduce building water use.
Providing Water-Efficiency Tips
Periodically remind building occupants and employees of common tips they can fol-low to help reduce water use, including some of the following, where relevant:
• Fill the sink and turn off the tap when washing dishes in community kitchen areas.
• When using the dishwasher, wash only full loads.
• Look for and report leaky bathroom and kitchen fixtures, or any other leaks, to the appropriate personnel.
• Sweep instead of rinsing off sidewalks, kitchen floors, or other areas.
• Report irrigation occurrences during less efficient times, including during the middle of the day or when it is raining.
• Report broken or improperly positioned irrigation sprinkler heads that spray water on sidewalks or pavement.
• To help building occupants learn more about how they can be water-efficient at work or at home, direct them to the EPA’s WaterSense website18 for more information.
17 U.S. Environmental Protection Agency’s (EPA’s) WaterSense program. Fix a Leak Week. www.epa.gov/watersense/our_water/fix_a_leak.html.18 EPA’s WaterSense program. www.epa.gov/watersense.

October 2012 2-15
2.4 User Education and Facility Outreach
Outreach to Visitors and Audiences Outside the Facility
Consider the following when looking to broaden the outreach of your facility’s water-efficiency efforts:
• Work with local utilities to participate in their commercial and institutional water conservation programs and to share suc-cess stories with other facilities.
• Create displays presenting facility water savings for the facility lobby and other public reception areas.
• Use signage, brochures, and other promo-tional materials to inform visitors, custom-ers, and others about the facility’s water-efficiency program and actions people can take in restrooms or other areas to save water.
Additional ResourcesAlliance for Water Efficiency. Water Savings Tips: Commercial, Industrial, and Institu-tional Water Use. www.allianceforwaterefficiency.org/CII-tips.aspx.
Schultz Communications. July 1999. A Water Conservation Guide for Commercial, Insti-tutional and Industrial Users. Prepared for the New Mexico Office of the State Engineer. www.ose.state.nm.us/wucp_ici.html.
State of California, Department of Water Resources. October 1994. Water Efficiency Guide for Business Managers and Facility Engineers. www.water.ca.gov/wateruseefficiency.
Example signage at an EPA Gulf Ecology Division (GED) facility

2-16 WaterSense at Work: Best Management Practices for Commercial and Institutional Facilities
OverviewCodes and standards are important mechanisms for addressing the efficiency of plumbing equipment, water-using appliances, and building water use. In addition, voluntary programs and guidelines have recently emerged as key market mecha-nisms, helping to assist facilities adopt water-efficient products and practices.
Standards
Standards specify uniform technical criteria, methods, processes, and practices by which performance is measured. In a strict sense, standards are created through a consensus-based development process. This process seeks agreement of most partic-ipants (i.e., more than a simple majority) and resolution of objections of the minority, but not necessarily unanimity.19 Standards developed by organizations accredited through the American National Standards Institute (ANSI), for example, are consid-ered consensus-based standards. Compliance with standards is considered voluntary unless they have been adopted into law through legislation or regulation.
Table 2-3 lists some of the organizations in the United States and internationally that develop standards related to commercial and institutional water-using products and equipment and water use in buildings.
Table 2-3. Select Standards Development Organizations
2.5 Codes, Standards, and Voluntary Programs for Water Efficiency
Standards Development Organization Products or Equipment Addressed
American Society of Agricultural and Biological Engineers (ASABE)
Irrigation equipment
American Society of Heating, Refrigerating, and Air Conditioning Engineers (ASHRAE)
Buildings, water heaters, and humidifiers
American Society of Mechanical Engineers (ASME)
Plumbing products
ASTM International (formerly the American Society for Testing and Materials)
Food service equipment and medical equipment
Association for the Advancement of Medical Instrumentation (AAMI)
Medical equipment
Canadian Standards Association (CSA) Plumbing products
International Association of Plumbing and Mechanical Officials (IAPMO)
Plumbing products and systems
International Code Council (ICC) Buildings and plumbing systems
National Sanitation Foundation (NSF)Commercial kitchen equipment and drinking water treatment units
19 American Society of Mechanical Engineers. Standards & Certification FAQ. www.asme.org/kb/standards/about-codes---standards.

October 2012 2-17
2.5 Codes, Standards, and Voluntary Programs for Water Efficiency
In 1992, Congress enacted the Energy Policy Act (EPAct)20—and later, EPAct 2005—both of which established maximum water consumption requirements for many plumbing products and water-using appliances sold in the United States. Where applicable, EPAct references relevant standards, making their compliance mandatory. The U.S. Energy Department (DOE) is responsible for implementing and enforcing the requirements established under EPAct.
The water-using products and appliances covered by EPAct 2005 include:
• Toilets • Urinals • Faucets (e.g., residential lavatory, kitchen, commercial lavatory) • Showerheads • Residential clothes washers • Commercial clothes washers • Residential dishwashers • Commercial ice makers • Pre-rinse spray valves
Codes
Codes provide the criteria necessary to protect public health, safety, and welfare related to building construction and occupancy. Codes can also be adopted into law through regulation, making their compliance mandatory. Codes often reference stan-dards, which provide the details for how to comply with specific requirements.
Plumbing codes are the primary code mechanism governing how water is used in buildings. This includes provisions for supply, distribution, disposal, and water use of specific products or equipment. There are two primary plumbing code development organizations in the United States. IAPMO produces the Uniform Plumbing Code, and ICC produces the International Plumbing Code. These plumbing codes have no legal status in and of themselves, but they serve as models and, in many cases, have been adopted into law by state and local jurisdictions.
Water-Efficiency Codes, Standards, and Voluntary Programs
Historically, standards and codes have focused primarily on protecting public health and safety. However, in the past 20 years or so, water efficiency has emerged as a commensurate issue that has been incorporated into codes and standards in many places. More recently, voluntary programs have been created to specifically address water uses and water efficiency of products and buildings to go above and beyond federal law and the established codes and standards.
20 U.S. Energy Department (DOE). Energy Policy Act of 1992. www1.eere.energy.gov/femp/regulations/epact1992.html.
2-18 October 2012
2.5 Codes, Standards, and Voluntary Programs for Water Efficiency
Water-Efficient Products
Recently, voluntary programs have emerged that seek to leverage public/private partnerships and use market-based incentives (e.g., certification label) to further improve the water efficiency and performance of individual products and appliances beyond the requirements established by EPAct or the conventional products avail-able in the marketplace. Notable national voluntary programs specifying product and appliance water efficiency include the U.S. Environmental Protection Agency’s (EPA’s) WaterSense® program, EPA and DOE’s ENERGY STAR,® and the Consortium for Energy Efficiency (CEE):21
• WaterSense is a public/private partnership program that develops specifications for water-efficient, high-performing products. Products that are independently certified to meet WaterSense criteria earn the WaterSense label, which distin-guishes them from standard products on the market. WaterSense has developed specifications for both residential and commercial products. For more informa-tion, visit the WaterSense website.22
• ENERGY STAR is a joint public/private partnership program sponsored by EPA and DOE that develops specifications for energy-efficient products and buildings. Products that meet ENERGY STAR criteria are qualified to earn the ENERGY STAR label, which distinguishes them from standard products on the market. ENERGY STAR has developed specifications for many water-using products. For more information, visit the ENERGY STAR website.23
• CEE is a non-profit consortium of efficiency program administrators that pro-motes the use of energy-efficient products, technologies, and services. Where there is significant opportunity and interest from its membership, CEE develops national initiatives that can be used as templates for individual energy-efficiency programs. Related to water efficiency, CEE has developed initiatives for commer-cial ice makers, residential and commercial clothes washers, residential dishwash-ers, and some commercial kitchen equipment.
The Alliance for Water Efficiency (AWE) maintains a list of current and proposed national efficiency standards and voluntary specifications for residential and com-mercial water-using fixtures and appliances.24 This is a useful reference tool for under-standing the types of water-efficient products and appliances that are available on the market and for determining their relative water savings potential.
To further encourage the adoption of water-efficient products and appliances, local jurisdictions or utilities may offer rebates or incentive programs. In many instances, the incentives are provided for products recognized or labeled by the national volun-tary programs discussed above.
21 Consortium for Energy Efficiency, Inc. www.cee1.org.22 U.S. Environmental Protection Agency’s (EPA’s) WaterSense program. www.epa.gov/watersense.23 EPA and DOE’s ENERGY STAR. www.energystar.gov.24 Alliance for Water Efficiency (AWE). Green Building Guidelines & Standards. www.allianceforwaterefficiency.org/Background_on_Green_Building_
Specifications.aspx.

October 2012 2-19
2.5 Codes, Standards, and Voluntary Programs for Water Efficiency
Water-Efficient Buildings
As with products, substantial progress has been made to address water use and efficiency in building plumbing systems and whole buildings, primarily as part of a larger movement to improve the environmental performance of buildings. Tradition-ally, building and plumbing codes have addressed health and safety in plumbing and building water use. Now “green” building standards, codes, and voluntary guidelines are available that also address water-efficient design or construction practices, tech-nologies, performance thresholds, and metrics.
In the world of green building, there is a distinction between green building stan-dards and codes and green building guidelines. As with the discussion of standards above, green building standards and codes are written in language that is enforce-able and ready for adoption into law by legislation or regulation, so that their com-pliance becomes mandatory. Green building guidelines, on the other hand, are not written in enforceable language and are usually intended to be voluntary. Both provide thresholds for efficiency that go above and beyond the established building and plumbing codes and standards.
Table 2-4 shows the prominent national green building codes, standards, and volun-tary guidelines that address water efficiency in commercial and institutional build-ings.25 AWE also maintains a chart comparing the water-efficiency criteria of several of these national green building codes, standards, and guidelines.26
Table 2-4. National Green Building Codes, Standards, and Voluntary Guidelines
25 Ibid. 26 Ibid. 27 U.S. Green Building Council (USGBC). USGBC: Rating Systems. www.usgbc.org/DisplayPage.aspx?CMSPageID=222.
Primary Developing Organization
TitleStandard, Code, or
Guideline
U.S. Green Building Council (USGBC)
LEED® Rating Systems27 Guideline
Green Globes Green Building Initiative (GBI)
ANSI/GBI 01-2010–Green Building Assessment Protocol for Commercial Buildings
Standard
ASHRAEASHRAE 189.1–Standard for the Design of High-Performance, Green Buildings
Standard
ASHRAE
ASHRAE 191–Standard for the Efficient Use of Water in Building, Site, and Mechanical Systems (in development)
Standard
IAPMOGreen Plumbing and Mechanical Code Supplement
Code
ICC Green Construction Code Code

2-20 October 2012
These green building programs typically address water use and efficiency in the fol-lowing areas:28
• Plumbing fixtures and fixture fittings.
• Appliances (e.g., clothes washers, dishwashers).
• Water treatment equipment (e.g., softeners, filtering systems).
• Landscape and landscape irrigation.
• Pools, fountains, and spas.
• Cooling towers.
• Decorative and recreational water features.
• Water reuse and alternate sources of water (e.g., gray water, rainwater and storm-water, cooling condensate and cooling tower blowdown, foundation drain water).
• Specialty processes, appliances, and equipment (e.g., food service, medical, labo-ratories, laundries, etc.).
• Metering and submetering.
• Single-pass cooling.
• Vegetated green roofs.
• Building water pressure.
Water -Efficient Businesses
In addition to programs that incentivize green products and buildings, several initia-tives recognize businesses for their efforts to reduce the company’s impact on the environment. Many of these programs have a multi-media scope while others are specifically focused on water efficiency. These programs can help businesses meet stakeholder demand for transparency and accountability, often called corporate social responsibility. In fact, many companies are reporting their environmental im-pacts voluntarily to programs to demonstrate their commitment to the environment and goodwill toward the community in a more tangible way.29 Resources are avail-able at the national, state, or local level, which can assist companies or other orga-nizations on the path to sustainability and reduced environmental impact.30 Facility managers who actively track their water use, implement water-efficiency measures, and demonstrate savings can contribute to communicating their corporate commit-ment to sustainability.
2.5 Codes, Standards, and Voluntary Programs for Water Efficiency
28 AWE. Green Building Introduction. www.allianceforwaterefficiency.org/Green_Building_Introduction.aspx. 29 Pacific Institute. August 2012. The CEO Water Mandate: Corporate Water Disclosure Guidelines Toward a Common Approach to Reporting Water Issues.
pacinst.org/reports/corporate_water_disclosure_guidelines/full_report.pdf.30 Ceres. Ceres Aqua Gauge. www.ceres.org/issues/water/aqua-gauge/aqua-gauge.

October 2012 2-21
2.5 Codes, Standards, and Voluntary Programs for Water Efficiency
Several sector-specific programs are also available that focus on issues and challeng-es common across a particular sector. For example, green hospitality programs now exist in almost every state that provide recognition or facilitate information sharing between partners.31 These networks can provide expert advice to find new ways to implement water-efficiency initiatives—saving water, energy, and resources at the same time.
Reference ResourcesIf installing new or replacing existing water-using products or appliances, consider referencing resources, such as the AWE’s list of current and proposed national effi-ciency standards and voluntary specifications for residential and commercial water-using fixtures and appliances.32 This list is updated on a regular basis to reflect the most recent standards and voluntary specifications. In addition, look for products that have the earned the WaterSense label or are ENERGY STAR qualified.
Check with local jurisdictions or utilities regarding any water-efficiency incentives or rebates they may offer. Both WaterSense33 and ENERGY STAR34 maintain lists of some utility partners’ rebate programs.
For new construction or major renovation projects, consider following relevant por-tions of the national green building standards, codes, or voluntary guidelines. Com-pliance with these green building criteria can save water and be cost-effective. Some of these programs even offer certification or public recognition for conformance. For example, LEED certified buildings can be advertised and marketed with the LEED logo and appropriate rating (i.e., Certified, Silver, Gold, Platinum).
Additional ResourcesAlliance for Water Efficiency (AWE). Green Building Guidelines & Standards. www.allianceforwaterefficiency.org/Background_on_Green_Building_ Specifications.aspx.
American Society of Heating, Refrigerating, and Air Conditioning Engineers. www.ashrae.org.
American Society of Mechanical Engineers. Standards & Certification FAQ. www.asme.org/kb/standards/about-codes---standards.
AWE. Standards & Codes for Water Efficiency. www.allianceforwaterefficiency.org/Codes_and_Standards_Home_Page.aspx.
Ceres. Ceres Aqua Gauge. www.ceres.org/issues/water/aqua-gauge/aqua-gauge.
Consortium for Energy Efficiency, Inc. www.cee1.org.
31 Florida Department of Environmental Protection. Green Lodging Designation Program. www.dep.state.fl.us/greenlodging/default.htm.32 AWE. Green Building Guidelines & Standards, op.cit.33 EPA’s WaterSense program. WaterSense Rebate Finder. www.epa.gov/watersense/rebate_finder_saving_money_water.html.34 EPA and DOE’s ENERGY STAR. Special Offers and Rebates from ENERGY STAR Partners. www.energystar.gov/index.cfm?fuseaction=rebate.rebate_locator.

2-22 October 2012
2.5 Codes, Standards, and Voluntary Programs for Water Efficiency
DOE, Energy Efficiency & Renewable Energy, Federal Energy Management Program. Energy Management Requirements by Law and Regulation. www1.eere.energy.gov/femp/regulations/requirements_by_reg.html.
EPA and DOE’s ENERGY STAR. www.energystar.gov.
EPA’s WaterSense program. www.epa.gov/watersense.
Green Building Initiative. www.thegbi.org.
International Association of Plumbing and Mechanical Officials. 2012 Green Plumbing and Mechanical Code Supplement. iapmomembership.org/index.php?option=com_virtuemart&page=shop.product_details&flypage=flypage_iapmo.tpl&product_id=213&Itemid=3.
International Code Council. 2012 International Green Construction Code.™ www.iccsafe.org/Store/Pages/Product.aspx?id=3750S12.
Pacific Institute. August 2012. The CEO Water Mandate: Corporate Water Disclosure Guidelines Toward a Common Approach to Reporting Water Issues. pacinst.org/reports/corporate_water_disclosure_guidelines/full_report.pdf.
U.S. Green Building Council. www.usgbc.org.

Table of Contents3.1 Introduction to Sanitary Fixtures
and Equipment ...................................................... 3-2
3.2 Toilets ........................................................................ 3-4
3.3 Urinals .....................................................................3-11
3.4 Faucets ....................................................................3-16
3.5 Showerheads ........................................................3-23
3.6 Laundry Equipment ...........................................3-27
Sanitary Fixtures and Equipment
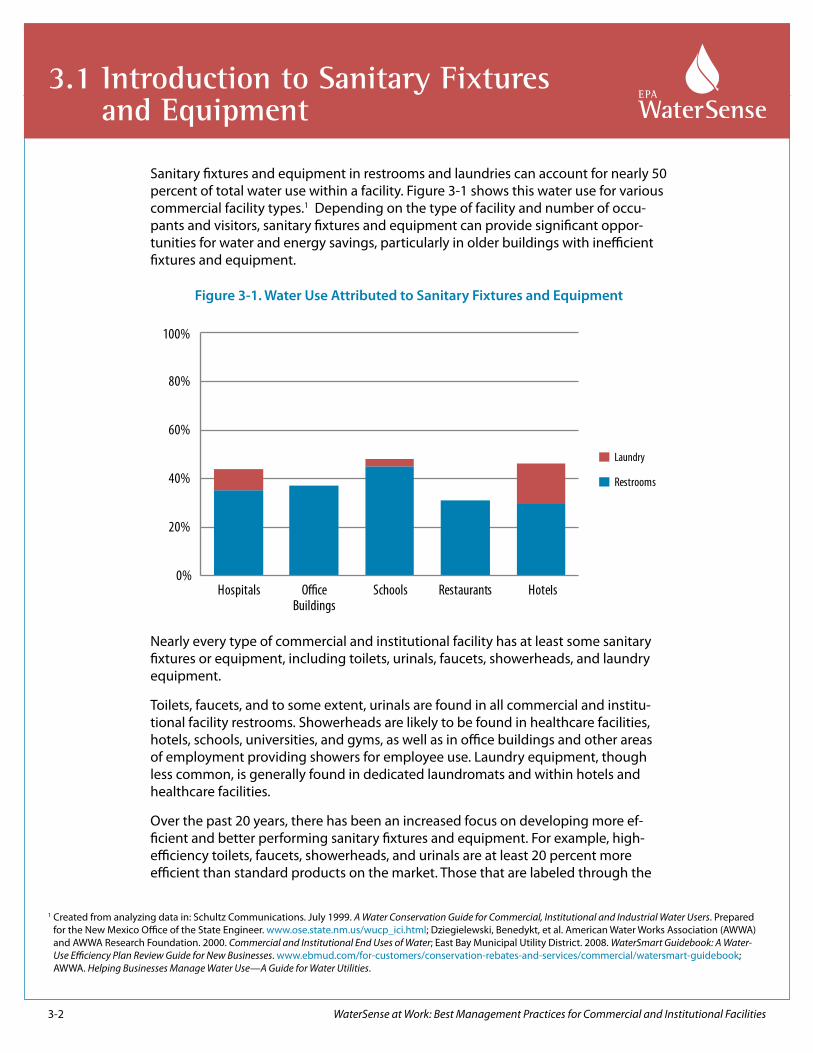
3-2 WaterSense at Work: Best Management Practices for Commercial and Institutional Facilities
3.1 Introduction to Sanitary Fixtures and Equipment
Sanitary fixtures and equipment in restrooms and laundries can account for nearly 50 percent of total water use within a facility. Figure 3-1 shows this water use for various commercial facility types.1 Depending on the type of facility and number of occu-pants and visitors, sanitary fixtures and equipment can provide significant oppor-tunities for water and energy savings, particularly in older buildings with inefficient fixtures and equipment.
Figure 3-1. Water Use Attributed to Sanitary Fixtures and Equipment
Nearly every type of commercial and institutional facility has at least some sanitary fixtures or equipment, including toilets, urinals, faucets, showerheads, and laundry equipment.
Toilets, faucets, and to some extent, urinals are found in all commercial and institu-tional facility restrooms. Showerheads are likely to be found in healthcare facilities, hotels, schools, universities, and gyms, as well as in office buildings and other areas of employment providing showers for employee use. Laundry equipment, though less common, is generally found in dedicated laundromats and within hotels and healthcare facilities.
Over the past 20 years, there has been an increased focus on developing more ef-ficient and better performing sanitary fixtures and equipment. For example, high-efficiency toilets, faucets, showerheads, and urinals are at least 20 percent more efficient than standard products on the market. Those that are labeled through the
1 Created from analyzing data in: Schultz Communications. July 1999. A Water Conservation Guide for Commercial, Institutional and Industrial Water Users. Prepared for the New Mexico Office of the State Engineer. www.ose.state.nm.us/wucp_ici.html; Dziegielewski, Benedykt, et al. American Water Works Association (AWWA) and AWWA Research Foundation. 2000. Commercial and Institutional End Uses of Water; East Bay Municipal Utility District. 2008. WaterSmart Guidebook: A Water-Use Efficiency Plan Review Guide for New Businesses. www.ebmud.com/for-customers/conservation-rebates-and-services/commercial/watersmart-guidebook; AWWA. Helping Businesses Manage Water Use—A Guide for Water Utilities.
0%
20%
40%
60%
80%
100%
Laundry
Restrooms

October 2012 3-3
U.S. Environmental Protection Agency’s (EPA’s) WaterSense® program are tested and certified for performance as well. EPA and the U.S. Energy Department’s ENERGY STAR® qualified commercial coin- or card-operated washers are 37 percent more energy- and water-efficient than standard washers. In addition, the advent of ozone and wash water recycling systems provides significant water and energy savings op-portunities for larger, more industrial types of laundry equipment.
Section 3: Sanitary Fixtures and Equipment of WaterSense at Work provides an overview of and guidance for effectively reducing the water use of:
• Toilets • Urinals • Faucets • Showerheads • Laundry equipment
3.1 Introduction to Sanitary Fixtures and Equipment
Sanitary Fixtures Case Study
To learn how the Holiday Inn near the San Antonio Airport in Texas saved 7 million gallons of water and an estimated 330,000 kilowatt-hours of energy per year by installing high-efficiency toilets, faucet aerators, and showerheads, read the case study in Appendix A.

3-4 WaterSense at Work: Best Management Practices for Commercial and Institutional Facilities
OverviewToilets, or water closets, can be found in nearly every commercial and institutional fa-cility. Several types of toilet technologies are installed in commercial and institutional settings, including tank-type toilets, flushometer-valve toilets, and less commonly, composting toilets. Toilets currently on the market can perform well (i.e., adequately clear waste) while using less water than older models installed before the Energy Policy Act (EPAct) of 1992 maximum flush volume requirements were established.
Tank-type toilets are designed with tanks that store and dispense water to the toilet bowl to flush waste. Varieties of tank-type toilets include the standard gravity type (found in most homes), pressure-assist (or flushometer-tank toilets), and electro- mechanical hydraulic toilets. Tank-type toilets are available as single, constant- volume flushing models or as dual-flush models, which include a full flush for solids and a reduced flush for liquids. Tank-type toilets are commonly found in residential and light commercial settings.
Flushometer-valve toilets are tankless fixtures with ei-ther wall- or floor-mounted bowls attached to a lever- or sensor-activated flushometer valve that releases a specific volume of water at a high flow rate directly from the water supply line to the bowl to remove (i.e., flush) waste. Unlike tank-type toilets, which store water in the tank to provide the necessary pressure and flow to remove waste from the bowl, flushometer-valve toilets rely on larger diameter water supply piping and high water supply line pressures to remove waste. These fixtures are also available as single, constant-volume flushing models, or as dual-flush models. Flushometer-valve toilets are used predominantly in public-use facilities and high-use commercial settings. Flushome-ter-valve toilets include blowout and rear discharge toilets, which have bowls that remove waste slightly differently than standard siphonic bowls.
Flushometer-valve toilets can be equipped with electronic sensors, which trigger the flushing mechanism when a user has finished using the fixture. Sensors themselves provide no additional water-efficiency benefits; however, they provide health and sanitation benefits in public-use facilities since they offer a hands-free option. If not properly
programmed, operated, and maintained, automatic flush sensors can cause double or phantom flushing, which increases the water used at a facility.
EPAct 1992 established the maximum allowable flush volume for gravity tank-type, flushometer tank (or pressure-assist), electromechanical hydraulic, and flushometer-valve toilets sold in the United States at 1.6 gallons per flush (gpf ). The maximum flush volume for blowout toilets, which are used primarily in locations subject to high traffic or heavy use such as prisons, was set at 3.5 gpf. Due to the long, useful life of
3.2 Toilets
Flushometer-valve toilet
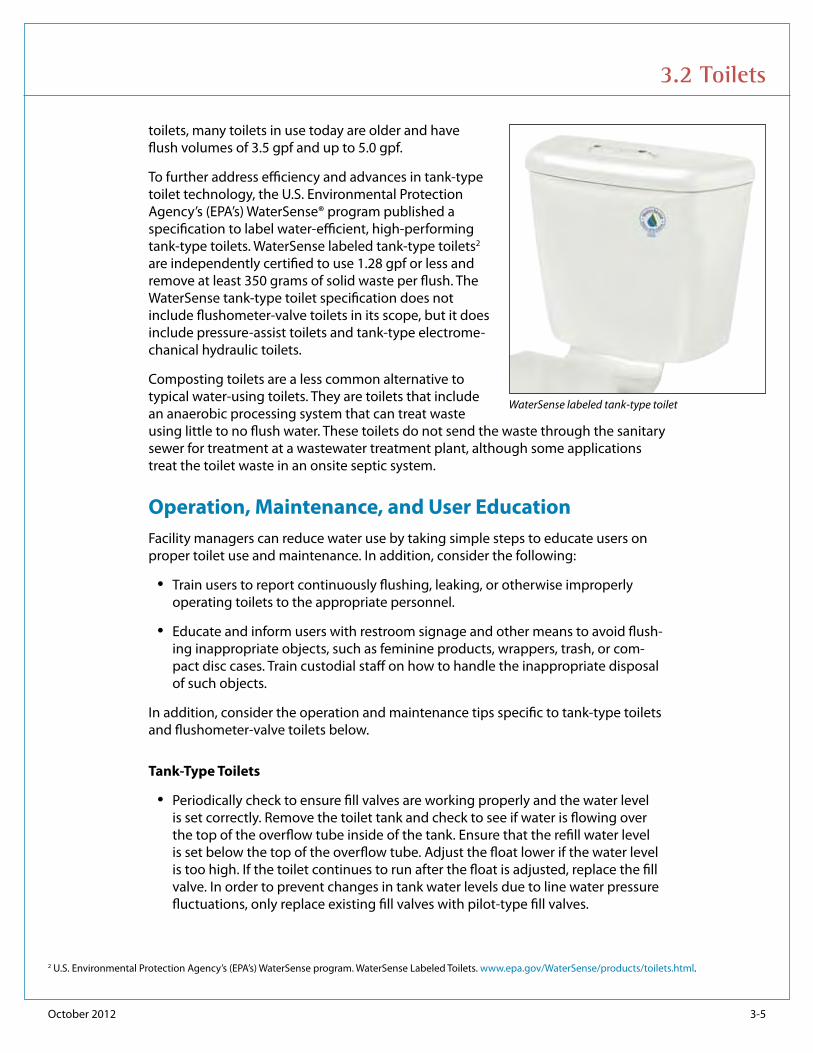
October 2012 3-5
toilets, many toilets in use today are older and have flush volumes of 3.5 gpf and up to 5.0 gpf.
To further address efficiency and advances in tank-type toilet technology, the U.S. Environmental Protection Agency’s (EPA’s) WaterSense® program published a specification to label water-efficient, high-performing tank-type toilets. WaterSense labeled tank-type toilets2 are independently certified to use 1.28 gpf or less and remove at least 350 grams of solid waste per flush. The WaterSense tank-type toilet specification does not include flushometer-valve toilets in its scope, but it does include pressure-assist toilets and tank-type electrome-chanical hydraulic toilets.
Composting toilets are a less common alternative to typical water-using toilets. They are toilets that include an anaerobic processing system that can treat waste using little to no flush water. These toilets do not send the waste through the sanitary sewer for treatment at a wastewater treatment plant, although some applications treat the toilet waste in an onsite septic system.
Operation, Maintenance, and User EducationFacility managers can reduce water use by taking simple steps to educate users on proper toilet use and maintenance. In addition, consider the following:
• Train users to report continuously flushing, leaking, or otherwise improperly operating toilets to the appropriate personnel.
• Educate and inform users with restroom signage and other means to avoid flush-ing inappropriate objects, such as feminine products, wrappers, trash, or com-pact disc cases. Train custodial staff on how to handle the inappropriate disposal of such objects.
In addition, consider the operation and maintenance tips specific to tank-type toilets and flushometer-valve toilets below.
Tank-Type Toilets
• Periodically check to ensure fill valves are working properly and the water level is set correctly. Remove the toilet tank and check to see if water is flowing over the top of the overflow tube inside of the tank. Ensure that the refill water level is set below the top of the overflow tube. Adjust the float lower if the water level is too high. If the toilet continues to run after the float is adjusted, replace the fill valve. In order to prevent changes in tank water levels due to line water pressure fluctuations, only replace existing fill valves with pilot-type fill valves.
3.2 Toilets
WaterSense labeled tank-type toilet
2 U.S. Environmental Protection Agency’s (EPA’s) WaterSense program. WaterSense Labeled Toilets. www.epa.gov/WaterSense/products/toilets.html.

3-6 October 2012
• Annually test toilets to ensure the flappers are not worn or allowing water to seep from the tank into the bowl and down the sewer. Drop a dye tablet or several drops of diluted food coloring in the tank. After 10 minutes, see if the dye has leaked into the bowl. Flush the toilet immediately after conducting this test to ensure the dye does not stain the tank or bowl. If there is a leak, check for a tangled chain in the tank or replace a worn flapper valve. If leaking does not subside after a flapper valve is replaced, consider replacing the flapper seat and overflow tub assembly, which could also be worn.
• Learn more by watching leak detection and repair videos3 posted on the South-ern Nevada Water Authority website.
Flushometer-Valve Toilets
• At least annually, inspect diaphragm or piston valves and replace any worn parts. To determine if the valve is in need of replacement, determine the time it takes to complete a flush cycle. A properly functioning 1.6 gpf flush valve should not have a flush cycle longer than four seconds.
• If replacing valve inserts, make sure the replacements are consistent with the valve manufacturer’s specifications, including the rated flush volume. If replacing the entire valve, make sure it has a rated flush volume consistent with manufac-turer specifications for the existing bowl.
• Periodically check to ensure the control stop (which regulates the flow of water from the inlet pipe to the flushometer valve and is necessary for shutting off the flow of water during maintenance and replacement of the bowl or valve) is set to fully open during normal operation.
• Upon installation of a flushometer-valve toilet, adjust the flush volume following manufacturer’s instructions to ensure optimum operation for the facility’s specific conditions. Periodically inspect the flush volume adjustment screw to ensure the flush volume setting has not been modified from the original settings; if it has, it could change the water use and performance of the product.
• Ensure that the line pressure serving the flushometer-valve toilet meets the mini-mum requirements specified by the fixture manufacturer.
• If installed, check and adjust automatic sensors to ensure proper settings and operation to avoid double or phantom flushing.
Retrofit OptionsTo retrofit an existing toilet to increase water efficiency, consider the following op-tions for tank-type and flushometer-valve toilets.
3 Southern Nevada Water Authority. How to Find a Leak. www.snwa.com/3party/find_leak/main.html.
3.2 Toilets

October 2012 3-7
Tank-Type Toilets
In general, avoid retrofitting existing tank-type toilets with displacement dams or bags, early-closing toilet flappers, or valves with different flush volumes, as these devices could impede overall performance and require increased operation and maintenance. In addition, the use of these devices and other retrofit products could void manufacturer warranties.
Flushometer-Valve Toilets
In general, it is best to avoid retrofit options, such as valve inserts, that reduce the flush volume of flushom-eter-valve toilets. These products might not provide the expected performance if the original bowl is not designed to handle a reduced flush volume. In addi-tion, the use of these devices could void manufacturer warranties.
Dual-flush conversion devices are available for flush-ometer-valve toilets. These devices usually replace the
existing flush valve handle with a handle that provides a reduced flush volume for liquids and a standard flush for solids. When considering this type of retrofit, verify that the product has been certified to either American Society of Mechanical Engi-neers (ASME) A112.19.10, Dual-Flush Devices for Water Closets, or International Asso-ciation of Plumbing and Mechanical Officials (IAPMO) PS 50-2008, Flush Valves With Dual-Flush Device for Water Closets or Water Closet Tanks with Integral Flush Valves with a Dual-Flush Device. In addition, before initiating a full-scale retrofit, test the product on a select number of toilets to verify it achieves and maintains the desired performance.
Replacement OptionsIf installing a new toilet or replacing an older, inefficient toilet, consider the following replacement options.
Tank-Type Toilets
When installing new tank-type toilets or replacing older, inefficient tank-type toilets, choose WaterSense labeled models.4 WaterSense labeled tank-type toilets are inde-pendently certified to have an effective flush volume of 1.28 gpf or less and pass a performance test to remove at least 350 grams or more of solid waste per flush.
Flushometer-Valve Toilets
When installing new or replacing older, inefficient flushometer-valve toilets, choose models that are designed to use 1.6 gpf or less. If considering 1.28 gpf or less flushometer-valve toilets, including dual-flush models, carefully evaluate the physi-cal conditions of existing drainlines and the availability of supplemental water flow
4 EPA’s WaterSense program, op. cit.
Dual-flush toilet handle
3.2 Toilets

3-8 October 2012
upstream from the toilet fixtures to make sure that the conditions are appropriate for effective waste transport.
For maximum water savings and performance, purchase the flushometer valve and bowl in hydraulically matched combinations that are compatible in terms of their designed flush volume.
Composting Toilets
Consider installing composting toilets in facilities where connecting to a plumbing system is cost-prohibitive or unavailable.
Savings PotentialWater savings can be achieved by replacing existing tank-type and flushometer-valve toilets. To estimate facility-specific water savings and payback, use the following information.
Tank-Type Toilet Replacement
Current Water Use
To estimate the current water use of an existing tank-type toilet, identify the follow-ing information and use Equation 3-1:
• Flush volume of the existing tank-type toilet. Toilets installed starting in the mid-1970s typically have standard flush volumes of 3.5 gpf or 5.0 gpf.5 Toilets installed in 1994 or later have standard flush volumes of 1.6 gpf.
• Average number of times the toilet is flushed per day, which will be dependent on the facility’s male-to-female ratio. Female building occupants use the toilet three times per day on average, while male building occupants use the toilet once per day on average.6
• Days of facility operation per year.
Equation 3-1. Water Use of Toilet (gallons per year)
= Toilet Flush Volume x Number of Flushes x Days of Facility Operation
Where:
• Toilet Flush Volume (gallons per flush) • Number of Flushes (flushes per day) • Days of Facility Operation (days per year)
5 North Carolina Department of Environment and Natural Resources, et al. May 2009. Water Efficiency Manual for Commercial, Industrial and Institutional Facilities. Page 28. savewaternc.org/bushome.php.
6 Vickers, Amy. 2001. Handbook of Water Use and Conservation. WaterPlow Press.
3.2 Toilets

October 2012 3-9
Water Use After Replacement
To estimate the water use of a WaterSense labeled replacement tank-type toilet, use Equation 3-1, substituting the flush volume of the replacement tank-type toilet. Wa-terSense labeled toilets use no more than 1.28 gpf on average.
Water Savings
To calculate the water savings that can be achieved from replacing an existing tank-type toilet, identify the following information and use Equation 3-2:
• Current water use as calculated using Equation 3-1. • Water use after replacement as calculated using Equation 3-1.
Equation 3-2. Water Savings From Toilet Replacement (gallons per year)
= Current Water Use of Toilet – Water Use of Toilet After Replacement
Where:
• Current Water Use of Toilet (gallons per year) • Water Use of Toilet After Replacement (gallons per year)
Payback
To calculate the simple payback from the water savings associated with replacing an existing tank-type toilet, consider the equipment and installation cost of the replace-ment tank-type toilet, the water savings as calculated using Equation 3-2, and the facility-specific cost of water and wastewater.
Flushometer-Valve Toilet Replacement
Current Water Use
To estimate the current water use of an existing flushometer-valve toilet, use Equa-tion 3-1, substituting the flush volume of the existing flushometer-valve toilet. Toilets installed starting in the mid-1970s typically have standard flush volumes of 3.5 gpf or 5.0 gpf.7 Toilets installed in 1994 or later have standard flush volumes of 1.6 gpf.
Water Use After Replacement
To estimate the water use of a replacement flushometer-valve toilet, use Equation 3-1, substituting the flush volume of the replacement flushometer-valve toilet.
7 North Carolina Department of Environment and Natural Resources, et al., op. cit.
3.2 Toilets

3-10 October 2012
Water Savings
To calculate water savings that can be achieved from replacing an existing flushome-ter-valve toilet, use Equation 3-2.
Payback
To calculate the simple payback from the water savings associated with replacing an existing flushometer-valve toilet, consider the equipment and installation cost of the replacement flushometer-valve toilet, the water savings as calculated using Equation 3-2, and the facility-specific cost of water and wastewater.
Additional ResourcesAlliance for Water Efficiency. Toilet Fixtures Introduction. www.allianceforwaterefficiency.org/toilet_fixtures.aspx.
EPA’s WaterSense program. WaterSense Labeled Toilets. www.epa.gov/watersense/products/toilets.html.
North Carolina Department of Environment and Natural Resources, et al. May 2009. Water Efficiency Manual for Commercial, Industrial and Institutional Facilities. Pages 27–33. savewaternc.org/bushome.php.
Schultz Communications. July 1999. A Water Conservation Guide for Commercial, Insti-tutional and Industrial Users. Prepared for the New Mexico Office of the State Engi-neer. Pages 33–36. www.ose.state.nm.us/wucp_ici.html.
Southern Nevada Water Authority. How to Find a Leak in Your Toilet. www.snwa.com/3party/find_leak/section4.html.
3.2 Toilets

WaterSense at Work: Best Management Practices for Commercial and Institutional Facilities 3-11
OverviewA urinal is defined in the applicable national standard for urinals as “a plumbing fix-ture that receives only liquid waste and conveys the waste through a trap seal into a gravity drainage system.”8 Flushing urinals use water to remove (i.e., flush) the liquid waste from the fixture. Flushing urinals use a variety of different technologies. Wash-down or washout urinals require the activation of a flushometer valve. Gravity tank-type urinals, which are less common, rely on the release of water stored in an in-wall cistern to provide the necessary water pressure and flow to remove waste from the urinal, similar to the operation of a gravity tank-type toilet. Siphonic jet urinals have an elevated flush tank and operate by using a siphon device to automatically dis-charge the tank’s contents when the water level in the tank reaches a certain height. This type of urinal requires no user activation.
Flushing urinals can be equipped with electronic sensors that activate the flushing mechanism when a user has finished using the fixture. Automatic flush sensors provide no additional water-efficiency benefits. They do, however, provide health and sanitation benefits in public-use facilities because they offer a hands-free option. Al-though, if not properly operated, automatic flush sensors can cause double or phantom flushing, actually increasing the water used at a facility.
Flushing urinals come in two basic types—standard, single-user fixtures and trough-type, multi-user fixtures. Trough-
type urinals are large fixtures designed for multiple users in high-traffic places, such as stadiums and sports arenas. Trough urinals are sold in 36-, 48-, 60-, and 72-inch lengths. Some older models were designed to run continuously and, consequently, consumed large amounts of water. New trough urinals either use flushometer valves on preset timers or are equipped with electronic sensors.
Some urinals do not use water to flush the liquid waste from the fixture. A non-water urinal is “a plumbing fixture that is designed to receive and convey only liquid waste through a trap seal into the gravity drainage system without the use of water for such function.”9
Non-water urinals use a specially designed trap that allows liquid waste to drain out of the fixture, through a trap seal, and into the drainage system. Many non-water
3.3 Urinals
8 American Society of Mechanical Engineers (ASME), Canadian Standards Association (CSA). August 2008. ASME A112.19.2-2008/CSA B45.1-08, Ceramic Plumbing Fixtures.
9 International Association of Plumbing and Mechanical Officials (IAPMO). February 19, 2004. IAPMO Z124.9-2004, American National Standard for Plastic Urinal Fixtures.
Flushing urinal

3-12 October 2012
urinals on the market today use a cartridge that contains a liquid barrier seal to pre-vent the escape of odors and sewer gases. Other models feature cartridge-less de-signs that use a liquid barrier seal in the urinal’s trap. A third type uses a self-sealing mechanical waste valve trap that does not require a liquid barrier seal. U.S. plumbing codes currently prohibit these self-sealing mechanical trap designs.
The Energy Policy Act (EPAct) of 1992 established the maximum allowable flush volume for all urinals sold in the United States starting in 1994 as 1.0 gallons per flush (gpf ). Many urinals in facilities nationwide were installed prior to 1994, and thus flush higher than the 1.0 gpf standard, often between 1.5 and 3.5 gpf.
To address efficiency and advances in flushing urinal technology, the U.S. Environ-mental Protection Agency’s (EPA’s) WaterSense® program published a specification to label water-efficient, high-performing flushing urinals. WaterSense labeled flushing urinals10 are independently certified to use 0.5 gpf or less, while still achieving equal or superior performance in removing liquid waste.
Operation, Maintenance, and User EducationFor optimum urinal efficiency, consider the following tips specific to flushing urinals and non-water urinals.
Flushing Urinals
• At least annually, inspect diaphragm or piston valves and replace any worn parts. If replacing valve inserts, make sure the replacements are consistent with the valve manufacturer’s specifications, including the rated flush volume. If replacing the entire valve, make sure it has a rated flush volume consistent with manufac-turer specifications for the existing urinal fixture.
• Annually check and adjust automatic sensors, if installed, to ensure they are op-erating properly to avoid double or phantom flushing.
• Flushing urinals equipped with automatic flush sensors often will have an over-ride switch, allowing maintenance personnel to manually activate the flush. Activating the override switch may release a larger volume of water than is typi-cal for the standard flush. Train cleaning and maintenance personnel on how to effectively clean and maintain urinals with automatic flush sensors to ensure that the urinal is returned to its intended flush volume after maintenance operations are completed.
• Train users to report continuously flushing, leaking, or otherwise improperly operating urinals to the appropriate personnel.
Non-Water Urinals
If non-water urinals are selected for the facility, regularly clean and replace the seal cartridges or other materials as specified by the manufacturer and follow all other
3.3 Urinals
10 U.S. Environmental Protection Agency’s (EPA’s) WaterSense program. WaterSense Labeled Urinals. www.epa.gov/watersense/products/urinals.html.

October 2012 3-13
manufacturer-provided guidance. Proper maintenance is vital to the long-term per-formance of non-water urinals.
Retrofit OptionsIn general, avoid retrofit options to reduce the flush volume of valves, including valve inserts that have a lower flush volume, unless the inserts are rated to provide a flush volume that is compatible with the existing urinal fixture. Confirm compatibility with the urinal fixture manufacturer, as many new urinal fixture models are designed to function at several different flush volumes. If the flush volume of the valve insert is not compatible with the urinal fixture, it may not provide the expected performance, especially if the original equipment is not designed to handle a reduced flush vol-ume.
Replacement OptionsWhen installing new flushing urinals or replacing older, inefficient flushing urinals, choose WaterSense labeled models.11 WaterSense labeled flushing urinals have been independently certified to use no more than 0.5 gpf, which is at least 50 per-cent more water-efficient than standard flushing urinals on the market. In addition, WaterSense labeled flushing urinals must meet specific criteria for flush performance and drain trap functionality and are designed to be non-adjustable above their rated flush volume. These features provide for the longevity of water savings. The specifica-tion is applicable to the following devices:
• Urinal fixtures that receive liquid waste and use water to convey the waste through a trap seal into a gravity drainage system.
• Pressurized flushing devices that deliver water to urinal fixtures.
• Flush tank (gravity type) flushing devices that deliver water to urinal fixtures.
To ensure high performance and water savings, choose a valve and fixture combina-tion with matching rated flush volumes.
Non-water urinals can also be considered during urinal installation or replacement. When looking to install non-water urinals and very low volume flushing urinals (e.g., 1.0 pint per flush urinals), consider the condition and design of the existing plumb-ing system and the expected usage patterns in order to ensure that these products will provide the anticipated performance. As a good rule of practice, adhere to the guidelines outlined in the International Association of Plumbing and Mechanical Officials (IAPMO) Green Plumbing and Mechanical Code Supplement,12 which requires at least one water supply fixture unit (i.e., a faucet) to be installed on the drainline up-stream of the fixtures to facilitate drainline flow and rinsing. Supplemental water or even periodic manual flushing of the drainlines is important because these products have little to no water going through the drain to flush out any solids that may build
3.3 Urinals
11 Ibid.12 IAPMO. February 2010. Green Plumbing & Mechanical Code Supplement. Page 9. www.iapmo.org/pages/iapmo_green.aspx.
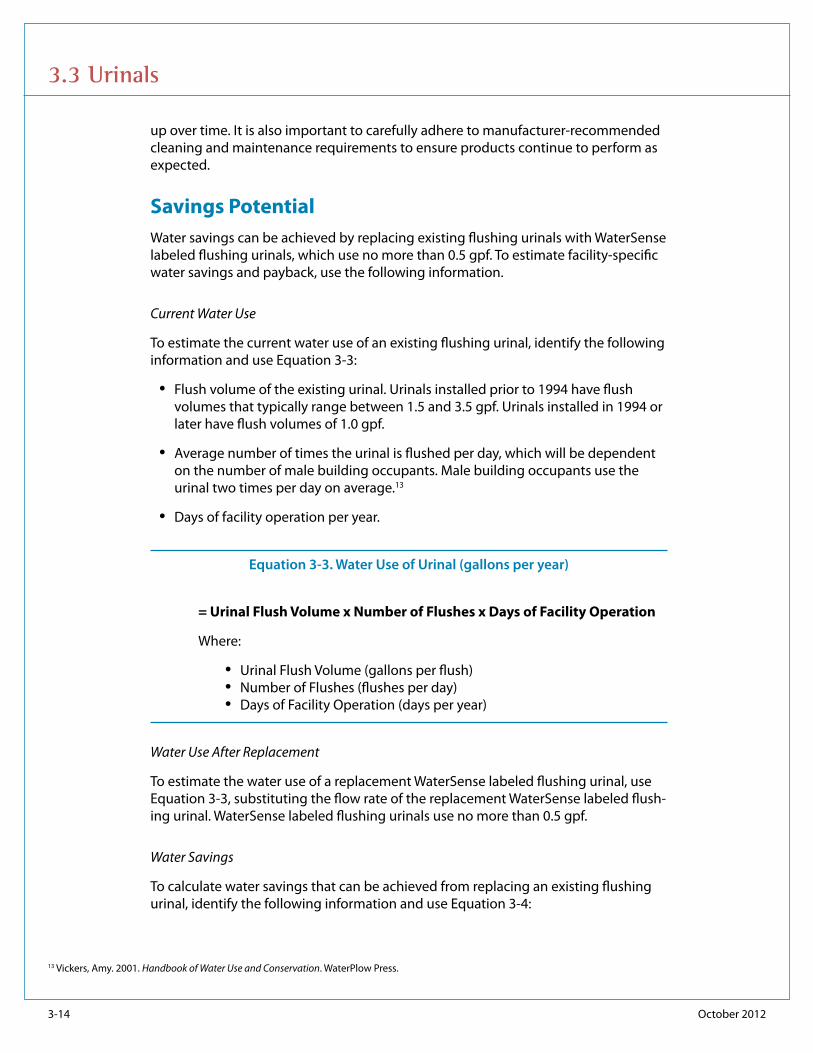
3-14 October 2012
up over time. It is also important to carefully adhere to manufacturer-recommended cleaning and maintenance requirements to ensure products continue to perform as expected.
Savings PotentialWater savings can be achieved by replacing existing flushing urinals with WaterSense labeled flushing urinals, which use no more than 0.5 gpf. To estimate facility-specific water savings and payback, use the following information.
Current Water Use
To estimate the current water use of an existing flushing urinal, identify the following information and use Equation 3-3:
• Flush volume of the existing urinal. Urinals installed prior to 1994 have flush volumes that typically range between 1.5 and 3.5 gpf. Urinals installed in 1994 or later have flush volumes of 1.0 gpf.
• Average number of times the urinal is flushed per day, which will be dependent on the number of male building occupants. Male building occupants use the urinal two times per day on average.13
• Days of facility operation per year.
Equation 3-3. Water Use of Urinal (gallons per year)
= Urinal Flush Volume x Number of Flushes x Days of Facility Operation
Where:
• Urinal Flush Volume (gallons per flush) • Number of Flushes (flushes per day) • Days of Facility Operation (days per year)
Water Use After Replacement
To estimate the water use of a replacement WaterSense labeled flushing urinal, use Equation 3-3, substituting the flow rate of the replacement WaterSense labeled flush-ing urinal. WaterSense labeled flushing urinals use no more than 0.5 gpf.
Water Savings
To calculate water savings that can be achieved from replacing an existing flushing urinal, identify the following information and use Equation 3-4:
3.3 Urinals
13 Vickers, Amy. 2001. Handbook of Water Use and Conservation. WaterPlow Press.

October 2012 3-15
• Current water use as calculated using Equation 3-3. • Water use after replacement as calculated using Equation 3-3.
Equation 3-4. Water Savings From Urinal Replacement (gallons per year)
= Current Water Use of Urinal – Water Use of Urinal After Replacement
Where:
• Current Water Use of Urinal (gallons per year) • Water Use of Urinal After Replacement (gallons per year)
Payback
To calculate the simple payback from the water savings associated with replacing an existing flushing urinal, consider the equipment and installation cost of the replace-ment flushing urinal, the water savings as calculated in Equation 3-4, and the facility-specific cost of water and wastewater.
Additional ResourcesAlliance for Water Efficiency. Urinal Fixtures Introduction. www.allianceforwaterefficiency.org/Urinal_Fixtures_Introduction.aspx.
EPA’s WaterSense program. WaterSense Labeled Urinals. www.epa.gov/watersense/products/urinals.html.
North Carolina Department of Environment and Natural Resources, et al. May 2009. Water Efficiency Manual for Commercial, Industrial and Institutional Facilities. Pages 31–34. savewaternc.org/bushome.php.
Schultz Communications. July 1999. A Water Conservation Guide for Commercial, Insti-tutional and Industrial Users. Prepared for the New Mexico Office of the State Engi-neer. Pages 33–36. www.ose.state.nm.us/wucp_ici.html.
3.3 Urinals

3-16 WaterSense at Work: Best Management Practices for Commercial and Institutional Facilities
OverviewFaucets can be found in restrooms, kitchens, break rooms, and service areas in all commercial and institutional buildings. Lavatory (i.e., restroom) faucets are designed for either private or public use. Private-use faucets are generally found in homes, ho-tel guest rooms, dorms, barracks, and hospital rooms. Public-use lavatory faucets are those intended for unrestricted use by more than one individual (i.e., employees, visi-tors, other building occupants) in facilities, such as public restrooms in offices, malls, schools, restaurants, or other commercial, industrial, and institutional buildings.
When it comes to improving faucet water efficiency in these lavatories, there are two different ways to apply technology: optimizing faucets and using faucet accessories. A faucet accessory is defined as a component that can be added, removed, or re-
placed easily and, when removed, does not prevent the faucet from functioning properly.14 Faucet accessories include flow restrictors, flow regulators, aera-tors, and laminar flow devices. While faucet accessories can be incorporated into new faucet design to control the flow rate, most often, accessories are external components that screw onto an existing faucet’s end spout.
In addition to typical, hand-operated components, lavatory faucets can also be equipped with automatic sensors to trigger the on/off mechanism when users place their hands under and remove them from the fixture. Depend-ing on use patterns before installation,
appropriately programmed automatic sensors may or may not provide additional water savings.15 In most cases, automatic sensors open the faucet valve completely when in use, whereas users of manually controlled faucets typically do not turn the tap fully on. Some jurisdictions might mandate the use of automatic sensors by code in certain applications. Automatic sensors can provide health and sanitation benefits in public-use facilities, since they are a hands-free option. However, recent research suggests that automatic sensor faucets might be more likely to be contaminated with Legionella, compared to old-style fixtures with separate handles for hot and cold water. This might be because the electronic faucet technology has more surfaces for the bacteria to become trapped and grow, or it might be because of the low flow rate of the faucets tested.16 The American Society of Heating, Refrigerating, and Air Condi-tioning Engineers, Inc. (ASHRAE) is currently developing a standard to protect users.
3.4 Faucets
14 American Society of Mechanical Engineers (ASME), Canadian Standards Association (CSA). June 2011. ASME A112.18.1/CSA B125.1 Plumbing Supply Fittings.15 Gauley, Bill and Koeller, John. March 2010. Sensor-Operated Plumbing Fixtures: Do They Save Water? www.map-testing.com/assets/files/hillsborough~study.pdf.16 Johns Hopkins Medicine. March 31, 2011. “Latest Hands-Free Electronic Water Faucets Found to Be Hindrance, Not Help, in Hospital Infection Control.” www.
hopkinsmedicine.org/news/media/releases/latest_hands_free_electronic_water_faucets_found_to_be_hindrance_not_help_in_hospital_infection_control.
Faucet accessory (aerator)

October 2012 3-17
Once finalized, the Proposed New Standard 188, Prevention of Legionellosis Associated with Building Water Systems can assist building owners and managers in reducing the risk of legionellosis by specifying a practice to identify the conditions in a build-ing water system that can be made less favorable to the growth and transmission of Legionella.17 In addition, medical facilities should consider facility-specific health and safety needs before installing low-flow faucets or faucets with automatic sensors. For example, medical facilities might want to install laminar flow devices instead of fau-cet aerators. Since laminar flow faucets do not inject air into the water, there might be a lower risk of bacterial contamination.
Some restrooms can also be equipped with metered or self-closing faucets. Metered faucets, when activated by the user, dispense a preset amount of water before shut-ting off. Self-closing faucets, operated with a spring-loaded knob, automatically shut the water off when the user releases the knob.
The standard flow rate of a faucet is dictated by its intended end use, as described below.
Private-Use Lavatory Faucets
To promote and enhance the market for water-efficient, private-use lavatory faucets, the U.S. Environmental Protection Agency’s (EPA’s) WaterSense® program has pub-lished a specification to label water-efficient, high-performing residential lavatory faucets and faucet accessories. WaterSense labeled lavatory faucets and faucet accessories18 are independently certified to use between 0.8 gallons per minute (gpm) at 20.0 pounds per square inch (psi) and 1.5 gpm at 60.0 psi, which is 20 percent less than the federal standard.
Public-Use Lavatory Faucets
The Energy Policy Act (EPAct) of 1992 address-es metered faucets found in public restrooms and sets a maximum water use of 0.25 gallons per cycle (gpc).
The American Society of Mechanical Engineers (ASME) A112.18.1/Canadian Standards Asso-ciation (CSA) B125.1 specifies a maximum flow rate of 0.5 gpm at 60.0 psi for non-metered public-use lavatory faucets. Although not
17 American Society of Heating, Refrigerating, and Air Conditioning Engineers (ASHRAE). June 2011. Proposed Standard P188, Prevention of Legionellosis Associated with Building Water Systems.
18 U.S. Environmental Protection Agency’s (EPA’s) WaterSense program. WaterSense Labeled Sink Faucets & Accessories. www.epa.gov/watersense/products/bathroom_sink_faucets.html.
3.4 Faucets
Faucet aerator, 0.5 gpm

3-18 October 2012
a federal regulation, the ASME/CSA standard has been incorporated into both the International Plumbing Code (IPC) and the Uniform Plumbing Code (UPC), two of the major plumbing codes adopted in many states and jurisdictions across the United States. Despite code requirements, many public-use faucets still have higher flow rates, typically between 2.0 and 2.5 gpm.
Kitchen Faucets
The U.S. Energy Department (DOE) adopted a 2.2 gpm at 60.0 psi maximum flow rate standard for all faucets, including kitchen faucets, in 1998 (see 63 FR 13307; March 18, 1998). This national standard is codified in the U.S. Code of Federal Regulations at 10 CFR Part 430.32. Thus far, codes and voluntary standards have not attempted to further address the efficiency of kitchen sink faucets because their uses may be volume-dependent.
Service Sinks
Sinks present in some facilities have purposes other than traditional kitchen or lavatory uses. These sinks can be found in janitorial closets, laundries, laboratories, classrooms, or other areas. There are no federal regulations limiting the flow rate of these faucets, but flow rate should be carefully considered with the intended end use, expected performance, and water efficiency in mind.
Operation, Maintenance, and User EducationFor optimum faucet efficiency, test the system’s water pressure to make sure that it is between 20 and 80 psi. This level ensures the faucet delivers the expected flow and performance. In addition, consider the following:
• Periodically inspect faucet aerators for scale buildup to ensure flow is not being restricted. Clean or replace the aerator or other spout end device, if necessary.
• If installed, check and adjust automatic sensors to ensure they are operating properly to avoid faucets from running longer than necessary.
• Post materials in restrooms and kitchens to ensure user awareness of the facility’s water-efficiency goals. Remind users to turn off the tap when they are done and to consider turning the tap off during sanitation activities when it is not being used (i.e., when brushing teeth or washing dishes).
• Train users to report continuously running, leaking, or otherwise malfunctioning faucets to the appropriate personnel.
Retrofit OptionsIf looking to retrofit an existing faucet fixture to increase water efficiency, consider the following:
3.4 Faucets

October 2012 3-19
• For lavatory faucet retrofits in public restrooms, install faucet aerators or laminar flow devices that achieve 0.5 gpm.
• For lavatory faucet retrofits in private restrooms, look for WaterSense labeled sink faucets and accessories19 (aerators or laminar flow devices), which have flow rates of 1.5 gpm or less at 60.0 psi and no less than 0.8 gpm at 20.0 psi.
• For kitchen faucet retrofits, install aerators or laminar flow devices that achieve a flow rate of 2.2 gpm.
• Install temporary shut-off or foot-operated valves for kitchen faucets in commer-cial facilities. These valves stop water flow during intermittent activities, such as scrubbing or dishwashing. The water can be reactivated at the previous tempera-ture without the need to remix hot and cold water.
• Medical facilities should consider facility-specific health and safety needs before installing low-flow faucets or faucets with automatic sensors. For example, medi-cal facilities may want to install laminar flow devices instead of faucet aerators; since laminar flow faucets do not inject air into the water, there is a lower risk of bacterial contamination.20
• For service sinks, install retrofit devices that reduce the water flow as much as possible without inhibiting the use of the sink (i.e., if the sink’s function is volume-dependent, do not reduce faucet flow rate to the point that it has to be used significantly longer).
Replacement OptionsIf installing a new faucet fixture, consider the following:
• In public restrooms, install lavatory faucet fixtures that flow at 0.5 gpm (with or without the self-closing feature) or metered faucets that use no more than 0.25 gpc.
• In private restrooms, select WaterSense labeled sink faucets and accessories,21 which have flow rates or 1.5 gpm or less at 60.0 psi and no less than 0.8 gpm at 20.0 psi.
• In kitchens, install faucet fixtures that flow at 2.2 gpm. Consider installing tempo-rary shut-off or foot-operated valves for kitchen faucets in commercial facilities.
• Medical facilities should consider facility-specific health and safety needs before installing low-flow faucets or faucets with automatic sensors. For example, medi-cal facilities may want to install laminar flow devices instead of faucet aerators; since laminar flow faucets do not inject air into the water, there is a lower risk of bacterial contamination.22
3.4 Faucets
19 Ibid.20 U.S. Energy Department (DOE), Energy Efficiency & Renewable Energy (EERE), Federal Energy Management Program (FEMP). Water Management Training, Faucets
and Showerheads.21 EPA’s WaterSense program, op. cit.22 DOE, EERE, FEMP, op. cit.

3-20 October 2012
• For service sinks, install faucets that flow as low as possible without inhibiting the use of the sink (i.e., if the sink’s function is volume-dependent, do not reduce faucet flow rate to the point that it has to be used significantly longer).
Savings PotentialWater savings for both private- and public-use lavatory faucets can be achieved by retrofitting existing faucets with aerators or replacing existing faucets. The same amount of water savings can be expected for a retrofit or replacement, however, retrofitting existing faucets with aerators will yield the shortest payback period due to minimal equipment costs.
To estimate facility-specific water savings and payback, use the following information:
Current Water Use
To estimate the current water use of an existing faucet, identify the following infor-mation and use Equation 3-5:
• Flow rate of the existing faucet. Private- and public-use lavatory faucets installed in 1996 or later have flow rates of 2.2 gpm or less. Some public-use lavatory faucets installed in more recent years may flow at 0.5 gpm. Faucet flow rate is typically inscribed directly on the fixture itself.
• Average daily use time. The average private-use lavatory faucet use is approxi-mately 8.1 minutes per person per day.23 Public-use faucets can be used between 15 seconds and one minute per use, and used three or four times per occupant per day.
• Number of building occupants.
• Days of facility operation per year.
Equation 3-5. Water Use of Faucet (gallons per year)
= Faucet Flow Rate x Daily Use Time x Number of Building Occupants x Days of Facility Operation
Where:
• Faucet Flow Rate (gallons per minute) • Daily Use Time (minutes per person per day) • Number of Building Occupants (persons) • Days of Facility Operation (days per year)
3.4 Faucets
23 Mayer, Peter W., and DeOreo, William B. American Water Works Association (AWWA) and AWWA Research Foundation. 1998. Residential End Uses of Water. Page 95.

October 2012 3-21
Water Use After Retrofit or Replacement
To estimate the water use after retrofitting or replacing an existing faucet with a water-efficient model or aerator, use Equation 3-5, substituting the flow rate of the retrofit or replacement. WaterSense labeled aerators installed in private-use settings use no more than 1.5 gpm. Public-use lavatory faucets can be retrofitted with 0.5 gpm aerators.
Water Savings
To calculate water savings that can be achieved from retrofitting or replacing an existing faucet, identify the following information and use Equation 3-6:
• Current water use as calculated using Equation 3-5. • Water use after retrofit or replacement as calculated using Equation 3-5.
Equation 3-6. Water Savings From Faucet Retrofit or Replacement (gallons per year)
= Current Water Use of Faucet – Water Use of Faucet After Retrofit or Replacement
Where:
• Current Water Use of Faucet (gallons per year) • Water Use of Faucet After Retrofit or Replacement (gallons per year)
Payback
To calculate the simple payback from the water savings associated with the lavatory faucet retrofit or replacement, consider the equipment and installation cost of the retrofit or replacement faucet or aerator, the water savings as calculated using Equa-tion 3-6, and the facility-specific cost of water and wastewater. Aerators typically cost $10 and require no installation cost.
Because faucets use hot water, a reduction in water use will also result in energy savings, further reducing the payback period and increasing replacement cost- effectiveness.
Additional ResourcesAlliance for Water Efficiency. Faucet Fixtures Introduction. www.allianceforwaterefficiency.org/Faucet_Fixtures_Introduction.aspx.
EPA’s WaterSense program. WaterSense Labeled Sink Faucets & Acessories. www.epa.gov/watersense/products/bathroom_sink_faucets.html.
3.4 Faucets

3-22 October 2012
North Carolina Department of Environment and Natural Resources, et al. May 2009. Water Efficiency Manual for Commercial, Industrial and Institutional Facilities. Pages 36–37. savewaternc.org/bushome.php.
Schultz Communications. July 1999. A Water Conservation Guide for Commercial, Insti-tutional and Industrial Users. Prepared for the New Mexico Office of the State Engi-neer. Pages 33–37. www.ose.state.nm.us/wucp_ici.html.
3.4 Faucets

WaterSense at Work: Best Management Practices for Commercial and Institutional Facilities 3-23
OverviewShowerheads come in a variety of shapes, sizes, and configurations, including: fixed showerheads, which are affixed overhead and permanently attached to the wall; handheld showerheads, which have a flexible hose that can be detached from the wall and moved freely by the user; and body sprays (e.g., spas, jets), which spray
water onto the user from a direction other than overhead, usually from a vertical column on the shower wall. Each type is uniquely suited to perform a specific function. In order to reduce overall water use, the Energy Policy Act (EPAct) of 1992 established the maximum allowable flow rate for all showerheads sold in the United States as 2.5 gallons per minute (gpm).
Since this standard was enacted, many showerheads have been designed to use even less water. While these fixtures save water with a lower flow rate, the duration of the shower sometimes increases, resulting in an overall increase water usage. Recent con-sumer market research identified three key performance attributes that are necessary to ensure user satisfaction under a variety of household conditions: flow rate across a range of pressures, spray force, and spray coverage. Each of these criteria can be tested using a specific protocol that measures accuracy and reliability. All three criteria must be met to produce a “satisfactory” shower without using more water.
To address efficiency and advances in showerhead technology, the U.S. Environmental Protection Agency’s (EPA’s) WaterSense® pro-gram has published a specification to label water-efficient, high-
performing showerheads. WaterSense labeled showerheads24 are independently certified to use 2.0 gpm or less, while also meeting or exceeding performance criteria for force and coverage.
Operation, Maintenance, and User EducationFor optimum showerhead efficiency, the system pressure should be tested to make sure that it is between 20 and 80 pounds per square inch (psi). This will ensure that the showerhead will deliver the expected flow and performance. In addition, con-sider the following:
• Verify that the hot and cold water plumbing lines to the showerhead are routed through a shower valve that meets the temperature control performance re-quirements of the American Society of Sanitary Engineers (ASSE) 1016 or Ameri-can Society of Mechanical Engineers (ASME) A112.18.1/Canadian Standards As-sociation (CSA) B125.1 standards when tested at the flow rate of the showerhead installed. This valve will prevent against significant fluctuations in water pressure
3.5 Showerheads
Handheld showerhead
24 U.S. Environmental Protection Agency’s (EPA’s) WaterSense program. WaterSense Labeled Showerheads. www.epa.gov/watersense/products/showerheads.html.

3-24 October 2012
and temperature and can reduce risks of thermal shock and scalding. A plumber can check the compatibility of the showerhead and shower valve and, if neces-sary, install a valve that meets the recommended standards for the flow rate of the showerhead.
• Periodically inspect showerheads for scale buildup to ensure flow is not being restricted. Certain cleaning products are designed to dissolve scale from shower-heads with buildup. Do not attempt to bore holes in the showerhead or manually remove scale buildup, as this can lead to increased water use or cause perfor-mance problems.
• Provide a way for users to track showering time and encourage users to take shorter showers by placing clocks or timers in or near the showers.
• Train users to report leaking or malfunctioning showerheads to the appropriate personnel.
Retrofit OptionsBecause showerheads are relatively inexpensive, replacement is often more eco-nomical and practical than a retrofit. In general, avoid retrofitting existing inefficient showerheads with flow control inserts (which restrict water flow) or flow control valves (which can be activated to temporarily shut off water flow) to reduce the flow rate and save water. These devices may not provide adequate performance in some facilities and can lead to user dissatisfaction.
In certain circumstances, single shower stalls may be outfitted with multiple show-erheads that can be activated simultaneously or individually by the user. In some cases, when these showerheads are turned on simultaneously, they use more water than the federal maximum flow rate of 2.5 gpm for an individual showerhead (e.g., two 2.5 gpm showerheads can use 5.0 gpm). In these instances, stalls can be retrofit-ted so that the showerheads can only be operated individually rather than all at the same time, or so the total volume of water flowing from all showerheads is equal to or less than 2.0 gpm. The latter may require replacing the existing showerheads with more efficient ones. The retrofit suggestions for single shower stalls provided here do not apply to communal showers used in prisons, locker rooms, and barracks. Communal showers might have multiple showerheads that each flow at equal to or less than 2.0 gpm, since the showerheads are designed to be used by different users at once, as opposed to multiple show-erheads being used by one user, as described above.
Replacement OptionsWhen installing new showerheads or replacing older, ineffi-cient showerheads, choose WaterSense labeled models. Water-Sense labeled showerheads25 are designed to use 2.0 gpm or
3.5 Showerheads
25 Ibid.
WaterSense labeled showerhead

October 2012 3-25
less and thus are 20 percent more water-efficient than standard showerheads on the market. In addition, WaterSense labeled showerheads are independently certified to meet or exceed minimum performance requirements for spray coverage and force.
Except for communal settings in prisons, locker rooms, and barracks, avoid purchas-ing and installing multiple showerheads when remodeling, particularly if they can be operated simultaneously or so that the total volume of water flowing from all showerheads is greater than the 2.0 gpm WaterSense specification maximum. These multiple showerhead systems can waste a significant amount of water and energy.
Savings PotentialWater savings can be achieved by replacing existing showerheads. To estimate facility-specific water savings and payback, use the following information.
Current Water Use
To estimate the current water use of an existing showerhead, identify the following information and use Equation 3-7:
• Flow rate of the existing showerhead. Showerheads installed in 1994 or later will have a flow rate of 2.5 gpm or less. Older showerheads may flow as high as 3.0 to 5.0 gpm.
• Average duration of each shower. The average shower duration is approximately eight minutes.26
• Average use rate of showers in terms of number of showers each person takes per day.
• Number of building occupants.
• Days of facility operation per year.
Equation 3-7. Water Use of Showerhead (gallons per year)
= Showerhead Flow Rate x Duration of Use x Use Rate x Number of Building Occupants x Days of Facility Operation
Where:
• Showerhead Flow Rate (gallons per minute) • Duration of Use (minutes per shower) • Use Rate (showers per person per day) • Number of Building Occupants (persons) • Days of Facility Operation (days per year)
3.5 Showerheads
26 Mayer, Peter W. and DeOreo, William B. American Water Works Association (AWWA) and AWWA Research Foundation. 1998. Residential End Uses of Water. Page 102.

3-26 October 2012
Water Use After Replacement
To estimate the water use of a replacement WaterSense labeled showerhead, use Equation 3-7, substituting the flow rate of the replacement showerhead. WaterSense labeled showerheads use no more than 2.0 gpm.
Water Savings
To calculate water savings that can be achieved from replacing an existing shower-head, identify the following information and use Equation 3-8:
• Current water use as calculated using Equation 3-7. • Water use after replacement as calculated using Equation 3-7.
Equation 3-8. Water Savings From Showerhead Replacement (gallons per year)
= Current Water Use of Showerhead – Water Use of Showerhead After Replacement
Where:
• Current Water Use of Showerhead (gallons per year) • Water Use of Showerhead After Replacement (gallons per year)
Payback
To calculate the simple payback from the water savings associated with replacing an existing showerhead, consider the equipment and installation cost of the replace-ment showerhead, the water savings as calculated in Equation 3-8, and the facility-specific cost of water and wastewater. The average showerhead costs approximately $30 retail.27
Because showerheads use hot water, a reduction in water use will also result in energy savings, further reducing the payback period and increasing replacement cost-effectiveness.
Additional ResourcesAlliance for Water Efficiency. Residential Shower and Bath Introduction. www.allianceforwaterefficiency.org/Residential_Shower_Introduction.aspx.
EPA’s WaterSense program. WaterSense Labeled Showerheads. www.epa.gov/watersense/products/showerheads.html.
Vickers, Amy. 2001. Handbook of Water Use and Conservation. WaterPlow Press.
3.5 Showerheads
27 EPA’s WaterSense program. March 4, 2010. WaterSense Specification for Showerheads Supporting Statement. Page 6. www.epa.gov/WaterSense/partners/ showerhead_spec.html.
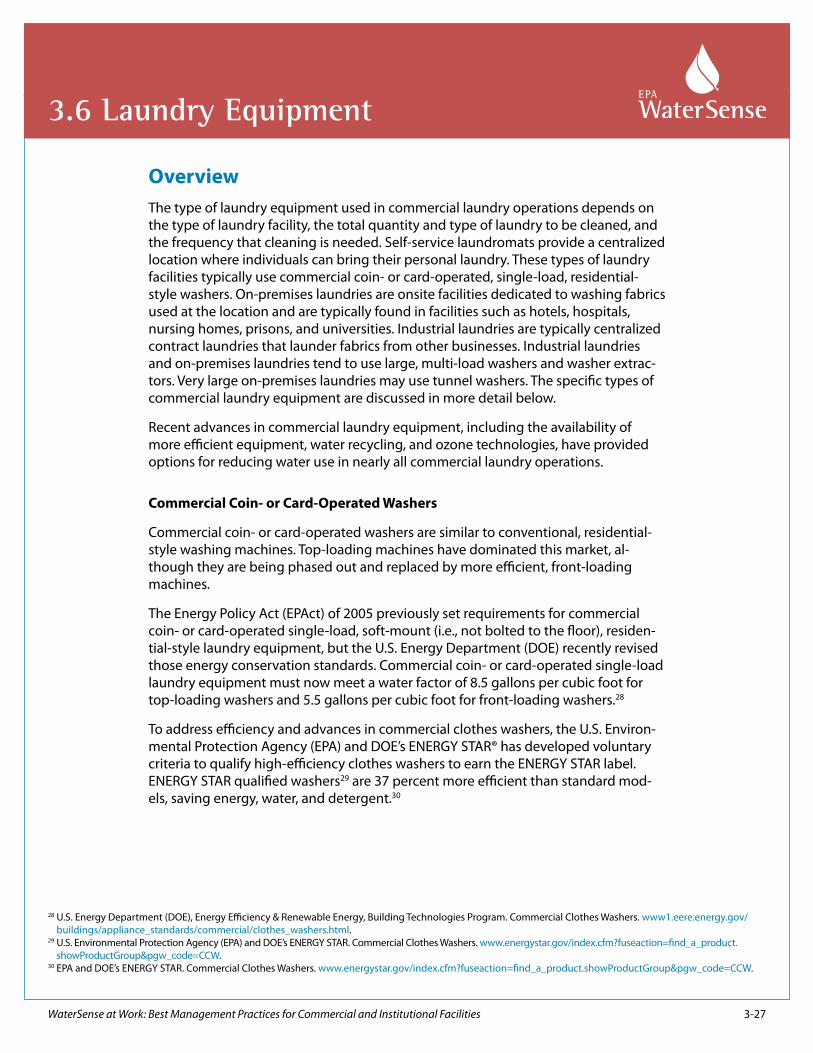
WaterSense at Work: Best Management Practices for Commercial and Institutional Facilities 3-27
OverviewThe type of laundry equipment used in commercial laundry operations depends on the type of laundry facility, the total quantity and type of laundry to be cleaned, and the frequency that cleaning is needed. Self-service laundromats provide a centralized location where individuals can bring their personal laundry. These types of laundry facilities typically use commercial coin- or card-operated, single-load, residential-style washers. On-premises laundries are onsite facilities dedicated to washing fabrics used at the location and are typically found in facilities such as hotels, hospitals, nursing homes, prisons, and universities. Industrial laundries are typically centralized contract laundries that launder fabrics from other businesses. Industrial laundries and on-premises laundries tend to use large, multi-load washers and washer extrac-tors. Very large on-premises laundries may use tunnel washers. The specific types of commercial laundry equipment are discussed in more detail below.
Recent advances in commercial laundry equipment, including the availability of more efficient equipment, water recycling, and ozone technologies, have provided options for reducing water use in nearly all commercial laundry operations.
Commercial Coin- or Card-Operated Washers
Commercial coin- or card-operated washers are similar to conventional, residential-style washing machines. Top-loading machines have dominated this market, al-though they are being phased out and replaced by more efficient, front-loading machines.
The Energy Policy Act (EPAct) of 2005 previously set requirements for commercial coin- or card-operated single-load, soft-mount (i.e., not bolted to the floor), residen-tial-style laundry equipment, but the U.S. Energy Department (DOE) recently revised those energy conservation standards. Commercial coin- or card-operated single-load laundry equipment must now meet a water factor of 8.5 gallons per cubic foot for top-loading washers and 5.5 gallons per cubic foot for front-loading washers.28
To address efficiency and advances in commercial clothes washers, the U.S. Environ-mental Protection Agency (EPA) and DOE’s ENERGY STAR® has developed voluntary criteria to qualify high-efficiency clothes washers to earn the ENERGY STAR label. ENERGY STAR qualified washers29 are 37 percent more efficient than standard mod-els, saving energy, water, and detergent.30
3.6 Laundry Equipment
28 U.S. Energy Department (DOE), Energy Efficiency & Renewable Energy, Building Technologies Program. Commercial Clothes Washers. www1.eere.energy.gov/buildings/appliance_standards/commercial/clothes_washers.html.
29 U.S. Environmental Protection Agency (EPA) and DOE’s ENERGY STAR. Commercial Clothes Washers. www.energystar.gov/index.cfm?fuseaction=find_a_product.showProductGroup&pgw_code=CCW.
30 EPA and DOE’s ENERGY STAR. Commercial Clothes Washers. www.energystar.gov/index.cfm?fuseaction=find_a_product.showProductGroup&pgw_code=CCW.
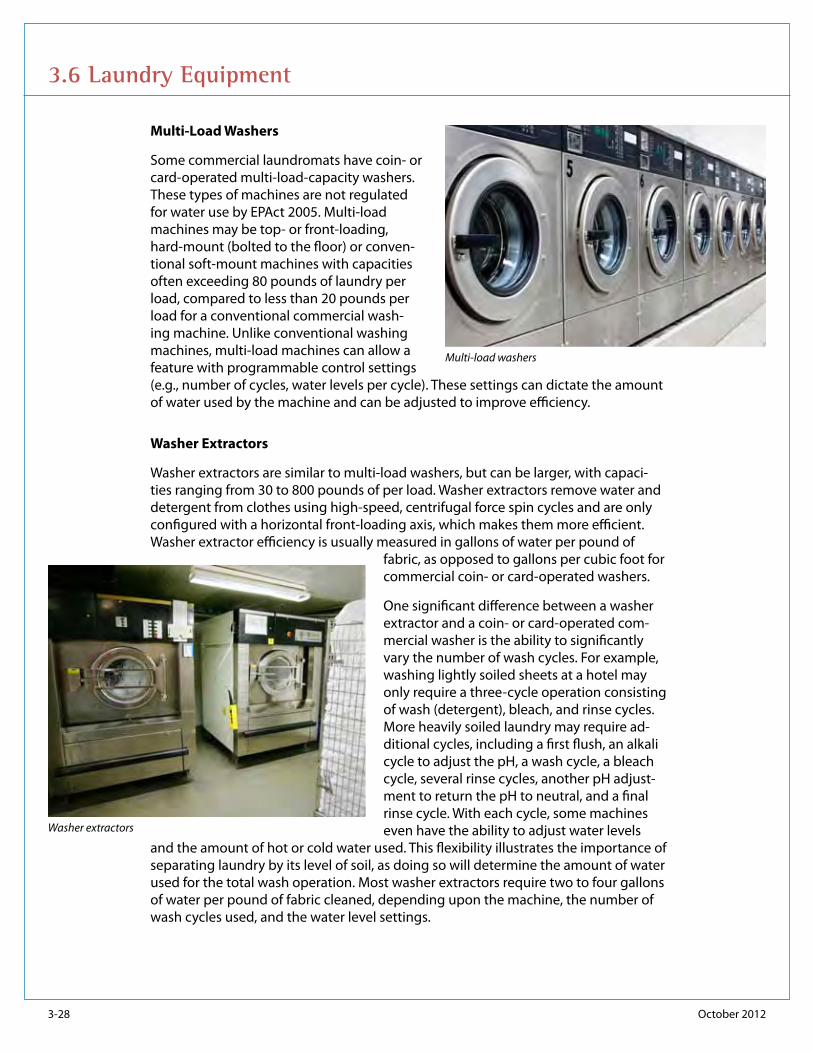
3-28 October 2012
Multi-Load Washers
Some commercial laundromats have coin- or card-operated multi-load-capacity washers. These types of machines are not regulated for water use by EPAct 2005. Multi-load machines may be top- or front-loading, hard-mount (bolted to the floor) or conven-tional soft-mount machines with capacities often exceeding 80 pounds of laundry per load, compared to less than 20 pounds per load for a conventional commercial wash-ing machine. Unlike conventional washing machines, multi-load machines can allow a feature with programmable control settings (e.g., number of cycles, water levels per cycle). These settings can dictate the amount of water used by the machine and can be adjusted to improve efficiency.
Washer Extractors
Washer extractors are similar to multi-load washers, but can be larger, with capaci-ties ranging from 30 to 800 pounds of per load. Washer extractors remove water and detergent from clothes using high-speed, centrifugal force spin cycles and are only configured with a horizontal front-loading axis, which makes them more efficient. Washer extractor efficiency is usually measured in gallons of water per pound of
fabric, as opposed to gallons per cubic foot for commercial coin- or card-operated washers.
One significant difference between a washer extractor and a coin- or card-operated com-mercial washer is the ability to significantly vary the number of wash cycles. For example, washing lightly soiled sheets at a hotel may only require a three-cycle operation consisting of wash (detergent), bleach, and rinse cycles. More heavily soiled laundry may require ad-ditional cycles, including a first flush, an alkali cycle to adjust the pH, a wash cycle, a bleach cycle, several rinse cycles, another pH adjust-ment to return the pH to neutral, and a final rinse cycle. With each cycle, some machines even have the ability to adjust water levels
and the amount of hot or cold water used. This flexibility illustrates the importance of separating laundry by its level of soil, as doing so will determine the amount of water used for the total wash operation. Most washer extractors require two to four gallons of water per pound of fabric cleaned, depending upon the machine, the number of wash cycles used, and the water level settings.
3.6 Laundry Equipment
Multi-load washers
Washer extractors

October 2012 3-29
Tunnel Washers
Tunnel washers are large-volume, continuous-batch washers with long chambers and a series of compartments through which the laundry is pulled for soaking, wash-ing, and rinsing. Tunnel washers are used in very large laundry operations serving institutional users, such as hospitals, prisons, hotels, motels, and restaurants. They are capable of handling up to 2,000 pounds of laundry per hour. Tunnel washers are more water-efficient, because the water moves in a counter-flow direction to the laundry starting with the last rinse, so that the water is used through several cycles of the wash before being sent to the drain (see Figure 3-2). Tunnel washers are costly to install, but they are capable of saving more water than washer extractors and require less operation and maintenance labor. Tunnel washers typically use two gallons of water or less per pound of fabric.
Figure 3-2. Tunnel Washer
Operation, Maintenance, and User EducationFacility managers can reduce water use by taking simple steps to educate users on proper laundry equipment use and maintenance. In addition, consider the following:
• Encourage users to wash only full loads. Consider using a laundry scale to weigh loads to ensure the machine is filled to capacity.
• Consider separating and washing laundry based on the number of wash cycles needed (e.g., more soiled articles will require more wash cycles).
Freshwater Supply
Laundry Flow Pre-Wash Main Wash Rinse Extraction
LaundryIn
LaundryOut
Water Flow Water Flow Water Flow Water Flow
RecycledWater
Recovery forRecycle
Wastewaterto
Drain
3.6 Laundry Equipment

3-30 October 2012
• Ensure multi-load washers are preset to meet a water factor of 8.0 gallons per cycle per cubic foot of capacity or less.31
• Work with the equipment supplier to provide an ongoing service and mainte-nance program.
• Consult the laundry chemical supplier for laundry methods that require fewer wash and rinse steps.
• Use detergents formulated for high-efficiency clothes washers. Normal deter-gents may suds too much and can leave laundry that is not completely washed or rinsed.
Retrofit OptionsThere are two main retrofit options to reduce water use associated with existing laundry equipment: water reuse/recycling and ozone systems.
Water Reuse/Recycling
Simple or complex recycling systems can be added to coin- or card-operated wash-ers, multi-load washers, and washer extractors to recycle a portion or all of the water for reuse in the next wash. Simple recycling systems recover discharge from the final rinse in a multi-cycle operation for use in the first rinse of the next cycle. The water from these systems rarely needs treatment prior to reuse, so potential water savings is 10 to 35 percent. Complex recycling systems treat the reclaimed water from wash and rinse cycles for use in all cycles of the next load and can save more than 85 per-cent of water used. Complex recycle systems usually require water treatment before reuse.
Be sure to evaluate space constraints when considering water reuse/recycling op-tions. Space may not be available to accommodate additional recycling equipment or storage tanks. Because recycling may also require adjustments in chemicals and detergents, contact the chemical supply vendor in any retrofit planning.
Ozone Systems
Ozone systems can be installed on all types of existing commercial laundry machines as retrofits, although they are not as common as a retrofit for tunnel washers. Ozone systems generate ozone, which is injected into the wash as a powerful oxidant that reacts with dirt and organic materials. It also provides disinfection and whiten-ing properties. Ozone can allow for reduced water temperatures, typically to 80oF, which saves energy. It also can reduce the amount of detergents and other chemi-cals needed, lessening the amount of rinsing required. Ozone systems work well on lightly soiled laundry, but they are not recommended for heavily soiled laundry. For heavily soiled laundry, conventional washing, detergents, and hot water work best. See Figure 3-3 for an example of the configuration of a laundry ozone system.
3.6 Laundry Equipment
31 East Bay Municipal Utility District (EBMUD). 2008. WaterSmart Guidebook: A Water-Use Efficiency Plan Review Guide for New Businesses. Page 31. www.ebmud.com/for-customers/conservation-rebates-and-services/commercial/watersmart-guidebook.

October 2012 3-31
Figure 3-3. Laundry Ozone System
Replacement OptionsWhen installing new laundry equipment or replacing existing equipment, consider the following replacement options:
• For coin- or card-operated, single-load clothes washers, choose models that are ENERGY STAR qualified.32 ENERGY STAR qualified washers use significantly less energy, water, and detergent compared to standard models.
• For multi-load washers, choose models that use no more than 8.0 gallons per cycle per cubic foot of capacity.
• For washer extractors, choose machines with built-in water recycling capabili-ties that can store the rinse water from the previous load for use in the next load. These types of washer extractors can use less than 2.5 gallons of water per pound of fabric.
• For large industrial or commercial laundries, consider replacing old washer extractors or multi-load washers with tunnel washers if large volumes of laundry will be processed.
• Choose new machines that support remote diagnosis by the manufacturer to minimize maintenance cost and time associated with troubleshooting equip-ment problems.
Washer
Ozonated WaterSupply
OzoneRecirculation
Cold WaterSupply
ActivatedCarbon Filter
(Optional)
pH Control(Optional)
Wastewater to Drain
Hot Water Supply
OzonatedWaterTank
3.6 Laundry Equipment
32 EPA and DOE’s ENERGY STAR. ENERGY STAR Qualified Products, op. cit.

3-32 October 2012
Savings PotentialWater savings can be achieved through retrofitting existing laundry equipment to recycle wash water or reduce the amount of water required for rinsing, or by repla-cing existing laundry equipment with more efficient equipment. To estimate facility-specific water savings and payback, use the following information.
Coin- or Card-Operated Washer or Multi-Load Washer Retrofit
Use the following information to estimate water savings and payback potential that may be achieved with recycling or ozone retrofits. Water savings can vary based upon the water use and use patterns of the existing laundry equipment and the type of retrofit selected.
Current Water Use
To estimate the current water use from a commercial coin- or card-operated washer or multi-load washer, identify the following information and use Equation 3-9:
• Washer’s water factor in gallons per cycle per cubic foot of capacity. Coin- or card-operated washers installed since the early 1990s will have a water factor of 9.5 gallons per cycle per cubic foot of capacity or less.
• Capacity of the washer.
• Average number of cycles per load. The number of cycles refers to the number of times the washer is filled with water. There may be one or two wash cycles and one or two rinse cycles in typical coin- or card-operated washers or multi-load washers.
• Average number of loads per year.
Equation 3-9. Water Use of Commercial Coin- or Card-Operated Washer or Multi-Load Washer (gallons per year)
= Water Factor x Washer Capacity x Number of Cycles x Number of Loads
Where:
• Water Factor (gallons per cycle per cubic foot capacity) • Washer Capacity (cubic feet of capacity) • Number of Cycles (cycles per load) • Number of Loads (loads per year)
Water Savings
Studies have documented water savings for retrofits with a simple recycling system, retrofits with a complex recycling system, and ozone system retrofits. To estimate
3.6 Laundry Equipment

October 2012 3-33
water savings that can be achieved from retrofitting existing laundry equipment, multiply the water use of the existing laundry equipment (Equation 3-9) by the sav-ings potential for the appropriate retrofit option indicated in Table 3-1 below (see Equation 3-10).33
Table 3-1. Potential Water Savings From Commercial Laundry Retrofit Options
Retrofit Option Water Savings Potential
Retrofit With Simple Recycling System 10% to 35%
Retrofit With Complex Recycling System 85% to 90%
Retrofit With Ozone System 10% to 25%
Equation 3-10. Water Savings From Commercial Laundry Equipment Retrofit (gallons per year)
= Current Water Use of Laundry Equipment x Water Savings Potential
Where:
• Current Water Use of Laundry Equipment (gallons per year) • Water Savings Potential (percent, from Table 3-1)
Payback
To calculate the simple payback from the water savings associated with retrofitting existing laundry equipment, consider the equipment and installation cost of the retrofit option, the water savings as calculated using Equation 3-10, and the facility-specific cost of water and wastewater.
Because washers use hot water, a reduction in water use will also result in energy savings, further reducing the payback period and increasing replacement cost-effectiveness. More efficient washers may also require less detergent. If the facility is paying for the detergent used, this may reduce overall operating costs and reduce the payback period.
Washer Extractor or Tunnel Washer Retrofit
Existing washer extractors or tunnel washers can also be retrofitted to recycle and reuse a portion of the rinse water or retrofitted with an ozone system.
Current Water Use
To estimate the current water use from a washer extractor or tunnel washer, identify the following information and use Equation 3-11:
3.6 Laundry Equipment
33 EBMUD, op. cit., Pages LAUND 4–6.

3-34 October 2012
• Washer’s water-efficiency factor in gallons per pound of fabric. • Average number of pounds of fabric per load. • Average number of loads per year.
Equation 3-11. Water Use of Washer Extractor or Tunnel Washer (gallons per year)
= Water-Efficiency Factor x Pounds of Fabric x Number of Loads
Where:
• Water-Efficiency Factor (gallons per pound of fabric) • Pounds of Fabric (pounds of fabric per load) • Number of Loads (loads per year)
Water Savings
To calculate water savings that can be achieved from retrofitting an existing washer extractor or tunnel washer, multiply the water use of the existing laundry equipment as calculated using Equation 3-11 by the savings potential for the appropriate retrofit option indicated in the Table 3-1 above (Equation 3-10).
Payback
To calculate the simple payback from the water savings associated with retrofitting an existing washer extractor or tunnel washer, consider the equipment and installa-tion cost of the retrofit option, the water savings as calculated using Equation 3-10, and the facility-specific cost of water and wastewater.
Because washers use hot water, a reduction in water use will also result in energy savings, further reducing the payback period and increasing replacement cost- effectiveness. More efficient washers may also require less detergent, which may reduce overall operating costs and reduce the payback period.
Coin- or Card-Operated Washer or Multi-Load Washer Replacement
Coin- or card-operated washer or multi-load washers can be replaced with more ef-ficient laundry equipment. Look for washers with the ENERGY STAR label.
Current Water Use
To estimate the current water use of a coin- or card-operated washer or multi-load washer, use Equation 3-9.
Water Use After Replacement
To estimate the water use of a more efficient replacement commercial coin- or card-operated washer or multi-load washer, use Equation 3-9, substituting the water
3.6 Laundry Equipment

October 2012 3-35
factor and washer capacity of the replacement equipment. ENERGY STAR qualified coin- or card-operated washers will have a water factor of 6.0 gallons per cycle per cubic foot of capacity or less. An efficient multi-load washer will have a water factor of 8.0 gallons per cycle per cubic foot or less.
Water Savings
To calculate water savings that can be achieved from replacing an existing coin- or card-operated washer or multi-load washer, identify the following information and use Equation 3-12:
• Current water use as calculated using Equation 3-9. • Water use after replacement as calculated using Equation 3-9.
Equation 3-12. Water Savings From Commercial Laundry Equipment Replacement
= Current Laundry Equipment Water Use – Water Use of Laundry Equipment After Replacement
Where:
• Current Laundry Equipment Water Use (gallons per year) • Water Use of Laundry Equipment After Replacement (gallons per year)
Payback
To calculate the simple payback from the water savings associated with replacing an existing coin- or card-operated washer or multi-load washer with an ENERGY STAR qualified model, consider the equipment and installation cost of the new equipment, the water savings as calculated using Equation 3-12, and the facility-specific cost of water and wastewater.
Because washers use hot water, a reduction in water use will also result in energy savings, further reducing the payback period and increasing replacement cost-effectiveness. More efficient washers may also require less detergent. If the facility is paying for the detergent used, this may reduce overall operating costs and reduce the payback period.
Washer Extractor or Tunnel Washer Replacement
Existing washer extractors or tunnel washers can be replaced with more efficient laundry equipment.
Current Water Use
To estimate the current water use from a washer extractor or tunnel washer, use Equation 3-11.
3.6 Laundry Equipment

3-36 October 2012
Water Use After Replacement
To estimate the water use of a more efficient, replacement washer extractor or tunnel washer, use Equation 3-11, substituting the new washer’s water efficiency. Existing washer extractors can be replaced with machines with built-in water recycling ca-pabilities that use less than 2.5 gallons of water per pound of fabric. Efficient tunnel washers typically use two gallons of water or less per pound of fabric.
Water Savings
To calculate water savings that can be achieved from replacing an existing washer extractor or tunnel washer, use Equation 3-12.
Payback
To calculate the simple payback from the water savings associated with replacing an existing washer extractor or tunnel washer, consider the equipment and installation cost of new equipment, the water savings as calculated using Equation 3-12, and the facility-specific cost of water and wastewater.
Because washers use hot water, a reduction in water use will also result in energy savings, further reducing the payback period and increasing replacement cost-effectiveness. More efficient washers may also require less detergent, which may reduce overall operating costs and reduce the payback period.
Additional ResourcesAlliance for Water Efficiency. Commercial Laundry Facilities Introduction. www.allianceforwaterefficiency.org/commercial_laundry.aspx.
East Bay Municipal Utility District. 2008. WaterSmart Guidebook: A Water-Use Efficiency Plan Review Guide for New Businesses. Pages 31, LAUND4-6. www.ebmud.com/ for-customers/conservation-rebates-and-services/commercial/watersmart- guidebook.
EPA and DOE’s ENERGY STAR. Commercial Clothes Washers. www.energystar.gov/ index.cfm?fuseaction=find_a_product.showProductGroup&pgw_code=CCW.
Koeller, John, et al. Koeller and Company. January 2006. A Report on Potential Best Management Practices, Annual Report—Year Two. Prepared for The California Urban Water Conservation Council. www.cuwcc.org/products/pbmp-reports.aspx.
Pacific Gas and Electric. 2009. Hospitality Fact Sheet: Ozonated Laundry Systems in Hos-pital Facilities. www.pge.com/includes/docs/pdfs/mybusiness/energysavingsrebates/incentivesbyindustry/hospitality/Ozonated_Laundry_FS_Final.pdf.
3.6 Laundry Equipment
http://www.ebmud.com/for-customers/conservation-rebates-and-services/commercial/watersmart-guidebook
http://www.ebmud.com/for-customers/conservation-rebates-and-services/commercial/watersmart-guidebook

October 2012 3-37
Schultz Communications. July 1999. A Water Conservation Guide for Commercial, Insti-tutional and Industrial Users. Prepared for the New Mexico Office of the State Engi-neer. Page 41. www.ose.state.nm.us/wucp_ici.html.
Sullivan, G.P., et al. January 2008. Cal-UCONS Commercial Laundry Program Measure-ment and Evaluation, Southern California Gas Company and San Diego Gas and Electric Company, Final Report. eere.pnnl.gov/building-technologies/pdf/sempra_final.pdf.
Water Management, Inc., et al. 2006. Report on the Monitoring and Assessment of Water Savings from the Coin-Operated Multi-Load Clothes Washer Voucher Initiative Program. Prepared for the San Diego Water Authority. www.allianceforwaterefficiency.org/commercial_laundry.aspx.
3.6 Laundry Equipment


Commercial Kitchen Equipment
Table of Contents4.1 Introduction to Commercial
Kitchen Equipment ............................................... 4-2
4.2 Commercial Ice Machines .................................. 4-4
4.3 Combination Ovens ...........................................4-11
4.4 Steam Cookers .....................................................4-15
4.5 Steam Kettles ........................................................4-19
4.6 Wok Stoves ............................................................4-23
4.7 Dipper Wells ..........................................................4-30
4.8 Pre-Rinse Spray Valves .......................................4-36
4.9 Food Disposals .....................................................4-40
4.10 Commercial Dishwashers .................................4-47
4.11 Wash-Down Sprayers .........................................4-52

xxx
4-2 WaterSense at Work: Best Management Practices for Commercial and Institutional Facilities
4.1 Introduction to Commercial Kitchen Equipment
In restaurants, water use in the kitchen can account for nearly 50 percent of the facil-ity’s total water use. Several other commercial and institutional sectors, including hospitals, offices, schools, and hotels, also have substantial kitchen water use that accounts for as much as 10 to 15 percent of the facility’s total water use.1 Figure 4-1 shows the percentage of facility water use that is attributed to kitchen equipment for various commercial facility types.2
Figure 4-1. Water Use Attributed to Commercial Kitchen Equipment
The type and water use of commercial kitchen equipment will vary depending upon the scope and scale of the kitchen’s operations. A kitchen in an office building, for example, may only have a kitchen faucet and a small undercounter dishwasher. Commercial-style kitchens found in food service establishments, such as standalone and hotel restaurants or hospital and school cafeterias, on the other hand, may use water in almost every aspect of their operation, from food preparation to dish clean-ing. These types of kitchens may also have much larger and more water-intensive commercial kitchen equipment.
In most commercial kitchens, the commercial dishwasher and pre-rinse spray valve account for over two-thirds of the water use.3 However, the presence of a sluice trough food disposal system or boiler-based food preparation equipment, such as combination ovens, steam kettles, and steam cookers, can dwarf this water use.
1 Fisher, Don. Food Service Technology Center. 2006. “Energy & Water Savings in Commercial Food Service.” www.cuwcc.org/products/commercial-food-services-main.aspx.
2 Created from analyzing data in: Schultz Communications. July 1999. A Water Conservation Guide for Commercial, Institutional and Industrial Water Users. Prepared for the New Mexico Office of the State Engineer. www.ose.state.nm.us/wucp_ici.html; Dziegielewski, Benedykt, et al. American Water Works Association (AWWA) and AWWA Research Foundation. 2000. Commercial and Institutional End Uses of Water; East Bay Municipal Utility District. 2008. WaterSmart Guidebook: A Water-Use Efficiency Plan Review Guide for New Businesses. www.ebmud.com/for-customers/conservation-rebates-and-services/commercial/watersmart-guidebook; AWWA. Helping Businesses Manage Water Use—A Guide for Water Utilities.
3 Alliance for Water Efficiency. Commercial Dishwashing Introduction. www.allianceforwaterefficiency.org/commercial_dishwash_intro.aspx.
0%
20%
40%
60%
80%
100%

October 2012 4-3
4.1 Introduction to Commercial Kitchen Equipment
In addition, specialty equipment, such as dipper wells found in ice cream and coffee shops and wok stoves found in Asian-style restaurants, can be among the largest wa-ter-using commercial kitchen equipment if standard, inefficient equipment is installed. These typically discharge water continuously during operation, consuming hundreds of thousands of gallons per year.
Because water use from commercial kitchens can account for a large percent of total facility water use, and a majority of that water is heated using facility energy, ensur-ing commercial kitchen equipment uses water efficiently affords both significant water and energy savings. Newer technologies and better practices are available that can significantly reduce commercial kitchen equipment water and energy use. For example, ENERGY STAR® qualified dishwashers,4 ice machines, and steam cookers are at least 10 percent more water-efficient and 15 percent more energy-efficient than standard models, with some models saving significantly more. Efficient dipper wells and waterless wok stoves can use 50 to 90 percent less water than standard models.
Section 4: Commercial Kitchen Equipment of WaterSense at Work provides an overview of and guidance for effectively reducing the water use of:
• Commercial ice machines • Combination ovens • Steam cookers • Steam kettles • Wok stoves • Dipper wells • Pre-rinse spray valves • Food disposals • Commercial dishwashers • Wash-down sprayers
4 U.S. Environmental Protection Agency and U.S. Energy Department’s ENERGY STAR. Dishwashers. www.energystar.gov/index.cfm?fuseaction=find_a_product.showProductGroup&pgw_code=DW.
Commercial Kitchen Equipment Case Study
To learn how three restaurants in Chicago, Illinois; Omaha, Nebraska; and Washington, D.C. saved water and energy by implementing several of the best management practices discussed in this section, read the case study in Appendix A.

4-4 WaterSense at Work: Best Management Practices for Commercial and Institutional Facilities
OverviewCommercial ice machines use refrigeration units to freeze water into ice for cool-ing or preserving food and other items. Ice machines have become a mainstay in all types of settings, including restaurants, commercial kitchens, fast food establish-ments, convenience stores, grocery stores, schools, hotels, hospitals, and laboratories. Ice machines typically use water for two purposes: cooling the refrigeration unit and making ice. There are mechanisms to address the efficiency of both aspects.
Because the ice-making process generates a significant amount of heat, either water or air is used to remove this waste heat from the ice machine’s refrigeration unit. In the most basic configuration, water-cooled ice machines pass water through the machine once to cool it, and then dispose of the single-pass water down the drain. Water-cooled systems can use less water by recirculating the cooling water through a chiller or a cooling tower to lower the temperature, return-ing the water to the machine for reuse. To eliminate using water to cool the refrigeration unit altogether, air can be used to cool the unit instead. Air-cooled ice machines use motor-driven fans or centrifugal blowers to move air through the refrigeration unit to remove heat.5
There are three primary types of ice machines: ice-making head units, self-contained units, and remote condensing units. Ice-making head units include the ice-making mechanism and the condenser unit in a single package, and the ice storage bins are sold separately. Self-contained units have the ice-making mechanism, condenser unit, and a built-in storage bin in an integral cabinet. These units are typically small, undercounter units that produce a smaller volume of ice. Re-mote condensing units are models with the ice-making mechanism
and the condenser unit in a separate section. They transfer the heat generated by the ice-making process outside the building.
Regardless of how the machine is cooled, all ice machines use water to produce ice. If a machine were 100 percent water-efficient and wasted no water when produ-cing ice, the machine would use approximately 12 gallons of water to produce 100 pounds of ice.6 However, in order to create ice of acceptable quality, some water is used and sent down the drain during the process. The amount of water used for the ice-making process depends upon the facility’s incoming water quality and on the desired end quality of the ice. Specifically, water is used to rinse ice-making surfaces and flush minerals that accumulate as water crystallizes into ice.
As ice is formed in the freezing trays, minerals in the water collect on the equipment and must be rinsed occasionally. Ice machines at facilities with poorer incoming water quality (i.e., incoming potable water that contains high total dissolved solids or minerals) will require more frequent rinse cycles. Some ice machines might be set
4.2 Commercial Ice Machines
5 U.S. Environmental Protection Agency (EPA) and U.S. Energy Department’s (DOE’s) ENERGY STAR. Commercial Ice Machines. www.energystar.gov/index.cfm?fuseaction=find_a_product.showProductGroup&pgw_code=CIM.
6 Alliance for Water Efficiency (AWE). Ice Machines. www.allianceforwaterefficiency.org/Ice_Machines.aspx.
Cubed ice machine
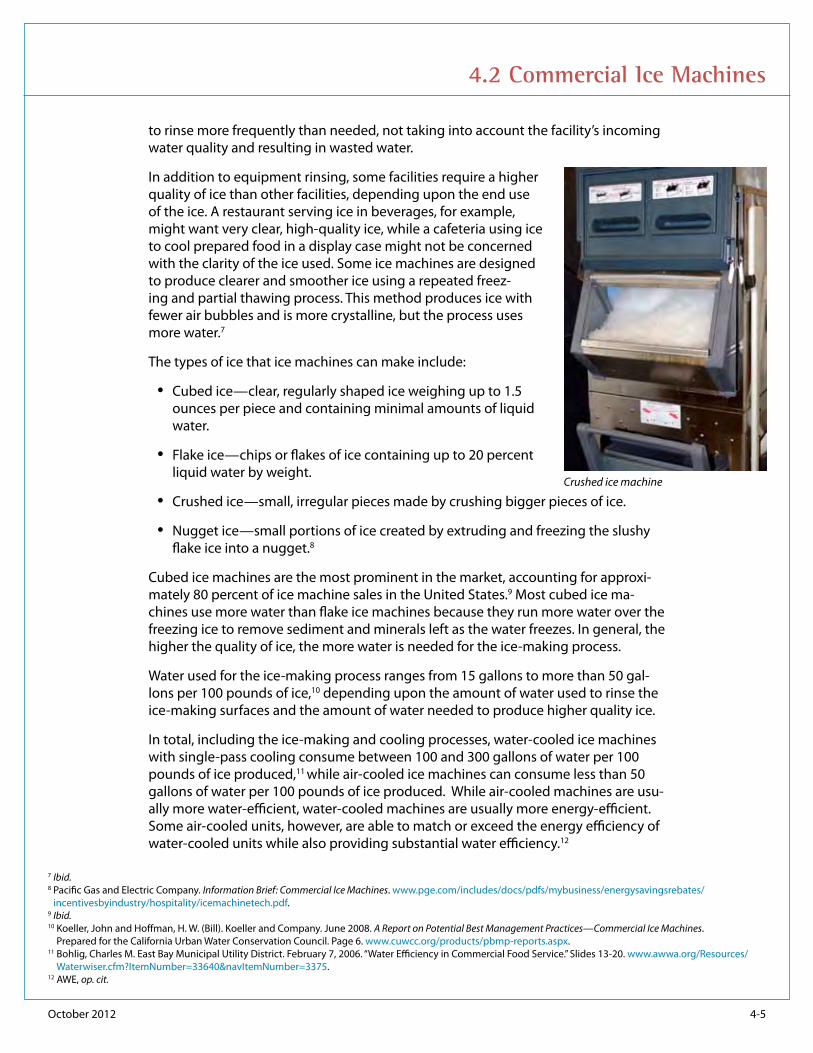
October 2012 4-5
4.2 Commercial Ice Machines
to rinse more frequently than needed, not taking into account the facility’s incoming water quality and resulting in wasted water.
In addition to equipment rinsing, some facilities require a higher quality of ice than other facilities, depending upon the end use of the ice. A restaurant serving ice in beverages, for example, might want very clear, high-quality ice, while a cafeteria using ice to cool prepared food in a display case might not be concerned with the clarity of the ice used. Some ice machines are designed to produce clearer and smoother ice using a repeated freez-ing and partial thawing process. This method produces ice with fewer air bubbles and is more crystalline, but the process uses more water.7
The types of ice that ice machines can make include:
• Cubed ice—clear, regularly shaped ice weighing up to 1.5 ounces per piece and containing minimal amounts of liquid water.
• Flake ice—chips or flakes of ice containing up to 20 percent liquid water by weight.
• Crushed ice—small, irregular pieces made by crushing bigger pieces of ice.
• Nugget ice—small portions of ice created by extruding and freezing the slushy flake ice into a nugget.8
Cubed ice machines are the most prominent in the market, accounting for approxi-mately 80 percent of ice machine sales in the United States.9 Most cubed ice ma-chines use more water than flake ice machines because they run more water over the freezing ice to remove sediment and minerals left as the water freezes. In general, the higher the quality of ice, the more water is needed for the ice-making process.
Water used for the ice-making process ranges from 15 gallons to more than 50 gal-lons per 100 pounds of ice,10 depending upon the amount of water used to rinse the ice-making surfaces and the amount of water needed to produce higher quality ice.
In total, including the ice-making and cooling processes, water-cooled ice machines with single-pass cooling consume between 100 and 300 gallons of water per 100 pounds of ice produced,11 while air-cooled ice machines can consume less than 50 gallons of water per 100 pounds of ice produced. While air-cooled machines are usu-ally more water-efficient, water-cooled machines are usually more energy-efficient. Some air-cooled units, however, are able to match or exceed the energy efficiency of water-cooled units while also providing substantial water efficiency.12
7 Ibid.8 Pacific Gas and Electric Company. Information Brief: Commercial Ice Machines. www.pge.com/includes/docs/pdfs/mybusiness/energysavingsrebates/
incentivesbyindustry/hospitality/icemachinetech.pdf. 9 Ibid.10 Koeller, John and Hoffman, H. W. (Bill). Koeller and Company. June 2008. A Report on Potential Best Management Practices—Commercial Ice Machines.
Prepared for the California Urban Water Conservation Council. Page 6. www.cuwcc.org/products/pbmp-reports.aspx.11 Bohlig, Charles M. East Bay Municipal Utility District. February 7, 2006. “Water Efficiency in Commercial Food Service.” Slides 13-20. www.awwa.org/Resources/
Waterwiser.cfm?ItemNumber=33640&navItemNumber=3375.12 AWE, op. cit.
Crushed ice machine

4-6 October 2012
4.2 Commercial Ice Machines
The U.S. Energy Department (DOE) sets energy and water use standards for ice ma-chines under the Energy Policy Act (EPAct) of 2005. Visit DOE’s website for the most up-to-date information.13
To recognize energy- and water-efficient ice machines, the U.S. Environmental Protection Agency (EPA) and DOE’s ENERGY STAR® issued a specification14 to qualify certain types of commercial air-cooled ice machines that meet more stringent energy use and potable water use criteria. Commercial ice machines that are ENERGY STAR qualified are, on average, 15 percent more energy-efficient and 10 percent more water-efficient than standard air-cooled models.
Operation, Maintenance, and User EducationFor optimal ice machine efficiency, consider the following:
• Periodically clean the ice machine to remove lime and scale buildup; sanitize it to kill bacteria and fungi. For self-cleaning or sanitizing machines, run the self-cleaning option. For machines without a self-cleaning mode, shut down the ma-chine, empty the bin of ice, add cleaning or sanitizing solution to the machine, switch it to cleaning mode, and then switch it to ice production mode. For health and safety purposes, create and discard several batches of ice to remove residual cleaning solution.
• Keep the ice machine’s coils clean to ensure the heat exchange process is run-ning as efficiently as possible.
• Keep the lid closed to keep cool air inside the ice machine and maintain the ap-propriate temperature.
• Install a timer to shift ice production to nighttime or off-peak hours. This will decrease the facility’s peak energy demand.
• Keeping in mind local water quality and site requirements, work with the manu-facturer to ensure that the ice machine’s rinse cycle is set to the lowest possible frequency that still provides sufficient ice quality. If available, use the ice ma-chine’s ability to initiate rinse cycles based on sensor readings of minerals.
• Follow the manufacturer-provided use and care instructions for the specific model ice machine used at the facility.
• Train users to report leaking or otherwise improperly operating ice machines to the appropriate personnel.
Retrofit OptionsIf the machine is cooled using single-pass water, modify the machine to operate on a closed loop that recirculates the cooling water through a cooling tower or heat
13 DOE, Energy Efficiency & Renewable Energy. Building Technologies Program: Automatic Commercial Ice Makers. www1.eere.energy.gov/buildings/appliance_standards/commercial/automatic_ice_making_equipment.html.
14 EPA and DOE’s ENERGY STAR. Commercial Ice Machines Key Product Criteria. www.energystar.gov/index.cfm?c=comm_ice_machines.pr_crit_comm_ice_machines.

October 2012 4-7
exchanger, if possible. If eliminating single-pass cooling is not feasible, consider reus-ing the cooling water for another application. See Section 8: Onsite Alternative Water Sources for more information.
Replacement OptionsWhen replacing an ice machine or installing a new one, ensure that the new model is sized appropriately to fit the facility’s need. If the machine produces too large of a yield, water will be wasted by producing unnecessary ice. Choose an ice machine that is appropriate for the quality of ice needed. Producing ice of higher quality than required will use water unnecessarily. Look for ENERGY STAR qualified models,15 all of which are air-cooled. Also consider air- or water-cooled ice machines that meet the efficiency specifications outlined by the Consortium for Energy Efficiency.16 If feasible, consider selecting air-cooled flake or nugget ice machines, which use less water and energy than cubed ice machines.
Savings PotentialA facility will see varying levels of water savings, depending upon whether it is re-placing an existing air-cooled ice machine or an existing water-cooled model.
The Food Service Technology Center has a life cycle and energy cost calculator, which can be used to calculate the savings potential from replacing many types of commer-cial kitchen equipment, including commercial ice machines.17
To estimate facility-specific water savings and payback, the facility can also use the following information.
Air-Cooled Ice Machine Replacement
ENERGY STAR qualified ice machines are, on average, 15 percent more energy-efficient and 10 percent more water-efficient than standard air-cooled models. Total savings depend upon the type of machine selected.
Use ENERGY STAR’s commercial kitchen equipment savings calculator18 to estimate facility-specific water, energy, and cost savings for replacing an existing ice machine with an ENERGY STAR qualified model.
Water-Cooled Ice Machine Replacement
A facility will see the most water savings from replacing a water-cooled ice machine with an air-cooled model. When replacing an ice machine, select an ENERGY STAR qualified model.
4.2 Commercial Ice Machines
15 EPA and DOE’s ENERGY STAR. Commercial Ice Machines, op. cit. 16 Consortium for Energy Efficiency, Inc. Commercial Kitchens. www.cee1.org/com/com-kit/com-kit-equip.php3.17 Food Service Technology Center. Commercial Foodservice Equipment Lifecycle Cost Calculator. www.fishnick.com/saveenergy/tools/calculators/. 18 EPA and DOE’s ENERGY STAR. Savings Calculator for ENERGY STAR Qualified Commercial Kitchen Equipment. www.energystar.gov/ia/business/bulk_purchasing/
bpsavings_calc/commercial_kitchen_equipment_calculator.xls.

4-8 October 2012
4.2 Commercial Ice Machines
Current Water Use
To estimate the current water use from a water-cooled ice machine, identify the fol-lowing information and use Equation 4-1:
• The ice machine’s harvest rate, or how many pounds of ice it produces per day.
• The ice machine’s maximum water use rate. EPAct of 2005 provides different water use maximums for water-cooled, self-contained units with harvest rates less than 200 pounds per day and those with harvest rates greater than or equal to than 200 pounds per day. It also provides different water use maximums for water-cooled, ice-making head units with harvest rates less than 500 pounds per day; those with harvest rates greater than or equal to 500 pounds per day and less than 1,436 pounds per day; and those with harvest rates greater than or equal to than 1,436 pounds per day.19
• Days of facility operation per year.
Equation 4-1. Water Use of Ice Machine (gallons per year)
= Harvest Rate x Water Use Rate x Days of Facility Operation
Where:
• Harvest Rate (pounds of ice per day) • Water Use Rate (gallons per 100 pounds of ice) • Days of Facility Operation (days per year)
Water Use After Replacement
To estimate the water use of a replacement air-cooled model, use Equation 4-1, substituting the harvest rate (if it will change) and the new water use per hundred pounds of ice. ENERGY STAR provides different water use maximums for qualified air-cooled models depending on the machine type and the harvest rate.20
Water Savings
To calculate the water savings that can be achieved from replacing an existing water-cooled ice machine, identify the following information and use Equation 4-2:
• Current water use as calculated using Equation 4-1. • Water use after replacement as calculated using Equation 4-1.
19 Energy Policy Act of 2005. Public Law 109–58. August 8, 2005.20 EPA and DOE’s ENERGY STAR. Commercial Ice Machines Key Product Criteria, op. cit.

October 2012 4-9
4.2 Commercial Ice Machines
Equation 4-2. Water Savings From Ice Machine Replacement (gallons per year)
= Current Water Use of Ice Machine – Water Use of Ice Machine After Replacement
Where:
• Current Water Use of Ice Machine (gallons per year) • Water Use of Ice Machine After Replacement (gallons per year)
Payback
To calculate the simple payback from the water savings associated with replacing a water-cooled ice machine, consider the equipment and installation cost of the re-placement air-cooled model, the water savings as calculated in Equation 4-2, and the facility-specific cost of water and wastewater.
The facility should also consider the energy impact of replacing old equipment. While air-cooled machines are usually more water-efficient, water-cooled machines are usually more energy-efficient. Some air-cooled units, however, are able to match or exceed the energy efficiency of water-cooled units while also providing substan-tial water efficiency.21
Additional ResourcesAlliance for Water Efficiency (AWE). Commercial Food Service Introduction. www.allianceforwaterefficiency.org/Commercial_Food_Service_Introduction.aspx.
AWE. Ice Machines. www.allianceforwaterefficiency.org/Ice_Machines.aspx.
California Urban Water Conservation Council. Resource Center, Commercial Food Services, Ice-Makers. www.cuwcc.org/products/commercial-ice-makers.aspx.
Consortium for Energy Efficiency, Inc. July 1, 2011. High Efficiency Specifications for Commercial Ice Makers. www.cee1.org/com/com-kit/com-kit-equip.php3.
DOE, Energy Efficiency & Renewable Energy, Federal Energy Management Program. Covered Product Category: Air-Cooled Ice Makers. www1.eere.energy.gov/femp/technologies/eep_ice_makers.html#buying.
East Bay Municipal Utility District. 2008. WaterSmart Guidebook—A Water-Use Efficiency Plan Review Guide for New Businesses. Pages FOOD3-5. www.ebmud.com/ for-customers/conservation-rebates-and-services/commercial/watersmart-guidebook.
EPA and DOE’s ENERGY STAR. Commercial Ice Machines. www.energystar.gov/index.cfm?fuseaction=find_a_product.showProductGroup&pgw_code=CIM.
21 AWE, op. cit.
http://www.ebmud.com/for-customers/conservation-rebates-and-services/commercial/watersmart-guidebook

4-10 October 2012
4.2 Commercial Ice Machines
Food Service Technology Center (FSTC) Commercial Foodservice Equipment Lifecycle Cost Calculators. www.fishnick.com/saveenergy/tools/calculators/.
FSTC. Ice Machines. www.fishnick.com/savewater/appliances/icemachines/.
Koeller, John and Hoffman, H. W. (Bill). Koeller and Company. June 2008. A Report on Potential Best Management Practices—Commercial Ice Machines. Prepared for the California Urban Water Conservation Council. www.cuwcc.org/products/pbmp-reports.aspx.
Pacific Gas and Electric Company. Information Brief: Commercial Ice Machines. www.pge.com/includes/docs/pdfs/mybusiness/energysavingsrebates/ incentivesbyindustry/hospitality/icemachinetech.pdf.

3.2 Toilets
WaterSense at Work: Best Management Practices for Commercial and Institutional Facilities 4-11
OverviewCombination ovens combine three modes of cooking into one oven: steam mode, circulated hot air (i.e., dry heat) mode, or a combination of both (i.e., combi-mode). The steam mode is used for rapid cooking of food items such as vegetables and shell-fish. The circulated hot air mode operates in the same manner as a typical convection oven and is traditionally used for roasting meats or baking. The combi-mode is used to reheat, roast, bake, or oven-fry foods. Steam and combi-modes require generation of steam, an energy and water-intensive process.
The amount of water used by a combination oven is primarily dictated by whether it is boiler-based or connectionless (i.e., without a central boiler connection). Typi-cal boiler-based combination ovens are connected to a boiler system that supplies the steam. These systems can waste large amounts of water because they require a continuous stream of water to cool the condensed steam before it is disposed down the drain. They may also supply steam regardless of whether the oven is in operation. In contrast, a connectionless combination oven has a self-contained water reservoir and heat source to create the steam required for the cooking process. This eliminates the use of a separate, central boiler system and saves energy that would have been used to supply continuous steam. Connectionless combination ovens are typically drained and refilled each day and do not require a drain of condensate or the addi-tion of cooling water.
Operation, Maintenance, and User EducationFor optimal combination oven efficiency, consider the following:
• Use the oven’s programming capabilities to control the use of the different cook-ing modes in order to minimize water and energy use, taking into account food preparation requirements. Specifically, where possible, use the steam mode and combi-mode sparingly because these modes consume water and significantly increase energy use. Instead, maximize the use of the circulated hot air mode.
• Turn the oven off or down during slow times or when not in use.
• Keep the oven doors completely closed.
• Whenever possible, maximize the amount of food cooked per use by ensuring that the combination oven is loaded to its full capacity.
• Make sure to replace gaskets when necessary and keep door hinges tight, so that the doors stay aligned and provide a good seal to retain heat or steam.
4.3 Combination Ovens

4-12 October 2012
4.3 Combination Ovens
Retrofit OptionsThere are currently no known retrofit options available on the market to increase the efficiency of combination ovens.
Replacement OptionsWhen purchasing a new combination oven or replacing an existing one, look for models that are connectionless and that use no more than 15 gallons of water per hour22 or 3.5 gallons per pan per hour.23
Combination ovens come in varying sizes, depending upon the amount and types of food cooked. Consult the manufacturer to choose a combination oven that is the appropriate size for the cooking needs of the facility. A larger-than-necessary combi-nation oven can waste water and energy to heat unused compartment space.
Savings PotentialBoiler-based combination ovens can use as much as 30 to 40 gallons of water per hour.24 Switching to a connectionless combination oven can reduce that water use to 15 gallons of water per hour or less.25
The Food Service Technology Center has a life cycle and energy cost calculator, which can be used to calculate the savings potential from replacing many types of commer-cial kitchen equipment, including combination ovens.26
To estimate facility-specific water savings and payback, the facility can also use the following information.
Current Water Use
To estimate the current water use of an existing combination oven, identify the fol-lowing information and use Equation 4-3:
• Hourly water use rate in gallons per hour. A typical boiler-based combination oven may use as much as 30 to 40 gallons per hour.
• Average daily use time. This will vary by facility.
• Days of facility operation per year.
22 East Bay Municipal Utility District (EBMUD). 2008. WaterSmart Guidebook—A Water-Use Efficiency Plan Review Guide for New Businesses. Page 43. www.ebmud.com/for-customers/conservation-rebates-and-services/commercial/watersmart-guidebook.
23 Food Service Technology Center (FSTC). Combination Ovens. www.fishnick.com/savewater/appliances/combinationovens/. 24 U.S. Environmental Protection Agency (EPA) and U.S. Energy Department’s (DOE’s) ENERGY STAR. Best Practices—How to Achieve the Most Efficient Use of Water
in Commercial Food Service Facilities. www.energystar.gov/index.cfm?c=healthcare.fisher_nickel_feb_2005.25 Ibid.26 FSTC. Commercial Foodservice Equipment Lifecycle Cost Calculators. www.fishnick.com/saveenergy/tools/calculators/.
October 2012 4-13
4.3 Combination Ovens
Equation 4-3. Water Use of Combination Oven (gallons per year)
= Water Use Rate of Combination Oven x Daily Use Time x Days of Facility Operation
Where:
• Water Use Rate of Combination Oven (gallons per hour) • Daily Use Time (hours per day) • Days of Facility Operation (days per year)
Water Use After Replacement
To estimate the water use of a replacement combination oven, use Equation 4-3, substituting the replacement combination oven’s hourly water use. Connectionless combination ovens can use 15 gallons per hour or less.
Water Savings
To calculate the water savings that can be achieved from replacing an existing com-bination oven, identify the following and use Equation 4-4:
• Current water use as calculated using Equation 4-3. • Water use after replacement as calculated using Equation 4-3.
Equation 4-4. Water Savings From Combination Oven Replacement (gallons per year)
= Current Water Use of Combination Oven – Water Use of Combination Oven After Replacement
Where:
• Current Water Use of Combination Oven (gallons per year) • Water Use of Combination Oven After Replacement (gallons per year)
Payback
To calculate the simple payback associated with the water savings from replacing an existing combination oven, consider the equipment and installation cost of the replacement combination oven, the water savings as calculated using Equation 4-4, and the facility-specific cost of water and wastewater. A combination oven can cost approximately $15,000.27
By switching to a connectionless combination oven, facilities also save a significant amount of energy by reducing the water use and steam generation associated with
27 Harris, Richard. EBMUD. March 5, 2008. “Turning up the Heat on Commercial Kitchen Water Savings.” Slide 26. www.energystar.gov/ia/partners/downloads/ meetings/water_Richard_Harris.pdf.

4-14 October 2012
4.3 Combination Ovens
the use of the combination oven. This energy savings will further reduce the payback period and increase replacement cost-effectiveness.
Additional Resources Alliance for Water Efficiency. Combination Ovens Introduction. www.allianceforwaterefficiency.org/1Column.aspx?id=650&terms=combination+ovens.
East Bay Municipal Utility District (EBMUD). 2008. WaterSmart Guidebook—A Water-Use Efficiency Plan Review Guide for New Businesses. Page FOOD8. www.ebmud.com/for-customers/conservation-rebates-and-services/commercial/watersmart- guidebook.
EPA and DOE’s ENERGY STAR. Best Practices—How to Achieve the Most Efficient Use of Water in Commercial Food Service Facilities. www.energystar.gov/index.cfm?c=healthcare.fisher_nickel_feb_2005.
Food Service Technology Center (FSTC). Combination Ovens. www.fishnick.com/savewater/appliances/combinationovens/.
FSTC. Commercial Foodservice Equipment Lifecycle Cost Calculators. www.fishnick.com/saveenergy/tools/calculators/.
Harris, Richard. EBMUD. March 5, 2008. “Turning up the Heat on Commercial Kitchen Water Savings.” www.energystar.gov/ia/partners/downloads/meetings/ water_Richard_Harris.pdf.
http://www.ebmud.com/for-customers/conservation-rebates-and-services/commercial/watersmart-guidebook
http://www.ebmud.com/for-customers/conservation-rebates-and-services/commercial/watersmart-guidebook

3.2 Toilets
WaterSense at Work: Best Management Practices for Commercial and Institutional Facilities 4-15
OverviewSteam cookers, also known as food steamers, are commercial kitchen appliances used to prepare foods in a sealed vessel that limits the escape of air or liquids below a preset pressure. There are two types of steam cookers: boiler-based and connec-tionless (i.e., without a central boiler connection).
Boiler-based steam cookers are connected to a central boiler, which delivers steam to the heating compartment. Steam that does not condense on the food escapes as a mixture of steam and condensate through a drain. In addition, some water is continu-ously bled off from the steam cooker to help reduce and manage scale buildup. Most manufacturers indicate that water supplied to the steam cooker should be under 50 parts per million (ppm) of total dissolved solids (TDS), or else bleed off should be increased.
Boiler-based steam cookers also use large amounts of water to further condense the steam and to cool (i.e., temper) the condensate water to less than 140ºF before it enters the sewer system. Most boiler-based steam cookers offer a standby setting, which maintains the boiler in a ready-to-use state. In many instances, the condensate cooling water will continue to flow even when the steam cooker is in standby mode, particularly if the condensate cooling water is controlled by a valve that must be manually turned on and off. Some boiler-based steam cookers, but not all, do allow for the condensate cooling water to be turned off while the steamer is in standby mode. Steamers that are timer-controlled will automatically switch to standby mode at the end of the set cook time, minimizing the amount of water wasted while the unit is not in use.
Connectionless steam cookers can be either completely unconnected to any water sup-ply or can be connected to a water supply to keep the water reservoir full. Connection-less steam cookers have an individual reservoir where water is heated below the steam trays to create the steam. These types of steam cookers are manually drained and refilled and do not require a dedicated drain for condensate or the addition of cooling or tempering water. A small amount of steam is vented through the top of the steam cooker, but what is not vented or condensed on the food returns as condensate to the reservoir. Connectionless steam cookers that are connected to a water supply have a float valve that maintains the water level in the reservoir, but unlike the boiler-based steam cookers, there is no continuous flow of water. This type of steam cooker is usually as efficient as other connectionless models that are not connected to a water supply.
Steam cookers can achieve lower idle energy rates and reduce the amount of steam needed and water used by reducing the temperature of the compartment during standby mode, not continuously supplying steam to the cooking compartment, and adding insulation. To address these efficiency advances in commercial steam cook-ers, the U.S. Environmental Protection Agency (EPA) and U.S. Energy Department’s (DOE’s) ENERGY STAR® has developed voluntary criteria to qualify energy-efficient—and thus, water-efficient—steam cookers. ENERGY STAR qualified models must meet minimum cooking efficiency and maximum idle energy rate requirements.
4.4 Steam Cookers

4-16 October 2012
4.4 Steam Cookers
ENERGY STAR qualified steam cookers typically use at least 90 percent less water when compared to standard steam cooker models. ENERGY STAR qualified steam cookers use an average of 3 gallons of water per hour, while standard models typi-cally use 40 gallons of water per hour.
Operation, Maintenance, and User EducationFor optimal steam cooker efficiency, consider the following:
• Use batch production as opposed to staged loading of food pans (i.e., do not continuously open the door to load and unload food pans).
• In a multi-pan steamer, if possible, fill the steam cooker to capacity instead of cooking one pan at a time.
• Keep the doors closed while the steamer is operating.
• Use only as many steamer compartments as needed.
• Use a timer to ensure that the steam cooker returns to standby mode after use.
• Turn the steam cooker off during long periods of non-use. This will reduce water and energy use associated with keeping the steam cooker in stand-by mode.
• Fix and repair any leaks. Remove any deposit buildup from the boiler on boiler-based models.
Retrofit OptionsThere are currently no known retrofit options available on the market to increase the water efficiency of steam cookers.
Replacement OptionsSteam cookers come in several sizes with varying numbers of boiler pans. Be sure to choose a steam cooker that is of the appropriate size for the steam cooking needs of the facility. A larger-than-necessary steam cooker can waste water and energy to heat unused compartment space.
When purchasing a new steam cooker or replacing an existing one, choose models that are ENERGY STAR qualified.28
Savings PotentialENERGY STAR qualified steam cookers can use 90 percent less water and 50 percent less energy as standard steam cookers.29 Traditional boiler-based steam cookers use as much as 40 gallons of water per hour. Switching to an ENERGY STAR qualified steam cooker can reduce that water use to 3 gallons of water per hour or less.
28 U.S. Environmental Protection Agency (EPA) and U.S. Energy Department’s (DOE’s) ENERGY STAR. Commercial Steam Cookers. www.energystar.gov/index.cfm?fuseaction=find_a_product.showProductGroup&pgw_code=COC.
29 Ibid.

October 2012 4-17
4.4 Steam Cookers
Use ENERGY STAR’s commercial kitchen equipment savings calculator30 to estimate facility-specific water, energy, and cost savings for replacing an existing boiler-based steam cooker with an ENERGY STAR qualified model.
The Food Service Technology Center also has a life cycle and energy cost calculator, which can be used to calculate the savings potential from replacing many types of commercial kitchen equipment, including steam cookers.31
To estimate facility-specific water savings and payback, the facility can also use the following information.
Current Water Use
To estimate the water use of a steam cooker, identify the following information and use Equation 4-5:
• Water use rate of the existing steam cooker, typically provided in gallons per hour. • Average daily use time. • Days of facility operation per year.
Equation 4-5. Water Use of Steam Cooker (gallons per year)
= Steam Cooker Water Use Rate x Daily Use Time x Days of Operation
Where:
• Steam Cooker Water Use Rate (gallons per hour) • Daily Use Time (hours per day) • Days of Operation (days per year)
Water Use After Replacement
To estimate the water use after replacing an existing steam cooker with an ENERGY STAR qualified steam cooker, use Equation 4-5, substituting the water use of the ENERGY STAR qualified steam cooker for the water use of the existing steam cooker.
Water Savings
To calculate the water savings that can be achieved from replacing an existing steam cooker, identify the following information and use Equation 4-6:
• Current water use as calculated using Equation 4-5. • Water use after replacement as calculated using Equation 4-5.
30 EPA and DOE’s ENERGY STAR. Savings Calculator for ENERGY STAR Qualified Commercial Kitchen Equipment. www.energystar.gov/ia/business/bulk_purchasing/bpsavings_calc/commercial_kitchen_equipment_calculator.xls.
31 Food Service Technology Center. Commercial Foodservice Equipment Lifecycle Cost Calculator. www.fishnick.com/saveenergy/tools/calculators/.

4-18 October 2012
4.4 Steam Cookers
Equation 4-6. Water Savings From Steam Cooker Replacement (gallons per year)
= Current Water Use of Steam Cooker – Water Use of Steam Cooker After Replacement
Where:
• Current Water Use of Steam Cooker (gallons per year) • Water Use of Steam Cooker After Replacement (gallons per year)
Payback
To calculate the simple payback from the water savings associated with replacing an existing steam cooker, consider the equipment and installation cost of the ENERGY STAR qualified steam cooker, the water savings as calculated in Equation 4-6, and the facility-specific cost of water and wastewater.
By switching to an ENERGY STAR qualified steam cooker, facilities can also save a significant amount of energy. ENERGY STAR qualified steam cookers can use half as much energy as standard steam cookers.32 This energy savings will further reduce the payback period and increase replacement cost-effectiveness.
Additional ResourcesAlliance for Water Efficiency. Food Steamers Introduction. www.allianceforwaterefficiency.org/1Column.aspx?id=642&terms=steam.
East Bay Municipal Utility District. 2008. WaterSmart Guidebook—A Water-Use Efficiency Plan Review Guide for New Businesses. Pages FOOD7-8. www.ebmud.com/for-customers/conservation-rebates-and-services/commercial/watersmart- guidebook.
EPA and DOE’s ENERGY STAR. Commercial Steam Cookers. www.energystar.gov/index.cfm?fuseaction=find_a_product.showProductGroup&pgw_code=COC#buying.
Food Service Technology Center (FSTC). Commercial Foodservice Equipment Life-cycle Cost Calculators. www.fishnick.com/saveenergy/tools/calculators/.
FSTC. Steamers. www.fishnick.com/savewater/appliances/steamers/.
32 EPA and DOE’s ENERGY STAR. Commercial Steam Cookers, op. cit.
http://www.ebmud.com/for-customers/conservation-rebates-and-services/commercial/watersmart-guidebook
http://www.ebmud.com/for-customers/conservation-rebates-and-services/commercial/watersmart-guidebook

3.2 Toilets
WaterSense at Work: Best Management Practices for Commercial and Institutional Facilities 4-19
OverviewSteam kettles are boiler-based or self-contained cooking appliances that use circula-ting steam to perform tasks similar to traditional stockpots, including boiling pasta and simmering sauces. Steam kettles may be preferable to traditional stockpots due to their rapid, uniform cooking and ease of control.
Steam kettles have a double wall that covers at least half of the height of the sides of the kettle. Steam is circulated within this double wall, or “jacket,” then condenses to transfer heat to the food product by means of conduction. Steam kettles range in capacity from 0.5 gallon to more than 200 gallons each.33 Steam kettles can also be designed with tilting capability, strainers, and covers.
Boiler-based steam kettles rely on an external central boiler to deliver steam. These types of steam kettles are commonly found in large facilities with centrally located boilers. Boiler-based steam kettles require a regular blowdown to remove conden-sate on the steam supply line and can consume more than 100,000 gallons of water per year. Returning condensate to the boiler as make-up water can reduce this water consumption.34
Self-contained steam kettles rely on their own heat source to generate steam under pressure (see Figure 4-2). Self-contained steam kettles use less water and energy than boiler-based steam kettles because they do not require significant blowdown water. Boiler water must be dumped at the end of the day to prevent mineral buildup. They also require de-liming on a regular basis and regular manual venting and refilling.35
Figure 4-2. Self-Contained Steam Kettle
Water or Product
Steam
Inner J
acke
t
Boiling WaterHeating
Elements
Oute
r Jac
ket
4.5 Steam Kettles
33 The Northeast Center for Food Entrepreneurship at the New York State Food Venture Center, Cornell University. January 2007. Steam Kettles in Food Processing: Fact Sheets for the Small Scale Food Entrepreneur. necfe.foodscience.cornell.edu/publications/fact-sheets.php.
34 East Bay Municipal Utility District. 2008. WaterSmart Guidebook—A Water-Use Efficiency Plan Review Guide for New Businesses. Page FOOD6. www.ebmud.com/for-customers/conservation-rebates-and-services/commercial/watersmart-guidebook.
35 The Northeast Center for Food Entrepreneurship at the New York State Food Venture Center, Cornell University, op. cit.

4-20 October 2012
4.5 Steam Kettles
Operation, Maintenance, and User EducationFor optimal steam kettle efficiency, consider the following:
• Regularly monitor self-contained steam kettle water levels and maintain tem-perature control components to ensure efficient operation.
• Turn the steam kettle down or off between uses.
• Make sure the steam kettle lid is secured whenever possible to reduce the amount of energy required for simmering and boiling.
Retrofit OptionsSince the steam does not come into contact with the food, if a boiler-based steam kettle is used, a condensate return system can be installed to direct the conden-sate back into the central boiler system for reuse (see Figure 4-3). This process will improve both water and energy efficiency because the condensate can be used as boiler make-up water. Facilities can purchase packaged condensate return systems from most steam equipment suppliers and plumb them directly into an existing sys-tem. Insulating condensate return lines will further improve their efficiency.
Figure 4-3. Boiler-Type Steam Kettle
Replacement OptionsWhen purchasing a new steam kettle or replacing an old one, consider the kettle cooking needs of the kitchen. For smaller needs, consider a self-contained steam kettle without an external boiler, which uses less water and energy than boiler-based steam kettles. If daily operations require a boiler-based steam kettle, consider a mod-el with a condensate return system. Be sure to choose a steam kettle with a properly sized steam trap, to prevent inadvertent dumping of condensate.
SteamTrap Condensate Return
Steam SupplyWater or Product
Steam
Inner J
acke
t
Oute
r Jac
ket

October 2012 4-21
4.5 Steam Kettles
Savings PotentialRetrofitting or replacing existing steam kettles can yield significant water savings. For a boiler-based steam kettle, the water savings achieved by returning the condensate to the boiler can be substantial. Actual water savings are difficult to approximate because the water use of a steam kettle varies based on its size and the pressure of the steam.
To estimate facility-specific water savings and payback, use the following informa-tion.
Current Water Use
To estimate the water use of a steam kettle, identify the following information and use Equation 4-7:
• Water use per day of the existing steam kettle. The equipment manufacturer or vendor should be able to help determine the daily water use.
• Days of facility operation per year.
Equation 4-7. Water Use of Steam Kettle (gallons per year)
= Water Use of Steam Kettle x Days of Facility Operation
Where:
• Water Use of Steam Kettle (gallons per day) • Days of Facility Operation (days per year)
Water Use After Retrofit or Replacement
To estimate the water use after retrofitting or replacing an existing steam kettle, use Equation 4-7, substituting water use of the new configuration or new system for the water use of the existing steam kettle.
Water Savings
To calculate the water savings that can be achieved from retrofitting or replacing an existing steam kettle, identify the following information and use Equation 4-8:
• Current water use as calculated using Equation 4-7. • Water use after retrofit or replacement as calculated using Equation 4-7.

4-22 October 2012
4.5 Steam Kettles
Equation 4-8. Water Savings From Steam Kettle Retrofit or Replacement (gallons per year)
= Current Water Use of Steam Kettle – Water Use of Steam Kettle After Retrofit or Replacement
Where:
• Current Water Use of Steam Kettle (gallons per year) • Water Use of Steam Kettle After Retrofit or Replacement (gallons per
year)
Payback
To calculate the simple payback associated with the water savings from retrofitting or replacing an existing steam kettle, consider the equipment and installation cost of the retrofit or replacement, the water savings as calculated in Equation 4-8, and the facility-specific cost of water and wastewater.
By switching to a self-contained steam kettle or by returning condensate back to the boiler in a boiler-based system, facilities can also save a significant amount of energy. This energy savings will further reduce the payback period and increase replacement cost-effectiveness.
Additional ResourcesDOE, Energy Efficiency & Renewable Energy, Federal Energy Management Program. Best Management Practice: Commercial Kitchen Equipment. www1.eere.energy.gov/femp/program/waterefficiency_bmp11.html.
East Bay Municipal Utility District. 2008. WaterSmart Guidebook—A Water-Use Effi-ciency Plan Review Guide for New Businesses. Pages FOOD5-6. www.ebmud.com/for-customers/conservation-rebates-and-services/commercial/watersmart-guidebook.
Food Service Technology Center. Steam Kettles. www.fishnick.com/equipment/appliancetypes/steamkettles.
The Northeast Center for Food Entrepreneurship at the New York State Food Venture Center, Cornell University. January 2007. Steam Kettles in Food Processing: Fact Sheets for the Small Scale Food Entrepreneur. necfe.foodscience.cornell.edu/publications/fact-sheets.php.
Robert M. Kerr Food & Agricultural Products Center. Food Technology Fact Sheet: Steam Kettle Hookup. www.fapc.okstate.edu/files/factsheets/fapc120.pdf.
http://www.ebmud.com/for-customers/conservation-rebates-and-services/commercial/watersmart-guidebook

3.2 Toilets
WaterSense at Work: Best Management Practices for Commercial and Institutional Facilities 4-23
Overview A wok stove is a Chinese pit-style stove that has a wok, or multiple woks, recessed into the stove top, allowing heat to be fully directed onto the bottom of the wok. Wok stoves can use water for cooling, cleaning, and cooking.36
Cooling
In a conventional water-cooled wok stove, the burner chimney and ring are affixed to the top of the stove, trapping heat under the cooktop. To absorb the heat and keep the cooktop cool, water jets spray cooling water across the cooktop at a rate of ap-proximately 1.0 gallon per minute (gpm) per burner.
Cleaning
Wok stoves can be outfitted with a rinsing spout used to rinse and clean the wok between uses. In many cases, the rinsing spout might be left running continuously, even when not in use, because the operator may not have time to turn it off.
Cooking
Many wok stoves also have a separate reservoir tap that fills a small reservoir used for cooking. As with rinsing spouts, the reservoir tap might be left running continuously even when the reservoir is full.
An illustration of a conventional water-cooled wok stove is shown in Figure 4-4.
4.6 Wok Stoves
Wok stoves
36 Sydney Water. Wok stoves: The waterless wok stove. www.sydneywater.com.au/Water4Life/InYourBusiness/FactSheets.cfm.

4-24 October 2012
4.6 Wok Stoves
Figure 4-4. Water-Cooled Wok Stove
Waterless wok stoves, a relatively new technology, are cooled with air, and thus do not require the use of cooling water. One such type of wok stove functions by creat-ing an air gap between the burner chimney and ring and the top of the stove, so that the heat can be released directly from beneath the cooktop and vented to the kitchen exhaust (see Figure 4-5). This eliminates the need for cooling water entirely. Waterless wok stoves can further reduce water use if they are outfitted with a rinsing spout that shuts off the water supply when it is not needed for wok cleaning. In ad-dition, waterless wok stoves may have a mechanism such as a knee-operated timer reservoir tap that limits both the flow rate and duration of flow of the reservoir tap.37
Another new wok stove technology connects to a built-in recirculation loop origina-ting from under the wok stove cooktop to recirculate cooling water via an external point-of-use chiller. This type of wok stove has an internal backup water-using system in the event that the recirculated chilled water is not available. A study of this type of wok stove conducted by the Food Service Technology Center showed negligible energy use associated with the use of the external chiller.38
37 Alliance for Water Efficiency. Waterless Wok Introduction. www.allianceforwaterefficiency.org/1Column.aspx?id=700.38 Sham, Kong and Zabrowski, David. Food Service Technology Center. March 2010. Wok Water Saver Performance Test. Prepared for Pacific Gas & Electric Company.
www.fishnick.com/publications/appliancereports/rangetops/Wok_Water_Saver.pdf.

October 2012 4-25
Figure 4-5. One Type of Air-Cooled Wok Stove
By replacing conventional wok stoves with waterless or recirculating chilled water models and reducing the flow rate and duration of rinse spouts and reservoir taps, facilities could use 90 percent less water than normally required for cooling, cleaning, and cooking in wok stoves.39
Operation, Maintenance, and User EducationFor optimal wok stove efficiency, consider the following:
• Encourage cooking staff to turn off rinse spouts and reservoir taps when not in use.
• Inspect and ensure the shut-off valves for the rinse spouts and reservoir taps are in working order.
• Ensure the cooling water is shut off when the wok stove is not in use, especially at the end of each day.
• Routinely check cooling water lines for leaks and corrosion.
4.6 Wok Stoves
39 Sydney Water, op. cit.

4-26 October 2012
4.6 Wok Stoves
Retrofit OptionsIf retrofitting an existing conventional wok stove, check to see if rinse spouts can be replaced with spouts that automatically shut off or that can switch off when pushed back away from the wok.
Replacement OptionsWhen purchasing a new wok stove or replacing an existing conventional wok stove, look for models that are considered waterless, or are air-cooled instead of water-cooled. Waterless wok stoves can use about 2 percent more energy than a conven-tional wok stove,40 but they can use 90 percent less water. Alternatively, look for models that use recirculated chilled water. Also, consider models that have automatic shut-off rinse spouts and/or knee-operated timer reservoir taps to limit both the flow rate and duration of the flow to the rinse spout and reservoir tap.
Savings PotentialWater savings can be achieved through two mechanisms: eliminating the use of cooling water and reducing the flow rate and duration of use of rinse spouts and reservoir tap.
To calculate facility-specific water savings and payback, use the following information.
Wok Stove Retrofit
Wok cleaning and cooking activities can use 500 to 800 gallons of water per day, particularly if the rinse spouts and reservoir taps are left constantly running. Retrofitting the wok stove to reduce the flow rate and duration of use of rinse spouts and reservoir taps can significantly reduce water use associated with wok cleaning and cooking.
Current Water Use
To estimate the current water use of the existing wok stove rinse and reservoir spouts, identify the following information and use Equation 4-9:
• Flow rate of each rinse and reservoir spout. • Average daily use time of rinse and reservoir spouts. • Number of days the facility operates each year.
40 International Association of Plumbing and Mechanical Officials (IAPMO). 2010. “2010’s Top-5 New and Innovative Water Efficient Products.” Green Newsletter. forms.iapmo.org/newsletter/green/2010/05/2010_Top5.asp.

October 2012 4-27
4.6 Wok Stoves
Equation 4-9. Water Use of Wok Stove Rinse and Reservoir Spouts (gallons per year)
= Flow Rate of Rinse or Reservoir Spout x Daily Use Time x Days of Facility Operation
Where:
• Flow Rate of Rinse or Reservoir Spout (gallons per minute) • Daily Use Time (minutes per day) • Days of Facility Operation (days per year)
Water Use After Retrofit
To estimate the water use of more efficient rinse and reservoir spouts, use Equation 4-9, substituting the flow rate and use time of the retrofit rinse and reservoir spouts.
Water Savings
To calculate the water savings from the retrofit of an existing wok stove with more ef-ficient rinse and reservoir spouts, identify the following information and use Equation 4-10:
• Current water use as calculated using Equation 4-9. • Water use after retrofit using Equation 4-9.
Equation 4-10. Water Savings From Wok Stove Rinse and Reservoir Spout Retrofit (gallons per year)
= Current Water Use of Wok Stove Rinse and Reservoir Spouts – Water Use of Wok Stove After Retrofit of Rinse and Reservoir Spouts
Where:
• Current Water Use of Wok Stove Rinse and Reservoir Spouts (gallons per year)
• Water Use of Wok Stove After Retrofit of Rinse and Reservoir Spouts (gallons per year)
Payback
To calculate the simple payback from the water savings associated with retrofitting an existing wok stove with more efficient rinse and reservoir spouts, consider the equipment and installation cost of the retrofit rinse and reservoir spouts, the water savings as calculated using Equation 4-10, and the facility-specific cost of water and wastewater.

4-28 October 2012
4.6 Wok Stoves
Wok Stove Replacement
During the course of a 12-hour day, a conventional water-cooled wok stove can use more than 700 gallons of water. Switching to a waterless wok or one that uses recir-culated chilled water can eliminate this use of single-pass cooling water. To estimate facility-specific water savings and payback, use the following information.
Water Use and Savings
To estimate the water used for cooling of a conventional wok stove and subsequent water savings associated with a waterless wok stove or one that uses recirculated chilled water, identify the following information and use Equation 4-11:
• Flow rate of the cooling water. This flow rate is typically 1.0 gpm. • Average daily use time. • Days of facility operation per year.
Equation 4-11. Water Use and Savings From Water-Cooled Wok Stove Replacement (gallons per year)
= Current Wok Stove Cooling Water Flow Rate x Daily Use Time x Days of Facility Operation
Where:
• Current Wok Stove Cooling Water Flow Rate (gallons per minute) • Daily Use Time (minutes per day) • Days of Facility Operation (days per year)
Payback
To calculate the simple payback from the water savings associated with replacing an exis-ting conventional wok stove, consider the equipment and installation cost of the replace-ment waterless wok stove or one that uses recirculated chilled water, the water savings as calculated using Equation 4-11, and the facility-specific cost of water and wastewater.
The facility should also consider the energy impact of replacing old equipment. Waterless wok stoves can use about 2 percent more energy than a conventional wok stove,41 but they use at least 90 percent less water.
Additional ResourcesAlliance for Water Efficiency. Waterless Wok Introduction. www.allianceforwaterefficiency.org/1Column.aspx?id=700.
City West Water Limited. Programs and Assistance, Woking the Way to Water Savings. www.citywestwater.com.au/business/programs_and_assistance_woking_the_way_to_water_savings.aspx.
41 IAPMO, op. cit.

October 2012 4-29
International Association of Plumbing and Mechanical Officials. 2010. “2010’s Top-5 New and Innovative Water Efficient Products.” Green Newsletter. forms.iapmo.org/newsletter/green/2010/05/2010_Top5.asp.
Sydney Water. Wok stoves: The waterless wok stove. www.sydneywater.com.au/Water4Life/InYourBusiness/FactSheets.cfm.
4.6 Wok Stoves

4-30 WaterSense at Work: Best Management Practices for Commercial and Institutional Facilities
OverviewDipper wells are used in some restaurants, coffee houses, and ice cream shops to rinse utensils between uses. Most dipper wells have a single spigot and a valve that controls the flow of either hot or cold water into a receiving well. Shops often have dipper wells running constantly during service hours to provide a continuous ex-change of the water in the well, in order to reduce the potential for bacterial growth.
Dipper wells have flow rates between 0.5 and 1.0 gallon per minute (gpm).42
Food service locations should ensure that the requirements of the U.S. Department of Health and Human Services Food Code43 are met when considering changes to facility operations that may involve installing, retrofitting, or replacing a dipper well.
Operation, Maintenance, and User EducationFor optimal dipper well efficiency, consider the following:
• Turn off water when service periods are slow and the dipper well is not in use. Also, turn off the water to the dipper well at the end of each day. Be sure to clean the dipper well prior to restarting the water in order to remove any bacterial buildup.
• Keep the flow rate of the dipper well valve at its minimum level. Some munici-palities recommend no more than 0.3 gpm.44
• Consider rinsing utensils with a sink faucet only as needed, rather than using the dipper well.
Retrofit OptionsTo reduce the water use associated with a dipper well, consider installing an in-line flow restrictor to reduce the flow rate from 0.5 or 1.0 gpm to 0.3 gpm.
Replacement OptionsWhen looking to replace dipper wells, consider these options:
• Install a push-button, metered faucet for utensil rinsing.
• If the facility has enough utensils to run full dishwasher loads, consider installing an ENERGY STAR® qualified, commercial undercounter dishwasher45 to replace the dipper well to wash utensils after use. These commercial dishwashers can use less than 1.0 gallon per rack.
4.7 Dipper Wells
42 East Bay Municipal Utility District (EBMUD). 2008. WaterSmart Guidebook—A Water-Use Efficiency Plan Review Guide for New Businesses. Pages FOOD8-9. www.ebmud.com/for-customers/conservation-rebates-and-services/commercial/watersmart-guidebook.
43 U.S. Food and Drug Administration (FDA). FDA Food Code 2009: Chapter 3—Food. Sections 3-304.11 and 3-304.12. www.fda.gov/Food/FoodSafety/ RetailFoodProtection/FoodCode/FoodCode2009/ucm186451.htm.
44 Arizona Department of Water Resources. Implementing a Water Management Plan Checklist for Facility Managers. Page 8. www.azwater.gov/azdwr/StatewidePlanning/Conservation2/CommercialIndustrial/FacilityManagers.htm.
45 U.S. Environmental Protection Agency (EPA) and U.S. Energy Department’s (DOE’s) ENERGY STAR. Commercial Dishwashers. www.energystar.gov/index.cfm?fuseaction=find_a_product.showProductGroup&pgw_code=COH.

October 2012 4-31
4.7 Dipper Wells
Savings PotentialWater savings can be achieved in two ways: by retrofitting the dipper well to reduce the flow rate or by replacing a dipper well with a metered faucet or an ENERGY STAR qualified commercial undercounter dishwasher.
Dipper Well Retrofit With In-Line Flow Restrictor
Retrofitting a dipper well with an in-low flow restrictor can be a simple way to save water.
Current Water Use
To estimate the water use of an existing dipper well, identify the following informa-tion and use Equation 4-12:
• Flow rate of the existing dipper well. Most dipper wells have flow rates between 0.5 and 1.0 gpm.46
• Average daily use time.
• Days of facility operation per year.
Equation 4-12. Water Use of Dipper Well (gallons per year)
= Dipper Well Flow Rate x Daily Use Time x Days of Facility Operation
Where:
• Dipper Well Flow Rate (gallons per minute) • Daily Use Time (minutes per day) • Days of Facility Operation (days per year)
Water Use After Retrofit
To estimate the water use after retrofitting an existing dipper well with an in-line flow restrictor, use Equation 4-12, substituting the flow rate of the retrofit in-line flow restrictor for the flow rate of the existing dipper well. An efficient, retrofit in-line flow restrictor should provide a maximum flow rate of 0.3 gpm.
Water Savings
To calculate the water savings that can be achieved from retrofitting an existing dip-per well, identify the following information and use Equation 4-13:
• Current water use as calculated using Equation 4-12. • Water use after retrofit as calculated using Equation 4-12.
46 EBMUD, op. cit.
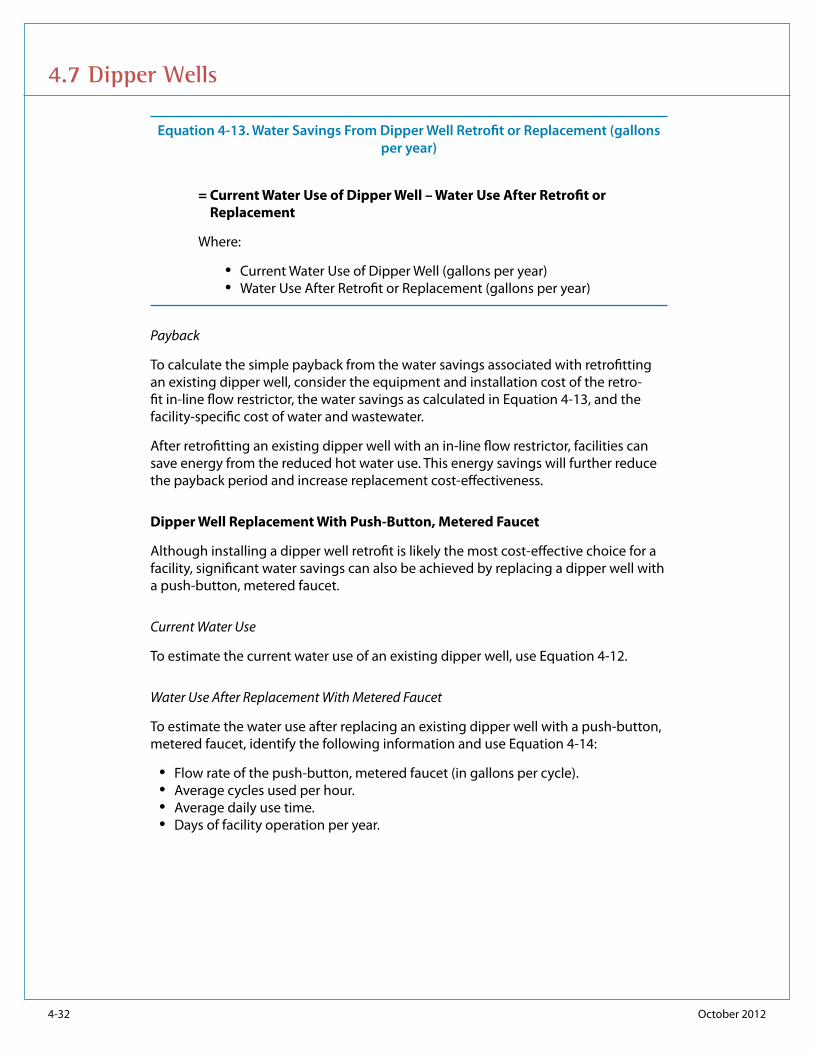
4-32 October 2012
4.7 Dipper Wells
Equation 4-13. Water Savings From Dipper Well Retrofit or Replacement (gallons per year)
= Current Water Use of Dipper Well – Water Use After Retrofit or Replacement
Where:
• Current Water Use of Dipper Well (gallons per year) • Water Use After Retrofit or Replacement (gallons per year)
Payback
To calculate the simple payback from the water savings associated with retrofitting an existing dipper well, consider the equipment and installation cost of the retro-fit in-line flow restrictor, the water savings as calculated in Equation 4-13, and the facility-specific cost of water and wastewater.
After retrofitting an existing dipper well with an in-line flow restrictor, facilities can save energy from the reduced hot water use. This energy savings will further reduce the payback period and increase replacement cost-effectiveness.
Dipper Well Replacement With Push-Button, Metered Faucet
Although installing a dipper well retrofit is likely the most cost-effective choice for a facility, significant water savings can also be achieved by replacing a dipper well with a push-button, metered faucet.
Current Water Use
To estimate the current water use of an existing dipper well, use Equation 4-12.
Water Use After Replacement With Metered Faucet
To estimate the water use after replacing an existing dipper well with a push-button, metered faucet, identify the following information and use Equation 4-14:
• Flow rate of the push-button, metered faucet (in gallons per cycle). • Average cycles used per hour. • Average daily use time. • Days of facility operation per year.

October 2012 4-33
4.7 Dipper Wells
Equation 4-14. Water Use of Push-Button, Metered Faucet (gallons per year)
= Flow Rate of Push-Button, Metered Faucet x Uses per Hour x Daily Use Time x Days of Facility Operation
Where:
• Flow Rate of Push-Button, Metered Faucet (gallons per cycle) • Uses per Hour (cycles per hour) • Daily Use Time (hours per day) • Days of Facility Operation (days per year)
Water Savings
To calculate the water savings that can be achieved from replacing an existing dipper well with a push-button, metered faucet, identify the following information and use Equation 4-13:
• Current water use as calculated using Equation 4-12. • Water use after replacement as calculated using Equation 4-14.
Payback
To calculate the simple payback from the water savings associated with replacing an existing dipper well with a push-button, metered faucet, consider the equipment and installation cost of installing the new push-button, metered faucet; the water savings as calculated in Equation 4-13; and the facility-specific cost of water and wastewater.
After replacing an existing dipper well with a push-button, metered faucet, facilities may save energy from the reduced hot water use. This energy savings will further reduce the payback period and increase replacement cost-effectiveness.
Dipper Well Replacement With an ENERGY STAR Qualified Dishwasher
Although installing a dipper well retrofit is likely the most cost-effective choice for a facility, significant water savings can also be achieved by replacing a dipper well with an ENERGY STAR qualified commercial undercounter dishwasher.
Current Water Use
To estimate the current water use of an existing dipper well, use Equation 4-12.

4-34 October 2012
4.7 Dipper Wells
Water Use After Replacement With an ENERGY STAR Qualified Dishwasher
To estimate the water use after replacing an existing dipper well with an ENERGY STAR qualified commercial undercounter dishwasher, identify the following informa-tion and use Equation 4-15:
• Water use per rack washed. A high-temperature, ENERGY STAR qualified commer-cial undercounter dishwasher uses 1.0 gallons per rack or less. A low-temperature model uses 1.7 gallons per rack or less.47
• Average estimate of racks washed per day.
• Days of facility operation per year.
Equation 4-15. Water Use of an ENERGY STAR Qualified Commercial, Undercounter Dishwasher (gallons per year)
= Water Use per Rack x Racks Washed per Day x Days of Facility Operation
Where:
• Water Use per Rack (gallons per rack) • Racks Washed per Day (racks per day) • Days of Facility Operation (days per year)
Water Savings
To calculate the water savings that can be achieved from replacing an existing dipper well with an ENERGY STAR qualified commercial undercounter dishwasher, identify the following information and use Equation 4-13:
• Current water use as calculated using Equation 4-12. • Water use after replacement as calculated using Equation 4-15.
Payback
To calculate the simple payback from the water savings associated with replacing an existing dipper well with an ENERGY STAR qualified commercial undercounter dishwasher, consider the equipment and installation cost of the new dishwasher, the water savings as calculated in Equation 4-13, and the facility-specific cost of water and wastewater. Installing a new ENERGY STAR qualified commercial undercounter dishwasher can cost approximately $6,000.48
The facility should also consider the energy impact of replacing the dipper well with an ENERGY STAR qualified dishwasher. The dishwasher might use less hot water than the dipper well, but it also uses energy to run cleaning cycles.
47 EPA and DOE’s ENERGY STAR. Commercial Dishwashers Key Product Criteria. www.energystar.gov/index.cfm?c=comm_dishwashers.pr_crit_comm_dishwashers.48 EPA and DOE’s ENERGY STAR. Life Cycle Cost Estimate for 1 ENERGY STAR Qualified Commercial Dishwasher(s). www.energystar.gov/ia/business/bulk_purchasing/
bpsavings_calc/CalculatorCommercialDishwasher.xls.

October 2012 4-35
4.7 Dipper Wells
Additional ResourcesArizona Department of Water Resources. Implementing a Water Management Plan Checklist for Facility Managers. Page 8. www.azwater.gov/azdwr/StatewidePlanning/Conservation2/CommercialIndustrial/FacilityManagers.htm.
Brean, Henry. June 8, 2009. “UNLV professor targets ‘wasteful’ dipper wells.” Las Vegas Review-Journal. www.lvrj.com/news/47195482.html.
East Bay Municipal Utility District. 2008. WaterSmart Guidebook—A Water-Use Efficiency Plan Review Guide for New Businesses. Pages FOOD8-9. www.ebmud.com/ for-customers/conservation-rebates-and-services/commercial/watersmart-guidebook.
EPA and DOE’s ENERGY STAR. Best Practices—How to Achieve the Most Efficient Use of Water in Commercial Food Service Facilities. www.energystar.gov/index.cfm?c=healthcare.fisher_nickel_feb_2005.
EPA and DOE’s ENERGY STAR. Commercial Dishwashers Key Product Criteria. www.energystar.gov/index.cfm?c=comm_dishwashers.pr_crit_comm_dishwashers.
http://www.ebmud.com/for-customers/conservation-rebates-and-services/commercial/watersmart-guidebook

4-36 WaterSense at Work: Best Management Practices for Commercial and Institutional Facilities
OverviewCommercial pre-rinse spray valves are spray nozzles that use water under pressure to remove food residue from plates, pots, pans, and other kitchen utensils prior to sani-tation in a dishwasher. Pre-rinse spray valves designed for commercial dishwashing are different from spray valves used for filling glasses, pots, or kettles and for washing down countertops, floors, and other kitchen areas, all of which typically have very dif-ferent usage patterns and higher flow rates. These other types of spray valves are not the focus of this section. Sink faucets for commercial kitchen use are covered under Section 3.4: Faucets.
Pre-rinse spray valves designed for commer-cial dishwashing are connected to a hose, which is connected to the water supply. These handheld devices consist of a spray nozzle, a squeeze lever that controls the water flow, and a dish guard bumper. They often include a spray handle clip, allowing the user to lock the lever at full spray for continual use, which can reduce hand irrita-tion. They can be installed at the end of a flexible stainless steel hose and can include a foot-operated, on-off lever. Pre-rinse spray valves are usually located at the entrance to a dishwasher or over a sink and are used in conjunction with a faucet fixture.
The Energy Policy Act (EPAct) of 2005 established the maximum allowable flow rate for all commercial pre-rinse spray valves sold in the United States at 1.6 gallons per minute (gpm). Older models can use between 3.0 and 4.5 gpm. Since EPAct 2005 established maximum flow rate requirements, more efficient products have been developed with flow rates as low as 0.65 gpm.
The U.S. Environmental Protection Agency’s (EPA’s) WaterSense® program is con-sidering a label for high-efficiency pre-rinse spray valves, with plans to set a water-efficiency level at least 20 percent below the federal standard and address product performance. Replacing a pre-rinse spray valve that flows at 1.6 gpm or higher with one that is at least 20 percent more water-efficient will result in significant water and energy savings and a simple payback period of less than one year for most facilities.
Operation, Maintenance, and User EducationFor optimal pre-rinse spray valve efficiency, system pressure should be tested to ensure that it is between 20 and 80 pounds per square inch (psi). This will ensure that the pre-rinse spray valve will deliver the expected flow and performance. In addition, consider the following:
4.8 Pre-Rinse Spray Valves
Pre-rinse spray valve

October 2012 4-37
4.8 Pre-Rinse Spray Valves
• Ensure that the pre-rinse spray valve unit’s hose height is appropriate for the user (i.e., neither too high nor too low). If the pre-rinse spray valve is not situated at an optimal height, users could choose to use other kitchen sprayers, which may have higher flow rates.
• To decrease water use, train users to manually scrape as much food waste from dishes as possible before using the pre-rinse spray valve.
• If possible, pre-soak heavily soiled dishes in a basin of water to loosen food residue.
• Train users how to properly use the always-on clamp, if avail-able. Improper use of the always-on clamp could lead to unnecessary water waste. If a constant stream of water is not necessary, train users to manually depress the pre-rinse spray valve handle only when water is needed.
• Periodically inspect pre-rinse spray valves for scale buildup to ensure flow is not being restricted. There are certain cleaning products designed to dissolve scale buildup from pre-rinse spray valves. Do not attempt to bore holes in the pre-rinse spray valve, as this may lead to increased water use or cause performance problems. If scale cannot be removed, consider replacing the pre-rinse spray valve with a new model.
• Periodically inspect pre-rinse spray valves for leaks and bro-ken or loose parts. If necessary and possible, tighten screws and fittings to stop leakage. If the product cannot be manu-ally adjusted to perform properly, consider replacing the pre-rinse spray valve.
• Conduct routine inspections for leaks and train appropriate custodial and clean-ing personnel and users to identify and report leaks.
Retrofit OptionsBecause pre-rinse spray valves are relatively inexpensive, consider replacement rath-er than a retrofit or extensive repair. In general, avoid retrofitting existing, inefficient pre-rinse spray valves with flow control inserts (which restrict water flow) to reduce the flow rate. These devices might not provide adequate performance in some facili-ties, thereby increasing use time and total water used.
Replacement OptionsWhen installing new pre-rinse spray valves or replacing older, inefficient pre-rinse spray valves, choose models with flow rates of 1.3 gpm or less.
User manually depressing pre-rinse spray valve handle during use

4-38 October 2012
4.8 Pre-Rinse Spray Valves
Savings PotentialWater savings can be achieved by replacing existing pre-rinse spray valves. Because water use of pre-rinse spray valves is dependent on facility operations and factors such as average throughput, water savings will vary by facility. To estimate facility-specific water savings and payback, use the following information.
Current Water Use
To estimate the current water use of a pre-rinse spray valve, identify the following information and use Equation 4-16:
• Flow rate of the existing pre-rinse spray valve. Pre-rinse spray valves installed af-ter 2005 have flow rates of 1.6 gpm or less. Pre-rinse spray valves installed before 2005 can have flow rates of up to 4.5 gpm.
• Average daily use time. This will vary by facility, but facilities typically use pre-rinse spray valves for no more than 200 minutes per day.49
• Days of facility operation per year.
Equation 4-16. Water Use of Pre-Rinse Spray Valve (gallons per year)
= Flow Rate of Pre-Rinse Spray Valve x Daily Use Time x Days of Facility Operation
Where:
• Flow Rate of Pre-Rinse Spray Valve (gallons per minute) • Daily Use Time (minutes per day) • Days of Facility Operation (days per year)
Water Use After Replacement
To estimate the water use of a more efficient replacement pre-rinse spray valve, use Equation 4-16, substituting the flow rate of the replacement pre-rinse spray valve. Efficient pre-rinse spray valves use 1.3 gpm or less.
Water Savings
To calculate the water savings that can be achieved from replacing an existing pre-rinse spray valve, identify the following information and use Equation 4-17:
• Current water use as calculated using Equation 4-16. • Water use after replacement as calculated using Equation 4-16.
49 U.S. Environmental Protection Agency’s (EPA’s) WaterSense program. March 31, 2011. Pre-Rinse Spray Valves Field Study Report. Page 19. www.epa.gov/watersense/products/prsv.html.

October 2012 4-39
Equation 4-17. Water Savings From Pre-Rinse Spray Valve Replacement (gallons per year)
= Current Water Use of Pre-Rinse Spray Valve – Water Use of Pre-Rinse Spray Valve After Replacement
Where:
• Current Water Use of Pre-Rinse Spray Valve (gallons per year) • Water Use of Pre-Rinse Spray Valve After Replacement (gallons per year)
Payback
To calculate the simple payback from the water savings associated with replacing an existing pre-rinse spray valve, consider the equipment cost of the replacement pre-rinse spray valve, the water savings as calculated using Equation 4-17, and the facility-specific cost of water and wastewater. Pre-rinse spray valves typically cost less than $100.
By replacing a pre-rinse spray valve with a more efficient model, facilities can also save a significant amount of energy due to the reduction in hot water use. This energy savings will further reduce the payback period and increase replacement cost-effectiveness.
Additional ResourcesAlliance for Water Efficiency. Commercial Food Service Introduction. www.allianceforwaterefficiency.org/Commercial_Food_Service_Introduction.aspx.
DOE, Energy Efficiency & Renewable Energy, Federal Energy Management Program. Covered Product Category: Pre-Rinse Spray Valves. www1.eere.energy.gov/femp/technologies/eep_low-flow_valves.html.
EPA’s WaterSense program. Pre-Rinse Spray Valves. www.epa.gov/WaterSense/ products/prsv.html.
Food Service Technology Center. Commercial Kitchen Equipment—Pre-Rinse Spray Valves. www.fishnick.com/equipment/sprayvalves/.
4.8 Pre-Rinse Spray Valves

4-40 WaterSense at Work: Best Management Practices for Commercial and Institutional Facilities
OverviewScraping dishes and disposing of food waste prior to dishwash-ing can be a very water- and energy-intensive process, depending upon the food disposal method used. Typically, commercial kitchens dispose of food scraps using a garbage disposal with a grinder that processes food waste into pieces small enough to pass through the plumbing system.
Garbage disposals in and of themselves do not use water; however, kitchen staff often run water at high flow rates through the garbage disposal to prevent damage to the grinder blades and keep food waste from building up and clogging the plumbing system. Some facilities have a sluice trough, which feeds the garbage disposal and is usually built into a stainless steel table system. Water is applied continuously at the top of the trough, often at a rate of 2.0 to 15.0 gallons per minute (gpm),50 depending upon how many nozzles are installed. Food waste is
scraped into the trough and rinsed down into the garbage disposal. Alternatively, some facilities rinse food from dishes into a garbage disposal using a pre-rinse spray valve.
As an alternative to a traditional garbage disposal with a grinder, some facilities use food pulpers to collect and dispose of food scraps. Food pulpers are located where the grinder would otherwise be located. Unlike a traditional garbage disposal with a grinder, how-ever, food pulpers crush food waste into a pulp (i.e., slurry), extract excess water from the pulp, then send the pulp waste to a bin for later disposal or composting. In many food pulper systems, the extracted water can be recycled within the food pulping process or reused to pre-rinse dishes or act as a sluice trough where food wastes are dumped. When a recirculation system is used, pulpers can recirculate 5.0 to 15.0 gpm through the system, needing only 2.0 gpm for make-up water.51 Figure 4-6 illustrates the food pulping process.
4.9 Food Disposals
Garbage disposal with grinder
Sluice trough
50 Koeller and Company and H.W. (Bill) Hoffman & Associates, LLC. June 2010. A Report on Potential Best Management Practices—Commercial Dishwashers. Prepared for the California Urban Water Conservation Council. Pages 5-7. www.cuwcc.org/products/pbmp-reports.aspx.
51 Ibid.

October 2012 4-41
4.9 Food Disposals
Figure 4-6. Food Pulper System Diagram
Food strainers are an alternative to traditional garbage disposals and food pulpers. As food scraps are rinsed from dishes, a scrap or strainer basket in the bottom of the sink captures the waste for later disposal or composting. Another type of combina-tion system acts as both a food pulper and food strainer, recirculating water for pulp-ing of food scraps and collecting food scraps in a strainer basket for later disposal.52
Before installing a new or replacing an existing food disposal system, consider any local restrictions on systems that discharge food waste to the sanitary sewer. Some areas have banned garbage disposals or have placed additional sewer charges on operations using them, due to concerns about increased loads on the local wastewater treatment plant.53
Operation, Maintenance, and User EducationFor optimal food disposal efficiency, consider the following:
• Where possible, turn off the water to the food disposal system during idle peri-ods when the system is not in use and when the facility is closed.
• Scrape larger food scraps into a trash receptacle prior to rinsing food waste into the food disposal system. Consider composting food waste if appropriate. See the U.S. Environmental Protection Agency’s (EPA’s) composting Web page54 for more information.
• Do not pour grease into the food disposal system. Doing so can clog pipes over time.
• Do not place any hard objects into the food disposal system. This can dull the blades, reducing the unit’s efficiency.
Food Scraps Reject Water
Recycled Water
Food Waste Pulp
Food Pulper/Waste Extractor
Waste Pulp Storage/
Disposal Bin
52 Ibid.53 Ibid.54 U.S. Environmental Protection Agency (EPA). Composting of Organic Materials. www.epa.gov/osw/conserve/materials/organics/food/fd-compost.htm.

4-42 October 2012
4.9 Food Disposals
• Run cold water through the food disposal system instead of hot water. This will reduce the energy use associated with heating the water. It will also help to keep the system cool.
• Regularly inspect and clean the food disposal system to make sure the blades are sharp and the system is not clogged with debris.
Retrofit OptionsTo reduce the water use associated with a traditional garbage disposal, consider installing a device that can sense the disposal motor’s load and regulate the amount of water necessary. These devices can reduce the idle flow rate when the garbage disposal is not in use, from between 2.0 and 15.0 gpm to 1.0 gpm, thus saving a sig-nificant amount of water. Also, consider installing a timer to stop the flow of water to the garbage disposal after 15 minutes, so that the user must periodically reactivate the system.55
Replacement OptionsWhen purchasing a new food disposal system or looking to replace an existing food disposal system, consider these options:
• Purchase a garbage disposal with a load sensor to regulate the amount of water conveyed through the disposal depending upon whether it is in use or idling.
• Install a food pulper or food pulper/strainer combination system, which can recycle 75 percent of the water used for the food disposal process.
• Replace mechanical food disposal systems with food strainers, which use little to no water.
Savings Potential Conventional garbage disposals can use a constant water flow of 2.0 to 15.0 gpm when in use. This water use can be significantly reduced either by retrofitting with a load sensor to regulate and reduce the amount of water used by the existing gar-bage disposal during idle mode, or by replacing the garbage disposal with a food pulper or food strainer. To estimate facility-specific water savings and payback, use the following information.
Conventional Garbage Disposal Retrofit
Water use can be reduced by retrofitting an existing conventional garbage disposal with a load sensor. Load sensors can reduce the flow rate through the garbage dispo-sal to as little as 1.0 gpm when the garbage disposal is not in use (i.e., during idle peri-ods). Water savings from the reduction in flow rate during idle use can be calculated.
55 East Bay Municipal Utility District. 2008. WaterSmart Guidebook—A Water-Use Efficiency Plan Review Guide for New Businesses. Pages FOOD9-11. www.ebmud.com/for-customers/conservation-rebates-and-services/commercial/watersmart-guidebook.

October 2012 4-43
Current Water Use
To estimate the current water use of an existing garbage disposal during idle periods, identify the following information and use Equation 4-18:
• Flow rate of water through the garbage disposal. This flow rate typically ranges from 2.0 to 15.0 gpm.
• Average daily idle period of the garbage disposal. Idle period is the time when the garbage disposal is turned on but not in use. While this will vary by facility, some estimates indicate that garbage disposals are typically used three hours per day. For a facility operating 12 hours a day, this would mean an idle period of nine hours if the garbage disposal is kept on throughout the day.56
• Days of facility operation per year.
Equation 4-18. Water Use of Garbage Disposal During Idle Periods (gallons per year)
= Flow Rate Through Garbage Disposal x Daily Idle Period x Days of Facility Operation
Where:
• Flow Rate Through Garbage Disposal (gallons per minute) • Daily Idle Period (minutes per day) • Days of Facility Operation (days per year)
Water Use After Retrofit
To estimate the water use from an existing garbage disposal that is retrofitted with a load sensor during idle period, use Equation 4-18, substituting the reduced idle flow rate. A load sensor can reduce the idle flow rate when the garbage disposal is not in use to as little as 1.0 gpm.
Water Savings
To calculate the water savings that can be achieved from retrofitting an existing con-ventional garbage disposal, identify the following and use Equation 4-19:
• Current water use as calculated using Equation 4-18. • Water use after retrofit as calculated using Equation 4-18.
4.9 Food Disposals
56 Ibid.

4-44 October 2012
4.9 Food Disposals
Equation 4-19. Water Savings From Garbage Disposal Retrofit (gallons per year)
= Current Water Use of Garbage Disposal During Idle Periods – Water Use of Garbage Disposal During Idle Periods After Retrofit
Where:
• Current Water Use of Garbage Disposal During Idle Periods (gallons per year)
• Water Use of Garbage Disposal During Idle Periods After Retrofit (gal-lons per year)
Payback
To calculate the simple payback from the water savings associated with retrofitting an existing conventional garbage disposal with a load sensor, consider the equip-ment and installation cost of the retrofit load sensor, the water savings as calculated in Equation 4-19, and the facility-specific cost of water and wastewater.
Because garbage disposals may use hot water, a reduction in water use could also result in energy savings. Reducing the use time of the garbage disposal can also save energy. The potential energy savings may further reduce the payback period and increase the cost-effectiveness.
Conventional Garbage Disposal Replacement—Food Pulper
Conventional garbage disposals can be replaced with a food pulper. A food pulper can recycle and reuse 75 percent of the water used for the food disposal process, thus reducing the flow rate of fresh water required to run through the garbage dis-posal unit.
Current Water Use
To estimate the current water use of an existing garbage disposal, identify the follow-ing information and use Equation 4-20:
• Flow rate of water through the garbage disposal. This flow rate typically ranges from 2.0 to 15.0 gpm.
• Average daily use time of the garbage disposal.
• Days of facility operation per year.

October 2012 4-45
4.9 Food Disposals
Equation 4-20. Water Use of Garbage Disposal (gallons per year)
= Flow Rate Through Garbage Disposal x Daily Use Time x Days of Facility Operation
Where:
• Flow Rate Through Garbage Disposal (gallons per minute) • Daily Use Time (minutes per day) • Days of Facility Operation (days per year)
Water Use After Replacement
To estimate the water use of a replacement food pulper, use Equation 4-20, substi-tuting the flow rate of fresh water through the food pulper. Freshwater flow rate through a food pulper that recirculates water for pre-rinsing is typically 2.0 gpm.57
Water Savings
To calculate the water savings that can be achieved from replacing an existing con-ventional garbage disposal with a food pulper, identify the following information and use Equation 4-21:
• Current water use as calculated using Equation 4-20. • Water use after replacement as calculated using Equation 4-20.
Equation 4-21. Water Savings From Garbage Disposal Replacement (gallons per year)
= Current Water Use of Garbage Disposal – Water Use of Garbage Disposal After Replacement
Where:
• Current Water Use of Garbage Disposal (gallons per year) • Water Use of Garbage Disposal After Replacement (gallons per year)
Payback
To calculate the simple payback from the water savings associated with replacing a garbage disposal with a food pulper, consider the equipment and installation cost of the food pulper, the water savings as calculated in Equation 4-21, and the facility-specific cost of water and wastewater.
Because garbage disposals can use hot water, a reduction in water use could also result in energy savings, which can further reduce the payback period and increase the cost-effectiveness.
57 Ibid.

4-46 October 2012
4.9 Food Disposals
Conventional Garbage Disposal Replacement—Food Strainer
Conventional garbage disposals can be replaced with a food strainer. Because a food strainer does not use water for the grinding/food disposal process, installing a food strainer to replace an existing garbage disposal can eliminate this water use.
Current Water Use
To estimate the current water use of an existing garbage disposal, use Equation 4-20.
Water Use After Replacement
A food strainer can completely eliminate the use of water for the grinding/food dis-posal process.
Water Savings
To calculate the water savings that can be achieved from replacing an existing con-ventional garbage disposal with a food strainer, use Equation 4-21. In this case, water savings will be exactly equal to the current water use because the replacement food strainer uses no water.
Payback
To calculate the simple payback from the water savings associated with replacing a garbage disposal with a food strainer, consider the equipment and installation cost of the food strainer, the water savings as calculated in Equation 4-21, and the facility-specific cost of water and wastewater.
Because garbage disposals can use hot water, a reduction in water use could also result in energy savings. Eliminating the use of the garbage disposal may also save energy. The potential energy savings could further reduce the payback period and increase the cost-effectiveness.
Additional ResourcesEast Bay Municipal Utility District. 2008. WaterSmart Guidebook—A Water-Use Efficiency Plan Review Guide for New Businesses. Pages FOOD9-11. www.ebmud.com/for-customers/conservation-rebates-and-services/commercial/watersmart- guidebook.
Koeller and Company and H.W. (Bill) Hoffman & Associates, LLC. June 2010. A Report on Potential Best Management Practices–Commercial Dishwashers. Prepared for the California Urban Water Conservation Council. Pages 5-7. www.cuwcc.org/products/pbmp-reports.aspx.
http://www.ebmud.com/for-customers/conservation-rebates-and-services/commercial/watersmart-guidebook
http://www.ebmud.com/for-customers/conservation-rebates-and-services/commercial/watersmart-guidebook

3.2 Toilets
WaterSense at Work: Best Management Practices for Commercial and Institutional Facilities 4-47
OverviewCommercial dishwashers are one of the largest water users in commercial kitchens. They clean and sanitize plates, glasses, bowls, utensils, and other food service ware. These machines can account for more than one-third of the overall water use in a commercial kitchen.58 Commercial dishwasher design can vary greatly by application, depending on the how many employees, visitors, and/or customers are served by the commercial kitchen (i.e., the amount of facility throughput).
The most efficient commercial dishwashers reuse water from one wash load to the next, using one or more holding tanks. This not only reduces water use, but also reduces the amount of energy required to heat additional water. Alternatively, fill-and-dump commercial dishwashers discard water after each load, making this type of commercial dishwasher inherently less efficient.
The basic design of commercial dishwashers varies. Commer-cial dishwasher design can be separated into several catego-ries:
• Undercounter • Stationary door- or hood-type • Conveyor-type • Flight-type
Smaller facilities serving fewer than 60 people per day often use undercounter dishwashers, which are similar to residential dishwashers and tend to be smaller in size.
Stationary door- or hood-type commercial dishwashers are used for slightly larger throughputs of 150 people per day. These are usually manually front-loaded with racks (generally 20 inches by 20 inches in size) that contain dishes and other kitchen-ware.
Conveyor-type machines also wash dishes that are manually loaded on removable racks; however, multiple racks can be washed at a time, and the racks are pulled through the washer using a conveyor to complete each cycle. The conveyor is typi-cally turned off between loads. These types of machines are ideal for larger service facilities serving up to 300 people per day.
Flight-type machines are used in facilities with the highest throughputs. They also use a conveyor, but instead of loading racks full of dishes onto the conveyor, the conveyor itself serves as a rack, and dishes are loaded onto the pegs or fingers of the conveyor rack as it comes around. The conveyor is typically continuously moving as dishes are loaded, washed, and removed.59
4.10 Commercial Dishwashers
Stationary hood-type dishwasher
58 Alliance for Water Efficiency. Commercial Dishwashing Introduction. www.allianceforwaterefficiency.org/commercial_dishwash_intro.aspx?terms=commercial+dishwasher.
59 Koeller and Company and H.W. (Bill) Hoffman & Associates, LLC. June 2010. A Report on Potential Best Management Practices—Commercial Dishwashers. Prepared for the California Urban Water Conservation Council. www.cuwcc.org/products/pbmp-reports.aspx.
http://www.allianceforwaterefficiency.org/commercial_dishwash_intro.aspx?terms=commercial+dishwasher

4-48 October 2012
4.10 Commercial Dishwashers
There are no federal standards limiting the water or energy consumption of commercial dishwash-ers. The U.S. Environmental Protection Agency (EPA) and the U.S. Energy Department’s (DOE’s) EN-ERGY STAR® qualifies energy- and water-efficient commercial dishwashers,60 including undercounter, stationary single-tank door-, and conveyor- (single- and multi-stage tank-) type machines.
ENERGY STAR specifies that commercial dishwash-ers demonstrate a maximum water consumption in gallons per rack in order to qualify for the ENERGY STAR. ENERGY STAR qualified commercial dish-washers can reduce both energy and water use by 25 percent.
Operation, Maintenance, and User EducationFor optimal commercial dishwasher efficiency, consider the following:
• Only run dishwashers when they are full. Each dishwasher rack should be filled to maximum capacity.
• Educate staff to scrape dishes prior to loading the dishwasher.
• Replace any damaged dishwasher racks.
• Ensure that the final rinse pressure and water temperature are within the manu-facturer’s recommendations.
• Operate the dishwasher close to or at the minimum flow rate recommended by the manufacturer. Set the rinse cycle time to the manufacturer’s minimum rec-ommended setting and periodically verify that the machine continues to operate with that rinse cycle time.
• Turn off machines at night when not in use.
• Make sure that manual fill valves close completely after the wash tank is filled.
• Find and repair any leaks. Inspect valves and rinse nozzles for proper operation and repair worn nozzles.
For conveyor-type machines, these further steps can be taken to ensure optimal efficiency:
• Install and/or maintain wash curtains. Wash curtains are able to retain heat within the machine.
• Ensure the rinse bypass drain is properly adjusted so that the wash tank is ad-equately replenished during operation.
60 U.S. Environmental Protection Agency (EPA) and U.S. Energy Department’s (DOE’s) ENERGY STAR. Commercial Dishwashers Key Product Criteria. www.energystar.gov/index.cfm?c=comm_dishwashers.pr_crit_comm_dishwashers.
Rack conveyor-type dishwasher

October 2012 4-49
4.10 Commercial Dishwashers
• Operate conveyor-type machines in auto-mode. This will save energy by running the conveyor motor only when needed.
Retrofit OptionsEfficient retrofit options are available for conveyor-type dishwasher units. When ret-rofitting an existing conveyor-type dishwasher, consider installing rack sensors that allow water flow only when dishes are present, saving water by initiating the clean-ing cycle less frequently.
Replacement OptionsWhen purchasing or leasing a new commercial dishwasher or replacing an existing commercial dishwasher, look for ENERGY STAR qualified models,61 which save water, conserve energy, and reduce overall operating costs. For flight-type dishwashers, which do not qualify for the ENERGY STAR, choose equipment with a water use of less than 0.01 gallons per dish.62 In addition, choose models that reuse rinse water, if possible, as opposed to traditional fill-and-dump machines.
Be sure to consider the typical kitchen throughput to select an appropriately sized commercial dishwasher. A commercial dishwasher that is larger than necessary will waste water if the machine is not loaded to capacity.
Savings PotentialENERGY STAR qualified commercial dishwashers use 25 percent less water than con-ventional models, on average. Use ENERGY STAR’s commercial kitchen equipment savings calculator63 to estimate facility-specific water, energy, and cost savings for replacing an existing commercial dishwasher with an ENERGY STAR qualified model.
The Food Service Technology Center also has a life cycle and energy cost calculator,64 which can be used to calculate the savings potential from replacing many types of commercial kitchen equipment, including commercial dishwashers.
Depending upon the type of machine, a range of water and energy savings can be achieved. To estimate facility-specific water savings and payback, the facility can also use the following information.
Current Water Use
To estimate the water use of a commercial dishwasher, identify the following infor-mation and use Equation 4-22:
• Water use per rack washed. • Average estimate of racks washed per day. • Days of facility operation per year.
61 Ibid.62 Koeller and Company and H.W. (Bill) Hoffman & Associates, LLC, op. cit.63 EPA and DOE’s ENERGY STAR. Savings Calculator for ENERGY STAR Qualified Commercial Kitchen Equipment. www.energystar.gov/ia/business/bulk_purchasing/
bpsavings_calc/commercial_kitchen_equipment_calculator.xls.64 Food Service Technology Center. Commercial Foodservice Equipment Lifecycle Cost Calculator. www.fishnick.com/saveenergy/tools/calculators/.
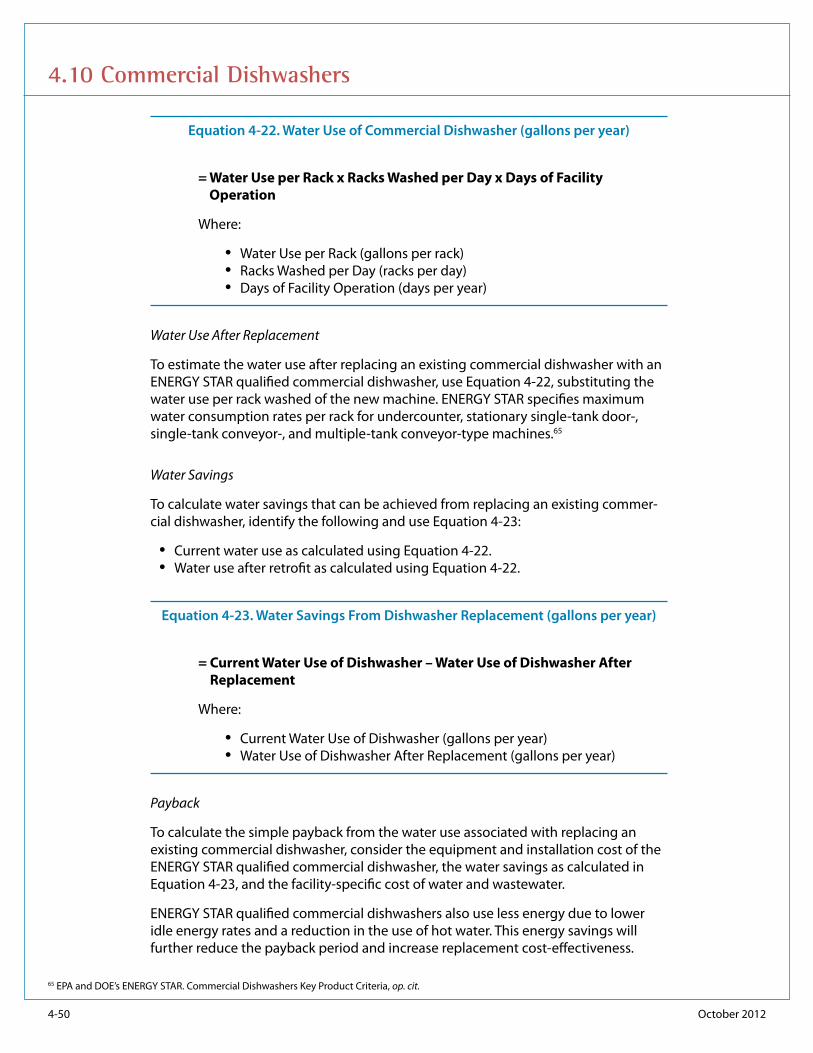
4-50 October 2012
4.10 Commercial Dishwashers
Equation 4-22. Water Use of Commercial Dishwasher (gallons per year)
= Water Use per Rack x Racks Washed per Day x Days of Facility Operation
Where:
• Water Use per Rack (gallons per rack) • Racks Washed per Day (racks per day) • Days of Facility Operation (days per year)
Water Use After Replacement
To estimate the water use after replacing an existing commercial dishwasher with an ENERGY STAR qualified commercial dishwasher, use Equation 4-22, substituting the water use per rack washed of the new machine. ENERGY STAR specifies maximum water consumption rates per rack for undercounter, stationary single-tank door-, single-tank conveyor-, and multiple-tank conveyor-type machines.65
Water Savings
To calculate water savings that can be achieved from replacing an existing commer-cial dishwasher, identify the following and use Equation 4-23:
• Current water use as calculated using Equation 4-22. • Water use after retrofit as calculated using Equation 4-22.
Equation 4-23. Water Savings From Dishwasher Replacement (gallons per year)
= Current Water Use of Dishwasher – Water Use of Dishwasher After Replacement
Where:
• Current Water Use of Dishwasher (gallons per year) • Water Use of Dishwasher After Replacement (gallons per year)
Payback
To calculate the simple payback from the water use associated with replacing an existing commercial dishwasher, consider the equipment and installation cost of the ENERGY STAR qualified commercial dishwasher, the water savings as calculated in Equation 4-23, and the facility-specific cost of water and wastewater.
ENERGY STAR qualified commercial dishwashers also use less energy due to lower idle energy rates and a reduction in the use of hot water. This energy savings will further reduce the payback period and increase replacement cost-effectiveness.
65 EPA and DOE’s ENERGY STAR. Commercial Dishwashers Key Product Criteria, op. cit.

October 2012 4-51
Additional ResourcesAlliance for Water Efficiency. Commercial Dishwashing Introduction. www. allianceforwaterefficiency.org/commercial_dishwash_intro.aspx?terms=commercial+dishwashers+introduction.
Consortium for Energy Efficiency, Inc. 2010. High Efficiency Specifications for Commer-cial Dishwashers. www.cee1.org/com/com-kit/com-kit-equip.php3.
East Bay Municipal Utility District. 2008. WaterSmart Guidebook—A Water-Use Efficiency Plan Review Guide for New Businesses. Pages FOOD12-14. www.ebmud.com/for-customers/conservation-rebates-and-services/commercial/watersmart- guidebook.
EPA and DOE’s ENERGY STAR. Commercial Dishwashers. www.energystar.gov/index.cfm?fuseaction=find_a_product.showProductGroup&pgw_code=COH.
Food Service Technology Center (FSTC). Commercial Foodservice Equipment Life-cycle Cost Calculators. www.fishnick.com/saveenergy/tools/calculators/.
FSTC. Dishwashing Machines. www.fishnick.com/savewater/appliances/dishmachines/.
Koeller and Company and H.W. (Bill) Hoffman & Associates, LLC. June 2010. A Report on Potential Best Management Practices—Commercial Dishwashers. Prepared for the Califor-nia Urban Water Conservation Council. www.cuwcc.org/products/pbmp-reports.aspx.
North Carolina Division of Pollution Prevention and Environmental Assistance. May 2009. Water Efficiency, Water Management Options, Kitchen and Food Preparation. Pages 2-4. www.savewaternc.org/busresources.php.
4.10 Commercial Dishwashers
http://www.ebmud.com/for-customers/conservation-rebates-and-services/commercial/watersmart-guidebook
http://www.ebmud.com/for-customers/conservation-rebates-and-services/commercial/watersmart-guidebook

4-52 WaterSense at Work: Best Management Practices for Commercial and Institutional Facilities
OverviewWash-down sprayers are hoses used for a variety of cleaning purposes, including washing countertops, floors, mats, and other kitchen areas. Wash-down sprayers use large volumes of water to provide a high-pressure stream capable of cleaning dirt and residue from surfaces.
A wash-down sprayer features a nozzle attached to a hose, which is connected to the water supply. Wash-down sprayers typically deliver flow rates of 7.0 gallons per minute (gpm),66 while heavy-duty hoses can deliver higher flow rates from 9.0 to 20.0 gpm.67
Because wash-down sprayers use large volumes of water to perform cleaning tasks, using another cleaning method could be a viable alternative. These alternative cleaning methods (e.g., mopping, sweeping) are able to perform the same tasks, yet require significantly less water or no water at all. If implementing new cleaning meth-ods is not feasible, replacement options exist that use lower flow rates than wash-down sprayers, including pressure washers and water brooms.
Operation, Maintenance, and User EducationFor optimal wash-down sprayer efficiency, consider the following:
• Only use wash-down sprayers to clean floors, countertops, and other surfaces. Do not use wash-down sprayers to clean dishware, which should be cleaned with pre-rinse spray valves.
• If the wash-down sprayer does not have a self-closing nozzle, shut off the water supply when the sprayer is not in use.
• For floor washing applications, consider using a broom and dust pan to clean up solid waste and/or using a mop and squeegee instead of a wash-down sprayer.
Retrofit OptionsIf a high-flowing wash-down sprayer hose is used without a nozzle, consider install-ing a self-closing nozzle. This can reduce the flow rate of the wash-down sprayer from up to 20.0 gpm down to 7.0 gpm and prevent water from being wasted when the wash-down sprayer is not in use.
Replacement OptionsThere are several replacement options for wash-down sprayers. For certain appli-cations, wash-down sprayers can be replaced with mopping or sweeping, which require little to no water use.
4.11 Wash-Down Sprayers
66 Food Service Technology Center (FSTC). 2010. Water Conservation Measures for Commercial Food Service. www.fishnick.com/savewater/bestpractices.67 U.S. Environmental Protection Agency (EPA) and U.S. Energy Department’s (DOE’s) ENERGY STAR. Best Practices—How to Achieve the Most Efficient Use of Water
in Commercial Food Service Facilities. www.energystar.gov/index.cfm?c=healthcare.fisher_nickel_feb_2005.

October 2012 4-53
Pressure washers serve as good replacement options for facilities that rely on the washing ability of wash-down sprayers. Pressure washers typically have flow rates of 3.0 gpm or less at high pressure and often perform better than wash-down sprayers.
For floor cleaning applications, water brooms can replace existing wash-down spray-ers. Water brooms have wide spray patterns with multiple jets that can clean more efficiently than a wash-down sprayer and use significantly less water.68
Savings PotentialWater savings can be achieved through wash-down sprayer retrofit or replacement. Existing high-flowing wash-down sprayers can be retrofitted with a self-closing nozzle. Wash-down sprayers can be replaced with a pressure washer or water broom.
To estimate facility-specific savings and payback, use the following information.
Wash-Down Sprayer Retrofit
Wash-down sprayers typically deliver flow rates of 7.0 gallons per minute (gpm),69 while heavy-duty hoses can deliver higher flow rates from 9.0 to 20.0 gpm.70
Current Water Use
To estimate the current water use of an existing wash-down sprayer, identify the fol-lowing information and use Equation 4-24:
• Flow rate of the existing, high-flowing wash-down sprayer. Most high-flowing wash-down sprayers have flow rates between 9 and 20 gpm.71
• Average daily use time.
• Days of facility operation per year.
Equation 4-24. Water Use of Wash-Down Sprayer or Water Broom (gallons per year)
= Flow Rate of Wash-Down Sprayer or Water Broom x Daily Use Time x Days of Facility Operation
Where:
• Flow Rate of Wash-Down Sprayer or Water Broom (gallons per minute) • Daily Use Time (minutes per day) • Days of Facility Operation (days per year)
4.11 Wash-Down Sprayers
68 FSTC, op. cit.69 Ibid.70 EPA and DOE’s ENERGY STAR, op. cit.71 Ibid.
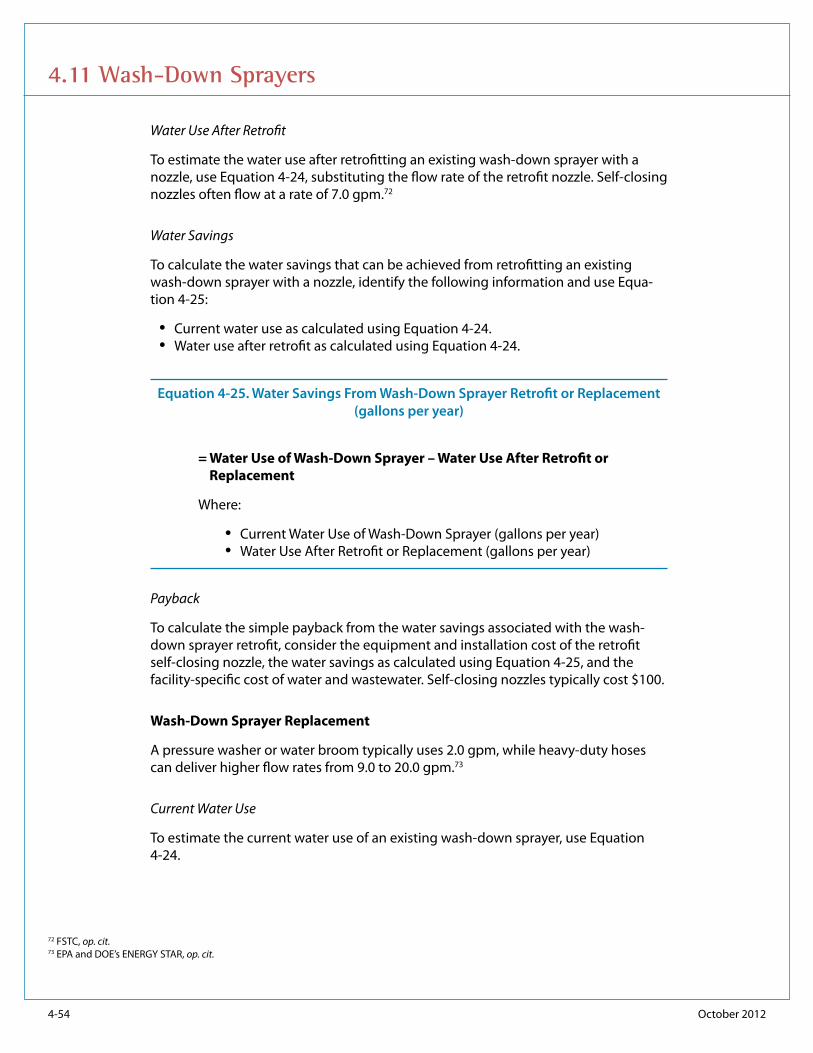
4-54 October 2012
4.11 Wash-Down Sprayers
Water Use After Retrofit
To estimate the water use after retrofitting an existing wash-down sprayer with a nozzle, use Equation 4-24, substituting the flow rate of the retrofit nozzle. Self-closing nozzles often flow at a rate of 7.0 gpm.72
Water Savings
To calculate the water savings that can be achieved from retrofitting an existing wash-down sprayer with a nozzle, identify the following information and use Equa-tion 4-25:
• Current water use as calculated using Equation 4-24. • Water use after retrofit as calculated using Equation 4-24.
Equation 4-25. Water Savings From Wash-Down Sprayer Retrofit or Replacement (gallons per year)
= Water Use of Wash-Down Sprayer – Water Use After Retrofit or Replacement
Where:
• Current Water Use of Wash-Down Sprayer (gallons per year) • Water Use After Retrofit or Replacement (gallons per year)
Payback
To calculate the simple payback from the water savings associated with the wash-down sprayer retrofit, consider the equipment and installation cost of the retrofit self-closing nozzle, the water savings as calculated using Equation 4-25, and the facility-specific cost of water and wastewater. Self-closing nozzles typically cost $100.
Wash-Down Sprayer Replacement
A pressure washer or water broom typically uses 2.0 gpm, while heavy-duty hoses can deliver higher flow rates from 9.0 to 20.0 gpm.73
Current Water Use
To estimate the current water use of an existing wash-down sprayer, use Equation 4-24.
72 FSTC, op. cit.73 EPA and DOE’s ENERGY STAR, op. cit.

October 2012 4-55
4.11 Wash-Down Sprayers
Water Use After Replacement
To estimate the water use of a replacement pressure washer or water broom, use Equation 4-24, substituting the flow rate of the water broom. Water brooms can use as little as 2.0 gpm.74 Pressure washers flow at similar flow rates using high water pressure.
Water Savings
To calculate the water savings that can be achieved from replacing an existing wash-down sprayer with a pressure washer or water broom, use Equation 4-25.
Payback
To calculate the simple payback from the water savings associated with replacing the wash-down sprayer with a pressure washer or water broom, consider the equipment and installation cost of the replacement, the water savings as calculated using Equa-tion 4-25, and the facility-specific cost of water and wastewater. Pressure washers and water brooms typically cost $100.
Additional ResourcesEast Bay Municipal Utility District. 2008. WaterSmart Guidebook—A Water-Use Efficiency Plan Review Guide for New Businesses. Pages FOOD8-9. www.ebmud.com/ for-customers/conservation-rebates-and-services/commercial/watersmart-guidebook.
EPA and DOE’s ENERGY STAR. Best Practices—How to Achieve the Most Efficient Use of Water in Commercial Food Service Facilities. www.energystar.gov/index.cfm?c=healthcare.fisher_nickel_feb_2005.
Food Service Technology Center (FSTC). 2010. Water Conservation Measures for Com-mercial Food Service. www.fishnick.com/savewater/bestpractices.
FSTC. April 2005. Green Sheet: Water, Water Everywhere and Not a Drop to Waste. www.fishnick.com/saveenergy/greensheets/GreenSheet_Water_Waste_1.pdf.
74 FSTC, op. cit.
http://www.ebmud.com/for-customers/conservation-rebates-and-services/commercial/watersmart-guidebook


Table of Contents5.1 Introduction to Outdoor Water Use................ 5-2
5.2 Landscaping ............................................................ 5-4
5.3 Irrigation .................................................................5-11
5.4 Commercial Pool and Spa Equipment .........5-20
5.5 Vehicle Washing ...................................................5-29
Outdoor Water Use

5-2 WaterSense at Work: Best Management Practices for Commercial and Institutional Facilities
5.1 Introduction to Outdoor Water Use
Outdoor water use can account for between 5 and 30 percent of a facility’s total water use, as shown in Figure 5-1.1 Water is used outdoors for a variety of purposes, including landscape irrigation, swimming pools, and vehicle washing. Improved landscaping and pool maintenance practices and more efficient irrigation equipment can provide opportunities for significant water savings.
Figure 5-1. Water Use Attributed to Outdoor Purposes
Most commercial and institutional facilities that own or maintain surrounding landscape will have some outdoor water use associated with irrigation or landscape maintenance. The amount of outdoor water use is dictated by the size and design of the landscape and the need for supplemental irrigation. Not surprisingly, larger com-plexes with larger areas of maintained landscape, such as offices, schools, and hotels, can use as much as 30 percent of their water to maintain the health and quality of the landscape. The amount of water used outdoors may also vary due to local climate and facility type. For example, a 2003 study in California estimated that 72 percent of water use in K-12 schools was used outdoors, compared to the 35 percent average from the eight sectors studied.2 Several sectors, including schools and hotels, also consume a measurable amount of water for the operation and maintenance of pools. Finally, some commercial buildings also use a significant amount of water to clean their fleet of vehicles with a washing station on site.
In many instances, outdoor water use can be controlled and minimized with proper landscape design. Regionally appropriate plant choices, healthy soils with
1 Created from analyzing data in: Schultz Communications. July 1999. A Water Conservation Guide for Commercial, Institutional and Industrial Water Users. Prepared for the New Mexico Office of the State Engineer. www.ose.state.nm.us/wucp_ici.html; Dziegielewski, Benedykt, et al. American Water Works Association (AWWA) and AWWA Research Foundation. 2000. Commercial and Institutional End Uses of Water; East Bay Municipal Utility District. 2008. WaterSmart Guidebook: A Water-Use Efficiency Plan Review Guide for New Businesses. www.ebmud.com/for-customers/conservation-rebates-and-services/commercial/watersmart-guidebook; AWWA. Helping Businesses Manage Water Use—A Guide for Water Utilities.
2 Gleick, Peter H., et al. Pacific Institute. 2003. Waste Not, Want Not: The Potential for Urban Water Conservation in California. Page 83 and Appendix E.
0%
20%
40%
60%
80%
100%
October 2012 5-3
3 Ibid. Page 8.4 Solomon, K.H., et al. 2007. Performance and Water Conservation Potential of Multi-Stream, Multi-Trajectory Rotating Sprinklers for Landscape Irrigation. Applied Engi-
neering in Agriculture. 23(2):153-163.5 U.S. Environmental Protection Agency’s (EPA’s) WaterSense program. November 3, 2011. WaterSense Specification for Weather-Based Irrigation Controllers Support-
ing Statement. Page 8. www.epa.gov/watersense/partners/controller_final.html.6 Koeller, John and H.W. (Bill) Hoffman & Associates, LLC. September 2010. Evaluation of Potential Best Management Practices—Pools, Spas, and Fountains. Prepared
for The California Urban Water Conservation Council. Page 34. www.cuwcc.org/products/pbmp-reports.aspx.7 Ibid. Page 35.8 Created from analyzing data in: Schultz Communications, op. cit.9 Brown, Chris. 2000. Water Conservation in the Professional Car Wash Industry. Prepared for the International Carwash Association.
www.carwash.org/operatorinformation/research/Pages/EnvironmentalReports.aspx.
appropriate grading, the use of mulches, and limiting the use of high water-using plants such as turfgrass can significantly reduce the need for supplemental irrigation. In addition, proper design, installation, and maintenance of irrigation equipment can have a dramatic impact on outdoor water use. For example, using drip irrigation on plant beds instead of traditional sprinklers can reduce irrigation water use by 20 to 50 percent.3 More efficient sprinkler heads can reduce irrigation water use by 30 percent compared to traditional sprinkler heads.4 Smart irrigation controllers that schedule irrigation based on weather data or onsite conditions can reduce irrigation water use by 15 percent compared to manual or clock timer irrigation systems.5
For schools or hotels with pools, proper pool operation and maintenance can reduce water loss associated with evaporation, filter cleaning, mineral buildup control, leaks, and splashing. For example, pool covers have been shown to reduce evaporation losses by 30 to 50 percent.6 More efficient filters can reduce water use associated with filter cleaning by 68 to 98 percent.7
Vehicle wash facilities are another specialty sector with significant outdoor water use. As much as 95 percent of the water use associated with vehicle wash systems can be attributed to the washing processes and equipment.8 Reclaiming and reusing ve-hicle wash water has been shown to save at least 50 percent of the water used in the vehicle-washing process.9
Section 5.0: Outdoor Water Use of WaterSense at Work provides an overview of and guidance for effectively reducing the water use associated with:
• Landscaping • Irrigation • Commercial pool and spa equipment • Vehicle washing
5.1 Introduction to Outdoor Water Use
Outdoor Water Use Case Study
To learn how the Granite Park office complex in Plano, Texas, saved nearly 12.5 million gallons of water by increasing the efficiency of the irrigation system, read the case study in Appendix A.

5-4 WaterSense at Work: Best Management Practices for Commercial and Institutional Facilities
5.2 Landscaping
OverviewWater applied to a landscape can account for a significant portion of a commercial or institutional property’s overall water use. Studies show that average landscape water use in the commercial and institutional sector can range from 7 percent of total water use for hospitals, 22 percent for office buildings, and up to 30 percent for schools.10 Typically, a landscape is watered to supplement natural precipitation based
on a plant’s water needs. In some areas of the country, such as the arid Southwest, this gap in water needs and precipitation can be significant. Landscape design, soil conditions, plant choice, and maintenance all affect the amount of water a landscape needs. Section 5.2: Landscaping outlines best management practices that can guide a facility in making more water-efficient landscaping choices.
A well-designed landscape should be supported by healthy soils with appropriate grading, mulches, regionally appropriate plant choices, appropriately sized turf areas, and hydrozones. The following information should also be considered for a well-designed landscape:
• Healthy soils allow water to properly infiltrate and help healthy plant root sys-tems to develop. Soil health can be maintained with a combination of aeration and applying compost or mulch to help the soil retain its nutrients while sup-porting plant growth.
• Appropriately graded sites with gentle slopes allow water to stay where it is applied and get delivered to the root zone of the plants, instead of leading to stormwater runoff.
• Mulches on landscaped beds can help keep soils cool and minimize evaporation. If organic mulches, such as wood chips or shredded leaves, are used, they can add nutrients to the soil as they decompose.
• An appropriate plant palette consisting of drought-tolerant, native, or regionally appropriate species lays a solid foundation for a water-efficient landscape, reducing water requirements, as well as the time and cost associated with main-taining the landscape.11
• A smaller turf area can reduce resources and costs associated with watering, mowing, fertilizing, and removing debris.
10 U.S. Environmental Protection Agency (EPA’s) WaterSense program. August 20, 2009. Water Efficiency in the Commercial and Institutional Sector: Considerations for a WaterSense Program. Pages 7-10. www.epa.gov/watersense/docs/ci_whitepaper.pdf.
11 EPA’s WaterSense program. December 2009. Research Report on Turfgrass Allowance. Page 6. www.epa.gov/WaterSense/docs/home_turfgrass-report508.pdf.
Reduction of turf area with plantings

October 2012 5-5
12 EPA. Green Infrastructure. water.epa.gov/infrastructure/greeninfrastructure/index.cfm.13 Portland Bureau of Environmental Services. Stormwater Solutions. www.portlandonline.com/bes/index.cfm?c=31870; Philadelphia Water Department.
Businesses. www.phillywatersheds.org/whats_in_it_for_you/businesses.
5.2 Landscaping
• Hydrozoning, or grouping plants according to their water needs, will promote efficient irrigation in those zones that require supplemental water.
It is possible in many parts of the country to design a land-scape that does not require any supplemental irrigation. If irrigation is used, the irrigation system efficiency is another important factor that affects landscape water use. For infor-mation on the efficient use of landscape irrigation systems, refer to Section 5.3: Irrigation.
If a water feature (e.g., pond or ornamental pool) is included in a landscape, it should provide a beneficial use, such as a wild-life habitat or stormwater management. In addition, the feature should recirculate water instead of serving as a single-pass device, which can waste significant amounts of water.
Many of the actions that can be taken to improve a landscape’s water efficiency can have the co-benefit of reducing stormwater runoff. The U.S. Environmental Protection Agency’s (EPA’s) Green Infrastructure program focuses on solutions to reduce runoff, such as rain gardens and permeable pavements.12 Local water utilities or municipal governments13 may also have green infrastructure practices to share or incentives to help improve landscapes to reduce stormwater runoff.
Operation, Maintenance, and User EducationTo optimize a landscape’s water efficiency, hire a landscape professional with a dem-onstrated knowledge of water-efficient landscape design, maintain the soil quality and existing plants, and minimize water used for other purposes with respect to the overall landscape design.
Hiring a Landscape Professional
When selecting or employing a landscape professional, consider the following attributes and management strategies:
• Consider selecting landscape professionals trained and certified in water-efficient or climate-appropriate landscaping. Existing professionals can attend courses or seminars to learn water-efficient techniques.
• Periodically review all landscape service and maintenance agreements to incor-porate water-, chemical-, and energy-efficiency requirements or performance standards.
• Encourage landscape professionals to report and/or fix irrigation system prob-lems. Many landscape professionals not only install and maintain plants in your landscape, but also install and maintain the irrigation system. These professionals can identify and report leaks or other inefficiencies over time.
Non-turf landscape

5-6 October 2012
Maintaining Soil Quality
Consider the following maintenance tactics to ensure a healthy soil quality:
• Add mulch to plant beds to cover bare soil. Re-mulch areas annually to maintain soil coverage and prevent erosion.
• Maintain a sufficient quantity of good topsoil—four to six inches deep—to cap-ture precipitation as it falls and release water back to plants over time, reducing irrigation requirements.
• Consider incorporating soil amendments into water-logged or fast-draining soils to attain proper soil water holding capacity. For soils with poor drainage (i.e., clay soils) or soils that drain too quickly (i.e., sandy soils), consider incorporating topsoil or compost to balance soil composition and restore nutrients.
• For areas that undergo regular foot or vehicular traffic, aerate the soil annually to alleviate compaction and improve water infiltration rates.
Maintaining Existing Plants
When maintaining your landscape’s existing plant life, consider the following water-efficient tips:
• Keep the irrigated landscape free of weeds so that water is available for the deco-rative landscaping. Pull weeds manually instead of using herbicides, which can contaminate local water sources.
• Raise the blade on mowers to allow grass to grow longer. Longer grass promotes deeper root growth and more drought-resistant turf. Some species of turfgrass go dormant during dry periods. Consider letting the grass turn brown during these times. It will recover when rainfall returns.
• Encourage the inclusion of shaded areas in the overall landscape design, which decreases the water needs of surrounding plants. Consider planting additional trees and shrubbery to increase the amount of shaded area in the future.
Minimizing Water Used for Other Purposes
To minimize the amount of water used for other outdoor-related purposes, consider the following:
• Recirculate water in decorative fountains, ponds, and waterfalls. Shut off these features when possible to reduce evaporation losses. Check water recirculation systems annually for leaks and other damage. Consider using non-potable water in these systems (refer to Section 8: Onsite Alternative Water Sources for additional information).
• Do not use water to clean sidewalks, driveways, parking lots, tennis courts, pool decks, or other hardscapes. Sweep these areas instead.
5.2 Landscaping

October 2012 5-7
Retrofit and Replacement OptionsMany of the actions that might be undertaken to retrofit or replace a landscape are similar. The goal for either retrofitting or replacing landscaping should be to optimize water use and hold water in the soil rather than allowing it to run off site. Differences in practices and options are primarily those of scale. Because the replacement of a commercial or institutional landscape could carry a considerable cost, it is important to ensure that the landscape is properly designed from the start. Consider hiring a licensed landscape architect or a qualified site planner/designer to assist. Local botanical gardens may also have information on how to develop a landscape that is beautiful, functional, and water-efficient. For example, the Conservation Garden Park developed by the Jordan Valley Water Conservancy District in West Jordan, Utah,14 has a wealth of information and virtual tours demonstrating water-smart landscap-ing that can even be beneficial to people outside of the area.
Site Preparation
How the site is prepared has a significant impact on the ability for the landscape to retain moisture and limit the need for supplemental irrigation. Before retrofitting, replacing, or installing a new landscape, consider the following site preparation tips:
• To the extent feasible, limit the removal of native vegetation and soils.
• Minimize soil compaction in the construction phase by limiting areas for use of heavy equipment.
• Install temporary protective fencing around trees to protect their root zones.
• Reduce runoff from steep slopes in the landscape by either grading appropriately or terracing. If slopes cannot be avoided in landscape design, install plants with deeper root zones to provide stabilization and prevent erosion.
• Before the landscape is installed, ensure that the soil is properly amended, tilled, and contoured to hold water. Where turfgrass is used, the area should include at least six inches of well-amended soil capable of easily absorbing and holding water in the root zone.
Plant Selection
Plant selection can make all the difference in a water-efficient landscape. Consider the following when redesigning a landscape:
• Evaluate site conditions and plant appropriately. Areas of the same site may vary significantly in soil type or exposure to sun and wind, as well as evaporation rates and moisture levels. Be mindful of a site’s exposure to the elements and choose plants that will thrive in the site’s conditions.
5.2 Landscaping
14 Jordan Valley Conservation Gardens Foundation. Visit the Conservation Garden Park. conservationgardenpark.org/visit/.

5-8 October 2012
• Select drought-tolerant or climate-appropriate turfgrass, trees, shrubs, and ground cover when replanting landscaped areas. Information about climate-appropriate plants may be available through your local extension office15 or on EPA’s WaterSense® program website.16
• Incorporate shade trees into your landscape or plant near large shade trees. Shaded areas typically require less supplemental water than areas exposed to direct sun. Additionally, shade trees and other vegetation placed strategically to shade the south-facing wall of a building can eventually help to reduce energy costs.17
• Consider reducing the area of turfgrass in the landscape, as most turf generally requires more water than planted beds, especially if the plants are climate- appropriate and their surrounding soil is covered with mulch.18
• Avoid installing “strip grass,” such as small strips of grass between the sidewalk and street, because these areas are hard to maintain and difficult to water efficiently.
• Consider installing rain gardens throughout the landscape. These excavated, shallow depressions should include native plantings designed to cap-ture rainwater runoff from roofs, driveways, and sidewalks. These gardens can keep water on the property and absorb up to 40 percent more runoff than typical lawns.19
Irrigation
Although it is possible in many parts of the country to design a landscape that can live on rainfall alone, some irrigation may be needed to ensure landscape health. There are many factors that should be taken into account to ensure that an irrigation system is well designed, operated, and maintained. More detailed information about irrigation systems is available in Section 5.3: Irrigation, but following are a few tips:
• Use the technique of hydrozoning to group plants with similar irrigation needs together.
• Consider how the interplay between the types of plants and irrigation compo-nents can affect the volume of water needed to sustain the landscape. EPA’s WaterSense Water Budget Tool,20 developed to address residential landscapes in WaterSense labeled new homes, can be used as a guide to see how plant types
15 U.S. Department of Agriculture. Cooperative Extension System Offices. www.csrees.usda.gov/Extension/.16 EPA’s WaterSense program. What to Plant. www.epa.gov/WaterSense/outdoor/what_to_plant.html.17 Sailor, David J. and Dietsch, Nikolaas. October 3, 2005. The Urban Heat Island Mitigation Impact Screening Tool (MIST). Page 2.18 EPA’s WaterSense program. December 2009, op. cit.19 EPA’s WaterSense program. Resource Manual for Building WaterSense Labeled New Homes. www.epa.gov/watersense/docs/newhome_builder_resource_
manual508.pdf.20 EPA’s WaterSense program. The WaterSense Water Budget Tool. www.epa.gov/WaterSense/water_budget/.
Climate-appropriate plants
Avoided strip grass
5.2 Landscaping

October 2012 5-9
21 EPA’s WaterSense program. Rainwater & Reuse. www.epa.gov/WaterSense/outdoor/rainwater_reuse.html.22 EPA’s WaterSense program, op. cit., Page 41.
5.2 Landscaping
and irrigation methods affect the ability of a landscape to meet a water budget based on the local climate. The Water Budget Tool is not intended to estimate actual savings, but it is a tool to help evaluate the relative water savings that can be achieved with different plant palette and technology choices.
• Consider installing a separate meter to measure the volume of water applied to the landscape. Separately metering irrigation systems can reduce wastewater costs in some jurisdictions and can help to identify leaks more quickly.
• Consider where alternative water sources can be used as a substitute for potable water sources for irrigation. Information about rainwater harvesting and reuse can be found on the WaterSense website21 or see Section 8: Onsite Alternative Water Sources for more information.
Other Features
When planning hardscape retrofits, consider the following to enhance outdoor water efficiency:
• If replacing sidewalks or parking lot pavement, consider installing permeable surfaces (e.g., permeable pave-ment) rather than impermeable hardscape.
• Use bushes, mulch, rain gardens, permeable hardscape, or curb cuts in parking lot islands or in the areas be-tween sidewalks and the roadway. These should be at a lower elevation than surrounding hardscape so that runoff flows into them.
• While water features are common in many landscapes, consider the annual water use of the specific feature before installing one. Ideally, these features should provide a beneficial use, such as a wildlife habitat, stormwater management, and/or noise reduction. Because water from these features is often lost to evapo-ration, use alternative water sources or look for a feature that recirculates water in order to reduce the amount of potable water used. Smaller pumps, lower pump-ing rates, and/or pressure-reducing valves can help reduce water flow.22
Savings PotentialLandscape water use is largely dependent upon climate, plant type, and an irrigation system’s efficiency. Soil health, grade, and maintenance also play a role. In order to evaluate landscape improvements and their associated savings, one must first know how much water is being applied to the landscape. Dedicated irrigation meters can be used to track irrigation water use and document savings from various measures.
Savings for converting high water-using landscapes to low water-using landscapes vary by plant type and climate. Keep in mind that calculations are property-specific. In general, various studies have reported savings ranging from 18 to 50 percent from
Rain garden
5-10 October 2012
converting landscape plants with high water requirements to those with lower water requirements.23 A more water-efficient landscape can also provide ancillary benefits by reducing the need for maintenance, fertilizer application, and fuel use.24
Additional ResourcesAmerican Society of Landscape Architects. www.asla.org.
Denver Water. Xeriscape Plans. www.denverwater.org/Conservation/Xeriscape/XeriscapePlans/.
EPA. Green Infrastructure. water.epa.gov/infrastructure/greeninfrastructure/index.cfm.
EPA. GreenScapes Program. www.epa.gov/epawaste/conserve/rrr/greenscapes/index.htm.
EPA’s WaterSense program. Resource Manual for Building WaterSense Labeled New Homes. www.epa.gov/WaterSense/docs/newhome_builder_resource_manual508.pdf.
EPA’s WaterSense program. The WaterSense Water Budget Tool. www.epa.gov/WaterSense/water_budget/.
EPA’s WaterSense program. Water-Efficient Landscape Design. www.epa.gov/watersense/outdoor/landscaping.html.
Rosenberg, David E., et al. June 2011. Value Landscape Engineering: Identifying Costs, Water Use, Labor, and Impacts to Support Landscape Choice. Journal of the American Water Resources Association (JAWRA) 47(3):635-649.
Rushton, Betty, Ph.D. Southwest Florida Water Management District. May 2002. Infil-tration Opportunities in Parking Lot Designs Reduce Runoff and Pollution. www.p2pays.org/ref/41/40363.pdf.
Sailor, David J. and Dietsch, Nikolaas. October 3, 2005. The Urban Heat Island Mitigation Impact Screening Tool (MIST). www.heatislandmitigationtool.com/Introduction.aspx.
23 EPA’s WaterSense program. December 2009, op. cit.24 Rosenberg, David E., et al. June 2011. Value Landscape Engineering: Identifying Costs, Water Use, Labor, and Impacts to Support Landscape Choice. Journal of the
American Water Resources Association (JAWRA). 47(3):635-649.
5.2 Landscaping

WaterSense at Work: Best Management Practices for Commercial and Institutional Facilities 5-11
25 Irrigation Association (IA). Falls Church, Virginia.
5.3 Irrigation
OverviewThe efficiency of an irrigation system is dictated by many factors, including human, mechanical, and environmental components. Implementing mechanisms and prac-tices that increase an irrigation system’s efficiency could save a property more than half of its outdoor water use. In landscapes around the country, a significant amount of water is lost from evaporation, wind, or runoff due to improper irrigation system design, installation, and maintenance. Eliminating this waste requires trained profes-sionals, appropriate irrigation schedules, and efficient technologies. Additionally, the landscape itself (e.g., plant palette, soil type, etc.) plays a role in irrigation water use and provides the potential for additional water savings. See Section 5.2: Landscaping for more details.
One of the most important concepts associated with irrigation system efficiency is distribution uniformity, or how evenly water is applied over the landscape. This concept is illustrated in Figure 5-2.25 Extra water is often applied if the system is not distributing water in a uniform manner. Without proper distribution, the landscape is watered to keep the driest spot green, over-irrigating other areas. Figure 5-3 provides an illustration of head-to-head coverage, which is a practice to increase distribu-tion uniformity. Using this practice, each sprinkler head (depicted with numbers 1 through 4 in Figure 5-3) is positioned so that its spray arch just touches the head of each surrounding sprinkler. This ensures that there is sufficient overlap and no areas are without coverage.
Figure 5-2. Good and Poor Distribution Uniformity
Good Uniformity
Application Depth
(Never Perfect)
Poor Uniformity
Application Depth

5-12 October 2012
Figure 5-3. Example of Head-to-Head Coverage Spray Pattern
In addition to considering how evenly water is applied, it is equally important to consider the irrigation schedule, which dictates the amount and timing of the water applied. Landscape water needs change with the seasons, and so should the irriga-tion schedule. Many landscapes are watered at the same level all year, which is unnecessary. Over-watering can damage plants more than under-watering and can also damage streets, curbs, other paving, and building foundations.
Not only do proper design, installation, and maintenance of an irrigation system play a significant role in landscape water efficiency, but there are also a variety of irriga-tion technologies that can help reduce water use. For example, drip irrigation is a highly efficient method of application because it directs water to plant roots at a low flow rate, avoiding water lost to wind or runoff. This technology uses between 20 to 50 percent less water than conventional in-ground sprinkler systems.26 There are also efficient types of sprinkler heads that distribute water in larger droplets, avoiding wind drift and increasing distribution uniformity. The Southern Nevada Water Au-thority (SNWA) estimates water-efficient sprinkler technologies can reduce water use by as much as 30 percent when compared to standard pop-up sprinklers.27 Addition-ally, scheduling technologies relying on weather data, soil moisture, or other onsite conditions apply water only when needed.
To capitalize on the water savings potential from these scheduling technologies, the U.S. Environmental Protection Agency’s (EPA’s) WaterSense® program published a specification to label weather-based irrigation controllers. WaterSense labeled weather-based irrigation controllers (WBICs)28 are independently certified to meet plants’ watering needs without over-watering.
5.3 Irrigation
26 Gleick, Peter H., et al. Pacific Institute. 2003. Waste Not, Want Not: The Potential for Urban Water Conservation in California. Page 8.27 Solomon, K.H., et al. 2007. Performance and Water Conservation Potential of Multi-Stream, Multi-Trajectory Rotating Sprinklers for Landscape Irrigation. Applied Engi-
neering in Agriculture. 23(2):153-163.28 U.S. Environmental Protection Agency’s (EPA’s) WaterSense program. WaterSense Labeled Irrigation Controllers. www.epa.gov/WaterSense/products/
controltech.html.
1 2
3 4

October 2012 5-13
5.3 Irrigation
WaterSense has evaluated a number of studies conducted by a variety of organiza-tions that cover numerous WBIC brands. Results from these studies indicate a range of overall savings from 6 to 30 percent. Individual site savings can vary beyond these overall numbers, depending upon the watering habits prior to installing the WBIC. In some cases, site water use can increase if the facility was practicing deficit irriga-tion before installing a WBIC. In a 2009 comprehensive study, first-year savings were shown to be approximately 6 percent.29 For a limited subset of controllers in this study that were tracked for three years, overall savings were shown to be 16 percent in the third year after installation. In full consideration of the findings of these numer-ous studies, WaterSense anticipates seeing overall water savings of approximately 15 percent after proper installation of WBICs, when compared to systems that use a clock timer with manual programming.30
The key to saving irrigation water is to combine efficient irrigation practices with efficient technologies. Additional details on many of these principles, practices, and technologies can be found in the Irrigation Association’s (IA’s) Landscape Irrigation Scheduling and Water Management and Turf and Landscape Best Management Prac-tices31 documents.
Operation, Maintenance, and User EducationThere are several best practices a facility can consider to optimize an irrigation sys-tem’s efficiency, such as ensuring irrigation professionals are properly educated on water-efficient practices and that existing irrigation systems are properly operated and maintained.
Irrigation Professional Education
Consider the following to ensure irrigation professionals have a strong understand-ing of the principles of water-efficient irrigation:
• Ensure existing professionals or staff managing the irrigation system become familiar with water-efficient irrigation practices through partnerships, classes, seminars, and/or published guidance documents. Encourage professionals or staff managing the system to:
à Become certified through a WaterSense labeled irrigation certification pro-gram with an emphasis on water efficiency.32
à Consult the local water utility, community colleges, or agricultural services for courses or seminars on water-efficient irrigation practices.
à Review technical guidance documents provided by local cooperative exten-sion services and irrigation trade associations.
29 Mayer, Peter, et al. The Metropolitan Water District of Southern California and the East Bay Municipal Utility District. July 1, 2009. Evaluation of California Weather-Based “Smart” Irrigation Controller Programs. www.aquacraft.com/node/32.
30 EPA’s WaterSense program. November 3, 2011. WaterSense Specification for Weather-Based Irrigation Controllers Supporting Statement. Page 12. www.epa.gov/watersense/partners/controller_final.html.
31 IA. Best Practices & Standards: Turf & Landscape Irrigation Best Management Practices. www.irrigation.org/Resources/Turf___Landscape_BMPs.aspx.32 EPA’s WaterSense program. Professional Certification Program. www.epa.gov/WaterSense/outdoor/cert_programs.html.

5-14 October 2012
• When hiring new irrigation professionals to work with the system, inquire about their water-efficiency certification or specific training that promotes efficient ir-rigation. For example, professionals certified by WaterSense labeled irrigation cer-tification programs33 have demonstrated knowledge in water-efficient irrigation.
Irrigation System Operation
In addition to periodically reviewing all irrigation service agreements to emphasize the operation of a water-efficient system, verify that the irrigation schedule is appro-priate for climate, soil conditions, plant materials, grading, and season as follows:
• Irrigation schedules should be updated based on changing weather conditions and as part of regular maintenance. Require the irrigation professional and/or auditor to deliver options for automating schedule changes based on changing weather conditions. Installing and properly programming WaterSense labeled WBICs34 or soil moisture sensors can provide this capability.
• Certain soil types or steep slopes could increase the chance of surface runoff. Irrigation events may need to be separated into multiple applications depend-ing upon landscape conditions. This is commonly known as a “cycle and soak” methodology. If currently installed irrigation controller(s) are not capable of such programming, consider using more current technology.
• Generally, it is better to apply water in larger amounts, but less frequently, result-ing in deep watering. A less frequent but more intense schedule encourages the growth of deep roots, resulting in healthy plants. Note that soil type plays a role in creating this type of schedule and should be taken into consideration.
• Incorporate a water budget, which can be used as a performance standard for wa-ter use. A budget provides a specified amount of water that should be applied to the landscape and can be used as a comparison to the property’s actual water use.
Irrigation System Maintenance
Irrigation systems require regular maintenance to ensure optimal performance. Consider the following key system maintenance tips:
• Require a full audit of the irrigation system every three years by a qualified irriga-tion auditor, such as a professional certified by a WaterSense labeled program.35 IA provides audit guidelines.36 A full audit should include an in-depth assessment of the irrigation system, its performance, and schedule. In addition, the audit should expose deficiencies that have occurred from either system changes and/or landscape changes. The audit is an opportunity to identify appropriate, new technologies as well. An audit should analyze the distribution uniformity of the system to ensure it is at least 65 percent. A distribution uniformity of
5.3 Irrigation
33 Ibid.34 EPA’s WaterSense program. WaterSense Labeled Irrigation Controllers, op. cit.35 EPA’s WaterSense program. Professional Certification Program, op. cit.36 IA. Technical Resources: Irrigation Audit Guidelines. www.irrigation.org/Resources/Audit_Guidelines.aspx.

October 2012 5-15
5.3 Irrigation
65 percent is equal to a rating of “very good” for fixed spray heads, according to IA.37 To help ensure consistent uniformity, require that replacement equipment is compatible with existing equipment and made by the same manufacturer.
• In addition to a full audit every few years, the system should be periodically monitored for effectiveness throughout the year. Ask the irrigation professional or staff managing the system to ensure certain sprinkler components are placed and adjusted so that they water the cultivated plants and not the pavement or other hardscape. Verify that irrigation system pressure is within manufacturer specifications.
• Request that irrigation professionals or staff managing the system include immedi-ate reporting and repair of problems in maintenance programs, and require regu-lar maintenance routines as part of the overall irrigation maintenance program.
• Install a dedicated water meter for the irrigation system to measure the amount of water applied to the landscape. Some water utilities offer an interruptible rate for the service or will not apply sewer charges to water used for irrigation. The ir-rigation professional or staff managing the system should keep a record of trends in irrigation water use as part of the maintenance program.
Retrofit OptionsIf retrofitting an irrigation system, consider the follow-ing options to decrease landscape water use.
Irrigation System Controllers and Sensors
An existing irrigation system can be optimized by the following retrofits to the controls or components:
• Consider replacing existing irrigation system con-trollers with a more advanced control system that waters plants only when needed. There are many available technologies using weather or soil moisture information to schedule irrigation according to plant needs. The following are a few options to discuss with the service provider, audi-tor, or consultant/designer:
à WaterSense labeled WBICs38 can be added to an existing system. These prod-ucts are independently certified to minimize irrigation excess and maximize irrigation adequacy, while also providing other performance and user fea-tures. In order to work effectively, these WBICs must be installed and pro-grammed properly, taking into account facility-specific landscape conditions and the irrigation system installed.
37 IA. March 2005. Landscape Irrigation Scheduling and Water Management. Pages 1-22. www.asla.org/uploadedFiles/PPN/Water%20Conservation/Documents/LISWM%20Draft.pdf.
38 EPA’s WaterSense program. WaterSense Labeled Irrigation Controllers, op. cit.
Weather-based irrigation controller

5-16 October 2012
à Soil moisture sensors can be inserted into the soil to measure moisture. They can be connected to an existing system, enabling irrigation as needed by plants.
• Consider installing rain-sensing technology to prevent irrigation from taking place during periods of sufficient moisture. Many cities and some states require rain-sensing technology by law. Check with the state or city on relevant man-dates.
• Consider installing other sensors to cut down on wasted water. For example, wind-sensing technology interrupts irrigation cycles in the presence of signifi-cant wind. Freeze-sensing technology prevents irrigation during freeze condi-tions. Flow rate-monitoring equipment can interrupt irrigation if excess flow is detected (i.e., caused by broken pipes, fittings, emitters, sprinklers, etc.).
• If managing a large property, consider installing complete central control sys-tems that use demand-based controls to enable a water manager to centrally operate and manage multiple irrigation systems at multiple locations with vari-ous means of communication.
Irrigation System Hardware
In addition to retrofitting the control system to decrease water use, a facility can con-sider retrofitting irrigation system hardware as follows:
• Consider retrofitting a portion of the spray heads that water trees, shrubs, or plant beds with low-flow, low-volume irrigation, also called micro-irrigation or drip irrigation. Many plant beds do not require the spray heads traditionally used to water turf areas.
• Consider exchanging existing sprinkler heads with more efficient heads designed to minimize water lost to wind and distribute water in a more uniform man-ner. Sprinklers with a fine mist are susceptible to water waste from wind drift. Also, some sprinklers do not apply water evenly over the landscape. Consider pressure-regulating heads with matched precipitation and/or multi-trajectory rotating spray heads as water-efficient sprinkler head options.
• Pay attention to sprinkler head spacing during replacement to ensure the heads have matched trajectories and offer head-to-head coverage.
• Retrofit other water-using devices on the property to use water more efficiently. For example, attach shut-off nozzles to handheld hoses to make sure water is go-ing directly to the plants rather than dripping on the ground.
Replacement OptionsIf replacing an irrigation system, there are as many opportunities to increase its efficiency during the phases of system design and installation as there are during system operation and maintenance. Hiring qualified irrigation professionals and ensuring a well-designed system are key to ensuring water savings from an irrigation system replacement.
5.3 Irrigation
October 2012 5-17
5.3 Irrigation
Qualified Irrigation Professionals
Select an irrigation installation and maintenance professional that has been certified by a WaterSense labeled program39 or otherwise has experience in water efficiency. In addition, consider the following:
• If using onsite staff, encourage them to become certified through a WaterSense labeled certification program that focuses on water efficiency.
• Upon completion of new irrigation systems, use a qualified irrigation auditor, such as one certified by a WaterSense labeled program,40 to audit the system and ensure the installed system’s performance meets the design intent. The auditor can then make minor adjustment recommendations as needed.
System Design Considerations
When replacing an irrigation system, recommend that the system be designed, installed, and maintained according to technical guidance published by local co-operative extensions or IA. Following industry best practices helps the irrigation professional address water-efficient techniques from design through installation and proper maintenance. Visit IA’s website for further technical guidance and information related to the most widely known irrigation best practices.41 In addition, consider the following:
• Design the system for maximum water application uniformity (i.e., distribution uniformity). As noted above, aim for a distribution uniformity of at least 65 per-cent. Request the following of the designer:
à Ensure no direct distribution of water over impermeable surfaces or non-target areas.
à Maximize sprinkler distribution uniformity by following manufacturer rec-ommendations for head spacing and design the system with head-to-head coverage.
• Create irrigation hydrozones by placing plants with similar water needs together. Also consider varying soil conditions, sun/shade/wind exposure, slope, and other site specifics that could impact watering needs.
• Consider installing the following components for optimal water efficiency:
à Drip/micro-irrigation for all areas suitable for such technology.
à High-efficiency sprinkler heads for turf and other areas that require spray irrigation.
à Check valves in all sprinklers to retain water in lateral pipes between cycles.
à Demand-based irrigation controls (i.e., weather- or sensor-based controls).
39 EPA’s WaterSense program. Professional Certification Program, op. cit.40 Ibid.41 IA. Technical Resources. www.irrigation.org/Resources/Technical_Resources.aspx.

5-18 October 2012
à Rain, freeze, and wind sensors to interrupt irrigation during unfavorable weather conditions.
à Flow rate-monitoring equipment that can interrupt irrigation if excess flow is detected.
• Use alternative sources of water (see Section 8: Onsite Alternative Water Sources) where environmentally appropriate and local regulations allow. Keep in mind that while alternative sources are an additional way to save water in a landscape, efficiency should come first. Apply all the principles above to build the optimal, efficient system, and then consider using alternative sources.
Savings PotentialIrrigation water savings can be achieved through proper design, installation, and maintenance, combined with efficient technologies. In addition, the landscape itself (e.g., plant palette, soil type, etc.) plays a role in irrigation water use and provides potential for additional water savings (see Section 5.2: Landscaping for more details).
In order to consider irrigation system improvements and their associated savings, it is important to first understand how much water is being applied to the landscape. Dedicated irrigation meters track irrigation water use and allow facilities to docu-ment actual savings.
The WaterSense Water Budget Tool,42 developed by EPA to support residential land-scapes associated with WaterSense labeled new homes, can be used to see how relative water needs adjust by changing the plant palette and associated irrigation type. For example, replacing a large turf area irrigated by spray heads with plant beds irrigated by drip irrigation could significantly reduce water use. The Water Budget Tool allows a landscape professional to alter the irrigation type in a virtual setting, analyzing the relative water savings associated with each design change. The tool, however, is not intended to estimate actual savings; it is meant to evaluate the rela-tive water savings achieved with different palette and technology choices.
Savings from implementing any of these technologies are dependent upon the system as a whole, including the landscape and climate, and, therefore, are land-scape-specific. Following are a few examples of savings realized from implementing water-efficient technologies in the landscape:
• Installing drip irrigation uses 50 percent less water than conventional in-ground sprinkler systems.43
• Water-efficient sprinkler technologies can reduce water use by as much as 30 percent when compared to standard pop-up sprinklers.44
5.3 Irrigation
42 EPA’s WaterSense program. The WaterSense Water Budget Tool. www.epa.gov/WaterSense/water_budget/.43 Gleick, Peter H., op. cit.44 Solomon, K.H., et al., op. cit.

October 2012 5-19
5.3 Irrigation
45 EPA’s WaterSense program. November 3, 2011, op. cit.46 Dukes, Michael D. and Haman, Dorota Z. University of Florida IFAS Extension. August 2002. Residential Irrigation System Rainfall Shutoff Device. edis.ifas.ufl.edu/ae221.
• Properly installing a WaterSense labeled WBIC may reduce irrigation water use by 15 percent.45
• A project in Florida demonstrated a savings of 13,567 gallons every time a rain sensor prevented an irrigation event on half an acre of landscape.46
Additional ResourcesEPA’s WaterSense program. The WaterSense Water Budget Tool. www.epa.gov/WaterSense/water_budget/.
EPA’s WaterSense program. Resource Manual for Building WaterSense Labeled New Homes. www.epa.gov/WaterSense/docs/newhome_builder_resource_manual508.pdf.
EPA’s WaterSense program. Meet Our Partners. www.epa.gov/watersense/meet_our_partners.html.
EPA’s WaterSense program. Watering Wisely. www.epa.gov/watersense/outdoor/waterwisely.html.
EPA’s WaterSense program. WaterSense Labeled Irrigation Controllers. www.epa.gov/watersense/products/controltech.html.
Irrigation Association. Best Practices & Standards: Turf & Landscape Irrigation Best Management Practices. www.irrigation.org/Resources/Turf___Landscape_BMPs.aspx.
Irrigation Association. March 2005. Landscape Irrigation Scheduling and Water Man-agement. www.asla.org/uploadedFiles/PPN/Water%20Conservation/Documents/LISWM%20Draft.pdf.
Irrigation Association. Technical Resources: Irrigation Audit Guidelines. www.irrigation.org/Resources/Audit_Guidelines.aspx.

5-20 WaterSense at Work: Best Management Practices for Commercial and Institutional Facilities
5.4 Commercial Pool and Spa Equipment
OverviewPools and spas are found in many commercial or institutional settings, including hotels, schools, community centers, hospitals, and apartment complexes. The size and features of these pools vary widely depending on their intended use and set-ting. Table 5-1, which summarizes typical pool sizes for commercial pools and spas in California,47 shows that a typical commercial pool can contain between 34,000 and 860,000 gallons of water. Spas are much smaller, containing on average 1,100 gal-lons. Due to a lack of data, the California Urban Water Conservation Council (CUWCC) document from which this data was taken assumes that the typical pool sizes esti-mated for California are representative of pool sizes nationally.
Table 5-1. Typical Sizes for Commercial Pools and Spas
Pool TypeArea
(square feet)Depth (feet)
Volume (gallons)
Spa 40 3.0 1,100
Hotel (in-ground) 1,000 4.5 34,000
Public (in-ground) 4,000 5.0 150,000
Olympic (in-ground) 14,000 8.0 860,000
Overall, a large volume of water is used to fill commercial pools or spas. Much of this water is often lost in day-to-day operation due to evaporation, leaking, and splash-ing. Ongoing pool or spa maintenance also creates significant losses in filter cleaning and mineral buildup control.
Because evaporation, filter cleaning, and mineral buildup control represent the great-est uses of water for commercial pools and spas, they also provide the most significant opportunities to achieve water savings. CUWCC estimates that water evaporation, filter backwashing, and mineral buildup control account for 56, 23, and 21 percent of pool water use, respectively, across all pools installed in California.48 Water losses from leaks and splashing are not included in this estimate because they are difficult to quantify. Although the estimates used in this section are specific to California, EPA assumes that, with the exception of evaporation (which is dependent upon local cli-mate), they are applicable to and representative of pools and spas nationwide.
Evaporation
Water continually escapes pools and spas due to evaporation from the pool/spa surface. The rate of evaporation will depend upon several factors, including: water temperature, the pool’s ambient conditions (e.g., indoor or outdoor), the extent of convection over the pool’s open surface, and the surface area of water that comes in
47 Koeller, John and H.W. (Bill) Hoffman & Associates, LLC. September 2010. Evaluation of Potential Best Management Practices—Pools, Spas, and Fountains. Prepared for the California Urban Water Conservation Council. Pages 3-30. www.cuwcc.org/products/pbmp-reports.aspx.
48 Ibid. Page 30.
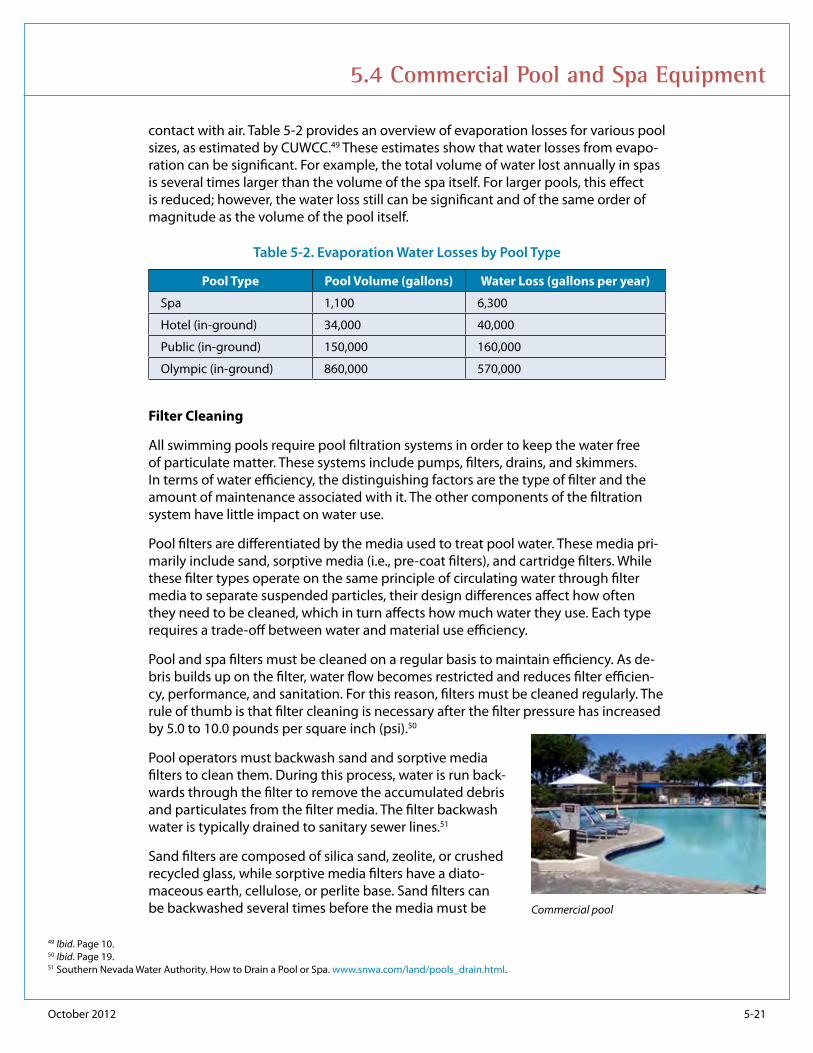
October 2012 5-21
5.4 Commercial Pool and Spa Equipment
contact with air. Table 5-2 provides an overview of evaporation losses for various pool sizes, as estimated by CUWCC.49 These estimates show that water losses from evapo-ration can be significant. For example, the total volume of water lost annually in spas is several times larger than the volume of the spa itself. For larger pools, this effect is reduced; however, the water loss still can be significant and of the same order of magnitude as the volume of the pool itself.
Table 5-2. Evaporation Water Losses by Pool Type
Pool Type Pool Volume (gallons) Water Loss (gallons per year)
Spa 1,100 6,300
Hotel (in-ground) 34,000 40,000
Public (in-ground) 150,000 160,000
Olympic (in-ground) 860,000 570,000
Filter Cleaning
All swimming pools require pool filtration systems in order to keep the water free of particulate matter. These systems include pumps, filters, drains, and skimmers. In terms of water efficiency, the distinguishing factors are the type of filter and the amount of maintenance associated with it. The other components of the filtration system have little impact on water use.
Pool filters are differentiated by the media used to treat pool water. These media pri-marily include sand, sorptive media (i.e., pre-coat filters), and cartridge filters. While these filter types operate on the same principle of circulating water through filter media to separate suspended particles, their design differences affect how often they need to be cleaned, which in turn affects how much water they use. Each type requires a trade-off between water and material use efficiency.
Pool and spa filters must be cleaned on a regular basis to maintain efficiency. As de-bris builds up on the filter, water flow becomes restricted and reduces filter efficien-cy, performance, and sanitation. For this reason, filters must be cleaned regularly. The rule of thumb is that filter cleaning is necessary after the filter pressure has increased by 5.0 to 10.0 pounds per square inch (psi).50
Pool operators must backwash sand and sorptive media filters to clean them. During this process, water is run back-wards through the filter to remove the accumulated debris and particulates from the filter media. The filter backwash water is typically drained to sanitary sewer lines.51
Sand filters are composed of silica sand, zeolite, or crushed recycled glass, while sorptive media filters have a diato-maceous earth, cellulose, or perlite base. Sand filters can be backwashed several times before the media must be
49 Ibid. Page 10.50 Ibid. Page 19.51 Southern Nevada Water Authority. How to Drain a Pool or Spa. www.snwa.com/land/pools_drain.html.
Commercial pool

5-22 October 2012
replaced, but they use the greatest amount of water to flush particulates out of the sand in the backwash process. Sorptive media filters use less water, but must be replenished after every backwash, as the media is purged from the filter grid along with the debris. Replenishment is accomplished by mixing new sorptive media with water and pouring it into the skimmer closest to the pump. The pump then trans-ports the sorptive media to the filter and deposits it onto the filter grid.
Cartridge units eliminate backwashing by using pleated filters made from a paper-type material that can be reused or disposed. Instead of backwashing, disposable cartridge filters are removed, discarded, and replaced with a new filter. Reusable filters are rinsed with a spray hose or soaked in a cleaning solution before being brushed or rinsed. While cartridge filtration is the most water-efficient, it is not usu-ally a viable option for large commercial pools because the cartridge replacement rate quickly becomes cost-prohibitive and labor-intensive.52
Large commercial pools sometimes use a fourth filter type, industrial filters, which are a specific type of sorptive media filter. These filters are more efficient than tra-ditional sorptive media filters because they can recycle the sorptive media up to 30 times before it must be discarded and replaced. Unlike traditional sorptive media filters, which pass water straight through the filter during backwashing, industrial fil-ters recycle the water that is used to backwash the filter. As a result, the total volume of water used during backwashing is reduced to only twice the volume of the filter.53
The East Bay Municipal Utility District in Oakland, California, recommends using sorp-tive media for commercial pools and cartridge filters for spas.54 Table 5-3 provides an overview of the water use associated with each filter type, as estimated by CUWCC.55 These estimates show that, for smaller pools and spas, cartridge filters use less water than sand, sorptive media, or industrial filters. For larger pools, industrial filters are much more efficient.
Table 5-3. Filter Cleaning Water Consumption Estimates by Pool and Filter Type
Pool TypePool
Volume (gallons)
Water Use (gallons per year)
SandSorptive
MediaCartridge Industrial
Spa 1,100 940 470 300 N/A*
Hotel (in-ground)
34,000 30,000 9,400 3,600 5,000
Public (in-ground)
150,000 170,000 42,000 N/A 9,000
Olympic (in-ground)
860,000 960,000 240,000 N/A 17,000
5.4 Commercial Pool and Spa Equipment
52 East Bay Municipal Utility District (EBMUD). 2008. WaterSmart Guidebook—A Water-Use Efficiency Plan Review Guide for New Businesses. Page 171. www.ebmud.com/for-customers/conservation-rebates-and-services/commercial/watersmart-guidebook.
53 Koeller, John and H.W. (Bill) Hoffman & Associates, LLC, op. cit., Pages 18-19.54 EBMUD, op. cit., Page 174.55 Koeller, John and H.W. (Bill) Hoffman & Associates, LLC, op. cit., Page 35.
*N/A: not applicable

October 2012 5-23
5.4 Commercial Pool and Spa Equipment
Mineral Buildup Control
Water in pools and spas experiences a continual buildup of dissolved solids in the form of mineral salts and treatment chemicals. This buildup must be treated or re-moved to prevent scale buildup or corrosion of pool surfaces and equipment. Proper pool maintenance and water quality control are essential for extending the useful life of the water. Water quality control significantly saves water by reducing the number of times the pool must be completely drained and refilled, the number of filter back-washes needed, and the potential for leaks due to corrosion or other factors.
All pools require water to be exchanged periodically in order to control the buildup of solids and other contaminants. This water exchange can be either partial or full and can be controlled manually or through an automated process. When draining the pool manually, the pool operator will simply pump pool water directly to the drain at some predetermined point in time. The automated approach utilizes conductivity control-lers, which drain a portion of the pool water once a predetermined concentration of total dissolved solids is reached. Conductivity controllers save water by limiting ex-changes to when they are necessary. The amount of water lost in the exchange process will depend upon pool volume, dissolved solids concentration in the make-up water, type and amount of treatment chemicals added, and the local evaporation rate.56
Reverse osmosis systems, which operate independently from pool filters, are also utilized to prolong the useful life of pool water. During reverse osmosis filtration, pool water is passed through a membrane filter, which selectively excludes dissolved minerals and sus-pended particles from passing through the filter. Water is able to permeate through the barrier and is recovered and returned to the pool. The dissolved minerals and suspended particles that are trapped behind the membrane filter are then discharged to sanitary sewer lines as reject water. Recovering the pool water in this manner eliminates the need to dump and refill the pool. While reverse osmosis systems are effective at filtering miner-als, they waste a large amount of water in the treatment process. A large facility should consider the amount of reject water that would be produced if utilizing this equipment.
Leaks and Splashing
Water is lost in pools and spas from leaks and splash-ing throughout their useful life. Common leak locations include pump seals, pipe joints, piping in filtration system suction or return lines, pool liners, and along pool edges. A leak may be present if a pool is losing more than two inches of water per week. Air bubbles in either the pump strainer basket or water return line can also indicate the presence of a leak.57 Water is also lost during pool use from splashing and drag-outs as swimmers exit. Water loss from drag-outs can be mitigated by the use of gutter and grate systems installed along the edge of the pool. Although leaks and splashing contribute to water loss, it is difficult to quantify the frequency and extent to which they can occur.
56 Ibid. Page 15.57 Ibid. Page 12.

5-24 October 2012
Operation, Maintenance, and User EducationControlling evaporation, splashing, leaks, and mineral buildup and ensuring that filters are cleaned properly are important operation and maintenance measures to ensure commercial pool and spa equipment efficiency.
Evaporation
To control evaporation, consider the following:
• Do not heat pools above 79°F to reduce water evaporation rates.58
• Limit the use of sprays, waterfalls, and other features.59
• Use pool covers to reduce evaporation rates during periods in which the pool is not in use. Covers also prevent debris from entering the pool, which in turn leads to reduced water usage from filter backwashing.60
• As an alternative to pool covers, liquid barriers can be used to control evapora-tion. These alcohol-based chemicals prevent evaporation by forming a thin film along pool surfaces that acts as a barrier.61 Liquid evaporation barrier products are available through pool supply vendors.62
Splashing
Splashing contributes to water loss. To reduce the amount of water loss from splash-ing, set the pool water level to several inches below the edge of the pool.63 In addi-tion, plug the overflow line when the pool is in use or when adding water.64
Filter Cleaning
Filter cleaning represents the greatest use of water attributed to pools or spas. Al-though water use depends upon the type of filter system installed and the extent to which the pool is used, consider the following:
• Clean filter media only as necessary and not on a set schedule (i.e., clean only when the filter is no longer operating effectively). Although there are several methods by which effectiveness is measured, the typical rule of thumb is that fil-ter cleaning is necessary after the filter pressure has increased by 5.0 to 10.0 psi.65
• Utilize the sight glass if one is installed to monitor the visual quality of the backwash water running through the filter and determine when backwashing is complete, rather than backwashing for a predetermined set amount of time (e.g.,
5.4 Commercial Pool and Spa Equipment
58 Alliance for Water Efficiency (AWE). Swimming Pool and Spa Introduction. www.allianceforwaterefficiency.org/Swimming_Pool_and_Spa_Introduction.aspx.59 Koeller, John and H.W. (Bill) Hoffman & Associates, LLC, op. cit., Page 33.60 Ibid.61 Ibid. Page 34.62 Williams, Kent. Professional Pool Operators of America. November 2002. “Liquid Pool Covers Save Energy.” Pumproom Press. # 25. www.lincolnaquatics.com/
Documents/7536.pdf.63 Koeller, John and H.W. (Bill) Hoffman & Associates, LLC, op. cit., Page 13.64 AWE, op. cit.65 Koeller, John and H.W. (Bill) Hoffman & Associates, LLC, op. cit., Page 19.

October 2012 5-25
five minutes). Backwashing is complete once the water that passes through the sight glass is clear and free of particulates.
Mineral Buildup Control
Pools and spas must be drained of some water on a regular basis in order to con-trol the mineral salt concentrations that gradually build up. The frequency of these events can be reduced by prolonging the useful life of the water by considering the following:
• Maintain proper pH, alkalinity, and hardness levels to avoid the need to drain the pool or to avoid using excess make-up water to correct water quality issues.
• When draining the pool, perform a partial drain rather than a full drain. Consider using the drained pool water for irrigation or other purposes. See Section 8: On-site Alternative Water Sources for more information.66
Leaks
To check your pool for leaks and prevent them for occurring, actively monitor the pool’s water levels. If the pool is losing more than two inches of water per week, it could be leaking.67 In addition, actively monitor for leaks around the pump seals, pipe joints, piping in filtration system suction or return lines, pool liners, and along the pool edges. Repair leaks as soon as they are identified.
Retrofit and Replacement OptionsIf retrofitting an existing pool or spa, there are a several options to minimize overall water use by addressing evaporation, filter cleaning, mineral buildup control, leaks, and splashing. If designing a new or replacement pool or spa, use the management techniques listed in the previous section and the equipment options below.
Evaporation
To prevent water loss from evaporation, cover the pool when it is not in use. In addi-tion, consider the following to control the evaporation of pool or spa water:
• Reduce wind movement across the water by using fences, walls, non-shedding hedges, or other similar barriers.
• Use a liquid barrier. These alcohol-based chemicals prevent evaporation by forming a thin film along pool surfaces that acts as a barrier.68 Liquid evaporation barrier products are available through pool supply vendors.69
5.4 Commercial Pool and Spa Equipment
66 Ibid. Page 15.67 Ibid. Page 12.68 Ibid. Page 34.69 Williams, Kent, op. cit.

5-26 October 2012
Filter Cleaning
In addition to the operation and maintenance tips outlined in the previous section, consider the following for optimum filter efficiency:
• Install a pool filter pressure gauge. This will provide a means for determining when filter cleaning is necessary (i.e., after a pressure increase of 5.0 to 10.0 psi).
• Install a pool filter sight glass to provide a visual means for determining when backwashing is complete and minimize the backwashing time.
• If replacing existing filtration systems, consider installing cartridge filters for small pools and spas, sorptive media filters for medium-sized pools, or industrial filters for very large pools.
Mineral Buildup Control
To control mineral buildup, consider the following:
• Install a reverse osmosis system to prolong the useful life of pool water and to reduce the number of times that the pool must be drained in order to control the concentration of dissolved solids.
• Install a conductivity controller system to manage the concentration of dissolved solids in the pool. This system will monitor the buildup of dissolved solids so that at a predetermined level, a portion of the pool water can be drained and replaced, rather than the entire volume. This also offers the added benefit of providing a frequent source of water that can be used for irrigation or other pur-poses. See Section 8: Onsite Alternative Water Sources for more information.70
Leaks
To reduce water loss from leaks, install a water meter to the pool’s make-up line. This will provide a means for directly monitoring and tracking water use for signs of potential leaks.
Splashing
To reduce water loss from splashing, install pool gutter and grate systems along the pool perimeter to mitigate drag-out losses during pool use.
Savings PotentialSignificant water savings can be achieved through proper pool and spa operation and maintenance and other water-efficient technologies. Following are a few ex-amples of savings that can be realized from implementing water-efficient practices or technologies in pools or spas:
5.4 Commercial Pool and Spa Equipment
70 Koeller, John and H.W. (Bill) Hoffman & Associates, LLC, op. cit., Page 15.

October 2012 5-27
5.4 Commercial Pool and Spa Equipment
• USA Swimming estimates that using pool covers overnight at heated, commer-cial indoor swimming pools can save approximately 575,000 gallons of water per year and also provide energy savings.71
• CUWCC estimates that evaporation losses can be reduced by 30 to 50 percent by using pool covers and 10 to 30 percent with liquid evaporation barriers.72 For an Olympic-sized pool, this could save as much as 290,000 gallons per year.
• CUWCC estimates that replacing conventional sand and sorptive media filters with cartridge or industrial filters, where appropriate, can save between 68 and 98 percent of backwash water. For an Olympic-sized pool, replacing sand filters with industrial filters could save as much as 940,000 gallons of water per year.73
• CUWCC identified one manufacturer who reported that installing a reverse os-mosis system could potentially reduce water consumption by saving 78 percent of the pool water that would otherwise be drained to control mineral buildup. For an Olympic-sized pool, this could save as much as 300,000 gallons of water per year.74
• Based on the CUWCC estimates listed above, the combined use of pool covers, cartridge or industrial filters, and reverse osmosis systems could provide a total annual water savings of as much as 1,500,000 gallons for Olympic-sized pools.
Additional ResourcesAlliance for Water Efficiency. Swimming Pool and Spa Introduction. www.allianceforwaterefficiency.org/Swimming_Pool_and_Spa_Introduction.aspx.
East Bay Municipal Utility District. 2008. WaterSmart Guidebook—A Water-Use Efficiency Plan Review Guide for New Businesses. www.ebmud.com/for-customers/conservation-rebates-and-services/commercial/watersmart-guidebook.
Koeller and Company and H.W. (Bill) Hoffman & Associates, LLC. September 2010. Evaluation of Potential Best Management Practices—Pools, Spas, and Fountains. Pre-pared for the California Urban Water Conservation Council. Pages 3-30. www.cuwcc.org/products/pbmp-reports.aspx.
Marin Municipal Water District. Swimming Pool Tips. www.marinwater.org/controller?action=menuclick&id=268.
Poolmanual.com. Pool Manual. www.poolmanual.com/poolmanual.aspx.
Southern Nevada Water Authority. How to Drain a Pool or Spa. www.snwa.com/land/pools_drain.html.
State of California Department of Water Resources. 2012. Commercial, Institutional and Industrial Task Force Best Management Practices Report to the Legislature.
71 USA Swimming. A Green Initiative Unique to Natatoriums. www.usaswimming.org/ViewMiscArticle.aspx?TabId=1755&Alias=rainbow&Lang=en &mid=7715&ItemId=3633.
72 Koeller and Company and H.W. (Bill) Hoffman & Associates, LLC, op. cit., Page 34.73 Ibid. Page 35.74 Ibid. Page 30.
http://www.ebmud.com/for-customers/conservation-rebates-and-services/commercial/watersmart-guidebook

5-28 October 2012
USA Swimming. A Green Initiative Unique to Natatoriums. www.usaswimming.org/ViewMiscArticle.aspx?TabId=1755&Alias=rainbow&Lang=en&mid=7715&ItemId=3633.
Williams, Kent. Professional Pool Operators of America. November 2002. “Liquid Pool Covers Save Energy.” Pumproom Press. # 25. www.lincolnaquatics.com/Documents/7536.pdf.
5.4 Commercial Pool and Spa Equipment

WaterSense at Work: Best Management Practices for Commercial and Institutional Facilities 5-29
5.5 Vehicle Washing
OverviewWhether at self-service or full-service car washes, or as part of gas stations or vehicle service facilities, there are three types of vehicle-washing technologies: conveyor, in-bay, and self-service. These technologies incorporate some or all of the following steps, as defined by the International Carwash Association:75
• Pre-soak: An automated nozzle or handheld spray.
• Wash: A high-pressure spray or brushes with a detergent solution.
• Rocker panel/undercarriage: Brushes or high-pressure sprays on the sides and bottom of the vehicle.
• First rinse: A high-pressure rinse.
• Wax and sealers: An optional surface finish that is sprayed on the vehicle.
• Final rinse: A low-pressure rinse with fresh or membrane-filtered water.
• Air blowers: Air blown over the vehicle to remove water and assist drying.
• Hand drying: Wiping down the vehicle with towels or chamois cloths, which are often laundered in onsite washing machines. See Section 3.6: Laundry Equipment for information on using water efficiently in commercial laundry systems.
Many commercial vehicle wash facilities have adopted water reclamation technol-ogy, which treats wash and rinse water from previous wash cycles for use during the next vehicle wash in an effort to reduce overall water use. There are several other opportunities for these facilities to minimize water use. In fact, efficient vehicle wash systems can use less water on average per vehicle than washing a car at home.76
Conveyor Systems
Conveyor vehicle wash systems use a conveyor belt to pull vehicles through a wash-ing tunnel, which consists of a series of spray arches and/or washing cloths. Vehicle washing can be conducted with the customer inside the vehicle during the wash process, or the customer can wait outside the vehicle as both the interior and exteri-or are cleaned. In some states, the driver and passengers are required to wait outside the vehicle during washing.
Conveyor facilities employ two different methods of washing: friction or frictionless. During friction washing, the wash equipment (e.g., a cloth curtain) makes contact with the vehicle. Frictionless, or touch-free, washing relies on high-pressure nozzles to clean the vehicle. Conveyors with friction wash cycles use less water per vehicle,
75 Brown, Chris. 2000. Water Conservation in the Professional Car Wash Industry. Prepared for the International Carwash Association.™ Page 10. www.carwash.org/operatorinformation/research/Pages/EnvironmentalReports.aspx.
76 Alliance for Water Efficiency. Vehicle Wash Introduction. www.allianceforwaterefficiency.org/Vehicle_Wash_Introduction.aspx.
5-30 October 2012
because the cloth brushes or curtains collect water and detergent from previous washes and require less re-wetting.77
Conveyor vehicle wash facilities are good candidates for installing reclamation sys-tems because the tunnel length allows for wash wastewater to be easily separated from rinse water of higher quality. Without reclamation, conveyor vehicle washing can use 65.8 gallons per vehicle (gpv) of fresh water during friction washing and 85.3 gpv of fresh water during frictionless washing. A reclamation system can reduce freshwater consumption to as low as 7.8 gpv during friction washing and 16.8 gpv during frictionless washing.78
In-Bay Systems
In-bay vehicle washes can be found at many gas stations or similar facilities where vehicle washing is a secondary service option. For in-bay vehicle washing, the vehicle remains stationary while the washing process occurs. Like conveyor vehicle washing, a series of nozzles and/or brushes is used to complete either a friction or frictionless wash process. One set of nozzles is typically used to perform all wash cycles.
In-bay vehicle washing facilities can also benefit from the use of a water reclamation system. However, because there is typically only one wastewater collection pit, an in-bay water reclamation system must be properly designed to separate contaminated water from cleaner water. A water reclamation system can reduce average in-bay water use from 60.0 gpv to as low as 8.0 gpv.79
Self-Service Car Washes
Self-service car washes allow customers to wash vehicles themselves, using a hand-held nozzle to perform all washing processes. In some cases, there could be a brush available for the wash cycle. The pricing structure for a self-service car wash is typi-cally set up so that the customer pays for a base amount of time of water use and can make additional payments for each additional time increment.
Of the three types of vehicle washing, self-service vehicle washing tends to use the least amount of water—15.0 gpv, on average.80 While self-service vehicle washing typically uses the smallest amount of water per vehicle, water reclamation systems are often not feasible for use with a self-service washing facility, because it is diffi-cult to collect and separate the wastewater. Coupled with the fact that water use in these facilities is driven by user behavior, self-service vehicle washing offers the least potential for water savings through retrofit or replacement.
77 East Bay Municipal Utility District. 2008. WaterSmart Guidebook—A Water-Use Efficiency Plan Review Guide for New Businesses. Pages 37-39, WASH1-6. www.ebmud.com/for-customers/conservation-rebates-and-services/commercial/watersmart-guidebook.
78 Brown, Chris, op. cit., Page 16.79 Ibid.80 Ibid.
5.5 Vehicle Washing

October 2012 5-31
Operation, Maintenance, and User EducationFor optimal vehicle wash system efficiency, consider the following:
• Conduct routine inspections for leaks and train appropriate custodial and clean-ing personnel and users to identify and report leaks.
• Ensure that the main shut-off valve is in proper working order.
• If possible, use a friction washing component in all cycles, especially if water is not reused.
• Sweep all driveways and impervious surfaces instead of washing.
• Minimize pump head pressures based on manufacturer recommendations.
Consider participating in the International Carwash Association™ (ICA) WaterSavers® recognition program, which requires participants to meet certain water usage and quality standards. For more information on the program, refer to the WaterSavers website.81
For further vehicle washing efficiency, follow the operating and maintenance tips specific to each type of vehicle wash system described below.
Conveyor Systems
For optimal conveyor system efficiency, consider the following:
• Make sure conveyors are properly calibrated by timing spray nozzles to activate only as the vehicle reaches the spray arch.
• Align spray nozzles properly; they should be oriented parallel to the spray arch.
• If using a water reclamation system, orient blowers so that water is sent back to the water reclamation pit for reuse. Create a dwell time after the final rinse to al-low for water to flow back into the reclamation pit.
• Maximize conveyor speed based on manufacturer recommendations.
In-Bay Systems
For optimal in-bay system efficiency, consider the following:
• Align spray nozzles properly; they should be oriented parallel to the spray arch.
• If using sensors that detect when a vehicle is present, make sure they are prop-erly calibrated. Sensors should activate the spray nozzles only as the vehicle reaches the spray arch.
5.5 Vehicle Washing
81 WaterSavers.® washwithwatersavers.com/.

5-32 October 2012
• If using a reclaim system, create a five-second dwell time before the vehicle exits the bay to allow for water runoff to be collected.
• Maximize wash and rinse cycle speeds based on manufacturer recommendations.
Self-Service Car Washes
For optimal self-service car wash efficiency, educate customers on how to efficiently wash their vehicles using less water.
Retrofit OptionsWater reclamation systems that treat wash and rinse water from previous wash cycles for use during the next vehicle wash offer the greatest potential water savings for vehicle wash systems (see Figure 5-4 for an example of a vehicle wash with a water reclamation system). The degree of water treatment needed depends upon which vehicle washing steps use the reclaimed water. At a minimum, water reclaim systems should separate grit, oil, and grease from wash water. This level of water treatment is enough to use reclaimed water during the rocker/undercarriage wash stage. Addi-tional treatment, such as oxidation, filtration, membrane filtration, and deionization, might be necessary for use of reclaimed water during additional vehicle-washing steps. Table 5-4 outlines the recommended level of water treatment for reclaimed water use during each phase.82
Figure 5-4. Vehicle Wash Water Reclamation System
5.5 Vehicle Washing
82 Created from analyzing data in: Brown, Chris, op. cit., Page 29.
Filtration
Reuse Water Supply for Select Stages
Wash Water
Reclaimed Water
Freshwater Supply
Sediment Filters

October 2012 5-33
5.5 Vehicle Washing
Table 5-4. Recommended Level of Treatment for Reclaim Systems
Wash StageSelf-
ServiceIn-Bay
Conveyor
Friction Frictionless
Pre-Soak N/A* N/AFiltration, reverse osmosis or deionization
Reverse osmosis or deionization
Wash N/A FiltrationSeparation, filtration
N/A
Rocker Panel/ Undercarriage
N/A FiltrationSeparation, filtration
Separation, filtration
First Rinse N/A Filtration Filtration Filtration
Wax and Sealers
Reverse osmosis
Reverse osmosis
Reverse osmosis or deionization
Reverse osmosis or deionization
Final RinseReverse osmosis
Reverse osmosis
Reverse osmosis or deionization
Reverse osmosis or deionization
If considering a water reclamation retrofit, be sure to evaluate the feasibility of the in-stallation. The ability to install additional piping and water treatment equipment will determine whether a reclamation system retrofit is appropriate. Industry experts rec-ommend taking the following into account when designing a reclamation system:83
• Nature of the contamination to be treated • Concentration of the contaminants • Volume of water used per day • Flow rate per minute of different processes in the professional car wash • Chemicals and procedures used in the wash or rinse process • Discharge limits (if applicable) • Intended use of the reclaimed water and the desired quality for its use
Water reclamation systems require additional maintenance to clean filters and other system components. Cleaning and finish products should be compatible with the system operation.84
Water reclamation systems can be retrofitted with existing conveyor or in-bay vehicle washing systems, but they are not recommended for retrofit with self-service vehicle washing.
For additional retrofit options to reduce water use, consider the following retrofit op-tions for each washing type.
83 Ibid. Page 21.84 Koeller and Company and Chris Brown Consulting. October 2006. Evaluation of Potential Best Management Practices—Vehicle Wash Systems. Prepared for The
California Urban Water Conservation Council. Page 23. www.cuwcc.org/products/pbmp-reports.aspx.
*N/A: not applicable

5-34 October 2012
Conveyor Systems
When retrofitting a conveyor system, consider the following:
• Limit freshwater consumption to 40.0 gpv, as recommended by ICA’s WaterSavers recognition program.85
• For conveyor systems that utilize frictionless washing, consider installing friction washing components to use during the wash cycles.
• If a reverse osmosis treatment system is installed for use with a water reclamation system or to supply spot-free rinse water, capture reject water and reuse during wash cycles.
• Install check valves to prevent backflow wherever possible.
In-Bay Systems
When retrofitting in-bay systems, consider the following:
• Limit freshwater consumption to 40.0 gpv, as recommended by ICA’s WaterSavers recognition program.86
• For in-bay systems that utilize frictionless washing, consider installing friction washing components to use during the wash cycles.
• If a reverse osmosis treatment system is installed for use with a reclaim system or to supply spot-free rinse water, capture reject water and reuse during wash cycles.
• Install check valves to prevent backflow wherever possible.
• Install laser sensors to evaluate the length of the vehicle being washed and ad-just the washing procedure to the specific length of the vehicle.
• Limit water consumption during the rocker panel/undercarriage cycle to 12.0 gallons per cycle.
Self-Service Car Washes
When retrofitting self-service car washes, consider the following:
• Limit nozzle flow rate to 3.0 gallons per minute (gpm), as recommended by ICA’s WaterSavers recognition program.87
• Install check valves to prevent backflow wherever possible.
• If towel ringers are installed, use a positive shut-off valve.
5.5 Vehicle Washing
85 International Carwash Association (ICA). WaterSavers Criteria. www.carwash.org/industryinformation/watersavers/Pages/default.aspx.86 Ibid.87 Ibid.

October 2012 5-35
5.5 Vehicle Washing
Replacement OptionsDue to the high capital costs involved with replacing a vehicle wash system, first implement all efficient operation and maintenance procedures and perform any retrofits available to optimize the efficiency of the system. Retrofitting an existing vehicle wash system with a water reclamation system can yield the most potential for water and operational cost savings.
Water reclamation systems are appropriate for conveyor and in-bay vehicle washing. When designing a new vehicle washing facility, consider one that incorporates the features described in the earlier “Retrofit Options” section.
Savings PotentialWater savings can be achieved by installing a water reclamation system for conveyor or in-bay vehicle wash facilities. A study by ICA found that facilities using reclama-tion systems were able to fulfill 51 percent of their water needs, on average, from reclaimed water.88
To calculate facility-specific water savings and payback, use the following information.
Current Water Use
To estimate the current water use of an existing vehicle wash system, identify the fol-lowing information and use Equation 5-1:
• Water use per vehicle. This can be determined based on metered water use. If the facility does not have a meter, ICA found that conveyor and in-bay washes use an average of 75.0 gpv and 55.0 gpv of fresh water, respectively.89
• Number of vehicles washed per day.
• Days of facility operation per year.
Equation 5-1. Water Use of Vehicle Wash (gallons per year)
= Water Use per Vehicle x Vehicles Washed x Days of Facility Operation
Where:
• Water Use per Vehicle (gallons per vehicle) • Vehicles Washed (number of vehicles washed per day) • Days of Facility Operation (days per year)
88 Brown, Chris. 2000, op. cit.89 Ibid. Page 16.

5-36 October 2012
Water Savings
According to the ICA’s study, vehicle wash facilities can reduce their freshwater use by approximately 50 percent by using a water reclamation system. To calculate water savings that can be achieved from retrofitting an existing vehicle wash system, iden-tify the current water use (as calculated using Equation 5-1) and use Equation 5-2.
Equation 5-2. Water Savings From Vehicle Wash System Retrofit (gallons per year)
= Current Water Use of Vehicle Wash System x Savings (0.5)
Where:
• Current Water Use of Vehicle Wash System (gallons per year) • Savings (percent)
Payback
To calculate the simple payback from the water savings associated with the vehicle wash system retrofit, consider the equipment and installation cost of the retrofit wa-ter reclamation system, the water savings as calculated using Equation 5-2, and the facility-specific cost of water and wastewater. Water reclamation systems might cost $35,000 for equipment and installation.90
Additional ResourcesAlliance for Water Efficiency. Vehicle Wash Introduction. www.allianceforwaterefficiency.org/Vehicle_Wash_Introduction.aspx.
Brown, Chris. 2000. Water Conservation in the Professional Car Wash Industry. Prepared for the International Carwash Association (ICA). www.carwash.org/ operatorinformation/research/Pages/EnvironmentalReports.aspx.
Brown, Chris. 2002. Water Use in the Professional Car Wash Industry. Prepared for ICA. www.carwash.org/operatorinformation/research/Pages/EnvironmentalReports.aspx.
East Bay Municipal Utility District. 2008. WaterSmart Guidebook—A Water-Use Efficiency Plan Review Guide for New Businesses. Pages 37-39, WASH1-6. www.ebmud.com/ for-customers/conservation-rebates-and-services/commercial/watersmart-guidebook.
ICA. WaterSavers Environmental Reports. www.carwash.org/industryinformation/ WaterSavers/Pages/WaterSaversEnvironmentalReports.aspx.
Koeller and Company and Chris Brown Consulting. October 2006. Evaluation of Po-tential Best Management Practices—Vehicle Wash Systems. Prepared for the California Urban Water Conservation Council. www.cuwcc.org/products/pbmp-reports.aspx.
5.5 Vehicle Washing
90 Brown, Chris. September 2002. Water Use in the Professional Car Wash Industry. Prepared for ICA. Page 43. www.carwash.org/operatorinformation/research/Pages/EnvironmentalReports.aspx.
http://www.ebmud.com/for-customers/conservation-rebates-and-services/commercial/watersmart-guidebook
Table of Contents6.1 Introduction to Mechanical Systems ............. 6-2
6.2 Single-Pass Cooling .............................................. 6-4
6.3 Cooling Towers ....................................................... 6-8
6.4 Chilled Water Systems .......................................6-18
6.5 Boiler and Steam Systems ................................6-25
Mechanical Systems

6-2 WaterSense at Work: Best Management Practices for Commercial and Institutional Facilities
6.1 Introduction to Mechanical Systems
Mechanical systems are used in nearly every type of commercial and institutional facility to provide building heating and cooling. Some facilities also use mechanical systems to cool specific pieces of equipment, such as vacuum pumps, X-ray equip-ment, and ice machines. In many instances, these mechanical systems use water as the heat transfer medium. As a result, the use of water for building and equipment heating and cooling can be significant, in some cases as much as 30 percent of the total water use within a facility, as shown in Figure 6-1 for various commercial facility types.1
Figure 6-1. Water Use Attributed to Mechanical Equipment for Heating and Cooling in Various Commercial Facility Types
Common mechanical systems that use water as the heat transfer medium include single-pass cooling, cooling towers, chilled water systems, and boiler and steam systems. When looking to reduce mechanical system water use, facilities should first eliminate single-pass cooling or reuse that water, then evaluate other cooling and heating systems to maximize efficiency. Single-pass cooling systems use water to re-move heat and cool specific pieces of equipment. However, after the water is passed through the equipment, it is typically discharged to the sewer, rather than being re-cooled and recirculated. In some cases, single-pass cooling can be the single largest water user at a facility, using approximately 40 times more water to remove the same heat load than a cooling tower operating at five cycles of concentration.2
1 Created from analyzing data in: Schultz Communications. July 1999. A Water Conservation Guide for Commercial, Institutional and Industrial Water Users. Prepared for the New Mexico Office of the State Engineer. www.ose.state.nm.us/wucp_ici.html; Dziegielewski, Benedykt, et al. American Water Works Association (AWWA) and AWWA Research Foundation. 2000. Commercial and Institutional End Uses of Water; East Bay Municipal Utility District. 2008. WaterSmart Guidebook: A Water-Use Efficiency Plan Review Guide for New Businesses. www.ebmud.com/for-customers/conservation-rebates-and-services/commercial/watersmart-guidebook; AWWA. Helping Businesses Manage Water Use—A Guide for Water Utilities.
2 U.S. Environmental Protection Agency and U.S. Energy Department, Energy Efficiency and Renewable Energy, Federal Energy Management Program. May 2005. Laboratories for the 21st Century: Best Practices, Water Efficiency Guide for Laboratories. Page 4. www1.eere.energy.gov/femp/program/labs21_bmp.html.
0%
20%
40%
60%
80%
100%
Hospitals Office Buildings
Schools Restaurants Hotels

October 2012 6-3
All facilities should be on the lookout for single-pass cooling, which is often a hid-den but rather significant water use associated with certain heating, air conditioning, and refrigeration equipment; hydraulic equipment; CAT scanners; X-ray equipment; vacuum pumps; ice machines; and wok stoves.
Like single-pass cooling systems, cooling towers also use significant quantities of water by design. Cooling towers dissipate heat from recirculating water that is used to cool chillers, air conditioning equipment, or other process equipment. After as-sessing whether single-pass cooling can be eliminated, facilities should focus next on ensuring that the cooling tower is properly maintained to minimize the need for make-up water. Facilities can also consider alternative sources of water for cooling tower make-up to significantly reduce the demand for potable water.
In many cases, cooling towers are used in conjunction with chilled water systems to remove heat by passing recirculated cold water through equipment. Chilled water systems are often used to cool air passing through air handling units, but they can also be used to cool a number of other systems or specific pieces equipment. Chilled water systems and/or cooling towers can be found in relatively small facilities, such as office buildings, schools, and supermarkets and in large facilities, such as hospitals, office complexes, and university campuses. Energy-efficiency measures should be used to decrease the load of the entire system to significantly reduce water used in both chilled water systems and cooling towers.
Boiler and steam systems are used in large building heating systems for heating water or to produce steam for industrial processes, cooking, or other operations. For example, hospitals might have central steam systems to supply steam for steriliza-tion, while large commercial kitchens use them to operate combination ovens, steam cookers, and steam kettles. Other types of facilities might use boilers to supply hot water. Returning steam condensate back to the boiler is an important first step in improving water efficiency of boiler and steam systems.
Section 6: Mechanical Systems of WaterSense at Work provides an overview of and guidance for effectively reducing the water use of:
• Single-pass cooling • Cooling towers • Chilled water systems • Boiler and steam systems
6.1 Introduction to Mechanical Systems
Single-Pass Cooling Case Study
To learn how the U.S. Environmental Protection Agency’s Mid-Continent Ecology Division Labora-tory in Duluth, Minnesota, eliminated single-pass cooling and reduced its potable water use by 90 percent, read the case study in Appendix A.

6-4 WaterSense at Work: Best Management Practices for Commercial and Institutional Facilities
OverviewSingle-pass or once-through cooling systems use water to remove heat and cool equipment components. After water is passed once through a coil within or casing around a piece of equipment, the water is discharged to the sewer. Types of equip-ment that use single-pass cooling include:
• Point-of-use chillers or other refrigeration systems • Condensers • Air compressors • Air conditioners • Hydraulic equipment • CAT scanners • Degreasers • Welding machines • Vacuum pumps • X-ray equipment • Ice machines • Wok stoves
Vacuum pumps, X-ray equipment, ice machines, and wok stoves use water for pro-cesses in addition to the water used for single-pass cooling. Such equipment and its associated water use, apart from single-pass cooling, are discussed in other sections within WaterSense at Work.
Eliminating single-pass cooling offers a significant opportunity for water savings. Single-pass systems use approximately 40 times more water to remove the same heat load than a cooling tower operating at five cycles of concentration.3 Many types of equipment cooled with single-pass water can be replaced with air-cooled systems.
For equipment that requires cooling with water, installing an air-cooled, point-of-use chiller or converting to a recirculating water system that makes use of a process water chiller and/or a cooling tower will eliminate single-pass cooling.
The International Association of Plumbing and Mechanical Officials 2010 Green Plumbing & Mechanical Code Supplement, which establishes requirements for green building and water efficiency applicable to plumbing, prohibits the use of single-pass cooling. The American Society of Heating, Refrigerating, and Air Conditioning Engineers (ASHRAE) Standard for the Design of High-Performance, Green Buildings Except Low-Rise Residential Buildings (ASHRAE Standard 189.1) also prohibits the use of single-pass cooling.
6.2 Single-Pass Cooling
3 U.S. Environmental Protection Agency and U.S. Energy Department, Energy Efficiency & Renewable Energy, Federal Energy Management Program. May 2005. Laboratories for the 21st Century: Best Practices, Water Efficiency Guide for Laboratories. Page 4. www1.eere.energy.gov/femp/program/labs21_bmp.html.

October 2012 6-5
Operation, Maintenance, and User EducationAs a first step, identify all equipment using single-pass cooling and follow these tips to minimize or eliminate this water use:
• Use the minimum flow rate required to cool the system recommended by the manufacturer.
• Install solenoid valves that shut off single-pass cooling water when the equip-ment is turned off.
• Regularly check operation of the water control valve so that cooling water only flows when there is a heat load that needs to be removed.
• Keep coil loops clean to maximize heat exchange.
• If single-pass cooling cannot be eliminated, consult the Section 8: Onsite Alterna-tive Water Sources to identify methods of reusing single-pass cooling water in other applications.
Retrofit OptionsFor maximum savings, eliminate single-pass cooling by modifying equipment to recirculate cooling water. This can be achieved by installing a closed-loop recircula-tion system that will reuse cooling water instead of discharging it. A dedicated air-cooled, point-of-use chiller can be added to most cooling systems to reject heat and allow the cooling water to be reused. Alternatively, at some facilities, the single-pass cooling water can be replaced with water from an existing recirculating chilled water loop or cooling tower water loop, which are mechanical systems used to remove heat from the water.
If single-pass cooling water cannot be eliminated through cooling water recircula-tion, consider installing an automatic control that stops cooling water flow when the equipment is not in use or no heat load is present. This retrofit will not entirely eliminate water use, but it will minimize unnecessary water use.
Replacement OptionsWhen possible, replace single-pass, water-cooled equipment with air-cooled equipment. Air-cooled equipment uses no water for cooling purposes. If considering air-cooled equipment as a replacement, evaluate the potential energy use of the equipment in addition to the water use to ensure that the cost benefit from water savings is not offset by an increase in energy use.
For detailed replacement options for specific equipment using single-pass cooling, refer to the WaterSense at Work sections covering vacuum pumps, X-ray equipment, ice machines, and wok stoves.
6.2 Single-Pass Cooling

6-6 October 2012
Savings PotentialSingle-pass cooling can be eliminated by retrofitting the existing equipment with a recirculating system or replacing with air-cooled equipment.
Potential savings can be estimated by measuring the existing cooling water dis-charge with a gallon bucket and stopwatch and determining how often the cooling water flows (e.g., how many hours per day and days per year). Many applications of single-pass cooling water flow continuously. To estimate facility-specific water sav-ings and payback, use the following information.
Current Water Use
To estimate the current water use of existing equipment cooled with single-pass water, identify the following information and use Equation 6-1:
• Flow rate of the discharge water from the equipment cooled with single-pass water.
• Average daily use time. This will vary by facility and the type of equipment cooled with single-pass water.
• Days of facility operation per year.
Equation 6-1. Single-Pass Cooling Equipment Water Use (gallons per year)
= Single-Pass Cooling Equipment Flow Rate x Daily Use Time x Days of Facility Operation
Where:
• Single-Pass Cooling Equipment Flow Rate (gallons per minute) • Daily Use Time (minutes per day) • Days of Facility Operation (days per year)
Water Savings
Replacing existing equipment cooled with single-pass water with an air-cooled system or retrofitting with a recirculating cooling water system will entirely eliminate discharge water use, as shown in Equation 6-2.
6.2 Single-Pass Cooling

October 2012 6-7
Equation 6-2. Water Savings From Retrofitting or Replacing Single-Pass Cooling Equipment (gallons per year)
= Current Water Use of Single-Pass Cooling Equipment
Where:
• Current Water Use of Single-Pass Cooling Equipment (gallons per year)
Payback
To calculate the simple payback from the water savings associated with replacing ex-isting equipment cooled with single-pass water, consider the equipment and instal-lation cost of the replacement option, the water savings as calculated using Equation 6-2, and the facility-specific cost of water and wastewater.
If single-pass cooling is eliminated by replacing equipment with air-cooled models, facilities might see an increase in energy usage. The increased energy use, depending upon how significant, might increase the payback time and decrease replacement cost-effectiveness.
Additional ResourcesEPA and DOE, Energy Efficiency & Renewable Energy, Federal Energy Management Program. May 2005. Laboratories for the 21st Century: Best Practices, Water Efficiency Guide for Laboratories. www1.eere.energy.gov/femp/program/labs21_bmp.html.
6.2 Single-Pass Cooling

6-8 WaterSense at Work: Best Management Practices for Commercial and Institutional Facilities
OverviewCooling towers are used in a variety of commercial and institutional applications to remove excess heat. They serve facilities of all sizes, such as office buildings, schools, supermarkets, and large facilities, such as hospitals, office complexes, and university campuses. Cooling towers dissipate heat from recirculating water that is used to cool chillers, air conditioning equipment, or other process equipment. By design, they use significant amounts of water.
Cooling towers often represent the largest use of water in institutional and commer-cial applications, comprising 20 to 50 percent or more of a facility’s total water use. However, facilities can save significant amounts of water by optimizing the operation and maintenance of cooling tower systems.4
Cooling towers work by circulating a stream of water through systems that generate heat as they function. To cool the systems, heat is transferred from the systems to the water stream. This warm water is then pumped to the top of the cooling tower, where it is sprayed or dripped through internal fill (i.e., a labyrinth-like packing with a large surface area). Fans pull or push air through the tower in a counterflow, crossflow, or parallel flow to the falling water. As some of the water is evaporated, the heat is removed.5 The remain-ing cooled water is recirculated back through the systems to repeat the process.
The thermal efficiency and longevity of the cooling tower and its associated water loops
depend upon the proper management of water recirculated through the tower. Water leaves a cooling tower system in four ways: evaporation, blowdown or bleed-off, drift, and leaks or overflows.
Evaporation
Evaporation is the primary function of the tower and is the method that transfers heat from the cooling tower system to the environment. The quantity of evaporation is not typically targeted for water-efficiency efforts because it controls the cooling process, although improving the energy efficiency of the systems that use the cool-ing water will reduce the evaporative load on the tower. The rate of evaporation from
6.3 Cooling Towers
4 North Carolina Department of Environment and Natural Resources, et al. May 2009. Water Efficiency Manual for Commercial, Industrial and Institutional Facilities. Page 39. savewaternc.org/bushome.php.
5 Ibid.
Cooling towers

October 2012 6-9
a cooling tower is typically equal to approximately 1 percent of the rate of recirculat-ing water flow for every 10°F in temperature drop that the cooling tower achieves.6
Blowdown or Bleed-Off
When water evaporates from the tower, dissolved solids (e.g., calcium, magnesium, chloride, silica) are left behind. As more water evaporates, the concentration of total dissolved solids (TDS) increases. If the concentration gets too high, the TDS can cause scale to form within the system or can lead to corrosion. The concentration of TDS is controlled by removing (i.e., bleeding or blowing down) a portion of the water that has high TDS concentration and replacing that water with make-up water, which has a lower concentration of TDS. Carefully monitoring and controlling the quantity of blowdown provides the most significant opportunity to conserve water in cooling tower operations. Blowdown can be conducted manually using a batch method, in which blowdown is initiated, and make-up water is fed to the system for a preset time to decrease the concentration of TDS. It can also happen automatically through a control scheme that initiates blowdown and make-up when the TDS concentration reaches a preset point.
Drift
A small quantity of water can be carried from the tower as mist or small droplets known as “drift.” Drift loss is small compared to evaporation and blowdown and is controlled with baffles and drift eliminators. Drift can vary from 0.05 to 0.2 percent of the flow rate through the cooling tower.7 Modern drift eliminators can reduce this loss to less than 0.005 percent, which would be negli-gible.
Leaks or Overflows
Properly operated towers and associated pip-ing should not have leaks or overflows. How-ever, an overflow drain is provided within the tower in case of malfunction and subsequent overflow. Most green codes require overflow alarms.
The water used by the cooling tower is equal to the amount of make-up water that is added to the system. The amount of make-up water needed is dictated by the amount of water that is lost from the cooling tower through evaporation, drift, blowdown, and leakage, as illustrated by Equation 6-3.
6 Schultz Communications. July 1999. A Water Conservation Guide for Commercial, Institutional and Industrial Users. Prepared for the New Mexico Office of the State Engineer. Page 60. www.ose.state.nm.us/wucp_ici.html.
7 Ibid.
6.3 Cooling Towers
Cooling tower

6-10 October 2012
Equation 6-3. Cooling Tower Make-Up Water (gallons)
= Evaporation + Drift + Blowdown + Leaks and Overflows
Where:
• Evaporation (gallons) • Drift (gallons) • Blowdown (gallons) • Leaks and Overflows (gallons)
See Figure 6-2 for an illustration of the water being recirculated, added to, or lost from a cooling tower.
Figure 6-2. Cooling Tower System
A key parameter used to evaluate cooling tower operation is cycles of concentration (sometimes referred to as “cycles” or “concentration ratio”). The concentration ratio is the ratio of the concentration of TDS (i.e., conductivity) in the blowdown water divided by the conductivity of the make-up water. Since TDS enter the system in the make-up water and exit the system in the blowdown water, the cycles of concentra-tion are also approximately equal to the ratio of volume of make-up water to blow-down water. See Equations 6-4 and 6-5.
6.3 Cooling Towers
Cooling Tower
Evaporated Water
Drift Loss
Make-Up WaterSupply
Blowdown
Circulated Cooling Water
Chiller

October 2012 6-11
Equation 6-4. Cooling Tower Cycles of Concentration
= Conductivity of Blowdown Water ÷ Conductivity of Make-Up Water
Where:
• Conductivity of Blowdown Water (parts per million of TDS) • Conductivity of Make-Up Water (parts per million of TDS)
Equation 6-5. Cooling Tower Cycles of Concentration
= Make-Up Water ÷ Blowdown Water
Where:
• Make-Up Water (gallons) • Blowdown Water (gallons)
To use water efficiently in the cooling tower system, the cycles of concentration must be maximized. This is accomplished by minimizing the amount of blowdown re-quired, thus reducing make-up water demand. The degree to which the cycles can be maximized depends on the water chemistry within the cooling tower and the water chemistry of the make-up water supply. As cycles of concentration are increased, the amount of TDS that stays within the system also increases.
Facilities often employ a water treatment vendor to monitor the cooling tower, add chemicals to the system to control scaling and chemical buildup, and maximize the cycles of concentration. Critical water chemistry parameters that require review and control include pH, alkalinity, conductivity, hardness, microbial growth, biocide, and corrosion inhibitor levels.8 Controlling these parameters allows water to be recycled through the system longer, thereby increasing cycles of concentration. Controlling blowdown using an automatic scheme allows a better opportunity to maximize cycles of concentration, as the TDS concentration can be kept at a more constant set point.
Equations 6-4 and 6-5 can also be used to determine if there is a leak, overflow, or excessive drift. Since the equations assume that the water lost to drift and overflow is negligible, if cycles of concentration are calculated using both equations and the results from Equation 6-5 are higher than that from Equation 6-4 by more than 10 percent, the cooling tower might be losing water due to one of these malfunctions.
In addition to carefully controlling blowdown and checking for unexpected losses, facilities can also reduce potable water demand from cooling towers. Water from other equipment within a facility can sometimes be recycled and reused for cooling
6.3 Cooling Towers
8 North Carolina Department of Environment and Natural Resources, et al., op. cit., Page 44.

6-12 October 2012
tower make-up with little or no pre-treatment, including air handler condensate (i.e., water that collects when warm, moist air passes over the cooling coils in air handling units). This reuse is particularly appropriate because the condensate has a low min-eral content and is generated in greatest quantities when cooling tower loads are the highest. For additional sources of water that could be used as cooling tower make-up water, refer to Section 8: Onsite Alternative Water Sources.
Operation, Maintenance, and User EducationFor optimum cooling tower efficiency, there are a number of operations, mainte-nance, and user education strategies to consider, such as maintaining system energy efficiency, monitoring the cooling tower’s water chemistry and flow, choosing a water treatment vendor, maximizing cycles of concentration in the tower, and paying close attention to water chemistry reports.
Maintaining System Energy Efficiency
To maintain the system energy efficiency, consider the following:
• Implement energy-efficiency measures to reduce the heat load to the tower. As the heat load is reduced, cooling tower water use will be commensurately reduced.
• Implement a comprehensive air handler coil maintenance program. Dirty coils can increase the load on the chilled water system used to maintain building tem-peratures. Increased load on the chilled water system will increase the load on the evaporative cooling process, requiring more make-up water for the cooling tower.
• Properly maintain and clean heat exchangers, condensers, and evaporator coils to prevent scale, biological growth, and sediment from building up in the tubes.
• Properly insulate all piping. Insulate chillers and storage tanks, if installed.
• When cooling specific equipment using the cooling tower water loop or chilled water system, use the minimum flow rate required to cool the system recom-mended by the manufacturer. In addition, regularly check operation of the water control valve so that cooling water only flows when there is a heat load that needs to be removed.
Monitoring the Cooling Tower’s Water Chemistry and Flow
Monitor the cooling tower’s water chemistry and flow by considering the following:
• If available, have operations and maintenance personnel read the conductivity meter and the make-up and blowdown flow meters regularly to quickly identify problems and determine when to make adjustments.
• Keep a detailed log of make-up and blowdown quantities, conductivity, and cycles of concentration and monitor trends to spot deterioration in performance.
6.3 Cooling Towers

October 2012 6-13
• Make sure the tower fill valve cuts off cleanly when the tower basin is full to mini-mize wasted water from leaks.
Choosing a Water Treatment Vendor
When considering a water treatment vendor, select one that focuses on water ef-ficiency. Request an estimate of the quantities and costs of treatment chemicals, vol-umes of make-up and blowdown water expected per year, and the expected cycles of concentration that the vendor plans to achieve. Select a vendor that can achieve high cycles of concentration while keeping costs for chemicals low.
Maximizing Cycles of Concentration
In addition, to maximize cycles of concentration, consider the following:
• Calculate and understand the cooling tower’s cycles of concentration. Check the ratio of make-up water to blowdown water. Then check the ratio of conductiv-ity of blowdown water and make-up water. Use a handheld conductivity meter if the tower is not equipped with permanent conductivity meters. These ratios should match the target cycles of concentration. If both ratios are not roughly the same, check the tower for leaks. If the tower is not maintaining target cycles of concentration, check the conductivity controller, the make-up water valve, and the blowdown valve for proper operation.
• Work with the cooling tower water treatment vendor to maximize the cycles of concentration. Many systems operate at two to four cycles of concentration, while six cycles or more might be possible. Increasing cycles from three to six re-duces cooling tower make-up water by 20 percent and cooling tower blowdown by 50 percent.
• Work with the water treatment vendor to add chemicals to the system to control scaling and chemical buildup. Critical water chemistry parameters that require re-view and control include pH, alkalinity, conductivity, hardness, microbial growth, biocide, and corrosion inhibitor levels.
• When increasing cycles of concentration, ensure that discharged water meets allowable water quality standards.
Reading Water Chemistry Reports
The water treatment vendor should produce a report every time he or she evaluates the water chemistry in the cooling tower. When these reports are received, read them to ensure that monitoring characteristics, such as conductivity and cycles of concen-tration, are within the target range. By paying proper attention to the water chemis-try reports, problems within the system can be identified quickly.
6.3 Cooling Towers

6-14 October 2012
Retrofit OptionsTo improve the efficiency of an existing cooling tower, some retrofit options are available, including: installing meters and control systems to help facility managers monitor water use; improving the tower’s water quality to increase cycles of concen-tration; using onsite alternative sources of water to replace potable make-up water; and taking steps to reduce biological growth.
Installing Meters and Control Systems
When installing meters and control systems, consider the following:
• To automatically control blowdown, install a conductivity controller, which can continuously measure the conductivity of the cooling tower water and will initi-ate blowdown only when the conductivity set point is exceeded. Working with the water treatment vendor, determine the maximum cycles of concentration that the cooling tower can sustain, then identify and program the conductivity controller to the associated conductivity set point, typically measured in micro-Siemens per centimeter (µS/cm), necessary to achieve that number of cycles.
• Install automated chemical feed systems on large cooling tower systems (more than 100 tons). The automated feed will monitor conductivity, control blow-down, and add chemicals based on make-up water flow. These systems minimize water and chemical use while protecting against scale, corrosion, and biological growth.
• If not already present, install flow meters on make-up and blowdown lines. Meters can be installed on most cooling towers for less than $1,000.9 Refer to the previous “Operation, Maintenance, and User Education” section for recommenda-tions on how to use the meters once they are installed.
• Consider contacting the water utility to determine if the facility can receive a sanitary sewer charge deduction from the potable water lost to evaporation. If the utility agrees to provide this deduction, calculate the difference between the city-supplied potable make-up water and the blowdown water that is discharged to the sanitary sewer.
Improving Cooling Tower Water Quality
To improve the cooling tower water quality, consider the following:
• To cleanse the cooling tower basin water and help the system operate more effi-ciently, install a rapid sand filter or high-efficiency cartridge filter on a sidestream taken from the cooling tower basin. This system will filter out sediments within the basin water and return it to the cooling tower. This is especially helpful if the cooling tower is subject to dusty conditions.
• Install a water softening system on the make-up water line if hardness (e.g., cal-cium and magnesium) limits the ability to increase cycles of concentration.
6.3 Cooling Towers
9 Ibid.
October 2012 6-15
10 Ibid. Page 42.11 Texas Water Development Board. November 2004. Water Conservation Best Practices Guide. Page 148. www.twdb.state.tx.us/conservation/municipal/plans/.
Using Appropriate Onsite Alternative Water Sources
Use onsite alternative water sources where appropriate and feasible (see Section 8: Onsite Alternative Water Sources for more information). Work with the water treat-ment vendor to ensure that the alternative sources identified are a good match for the cooling tower, considering the water chemistry of the source and water quality needs of the cooling tower.
Reducing Biological Growth
Install covers to block sunlight penetration. Reducing the amount of sunlight on tower surfaces can significantly reduce biological growth such as algae. Controlling algae growth can help increase cycles of concentration and improve water quality in the tower.
Replacement OptionsSince replacing a cooling tower involves significant capital cost, facilities should first implement all efficient operation and maintenance procedures and perform any retrofits available to optimize the current cooling tower’s management scheme. After exhausting all efficient management practices and considering the costs and ben-efits of a new tower, new cooling tower designs and improved materials can provide additional water and energy savings.
Savings PotentialSignificant water savings can be achieved by improving the cooling tower manage-ment approach. A key mechanism to reduce water use is to maximize the cycles of concentration. Table 6-1 shows the percentage of make-up water savings that can be expected by increasing a cooling tower’s cycles of concentration, denoted as the concentration ratio (CR).10 Figure 6-3 further illustrates this point by showing how in-creasing cycles of concentration can decrease water use in a 100-ton cooling tower.11 Each facility should determine the maximum cycles of concentration it can achieve depending upon the quality of the make-up water supply and other facility-specific characteristics.
6.3 Cooling Towers

6-16 October 2012
6.3 Cooling Towers
Table 6-1. Percent of Make-Up Water Saved by Maximizing Cycles of Concentration
New Concentration Ratio (CRf)
2 2.5 3 3.5 4 5 6 7 8 9 10
1.5 33% 44% 50% 53% 56% 58% 60% 61% 62% 63% 64%
2.0 – 17% 25% 30% 33% 38% 40% 42% 43% 44% 45%
2.5 – – 10% 16% 20% 25% 28% 30% 31% 33% 34%
3.0 – – – 7% 11% 17% 20% 22% 24% 25% 26%
3.5 – – – – 5% 11% 14% 17% 18% 20% 21%
4.0 – – – – – 6% 10% 13% 14% 16% 17%
5.0 – – – – – – 4% 7% 9% 10% 11%
6.0 – – – – – – – 3% 5% 6% 7%
Figure 6-3. Cooling Tower Water Usage at Various Cycles of Concentration for a 100-Ton Tower
Additional ResourcesAlliance for Water Efficiency. Introduction to Cooling Towers. www.a4we.org/cooling_tower_intro.aspx.
Cooling Technology Institute. www.cti.org.
DOE, Energy Efficiency & Renewable Energy (EERE), Federal Energy Management Program (FEMP). February 2011. Cooling Towers: Understanding Key Components of Cooling Towers and How to Improve Water Efficiency. www1.eere.energy.gov/femp/program/waterefficiency_bmp10.html#resources.
3,000
3,500
4,000
4,500
5,000
5,500
6,000
6,500
7,000
7,500
1 2 3 4 5
Cycles of Concentration
Gallo
ns p
er D
ay
6 7 8 9
Initi
al C
once
ntra
tion
Ratio
(Cri)

October 2012 6-17
East Bay Municipal Utility District. 2008. WaterSmart Guidebook—A Water-Use Efficiency Plan Review Guide for New Businesses. www.ebmud.com/for-customers/conservation-rebates-and-services/commercial/watersmart-guidebook.
EPA and DOE, EERE, FEMP. May 2005. Laboratories for the 21st Century: Best Practices, Water Efficiency Guide for Laboratories. www1.eere.energy.gov/femp/program/labs21_bmp.html.
North Carolina Department of Environment and Natural Resources, et al. May 2009. Water Efficiency Manual for Commercial, Industrial and Institutional Facilities. Pages 39-48. savewaternc.org/bushome.php.
Schultz Communications. July 1999. A Water Conservation Guide for Commercial, Institutional and Industrial Users. Prepared for the New Mexico Office of the State Engineer. Pages 60-65. www.ose.state.nm.us/wucp_ici.html.
Texas Water Development Board. November 2004. Water Conservation Best Practices Guide. Pages 145-149. www.twdb.state.tx.us/conservation/municipal/plans/.
6.3 Cooling Towers

6-18 WaterSense at Work: Best Management Practices for Commercial and Institutional Facilities
OverviewChilled water systems remove heat by passing recirculated cold water through equip-ment. They are often used in place of single-pass cooling because the water is recir-culated, rather than being discharged, to the drain. Chilled water systems are often used to cool air passing through air handling units, but they can also be used to cool a number of systems, including:
• Air compressors • Air conditioners • Hydraulic equipment • CAT scanners • Degreasers • Welding machines • Vacuum pumps • X-ray equipment • Ice machines
Water can be used to transfer heat loads within a chilled water system in two ways, as illustrated in Figure 6-4. First, water can be recirculated as a heat transfer fluid be-tween the chiller and the equipment to be cooled. This water is contained in a closed loop, and no water is gained or lost when the system is operating properly. Second, the chiller, or refrigeration unit, might use water or air to remove heat from the refrig-eration condenser. These types of chillers are referred to as water-cooled or air-cooled units.
A chiller’s cooling capacity is measured in tons of refrigeration, a metric used to repre-sent the amount of heat that can be extracted by the system in a 24-hour period. Small systems (i.e., 40 to 50 tons of refrigeration and below) are often designed as air-cooled systems because they are less expensive, although the energy consump-tion of air-cooled systems is usually significantly higher, especially as the systems approach 500 tons. In addition, the space required for air-cooled systems greater than 500 tons becomes impractical in many applications. Since air-cooled systems are used in limited applications and use air instead of water as the cooling mechanism, they are not the focus of this section.12
Water-cooled units tend to be more energy-efficient than air-cooled units, particu-larly in larger facility applications.13
As shown in Figure 6-4, there are four main stages of operation in a water-cooled chilled water system:
• First, chilled water at a temperature between 38° and 45°F is pumped through heat exchange units to transfer heat from equipment. By removing heat, the chilled water temperature typically rises 10° to 20°F.
6.4 Chilled Water Systems
12 Koeller and Company and Riesenberger, James. January 2006. A Report on Potential Best Management Practices—Commercial-Industrial Cooling Water Efficiency. Prepared for the California Urban Water Conservation Council. Page A-5. www.cuwcc.org/products/pbmp-reports.aspx.
13 Ibid.

October 2012 6-19
• The water that has absorbed heat is sent to the chiller to re-cool. Inside the chiller, an evaporator with refrigerant inside removes heat from the chilled water loop. As the refrigerant absorbs the excess heat, it expands and becomes a gas.
• The refrigerant gas is then sent to a compressor prior to passing through a con-denser, where heat is removed by the condenser water loop and the refrigerant gas returns to the liquid phase. Condenser water is typically between 80° and 85°F when it is sent through the chiller condenser and rises in temperature 10° to 20°F after it has removed the heat from the refrigerant.14
• In the final stage, the condenser water is re-cooled in a cooling tower.
Figure 6-4. Water-Cooled Chilled Water System
In water-cooled chilled water systems, the condenser water is typically recirculated to give off heat through evaporation. Cooling by evaporation can occur in either an open cooling tower, where the condenser water is open to the atmosphere, or in a closed-loop evaporative cooler, where the condenser water is not open to the atmosphere. Both cooling towers and evaporative coolers are installed outdoors to mechanically circulate air used to cool condenser water. Refer to Section 6.3: Cooling Towers for more information on cooling towers.
Alternatively, single-pass cooling systems can be used, which rely on a source of freshwater supply for condenser cooling water, which is ultimately discharged. In small systems, the discharge might be to the sewer, but in large systems, it might be discharged to a local body of water depending upon the discharge permit. Single-pass cooling systems should be avoided if the water goes to the sewer after it is used.
14 Ibid. Page A-2.
(Cold Water Out)(Hot Water In)Condenser
WaterSupply
Refrigerant
(Cold Water In)(Hot Water Out)
(Chilled Water Out)(Warm Water In) ChilledWaterSupply(Chilled Water In)(Warm Water Out)
Cooling Tower
Condenser
Chiller
Evaporator
Heat ExchangeUnit
6.4 Chilled Water Systems

6-20 October 2012
There are several main components of a chilled water system: chillers, pumps, heat exchangers, piping, and valves. The systems used to cool condenser water (e.g., a cooling tower) are auxiliary to the chilled water system.
Chillers are central to the chilled water system design. Chillers contain a refrigerant used to remove heat from the chilled water loop and a compressor to compress the refrigerant. Proper sizing of chillers is determined by evaluating the peak load and cooling load profile of the facility or process. Improper sizing of chillers can lead to undersized units that are unable to cool equipment or oversized units that do not operate efficiently.
Some facilities might require multiple chillers or cooling towers to meet equipment cooling needs. In the case of multiple chillers or cooling towers, there might be several options for the way in which the system is staged. For example, if multiple cooling towers are installed, they could be plumbed in parallel to allow for condenser water to pass through multiple cooling towers.
The efficiency of a chilled water system is dictated by its net useful refrigerating effect, or its ability to remove heat, compared to the energy supplied to do so. A sys-tem that removes more heat per unit of supplied energy is considered more efficient than a comparable system.
There are no federal standards for the efficiency of a chilled water system; however, the American Society of Heating, Refrigerating, and Air Conditioning Engineers (ASHRAE) ASHRAE 90.1-2007 Energy Standard for Buildings Except Low-Rise Residen-tial Buildings has minimum required efficiencies for water chillers and is specified in several local and state building codes.15
Operation, Maintenance, and User EducationBecause chilled water systems are complex systems, the efficiency of the system as a whole is dependent upon the combined performance of each individual component. Considering the interaction between components helps ensure optimum energy and water savings from efficient operation and maintenance measures.16
Prior to implementing any operation and maintenance efficiency measures, the potential energy savings should be evaluated using the University of Massachusetts Amherst Center for Energy Efficiency & Renewable Energy’s Chilled Water Systems Analysis Tool.17,18 The tool was developed for facility personnel to evaluate potential changes to existing chilled water systems and can be used to calculate the potential energy-saving—and inherently water-saving—opportunities that exist from the measures listed below. The maximum water efficiency can be reached by reducing energy use, since it reduces the overall cooling load on the system.
15 American Society of Heating, Refrigerating, and Air Conditioning Engineers (ASHRAE). 2007. ASHRAE 90.1-2007 Energy Standard for Buildings Except Low-Rise Residential Buildings.
16 U.S. Environmental Protection Agency (EPA) and U.S. Energy Department’s (DOE’s) ENERGY STAR. Building Upgrade Manual, Chapter 9: Heating and Cooling Up-grades. www.energystar.gov/index.cfm?c=business.bus_upgrade_manual.
17 University of Massachusetts Amherst, Center for Energy Efficiency & Renewable Energy (CEERE), Industrial Assessment Center (IAC). Chilled Water Systems Analy-sis Tool (CWSAT). www.ceere.org/iac/iac_assess_tools.html.
18 DOE, Energy Efficiency & Renewable Energy (EERE). October 2005. Improving Chilled Water System Performance: Chilled Water System Analysis Tool (CWSAT) Im-proves Efficiency. www1.eere.energy.gov/manufacturing/tech_deployment/pdfs/chiller_tool.pdf.
6.4 Chilled Water Systems

October 2012 6-21
Optimizing Chiller Efficiency
To optimize chiller efficiency, consider the following:
• Use controls to monitor the capacity of the chiller and turn chillers on or off as necessary, depending upon the cooling demand of equipment connected to each chiller.
• The smaller the temperature difference between the chilled water and condenser water loop, the higher the chiller efficiency. Therefore, raising the chilled water temperature and lowering the condenser water temperature will improve ef-ficiency. Such temperature adjustments can only be made within the constraints of outside conditions. The chilled water temperature will be constrained by the cooling load. A condenser water return temperature 5° to 7°F above the ambient wet bulb temperature is optimal.19
• Apply variable speed control to circulation pump motors.20
• Inspect chillers regularly to remove any scale buildup, which can decrease the heat-transfer efficiency of the chiller.
Reducing Demand on Chilled Water System
WaterSense at Work includes a number of best management practices for technolo-gies that might be connected to the chilled water loop. Optimizing these products or systems can reduce the load on the chilled water system, which will, in turn, reduce the load on the cooling tower.
Optimize Cooling Tower Efficiency
To optimize cooling tower efficiency, consider the following:
• Refer to Section 6.3: Cooling Towers to ensure that the cooling tower is operating most efficiently in order to deliver cooled condenser water to the chilled water system.
• If the facility has multiple cooling towers that are plumbed in parallel, run con-denser water over as many cooling towers as possible at the lowest possible fan speed.21
Retrofit OptionsWith proper preventative maintenance, chilled water systems have a typical life-time of 20 years or longer. Therefore, it is often practical to retrofit individual system components, rather than the whole system. However, the functioning of the overall system should still be considered. The effect of an individual component retrofit on
19 Pacific Gas and Electric Company. January 2006. High Performance Data Centers: A Design Guidelines Sourcebook. hightech.lbl.gov/datacenters-bpg.html.20 University of Massachusetts Amherst, CEERE, IAC, op. cit.21 EPA and DOE’s ENERGY STAR, op. cit.
6.4 Chilled Water Systems

6-22 October 2012
22 University of Massachusetts Amherst, CEERE, IAC, op. cit. 23 DOE, EERE, op. cit.24 Energy Design Resources. December 2009. Chilled Water Plant Design Guide. www.energydesignresources.com/resources/publications/design-guidelines/design-
guidelines-cooltools-chilled-water-plant.aspx. 25 EPA and DOE’s ENERGY STAR, op. cit.
other system component performance should be evaluated prior to performing the retrofit. By using University of Massachusetts Amherst Center for Energy Efficiency & Renewable Energy’s Chilled Water Systems Analysis Tool,22,23 facility managers can evaluate which of the following retrofit options are the best.
Water-Related Retrofits
For retrofit options that involve water reduction, consider the following:
• Install a make-up water meter on the chilled water loop, which will allow for leaks to be easily identified.
• Insulate the pipes on the chilled water loop to ensure that the chilled water does not absorb unnecessary heat, therefore requiring more water to cool.
Energy-Related Retrofits
In addition retrofit opportunities to increase the water efficiency of a chilled water sys-tem are in many cases directly related to reducing energy use by reducing the overall cooling load on the system. Consider the following energy-related retrofits in addition to the retrofit options discussed in University of Massachusetts Amherst’s Chilled Water Systems Analysis Tool. For additional information on increasing the energy efficiency of existing chilled water systems, review Energy Design Resources’ Chilled Water Plant Design Guide24 and the U.S. Environmental Protection Agency (EPA) and U.S. Energy Department’s (DOE’s) ENERGY STAR® Building Upgrade Manual.25
Replacing Pump Valves
• Standard valves can be replaced with low-friction valves to reduce flow resis-tance in the chilled water loop, thereby reducing pump energy use.
• For valves that control flow by inducing a pressure drop, consider removing the valves or eliminating their use by keeping the valve open. These types of valves can be replaced by using variable-speed controls, trimming the impeller, or stag-ing pumps instead.
Replacing Pumps
• Standard or oversized pumps can be replaced with more efficient pumps. Pumps typically reach peak efficiency when they are approximately 75 percent loaded, but they are less effective if they are fully or under loaded.
6.4 Chilled Water Systems

October 2012 6-23
26 Conservation Mechanical Systems, Inc. Water Use in Cooling Towers. www.conservationmechsys.com/wp-content/siteimages/Water%20use%20in%20Cool-ing%20Towers.pdf.
Replacement OptionsReplacing a chilled water system involves significant capital cost and involves many design considerations. Before replacing an existing chilled water system, first consid-er implementing efficient operation and maintenance and procedures and perform-ing any retrofits available to optimize the current chilled water system. After con-sidering the costs and benefits of installing a new chilled water system, if the facility plans to do so, the design process should take into account all system components. Facility managers and design professionals should consult design guides for efficient chilled water systems.
Because chillers are central to chilled water system design, replacing an existing chill-er might allow for efficiency improvements. If the existing chiller is inefficient, and the potential energy and cost savings merit a replacement, both water and energy efficiency should be considered as part of the planned design. Water-cooled systems are typically the most efficient option for larger facilities with cooling towers. Alter-nate technologies, such as ground source heat pumps, can also be more energy- and water-efficient than traditional chiller and cooling tower technology. Choose a sys-tem that will operate most efficiently under typical load conditions. For most cooling loads less than 100 tons, air cooling is just as cost-effective as a water-cooled system. An analysis of the total cost of cooling with air versus cooling towers should include the cost of the water, wastewater, water treatment to prevent scale and corrosion, and labor needed to operate a cooling tower versus the 0.2 to 0.3 kilowatt-hour/ton-hour savings realized with chilled water/cooling tower/chiller systems.
Savings PotentialChilled water systems are completely closed loops and thus consume no water when operating properly with no leaking components. However, if cooling towers are used to operate the refrigeration loop, the tower requires approximately 2.0 gallons per hour of evaporation for each ton of cooling.26 By improving the efficiency of the chilled water system, the heat load on the cooling tower can be reduced, thereby reducing the evaporative cooling load and the water use of the system as a whole.
Additional ResourcesDOE, Energy Efficiency & Renewable Energy. October 2005. Improving Chilled Water System Performance: Chilled Water Systems Analysis Tools (CWSAT) Improves Efficiency. www1.eere.energy.gov/manufacturing/tech_deployment/pdfs/chiller_tool.pdf.
Energy Design Resources. December 2009. Chilled Water Plant Design Guide. www.energydesignresources.com/resources/publications/design-guidelines/design-guidelines-cooltools-chilled-water-plant.aspx.
EPA and DOE’s ENERGY STAR. Building Upgrade Manual, Chapter 9: Heating and Cooling Upgrades. www.energystar.gov/index.cfm?c=business.bus_upgrade_manual.
6.4 Chilled Water Systems

6-24 October 2012
Koeller and Company and Riesenberger, James. January 2006. A Report on Potential Best Management Practices—Commercial-Industrial Cooling Water Efficiency. Prepared for The California Urban Water Conservation Council. Page A-2. www.cuwcc.org/products/pbmp-reports.aspx.
Pacific Gas and Electric Company. January 2006. High Performance Data Centers: A Design Guidelines Sourcebook. hightech.lbl.gov/datacenters-bpg.html.
University of Massachusetts Amherst, Center for Energy Efficiency & Renewable En-ergy, Industrial Assessment Center. Chilled Water Systems Analysis Tool. www.ceere.org/iac/iac_assess_tools.html.
6.4 Chilled Water Systems

WaterSense at Work: Best Management Practices for Commercial and Institutional Facilities 6-25
OverviewBoiler and steam systems are used in large building heating systems for heating water or to produce steam for industrial processes, cooking, or other operations. Hot water boilers are a subset of commercial and industrial boilers used to heat water. Steam boilers, which include water-tube and fire-tube systems, produce steam by boiling water. Low-pressure boilers are used most for commercial applications and heating water, while high-pressure boilers are more common for power generation and industrial processes.27
Hot Water Boilers
Hot water boilers are used to provide hot water for bathing, laundry, dishwashing, or similar operations. Unlike steam boilers, however, they do not produce steam. Instead, hot water boilers essentially act as commercial- or industrial-scale water heaters.28
Hot water boiler distribution systems can be open or closed. Open systems provide hot water to end uses, such as hand washing, bathing, and laundry. These can either be direct-supply systems or have loop piping, whereby the hot water is recirculated back to the hot water boiler. Open systems are typically found in food service or laun-dry operations. Recirculating systems are most commonly used in applications that need hot water instantaneously, such as hotels.
Closed systems are often used for heating buildings. Hot water is circulated in a closed loop for space heating, using either air heat-exchange or hydronic floor-heat-ing systems. Water in closed-loop systems is typically treated to prevent corrosion and scaling. Additional water is needed only to make up for leaks and periodic addi-tions.29 Because water efficiency isn’t a primary concern for hot water boiler systems, they are not discussed further in this section.
Water-Tube Boilers
Water-tube boilers (see Figure 6-5) are used for high-pressure boiler applications. In these systems, water circulates through tubes that are indirectly heated by fire. Exhaust gases remain inside the boiler shell and pass over tube surfaces to heat the water. The heated water then rises as steam to be used for cooking, as process steam, or for other operations. Water-tube boilers are lighter by design and thus able to withstand higher pressures. They are also capable of high efficiencies and generating saturated or superheated steam.
6.5 Boiler and Steam Systems
27 East Bay Municipal Utility District (EBMUD). 2008. WaterSmart Guidebook—A Water-Use Efficiency Plan Review Guide for New Businesses. Pages THERM10-14. www.ebmud.com/for-customers/conservation-rebates-and-services/commercial/watersmart-guidebook.
28 Ibid.29 Ibid.

6-26 October 2012
6.5 Boiler and Steam Systems
30 Ibid.
Figure 6-5. Water-Tube Steam Boiler Configuration
Fire-Tube Boilers
The most common type of steam boiler is the fire-tube boiler (see Figure 6-6).30 In this type of system, a gas- or oil-fired heater directs heat onto a series of tubes that are immersed in water, which transfers heat to the water, generating steam.
Figure 6-6. Fire-Tube Steam Boiler Configuration
Smoke Stack
Steam Generated
Water Pipes Water Supply
Steam Generated
Furnace
Steam GeneratedSmoke Stack
Smoke
Water Heated by Hot Pipes
Hot Metal Pipes
Furnace

October 2012 6-27
6.5 Boiler and Steam Systems
In both types of steam boiler configurations, as the steam is distributed, its heat is transferred to the ambient environment and, as a result, it recondenses to water. This condensate is then either discharged to the sewer or captured and returned to the boiler for reuse. If the condensate is discharged to the sanitary sewer, most codes require it to be cooled to an acceptable temperature before discharging. The hot condensate is typically tempered with cool water to meet the temperature discharge requirements.
As the water is converted to steam, dissolved solids, such as calcium, magnesium, chloride, and silica, are left behind. With evaporation, the total dissolved solids (TDS) concentration increases. If the concentration gets too high, the TDS can cause scale to form within the system or can lead to corrosion. The concentration of TDS is controlled by removing (i.e., blowing down) a portion of the water that has a high concentration of TDS and replacing that water with make-up water, which has a lower concentration of TDS. Some boiler operators practice continuous blowdown by leaving the blowdown valve partially open, requiring a continuous feed of make-up water.
From a water-efficiency standpoint, installing and maintaining a condensate recov-ery system to capture and return condensate to the boiler for reuse is the most effec-tive way to reduce water use. Recovering condensate:
• Reduces the amount of make-up water required.
• Eliminates or significantly reduces the need to add tempering water to cool con-densate before discharge.
• Reduces the frequency of blowdown, as the condensate is highly pure and adds little to no additional TDS to the boiler water.
In addition, since the steam condensate is relatively hot, when it is added back to the boiler, it requires less energy to reheat to produce steam again.
Proper control of boiler blowdown water is also critical to ensure efficient boiler op-eration and minimize make-up water use. Insufficient blowdown can lead to scaling and corrosion, while excessive blowdown wastes water, energy, and chemicals. The optimum blowdown rate is influenced by several factors, including boiler type, oper-ating pressure, water treatment, and quality of make-up water. Generally, blowdown rates range from 4 to 8 percent of the make-up water flow rate, although they can be as high as 10 percent if the make-up water is poor quality with high concentrations of solids.31,32
Blowdown is typically assessed and controlled by measuring the conductivity of the boiler make-up water compared to that in the boiler blowdown water. Conductivity provides an indication of the overall TDS concentration in the boiler. The blowdown percentage can be calculated as indicated in Equation 6-6. The boiler water quality is
31 U.S. Energy Department (DOE), Energy Efficiency & Renewable Energy (EERE). January 2012. Minimize Boiler Blowdown. www1.eere.energy.gov/industry/bestprac-tices/pdfs/steam9_blowdown.pdf.
32 DOE, EERE. January 2012. Return Condensate to Boiler. www1.eere.energy.gov/manufacturing/tech_deployment/pdfs/steam8_boiler.pdf.

6-28 October 2012
6.5 Boiler and Steam Systems
often expressed in terms of cycles of concentration, which is the inverse of the blow-down percentage.33
Equation 6-6. Boiler or Steam System Blowdown Percentage (percent)
= Conductivity of Make-Up Water ÷ Conductivity of Blowdown
Where:
• Conductivity of Make-Up Water (milligrams per liter of TDS) • Conductivity of Blowdown (milligrams per liter of TDS)
Controlling the blowdown percentage and maximizing the cycles of concentration will reduce make-up water use; however, this can only be done within the constraints of the make-up and boiler water chemistry. As the TDS concentration in the blow-down water increases, scaling and corrosion problems can occur, unless carefully controlled.
The amount of make-up water required is a key driver of the overall water use of the boiler. Make-up water quantity is dictated by the amount of water that is lost from the system, particularly steam condensate that is discharged and not returned to the boiler, and the amount of blow down, as illustrated in Equation 6-7.
Equation 6-7. Boiler or Steam System Make-Up Water (gallons)
= Condensate Loss + Blowdown
Where:
• Condensate Loss (gallons) • Blowdown (gallons)
By recovering steam condensate and carefully controlling the amount and frequency of blowdown, boiler water and energy use can be significantly reduced.
Operation, Maintenance, and User EducationThere are a number of ways to improve water efficiency of boiler and steam systems by changing operation, maintenance, and user education techniques. Best manage-ment practices include: maintaining boilers, steam lines, and steam traps; choosing a water treatment vendor that focuses on water efficiency; reading meters and water chemistry reports to closely monitor water use; minimizing blowdown; and improv-ing make-up water quality to increase cycles of concentration.
33 North Carolina Department of Environment and Natural Resources, et al. May 2009. Water Efficiency Manual for Commercial, Industrial and Institutional Facilities. Pages 49-52. savewaternc.org/bushome.php.

October 2012 6-29
6.5 Boiler and Steam Systems
Maintaining Boilers, Steam Lines, and Steam Traps
When maintaining boilers, steam lines, and steam traps, consider the following:
• Regularly check steam and hot water lines for leaks and make repairs promptly.
• Regularly clean and inspect boiler water and fire tubes.
• Develop and implement an annual boiler tune-up program.
• Provide proper insulation on piping and the central storage tank to conserve heat.
• Implement a steam trap inspection program for boiler systems with condensate recovery. When steam traps exceed condensate temperature, this inspection can reveal whether the trap is leaking condensation. Monitor temperature using an infrared temperature device.34 Repair leaking traps as soon as possible.35
Choosing a Water Treatment Vendor
When choosing a water treatment vendor, select one that focuses on water ef-ficiency. Request an estimate of the quantities and costs of treatment chemicals, volumes of make-up and blowdown water expected per year. Choose a vendor that can minimize water use, chemical use, and cost, while maintaining appropriate water chemistry for efficient scale and corrosion control.
Reading Meters and Water Chemistry Reports
When reading meters and water chemistry reports, consider the following:
• If available, have operations and maintenance personnel read the make-up and condensate return flow meters regularly to quickly identify leaks or other prob-lems.
• Ensure the water treatment vendor produces a report every time he or she evalu-ates the water chemistry in the boiler. When these reports are received, read them to ensure that monitoring characteristics, such as conductivity and cycles of concentration, are within the target range. By paying proper attention to the water chemistry reports, problems within the system can be identified quickly.
Minimizing Blowdown
To minimize blowdown, consider the following:
• Calculate and understand the boiler’s cycles of concentration. Check the ratio of conductivity of blowdown water to the make-up water. Use a handheld conduc-tivity meter if the boiler is not equipped with permanent conductivity meters. This ratio should match the target cycles of concentration.
34 Ibid.35 DOE, EERE, Federal Energy Management Program. July 1999. Steam Trap Performance Assessment: Advanced technologies for evaluating the performance of steam
traps. www1.eere.energy.gov/femp/pdfs/FTA_SteamTrap.pdf.
6-30 October 2012
6.5 Boiler and Steam Systems
36 EBMUD, op. cit.
• Work with the water treatment vendor to prevent scaling and corrosion and opti-mize cycles of concentration.
Improving Make-up Water Quality
To improve make-up water quality, consider the following:
• Consider pre-treating boiler make-up water to remove impurities, which can in-crease the cycles of concentration the boiler can achieve. Water softeners, reverse osmosis systems, or demineralization are potential pre-treatment technology options. Refer to Section 7.2: Water Purification for more information.
• When increasing cycles of concentration, ensure that discharged water meets allowable water quality standards.
Retrofit OptionsTo improve the efficiency of an existing boiler and steam system, consider retrofit-ting the system by recovering steam condensate and installing meters and control systems to monitor water use.
Recovering Steam Condensate
When recovering steam condensate, consider the following:
• Install and maintain a condensate recovery system to return condensate to the boiler for reuse.
• Where condensate cannot be returned to the boiler and must be discharged to the sanitary sewer, employ an expansion tank to temper hot condensate rather than adding water to cool it.
Installing Meters and Control Systems
When installing meters and control systems, consider the following:
• Install an automatic blowdown control system, particularly on boilers that are more than 200 horsepower, to control the amount and frequency of blowdown rather than relying on continuous blowdown.36 Control systems with a conduc-tivity controller will initiate blowdown only when the TDS concentrations in the boiler have built up to a certain concentration.
• If not already present, install flow meters on the make-up water line and the con-densate return line to monitor the amount of make-up water added to the boiler. Refer to the previous “Operation, Maintenance, and User Education” section for recommendations on how to use the meter once it is installed.

October 2012 6-31
6.5 Boiler and Steam Systems
• Install automated chemical feed systems to monitor conductivity, control blow-down, and add chemicals based on make-up water flow. These systems minimize water and chemical use while protecting against scale buildup and corrosion.
Replacement OptionsBecause replacing a boiler involves significant capital costs, first implement efficient operations and maintenance procedures and perform any retrofits available to opti-mize the current boiler’s management scheme. After exhausting all efficient manage-ment practices, consider the costs and benefits of boiler replacement.
Boiler replacement options will vary depending upon the size of the facility and existing equipment. Conduct an energy audit to help reduce heating loads; ensure the boiler system is appropriately sized; and identify whether it is possible to reduce the boiler size. When looking to replace an existing boiler, consider installing a small summer boiler, distributed system, or heat-capture system for reheating or dehumid-ification requirements. Also, consider alternative technologies such as heat pumps.
Savings PotentialSignificant water savings can be achieved by improving the boiler system manage-ment scheme. A key mechanism to reduce water use is to maximize the cycles of con-centration. Installing an automatic blowdown control system is one way to minimize blowdown and maximize cycles of concentration. Switching to an automatic control system can reduce a boiler’s energy use by 2 to 5 percent and reduce blowdown by as much as 20 percent.
Additional ResourcesAmerican Society of Mechanical Engineers. 1994. Consensus Operating Practices for Control of Feedwater/Boiler Water Chemistry in Modern Industrial Boilers.
Council of Industrial Boiler Owners (CIBO). November 1997. CIBO Energy Efficiency Handbook. www.cibo.org/pubs/steamhandbook.pdf.
DOE, Energy Efficiency & Renewable Energy. January 2012. Minimize Boiler Blowdown. www1.eere.energy.gov/industry/bestpractices/pdfs/steam9_blowdown.pdf.
DOE, Energy Efficiency & Renewable Energy. January 2012. Return Condensate to Boiler. www1.eere.energy.gov/industry/bestpractices/pdfs/steam8_boiler.pdf.
DOE, Energy Efficiency & Renewable Energy, Federal Energy Management Program. July 1999. Steam Trap Performance Assessment: Advanced technologies for evaluating the performance of steam traps. www1.eere.energy.gov/femp/pdfs/FTA_SteamTrap.pdf.

6-32 October 2012
East Bay Municipal Utility District. 2008. WaterSmart Guidebook—A Water-Use Effi-ciency Plan Review Guide for New Businesses. www.ebmud.com/for-customers/conser-vation-rebates-and-services/commercial/watersmart-guidebook.
North Carolina Department of Environment and Natural Resources, et al. May 2009. Water Efficiency Manual for Commercial, Industrial and Institutional Facilities. Pages 49-52. savewaternc.org/bushome.php.
Schultz Communications. July 1999. A Water Conservation Guide for Commercial, Insti-tutional and Industrial Users. Prepared for the New Mexico Office of the State Engi-neer. Page 68. www.ose.state.nm.us/wucp_ici.html.
6.5 Boiler and Steam Systems

Laboratory and Medical Equipment
Table of Contents7.1 Introduction to Laboratory
and Medical Equipment ..................................... 7-2
7.2 Water Purification .................................................. 7-4
7.3 Vacuum Pumps ....................................................7-10
7.4 Steam Sterilizers ..................................................7-16
7.5 Glassware Washers ..............................................7-24
7.6 Fume Hood Filtration and Wash-Down Systems..........................................7-27
7.7 Vivarium Washing and Watering Systems ................................................7-33
7.8 Photographic and X-Ray Equipment............7-38

7-2 WaterSense at Work: Best Management Practices for Commercial and Institutional Facilities
7.1 Introduction to Laboratory and Medical Equipment
From dental and doctor’s offices to large general hospitals, veterinary clinics, and research laboratories, medical and laboratory facilities have special operations and equipment. These systems can consume a significant amount of water through water purification, sterilization, photographic and X-ray processes, and vacuum systems. As shown in Figure 7-1, equipment such as steam sterilizers and reverse osmosis systems can account for 5 percent of a laboratory’s total water use.1 Hospitals can attribute more than 15 percent of their total water use to laboratory and medical equipment, including steam sterilizers and X-ray processing equipment, as shown in Figure 7-2.2
Figure 7-1. Laboratory Water Consumption
Figure 7-2. Hospital Water Consumption
1 U.S. Environmental Protection Agency. Laboratory Water Use vs. Office Water Use. www.epa.gov/oaintrnt/water/lab_vs_office.htm.2 East Bay Municipal Utility District (EBMUD). June 25, 2003. “EBMUD Hospital Water Efficiency: Water Conservation Division.” Page 5. www.cuwcc.org/WorkArea/
downloadasset.aspx?id=2230.
Cooling Tower42%
Sanitary12%
LaboratoryProcess
25%
Other BuildingHeating and Cooling
5%
Reverse OsmosisSystem
2% Boiler2%
SteamSterilizer
3%
Irrigation4%
Single-PassCooling
5%
Sanitary40%
Leaks8%
Laundry10%
Kitchen8%
X-RayProcessing
6%
Irrigation5%
SteamSterilizers
10%Building Heating
and Cooling13%

October 2012 7-3
7.1 Introduction to Laboratory and Medical Equipment
Many older pieces of medical and laboratory equipment use single-pass cooling continuously for the purpose of keeping equipment cool or for tempering hot water before it is discharged to the sewer. Newer technologies and better practices are available that can significantly reduce this water use. For example, retrofitting a steam sterilizer with a thermostatically actuated valve can reduce tempering water needed to cool hot steam condensate before discharge by up to 90 percent. Vacuum pump recirculation systems can save 50 to 80 percent of the water used to cool the vacuum. For traditional photographic and X-ray equipment, recycling and reusing the final rinse effluent as make-up for the developer or fixer solution can save 50 per-cent or more of the water required to process film. Converting to digital equipment can eliminate this water use entirely.
One consideration to note is that laboratories and medical facilities might face unique challenges because of the high quality of the water required for their equip-ment. Most of these facilities require the use of potable water at a minimum and more highly treated water in many cases. Water is frequently used to disinfect parts of these facilities as well. The need to maintain high-quality standards can preclude the use of certain technologies and alternative sources of water, as described in other sections within this document. For example, laboratories often require purified or de-ionized water to perform tests and experiments. Medical facilities also must maintain high standards for health and safety. These standards can limit the types of technolo-gies that can be utilized in these types of facilities. Water efficiency alone will not be a driver in the choice of technologies or processes in these facilities. Rather, it should be a consideration after other requirements have been met.
Section 7: Laboratory and Medical Equipment of WaterSense at Work provides an over-view of and guidance for effectively reducing the water use of:
• Water purification • Vacuum pumps • Steam sterilizers • Glassware washers • Fume hood filtration and wash-down systems • Vivarium washing and watering systems • Photographic and X-ray equipment
Laboratory and Medical Equipment Case Study
To learn how Providence St. Peter Hospital in Olym-pia, Washington, saved 31 million gallons of water by installing water-efficient laboratory and medical equipment and implementing many additional best management practices described in Water-Sense at Work, read the case study in Appendix A.

7-4 WaterSense at Work: Best Management Practices for Commercial and Institutional Facilities
7.2 Water Purification
OverviewWater purification systems are used in laboratory and medical applications requir-ing high-quality water that is free of minerals and organic contaminants. Generally, these systems purify water through physical or chemical means. Many water puri-fication systems use additional water during a backwash phase to remove particle buildup on the purification media, or discharge a reject stream containing concen-
trated contaminants. Typically, as finer particles are removed, the purification process becomes more water- and energy-intensive. Therefore, it is important to evaluate the level of water quality required to ensure that the system does not deliver a higher level of purification than is needed. Systems that deliver a higher wa-ter quality than the facility needs will often be more expensive to operate than a more appropriate system and can result in wasted water and energy.
There are several technical standards for water quality that facili-ties can use to evaluate the appropriate water purification method, including ASTM International ASTM D1193 Standard Specification for Reagent Water and the International Organization for Standard-ization (ISO) ISO 3696 Water for Analytical Laboratory Use—Specifi-cation and Test Methods. These standards generally classify water quality into specific types based on the quality required.3
When determining the level of treatment needed to supply water of a specific qual-ity, there are a number of water purification technologies used in lab and medical facilities that can be considered. These include: microporous filtration, carbon filtra-tion, deionization, distillation, membrane processes, and water softening. Because no single water purification system is able to remove 100 percent of all contaminants, it is common for multiple water purification technologies to be installed in sequence where only a low level of contaminants can be tolerated.
Microporous Filtration
Microporous filtration physically removes solid contaminants by capturing them on the surface of the media. Microporous filtration typically occurs at low pressures and does not remove any dissolved solids.4 After a period of use, filters will require back-washing with water to remove contaminants trapped on the media surface.
Carbon Filtration
Carbon filtration uses adsorption to attract particles as water passes through the filter. The adsorption process depends upon the physical characteristics of the activated carbon; the chemical compositions of the carbon and the contaminants;
3 Millipore. Overview of Lab Water Grades. www.millipore.com/lab_water/clw4/tutorial&tabno=4.4 Messinger, Stephen. September 2006. “What Makes Water Taste Best?” Water Conditioning & Purification Magazine. www.wcponline.com/TOC.cfm?ISN=110.
Water purification system in a laboratory

October 2012 7-5
7.2 Water Purification
the temperature and pH of the water; and the amount of time the contamin ant is exposed to the activated carbon.5 Carbon filters can use either disposable cartridges or packed columns. Disposable cartridges are disposed of once the adsorptive capac-ity is exhausted. Alternatively, packed columns can be removed and regenerated off site.6 Water use is required to regenerate the columns; however, since regeneration is typically done off site, no water is used at the facility level.
Deionization
Deionization is a physical process similar to water softening that exchanges cations and anions present in the untreated water with hydrogen and hydroxide ions. Deion-ization is not effective at removing particulates, but because the process is relatively fast, it is commonly used in laboratory applications requiring a low level of water purification. Regeneration of deionization resins often occurs off site.7 Water use is required to regenerate the resin; however, since the regeneration is done off site, no water is used at the facility level.
Distillation
Distillation functions by boiling water to form steam condensate using either an electric or gas still. Solid contaminants are left behind as the steam is generated, then the steam is condensed into a purified water stream. Distillers can use large volumes of water if once-through cooling water is used in the condenser, or if a reject stream is discharged from the boiler to prevent scale buildup. These systems typically reject 15 to 25 percent of water entering the system.8
Membrane Processes (Including Reverse Osmosis)
Membrane processes use a semi-permeable mem-brane layer to separate purified water from con-taminants. Several types of membranes are used for water purification, including (from largest to smallest size of particles removed) microfiltration, ultrafiltration, nanofiltration, and reverse osmosis. Because reverse osmosis is capable of removing the smallest particles, it is used most often by laboratory and medical facilities requiring very pure water.
Reverse osmosis units use pressure to reverse os-motic pressure and force water with a high solute concentration through a membrane filter to create purified (i.e., low solute) water. Reverse osmosis is
5 University of Minnesota | Extension. 1992. Treatment Systems for Household Water Supplies: Activated Carbon Filtration (Clean Water Series). www.extension.umn.edu/distribution/naturalresources/DD5939.html.
6 East Bay Municipal Utility District (EBMUD). 2008. WaterSmart Guidebook—A Water-Use Efficiency Plan Review Guide for New Businesses. Pages TREAT1-6. www.ebmud.com/for-customers/conservation-rebates-and-services/commercial/watersmart-guidebook.7 Water Online. Deionization. www.wateronline.com/product.mvc/Deionization-0001.8 EBMUD, op. cit.
Reverse osmosis system

7-6 October 2012
able to remove a large portion of contaminants but recovers only a portion of the incoming water. The recovery rate, defined as the ratio of the purified water (i.e., permeate) to feed (i.e., incoming) water, is used to depict the efficiency of a reverse osmosis system. For commercial and institutional applications, reverse osmosis units typically have recovery rates of 50 to 75 percent.9 Thus, the systems reject 25 to 50 percent of water entering the system.
Water Softening
Water softening is used to remove hardness minerals, such as calcium and magne-sium, from water. Cation exchange water softeners are the most common type of wa-ter softening system, although other water purification technologies, such as reverse osmosis and distillation systems, can also soften water.
In a cation exchange water softener, hard water with positively charged calcium and magnesium ions passes through a mineral tank consisting of positively charged sodium ions attached to a bed of negatively charged resin beads. The calcium and magnesium ions are exchanged for the sodium ions on the resin beads, which causes the gradual depletion of available ion exchange sites. Eventually, the water softener must be re-generated to replenish the softening capacity. The regeneration process uses water to purge and rinse the system and replenish the sodium ion supply on the resin beads. As a result, the system generates sodium-rich wastewater that must be disposed.
The frequency of regeneration and the amount of water used by the water softening process is dictated by the hardness of the incoming water, the rate of water con-sumption, and the hardness removal capacity of the cation exchange water softener. The most efficient cation exchange water softeners are demand-initiated, which base the frequency of regeneration on the incoming water’s hardness or the demand for softened water rather than a set regeneration schedule.
Other Technologies
Several less common technologies are also used to purify water. Chlorine com-pounds, ozone, or hydrogen peroxide can be used to chemically disinfect water. Ultraviolet light, heat, and extreme mechanical sheer can also be used to treat water with contaminants. These technologies might not require the backwash phase used by other water purification technologies, but they can require regular cleaning, which can be water-intensive.10 Chemical disinfection can use additional water if chemicals are added in liquid or slurry form.
9 U.S. Environmental Protection Agency (EPA) and U.S. Energy Department (DOE), Energy Efficiency & Renewable Energy (EERE), Federal Energy Management Program (FEMP). May 2005. Laboratories for the 21st Century: Best Practices, Water Efficiency Guide for Laboratories. Page 5. www1.eere.energy.gov/femp/program/labs21_bmp.html.
10 EBMUD, op. cit.
7.2 Water Purification

October 2012 7-7
7.2 Water Purification
Operation, Maintenance, and User EducationFor optimal water purification system efficiency, consider the following operation, maintenance, and user education techniques:
• Use water purification only when necessary and match the process to the actual quality of water required.
• For filtration processes, base backwash phases upon the pressure differential across the filtration media. A pressure drop will indicate that the filter requires backwashing.
• For carbon filtration and deionization processes where regeneration occurs off site, work with maintenance professionals to determine an optimal schedule for removing and regenerating units. This can be determined based on incoming water characteristics and the amount and quality of purified water required daily. Deionization systems should require regeneration based on the volume of water treated or conductivity.
• For distillation systems, periodically clean the boiling chamber to remove accu-mulated minerals. This will ensure efficient operation of the system.
• For water softeners, work with a plumbing professional or the product manufac-turer to account for and program regeneration based upon the incoming water hardness and/or flow through the system. Monitor and adjust settings periodically.
Retrofit OptionsFacilities might choose to install multiple water purification systems in sequence to increase the effectiveness and efficiency of the water purification process. When one of the later phases of treatment uses a membrane, at a minimum, it might be neces-sary to install a pretreatment step to remove larger particles.
For filtration processes, consider installing pressure gauges, if not already installed. Pressure gauges can be used to determine when to initiate a backwash phase.
Consider reusing water purification system reject water as an alternative onsite water source where appropriate and feasible. See Section 8: Onsite Alternative Water Sources for more information.
Replacement OptionsPrior to purchasing a new water purification system or replacing an old one, evalu-ate the incoming water supply and assess the quality and quantity requirements of the intended use for a period of time. This will help to determine the level of water purification needed and the sizing of the system. Choose the least intensive treat-ment needed to achieve the desired quality level and size the system correctly for the intended use. Oversized systems can waste water and energy and lead to degraded quality due to of long, inoperable periods.

7-8 October 2012
Consider water purification systems that require the least amount of backwashing or regeneration. For membrane processes such as reverse osmosis, consider a system with a high recovery rate for its size. For deionization systems, consider systems that regenerate based on the volume of water treated or conductivity. For distillation systems, consider units that use air-cooled coils, rather than water-cooled coils and recover at least 85 percent of the feed water.11 For water softeners, consider demand-initiated systems instead of systems with manual or auto-initiated regeneration. In addition, consider installing multiple smaller, more efficient cation exchange water softeners that can be alternated to minimize the frequency of regeneration and allow for a constant, uninterrupted supply of soft water.
Savings PotentialThe water use of a water purification system is dependent upon the level of purifica-tion required, incoming water quality, volume of use, and purified water demand. Water use is also specific to the type of water purification system used.
Carbon filtration and deionization systems are typically regenerated off site. If regen-erated off site, the water use of these systems will not directly affect the water use of the facility. However, minimizing the frequency of removal and regeneration will help to reduce the water use of these systems.
The water use of distillers is dependent upon the method of cooling and the amount of reject water used to clear the boiler of scale buildup. Water savings can be maxi-mized if air-cooled coils are used rather than water-cooled coils. Additionally, systems that produce less reject water will consume less water overall.
For filtration processes, water use is determined by the water quality requirements and frequency of the backwash phase. Optimizing the frequency of the backwash phase by initiating backwash only when a pressure drop occurs across the filter me-dia will ensure less water is used overall.
The water efficiency of a reverse osmosis process can be determined by the recovery rate, which is defined as the ratio of permeate to feed. Systems with higher recovery rates are considered more efficient, because they are able to produce more purified water from the same amount of feed.
Recovery rates can vary widely depending upon the type of membrane and quality of incoming water. Some less efficient reverse osmosis systems, for example, have a recovery rate of 33 to 50 percent.12 The recovery rate can be maximized by increas-ing the number of stages of membrane pressure vessels, which allows for higher pressures to be achieved in order to more effectively overcome natural osmosis. A one-stage system can achieve a recovery rate of 50 percent, while two- and three-stage systems can achieve recovery rates of 75 percent and 90 percent, respectively.13 For example, the Sandia National Laboratories in Albuquerque, New Mexico, installed a high-efficiency reverse osmosis system with pretreatment before the membranes.
7.2 Water Purification
11 Ibid .12 Pagliaro, Tony. 1995. “Commercial/Industrial Reverse Osmosis Systems: General Design Considerations.” WaterReview. Page 3. www.wqa.org/pdf/Technical/
cirodes.pdf.13 Ibid . Page 2.

October 2012 7-9
7.2 Water Purification
The facility was able to achieve a 95 percent recovery rate, rejecting only 5 percent of the water entering the system.14
Additional ResourcesEast Bay Municipal Utility District. 2008. WaterSmart Guidebook—A Water-Use Efficiency Plan Review Guide for New Businesses. Pages TREAT1-6. www.ebmud.com/for- customers/conservation-rebates-and-services/commercial/watersmart-guidebook.
EPA and DOE, Energy Efficiency & Renewable Energy, Federal Energy Management Pro-gram. May 2005. Laboratories for the 21st Century: Best Practices, Water Efficiency Guide for Laboratories. Page 5. www1.eere.energy.gov/femp/program/labs21_bmp.html.
Schultz Communications. July 1999. A Water Conservation Guide for Commercial, Insti-tutional and Industrial Users. Prepared for the New Mexico Office of the State Engin-eer. www.ose.state.nm.us/wucp_ici.html.
14 EPA and DOE, EERE, FEMP. August 2009. Microelectronics Plant Water Efficiency Improvements at Sandia National Laboratories. Page 2. www1.eere.energy.gov/femp/program/waterefficiency_csstudies.html.
http://www.ebmud.com/for-customers/conservation-rebates-and-services/commercial/watersmart-guidebook

7-10 WaterSense at Work: Best Management Practices for Commercial and Institutional Facilities
7.3 Vacuum Pumps
OverviewLaboratories, medical facilities, and dental offices use vacuum pumps to collect waste gases, liquids, or debris from a vessel or enclosure. These vacuum pump systems range in size, depending upon whether they are used to supply a vacuum to several rooms or for point of use. Dental offices’ pumps range from 1.0 to 4.0 horsepower
(hp), while a central vacuum pump in a medical facility can be 5.0 to 20.0 hp.15 Vacuum pumps can use water in two ways: to cool the pump or to create the vacuum seal in the rotating equipment, which generates the vacuum.
An aspirator is a type of vacuum system that can consume water in the process of creating the vacuum. In an aspirator, fluid (e.g., liquid, gaseous) flows through a narrowing tube. As the tube narrows, the velocity of the fluid increases and the static pres-sure within the system decreases due to the Venturi effect, which creates a vacuum. The simplest type of aspirator uses water as the fluid medium, which is used once and discharged to the drain, making the process very water-intensive. Because of their sim-plicity, water aspirators might commonly be found in many high school and college laboratories, but their use can be limited to just a few hours each semester. Although water aspirators are available, they are not the focus of this section. Instead, this section focuses on vacuum pump systems, which are more commonly found in
commercial and institutional facilities. If a facility has a water aspirator that is used frequently, it should consider the replacement options discussed in this section.
Generating the Vacuum
Vacuum pumps can either be “dry” or “wet”—based upon how the vacuum seal is generated within the pump. Dry pumps do not use water to generate the seal for the vacuum. Instead, they create vacuums with turbines (i.e., fans) or use positive dis-placement (e.g., vane pumps, claw pumps, piston pumps). Wet pumps use a closed impeller that is sealed with water or other lubricants such as oil to generate the vacuum.
The most common type of wet vacuum pump is a liquid-ring vacuum pump, which uses water to form a moving cylindrical ring inside the pump casing. In these pumps, the vacuum is created by the changing geometry inside the pump casing as the im-peller and liquid ring rotate. As the vacuum seal water rotates with the pump, it gains heat and gathers impurities from gases collected by the vacuum system.
In the most simple liquid-ring vacuum pump systems, the seal and cooling water are continuously discharged and replenished with fresh water to dissipate heat and
15 East Bay Municipal Utility District (EBMUD). 2008. WaterSmart Guidebook—A Water-Use Efficiency Plan Review Guide for New Businesses. Page MED2. www.ebmud.com/for-customers/conservation-rebates-and-services/commercial/watersmart-guidebook.
Vacuum pumps at the Kansas City Science and Technology Center

October 2012 7-11
7.3 Vacuum Pumps
remove impurities. Water requirements for both creating the vacuum and cooling the equipment range from 0.5 to 1.0 gallons per minute (gpm) per hp.16 To save water, these pumps can be equipped with a partial or full recovery and recirculation system. In the full recovery system, all the seal water is recovered from the discharge side of the pump, passed through a heat exchanger (if the system configuration allows for heat removal), and reused for sealing and cooling. A small amount of recycled water is discharged to remove impurities, and the system is replenished with make-up water. This full configuration recirculation system is estimated to reduce water use by 80 percent.17
Partial recovery and recirculation systems recirculate part of the sealing water. Make-up water is added to ensure that impurity concentration is not too high. In these systems, consideration should be made to avoid heat buildup in the pump. Partial recovery systems can reduce water use by about 50 percent.
Cooling the Vacuum Pump
Vacuum pumps can be water-cooled or air-cooled. Water-cooled vacuum pumps use single-pass cooling or recirculated cooling. Either wet or dry vacuum pumps can use water to cool the system. In single-pass cooling, water passes through the pump only once for cooling, then is discharged directly to the drain. A recirculated cooling system, on the other hand, passes the majority of cooling water through a heat exchanger, and the cooling water is reused. If the cooling water does not come in contact with the vacuumed gases or other impurities, it can be recirculated by connecting the pump to a larger building system chilled water loop or cooling tower water loop to remove the heat load. Air-cooled vacuum pumps use ambient air, rather than water, to remove the heat load from the vacuum pump.
Operation, Maintenance, and User EducationFor optimal liquid-ring vacuum pump efficiency, consider the following tips:
• Turn off the pump when it is not in use or needed.
• Ensure that the vacuum pump is set at manufacturer specifications to discharge only the amount of water necessary to remove impurities and cool the vacuum pump.
• Periodically check the vacuum pump’s operational control schemes, if available, to ensure optimum efficiency (e.g., timers, float-operated switches, total dis-solved solids controllers that initiate discharge and make-up water).
Retrofit OptionsIf the facility is using a liquid-ring vacuum pump that continuously discharges water, the facility can consider equipping the pump with a full recovery and recirculation
16 Ibid.17 U.S. Air Force Medical Service. Dental Vacuum Systems. Page 5. airforcemedicine.afms.mil/idc/groups/public/documents/afms/ctb_108329.pdf.

7-12 October 2012
system, to reduce total water use by an estimated 80 percent.18 The facility should consider the impurities gathered within the pump and other characteristics of the waste being removed when evaluating whether a full recovery and recirculation system is appropriate. A partial recovery and recirculation system could also be considered, and the facility could reduce water use by an estimated 50 percent with its installation. If either recovery and recirculation system option is installed, ensure that it is properly maintained per manufacturer instructions so that impurities are removed and hard water deposits do not remain in the system.
If the facility has any other type of vacuum pump that is cooled with single-pass, non-contact cooling water, a heat exchanger can be added, or it can be connected to a larger building system chilled water loop or cooling tower water loop. See Section 6.2: Single-Pass Cooling for more information.
Replacement OptionsWhen purchasing a new vacuum pump or replacing older equipment, a non- lubricated, dry vacuum pump that is air-cooled can eliminate the pump’s water use altogether. When choosing a vacuum pump, it is important to consider all factors, including energy and water use. Although they might be more expensive, dry, air-cooled vacuum pumps can be as much as 25 to 50 percent more energy-efficient than water-cooled or liquid-ring vacuum pumps.19
Facilities should note that, in some cases, liquid-ring vacuum pump discharge can pose a biohazard risk. Therefore, a non-lubricated, dry vacuum pump that is air-cooled could be the best option. However, if explosive or corrosive gases are being removed with the vacuum system, the facility might only be able to consider a liquid-ring vacuum pump. Dental facilities should note that new vacuum systems—wet or dry, and regardless of the type of cooling system—often need to add amalgam separators to prevent mercury contamination in water bodies.20
Savings PotentialRetrofitting existing liquid-ring vacuum pumps with full or partial recovery and recirculation systems can result in significant water savings, while replacing existing water-cooled and/or liquid-ring vacuum pumps with air-cooled, dry vacuum pumps can entirely eliminate water use.
To estimate facility-specific water savings and payback, use the following information.
Vacuum Pump Retrofit
Liquid-ring pumps that utilize water to create a vacuum can be retrofitted to recircu-late sealing and cooling water rather than discharging to the drain.
7.3 Vacuum Pumps
18 Ibid.19 EBMUD, op. cit.20 U.S. Air Force Medical Service, op. cit., Page 1.

October 2012 7-13
7.3 Vacuum Pumps
Current Water Use
To estimate the current water use of an existing vacuum pump, identify the following and use Equation 7-1:
• Flow rate of the discharged water from the existing vacuum pump. • Average daily use time. • Days of operation per year.
Equation 7-1. Water Use of Vacuum Pump (gallons per year)
= Vacuum Pump Discharge Flow Rate x Daily Use Time x Days of Operation
Where:
• Vacuum Pump Discharge Flow Rate (gallons per minute) • Daily Use Time (minutes per day) • Days of Operation (days per year)
Water Savings
Full water recovery and recirculation systems can reduce water use by approximately 80 percent,21 while partial systems can reduce water use by approximately 50 per-cent.22 To calculate the water savings that can be achieved from retrofitting an exist-ing vacuum pump, identify the current water use of the vacuum pump as calculated using Equation 7-1 and use Equation 7-2, using 80 percent savings for a full system and 50 percent for a partial system.
Equation 7-2. Water Savings From Vacuum Pump Recovery and Recirculation System Retrofit (gallons per year)
= Current Water Use of Vacuum Pump x Savings (0.80 or 0.50)
Where:
• Current Water Use of Vacuum Pump (gallons per year) • Savings (percent)
Payback
To calculate the simple payback from the water savings associated with retrofitting an existing vacuum pump, consider the equipment and installation cost of the retro-fit recovery and recirculation system, the water savings as calculated using Equation 7-2, and the facility-specific cost of water and wastewater.
21 Ibid. Page 5.22 Estimate based on manufacturer literature.

7-14 October 2012
The facility should also consider the energy impact of the vacuum pump retrofit. The recovery systems might use energy, which can affect the payback period and cost-effectiveness.
Vacuum Pump Replacement
Existing liquid-ring vacuum pumps can be replaced with dry vacuum pumps that are air-cooled rather than water-cooled. This replacement entirely eliminates the water used to create a vacuum, as well as the water used to cool the vacuum pump.
Current Water Use
To estimate the current water use of an existing vacuum pump, use Equation 7-1.
Water Savings
Because air-cooled, dry vacuum pumps consume no water to create a vacuum, water savings will be equal to the current water use. To calculate the water savings that can be achieved from replacing an existing vacuum pump, identify the current water use of the vacuum pump as calculated using Equation 7-1 and use Equation 7-3.
Equation 7-3. Water Savings From Vacuum Pump Replacement (gallons per year)
= Current Water Use of Vacuum Pump
Where:
• Current Water Use of Vacuum Pump (gallons per year)
Payback
To calculate the simple payback from the water savings associated with replacing an existing liquid-ring vacuum pump with an air-cooled, dry vacuum pump, consider the equipment and installation cost, the water savings as calculated using Equation 7-3, and the facility-specific cost of water and wastewater.
By replacing a water-cooled or liquid-ring vacuum pump with an air-cooled, dry pump, facilities should also consider the potential increase or decrease in energy use. Some dry vacuum pumps can save energy over the existing water-cooled or liquid-ring pump. The energy use will also affect the payback time and replacement cost-effectiveness.
7.3 Vacuum Pumps
October 2012 7-15
Additional ResourcesEast Bay Municipal Utility District. 2008. WaterSmart Guidebook—A Water-Use Efficiency Plan Review Guide for New Businesses. Pages MED1-2. www.ebmud.com/for-customers/conservation-rebates-and-services/commercial/watersmart-guidebook.
Sydney Water. October 2004. The Liquid Ring Vacuum Pump. www.sydneywater.com.au/Water4Life/InYourBusiness/FactSheets.cfm.
U.S. Air Force Medical Service. Dental Vacuum Systems. airforcemedicine.afms.mil/idc/groups/public/documents/afms/ctb_108329.pdf.
7.3 Vacuum Pumps
http://www.ebmud.com/for-customers/conservation-rebates-and-services/commercial/watersmart-guidebook
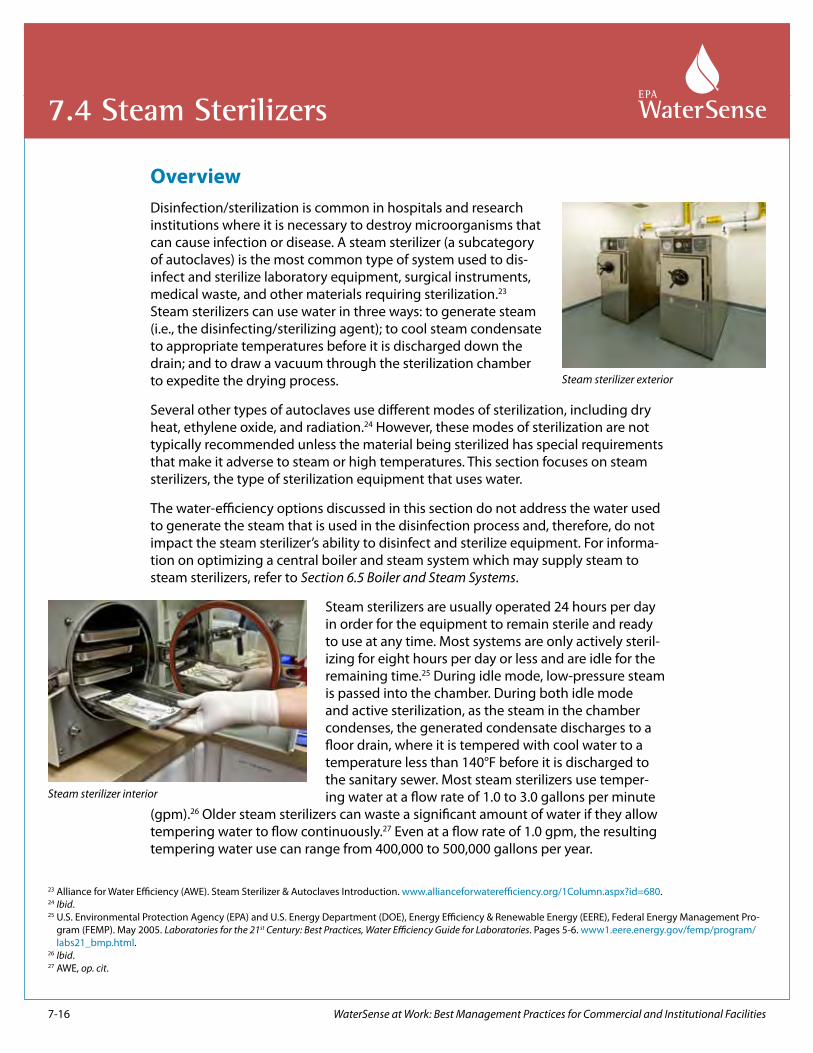
7-16 WaterSense at Work: Best Management Practices for Commercial and Institutional Facilities
7.4 Steam Sterilizers
OverviewDisinfection/sterilization is common in hospitals and research institutions where it is necessary to destroy microorganisms that can cause infection or disease. A steam sterilizer (a subcategory of autoclaves) is the most common type of system used to dis-infect and sterilize laboratory equipment, surgical instruments, medical waste, and other materials requiring sterilization.23 Steam sterilizers can use water in three ways: to generate steam (i.e., the disinfecting/sterilizing agent); to cool steam condensate to appropriate temperatures before it is discharged down the drain; and to draw a vacuum through the sterilization chamber to expedite the drying process.
Several other types of autoclaves use different modes of sterilization, including dry heat, ethylene oxide, and radiation.24 However, these modes of sterilization are not typically recommended unless the material being sterilized has special requirements that make it adverse to steam or high temperatures. This section focuses on steam sterilizers, the type of sterilization equipment that uses water.
The water-efficiency options discussed in this section do not address the water used to generate the steam that is used in the disinfection process and, therefore, do not impact the steam sterilizer’s ability to disinfect and sterilize equipment. For informa-tion on optimizing a central boiler and steam system which may supply steam to steam sterilizers, refer to Section 6.5 Boiler and Steam Systems.
Steam sterilizers are usually operated 24 hours per day in order for the equipment to remain sterile and ready to use at any time. Most systems are only actively steril-izing for eight hours per day or less and are idle for the remaining time.25 During idle mode, low-pressure steam is passed into the chamber. During both idle mode and active sterilization, as the steam in the chamber condenses, the generated condensate discharges to a floor drain, where it is tempered with cool water to a temperature less than 140°F before it is discharged to the sanitary sewer. Most steam sterilizers use temper-ing water at a flow rate of 1.0 to 3.0 gallons per minute
(gpm).26 Older steam sterilizers can waste a significant amount of water if they allow tempering water to flow continuously.27 Even at a flow rate of 1.0 gpm, the resulting tempering water use can range from 400,000 to 500,000 gallons per year.
Steam sterilizer exterior
Steam sterilizer interior
23 Alliance for Water Efficiency (AWE). Steam Sterilizer & Autoclaves Introduction. www.allianceforwaterefficiency.org/1Column.aspx?id=680.24 Ibid.25 U.S. Environmental Protection Agency (EPA) and U.S. Energy Department (DOE), Energy Efficiency & Renewable Energy (EERE), Federal Energy Management Pro-
gram (FEMP). May 2005. Laboratories for the 21st Century: Best Practices, Water Efficiency Guide for Laboratories. Pages 5-6. www1.eere.energy.gov/femp/program/labs21_bmp.html.
26 Ibid.27 AWE, op. cit.

October 2012 7-17
7.4 Steam Sterilizers
Newer steam sterilizers can be designed—or older systems retrofitted—with a ther-mostatically actuated valve (see Figure 7-3) and/or an uninsulated heat exchange tank to significantly reduce the amount of tempering water use. The heat exchange tank transfers heat from the condensate to the cooler, ambient atmosphere before it is discharged to the sanitary sewer. The tempering valve allows tempering water to flow only when the condensate reaches a certain temperature. Major steam sterilizer manufacturers in the United States began including water tempering kits on their systems in the late 1990s.
Figure 7-3. Steam Sterilizer Cooling Water Retrofit
Steam sterilizers can also be retrofitted or designed to reduce the amount of water necessary to draw a vacuum through the sterilization chamber. In a conventional steam sterilizer, the vacuum is generated by passing water at a high velocity through an ejector at a flow rate of 5.0 to 15.0 gpm and discharging it directly to the sanitary sewer.28 To reduce this water use, a second pump and water reservoir can be added to capture and reuse a portion of the water. New steam sterilizers can also offer an elec-tric liquid-ring vacuum pump that reduces water use by about 75 percent compared to the water used through the vacuum generation on a conventional steam sterilizer.29
28 Koeller, John, et al. August 2004. A Report on Potential Best Management Practices. Prepared for the California Urban Water Conservation Council. Pages 26. www.cuwcc.org/products/pbmp-reports.aspx.
29 Ibid. Page 31.
SterilizationChamber
TemperingWater
CondensateTemperature Sensor
ThermostaticallyActuated
ValveCooledCondensate
Wastewater toDrain
<140°F
Jacket
Steam Supply

7-18 October 2012
While steam sterilizers with dry vacuum pumps are available in Europe, they are still not available in the United States at this time.
Operation, Maintenance, and User EducationTo optimize the water efficiency of a steam sterilizer, consider the following opera-tion, maintenance, and user education techniques:
• Adjust the tempering water needle valve flow rate to the minimum manufacturer recommendations and periodically review and readjust to ensure no unneces-sary water is discharged to the drain.
• Change out the needle valve annually, because they can wear quickly. Worn valves can discharge excess water.
• If the steam sterilizer is already equipped with a thermostatically actuated valve to control tempering water flow, periodically check the valve to ensure it is open-ing and closing properly, so tempering water is not continuously discharged.
• Shut off the steam sterilizer unit when not in use.
• Use high-quality water to generate steam to improve the efficiency of the steam sterilizer.
Retrofit OptionsThere are two retrofit approaches to reduce the water use associated with steam ster-ilizers. One approach addresses the use of tempering water, and the other addresses the water used to create the vacuum in the sterilization chamber. Depending upon the operational settings, frequency, and timing of sterilizer use and whether the tem-pering water flows continuously, retrofitting a conventional steam sterilizer to reduce its water use can be cost-effective.
Tempering Water Retrofit
To reduce the amount of tempering water necessary to cool the steam condensate that is discharged, replace the standard needle valve with a thermostatically actu-ated valve. This type of valve can monitor the temperature of the condensate and will adjust and minimize the flow of cooling water necessary to maintain a discharge temperature below 140°F. In addition, consider diverting the steam condensate into a small, uninsulated tank prior to discharge. This tank will allow the condensate to cool through heat exchange with the ambient air to the point where little to no additional cooling water is required to meet the 140° F temperature discharge requirement.30
Vacuum Retrofit
Vacuum units contain an ejector that creates the vacuum in the sterilization chamber. Water is typically passed through the ejector at a very high flow rate before it is dis-
7.4 Steam Sterilizers
30 Ibid. Pages 23-34.

October 2012 7-19
charged down the drain. To capture and reuse a portion of the water passing through the ejector, a second, additional ejector with a pump and a water reservoir can be added. This modification channels 50 to 75 percent of the water flowing through the ejector into an uninsulated tank, where it is allowed to cool below 120°F before being reused through the pump and ejector. If the captured water does not cool fast enough, a thermostatic valve allows cold water to flow into the tank, and any overflow is sent to the drain. One limitation to this type of system is that it cannot be used on sterilizers with a sealing flange or any sterilizer that processes biohazardous material.31
Replacement OptionsWhen looking to purchase a new steam sterilizer or to replace older equipment, look for models that only use tempering water when needed and that have the capability to cool the steam condensate prior to discharge. Look for models that have a vacuum unit with a second ejector and a reservoir to capture and reuse a portion of the water passing through the ejector or models with an electric liquid-ring vacuum pump.
In addition, look for models with features that can further reduce water use and improve efficiency, such as an automatic shut-off, or a programmable control system that shuts down the sterilizer during periods of non-use (e.g., non-business hours) and restarts the unit so it is ready for use when needed. Models are also available with improved chamber jacket cladding (i.e., insulation) to reduce sterilizer heat loss and ambient heat gain.
Savings PotentialWater savings can be achieved through steam sterilizer retrofit or replacement in two ways: reducing the amount of water required to temper the condensate, or reducing the water used to create the vacuum.
To estimate facility-specific water savings and payback, use the following information.
Steam Sterilizer Retrofit or Replacement to Reduce Tempering Water Use
Existing steam sterilizers can be retrofitted or new steam sterilizers can be purchased with a thermostatically actuated valve and a heat exchanger to reduce the amount of tempering water used to cool the steam condensate.
Current Water Use
To estimate the current tempering water use of an existing steam sterilizer, identify the following information and use Equation 7-4:
• Flow rate of the sterilizer’s tempering water. Most steam sterilizers use tempering water with a flow rate of 1.0 to 3.0 gpm.32
7.4 Steam Sterilizers
31 Ibid.32 EPA and DOE, EERE, FEMP, op. cit.

7-20 October 2012
• Average daily idle period of the steam sterilizer. Note that some older models have tempering water that flows constantly, even if the unit is turned off and not in idle mode. In this case, the average daily use of 24 hours should be used instead of the daily idle period to calculate daily water use.
• Days of sterilizer operation per year. If the tempering water is flowing constantly, even when the sterilizer is not in use and the facility is closed, 365 days per year should be used.
Equation 7-4. Steam Sterilizer Tempering Water Use (gallons per year)
= Tempering Water Flow Rate x Daily Idle Period x Days of Operation
Where:
• Tempering Water Flow Rate (gallons per minute) • Daily Idle Period (minutes per day) • Days of Operation (days of sterilizer operation per year)
Water Savings
A study conducted at the University of Washington showed that a tempering water retrofit or installing new equipment that addresses tempering water can reduce tempering water use by up to 90 percent, depending upon how long the sterilizer is in idle mode.33 To calculate the tempering water savings that can be achieved from retrofitting or replacing an existing steam sterilizer, identify the current water use of the equipment, as calculated using Equation 7-4, and use Equation 7-5.
Equation 7-5. Water Savings From Steam Sterilizer Tempering Water Retrofit or Replacement (gallons per year)
= Current Steam Sterilizer Tempering Water Use x Savings (0.9)
Where:
• Current Steam Sterilizer Tempering Water Use (gallons per year) • Savings (percent)
Payback
To calculate the simple payback from the water savings associated with the temper-ing water retrofit or replacement, consider the equipment and installation cost of the retrofit or replacement, the water savings as calculated using Equation 7-5, and the
7.4 Steam Sterilizers
33 van Gelder, Roger E. and Leaden, John. University of Washington. 2003. Field Evaluation of Three Models of Water Conservation Kits for Sterilizer Trap Cooling at University of Washington. Page 9. www.p2pays.org/ref/50/49036.pdf.

October 2012 7-21
7.4 Steam Sterilizers
facility-specific cost of water and wastewater. A tempering water retrofit typically costs $2,900.34 If the steam sterilizer was replaced, use the cost of the new steam sterilizer.
Steam Sterilizer Retrofit or Replacement With Additional Ejector (Vacuum Water Use)
Sterilizers can consume water to produce a vacuum. To reduce this water use, exist-ing steam sterilizer equipment can be retrofitted or new units purchased with an additional ejector with a pump and water reservoir to capture and reuse a portion of the water passing through the ejector. Purchasing a new steam sterilizer with this vacuum configuration would require a longer payback period.
Current Water Use
To estimate the current water use of an existing steam sterilizer’s vacuum, identify the following information and use Equation 7-6:
• Flow rate of water needed to pull the required vacuum. This will be dependent upon the size of the unit.
• Number of sterilization cycles run each day.
• Duration of the conditioning phase. The average conditioning phase lasts three minutes.35
• Duration of the exhaust phase. The average exhaust phase lasts 30 minutes.36
• Days of sterilizer operation per year.
Equation 7-6. Steam Sterilizer Vacuum Water Use (gallons per year)
= [Vacuum Flow Rate x (Duration of Exhaust Phase + Duration of Conditioning Phase)] x Sterilization Cycles x Days of Operation
Where:
• Vacuum Flow Rate (gallons per minute) • Duration of Exhaust Phase (minutes per cycle) • Duration of Conditioning Phase (minutes per cycle) • Sterilization Cycles (sterilization cycles per day) • Days of Operation (days of sterilizer operation per year)
34 Escalated from 2004 dollars to 2010 dollars; 2004 dollars from: Koeller, John, et al., op. cit., Page 32.35 Koeller, John, et al., op. cit. Pages 26-32.36 Ibid. Page 26.

7-22 October 2012
Water Savings
On average, a vacuum retrofit or replacement that modifies the ejector can reduce vacuum water use by at least 50 percent.37 To calculate the water savings that can be achieved from this type of modification, identify the current water use of the equip-ment as calculated using Equation 7-6 and use Equation 7-7.
Equation 7-7. Water Savings From Steam Sterilizer Vacuum Retrofit or Replacement With Additional Ejector (gallons per year)
= Current Steam Sterilizer Vacuum Water Use x Savings (0.5)
Where:
• Current Steam Sterilizer Vacuum Water Use (gallons per year) • Savings (percent)
Payback
To calculate the simple payback from the water savings associated with retrofit-ting or replacing an existing steam sterilizer vacuum, consider the equipment and installation cost of the retrofit or replacement, the water savings as calculated using Equation 7-7, and the facility-specific cost of water and wastewater. An ejector modi-fication vacuum retrofit typically could cost approximately $17,200.38
By retrofitting an existing steam sterilizer vacuum with an additional ejector, facilities should also consider the potential energy impact. The pump and other equipment included with the retrofit or replacement can use additional energy. The energy use can affect the payback time and cost-effectiveness.
Steam Sterilizer Replacement With Liquid-Ring Vacuum Pump (Vacuum Water Use)
When replacing a steam sterilizer, facilities can also select models that have an elec-tric liquid-ring vacuum pump instead of a high-velocity ejector. Liquid-ring vacuum pumps can reduce vacuum water use by 75 percent compared to the water used through the vacuum generation on a conventional steam sterilizer.
Current Water Use
To estimate the water use of an existing steam sterilizer’s vacuum, use Equation 7-6.
Water Savings
Purchasing a new steam sterilizer with an electric liquid-ring vacuum pump can re-duce vacuum water use by approximately 75 percent.39 To calculate the water savings
7.4 Steam Sterilizers
37 Ibid. Page 27.38 Ibid.39 Ibid. Page 31

October 2012 7-23
7.4 Steam Sterilizers
that can be achieved from replacing an existing steam sterilizer with one that has an electric liquid-ring vacuum pump, identify the current water use of the equipment, as calculated using Equation 7-6, and use Equation 7-8.
Equation 7-8. Water Savings From Steam Sterilizer Retrofit With Liquid-Ring Vacuum Pump (gallons per year)
= Current Steam Sterilizer Vacuum Water Use x Savings (0.75)
Where:
• Current Steam Sterilizer Vacuum Water Use (gallons per year) • Savings (percent)
Payback
To calculate the simple payback from the water savings associated with replacing a steam sterilizer with one with a liquid-ring vacuum pump, consider the equipment and installation cost of the replacement, the water savings as calculated using Equa-tion 7-8, and the facility-specific cost of water and wastewater.
By replacing a steam sterilizer with one with a liquid-ring vacuum pump, facilities should also consider the potential increase or decrease in energy use. The energy use will also affect the payback period and replacement cost-effectiveness.
Additional ResourcesAlliance for Water Efficiency. Steam Sterilizer & Autoclaves Introduction. www.allianceforwaterefficiency.org/1Column.aspx?id=680.
EPA and DOE, Energy Efficiency & Renewable Energy, Federal Energy Management Program (FEMP). May 2005. Laboratories for the 21st Century: Best Practices, Water Efficiency Guide for Laboratories. Pages 5-6. www1.eere.energy.gov/femp/program/labs21_bmp.html.
DOE, Energy Efficiency & Renewable Energy, FEMP. Water Efficiency Improvements at Various Environmental Protection Agency Sites. www1.eere.energy.gov/femp/program/waterefficiency_csstudies.html.
Koeller, John, et al. August 2004. A Report on Potential Best Management Practices. Prepared for the California Urban Water Conservation Council. Pages 23-34. www.cuwcc.org/products/pbmp-reports.aspx.
van Gelder, Roger E. and Leaden, John. University of Washington. 2003. Field Evalua-tion of Three Models of Water Conservation Kits for Sterilizer Trap Cooling at University of Washington. www.p2pays.org/ref/50/49036.pdf.
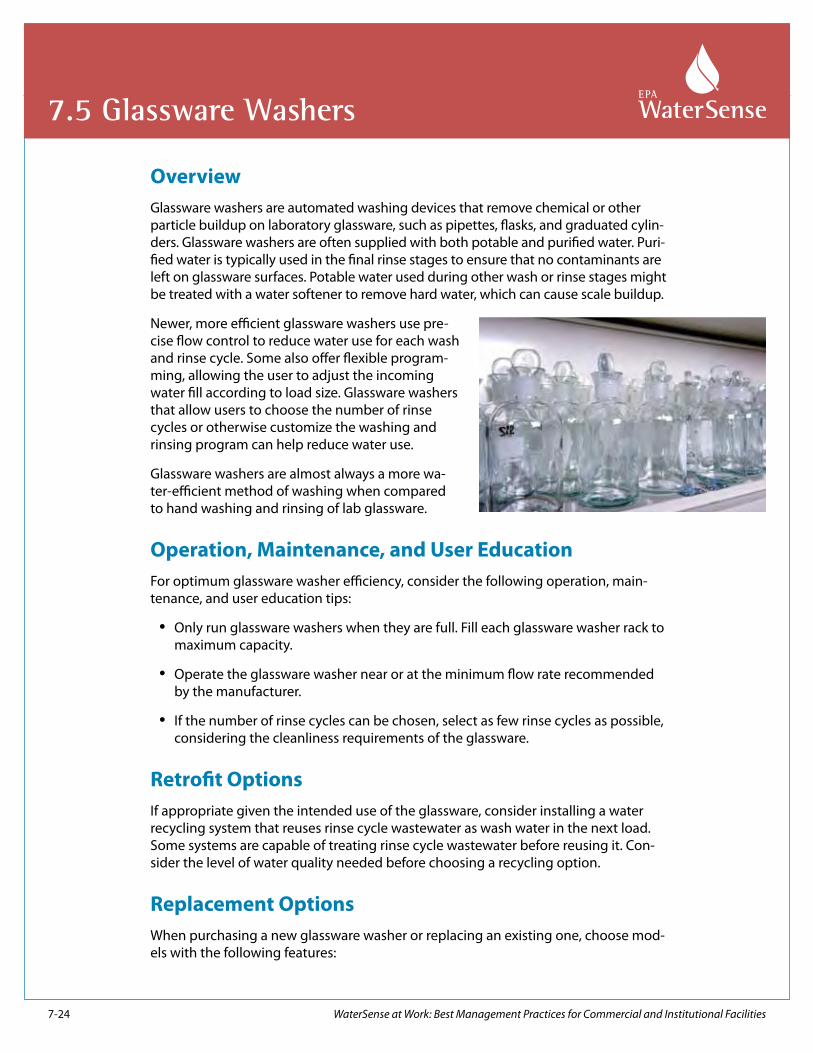
7-24 WaterSense at Work: Best Management Practices for Commercial and Institutional Facilities
7.5 Glassware Washers
OverviewGlassware washers are automated washing devices that remove chemical or other particle buildup on laboratory glassware, such as pipettes, flasks, and graduated cylin-ders. Glassware washers are often supplied with both potable and purified water. Puri-fied water is typically used in the final rinse stages to ensure that no contaminants are left on glassware surfaces. Potable water used during other wash or rinse stages might be treated with a water softener to remove hard water, which can cause scale buildup.
Newer, more efficient glassware washers use pre-cise flow control to reduce water use for each wash and rinse cycle. Some also offer flexible program-ming, allowing the user to adjust the incoming water fill according to load size. Glassware washers that allow users to choose the number of rinse cycles or otherwise customize the washing and rinsing program can help reduce water use.
Glassware washers are almost always a more wa-ter-efficient method of washing when compared to hand washing and rinsing of lab glassware.
Operation, Maintenance, and User EducationFor optimum glassware washer efficiency, consider the following operation, main-tenance, and user education tips:
• Only run glassware washers when they are full. Fill each glassware washer rack to maximum capacity.
• Operate the glassware washer near or at the minimum flow rate recommended by the manufacturer.
• If the number of rinse cycles can be chosen, select as few rinse cycles as possible, considering the cleanliness requirements of the glassware.
Retrofit OptionsIf appropriate given the intended use of the glassware, consider installing a water recycling system that reuses rinse cycle wastewater as wash water in the next load. Some systems are capable of treating rinse cycle wastewater before reusing it. Con-sider the level of water quality needed before choosing a recycling option.
Replacement OptionsWhen purchasing a new glassware washer or replacing an existing one, choose mod-els with the following features:

October 2012 7-25
7.5 Glassware Washers
• Cycle selection that allows users to optimize rinse cycles for both effective and efficient cleaning.
• Reuse of final rinse water as wash water for the next load, if appropriate.
• Water intake monitoring to adjust the amount of water used based on load size.
Savings PotentialWater savings can be achieved by replacing an existing glassware washer with a more efficient one. A glassware washer’s water use is dependent upon the amount of water used during wash and rinse cycles, as well as the total number of cycles. A replacement glassware washer can use less water per cycle through flow control and allow users to select fewer cycles.
To estimate facility-specific water savings and payback, use the following information.
Current Water Use
To estimate the current water use of a glassware washer, identify the following infor-mation and use Equation 7-9:
• Average volume of water used during a full wash process. This might be provided by the product manufacturer through product literature or the manufacturer’s website. The water efficiency will be dependent upon the flow rate of each rinse or wash cycle, duration of each cycle, and number of cycles. If the water use from the full wash process is not available from the manufacturer, add up the water use from each cycle to determine the water use from the full wash process.
• Average number of wash processes per day.
• Days of operation per year.
Equation 7-9. Water Use of Glassware Washer (gallons per year)
= Wash Water Use x Wash Processes per Day x Days of Operation
Where:
• Wash Water Use (gallons per wash) • Wash Processes per Day (washes per day) • Days of Operation (days of washer operation per year)
Water Use After Replacement
To estimate the water use of a more efficient replacement glassware washer, use Equation 7-9, substituting the average volume of water used during a full wash process of the replacement glassware washer. Efficient models can use less than 15 gallons during the full wash process. If the number of rinse cycles can be chosen,

7-26 October 2012
calculate the maximum potential water savings using the water use corresponding to the fewest average number of rinse cycles needed at the facility.
Water Savings
To calculate the water savings that can be achieved from the replacement of an exist-ing glassware washer, identify the following information and use Equation 7-10:
• Current water use as calculated using Equation 7-9. • Water use after replacement as calculated using Equation 7-9.
Equation 7-10. Water Savings From Glassware Washer Replacement (gallons per year)
= Current Glassware Washer Water Use – Water Use After Glassware Washer Replacement
Where:
• Current Glassware Washer Water Use (gallons per year) • Water Use After Glassware Washer Replacement (gallons per year)
Payback
To calculate the simple payback from the water savings associated with replacing an existing glassware washer, consider the equipment and installation cost of the replacement glassware washer, the water savings as calculated using Equation 7-10, and the facility-specific cost of water and wastewater.
By reducing water use in a glassware washer, facilities can also save a significant amount of energy, since most of the water used during the rinse cycles is hot water. This energy savings will further reduce the payback period and increase replacement cost-effectiveness.
Additional ResourcesEPA and DOE, Energy Efficiency & Renewable Energy, Federal Energy Management Program. May 2005. Laboratories for the 21st Century: Best Practices, Water Efficiency Guide for Laboratories. Pages 6-7. www1.eere.energy.gov/femp/program/labs21_bmp.html.
7.5 Glassware Washers

WaterSense at Work: Best Management Practices for Commercial and Institutional Facilities 7-27
7.6 Fume Hood Filtration and Wash-Down Systems
OverviewA fume hood is a ventilated enclosure where hazardous materials can be handled safely to limit exposure. Fume hoods draw contaminants within the work area away from the user to minimize contact and exhaust fumes through a ventilation system to remove contaminants from the building.
As a first step, a facility should determine if treatment is needed prior to exhausting fumes through the building ventilation system. Dry exhaust fume hoods use a fan to draw in air containing hazardous contaminants before expelling it without provi-ding contaminant treatment. These systems might be appropriate depending upon the hazard level associated with the exhaust being ventilated. If minor treatment of exhausting fumes is necessary, a facility should consider using condensers, cold traps, or adsorbents such as activated charcoal, or neutralizing or converting toxic substances into other less hazardous species.40
When dealing with certain hazardous substances requiring more intensive treat-ment, a fume hood with a filtration system might be needed. There are two types of fume hood filtration systems typically used to handle hazardous substances: gas-phase filtration (includes wet scrubbers) and particulate filtration.41 Wet scrubbers require the consumption of water to remove hazardous substances. Other gas-phase filtration or particulate filtration systems might be suitable alternatives to wet scrub-bers in certain circumstances, as discussed below. In all cases, laboratories should follow manufacturer instructions and facility health and safety guidelines in order to ensure safe operation of fume hoods.
This section focuses on fume hood filtration systems, including those that use water (e.g., wet scrubbers) and fume hood wash-down systems. It also describes systems that do not use water that could be considered as an alternative to wet scrubbers.
Fume Hood Filtration Systems
Wet Scrubbers
Fume hoods with wet scrubbers that use water to capture and trap hazardous sub-stances are also known as liquid fume hood scrubbers. Contaminated air enters the scrubber system from below and passes through a packed bed. The packed bed is wetted from above with a liquid spray. As the contaminated air comes into contact with the water, water-soluble gases, vapors, aerosols, and particulates become dis-solved. The trapped contaminants fall with the water and are discharged into a scrub-bing liquor sump. The “scrubbing liquor” is recirculated, with make-up water added as needed to replace water that has evaporated. The scrubbing liquor is removed peri-odically through a blowdown valve to control total dissolved solids. The treated air is released through an exhaust system. See Figure 7-4 for a schematic of this process.
40 Hitchings, Dale T. September 1993-January 1994. “Fume Hood Scrubbers—Parts I, II, and III.” Laboratory Building Design Update. Page 1. www.safelab.com/ resources.htm.
41 Ibid. Pages 6-8.

7-28 October 2012
7.6 Fume Hood Filtration and Wash-Down Systems
Figure 7-4. Fume Hood Wet Scrubber
Other Gas-Phase Filtration
Besides wet scrubbers, there are two other basic types of gas-phase filtration systems for fume hoods: inert adsorbents and chemically active adsorbents, which do not require water use. Inert adsorbents include activated carbon, activated alumina, and molecular sieves. Chemically active adsorbents are simply inert adsorbents impreg-nated with a strong oxidizer, such as potassium permanganate, that react with and destroy the organic vapors.42
Because contaminants build up in the adsorbent and can be desorbed if the concen-tration is too high or if the adsorbent has a higher affinity for another contaminant, the adsorbent must be changed or regenerated regularly. Adsorbent systems are not effective in removing high concentrations of contaminants (i.e., spills inside the hood). Since these systems require a consistent check on contaminant concentra-tions and maintenance of the adsorbent, these factors should be taken into account when evaluating alternatives to fume hood wet scrubber systems, keeping in mind the contaminant and concentration that needs to be removed to ensure that the hazard is fully abated.43,44
Make-UpWaterSupply
ChemicalSupply
Blowdown RecirculationPump
Liquid Flow Air FlowPacking
Spray Manifold
Mist Eliminator
Air FromFumeHood
ScrubbingLiquorSump
Clean Air Out to Exhaust System
42 Ibid. Page 6.43 National Research Council, et al. 1995. Prudent Practices in the Laboratory—Handling and Disposal of Chemicals. Washington, DC: National Academy Press. Page
188. www.nap.edu/openbook.php?record_id=4911&page=188.44 Hitchings, Dale T., op. cit., Pages 6-7.
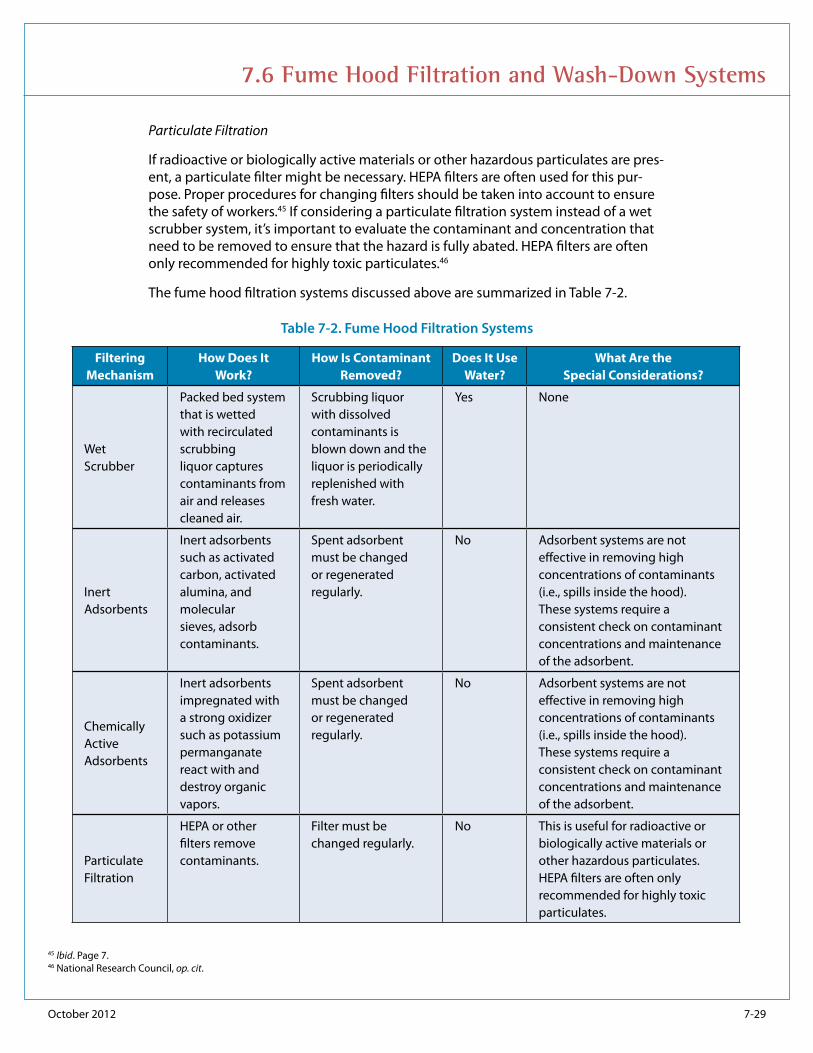
October 2012 7-29
7.6 Fume Hood Filtration and Wash-Down Systems
Particulate Filtration
If radioactive or biologically active materials or other hazardous particulates are pres-ent, a particulate filter might be necessary. HEPA filters are often used for this pur-pose. Proper procedures for changing filters should be taken into account to ensure the safety of workers.45 If considering a particulate filtration system instead of a wet scrubber system, it’s important to evaluate the contaminant and concentration that need to be removed to ensure that the hazard is fully abated. HEPA filters are often only recommended for highly toxic particulates.46
The fume hood filtration systems discussed above are summarized in Table 7-2.
Table 7-2. Fume Hood Filtration Systems
45 Ibid. Page 7.46 National Research Council, op. cit.
Filtering Mechanism
How Does It Work?
How Is Contaminant Removed?
Does It Use Water?
What Are the Special Considerations?
Wet Scrubber
Packed bed system that is wetted with recirculated scrubbing liquor captures contaminants from air and releases cleaned air.
Scrubbing liquor with dissolved contaminants is blown down and the liquor is periodically replenished with fresh water.
Yes None
Inert Adsorbents
Inert adsorbents such as activated carbon, activated alumina, and molecular sieves, adsorb contaminants.
Spent adsorbent must be changed or regenerated regularly.
No Adsorbent systems are not effective in removing high concentrations of contaminants (i.e., spills inside the hood). These systems require a consistent check on contaminant concentrations and maintenance of the adsorbent.
Chemically Active Adsorbents
Inert adsorbents impregnated with a strong oxidizer such as potassium permanganate react with and destroy organic vapors.
Spent adsorbent must be changed or regenerated regularly.
No Adsorbent systems are not effective in removing high concentrations of contaminants (i.e., spills inside the hood). These systems require a consistent check on contaminant concentrations and maintenance of the adsorbent.
Particulate Filtration
HEPA or other filters remove contaminants.
Filter must be changed regularly.
No This is useful for radioactive or biologically active materials or other hazardous particulates. HEPA filters are often only recommended for highly toxic particulates.
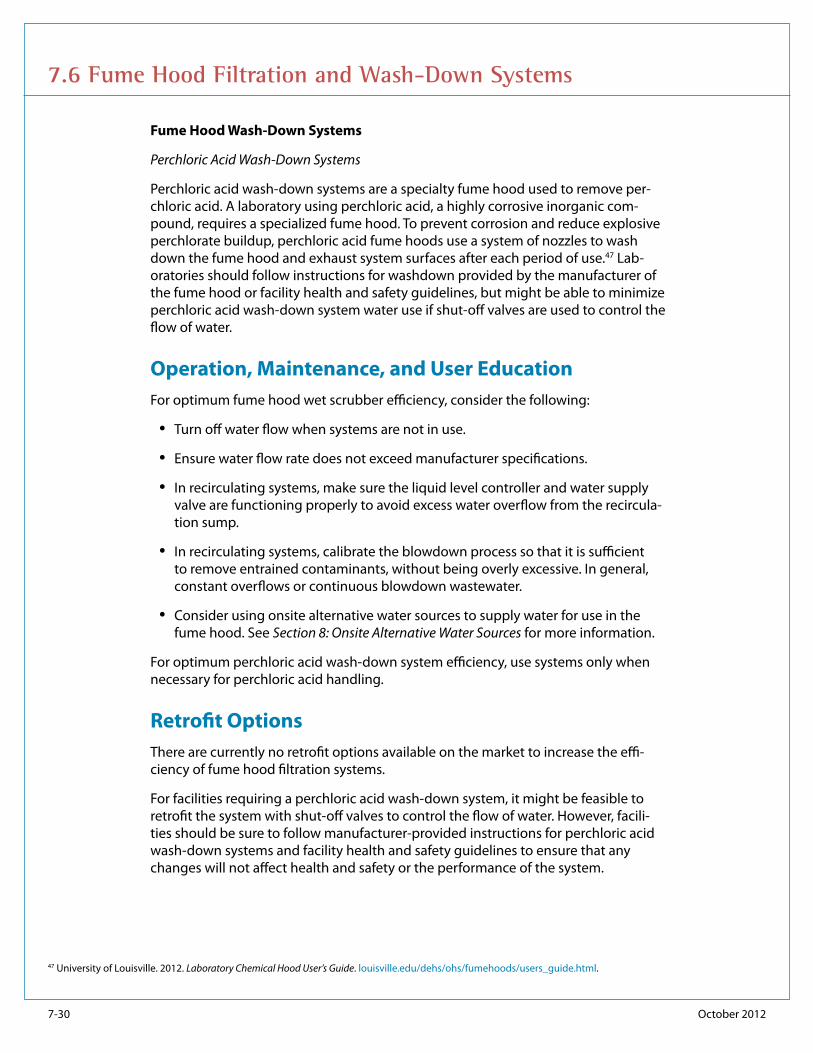
7-30 October 2012
Fume Hood Wash-Down Systems
Perchloric Acid Wash-Down Systems
Perchloric acid wash-down systems are a specialty fume hood used to remove per-chloric acid. A laboratory using perchloric acid, a highly corrosive inorganic com-pound, requires a specialized fume hood. To prevent corrosion and reduce explosive perchlorate buildup, perchloric acid fume hoods use a system of nozzles to wash down the fume hood and exhaust system surfaces after each period of use.47 Lab-oratories should follow instructions for washdown provided by the manufacturer of the fume hood or facility health and safety guidelines, but might be able to minimize perchloric acid wash-down system water use if shut-off valves are used to control the flow of water.
Operation, Maintenance, and User EducationFor optimum fume hood wet scrubber efficiency, consider the following:
• Turn off water flow when systems are not in use.
• Ensure water flow rate does not exceed manufacturer specifications.
• In recirculating systems, make sure the liquid level controller and water supply valve are functioning properly to avoid excess water overflow from the recircula-tion sump.
• In recirculating systems, calibrate the blowdown process so that it is sufficient to remove entrained contaminants, without being overly excessive. In general, constant overflows or continuous blowdown wastewater.
• Consider using onsite alternative water sources to supply water for use in the fume hood. See Section 8: Onsite Alternative Water Sources for more information.
For optimum perchloric acid wash-down system efficiency, use systems only when necessary for perchloric acid handling.
Retrofit OptionsThere are currently no retrofit options available on the market to increase the effi-ciency of fume hood filtration systems.
For facilities requiring a perchloric acid wash-down system, it might be feasible to retrofit the system with shut-off valves to control the flow of water. However, facili-ties should be sure to follow manufacturer-provided instructions for perchloric acid wash-down systems and facility health and safety guidelines to ensure that any changes will not affect health and safety or the performance of the system.
47 University of Louisville. 2012. Laboratory Chemical Hood User’s Guide. louisville.edu/dehs/ohs/fumehoods/users_guide.html.
7.6 Fume Hood Filtration and Wash-Down Systems

October 2012 7-31
Replacement OptionsWhen purchasing a new fume hood filtration system or perchloric acid wash-down sys-tem or replacing older equipment, consider the replacement options outlined below.
Fume Hood Filtration System Replacement
For facilities that need a fume hood filtration system, consider installing a gas-phase filtration system, such as activated carbon, that does not require water consump-tion. Replacing an existing fume hood wet scrubber system with an adsorbent dry filter system will eliminate water used to trap and contain hazardous substances. Because these systems require a consistent check on contaminant concentrations and maintenance of the adsorbent, these factors should be taken into account as an alternative to fume hood wet scrubber systems. Particulate filtration might also be considered, depending upon the type of contaminants present. Keep in mind the contaminant and concentration that needs to be removed to ensure that the hazard is fully abated.48,49
Keep in mind that a wet scrubber is sometimes necessary for the handling of highly toxic contaminants. Adsorbent dry filters should not be used if safety will be compro-mised as a result.
Perchloric Acid Wash-Down Retrofit or Replacement
For facilities requiring a perchloric acid wash-down system, consider a system with automatic shut-off valves, which limit the amount of water used during the wash-down process by controlling the duration of the wash-down cycle. Water savings will be dependent upon the reduction in wash-down cycle length and the flow rate of the wash-down sprayers.
Savings PotentialSufficient information is not available to estimate the savings potential associated with these products.
Additional ResourcesEast Bay Municipal Utility District. 2008. WaterSmart Guidebook—A Water-Use Efficien-cy Plan Review Guide for New Businesses. Page MED4. www.ebmud.com/for- customers/conservation-rebates-and-services/commercial/watersmart-guidebook.
Hitchings, Dale T. September 1993-January 1994. “Fume Hood Scrubbers—Parts I, II, and III.” Laboratory Building Design Update. www.safelab.com/resources.htm.
Lab Manager Magazine. Fume Hood Homepage. www.labmanager.com/?articles.list/categoryNo/2042/category/Fume-Hoods.
48 National Research Council, op. cit.49 Hitchings, Dale T., op. cit., Page 6.
7.6 Fume Hood Filtration and Wash-Down Systems
http://www.ebmud.com/for-customers/conservation-rebates-and-services/commercial/watersmart-guidebook
7-32 October 2012
National Research Council, et al. 1995. Prudent Practices in the Laboratory—Handling and Disposal of Chemicals. Washington, DC: National Academy Press. Page 188. www.nap.edu/openbook.php?record_id=4911&page=188.
University of Louisville. 2012. Laboratory Chemical Hood User’s Guide. louisville.edu/dehs/ohs/fumehoods/users_guide.html.
7.6 Fume Hood Filtration and Wash-Down Systems

WaterSense at Work: Best Management Practices for Commercial and Institutional Facilities 7-33
7.7 Vivarium Washing and Watering Systems
OverviewVivariums, or animal research laboratories, utilize water-using equipment for clean-ing and animal watering purposes. This equipment includes cage, rack, bottle, and tunnel washers and automatic animal watering systems. Washers can use large volumes of water based on the number of rinse cycles and water used during each cycle. Animal watering systems can use large volumes of water if constant flows or frequent flushing is required.
Cage, Rack, Bottle, and Tunnel Washers
Cage, rack, and bottle washers are batch-type washers that are front-loaded with washer racks. Traditional cage-and-rack washers are programmed with a pre-rinse, wash, and final rinse cycle. During each cycle, the unit can use between 40 and 60 gallons of hot water. In addition, many washers have optional cold-water tempering systems that cool the wastewater from each cycle to ensure that the discharge water temperature does not exceed sanitary sewer requirements. Accounting for water use in all cycles, traditional cage-and-rack washers can use as much as 320 to 480 gallons of water per load.50 More recent models of cage-and-rack washers use less water per cycle and allow users to choose the number of rinse cycles to minimize total water use. Some units also allow water from the final rinse cycle to be reused in the next cycle. More recent units can use less than 50 gallons per cycle, and some use as little as 12 gallons per cycle.51
Tunnel washers are conveyor-type washers that are capable of cleaning a number of cages, racks, and other laboratory accessories at once. Tunnel washers are typically found only in very high throughput vivarium operations. There are four main cycles in the tunnel washer: pre-rinse, wash, first rinse, and final rinse. The final rinse uses only fresh water, while the other cycles can use water recycled from the wash, first rinse, or final rinse. Starting with the final rinse cycle, water moves countercurrent within the tunnel washer and is disposed of after the pre-rinse cycle. Because tunnel washers are designed for high throughput, they are not necessarily more efficient than batch-type washers for smaller operations.
Animal Watering Systems
Automatic animal watering systems provide drinking water to laboratory animals. These systems are used instead of manually filling bottles. There are two types of ani-mal watering equipment, which differ in their method of bacterial buildup prevention: flushing animal watering systems and recirculating animal watering systems. Flush-ing animal watering systems use a periodic, high-pressure flow to “flush” and remove bacteria from piping. Residual chlorination is typically used to further control bacterial growth. To control bacteria, recirculating animal watering systems use a constant flow of water treated with ultraviolet disinfection or other methods before distribution for
50 Beckinghausen, David. October 1, 2006. “Energy-Efficient Washing Systems.” ALN Magazine. www.alnmag.com/article/energy-efficient-washing-systems.51 Ibid.

7-34 October 2012
7.7 Vivarium Washing and Watering Systems
animal watering. Flushing systems use more water than recirculating systems because water is discharged to the drain after the flushing cycle is complete.52
Automatic water systems require regular observation of the systems and the animals. If not maintained properly, they pose the risk of flooding cages or clogging valves. They do not allow for monitoring of animal water intake. Before choosing an auto-matic watering system, these issues should be taken into account.53
Operation, Maintenance, and User EducationTo ensure that cage, rack, bottle, tunnel washers, and animal watering systems are using water most efficiently, consider the following operation, maintenance, and user education tips for each.
Cage, Rack, Bottle, and Tunnel Washers
• Only run cage, rack, and bottle washers when they are full. For tunnel washers, schedule wash runs to maximize the equipment washed during each run, there-by reducing the amount of tunnel wash runs required per day.
• Operate the cage, rack, bottle, and tunnel washers near or at the minimum flow rate recommended by the manufacturer.
• If the number of rinse cycles can be chosen, use the fewest number of rinse cycles necessary to effectively clean equipment.
• Fix and repair any leaks. Inspect valves and rinse nozzles for proper operation, and repair worn nozzles.
Animal Watering Systems
• For animal watering systems that use flushing, minimize the number of flushing cycles while ensuring sufficient control of bacterial growth.
• Consider collecting and reusing wastewater from animal watering systems for other purposes within the facility, matching the end use with the level of water quality that exists or that can be achieved through water treatment.
Retrofit OptionsFor animal watering systems, consider adding a recirculation system; however, it should be noted that for this purpose, piping and a water purification system will be required to treat and return the unused water.
52 Schultz, Carl C. March 1, 2006. “Re-circulating vs. Flushing: Animal Watering System Alternatives.” ALN Magazine. www.alnmag.com/article/re-circulating-vs-flushing-animal-watering-system-alternatives.
53 Cosgrove, Chris, et al. July 1, 2003. “Vivarium Automation Part 1.” ALN Magazine. www.alnmag.com/article/vivarium-automation-part-1?page=0,0.

October 2012 7-35
7.7 Vivarium Washing and Watering Systems
Replacement OptionsWhen purchasing a new cage, rack, bottle, or tunnel washer or replacing existing equipment, look for models that use less water per load with the following features:
• Cycle selection that allows users to choose fewer rinse cycles • Reuse of final rinse water as wash water for the next load • Water intake monitoring to adjust the amount of water used based on load size • Use of high-quality water only during the final rinse cycle
As an alternative to automatic animal watering systems, manual bottle fillers use only as much water as the animals need for drinking purposes. Where automatic animal watering systems are used, consider systems that recirculate treated water when purchasing new equipment.
Savings PotentialCage, rack, bottle, or tunnel washers can be replaced with more efficient equipment to save water. Retrofitting or replacing existing animal watering equipment will also achieve water savings.
To estimate facility-specific water savings and payback, use the following information.
Cage, Rack, Bottle, or Tunnel Washer Replacement
Washers can be replaced with new, more water-efficient technologies that reduce the amount of water used during rinse and wash cycles and reuse rinse water in the next wash cycle. These more efficient models can use up to 90 percent less water per load than older, conventional models.54
Current Water Use
To estimate the current water use of an existing cage, rack, bottle, or tunnel washer, identify the following information and use Equation 7-11:
• The washer’s water efficiency in gallons per load. This is typically provided by the manufacturer through product literature or a website. The water efficiency will be dependent upon the flow rate of each rinse or wash cycle, duration of each cycle, and number of cycles.
• Average number of loads per day.
• Days of operation per year.
54 Beckinghausen, David, op. cit.

7-36 October 2012
Equation 7-11. Water Use of Cage, Rack, Bottle, or Tunnel Washer (gallons per year)
= Water Efficiency x Number of Loads x Days of Operation
Where:
• Water Efficiency (gallons per load) • Number of Loads (number of loads per day) • Days of Operation (days of cage, rack, bottle, or tunnel washer opera-
tion per year)
Water Use After Replacement
To estimate the water use after replacing an existing cage, rack, bottle, or tunnel washer, use Equation 7-11, substituting the water efficiency of the replacement washer. The water efficiency of the replacement washer should be provided by the product manufacturer. More recent models of washers can use up to 90 percent less water per load when compared to older, less efficient units by reusing rinse water and having shorter rinse and wash cycles. If the number of rinse cycles can be se-lected, base the water use on the water efficiency associated with the average fewest number of rinse cycles needed for effective washing operations.
Water Savings
To calculate the water savings that can be achieved from replacing an existing cage, rack, bottle, or tunnel washer, identify the following information and use Equation 7-12:
• Current water use as calculated using Equation 7-11. • Water use after replacement as calculated using Equation 7-11.
Equation 7-12. Water Savings From Cage, Rack, Bottle, or Tunnel Washer Replacement (gallons per year)
= Current Water Use of Cage, Rack, Bottle, or Tunnel Washer – Water Use After Cage, Rack, Bottle, or Tunnel Washer Replacement
Where:
• Current Water Use of Cage, Rack, Bottle, or Tunnel Washer (gallons per year)
• Water Use After Cage, Rack, Bottle, or Tunnel Washer Replacement (gallons per year)
7.7 Vivarium Washing and Watering Systems

October 2012 7-37
7.7 Vivarium Washing and Watering Systems
Payback
To calculate the simple payback from the water savings associated with the cage, rack, bottle, or tunnel washer replacement, consider the equipment and installation cost of the replacement washer, water savings as calculated in Equation 7-12, and the facility-specific cost of water and wastewater.
Because cage, rack, bottle, and tunnel washers use hot water, a reduction in water use will also result in energy savings, further reducing the payback period and in-creasing replacement cost-effectiveness.
Animal Watering System Retrofit or Replacement
Water savings from retrofitting or replacing a flushing automatic animal watering system with a recirculating automatic animal watering system will vary based on how much water can be recirculated. Facility managers should use their judgment when deciding whether potential water savings merit the equipment and installation cost of the retrofit or replacement.
Additional ResourcesBeckinghausen, David. October 1, 2006. “Energy-Efficient Washing Systems.” ALN Magazine. www.alnmag.com/article/energy-efficient-washing-systems.
Cosgrove, Chris, et al. July 1, 2003. “Vivarium Automation Part 1.” ALN Magazine. www.alnmag.com/article/vivarium-automation-part-1?page=0,0.
EPA and DOE, Energy Efficiency & Renewable Energy, Federal Energy Management Program. May 2005. Laboratories for the 21st Century: Best Practices, Water Efficiency Guide for Laboratories. Pages 6-7. www1.eere.energy.gov/femp/program/labs21_bmp.html.

7-38 WaterSense at Work: Best Management Practices for Commercial and Institutional Facilities
7.8 Photographic and X-Ray Equipment
OverviewThe traditional process of developing film can be quite water-intensive. Water is used during both the image development and printing processes. In X-ray equipment, water is sometimes also used for equipment cooling. Some X-ray film processing machines require a constant stream of cooling water flowing at a rate from 0.5 to 2.5 gallons per minute (gpm)55 to as much as 3.0 to 4.0 gpm56 to ensure acceptable image qual-ity. Cooling water with a flow rate as low as 0.5 gpm can discharge more than 250,000 gallons of water annually. A number of advancements in X-ray technology, including digital imaging, however, are reducing the need for this water-intensive process.
For more traditional film processing, developing and printing can occur in a self- contained “mini-lab” with very little water use.57 These changes also reduce or eliminate the need to use chemicals in film processing. Dry printing processes similar to laser printing are also available that do not use water.
Because of recent advances in imaging technology, many facilities have moved to digital photographic or X-ray film processing and computerized viewing and printing. Digital imaging has changed the means by which images are recorded and printed and elimi-nated the use of water entirely. X-ray equipment found at dental of-fices and other places where small pictures are taken use very little water for development. A typical dental office “wet” film processor uses under 1.0 gallon of water per day.
If converting to digital imaging is not feasible, retrofitting existing equipment to recycle the final rinse effluent as make-up for the developer/fixer solution can be a cost-effective option to significantly reduce photographic or X-ray film processing water use.
Operation, Maintenance, and User EducationFor optimum traditional photographic and X-ray equipment efficiency, consider the following tips:58
• Adjust the water flow to the film processor to flow at the minimum acceptable flow rate specified by the equipment manufacturer. Post minimum flow rates near the processor and educate users on how to adjust and operate the equipment.
• Check the solenoid valve on the X-ray equipment cooling water to ensure it is working properly and stop flow when the equipment is in standby mode. If nece-ssary, install a flow meter in the supply line to monitor flow from the equipment.
55 East Bay Municipal Utility District (EBMUD). 2008. WaterSmart Guidebook—A Water-Use Efficiency Plan Review Guide for New Businesses. Pages PHOTO1-8. www.ebmud.com/for-customers/conservation-rebates-and-services/commercial/watersmart-guidebook.
56 U.S. Environmental Protection Agency (EPA) and U.S. Energy Department (DOE), Energy Efficiency & Renewable Energy (EERE), Federal Energy Management Program (FEMP). May 2005. Laboratories for the 21st Century: Best Practices, Water Efficiency Guide for Laboratories. Page 6. www1.eere.energy.gov/femp/program/labs21_bmp.html.
57 EBMUD, op. cit.58 EPA and DOE, EERE, FEMP, op. cit.

October 2012 7-39
7.8 Photographic and X-Ray Equipment
• For X-ray equipment in particular, turn off the cooling water flow when the unit is not in use.
Retrofit OptionsTo reduce the water use associated with traditional photographic or X-ray equip-ment, the primary retrofit option is to install a recycling system, which recycles the final rinse effluent as make-up for the developer/fixer solution.59 An automatic shut-off valve can also be installed to turn off the flow of water when the unit is not in use. For these retrofits, it is essential to follow prescribed maintenance schedules in order to maintain water savings.
Replacement OptionsWhen looking to purchase new photographic or X-ray equipment or to replace older equipment, consider digital X-ray and photography equipment and computerized laser or ink-jet printing options.
If transitioning to digital equipment is not feasible, look for equipment with a squee-gee that removes excess chemicals from the film. The squeegee can reduce chemi-cal carryover and the amount of water needed for the wash cycle.60 If replacing a traditional wet printing, high-rinse flow system, consider a mini-lab system. Mini-labs provide a “washless” or “plumbingless” film development process. In these systems, wet chemical solutions are added only as needed for the amount of film being pro-cessed. A reservoir captures spent chemical solutions, which can be recovered and recycled.61 It should be noted that mini-labs do not work for large frame X-ray film. They are for small camera picture prints only.
Savings PotentialReplacing traditional X-ray film processing equipment with digital imaging equip-ment will eliminate water use entirely, but it might not be cost-effective for every facility due to the high cost of the new equipment. Digital equipment, however, provides other advantages in addition to water savings, such as ease of use and im-age transfer and storage.62 If converting to digital imaging is not feasible, retrofitting existing equipment to recycle the final rinse effluent as make-up for the developer/fixer solution can be a cost-effective option.
Retrofitting traditional X-ray equipment with a recycling system has been shown to save 500,000 to 1,600,000 gallons of water per year per X-ray film processor,63 based on studies conducted by several water utilities in California.
59 Ibid.60 Ibid.61 EBMUD, op. cit.62 Alliance for Water Efficiency. X-ray Film Processors Introduction. www.allianceforwaterefficiency.org/X-ray_Film_Processors.aspx.63 Koeller, John, et al. August 2004. A Report on Potential Best Management Practices. Prepared for the California Urban Water Conservation Council. Pages 16-22.
www.cuwcc.org/products/pbmp-reports.aspx.

7-40 October 2012
Additional ResourcesAlliance for Water Efficiency. X-ray Film Processors Introduction. www.allianceforwaterefficiency.org/X-ray_Film_Processors.aspx.
East Bay Municipal Utility District. 2008. WaterSmart Guidebook—A Water-Use Efficiency Plan Review Guide for New Businesses. Pages PHOTO1-8. www.ebmud.com/for- customers/conservation-rebates-and-services/commercial/watersmart-guidebook.
Koeller, John, et al. August 2004. A Report on Potential Best Management Practices. Prepared for the California Urban Water Conservation Council. Pages 16-22. www.cuwcc.org/products/pbmp-reports.aspx.
EPA and DOE, Energy Efficiency & Renewable Energy, Federal Energy Management Pro-gram. May 2005. Laboratories for the 21st Century: Best Practices, Water Efficiency Guide for Laboratories. Page 6. www1.eere.energy.gov/femp/program/labs21_bmp.html.
7.8 Photographic and X-Ray Equipment
http://www.ebmud.com/for-customers/conservation-rebates-and-services/commercial/watersmart-guidebook

Onsite Alternative Water Sources

8-2 WaterSense at Work: Best Management Practices for Commercial and Institutional Facilities
8. Onsite Alternative Water Sources
After implementing water-efficiency measures through facility modifications or efficient technologies, facilities can further reduce potable water use by taking advantage of onsite alternative water sources. An onsite alternative water source is the water discharge from one application or process that is captured, treated, and utilized in another application.1 These onsite alternative water sources can vary greatly in quality and must be carefully matched with an appropriate end use. The U.S. Environmental Protection Agency (EPA) has developed comprehensive guidelines for water reuse to assist all types of organizations in identifying potential sources and uses of reused water.2,3
Potential onsite alternative water sources include:4
• Rainwater/stormwater • Foundation drain water • Treated gray water • Condensate from air conditioning equipment • Filter and membrane (e.g., reverse osmosis system)
reject water • Cooling equipment blowdown
Although discharge from single-pass cooling systems can be a suitable onsite alternative water source, facility manag-ers should first consider eliminating single-pass cooling, as described in Section 6.2: Single-Pass Cooling. If elimination is not feasible, then consider reuse of the discharge water for another purpose.
Potential uses of onsite alternative water sources include:5
• Irrigation • Cooling tower make-up water • Toilet and urinal flushing • Make-up water for decorative ponds, fountains, and waterfalls • Processes or other uses not requiring potable water • Fume hood scrubbers
General considerations for reuse of onsite sources of water include the quality con-straints of the source and the potential types of treatment that may be needed to meet the quality needs of the proposed end use. Although every situation is differ-ent, Tables 8-16 and 8-27 provide guidance on typical considerations.
1 U.S. Energy Department (DOE), Energy Efficiency & Renewable Energy (EERE), Federal Energy Management Program (FEMP). February 2011. Methodology for Use of Reclaimed Water at Federal Locations. www1.eere.energy.gov/femp/program/waterefficiency_bmp14.html#resourceswww1.eere.energy.gov/femp/pdfs/ reclaimed_water_use.pdf.
2 U.S. Environmental Protection Agency (EPA). October 2012. Guidelines for Water Reuse. water.epa.gov/infrastructure/sustain/availability_wp.cfm.3 EPA. September 2004. Guidelines for Water Reuse. water.epa.gov/infrastructure/sustain/availability_wp.cfm.4 East Bay Municipal Utility District (EBMUD). 2008. WaterSmart Guidebook—A Water-Use Efficiency Plan Review Guide for New Businesses. Pages ALT1-8.
www.ebmud.com/for-customers/conservation-rebates-and-services/commercial/watersmart-guidebook.5 Ibid.6 Adapted from Hoffman, H.W. (Bill). P.E. Water Management, Inc. January 25-26, 2011. Presentation in Phoenix, Arizona, to the Arizona Municipal Water Users As-
sociation.7 Ibid.
Rainwater collection system

October 2012 8-3
8. Onsite Alternative Water Sources
Table 8-1. Water Quality Considerations for Onsite Alternative Water Sources*
Possible Sources
Level of Water Quality Concern
Sediment
Total Dissolved
Solids (TDS)
Hardness
Organic Biological
Oxygen Demand (BOD)
Pathogens (A)
Other Considerations
RainwaterLow/
MediumLow Low Low Low None
Stormwater High Depends Low Medium MediumPesticides and fertilizers
Air Handling Condensate
Low Low Low Low MediumMay contain copper when coil cleaned
Cooling Tower Blowdown
Medium High High Medium MediumCooling tower treatment chemicals
Reverse Osmosis and Nanofiltration Reject Water
Low High High Low LowHigh salt content
Gray Water High Medium Medium High HighDetergents and bleach
Foundation Drain Water
Low Depends Depends Medium MediumSimilar to stormwater
Note: The use of single-pass cooling water is also a possible source of clean onsite water, but facility managers should first consider elimi-nating single-pass cooling because of its major water-wasting potential. For that reason, it is not included in the list.
*Key:Low: Low level of concernMedium: Medium level of concern; may need additional treatment depending on end useHigh: High concentrations possible and additional treatment likelyDepends: Dependent upon local conditions (A): Disinfection for pathogens is recommended for all water used indoors for toilet flushing or other uses

8-4 October 2012
Table 8-2. Types of Available Treatment Based on Intended End Use Quality Needs*
Possible Sources
Filtration Sedimentation DisinfectionBiological Treatment
Other Treatment
Considerations
Rainwater Depends Depends Depends NoMay be used for irrigation without additional treatment
Stormwater Yes Depends Depends DependsFor non-potable use only
Air Handling Condensate
No No Yes NoSegregate coil cleaning water
Cooling Tower Blowdown
Depends Depends No NoConsider TDS monitoring
Reverse Osmosis and Nanofiltration Reject Water
No No No NoConsider TDS monitoring
Gray Water No Depends No Depends
Biologically unstable for long periods of storage unless treated; subsurface drip irrigation requires the least treatment
Foundation Drain Water
Depends No Depends NoMay be hard if in alkaline soils
*KeyYes: Level of treatment likely neededNo: Level of treatment not likely neededDepends: Treatment depends upon ultimate use
See Figure 8-1 for an example of a facility capturing and using various onsite alterna-tive water sources.
Note: This section concentrates on onsite water sources that might be used or re-used. This is in no way intended to diminish the significant potential that the reuse of reclaimed water from municipal wastewater treatment facilities has to help reduce potable water use. Municipally supplied reclaimed water should always be consid-ered for appropriate uses where available.
8. Onsite Alternative Water Sources

October 2012 8-5
Best PracticesFollowing are the first questions to evaluate when planning to use an onsite alterna-tive water source:
• Are there end use(s) that can be substituted or supplemented with the onsite alternative water source?
• What are the volume requirements of the end use, particularly if the demand is seasonal in nature? Can the onsite alternative water source be matched to meet the demand of the end use in terms of quantity and availability?
• What are the water quality requirements of the end use? Can the onsite alterna-tive water source meet those requirements?
8. Onsite Alternative Water Sources
Onsite Alternative Water Sources Case Study
To learn how the University of Texas at Austin used onsite alternative water sources to reduce its po-table water use by more than 33 percent, read the case study in Appendix A.
Air Handler Units
Air HandlerCondensate
RO Reject
Roof Drains CoolingTower
Toilets&
Urinals
CoolingTowerMake-
Up
Outdoor Landscape
RO Units
PressurizedHolding
Tank
Overflowto
Stormdrain
SedimentTank
HoldingTank
Figure 8-1. Examples of Onsite Alternative Water Use

8-6 October 2012
• What treatment of the onsite source is necessary? Note that most alternative water sources will require treatment of some kind, ranging from simple filtration to full treatment in compliance with NSF International/American National Stan-dards Institute (NSF/ANSI) 350, Onsite Residential and Commercial Reuse Treatment Systems.
• What are the basic design factors for capturing and delivering the onsite alterna-tive water source to the end use? This includes the proximity of the source to the end use and piping, tanks, and construction that may be necessary to convey the water.
Because facilities’ ability to capture and convey onsite alternative water sources var-ies, carefully evaluate the feasibility of using each source to determine the cost im-plications and payback periods.8 Guidance on the construction, alteration, and repair of alternative water source systems for non-potable water applications is provided in the International Association of Plumbing and Mechanical Officials Green Plumbing & Mechanical Code Supplement.9 Specific considerations for certain onsite alternative water sources are provided below.
Rainwater
Facilities with large areas of impervious cover can capture rainfall for use in non-potable applications. Rainwater that runs off of rooftops is typically of high quality, making it suitable for many end uses. In most facilities, it is used to supplement or replace irrigation water with little treatment or filtering.
To estimate the amount of rainwater that can be captured for each rain event, a good rule of thumb is to assume that 0.62 gallons of water can be collected per square foot of collection surface area per inch of rainfall. Most rainwater collection system installers will assume a capture efficiency of 80 percent, because some of the rainwa-ter is lost through evaporation, splashing, or other means.10 Equation 8-1 provides a calculation for rainfall capture potential.
Equation 8-1. Annual Rainfall Capture Potential (gallons per year)
= Roof Area x Annual Precipitation x Rainfall Capture per Roof Area (0.62) x Collection Efficiency (0.8)
Where:
• Roof Area (square feet) • Annual Precipitation (inches per year) • Rainfall Capture per Roof Area (0.62 gallons per square foot per inch of
rain) • Collection Efficiency (80 percent)
8. Onsite Alternative Water Sources
8 EBMUD, op. cit.9 International Association of Plumbing and Mechanical Officials. February 2010. Green Plumbing & Mechanical Code Supplement. Pages 13-26.
www.iapmo.org/pages/iapmo_green.aspx. 10 EBMUD, op. cit.

October 2012 8-7
11 DOE, EERE, FEMP. Best Management Practice: Alternate Water Sources. www1.eere.energy.gov/femp/program/waterefficiency_bmp14.html.12 EBMUD, op. cit.13 Alliance for Water Efficiency (AWE). Graywater Introduction.14 Ibid.
Rainwater collection systems can be practical in all regions of the country, including those that experience frequent precipitation and more arid regions where water sup-plies are scarce. The major components of a rainwater collection system include:11
• Roofs or surfaces where rainwater can be collected • Gutters and downspouts to transport the rainwater to storage • Gutter screens to remove debris • Storage tanks (cisterns) • Conveyance systems to deliver stored water • Water treatment, depending upon end use quality requirements
Rainwater that runs off of non-roof surfaces, such as parking lots, hardscapes, and landscapes, around a building can also be a good source of water for landscape irrigation, provided it can be captured, treated, and stored. Generally, this collected water can be captured and distributed from onsite features, such as berms, swales, or rain gardens, or can be diverted to a long-term storage detention pond, where the water can be pumped for landscape irrigation or other uses.12 The quality of rainwater collected from the ground is much more variable than that collected from rooftops, because it can pick up pollutants as it travels across the landscape. It is important to carefully consider the water quality needs of the end use or provide appropriate treatment before rainwater is used.
Treated Gray Water
Gray water is wastewater from lavatory sinks, laundries, and bathing. It never con-tains wastewater from toilets or urinals and excludes wastewater from kitchen sinks.13 Gray water can be treated and reused for specific onsite applications; however, health and safety concerns must be considered. Treated gray water should always be used within 24 hours of collection, or otherwise properly disposed, because it can foster bacteria and pathogens. If treated gray water is used for irrigation, it should only be applied below the surface and should never be used on plants intended for human consumption or sprayed through conventional sprinkler heads where it has the potential to be inhaled.14
The use of treated gray water as an onsite alternate water source requires a careful, site-specific analysis. Gray water is usually coarsely filtered to remove large, sus-pended solids and, when used for indoor purposes, is usually further sanitized with chemicals such as chlorine. The lowest level of treatment is typically sufficient for subsurface irrigation applications. More intensive treatment is necessary for other applications, including toilet and urinal flushing or above-ground irrigation. If con-sidering installing a graywater treatment system, consult local health department officials first to ensure that the system meets appropriate regulations. Also, consult the manufacturers of the fixtures and equipment to which non-potable water is to be delivered to determine under what conditions those items can function with treated gray water and what impact such use will have on fixture and equipment warranties.
8. Onsite Alternative Water Sources

8-8 October 2012
NSF/ANSI 350, Onsite Residential and Commercial Reuse Treatment Systems, establishes the minimum materials, design and construction, and performance requirements for onsite residential and commercial reuse treatment systems. It also encompasses resi-dential wastewater treatment systems (i.e., those that treat all the wastewater flow from a residence, similar to the scope of NSF/ANSI Standards 40 and 245) and those that treat the gray water portion only. Further, gray water systems can be evaluated for treating bathing water only, laundry water only, or both. Reuse applications of the treated effluent include indoor restricted urban water use, such as toilet and urinal flushing, and outdoor unrestricted urban water use, such as surface irrigation.15
Condensate From Air Conditioning Equipment
Water vapor in the air condenses as it comes into contact with an air conditioner’s cooling coils. This condensate must be removed to prevent water from damaging the equipment or building structure. Most often, the condensate is captured in a drip pan, where it is then discharged to the sewer system.
The amount of condensate generated depends upon the cooling load, relative humidity, and make-up air volumes.16 Condensate generation ranges from three to 10 gallons per day per 1,000 square feet of air conditioned space, depending on the type of building and air conditioning system.17 Condensate is generally high-quality and free of minerals and total dissolved solids (TDS). It is also generated in highest volumes during periods of high cooling loads, making it a good source for cooling tower make-up water. For more information on cooling towers, see Section 6.3: Cool-ing Towers.
Condensate is generally safe without additional treatment for direct use in cooling towers with biocide control, or for subsurface irrigation. However, condensate can grow bacteria removed from the air in the building. If the condensate is used for anything where humans can inhale it or come into direct contact with it (e.g., spray irrigation), it should first be filtered and disinfected.
Reverse Osmosis System Reject Water
Water treatment systems, such as reverse osmosis (RO) systems that use filters and membranes to remove impurities, will have a residual stream that remains after the purified water has been permeated through the membrane. Most RO systems have a recovery rate between 50 and 75 percent, meaning that 25 to 50 percent of the in-coming water remains as residual and is rejected from the system.18 This reject water is less pure than the source water entering the system but may still be useable for other purposes.19
15 NSF International. NSF/ANSI Standards. July 2011. NSF/ANSI 350, Onsite Residential and Commercial Reuse Treatment Systems. www.nsf.org/business/wastewater_certification/standards.asp?program=WastewaterCer#std350.
16 EBMUD, op cit.17 AWE. Condensate Water Introduction. www.allianceforwaterefficiency.org/Condensate_Water_Introduction.aspx.18 EPA and DOE, EERE, FEMP. May 2005. Laboratories for the 21st Century: Best Practices, Water Efficiency Guide for Laboratories. Page 5.
www1.eere.energy.gov/femp/program/labs21_bmp.html. 19 AWE. RO Discharge Water Introduction. www.allianceforwaterefficiency.org/RO_Discharge_Introduction.aspx?terms=alternate+water+source.
8. Onsite Alternative Water Sources

October 2012 8-9
Reject water is typically sent directly to the sanitary sewer, although it is often suit-able for use in other onsite applications. As long as sanitary conditions are main-tained for storage and transfer, reject water can be appropriate for end uses requiring higher water quality, including: toilet and urinal flushing; cooling tower make-up water; above-ground irrigation; make-up water for decorative ponds, fountains, and waterfalls; or other processes or uses not requiring potable water.20 If used for irriga-tion water, it should only be applied to plants with high salinity tolerances, due to elevated levels of TDS. In addition, if this water is to be used as cooling tower make-up water, compare the TDS concentration in the source to the cooling tower TDS set point, to make sure that it provides a benefit as make-up water to the system.
Cooling Equipment Blowdown
As water is evaporated from cooling equipment, the concentration of TDS builds up. If left undiluted, the TDS can cause scaling on equipment surfaces. As a result, some of the water remaining in the cooling equipment must be periodically blown down and replaced with make-up water. Cooling equipment that requires blowdown can include cooling towers, evaporative air condensers, evaporative coolers, and evapo-rative cooled air conditioners.21
Although cooling equipment blowdown is typically discharged to the sanitary sewer, it is often of sufficient quality to be used in other onsite applications such as irriga-tion. It should be noted that the TDS content is significantly higher than that of the original source water, often by two to five times. In addition, the water could con-tain algae, bacteria, or pathogens and water treatment chemicals, such as biocides or corrosion inhibitors. For these reasons, this water should never be used where it can come into contact with humans. In addition, if the cooling equipment is using water very efficiently, the TDS content could be too high for use in irrigation, unless it is diluted with water from another source.22 Blowdown could be treated through nanofiltration or RO to make it suitable for other uses, particularly for recycling as make-up water for the cooling equipment. Facility managers should carefully assess the possible impacts of using this water on equipment, fixtures, or plants.
Additional ResourcesAlliance for Water Efficiency (AWE). Blow-Down Water Introduction. www.allianceforwaterefficiency.org/blow_down_water_introduction.aspx.
AWE. Condensate Water Introduction. www.allianceforwaterefficiency.org/Condensate_Water_Introduction.aspx.
AWE. Graywater Introduction. www.allianceforwaterefficiency.org/graywater-introduction.aspx.
AWE. RO Discharge Water Introduction. www.allianceforwaterefficiency.org/RO_Discharge_Introduction.aspx?terms=alternate+water+source.
20 Ibid. 21 AWE. Blow-Down Water Introduction. www.allianceforwaterefficiency.org/blow_down_water_introduction.aspx.22 Ibid.
8. Onsite Alternative Water Sources
8-10 October 2012
DOE, Energy Efficiency & Renewable Energy, Federal Energy Management Program (FEMP). Best Management Practice: Alternate Water Sources. www1.eere.energy.gov/femp/program/waterefficiency_bmp14.html.
DOE, Energy Efficiency & Renewable Energy, FEMP. February 2011. Methodology for Use of Reclaimed Water at Federal Locations. www1.eere.energy.gov/femp/program/waterefficiency_bmp14.html#resources.
East Bay Municipal Utility District. 2008. WaterSmart Guidebook—A Water-Use Efficiency Plan Review Guide for New Businesses. Pages ALT1-8. www.ebmud.com/for-customers/conservation-rebates-and-services/commercial/watersmart-guidebook.
EPA. October 2012. Guidelines for Water Reuse. water.epa.gov/infrastructure/sustain/availability_wp.cfm.
EPA. September 2004. Guidelines for Water Reuse. water.epa.gov/infrastructure/sustain/availability_wp.cfm.
International Association of Plumbing and Mechanical Officials. February 2010. Green Plumbing & Mechanical Code Supplement. Pages 13-26. www.iapmo.org/pages/iapmo_green.aspx.
NSF International. NSF/ANSI Standards. July 2011. NSF/ANSI 350, Onsite Residential and Commercial Reuse Treatment Systems. www.nsf.org/business/wastewater_certification/standards.asp?program=WastewaterCer#std350.
8. Onsite Alternative Water Sources

Resources

9-2 WaterSense at Work: Best Management Practices for Commercial and Institutional Facilities
9. Resources
Compilation of Water-Efficiency ResourcesAlliance for Water Efficiency (AWE). www.allianceforwaterefficiency.org.
American Society of Heating, Refrigerating, and Air Conditioning Engineers (ASHRAE). www.ashrae.org.
American Society of Landscape Architects. www.asla.org.
American Society of Mechanical Engineers (ASME). 1994. Consensus Operating Practices for Control of Feedwater/Boiler Water Chemistry in Modern Industrial Boilers.
American Water Works Association (AWWA). 1999. Water Meters—Selection, Installa-tion, Testing, and Maintenance (AWWA Manual M6, Fourth Edition). apps.awwa.org/eBusMAIN/Default.aspx?TabID=401&ProductId=28471.
Arizona Department of Water Resources. Conservation Tools. www.azwater.gov/ azdwr/StatewidePlanning/Conservation2/CommercialIndustrial/FacilityManagers.htm.
Arizona Municipal Water Users Association. Regional Water Conservation Committee and Black and Veatch. August 2008. Facility Manager’s Guide to Water Management Version 2.7. www.amwua.org/business.html.
ASHRAE. Standard 189.1, Standard for the Design of High-Performance, Green Buildings Except Low-Rise Residential Buildings. www.ashrae.org/publications/page/927.
ASME. Standards & Certification FAQ. www.asme.org/kb/standards/about-codes---standards.
AWWA. 2004. Sizing Water Service Lines and Meters (AWWA Manual M22, Second Edition). apps.awwa.org/eBusMAIN/Default.aspx?TabID=401&ProductId=6711.
AWWA. Water Loss Control Basics. www.awwa.org/Resources/WaterLossControl.cfm?ItemNumber=47847.
Beckinghausen, David. October 1, 2006. “Energy-Efficient Washing Systems.” ALN Magazine. www.alnmag.com/article/energy-efficient-washing-systems.
Brean, Henry. June 8, 2009. “UNLV professor targets ‘wasteful’ dipper wells.” Las Vegas Review-Journal. www.lvrj.com/news/47195482.html.
California Urban Water Conservation Council (CUWCC). Potential Best Management Practices (PBMP) Report. www.cuwcc.org/products/pbmp-reports.aspx.
Centers for Disease Control and Prevention and AWWA. 2012. Emergency Water Supply Planning Guide for Hospitals and Health Care Facilities. Atlanta: U.S. Department of Health and Human Services. www.cdc.gov/healthywater/emergency/drinking_ water_advisory/index.html#planningguide.

October 2012 9-3
Ceres. Ceres Aqua Gauge. www.ceres.org/issues/water/aqua-gauge/aqua-gauge.
City West Water Limited. Programs and Assistance. www.citywestwater.com.au/ business/programs_and_assistance_woking_the_way_to_water_savings.aspx.
Consortium for Energy Efficiency, Inc. www.cee1.org.
Cooling Technology Institute. www.cti.org.
Cosgrove, Chris, et al. July 1, 2003. “Vivarium Automation Part 1.” ALN Magazine. www.alnmag.com/article/vivarium-automation-part-1?page=0,0.
Council of Industrial Boiler Owners (CIBO). November 1997. CIBO Energy Efficiency Handbook. www.cibo.org/pubs/steamhandbook.pdf.
CUWCC. Resource Center. www.cuwcc.org/resource-center/resource-center.aspx.
Database of State Incentives for Renewables & Efficiency. PACE Financing. dsireusa.org/solar/solarpolicyguide/?id=26.
Denver Water. Xeriscape Plans. www.denverwater.org/Conservation/Xeriscape/ XeriscapePlans.
DOE, Energy Efficiency & Renewable Energy (EERE), Federal Energy Management Program (FEMP). Water Efficiency. www1.eere.energy.gov/femp/program/ waterefficiency.html.
DOE, Energy Efficiency and Renewable Energy, FEMP. April 2008. M&V Guidelines: Measurement and Verification for Federal Energy Projects, Version 3.0. Section 11.6. mnv.lbl.gov/keyMnVDocs/femp.
DOE, Energy Efficiency & Renewable Energy, FEMP. July 1999. Steam Trap Performance Assessment: Advanced technologies for evaluating the performance of steam traps. www1.eere.energy.gov/femp/pdfs/FTA_SteamTrap.pdf.
DOE, Energy Efficiency & Renewable Energy. January 2012. Minimize Boiler Blowdown. www1.eere.energy.gov/industry/bestpractices/pdfs/steam9_blowdown.pdf.
DOE, Energy Efficiency & Renewable Energy. January 2012. Return Condensate to Boiler. www1.eere.energy.gov/industry/bestpractices/pdfs/steam8_boiler.pdf.
DOE, Energy Efficiency & Renewable Energy. October 2005. Improving Chilled Water System Performance: Chilled Water Systems Analysis Tools (CWSAT) Improves Efficiency. www1.eere.energy.gov/manufacturing/tech_deployment/pdfs/chiller_tool.pdf.
East Bay Municipal Utility District (EBMUD). 2008. WaterSmart Guidebook—A Water-Use Efficiency Plan Review Guide for New Businesses. www.ebmud.com/for-customers/conservation-rebates-and-services/commercial/watersmart-guidebook.
Energy Design Resources. December 2009. Chilled Water Plant Design Guide. www.energydesignresources.com/resources/publications/design-guidelines/ designguidelines-cooltools-chilled-water-plant.aspx.
9. Resources
http://www.ebmud.com/for-customers/conservation-rebates-and-services/commercial/watersmart-guidebook

9-4 October 2012
9. Resources
Environment Agency of the United Kingdom. March 2006. Waterwise—good for business, great for the environment. www.energydesignresources.com/resources/publications/design-guidelines/design-guidelines-cooltools-chilled-water- plant.aspx.
EPA and DOE, EERE, FEMP. May 2005. Laboratories for the 21st Century: Best Practices, Water Efficiency Guide for Laboratories. www1.eere.energy.gov/femp/program/labs21_bmp.html.
EPA and DOE’s ENERGY STAR. www.energystar.gov.
EPA and DOE’s ENERGY STAR. 2007. ENERGY STAR Building Upgrade Manual. www.energystar.gov/index.cfm?c=business.bus_upgrade_manual.
EPA and DOE’s ENERGY STAR. Best Practices—How to Achieve the Most Efficient Use of Water in Commercial Food Service Facilities. www.energystar.gov/index.cfm?c=healthcare.fisher_nickel_feb_2005.
EPA and DOE’s ENERGY STAR. Portfolio Manager Overview. www.energystar.gov/ index.cfm?c=evaluate_performance.bus_portfoliomanager.
EPA. Environmental Management Systems (EMS). www.epa.gov/EMS/.
EPA. EPA’s Water Management Plans. www.epa.gov/oaintrnt/water/epa_plans.htm.
EPA. Green Infrastructure. water.epa.gov/infrastructure/greeninfrastructure/index.cfm.
EPA. GreenScapes Program. www.epa.gov/epawaste/conserve/rrr/greenscapes/ index.htm.
EPA. October 2012. Guidelines for Water Reuse. water.epa.gov/infrastructure/sustain/availability_wp.cfm.
EPA. September 2004. Guidelines for Water Reuse. water.epa.gov/infrastructure/sustain/availability_wp.cfm.
EPA’s WaterSense program. www.epa.gov/watersense.
EPA. The Lean and Water Toolkit. www.epa.gov/lean/environment/toolkits/water/index.htm.
Food Service Technology Center (FSTC). www.fishnick.com/.
FSTC. 2010. Water Conservation Measures for Commercial Food Service. www.fishnick.com/savewater/bestpractices.
Green Building Initiative. www.thegbi.org.
Harris, Richard. EBMUD. March 5, 2008. “Turning up the Heat on Commercial Kitchen Water Savings.” www.energystar.gov/ia/partners/downloads/meetings/water_ Richard_Harris.pdf.

October 2012 9-5
9. Resources
Hitchings, Dale T. September 1993-January 1994. “Fume Hood Scrubbers—Parts I, II, and III.” Laboratory Building Design Update. www.safelab.com/resources.htm.
International Association of Plumbing and Mechanical Officials (IAPMO). IAPMO Green. www.iapmo.org/pages/iapmo_green.aspx.
International Association of Plumbing and Mechanical Officials. 2010. “2010’s Top-5 New and Innovative Water Efficient Products.” Green Newsletter. forms.iapmo.org/newsletter/green/2010/05/2010_Top5.asp.
International Carwash Association.™ WaterSavers® Environmental Reports. www.carwash.org/industryinformation/WaterSavers/Pages/ WaterSaversEnvironmentalReports.aspx.
International Code Council. 2012 International Green Construction Code.™ www.iccsafe.org/Store/Pages/Product.aspx?id=3750S12.
International Facility Management Association Foundation. “Sustainability ‘How-To’ Guide” Series. www.ifmafoundation.org/research/how-to-guides.htm.
Irrigation Association. March 2005. Landscape Irrigation Scheduling and Water Man-agement. www.asla.org/uploadedFiles/PPN/Water%20Conservation/Documents/LISWM%20Draft.pdf.
Irrigation Association. Resources. www.irrigation.org/Resources/Resources_Splash.aspx.
Lab Manager Magazine. Fume Hood Articles. www.labmanager.com/?articles.list/ categoryNo/2042/category/Fume-Hoods.
Marin Municipal Water District. Conservation. www.marinwater.org/controller?action=menuclick&id=257.
National Association of Energy Service Companies. Resources—What is an ESCO? www.naesco.org/resources/esco.htm.
National Research Council; Commission on Physical Sciences, Mathematics, and Applications; Board on Chemical Sciences and Technology; Committee on Prudent Practices for Handling, Storing, and Disposal of Chemicals in Laboratories. 1995. Prudent Practices in the Laboratory—Handling and Disposal of Chemicals. Washington, DC: National Academy Press. www.nap.edu/openbook.php?record_id=4911&page=188.
North Carolina Department of Environment and Natural Resources, et al. May 2009. Water Efficiency Manual for Commercial, Industrial and Institutional Facilities. savewaternc.org/bushome.php.
North Carolina Division of Pollution Prevention and Environmental Assistance. May 2009. Water Efficiency, Water Management Options, Kitchen and Food Preparation. infohouse.p2ric.org/ref/04/03103.pdf.
NSF International. NSF/ANSI Standards. July 2011. NSF/ANSI 350, Onsite Residential and Commercial Reuse Treatment Systems. www.nsf.org/business/wastewater_ certification/standards.asp?program=WastewaterCer#std350.

9-6 October 2012
9. Resources
Pacific Gas and Electric Company. 2009. Hospitality Fact Sheet: Ozonated Laundry Systems in Hospital Facilities. www.pge.com/includes/docs/pdfs/mybusiness/energy savingsrebates/incentivesbyindustry/hospitality/Ozonated_Laundry_FS_Final.pdf.
Pacific Gas and Electric Company. Information Brief: Commercial Ice Machines. www.pge.com/includes/docs/pdfs/mybusiness/energysavingsrebates/ incentivesbyindustry/hospitality/icemachinetech.pdf.
Pacific Gas and Electric Company. January 2006. High Performance Data Centers: A Design Guidelines Sourcebook. hightech.lbl.gov/datacenters-bpg.html.
Pacific Institute. August 2012. The CEO Water Mandate: Corporate Water Disclosure Guidelines Toward a Common Approach to Reporting Water Issues. pacinst.org/reports/corporate_water_disclosure_guidelines/full_report.pdf.
Poolmanual.com. Pool Manual. www.poolmanual.com/poolmanual.aspx.
Robert M. Kerr Food & Agricultural Products Center. Food Technology Fact Sheet: Steam Kettle Hookup. www.fapc.okstate.edu/files/factsheets/fapc120.pdf.
Rosenberg, David E., et al. June 2011. Value Landscape Engineering: Identifying Costs, Water Use, Labor, and Impacts to Support Landscape Choice. Journal of the American Water Resources Association (JAWRA) 47(3):635-649.
Rushton, Betty, Ph.D. Southwest Florida Water Management District. May 2002. Infiltration Opportunities in Parking Lot Designs Reduce Runoff and Pollution. www.p2pays.org/ref/41/40363.pdf.
Sailor, David J. and Dietsch, Nikolaas. October 3, 2005. The Urban Heat Island Mitigation Impact Screening Tool (MIST). www.heatislandmitigationtool.com/Introduction.aspx.
Schultz Communications. July 1999. A Water Conservation Guide for Commercial, Institutional and Industrial Users. Prepared for the New Mexico Office of the State Engineer. www.ose.state.nm.us/wucp_ici.html.
South Florida Water Management District Water Supply Development Section. April 2012. Water Efficiency Self-Assessment Guide for Commercial and Institutional Building Facility Managers. www.sfwmd.gov/portal/page/portal/xweb%20-%20release%203%20water%20conservation/water%20conservation%20businesses#efficiency.
South Florida Water Management District (SFWMD). SFWMD Library & Multimedia. my.sfwmd.gov/portal/pls/portal/portal_apps.repository_lib_pkg.repository_browse? p_keywords=waterefficiency&p_thumbnails=no.
Southern Nevada Water Authority. Conservation. www.snwa.com/consv/ conservation.html.
Southern Nevada Water Authority. Landscapes. www.snwa.com/land/landscapes.html.
Southern Nevada Water Authority. How to Find a Leak. www.snwa.com/3party/ find_leak/main.html.

October 2012 9-7
9. Resources
State of California Department of Water Resources. 2012. Commercial, Institutional and Industrial Task Force Best Management Practices Report to the Legislature.
State of California Department of Water Resources. October 1994. Water Efficiency Guide for Business Managers and Facility Engineers. www.water.ca.gov/wateruseefficiency.
Sullivan, G.P., et al. January 2008. Cal-UCONS Commercial Laundry Program Measure-ment and Evaluation, Southern California Gas Company and San Diego Gas and Electric Company, Final Report. eere.pnnl.gov/building-technologies/pdf/sempra_final.pdf.
Sydney Water. Fact Sheets. www.sydneywater.com.au/Water4Life/InYourBusiness/FactSheets.cfm.
Texas Water Development Board. November 2004. Water Conservation Best Management Practices Guide. www.twdb.state.tx.us/conservation/municipal/plans/.
The Northeast Center for Food Entrepreneurship at the New York State Food Venture Center, Cornell University. January 2007. Steam Kettles in Food Processing: Fact Sheets for the Small Scale Food Entrepreneur. necfe.foodscience.cornell.edu/publications/fact-sheets.php.
U.S. Air Force Medical Service. Dental Vacuum Systems. airforcemedicine.afms.mil/idc/groups/public/documents/afms/ctb_108329.pdf.
U.S. Green Building Council. www.usgbc.org.
University of Louisville. 2012. Laboratory Chemical Hood User’s Guide. louisville.edu/dehs/ohs/fumehoods/users_guide.html.
University of Massachusetts Amherst, Center for Energy Efficiency & Renewable Energy, Industrial Assessment Center. Chilled Water Systems Analysis Tool. www.ceere.org/iac/iac_assess_tools.html.
USA Swimming. A Green Initiative Unique to Natatoriums. www.usaswimming.org/ ViewMiscArticle.aspx?TabId=1755&Alias=rainbow&Lang=en&mid=7715&ItemId=3633.
van Gelder, Roger E. and Leaden, John. University of Washington. 2003. Field Evaluation of Three Models of Water Conservation Kits for Sterilizer Trap Cooling at University of Washington. www.p2pays.org/ref/50/49036.pdf.
Vickers, Amy. 2001. Handbook of Water Use and Conservation. WaterPlow Press


Appendix A: Case Studies Demonstrating Best Management
Practices in Action
Table of ContentsA.1 Introduction to Case Studies .......................A-2
A.2 Federal Agency Implements Water Management Strategy ......................A-3
A.3 Hotel Installs Water-Efficient Sanitary Fixtures ...............................................A-6
A.4 Restaurants Install Water-Efficient Commercial Kitchen Equipment ................A-9
A.5 Office Complex Reduces Outdoor Water Use....................................... A-13
A.6 Laboratory Eliminates Single-Pass Cooling ..................................... A-15
A.7 Hospital Installs Water-Efficient Laboratory and Medical Equipment ..... A-18
A.8 University Makes the Most of Onsite Alternative Water Sources ........... A-22

A-2 WaterSense at Work: Best Management Practices for Commercial and Institutional Facilities
A.1 Introduction to Case Studies
WaterSense at Work provides operation, maintenance, and user education tips, as well as retrofit and replacement options to make water-using products, equipment, and practices more efficient. To demonstrate how commercial and institutional facilities— large and small—translate this information into actual water and cost savings, the U.S. Environmental Protection Agency’s (EPA’s) WaterSense® program prepared this appendix to WaterSense at Work. The case studies included in this appendix feature several facilities in a variety of sectors and describe how these facilities have imple-mented one or more of the specific best management practices described in Water-Sense at Work. This includes case studies on the following topics:
• A federal agency implementing a comprehensive water management strategy • A hotel installing water-efficient sanitary fixtures • Restaurants installing water-efficient commercial kitchen equipment • An office complex reducing outdoor water use • A laboratory eliminating single-pass cooling • A hospital installing water-efficient laboratory and medical equipment • A university utilizing onsite alternative water sources
The case studies presented on the pages that follow illustrate how successfully implementing the best management practices recommended in WaterSense at Work can result in real and significant savings. Additional examples and case studies will be added to this collection over time.
Photo on previous page: Uncommon Ground’s rooftop organic farm

3.2 Toilets
WaterSense at Work: Best Management Practices for Commercial and Institutional Facilities A-3
A.2 Federal Agency Implements Water Management Strategy
Project SummaryThe U.S. Environmental Protection Agency (EPA) owns or operates 30 research laboratories across the country. These laboratories encompass more than 3.8 million square feet of conditioned space and are occupied by approximately 5,800 employees. For more than a decade, water conservation has been a top priority for EPA and the managers of these laboratories.
In 2002, EPA began conducting facility water assessments at 29 of its major laboratories. Consistent with Section 1.2 Water Management Planning, EPA’s goal during every water assessment is to fully understand where all water entering the facility is used and to identify ways to reduce that water use. Specifically, the assessments focus on:
• Reviewing historical water use.
• Identifying utility cost information.
• Touring the facility to inventory all water-using equipment and processes.
• Identifying and fixing apparent leaks.
Case Study Highlights
Facility type: Research laboratories
Location: 29 laboratories nationwide
Number of occupants: Approximately 5,800
Building size: 3.9 million gross square feet
Project overview: EPA began implementing a comprehensive water management planning strategy for 29 of its laboratory spaces nationwide in the early 2000s and began tracking and reporting water use in 2007. The strategy includes: conducting water use and conservation assessments every four years; setting facility-specific, annual water reduction goals; and identifying and implementing water-efficiency projects.
Water savings: Among all 29 laboratories, reduced water use intensity (in gallons per gross square foot) by 18.7 percent between 2007 and 2010, which is equal to 23.4 million gallons of total water saved
Cost savings: Approximately $200,000 in water and sewer costs over the three-year period
EPA’s Main Laboratory Complex in Research Triangle Park, North Carolina
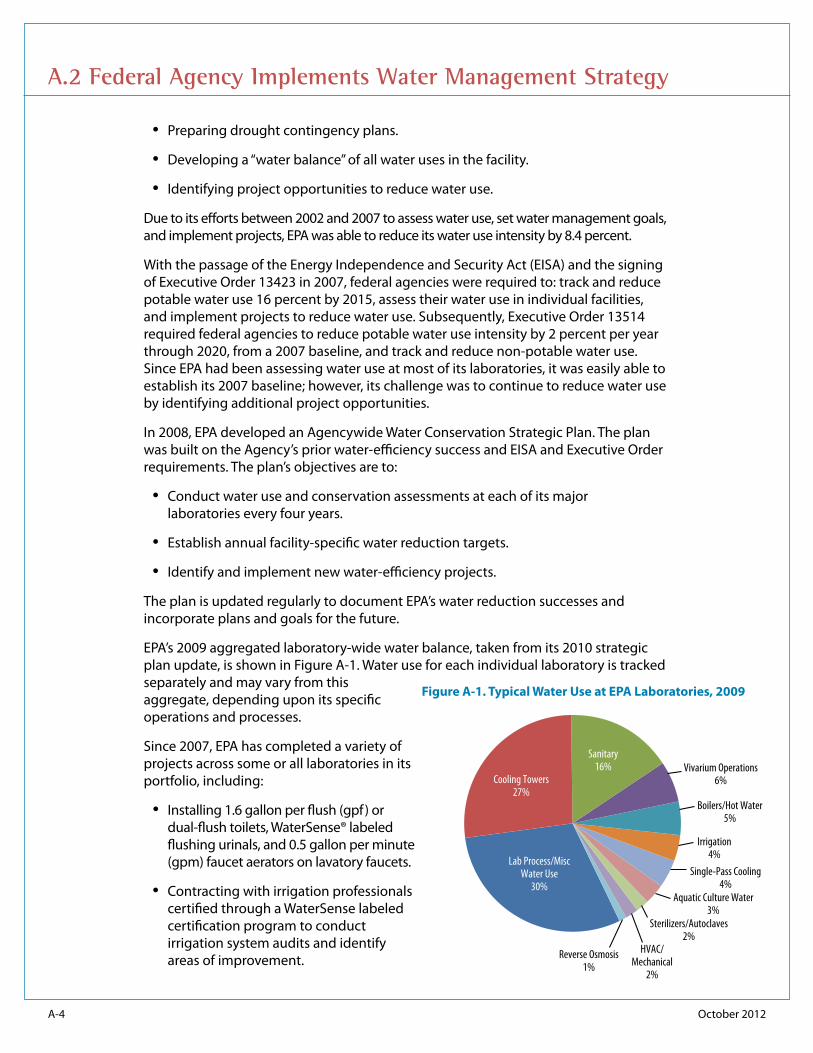
A-4 October 2012
A.2 Federal Agency Implements Water Management Strategy
• Preparing drought contingency plans.
• Developing a “water balance” of all water uses in the facility.
• Identifying project opportunities to reduce water use.
Due to its efforts between 2002 and 2007 to assess water use, set water management goals, and implement projects, EPA was able to reduce its water use intensity by 8.4 percent.
With the passage of the Energy Independence and Security Act (EISA) and the signing of Executive Order 13423 in 2007, federal agencies were required to: track and reduce potable water use 16 percent by 2015, assess their water use in individual facilities, and implement projects to reduce water use. Subsequently, Executive Order 13514 required federal agencies to reduce potable water use intensity by 2 percent per year through 2020, from a 2007 baseline, and track and reduce non-potable water use. Since EPA had been assessing water use at most of its laboratories, it was easily able to establish its 2007 baseline; however, its challenge was to continue to reduce water use by identifying additional project opportunities.
In 2008, EPA developed an Agencywide Water Conservation Strategic Plan. The plan was built on the Agency’s prior water-efficiency success and EISA and Executive Order requirements. The plan’s objectives are to:
• Conduct water use and conservation assessments at each of its major laboratories every four years.
• Establish annual facility-specific water reduction targets.
• Identify and implement new water-efficiency projects.
The plan is updated regularly to document EPA’s water reduction successes and incorporate plans and goals for the future.
EPA’s 2009 aggregated laboratory-wide water balance, taken from its 2010 strategic plan update, is shown in Figure A-1. Water use for each individual laboratory is tracked separately and may vary from this aggregate, depending upon its specific operations and processes.
Since 2007, EPA has completed a variety of projects across some or all laboratories in its portfolio, including:
• Installing 1.6 gallon per flush (gpf) or dual-flush toilets, WaterSense® labeled flushing urinals, and 0.5 gallon per minute (gpm) faucet aerators on lavatory faucets.
• Contracting with irrigation professionals certified through a WaterSense labeled certification program to conduct irrigation system audits and identify areas of improvement.
Sanitary16%
Reverse Osmosis1%
HVAC/Mechanical
2%
Sterilizers/Autoclaves2%
Aquatic Culture Water3%
Single-Pass Cooling4%
Irrigation4%
Boilers/Hot Water5%
Vivarium Operations6%Cooling Towers
27%
Lab Process/MiscWater Use
30%
Figure A-1. Typical Water Use at EPA Laboratories, 2009

October 2012 A-5
A.2 Federal Agency Implements Water Management Strategy
• Closely monitoring cooling towers to ensure that cycles of concentration are maximized.
• Collecting and reusing air handler condensate as cooling tower make-up water.
• Eliminating any remaining instances of single-pass cooling, replacing equipment such as water-cooled ice machines and liquid-ring vacuum pumps.
• Controlling the use of tempering water to cool steam sterilizer discharge water, only allowing the tempering water to flow when the equipment is in use.
EPA also established annual water reduction targets for each facility. As the targets are monitored and the facilities are reassessed, targets are updated and new projects are identified so EPA can continue making progress towards Agencywide goals.
Savings SummaryEPA’s facility-specific approach to water efficiency has resulted in significant savings when tallied up among all of the Agency’s laboratories. As of the end of 2010, EPA has reduced its water use intensity by 18.7 percent from the required 2007 baseline. This amounts to approximately 23.4 million gallons in total water savings and water and sewer cost savings of more than $200,000. See Figure A-2 for an illustration of EPA’s water savings in recent years.
Figure A-2. Water Use Intensity of All EPA Laboratories (gallons per gross square foot), 2007 through 2010
Acknowledgements EPA’s WaterSense program acknowledges the following individuals for providing information for this case study:
• Dexter Johnson, Water Management Coordinator, EPA • Bucky Green, Chief, Sustainable Facilities Practices Branch, EPA
20
25
30
35
40
2019 2020201820172016201520142013201220112010200920082007
Wat
er In
tens
ity (g
allon
s per
gros
s squ
are f
oot)
EPA’s Actual Gallons per Gross Square Foot Executive Order 13514 Target
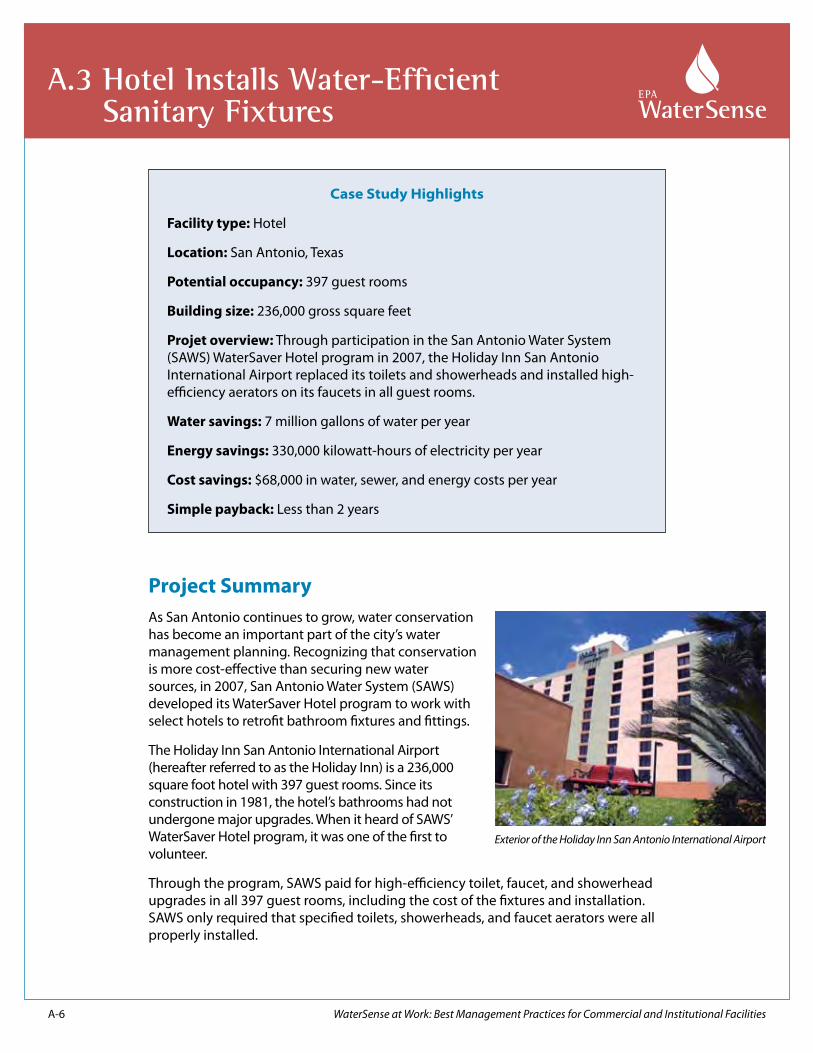
A-6 WaterSense at Work: Best Management Practices for Commercial and Institutional Facilities
A.3 Hotel Installs Water-Efficient Sanitary Fixtures
Case Study Highlights
Facility type: Hotel
Location: San Antonio, Texas
Potential occupancy: 397 guest rooms
Building size: 236,000 gross square feet
Projet overview: Through participation in the San Antonio Water System (SAWS) WaterSaver Hotel program in 2007, the Holiday Inn San Antonio International Airport replaced its toilets and showerheads and installed high- efficiency aerators on its faucets in all guest rooms.
Water savings: 7 million gallons of water per year
Energy savings: 330,000 kilowatt-hours of electricity per year
Cost savings: $68,000 in water, sewer, and energy costs per year
Simple payback: Less than 2 years
Exterior of the Holiday Inn San Antonio International Airport
Project SummaryAs San Antonio continues to grow, water conservation has become an important part of the city’s water management planning. Recognizing that conservation is more cost-effective than securing new water sources, in 2007, San Antonio Water System (SAWS) developed its WaterSaver Hotel program to work with select hotels to retrofit bathroom fixtures and fittings.
The Holiday Inn San Antonio International Airport (hereafter referred to as the Holiday Inn) is a 236,000 square foot hotel with 397 guest rooms. Since its construction in 1981, the hotel’s bathrooms had not undergone major upgrades. When it heard of SAWS’ WaterSaver Hotel program, it was one of the first to volunteer.
Through the program, SAWS paid for high-efficiency toilet, faucet, and showerhead upgrades in all 397 guest rooms, including the cost of the fixtures and installation. SAWS only required that specified toilets, showerheads, and faucet aerators were all properly installed.

October 2012 A-7
A.3 Hotel Installs Water-Efficient Sanitary Fixtures
SAWS used the efficiency and performance criteria from the U.S. Environmental Protection Agency (EPA) WaterSense® tank-type toilet and lavatory faucet specifications to select water-efficient, high-performing toilets and faucet aerators for installation. At the time, WaterSense had not issued its specification for showerheads, so the Holiday Inn selected its own showerheads; however, SAWS specified that they must have a flow rate less than 1.75 gallons per minute (gpm). Table A-1 summarizes the fixtures replaced at the Holiday Inn.
Table A-1. Holiday Inn’s Fixtures and Fittings Retrofits
Fixture/Fitting Replaced
Original Efficiency
Retrofit Efficiency
Number of Units Replaced
Toilets 3.5 gallons per flush (gpf ) 1.1 gpf 297
Toilets 5.0 gpf 1.1 gpf 100
Faucet Aerators 2.2 gpm 1.5 gpm 397
Showerheads 2.5 gpm 1.75 gpm 397
Holiday Inn undertook additional water-saving measures, including reusing the condensate that builds up from heating and cooling equipment to irrigate the landscape and planting a rooftop herb garden. The hotel is also reusing backwash water from the swimming pool and blowdown water from the cooling tower.
Savings SummaryBefore the retrofit, the Holiday Inn used approximately 202 gallons of water per occupied room per day. After installing the high-efficiency toilets, faucet aerators, and showerheads in all of the guest rooms, water use dropped 35 percent to 132 gallons per occupied room per day. This resulted in savings of about 580,000 gallons a month, or 7 million gallons of water each year. Figure A-3 illustrates the savings achieved after the retrofits were completed in late 2007.
Figure A-3. Holiday Inn San Antonio International Airport Monthly Water Use
500,000
1,000,000
1,500,000
2,000,000
2,500,000
Jan
2006
Wat
er U
se (g
allo
ns)
Month
2007 2010
Feb Mar Apr May Jun Jul Aug Sep Oct Nov Dec

A-8 October 2012
A.3 Hotel Installs Water-Efficient Sanitary Fixtures
The Holiday Inn estimates that it saves approximately $35,000 each year in water and sewer bills from reducing its water use. Because much of the water saved is hot water, the hotel also saves energy from these upgrades. Although the Holiday Inn does not currently measure this energy savings, based upon typical hot water use from showerheads and faucets, the hotel likely saves an estimated 330,000 kilowatt hours of electricity and an additional $33,000 per year in energy savings, for more than $68,000 in total savings each year.
According to SAWS, the utility spent approximately $100,000 retrofitting the 397 hotel guestroom bathrooms, which would have resulted in a payback period of less than two years, had the hotel paid for the upgrades. The hotel has also reported that it no longer receives calls for maintenance of the new fixtures or fittings, compared to the one to two calls received each day in the past.
AcknowledgementsEPA’s WaterSense program acknowledges the following individuals for providing information for this case study:
• Owners and management, Holiday Inn San Antonio International Airport • Brandon Leister, Conservation Planner, San Antonio Water System • Karen Guz, Conservation Director, San Antonio Water System

3.2 Toilets
WaterSense at Work: Best Management Practices for Commercial and Institutional Facilities A-9
5.2 Landscaping A.4 Restaurants Install Water-Efficient
Commercial Kitchen Equipment
Certified Green Restaurants®
With social and environmental responsibility becoming the norm among restaurateurs and consumers, restaurants across the country have begun to install water- and energy-efficient commercial kitchen equipment for food preparation, cooking, and cleaning. Despite measures taken to reduce water use, a challenge faced by many restaurants is the inability to directly quantify the impact of their efforts. In many cases, restaurants might be billed a flat fee for water or, if the building is leased or the restaurant is part of a corporate franchise, utility bills may be directed to the building owner or corporate headquarters.
The restaurants highlighted in this case study—Uncommon Ground, The Grey Plume, and Founding Farmers—showcase many of the water-efficiency best management practices described in WaterSense at Work. Although they cannot quantify specific savings, these restaurants are Green Restaurant Association (GRA) Certified Green Restaurants,® meaning they have reduced their environmental impact from disposables, energy, food, furnishings, building materials, pollution, chemicals, waste, and water.1
Project SummaryThe water-efficiency best management practices implemented at each of three restaurants—Uncommon Ground, The Grey Plume, and Founding Farmers—are described in this case study.
Uncommon Ground (Chicago, Illinois)
When Uncommon Ground first opened, it was a small café in a converted apartment in Chicago. Twenty years later, Uncommon Ground has two 4,000-square-foot restaurants that serve approximately 20,000 customers per month. As the restaurants’ popularity began to grow, the owners sought ways to reduce their environmental impact.
In the first year of its plan to reduce water use, Uncommon Ground focused on the “low hanging fruit” and installed water-efficient faucet aerators in prep sinks, changed its pre-rinse spray valve to a high-efficiency model, and began serving water to customers
1 Green Restaurant Association. www.dinegreen.com/.
Uncommon Ground exterior

A-10 October 2012
A.4 Restaurants Install Water-Efficient Commercial Kitchen Equipment
only upon request. To take its water conservation efforts to the next level, Uncommon Ground replaced the dishwashers at both restaurants with ENERGY STAR® qualified models and the ice machines (water-cooled models) with air-cooled, ENERGY STAR qualified models. In addition, Uncommon Ground uses a self-contained steam kettle without an external boiler, which uses less water and energy than boiler-based steam kettles.
Because serving local food is one of Uncommon Ground’s missions, management installed a rooftop organic farm watered by a drip irrigation system. The restaurant also has a rain barrel for rainwater collection, and the rainwater is used to water planters and wash down patio areas.
Following these water-efficient retrofits, the two Uncommon Ground restaurants became the first restaurants in the country to obtain a four-star rating—the highest possible—from GRA.
The Grey Plume (Omaha, Nebraska)
The Grey Plume, located in a LEED® certified building, has embarked on many green initiatives as part of its focus on sustainable food sourcing and operations. In the kitchen, water-efficient aerators are installed on all handwashing and prep sinks, and a high-efficiency pre-rinse spray valve is also used. Both the ice machine and dishwasher are ENERGY STAR qualified. Instead of utilizing a garbage disposal, which can flow between 2.0 and 15.0 gallons per minute (gpm) when in use, the restaurant composts food waste, saving water and reducing the waste that is discarded. Water efficiency, along with ongoing operations that facilitate recycling, waste minimization, green cleaning, and energy efficiency, enabled the Grey Plume to become GRA’s Greenest Restaurant in America in December 2010 and March 2012.
Founding Farmers (Washington, D.C., Metropolitan Area)
As a restaurant that tries to mirror the family farmer’s traditional protection of air, soil, water, and biodiversity, Founding Farmers developed a philosophy focused on efficient and environmentally-friendly operations for its two locations in Washington, D.C., and Potomac, Maryland. Both restaurants are approximately 9,000 square feet, serve between 20,000 and 30,000 customers per month, and have been recognized as Certified Green Restaurants® by GRA for their eco-friendly operations. The Washington, D.C., restaurant is located in a LEED Gold certified building.
In both restaurants, water-efficient products and equipment were installed during initial construction. The Washington, D.C., kitchen includes a high-efficiency pre-rinse spray valve, an ENERGY STAR qualified dishwasher, and an ENERGY STAR qualified steam cooker, which uses an average of 3 gallons of water per hour (standard models typically use 40 gallons of water per hour).
The Grey Plume exterior
ENERGY STAR qualified dishwasher and high-efficiency pre-rinse spray valve installed at one of Uncommon Ground’s locations

October 2012 A-11
A.4 Restaurants Install Water-Efficient Commercial Kitchen Equipment
The Potomac, Maryland, location includes the same features; it also incorporated 0.5 gpm faucet aerators on prep sinks and does not use a garbage disposal for removing food waste from dishes. Both locations also use dipper wells for utensil cleaning, which are not flowing continuously but are operated with an on/off mechanism. These features, along with a focus on continuous improvement, enabled both locations to earn GRA’s certification.
Savings SummaryBecause they do not collect water data, these restaurants are not able to cite how many total gallons of water they have saved through their efforts. Table A-2 provides a summary of the best management practices implemented at each restaurant and an indication of how much water the facilities may be saving compared to typical restaurant practices.
The restaurant owners noted that the water- and energy-efficient products and practices have not slowed down productivity in their busy operations, and they are all very satisfied with the products and equipment they have installed in and out of the kitchen.
Table A-2. Best Management Practices Implemented at Certified Green Restaurants®
Best Management
Practice
Percent Savings Compared to Standard
Product/Practice
Uncommon Ground
The Grey Plume
Founding Farmers
Commercial Kitchen Best Management Practices
High-Efficiency Faucet Aerators on Prep Sinks
30-75 X X X
Manually Operated Dipper Well
Significant X
High-Efficiency Pre-Rinse Spray Valve
20-40 X X X
ENERGY STAR Qualified Commercial Dishwasher
25 X X X
ENERGY STAR Qualified Commercial Ice Machine
10 X X
ENERGY STAR Qualified Steam Cooker
90 X
Self-Contained Steam Kettle
Significant X
Food Composting (no garbage disposal)
100 X
Founding Farmers exterior
(continued)

A-12 October 2012
Best Management
Practice
Percent Savings Compared to Standard
Product/Practice
Uncommon Ground
The Grey Plume
Founding Farmers
Other Best Management Practices
High-Efficiency Aerators on Handwashing Sinks
30-75 X X X
Dual-flush or 1.28 Gallons per Flush Toilets
20 X X X
High-Efficiency or Non-Water-Using Urinals
50-100 X X
Drip Irrigation 20-50 X
Rainwater Collection and Reuse
Significant X
AcknowledgementsThe U.S. Environmental Protection Agency’s WaterSense® program acknowledges the following individuals for providing information for this case study:
• Lara Hardcastle, Vice President, Vucurevich Simons Advisory Group • Helen Cameron, Owner, Uncommon Ground • Clayton Chapman, Chef/Owner, The Grey Plume
Table A-2. Best Management Practices Implemented at Certified Green Restaurants® (cont.)
A.4 Restaurants Install Water-Efficient Commercial Kitchen Equipment

3.2 Toilets
WaterSense at Work: Best Management Practices for Commercial and Institutional Facilities A-13
A.5 Office Complex Reduces
Outdoor Water Use
Case Study Highlights
Facility type: Office park landscape
Location: Dallas, Texas
Landscape size: 372,000 square feet
Project overview: Following an irrigation audit, an irrigation professional certified through a WaterSense labeled program improved the efficiency of the office park’s irrigation system by installing a weather-based irrigation controller, rain sensor, and freeze sensor and performing needed maintenance on the existing irrigation system.
Water savings: 12.5 million gallons in 2009
Cost savings: $47,000 in 2009
Simple payback: Less than 1.5 years
Project SummaryThe Granite Park office complex in Plano, Texas, has implemented water-efficient practices inside and out, including improvements to its landscape and irrigation system. As a result, it has significantly decreased its outdoor water use—and is winning awards in the process. Two buildings in the complex, Granite Park One and Two, have already earned LEED® Gold certification.
The Granite Park complex landscape is maintained by an irrigation professional certified through a program that has earned the U.S. Environmental Protection Agency (EPA) WaterSense® label. The certified professional, Bruce Birdsong, is the president of Precision Landscape Management, and he leads a team of irrigation professionals overseeing approximately 372,000 square feet of landscape at the complex, maintaining plant health and landscape aesthetics while saving water.
When Precision Landscape Management took over grounds maintenance at the Granite Park office complex in 2008, Mr. Birdsong conducted an irrigation audit to determine the system’s efficiency improvement potential. At that time, the system was controlled by traditional clock timers and lacked proper maintenance. To improve the efficiency of the system, the complex upgraded to weather-based irrigation controllers, which analyze local weather data and landscape conditions to program watering schedules based on plants’ needs.2
Granite Park office complex landscape2 Although not available at the time of installation, the WaterSense label is now available for weather-based irrigation controllers.

A-14 October 2012
A.5 Office Complex Reduces Outdoor Water Use
In addition to installing new controllers, the landscape management firm initiated routine maintenance and repairs to the irrigation system: replacing broken sprinkler heads; positioning sprinkler heads to ensure adequate coverage; and installing pressure regulating nozzles to increase the uniformity of water applied. Rain and freeze sensors were also installed to prevent watering at unnecessary times.
After completing the new installations and repairs, Precision Landscape Management continued comprehensive, monthly inspections of irrigation system operation. The inspections consist of examining each sprinkler head to ensure it is functioning properly, looking for leaks, checking the coverage, and verifying that the scheduling technology is programmed properly.
Savings SummaryThe Granite Park complex reduced irrigation water use by about 40 percent from the irrigation system upgrades and improvements in operation. Figure A-4 displays the outdoor monthly water usage before and after the irrigation system retrofit.
Figure A-4. Granite Park’s Monthly Landscape Water Use
The Granite Park office complex saved nearly 12.5 million gallons of water and $47,000 in 2009. Based on these savings, the project paid for itself in less than a year and a half, and Granite Park earned credits toward its LEED Gold certification. Beyond improving the bottom line and saving water, the resulting landscape is now both healthier and more attractive.
AcknowledgementsEPA’s WaterSense program acknowledges Mr. Bruce Birdsong, President, Precision Landscape Management, for providing information for this case study.
0
1,000,000
2,000,000
3,000,000
4,000,000
5,000,000
6,000,000
7,000,000
Jan Feb Mar Apr May Jun Jul Aug Sep Oct Nov DecMonth
2008 2009
Wat
er Us
e (ga
llons
)
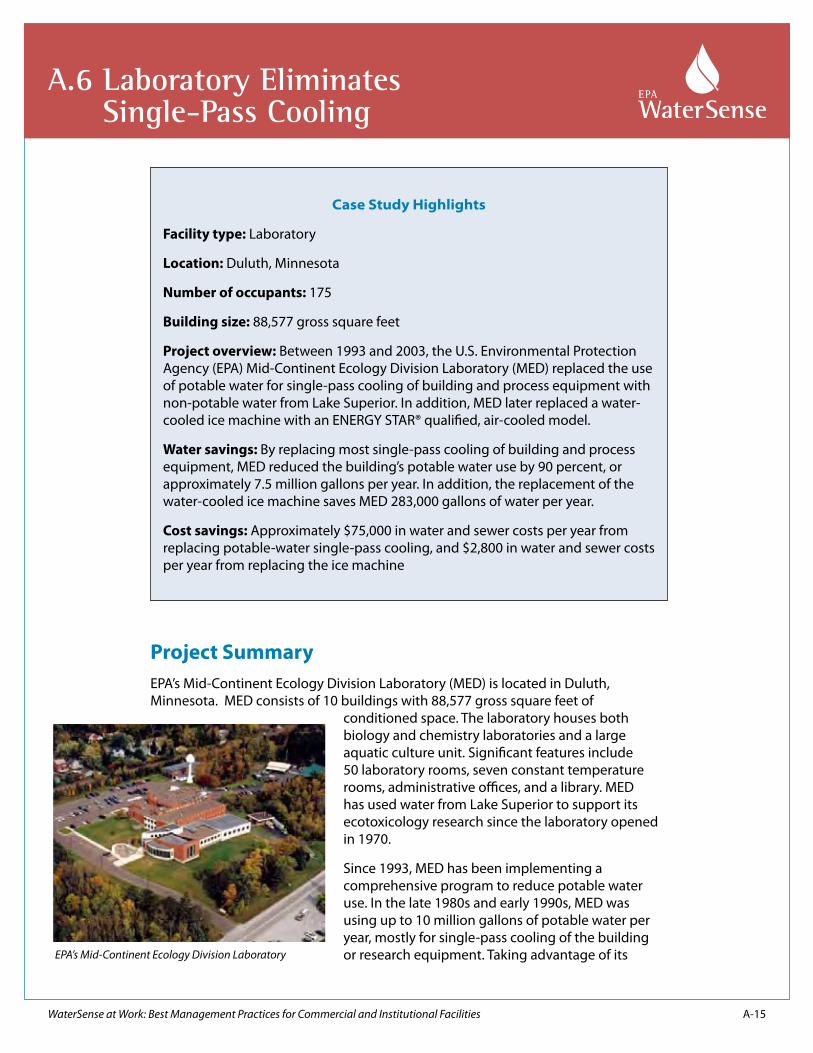
3.2 Toilets
WaterSense at Work: Best Management Practices for Commercial and Institutional Facilities A-15
A.6 Laboratory Eliminates
Single-Pass Cooling
Case Study Highlights
Facility type: Laboratory
Location: Duluth, Minnesota
Number of occupants: 175
Building size: 88,577 gross square feet
Project overview: Between 1993 and 2003, the U.S. Environmental Protection Agency (EPA) Mid-Continent Ecology Division Laboratory (MED) replaced the use of potable water for single-pass cooling of building and process equipment with non-potable water from Lake Superior. In addition, MED later replaced a water-cooled ice machine with an ENERGY STAR® qualified, air-cooled model.
Water savings: By replacing most single-pass cooling of building and process equipment, MED reduced the building’s potable water use by 90 percent, or approximately 7.5 million gallons per year. In addition, the replacement of the water-cooled ice machine saves MED 283,000 gallons of water per year.
Cost savings: Approximately $75,000 in water and sewer costs per year from replacing potable-water single-pass cooling, and $2,800 in water and sewer costs per year from replacing the ice machine
EPA’s Mid-Continent Ecology Division Laboratory
Project SummaryEPA’s Mid-Continent Ecology Division Laboratory (MED) is located in Duluth, Minnesota. MED consists of 10 buildings with 88,577 gross square feet of
conditioned space. The laboratory houses both biology and chemistry laboratories and a large aquatic culture unit. Significant features include 50 laboratory rooms, seven constant temperature rooms, administrative offices, and a library. MED has used water from Lake Superior to support its ecotoxicology research since the laboratory opened in 1970.
Since 1993, MED has been implementing a comprehensive program to reduce potable water use. In the late 1980s and early 1990s, MED was using up to 10 million gallons of potable water per year, mostly for single-pass cooling of the building or research equipment. Taking advantage of its

A-16 October 2012
A.6 Laboratory Eliminates Single-Pass Cooling
proximity to Lake Superior, MED made a concentrated effort to eliminate all uses of potable water for non-contact, single-pass cooling and replace it with lake water. As a result, MED was able to reduce its total potable water consumption by 90 percent. Instead of sending the lake water to the sanitary sewer, however, once the water is used, it is sent directly back to Lake Superior. Since the cooling water doesn’t come in contact with any sources of contamination, it can be returned in the same quantity and quality as before without any needed treatment.
In addition, from a 2009 water assessment at MED (see the discussion in Section A.2: Federal Agency Implements Comprehensive Water Management Strategy), EPA noted that a significant amount of potable water was still used to supply single-pass cooling of an ice machine. At a flow rate of 0.54 gallons per minute (gpm), MED was discharging approximately 283,000 gallons of water per year to the sewer just to cool the ice machine. As a result of the assessment, MED recalibrated the cooling water control valve to only allow water to flow when needed for cooling. Ultimately, MED decided to eliminate this single-pass cooling water use by replacing the ice machine with an ENERGY STAR® qualified, air-cooled model. This replacement allowed MED to completely eliminate the use of potable water for single-pass cooling at the facility, and even further reduce its overall potable water consumption.
Savings SummaryBy shifting to using lake water for non-contact, single-pass cooling, MED was able to reduce its potable water use by 90 percent between 1993 and 2003, which resulted in a water savings of approximately 7.5 million gallons per year or 55.4 million gallons in total, as illustrated in Figure A-5.
Figure A-5. MED Potable Water Use, 1987 to 2003
0
2,000
4,000
6,000
8,000
10,000
12,000
1987
1988
1989
1990
1991
1992
1993
1994
1995
1996
1997
1998
1999
2000
2001
2002
2003
Wate
r Use
(in
thou
sand
s of
gallo
ns)
Year

October 2012 A-17
Reducing potable water use saved MED both water supply and sewer costs, since the lake water used for non-contact, single-pass cooling was sent back to Lake Superior instead of the sanitary sewer. This results in savings of approximately $75,000 in water and sewer costs per year.
In 2009, MED spent approximately $3,500 to replace the water-cooled ice machine with the ENERGY STAR qualified, air-cooled model. In addition to saving an estimated 283,000 gallons of water per year, MED saved $2,800 per year in water and sewer bills and realized a payback period of less than two years from this installation.
Overall, MED has reduced its potable water use from approximately 9 million gallons per year in the early 1990s to only 884,000 gallons in 2010. In 2011, MED initiated plans to install WaterSense® labeled flushing urinals and dual-flush toilets to further reduce its potable water use. The facility’s commitment to water savings has helped EPA to meet its Agencywide water reduction goals.
AcknowledgementsEPA’s WaterSense program acknowledges the following individuals for providing information for this case study:
• Dexter Johnson, Water Management Coordinator, EPA • Bucky Green, Chief, Sustainable Facilities Practices Branch, EPA • Rod Booth, Facilities Manager, MED, EPA
A.6 Laboratory Eliminates Single-Pass Cooling

A-18 WaterSense at Work: Best Management Practices for Commercial and Institutional Facilities
A.7 Hospital Installs Water-Efficient
Laboratory and Medical Equipment
Case Study Highlights
Facility type: Hospital
Location: Olympia, Washington
Potential occupancy: 340 beds
Building size: 750,000 gross square feet
Project summary: Providence St. Peter Hospital retrofitted its steam sterilizers to make them more water-efficient; eliminated water used to cool air compressors and waste gas anesthesia pumps; and made other water-efficiency improvements to address sanitary fixture, mechanical system, and outdoor water use.
Water savings: 31 million gallons of water in total over 10 years, or approximately 5.9 million gallons per year once retrofits were completed
Cost savings: $1.5 million over 10 years, or approximately $140,000 per year
Simple payback: Accounting for rebates and incentives, all of the implemen-ted projects paid for themselves in less than 2 years
Project SummaryProvidence St. Peter Hospital in Olympia, Washington, is a 340-bed, 750,000-square-foot patient care facility. The hospital logs approximately 95,000 patient days per year and employs 2,300 staff.
In Olympia, water rates increased 40 percent between 2000 and 2011. Realizing the potential for saving both water and operating costs, Providence St. Peter Hospital began identifying water-efficiency improvement projects as early as 1999. In 2001, the hospital partnered with its mechanical contractor to perform a facility water assessment and identify sources of water waste, focusing its initial efforts on improving operations and maintenance. Providence St. Peter maintenance staff analyzed irrigation systems, heating and cooling systems, faucets, kitchen equipment, hydrotherapy pool operations, and other potential sources of leaks and made repairs where necessary.
Following the initial water assessment and leak detection and repair phase, Providence St. Peter began the major work of improving the efficiency of some of its medical equipment, as well as equipment in restrooms, kitchens, and mechanical spaces.
Providence St. Peter Hospital exterior

October 2012 A-19
A.7 Hospital Installs Water-Efficient Laboratory and Medical Equipment
Like most hospitals, Providence St. Peter uses sterilizer equipment to disinfect and sterilize surgical instruments, medical waste, and other materials. The hospital’s four existing instrument steam sterilizers all are outfitted with orifice venturi equipment, which uses water to produce a vacuum. By replacing the venturi equipment with electric vacuum pumps, Providence St. Peter was able to eliminate the water use associated with the vacuum operation in its sterilizer units. Additionally, piping was
modified so that steam condensate was recovered from the sterilizer jacket, which is now redirected to the boiler plant for reuse instead of discharged to the drain.
Instead of using potable water for single-pass cooling of its liquid-ring central vacuum pumps, Providence St. Peter uses recirculating chilled water from the central chilled water system, although some fresh water is required to flush the system clean of any medical fluids. Providence St. Peter has also replaced its liquid-ring, non-medical (control) air compressors and waste anesthesia gas pumps with non-water-using equipment.
In addition to addressing the water efficiency of some of its medical equipment, Providence St. Peter has also improved the efficiency of its sanitary fixtures, mechanical equipment, and outdoor water including:
• Installed dual-flush valves on existing flushometer-valve toilets and installed several new high-efficiency toilets, making use of available utility rebates.
• Installed 1-pint urinals.
• Installed water-saving showerheads that meet patient expectations of performance.
• Worked with a manufacturer to design dual-flush bed pan washers.
• Eliminated single-pass cooling in air conditioning units and ice machines.
• Maximized the cooling tower’s water efficiency; the cooling tower is the largest user of water at the facility, consuming approximately 3.2 million gallons of make-up water even under an efficient control scheme.
• Installed a weather-based irrigation controller on its irrigation system.
• Replaced the garbage disposal with a food separator and compost system.
Providence St. Peter has additional water-efficiency projects that it is considering, including: collecting and reusing rainwater; installing submeters to better monitor water use; reducing and/or reusing clean dialysis reject water; and collecting and using air handler condensate as cooling tower make-up water.
Medical air compressors
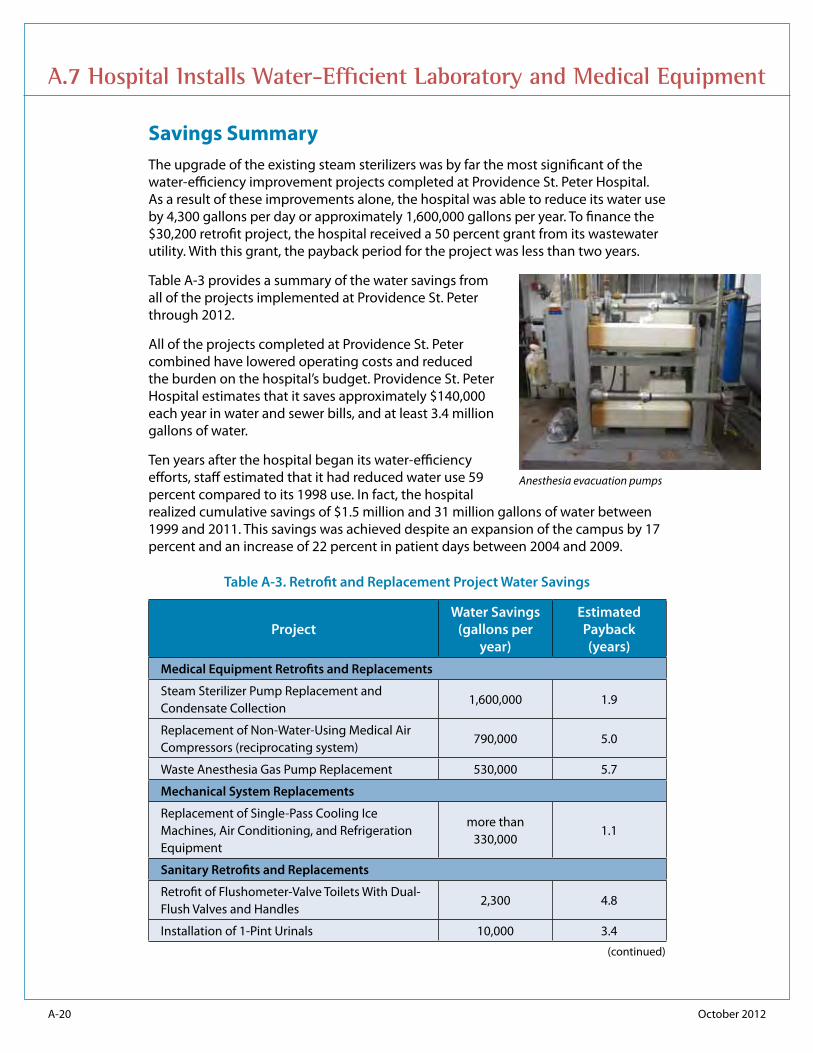
A-20 October 2012
A.7 Hospital Installs Water-Efficient Laboratory and Medical Equipment
Anesthesia evacuation pumps
Savings SummaryThe upgrade of the existing steam sterilizers was by far the most significant of the water-efficiency improvement projects completed at Providence St. Peter Hospital. As a result of these improvements alone, the hospital was able to reduce its water use by 4,300 gallons per day or approximately 1,600,000 gallons per year. To finance the $30,200 retrofit project, the hospital received a 50 percent grant from its wastewater utility. With this grant, the payback period for the project was less than two years.
Table A-3 provides a summary of the water savings from all of the projects implemented at Providence St. Peter through 2012.
All of the projects completed at Providence St. Peter combined have lowered operating costs and reduced the burden on the hospital’s budget. Providence St. Peter Hospital estimates that it saves approximately $140,000 each year in water and sewer bills, and at least 3.4 million gallons of water.
Ten years after the hospital began its water-efficiency efforts, staff estimated that it had reduced water use 59 percent compared to its 1998 use. In fact, the hospital realized cumulative savings of $1.5 million and 31 million gallons of water between 1999 and 2011. This savings was achieved despite an expansion of the campus by 17 percent and an increase of 22 percent in patient days between 2004 and 2009.
Table A-3. Retrofit and Replacement Project Water Savings
ProjectWater Savings
(gallons per year)
Estimated Payback (years)
Medical Equipment Retrofits and Replacements
Steam Sterilizer Pump Replacement and Condensate Collection
1,600,000 1.9
Replacement of Non-Water-Using Medical Air Compressors (reciprocating system)
790,000 5.0
Waste Anesthesia Gas Pump Replacement 530,000 5.7
Mechanical System Replacements
Replacement of Single-Pass Cooling Ice Machines, Air Conditioning, and Refrigeration Equipment
more than 330,000
1.1
Sanitary Retrofits and Replacements
Retrofit of Flushometer-Valve Toilets With Dual-Flush Valves and Handles
2,300 4.8
Installation of 1-Pint Urinals 10,000 3.4
(continued)

October 2012 A-21
ProjectWater Savings
(gallons per year)
Estimated Payback (years)
Installation of Some Dual-Flush Flushometer-Valve Toilets
9,800 6.8
Installation of 1.5 GPM (gallons per minute) Showerheads
3,700 2.1
Installation of Reduced Flow Rate Faucets 1,500 4.5
Commercial Kitchen Replacements
Installation of a More Efficient Tunnel Dishwasher
660,000 18
Installation of a Food Separator and Garbage Composting System
1,000,000 N/A*
Outdoor Replacements
Installation of a Weather-Based Irrigation Controller
1,000,000 N/A
TotalApproximately
5,900,000
*N/A: Information not available
AcknowledgementsThe U.S. Environmental Protection Agency’s WaterSense® program acknowledges the following individuals for providing information for this case study:
• Geoff Glass, Facility Director, Providence St. Peter Hospital • Troy Aichele, Stirrett Johnsen Mechanical Contractors • Laura Brannen, Senior Environmental Performance Consultant, Mazzetti Nash
Lipsey Burch
Table A-3. Retrofit and Replacement Project Water Savings (cont.)
A.7 Hospital Installs Water-Efficient Laboratory and Medical Equipment

A-22 WaterSense at Work: Best Management Practices for Commercial and Institutional Facilities
A.8 University Makes the Most of
Onsite Alternative Water Sources
Case Study Highlights
Facility type: University
Location: Austin, Texas
Number of occupants: 51,000 students and nearly 24,000 faculty and staff
Size: 400-acre campus with 17 million square feet of building space
Project overview: University of Texas at Austin has focused on recovering and reusing water from onsite alternative sources to serve non-potable water needs. Retrofits include using air handler condensate, single-pass cooling water, rainwater, and foundation groundwater for cooling tower make-up water and lawn irrigation.
Water savings: Reduced potable water use by more than 33 percent and saved more than 1.6 billion gallons of water in total since the program began in the 1980s.
Cost savings: $7.5 million since the program’s inception
Project SummaryOnce the largest water-using entity in the city of Austin, the University of Texas at Austin (UT Austin) has been implementing programs to reduce its water use for three decades. Although UT Austin continues to expand its campus, its comprehensive water conservation program has resulted in declining water use over the years.
The 400-acre campus, comprised of 17 million square feet of building space, serves approximately 51,000 students and nearly 24,000 faculty and staff. The campus includes administrative offices, academic lecture buildings, dormitories, research laboratories, cafeterias, museums, libraries, athletic venues, and industrial facilities. UT Austin has focused on recovering and reusing onsite alternative water sources in these facilities to serve non-potable water needs around the campus.
Single-Pass Cooling Water Recovery
Historically, UT Austin used single-pass cooling to supply chilled water for dormitory drinking fountains. Water was used to cool the drinking fountain chillers, then sent down the drain at a rate of 1 gallon per minute (gpm), 24 hours per day, 365 days per year. In addition, several pieces of laboratory equipment used single-pass cooling. Recognizing this opportunity for water savings, UT Austin installed a network of PVC pipes within existing underground tunneling to send the single-pass cooling water as make-up water to the campus’ cooling tower. All onsite alternative water sources directed to the cooling tower are now collected through this piping system.

October 2012 A-23
A.8 University Makes the Most of Onsite Alternative Water Sources
At one point, UT Austin maintained nearly 250 pieces of equipment connected to the recovery system. Over time, UT Austin has replaced some of the older single-pass cooling equipment with more efficient, air-cooled equipment to eliminate some unnecessary water use, including replacing the old drinking fountain chillers with air-cooled heat exchangers.
Ground Water Sump Recovery
Some buildings on campus sit two or three stories below ground level and, as a result, ground water must be removed from these foundations to prevent building flooding. Before the mid-1980s, all of the recovered foundation ground water was pumped to the storm sewer. However, UT Austin saw this as an opportunity to use water that otherwise would go down the drain, as long as the hard water is treated prior to use in the cooling towers.
Air Handler Condensate Recovery
In 1985, UT Austin began recovering air handler condensate and using it as make-up water for the cooling tower. Air handler condensate has relatively low conductivity and is cold, so it provides a good source of make-up water for the cooling tower. In addition, it is produced during the hot, humid summer months, when the cooling towers are running constantly and generate the highest demand for make-up water.
With the use of air handler condensate as make-up water, UT Austin was able to increase the average cycles of concentration of the cooling tower from five to an average of nine and a peak of 14 cycles in the hottest summer months. Due to the success of air handler condensate recovery, UT Austin now constructs all new buildings with air handler condensate recovery systems. Approximately 40 buildings recover condensate from 100 air handler units. UT Austin has also been working to retrofit existing buildings to recover air handler condensate. Because the generation of single-pass cooling water has diminished due to the installation of air-cooled equipment, UT Austin now relies primarily on air handler condensate, rainwater harvesting, and some recovered foundation ground water to provide cooling tower make-up.
Rainwater Harvesting
Rainwater harvesting has been a relatively new addition to the UT Austin’s alternative water source repertoire. Over the last five or six years, all newly constructed buildings on the campus have been equipped with rainwater harvesting capability, some with 5,000-gallon storage tanks, which collect rainwater for lawn irrigation. The rainwater harvesting system at UT Austin recovers 40 to 50 million gallons of water per year, depending upon the amount of rainfall.
A chilling station making chilled water to cool campus buildings
Two 2,500-gallon tanks storing air handler condensate and harvested rainwater for irrigation

A-24 October 2012
A.8 University Makes the Most of Onsite Alternative Water Sources
Reclaimed Wastewater
After capturing all feasible sources of onsite alternative water that would otherwise be wasted, UT Austin is now preparing to use city-supplied reclaimed water as an addi-tional source of make-up water to help achieve its goal of using non-potable water wherever possible. UT Austin is currently reengineering the campus’ infrastructure to be able to use reclaimed city water in its processes. This includes installing water meters, replacing valves where needed, and installing additional piping at the property boundary to connect the city-supplied reclaimed water to the cooling towers.
In addition to water efficiency, UT Austin is focused on sustainability as a whole. As of 2007, all new buildings on the UT Austin campus have received at least LEED Silver certification, and several are LEED Gold certified. To continue with its water-efficiency initiatives, UT Austin has begun focusing on measurement and verification and has installed submeters on water, steam condensate, and chilled water lines. Newly constructed buildings have all of these techniques incorpo-rated into the design phase, while existing buildings are being retrofitted.
Savings Summary In the early 1980s, UT Austin’s facilities were using 1 billion gallons of potable water per year. In 2010, UT Austin reduced this potable water use to 668 million gallons. This decrease in total potable water use was achieved despite a 70 percent increase in overall building square footage. Much of this reduction is attributed to the use of onsite alternative water sources.
In 2009, UT Austin used approximately 395 million gallons of water for cooling, 11 percent of which was supplied from onsite alternative water sources, including recov-ered single-pass cooling water, foundation groundwater, air handler condensate, and rainwater. The University also recovers rainwater to provide supplemental irrigation. UT Austin has recovered and reused more than 1.6 billion gallons of water since the water conservation program began, saving $7.5 million in water and sewer costs.
AcknowledgementsThe U.S. Environmental Protection Agency’s WaterSense® program acknowledges Mr. Rusty Osborne, Utilities and Energy Management at UT Austin (retired), for providing information for this case study.
Construction of city-supplied reclaimed water distribution lines
Appendix B: Sample Worksheets for Water Management Planning
Table of ContentsTable B-1. Building Water Survey Worksheet .......... B-3
Table B-2. List of Water Meters Worksheet .............. B-4
Table B-3. Water Consumption History Worksheet ....................................................... B-5
Table B-4. Existing Plumbing Equipment Worksheet ....................................................... B-6
Table B-5. Water Use Inventory Worksheet ............. B-7

Appendix B: Sample Worksheets for Water Management Planning
B-2 WaterSense at Work: Best Management Practices for Commercial and Institutional Facilities
Appendix B: Sample Worksheets for Water Management Planning
The sample worksheets for water management planning provided in this Appendix were adapted from: Arizona Municipal Water Users Association (AMWUA) Regional Water Conservation Committee and Black and Veatch. August 2008. Facility Manag-er’s Guide to Water Management Version 2.7. www.amwua.org/business.html.

October 2012 B-3
Appendix B: Sample Worksheets for Water Management PlanningTa
ble
B-1.
Bui
ldin
g W
ater
Sur
vey
Wor
kshe
et
Build
ing
Wat
er S
urve
y
Surv
eyed
by:
Dat
e:
Gen
eral
Info
rmat
ion
Nam
e of
Bui
ldin
g:Ad
dres
s:
Build
ing
Cont
act
Phon
e:
Build
ing
Dim
ensi
ons:
Wid
th:
Leng
th:
Build
ing
was
tew
ater
is c
urre
ntly
:
o
Trea
ted
on s
ite
o
Conn
ecte
d to
city
wat
er s
yste
m
o
Oth
er
Is re
cycl
ed w
ater
cur
rent
ly u
sed
in a
ny o
f the
fo
llow
ing
area
s?
o
Toile
ts
o
Urin
als
o
Cool
ing
Tow
ers
o
Irrig
atio
n
Num
ber o
f Flo
ors
(hei
ght)
:
Build
ing
Occ
upan
cy D
ata
Aver
age
Num
ber o
f Occ
upan
ts:
Num
ber o
f Wom
en:
Num
ber o
f Men
:
Occ
upan
cy S
ched
ule
Wee
kday
sFr
oma.
m.
Top.
m.
Satu
rday
sFr
oma.
m.
Top.
m.
Sund
ays
From
a.m
.To
p.m
.
Hol
iday
sFr
oma.
m.
Top.
m.
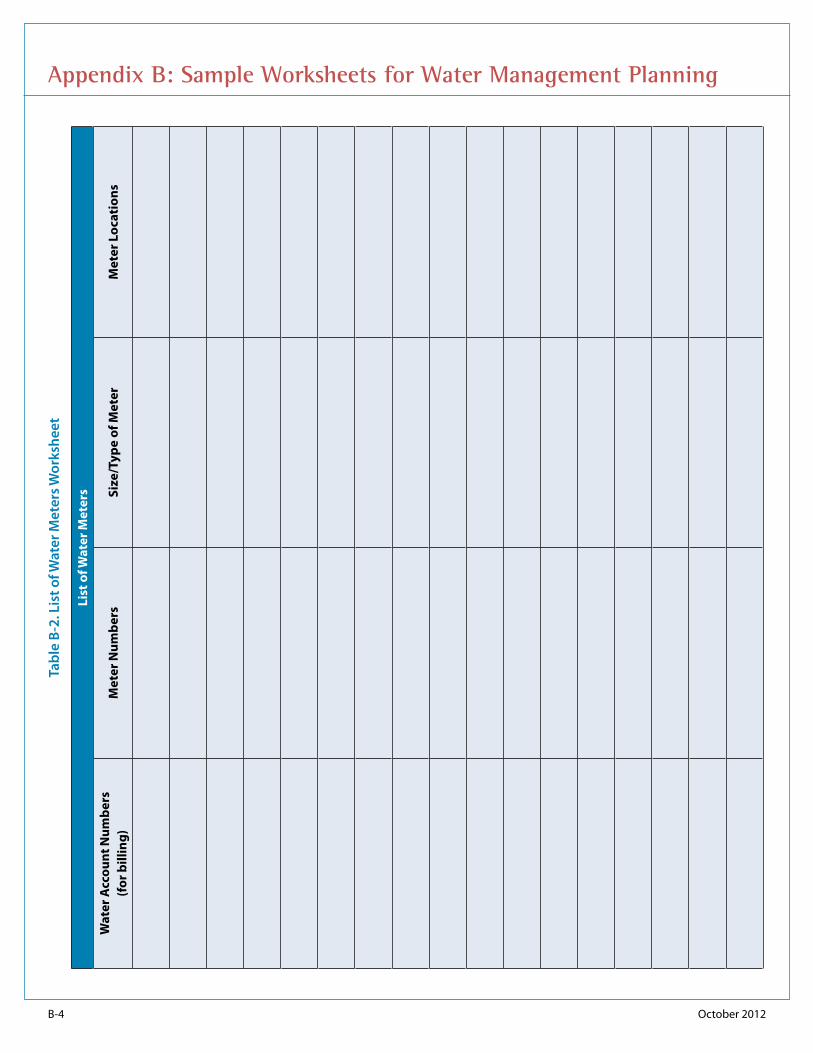
B-4 October 2012
Appendix B: Sample Worksheets for Water Management PlanningTa
ble
B-2.
Lis
t of W
ater
Met
ers W
orks
heet
List
of W
ater
Met
ers
Wat
er A
ccou
nt N
umbe
rs
(for
bill
ing)
Met
er N
umbe
rsSi
ze/T
ype
of M
eter
Met
er L
ocat
ions

October 2012 B-5
Appendix B: Sample Worksheets for Water Management PlanningTa
ble
B-3.
Wat
er C
onsu
mpt
ion
His
tory
Wor
kshe
et
Wat
er C
onsu
mpt
ion
His
tory
Year
Mon
thly
Con
sum
ptio
n by
Bill
ing
Uni
ts: T
hous
ands
of G
allo
ns o
r ccf
1 (by
wat
er a
ccou
nt n
umbe
r)
Indo
or U
ses
Land
scap
e U
ses
Mon
thA
ccou
nt
#A
ccou
nt
#A
ccou
nt
#A
ccou
nt
#Bi
lled
Day
sA
vera
ge
GPW
D2
Acc
ount
#
Acc
ount
#
Acc
ount
#
Acc
ount
#
Bille
d D
ays
Ave
rage
G
PWD
Janu
ary
Febr
uary
Mar
ch
Apr
il
May
June
July
Augu
st
Sept
embe
r
Oct
ober
Nov
embe
r
Dec
embe
r
Tota
l
Ave
rage
1 The
abb
revi
atio
n cc
f rep
rese
nts
100
cubi
c fe
et, o
r rou
ghly
748
gal
lons
.2 T
he a
bbre
viat
ion
GPW
D re
pres
ents
gal
lons
per
wor
kday
, ass
umin
g fiv
e da
ys p
er w
eek.
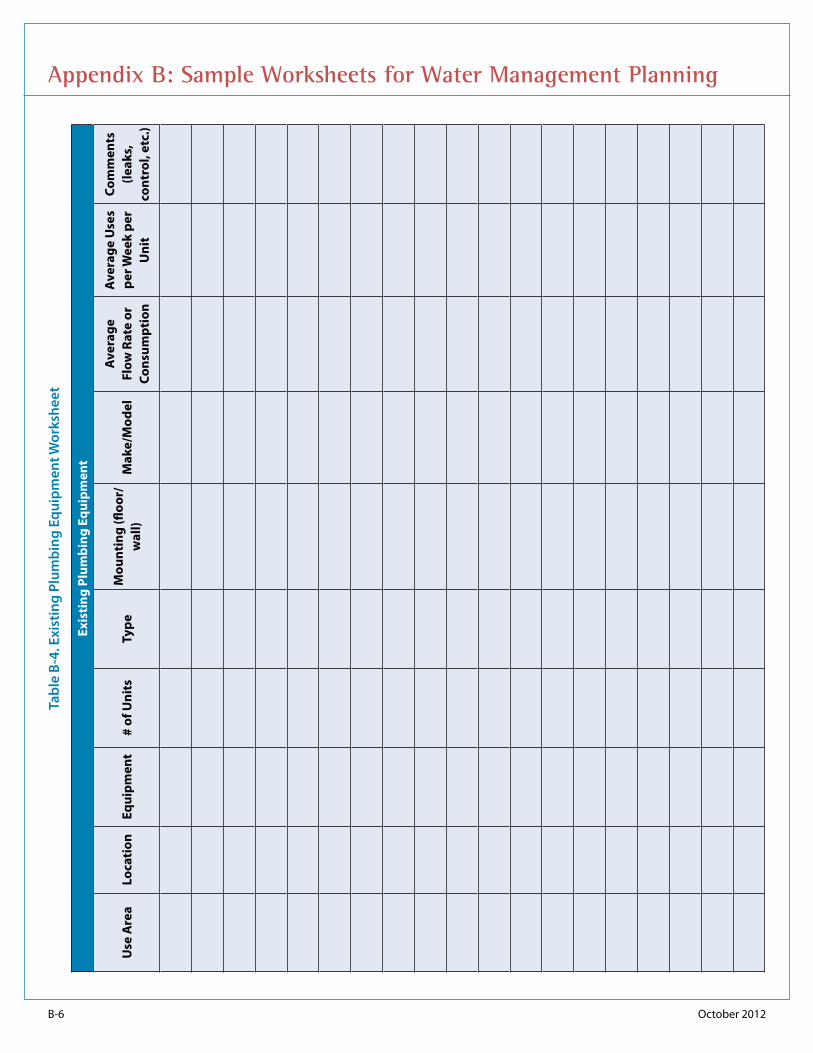
B-6 October 2012
Appendix B: Sample Worksheets for Water Management PlanningTa
ble
B-4.
Exi
stin
g Pl
umbi
ng E
quip
men
t Wor
kshe
et
Exis
ting
Plu
mbi
ng E
quip
men
t
Use
Are
aLo
cati
onEq
uipm
ent
# of
Uni
tsTy
peM
ount
ing
(floo
r/w
all)
Mak
e/M
odel
Ave
rage
Fl
ow R
ate
or
Cons
umpt
ion
Ave
rage
Use
s pe
r Wee
k pe
r U
nit
Com
men
ts
(leak
s,
cont
rol,
etc.
)

October 2012 B-7
Appendix B: Sample Worksheets for Water Management PlanningTa
ble
B-5.
Wat
er U
se In
vent
ory
Wor
kshe
et
Wat
er U
se In
vent
ory
Item
Loca
tion
Flow
(gal
lons
per
min
ute)
Ope
rati
ng T
ime
(min
utes
per
day
)Fl
ow p
er D
ay(g
allo
ns p
er d
ay)
Rem
arks
Tabl
e B-
4. E
xist
ing
Plum
bing
Equ
ipm
ent W
orks
heet
Exis
ting
Plu
mbi
ng E
quip
men
t
Use
Are
aLo
cati
onEq
uipm
ent
# of
Uni
tsTy
peM
ount
ing
(floo
r/w
all)
Mak
e/M
odel
Ave
rage
Fl
ow R
ate
or
Cons
umpt
ion
Ave
rage
Use
s pe
r Wee
k pe
r U
nit
Com
men
ts
(leak
s,
cont
rol,
etc.
)

United States Environmental Protection Agency(4204M)
EPA 832-F-12-034October 2012
www.epa.gov/watersense(866) WTR-SENS (987-7367)