EPA - PROPOSED EXPLANATION OF SIGNIFICANT …the differences in the costs between then and now. 1....
46
1 PROPOSED EXPLANATION OF SIGNIFICANT DIFFERENCES U.S. SMELTER AND LEAD REFINERY, INC. SUPERFUND SITE EAST CHICAGO, LAKE COUNTY, INDIANA EPA Region 5 December 2017 I. INTRODUCTION The United States Environmental Protection Agency (EPA) is proposing this Explanation of Significant Differences (ESD) to document the significant increase in cost between the estimated cost of the remedy selected in the 2012 Record of Decision (ROD) for Zones 2 and 3 of Operable Unit 1 (OU1) of the U.S. Smelter and Lead Refinery, Inc. Superfund Site (Site) and the current estimated cost of the remedy for those two Zones. Previously, the estimated cost for Zones 2 and 3 was $22.8 million; currently, the estimate is $84.9 million. Notwithstanding this projected increase in costs, EPA has determined that the remedy selected in the 2012 ROD—excavation of contaminated soil and off-site disposal (with an off-site soil treatment option)—is still the correct remedy for Zones 2 and 3 and continues to meet the requirements of the National Oil and Hazardous Substances Contingency Plan (NCP). EPA would have selected this remedy even if the projected costs in 2012 had been more consistent with the current estimate. Thus, this ESD does not propose any changes to the remedy selected for Zones 2 and 3 of OU1. It merely explains the differences in the costs between then and now. 1 Under Section 117(c) of the Comprehensive Environmental Response, Compensation, and Liability Act of 1980 (CERCLA or Superfund), as amended, EPA is required to publish an Explanation of Significant Differences when, after issuance of a Record of Decision, 2 subsequent enforcement or remedial actions differ in any significant respects from the final plan set forth in the ROD. Sections 300.435(c)(2)(i) and 300.825(a)(2) of the NCP set forth the criteria for issuing an ESD and requiring that an ESD be published if, after issuance of the ROD, there is a significant, but not fundamental, difference in the scope, performance, or cost of the remedy. A difference is significant, but not fundamental, if it affects basic features of the remedy such as timing and cost, but does not affect the overall approach to managing hazardous waste at a site. 3 1 This ESD does not address Zone 1 of OU1 of the Site. In 2016 and 2017, all residents of Zone 1 were relocated out of their housing complex and the housing complex was slated for demolition. Consequently, for the former residential and park areas of Zone 1, EPA is in the process of preparing a Feasibility Study Addendum to the 2012 ROD. EPA may fundamentally change the remedy for those areas, which would necessitate a ROD Amendment. In addition, there may be changes in the land use for some areas of Zone 1 that currently house a former elementary school. Therefore, no areas of Zone 1 are addressed in this ESD. This ESD also does not include costs associated with indoor response actions. Those actions were performed pursuant to EPA’s removal, not remedial, authorities. 2 A ROD documents the EPA’s remedy decision. 3 See 55 Fed. Reg. 8,666, 8,771-72 (Mar. 8, 1990).
Transcript of EPA - PROPOSED EXPLANATION OF SIGNIFICANT …the differences in the costs between then and now. 1....

1
PROPOSED EXPLANATION OF SIGNIFICANT DIFFERENCES
U.S. SMELTER AND LEAD REFINERY, INC. SUPERFUND SITE
EAST CHICAGO, LAKE COUNTY, INDIANA
EPA Region 5 December 2017
I. INTRODUCTION The United States Environmental Protection Agency (EPA) is proposing this Explanation of Significant Differences (ESD) to document the significant increase in cost between the estimated cost of the remedy selected in the 2012 Record of Decision (ROD) for Zones 2 and 3 of Operable Unit 1 (OU1) of the U.S. Smelter and Lead Refinery, Inc. Superfund Site (Site) and the current estimated cost of the remedy for those two Zones. Previously, the estimated cost for Zones 2 and 3 was $22.8 million; currently, the estimate is $84.9 million. Notwithstanding this projected increase in costs, EPA has determined that the remedy selected in the 2012 ROD—excavation of contaminated soil and off-site disposal (with an off-site soil treatment option)—is still the correct remedy for Zones 2 and 3 and continues to meet the requirements of the National Oil and Hazardous Substances Contingency Plan (NCP). EPA would have selected this remedy even if the projected costs in 2012 had been more consistent with the current estimate. Thus, this ESD does not propose any changes to the remedy selected for Zones 2 and 3 of OU1. It merely explains the differences in the costs between then and now.1 Under Section 117(c) of the Comprehensive Environmental Response, Compensation, and Liability Act of 1980 (CERCLA or Superfund), as amended, EPA is required to publish an Explanation of Significant Differences when, after issuance of a Record of Decision,2 subsequent enforcement or remedial actions differ in any significant respects from the final plan set forth in the ROD. Sections 300.435(c)(2)(i) and 300.825(a)(2) of the NCP set forth the criteria for issuing an ESD and requiring that an ESD be published if, after issuance of the ROD, there is a significant, but not fundamental, difference in the scope, performance, or cost of the remedy. A difference is significant, but not fundamental, if it affects basic features of the remedy such as timing and cost, but does not affect the overall approach to managing hazardous waste at a site.3
1 This ESD does not address Zone 1 of OU1 of the Site. In 2016 and 2017, all residents of Zone 1 were relocated out of their housing complex and the housing complex was slated for demolition. Consequently, for the former residential and park areas of Zone 1, EPA is in the process of preparing a Feasibility Study Addendum to the 2012 ROD. EPA may fundamentally change the remedy for those areas, which would necessitate a ROD Amendment. In addition, there may be changes in the land use for some areas of Zone 1 that currently house a former elementary school. Therefore, no areas of Zone 1 are addressed in this ESD. This ESD also does not include costs associated with indoor response actions. Those actions were performed pursuant to EPA’s removal, not remedial, authorities. 2 A ROD documents the EPA’s remedy decision. 3 See 55 Fed. Reg. 8,666, 8,771-72 (Mar. 8, 1990).

2
The remedial investigation (RI)4 performed by the EPA at OU1 of the Site identified lead and arsenic in soil as the contaminants of concern. EPA’s 2012 ROD estimated it would cost $29.9 million to implement the selected remedy across all areas of OU1, which were then designated as an “eastern” area, a “southwestern” area, and a “northwestern” area. In 2014, OU1 was subdivided into three geographic “zones”: Zones 1, 2, and 3. These Zones differed to some extent from the “areas” previously identified, but the original “area” costs were relatively easily reallocated to the “Zones.” EPA estimated it would cost $13.4 million to remediate Zone 2 and $9.4 million to remediate Zone 3, for a total of $22.8 million for both Zones.5 From approximately May 2015 to early 2016, extensive soil sampling in Zones 2 and 3 was conducted during remedial design to better delineate the extent of contamination at each property.6 Based on that sampling, EPA determined that the actual volume of contaminated soil that needs to be excavated is greater than what was originally estimated. In addition, based largely on more up-to-date engineering estimates, EPA determined that the “per unit” cost of various tasks required by remediation work is greater than what was originally estimated. As a result of the increased volume of contaminated soil and the increased per unit costs of remediating that soil, the current estimated cost of remediating Zones 2 and 3 has increased to $84.9 million.7
II. SITE BACKGROUND The U.S. Smelter and Lead Refinery, Inc. Superfund Site is located in the City of East Chicago, Indiana. The Site has been divided into two operable units (OUs). See Appendix A. Operable Unit 1 (OU1) is a predominantly residential neighborhood which is generally bounded on the north by East Chicago Avenue, on the east by Parrish Avenue, on the south by East 151st Street/149th Place, and on the west by the Indiana Harbor Canal. OU1 has been further subdivided in Zones 1, 2, and 3. See Appendix A. Operable Unit 2 (OU2) includes the 79-acre former USS Lead facility as well as groundwater beneath the entire Site. The Site was placed on the National Priorities List (NPL) in April 2009. Contamination in OU1 is largely derived from historic operations at three nearby facilities: (1) the USS Lead facility; (2) a facility formerly located in Zone 1 and owned and operated by subsidiaries of the Anaconda Copper and Mining Company (the “Anaconda facility”); and (3) the E. I. Du Pont de Nemours facility located just southeast of OU1 (the “DuPont facility”).
4 An RI determines the nature and extent of contamination at a site for the purposes of developing a ROD. EPA sampled 7.4% of properties in OU1 during the RI. 5 See Appendix B: Technical Memorandum: Final Comparison of Original Cost Estimates and Current Cost Estimates for Zones 2 and 3 of Operable Unit 1, USS Lead Superfund Site, at Table 1 (December 2017) (“Z2&3 ESD Technical Memorandum”). 6 Remedial design determines the extent of contamination at properties that are not sampled during the RI. 7 EPA has taken a conservative approach to the current cost estimate. Once remedial design is completed, EPA typically targets a cost estimate that is within +15% to -10% of the final cost. See A guide to Developing and Documenting Cost Estimates During the Feasibility Study, EPA 540-R-00-002, OSWER 93355.0-75 at 2-4 (July 2000). That said, the current estimate of $84.9 million includes a 20% contingency both because remedial design is not yet completed and because the original estimate used a 20% contingency. It is likely that the 20% contingency is high for both Zones, but especially for Zone 3 where more than 50% of the properties have already been remediated.

3
The USS Lead facility was constructed in 1906 and used an electrolytic process (the Betts process) to refine lead bullion that was shipped from Midvale, Utah, to East Chicago.8 Because lead refining produces a number of byproducts, the USS Lead facility also included various secondary metal treatment operations—such as secondary lead smelting—and operated a weed killer (lead arsenate) plant. In addition, throughout its history, the USS Lead facility accepted scrap lead from a variety of sources for treatment in its secondary lead smelting operations involving a blast furnace. In approximately 1972, the USS Lead facility stopped refining lead bullion and instead increased its blast furnace capacity to treat more scrap lead material. Operations at the USS Lead facility ceased in 1985. Among other sources of contamination from the USS Lead facility, slag from the blast furnace was routinely placed in piles on the ground and left exposed to the elements. Lead and arsenic particulate was disposed of into the environment as fumes from operations, as dust from the baghouses, and as dust from lead waste piles (e.g., slag and baghouse dust) stored on the grounds. The Anaconda facility operated three inter-related processes. In 1912, a lead refinery was built on the site and used a pyrometallurgical process to refine lead bullion that was shipped from Toole, Utah, to East Chicago. In 1919, a white lead plant was constructed to produce white lead for use as an ingredient in lead paint. Finally, in 1922, a zinc oxide plant was added to the facility. As with the USS Lead facility, the Anaconda facility also operated numerous secondary metal treatment processes. Byproducts of the operations included slag, lead waste, and arsenic. Among other sources of contamination, arsenic was burned off and was supposed to be recovered in flues and a baghouse. In addition, lead and arsenic particulate was disposed of into the environment in the same manner as with the USS Lead facility. Operation of the white lead process generated additional releases. Significant quantities of lead were refined from 1912 until 1946, when refining operations at the Anaconda facility ceased. However, secondary smelting and white lead production continued into the 1950s. The Anaconda facility was demolished over the course of the 1960s and early 1970s. In approximately 1972, the West Calumet Housing Complex was constructed on the facility’s footprint. The DuPont facility was constructed in 1892 to manufacture various organic and inorganic chemicals. Over the course of its operations, the DuPont facility produced over one hundred different chemicals, including lead and calcium arsenate (1910–1949) and zinc chloride (1900–1969). Among other sources of contamination, lead and arsenic particulate generated from these operations was disposed of into the environment as stack emissions, precipitator dust, and dust from exposed waste piles stored on the grounds of the site. General operations at the facility contracted significantly during the 1980s and 1990s. The DuPont facility is undergoing corrective action under federal RCRA authorities. Similarly, in the 1990s, USS Lead began a cleanup of its facility under state and federal RCRA programs. In the early 2000s, as part of RCRA corrective action at the facility, the scope of 8 The ROD incorrectly stated that the USS Lead facility was constructed to produce copper. EPA, USS Lead Record of Decision at 7 (Nov. 2012).

4
investigation was expanded somewhat beyond the facility’s boundaries into OU1. In 2007, responsibility for further investigation was transferred from EPA’s RCRA program to its Superfund program. Limited sampling was performed in 2007, resulting in the 2008 removal of contaminated soils from several residential properties. In April 2009, EPA placed the Site on the NPL. EPA performed its remedial investigation of OU1 from June 2009 to June 2012.9, 10 EPA’s completed remedial investigation identified lead and arsenic in soil as the contaminants of concern for OU1. Based on that investigation and on the corresponding feasibility study, EPA issued its Record of Decision for OU1 in November 2012. The remedy selected in the ROD was as follows:
• Excavation of soil that contains lead or arsenic in concentrations that exceed the Remedial Action Levels (for residential areas, the RALs are 400 ppm lead and 26 ppm arsenic); to a maximum excavation depth of 24 inches.
• Disposal of excavated soil at an off-site Subtitle D landfill; some excavated soils may require chemical stabilization prior to off-site disposal to address exceedances of the toxicity characteristic (TC) regulatory threshold. Contaminated soil that exceeds the TC threshold is considered principal threat waste.
• If contaminated soil is identified at a depth greater than 24 inches below ground surface (bgs), a visual barrier, such as orange construction fencing or landscape fabric, will be placed above the contaminated soil before the yard is backfilled with clean soil. Institutional controls will be implemented to protect the visual barrier that separates clean backfill from impacted soils and to ensure that users of the property are not exposed to contaminated soil that remains at depth.
• Excavated soil will be replaced with clean soil to maintain the original grade. The top 6 inches of fill will consist of topsoil. Each yard will be restored as close as practicable to its pre-remedial condition.
Consistent with the ROD and pursuant to a consent decree with two potentially responsible parties, from November 2014 to August 2016, EPA performed remedial design activities in Zones 1 and 3. Remedial design activities in Zone 2 began in August 2016 and is ongoing. Based on these remedial designs, EPA started remediation work in both Zones 2 and 3 in the fall of 2016 and
9 To date, it appears that soil contamination in the former USS Lead facility has largely been remediated through RCRA corrective action. Pursuant to a 2017 Administrative Settlement Agreement and Order on Consent between EPA and USS Lead, however, remaining contamination in OU2—that is, in the soil and in the groundwater under the entire Site—will be the subject of a remedial investigation beginning in early 2018. A proposed plan, public comment period, and record of decision for OU2 will follow that investigation. 10 In 2011, EPA performed additional soil removal actions at several residential properties in OU1 based on sampling data collected during the remedial investigation.

5
continued that work throughout 2017.11 As of December 2017, EPA has remediated 289 properties consistent with the ROD. Additional work will continue in 2018 and thereafter.12 III. EXPLANATION OF SIGNIFICANT DIFFERENCES AND NO CHANGE IN THE
REMEDY SELECTED A. Explanation of the Significant Differences EPA estimated that it would cost $22.8 million to remediate Zones 2 and 3 based on data generated during the remedial investigation and feasibility study. See App. B at Table 1. The principal assumptions underlying the original estimate were: (1) the number of contaminated properties; (2) the size of those properties; (3) the extent of contamination at those properties; and (4) the per unit cost of various tasks involved in remediation. The original cost estimate was based on a sample size of 7.4% of properties in OU1. At this time, approximately 90% of the properties in Zones 2 and 3 have been sampled. Based on the results of this sampling, EPA has determined that the number of properties requiring remediation, the size of those properties, and the extent of contamination at those properties are all greater than what was originally estimated. These changes have increased the total estimated volume of contaminated soil to be excavated from approximately 47,000 cubic yards to approximately 88,000 cubic yards. This increased quantity of soil correspondingly increased the construction management costs and the contingency costs and required a longer duration for remediation and oversight than originally estimated. In addition, based largely on more up-to-date engineering estimates, EPA has determined that the per unit cost of various tasks involved in remediation is greater than what was originally estimated. For example, the estimated rate for excavating and replacing one cubic yard of contaminated soil increased from $115 to $471. As a result of these major factors, the estimated cost to implement the selected remedy in Zones 2 and 3 is now $84.9 million. The Z2&3 ESD Technical Memorandum included as Appendix B provides a full explanation of the significant differences between the original and current cost estimate. B. No Change in the Remedy Selected In the 2012 ROD, EPA evaluated two remedial alternatives in addition to the one selected: (1) on-site soil cover plus institutional controls (Alternative 3); and (2) excavation to native sand plus off-site disposal (Alternative 4B).13 Alternative 3: Consistent with its determination in the ROD and upon further review, EPA has concluded that capping hundreds of residential yards and then implementing institutional controls 11 Soil remediation work in Zone 2 in 2016 and 2017 was performed pursuant to EPA’s removal authorities. However, that work was performed consistent with and after issuance of the ROD. 12 Work in Zone 1 has been put on hold. See Note 1. 13 As required by law, EPA also evaluated a “no action” alternative. That alternative remains inappropriate in light of the contamination that exists in Zones 2 and 3.

6
poses a number of technical, legal, and administrative difficulties. Among the technical challenges is the difficulty of developing effective, property-specific cap designs and grading. Capping would also result in significant topographic changes to the property, compared to the current remedy which restores properties to their existing use. These caps would require extensive operation and maintenance by individual property owners. Further, institutional controls required by a capping remedy would involve significantly greater restrictions and monitoring requirements that would burden the owners’ and tenants’ use of their property. Finally, capping is inconsistent with EPA’s preference for remedies that include treatment, which permanently and significantly reduces the toxicity, mobility, or volume of hazardous substances. Based on general community reactions at the July 25, 2012 public meeting held for the proposed plan and on extensive community engagement since then, EPA expects poor community acceptance of this alternative. Poor community acceptance could make it more difficult for EPA to secure access to implement the remedy and could significantly increase costs. Finally, 289 properties in Zones 2 and 3 have already been remediated pursuant to the preferred remedy selected in the ROD; it would be inappropriate and unfair for EPA to subject the owners and residents of properties that have not yet been remediated to a different, more burdensome remedy. Alternative 4B: The increased costs described above would proportionally increase the cost of Alternative 4B. Therefore, the reasons set forth in the ROD for not selecting Alternative 4B still apply at this time.
IV. SUPPORT AGENCY COMMENTS The Indiana Department of Environmental Management supports this proposed ESD.
V. FIVE YEAR REVIEWS
If this remedy results in hazardous substances, pollutants, or contaminants remaining on-site above levels that allow for unlimited use and unrestricted exposure, EPA will review the remedy no less often than every five years from the start of construction to ensure that the remedy is, or will be, protective of human health and the environment.
VI. AFFIRMATION OF STATUTORY DETERMINATIONS
The remedy selected in the 2012 ROD remains fundamentally unaltered, and the statutory determinations made in the ROD still apply. The significant change to the remedial action is an increase in the cost due primarily to an increase in the estimated volume of contaminated soil and an increase in the per unit costs of the remediation work.
The remedy will continue to be protective of human health and the environment and will comply with federal and state requirements that are legally applicable or relevant and appropriate to the remedial action. The remedy remains technically feasible, cost-effective and satisfies the requirements of CERCLA and the NCP.

7
VII. PUBLIC PARTICIPATION AND THE ADMINISTRATIVE RECORD Pursuant to NCP § 300.435(c)(i), EPA will publish a brief description of this ESD in the local newspaper. An electronic copy of this ESD will also be available online at: https://www.epa.gov/uss-lead-superfund-site. Further, EPA will hold a 60-day public comment period that will run from December 18, 2017 to February 16, 2018. A public meeting will be scheduled for January, where EPA will answer questions regarding this ESD and provide the public with further opportunities to provide comments. Because EPA will already hold a 60-day public comment period (instead of a typical 30-day public comment period), no extensions of time will be granted. EPA will review and consider all submitted comments before finalizing this ESD. Pursuant to NCP § 300.825(a)(2), once this ESD is finalized, it will become part of the Administrative Record file for the site. The Administrative Record for the response actions related to the site is available for public review at the following locations:
East Chicago Public Library 2401 East Columbus Drive East Chicago, IN 46312
East Chicago Public Library 1008 West Chicago Avenue East Chicago, IN 46312
The Administrative Record file and other relevant reports and documents are also available for public review at the EPA Region 5 office at the following location:
EPA Region 5 Records Center 77 West Jackson Boulevard – 7th Floor Chicago, IL 60604
Hours: Monday to Friday: 8:00 am – 4:00 pm
Finally, the Administrative Record is available online at: https://www.epa.gov/uss-lead-superfund-site. For any questions regarding this ESD, please contact:
Tim Drexler Remedial Project Manager Region 5, US EPA 77 West Jackson Boulevard (SR-6J) Chicago, IL 60604-3590 [email protected]
Sarah Rolfes Remedial Project Manager Region 5, US EPA 77 West Jackson Boulevard (SR-6J) Chicago, IL 60604-3590 [email protected]

APPENDIX A MAP OF USS LEAD SUPERFUND SITE
APPENDIX A: USS Lead Superfund Site Operable Units, Zones, and DuPont Facility

APPENDIX B TECHNICAL MEMORANDUM: FINAL COMPARISON
OF ORIGINAL COST ESTIMATE AND CURRENT COST ESTIMATES FOR ZONES 2 AND 3 OF OU1

REMEDIAL ACTION CONTRACT 2
REGION 5
TECHNICAL MEMORANDUM:
COMPARISON OF ORIGINAL AND CURRENT COST ESTIMATES FOR REMEDIAL ACTION IN ZONES 2 AND 3 OF OPERABLE UNIT 1
U.S. SMELTER AND LEAD RESIDENTIAL AREA SUPERFUND SITE EAST CHICAGO, LAKE COUNTY, INDIANA
Prepared for: U.S. ENVIRONMENTAL PROTECTION AGENCY
Region 5 77 West Jackson Boulevard
Chicago, IL 60604
Prepared by: SulTRAC
Date Submitted: December 4, 2017 EPA Region: 5 Work Assignment No: 327-TATA-0528 Contract No: EP-S5-06-02 Prepared by: SulTRAC Project Manager: Rik Lantz Telephone No: (312) 265-6125 EPA Work Assignment Manager: Sarah Rolfes / Tim Drexler Telephone No: (312) 886-6551 / (312) 363-4367

Technical Memorandum December 2017 Comparison of Original and Current Cost Estimates for Zones 2 and 3, USS Lead Superfund Site Work Assignment No. 327-TATA-0528
1
EXECUTIVE SUMMARY
This technical memorandum was prepared to compare estimated costs to remediate all properties in Zones 2 and 3 at the USS Lead site as estimated in the 2012 Feasibility Study, with a current cost estimate based on current remedial designs. The 2012 FS costs were estimated based on limited sampling conducted during the remedial investigation and on then-assumed unit rates for conducting various remediation tasks. The current estimated costs are based on a much more precise estimate of the total number of properties that will require remediation and volumes of contaminated soils present at each property, based on remedial design sampling conducted from 2014 to 2017, and on updated cost assumptions for the unit rates for the various tasks. The 2012 FS estimated that remediating all contaminated properties in Zones 2 and 3 would cost approximately $22.8 million. The current estimate to remediate all properties in Zones 2 and 3 is $84.9 million.
The principal underlying causes for the disparity between costs estimated in 2012 and current estimates are differences in quantities of contaminated soils that need to be removed and replaced and differences in unit rates. Specifically:
• Estimated quantities of soils that require remediation have nearly doubled from 47,250 cubic yards estimated in the 2012 FS to a current estimate of 88,300 cubic yards.
• Estimated unit rates such as costs to excavate and backfill each cubic yard of soil have increased significantly from the FS to the current estimate based on more labor-intensive excavation, higher wages paid to laborers, and a higher level of oversight than assumed for the FS.
• The increased quantity of soils to be remediated increased construction management costs and required a longer duration of remediation and oversight.
• Contingency costs across all tasks increased with the increased volume of soil and higher unit rates.
1.0 INTRODUCTION
SulTRAC received Work Assignment 327-TATA-0528 under Contract Number EP-S5-06-02 to compare estimated costs to remediate properties in Zones 2 and 3 of the U.S. Smelter and Lead Refinery, Inc. Superfund Site (USS Lead Site or Site), East Chicago, Lake County, Indiana that were presented in the Feasibility Study (SulTRAC 2012a) with current estimates using updated quantities and unit rates based on RD sampling conducted to date and revised engineering estimates. The Feasibility Study compared estimated costs for three areas within Operable Unit 1 (OU1) for four different remedial alternatives considered (SulTRAC 2012a). This Technical Memorandum only considers costs associated with the selected alternative (Alternative 4A – Excavation of Soil Exceeding RALs + Off-Site Disposal + Ex Situ Treatment Option).
A total of eighty-eight properties were sampled during the RI in a rough grid pattern at a frequency of two to three properties per block to provide spatial coverage of the entire site. The FS and Record of Decision (ROD) (EPA 2012) for the site divided operable unit 1 (OU1) into the northwestern, southwestern, and eastern geographic areas, based on similar incidence and levels of contamination in these areas. In 2014, after the FS was completed, OU1 was divided into three different geographic areas designated as Zones 1, 2, and 3. In 2014, SulTRAC reallocated the costs for the three areas identified in the FS into costs

Technical Memorandum December 2017 Comparison of Original and Current Cost Estimates for Zones 2 and 3, USS Lead Superfund Site Work Assignment No. 327-TATA-0528
2
associated with the three zones. Estimated costs to remediate all properties within OU1 were simply divided into different geographical groups between the FS and 2014. Total estimated costs for the three areas identified in the FS are equal to total estimated costs for the three zones identified in 2014, except for rounding errors.
The ROD estimated total remediation costs of $29.9 million for the northwestern, southwestern, and eastern areas. These same costs of $29.8 million were reallocated to Zones 1, 2, and 3 in 2014. (The $100,000 difference between the total estimated costs included in the ROD and the reallocated 2014 costs is due to rounding.) Because the remedial alternative for Zone 1 (the West Calumet Housing Complex) is currently being reviewed and possibly modified, this discussion is limited to Zones 2 and 3.
Based on the costs from the three areas presented in the ROD as reallocated to the three zones in 2014, a total cost of $22.8 million was estimated to remediate Zones 2 ($13.4 million) and Zone 3 ($9.4 million) (Table 1). These costs will subsequently be called the “original” costs. Tables 2, 3, and 4 show the basis for the original cost estimates. Based on an original estimate of 512 properties that require remediation in Zones 2 and 3, a per property remediation cost of approximately $44,500 per property was estimated.
This memorandum has been prepared to identify differences between the original estimated costs and current estimated costs to remediate properties in Zones 2 and 3, and to explain the basis for the differences. Major cost categories to remediate Zones 2 and 3 as originally estimated and as currently estimated are presented below.
Cost Estimates to Remediate Zones 2 and 3 USS Lead Superfund Site
East Chicago, Indiana 2012 Feasibility Study Current Cost Estimate Cost difference Pre-remedial design sampling $1,500,000 $3,900,000 $2,400,000 Remedy construction $15,000,000 $59,400,000 $44.400,000 Engineering and Construction Management
$2,400,000 $7,400,000 $5,000,000
O&M $ 62,000 $ 62,000 $0 Contingency $3,800,000 $14,100,000 $10,300,000 Total Estimated Cost $22,800,000 $84,900,000 $62,100,000
Note: Individual costs do not sum to total costs due to rounding.
2.0 BASIS FOR ORIGINAL COST ESTIMATE
As part of the Feasibility Study, estimated costs to remediate properties under remedial alternative 4A were derived from the estimated number of yards to be remediated and various components of the remedy including (1) costs to sample and prepare remedial designs for each property, (2) costs to excavate contaminated soils, (3) costs to transport and dispose (T&D) of contaminated soils, (4) costs to backfill excavated areas, (5) costs to restore properties, (6) contractor oversight costs, (7) engineering and construction management, and so on.
RI sampling and RD sampling was based on “yards,” defined as individual remediation units that consisted of front or back yards at typical residential properties, quadrants at larger properties, and other individual

Technical Memorandum December 2017 Comparison of Original and Current Cost Estimates for Zones 2 and 3, USS Lead Superfund Site Work Assignment No. 327-TATA-0528
3
units such as side yards, gardens, and areas where soil was relocated. Sampling results from the RI showed little correlation in contamination in front yards, back yards, and quadrants at a single property. Consequently, remediation costs were estimated based on individual yards, rather than individual properties.
Pre-remedial design sampling: Anticipated costs to sample each property were estimated based on the number of properties to sample, and past experience sampling properties during the RI. Estimated analytical costs assumed that samples would be analyzed by CLP laboratories or X-ray fluorescence, and that a small number of samples would be submitted to a private laboratory for TCLP analyses. The original estimate assumed that approximately 14 hours per property would be required to secure access and collect five-point composite samples from all of the yards at a particular property. A pre-remedial design sampling cost of $1.5 million was originally estimated.
Remedy construction: Remedy construction costs to remediate all properties in Zones 2 and 3 that were anticipated to require remediation were estimated by identifying each step in the remedial process, estimating unit rates and the number of units to execute that step, and summing the costs associated with each step to derive a total cost. Soil excavation costs, T&D costs, and backfill costs were based on the estimated volume of soil to be removed and replaced with clean fill, which was calculated using the estimated number of yards that would require remediation, the average size of the yards, and the percentage of yards that would require remediation to 6-, 12-, 18-, and 24-inches, based on sampling 88 of 1195 properties in Zones 1, 2, and 3 (7.4%) (see Tables 2 and 3).
The estimated volumes of soil and areas of each yard were multiplied by unit rates for various components of the remedy such as excavation of contaminated soils, backfill placement, topsoil placement, and restoration by seeding or installing sod over backfilled areas. Unit rates for each of the major components of the remedial process that were used for the original cost estimate are shown in Table 1. Descriptions of tasks included in each unit rate are detailed in Table 4. Unit rates presented originally were typically assigned based on engineering judgement or by project experience at other residential soil remediation sites such as the Jacobsville site in Evansville, Indiana.
Remedial contractor oversight costs were accounted for both as a subtask within “Remedy Construction” labeled “Contractors Oversight, Health and Safety, and Quality Control”, and as part of “Engineering and Construction Management”. Costs of $35,000 per month for 22 months were estimated for Contractor's Oversight, Health & Safety, and Quality Control. Based on unit rates used, this corresponds with 2 personnel providing remedial contractor oversight.
A total remedy construction cost of approximately $15 million was estimated to remediate all properties in Zones 2 and 3 based on estimated quantities derived from the RI sampling and estimated unit rates.
Engineering and construction management: Costs for preparing remedial designs, procuring a remedial contractor, onsite construction management, and reporting were estimated at a rate of $35,000 per month plus 10% of construction cost for a total $2.4 million. A total duration of 22 months was estimated to remediate an estimated 512 properties in Zone 2 and 3 with 2 more personnel providing remedial contractor oversight (these were in addition to the two oversight personnel providing oversight under the remedy construction task).

Technical Memorandum December 2017 Comparison of Original and Current Cost Estimates for Zones 2 and 3, USS Lead Superfund Site Work Assignment No. 327-TATA-0528
4
Operations and maintenance: A cost of $62,000 was originally estimated to conduct unspecified operations and maintenance (O&M) and five-year remedy reviews in Zones 2 and 3.
Contingency: A contingency of 20% of anticipated sampling costs, remedy construction costs, engineering and construction management costs, oversight and reporting, and O&M costs was added to the project subtotal cost to cover contingencies. The estimated contingency cost amounted to $3.8 million.
Based on the costs discussed above, a total project cost of $22.8 million was originally estimated to remediate all Zone 2 and 3 properties.
3.0 CURRENT COST ESTIMATES
Current cost estimates are based on units, unit rates, and cost assumptions that were updated based on current pricing and much more extensive RD sampling. The current cost estimate presented in Table 1 incorporates both the currently estimated units (such as volume of soil to be remediated) and current unit rates (such as cost to excavate and backfill each cubic yard of soil) and are based on current remedial designs and current unit rates. Current unit rates were derived in small part from actual incurred costs but predominantly from the Engineer’s Estimate of the most recent remedial design report (SulTRAC 2017).
Specifically, SulTRAC provides a detailed Engineer’s Estimate with each group of remedial designs submitted to the EPA for the USS Lead Site. The most recent RD document (SulTRAC 2017) submitted to EPA in September of this year included remedial designs for 94 Zone 3 properties and, in Appendix E, it included total estimated costs to remediate those 94 properties. That “Engineer’s Estimate” is attached to this technical memorandum as Appendix A.
From the Engineer’s Estimate, the total costs and units (i.e. yards, cubic yards, square yards) to remediate 94 Zone 3 properties were used as a basis to develop the new unit rates used in this document. To simplify the comparison between the more detailed cost categories used in the Engineer’s Estimate to the less detailed categories used in the original cost estimate, each cost category from the Engineer’s Estimate was mapped to a cost category used in the original estimate as detailed in Table 4. For example, to derive the new unit rate for Contaminated Soil Excavation and Backfilling, total estimated costs for 6 categories from the Engineer’s Estimate (Excavation [mechanical], Excavation [manual], Backfill Placement, Topsoil Placement, Gravel Placement, and Geotechnical Testing) were summed ($4,883,711) and divided by the total cubic yardage being excavated from the 94 properties (10,362 yd3), to derive a new unit rate of $471/yd3 for Contaminated Soil Excavation and Backfilling. Current unit rates for all categories from the original cost estimate and their derivations are detailed in Table 4.
Pre-remedial design sampling: SulTRAC has sampled 966 properties in Zones 2 and 3 and has incurred actual costs of $2.8 million to sample these properties. The actual sampling cost was derived by adding costs expended under the field investigation / data acquisition task (Task 3), sample analysis acquisition (Task 4), analytical support / data validation (Task 5), data management (Task 6), and project management (Task 1) of work assignments (WA) 198, 308, and 320 from May 2015 to the present. Through October 2017, SulTRAC has expended $2.8 million including $430,000 in travel costs, subcontractors, and other direct costs, and approximately $2.4 million and 29,000 hours of labor to obtain access, sample, and manage resulting data for 966 properties in Zones 2 and 3 (approximately $2,900 per property).

Technical Memorandum December 2017 Comparison of Original and Current Cost Estimates for Zones 2 and 3, USS Lead Superfund Site Work Assignment No. 327-TATA-0528
5
111 properties remain to be sampled, due to lack of access from the owner of record. Thirteen of these properties were not sampled because the property owner refused access. Assuming that SulTRAC samples the remaining 98 properties and incurs the same estimated cost per property to sample them, additional sampling costs of approximately $282,000 are anticipated. Therefore, a total cost of approximately $3.1 million is estimated to sample all properties in Zones 2 and 3.
Contract laboratory program (CLP) laboratory costs of approximately $876,500 have been incurred to date, as reported by EPA on November 28. These actual laboratory costs have been included along with sampling costs to derive a total estimated pre-remedial design sampling cost of $3.9 million in the current cost estimate.
Remedy construction: Remedy construction costs to remediate all properties in Zones 2 and 3 that are expected to require remediation are presented as “Current cost estimate” in Table 1. To date, SulTRAC has sampled approximately 966 of the 1,077 properties in Zones 2 and 3 (90%). The total number of properties in Zones 2 and 3 decreased from the original count of 1,153 to the current count of 1,064 for several reasons including combining adjacent parcels with common ownership into single properties, zoning changes, and not counting properties where the owners refused to allow sampling or remediation. Based on sampling conducted to date, 713 of the 966 properties sampled in Zones 2 and 3 (74%) are known to require remediation. If 74% of the 98 properties that have not yet been sampled also require remediation, 72 additional properties and a total of 785 properties in Zones 2 and 3 will require remediation.
Current estimated costs presented in Table 1 are based on (1) volumes of soil to be removed, which are known much more precisely based on RD sampling of 90% of properties in Zones 2 and 3 than the original costs, which were based on sampling only 7.4% of properties, and (2) current estimated unit rates, which are based on a much more detailed cost estimate prepared for a recent remedial design document (SulTRAC 2017).
Using the limited sampling conducted during the RI, SulTRAC estimated that approximately 47,250 cubic yards (CY) of soil in Zones 2 and 3 would require excavation, disposal, and replacement with clean fill. Based on the much more extensive sampling conducted during the remedial design (RD), SulTRAC now estimates that a total of 88,300 CY of soil in Zones 2 and 3 will require excavation, disposal, and replacement with clean fill, about double the original estimate. The 88,300 CY consists of approximately 69,700 CY of soil estimated for the 713 properties currently known to need remediation plus an estimated 18,600 CY of soil for the remaining 98 properties that have not yet been sampled. (Note: many of the properties that have not yet been sampled are commercial properties and railroad rights-of-way and therefore the average property size for these properties is considerably larger than the average size of the sampled properties.)
Treatment and disposal costs for the updated estimate are based on actual costs incurred of $40 per ton, as reported by EPA on November 27. Remedial designs provide volume of soil to be excavated and disposed of, but disposal of this material is priced in tons. For the purposes of estimating costs here, volume is converted to weight using density of the material, which depends on variables such as water content, soil composition, and inclusion of foreign materials such as bricks, debris, and slag. A disposal cost of $40 per ton and density conversion of 1.15 tons per cubic yard resulted in the disposal cost of $46 per cubic yard used for this cost estimate.

Technical Memorandum December 2017 Comparison of Original and Current Cost Estimates for Zones 2 and 3, USS Lead Superfund Site Work Assignment No. 327-TATA-0528
6
Based on updated units and unit rates, the remedy construction task for all properties in Zones 2 and 3 is now estimated at $59.4 million.
Engineering and construction management: The original engineering and construction management cost category included remedial design costs and as well as procurement, contractor oversight and reporting costs. Thus, we include estimates for these costs in the current estimate.
• Remedial design costs: To date, SulTRAC has prepared remedial designs for approximately 500 properties in Zones 2 and 3, at a cost of approximately $380,000 ($760 per remedial design). This estimated cost to prepare remedial designs was calculated by adding the costs incurred under the Pre-final/Final design task (Task 11) of WAs 198, 308, and 320 from May 2015 to the present. Assuming that a total of 785 remedial designs will need to be prepared at a cost of $760 per remedial design, a total of approximately $600,000 is estimated to prepare remedial designs for all properties in Zones 2 and 3 that may ultimately require remediation. These costs were included in engineering and construction management unit costs.
• Procurement, contractor oversight and reporting costs: The Engineer’s Estimate for 94 Zone 3 properties (SulTRAC 2017) included estimated costs to procure a remedial contractor, provide remedial oversight, and prepare a remedial action report. As noted above, remedial oversight costs appear in two locations in the original cost estimate: as a “Contractor’s Oversight, Health and Safety, and Quality Control” subtask included in the “Remedy Construction” task and separately in the “Engineering and Construction Management” task. SulTRAC assigned the Engineer’s Estimate subtasks to the Contractor’s Oversight task or the Remedy Construction task as shown in Table 4. Because the original construction management costs were estimated on a monthly rate, SulTRAC divided the Engineer’s Estimate totals by the seven months expected to complete the 94-property remedial project to derive an equivalent monthly rate for the current cost estimate that could be compared to the original cost estimate. The total duration to complete remediation of all properties in Zones 2 and 3 is now expected to be 48 months. This duration was estimated by prorating the 14 months of work required in 2017 to remediate 229 Zone 2 and 3 properties (16.4 properties per month) to derive the 48-month period required to remediate all 785 properties that are expected to require remediation.
Contingency: A contingency cost of $14.1 million is estimated for the project, based on 20% of the remedial design sampling costs, remedy construction costs, and oversight and reporting costs for Zones 2 and 3.
Institutional controls and operations and maintenance costs: Institutional controls and O&M costs are a relatively minor component of the total cost for the remedy and were not updated.
4.0 COMPARISON OF ORIGINAL COST ESTIMATE WITH CURRENT COST ESTIMATE
Based on the original cost estimate, which was prepared using the very limited RI sampling and estimated unit rates, and the current cost estimate, which is based on the much more detailed RD sampling and a much more detailed evaluation of unit rates using updated material, equipment, and labor costs, a cost difference of $62.1 million was identified. The basis for this cost difference is detailed below:

Technical Memorandum December 2017 Comparison of Original and Current Cost Estimates for Zones 2 and 3, USS Lead Superfund Site Work Assignment No. 327-TATA-0528
7
Pre-remedial design sampling: Estimated costs to conduct predesign sampling have increased by approximately $2.4 million between the original and current estimates, as shown in Table 1. The original estimate assumed a cost of $1,315 to sample each property, for a total cost of $1.5 million to sample all properties in Zones 2 and 3. A cost of $3.9 million is now estimated to sample all properties in Zones 2 and 3 as described under pre-remedial design in Section 3.
Increases in sampling and analysis costs from the original estimate were caused by several factors, including:
• Sampling deeper than originally assumed: The original estimate assumed that sampling would cease when zones of refusal were encountered; In fact, sampling at the majority of properties was advanced to 2.5 feet below ground surface using the much more labor-intensive pry bars, pick axes, and in some cases, a subcontracted mechanical excavation contractor.
• Use of contract laboratory program (CLP) laboratories instead of X-ray fluorescence (XRF) field instruments to measure lead and arsenic content of soil samples from Zone 2: To achieve more rapid turn-around time for individual samples so that work in Zone 2 could begin together with work in Zone 3, and to avoid delays associated with generating a complete data set to create an XRF correction factor, SulTRAC sent all samples from Zone 2 and selected samples from Zone 3 to CLP laboratories for analysis, at costs of $790,000 and $86,500, respectively. CLP laboratory costs were not included in the FS cost estimate.
• Use of private laboratories and third-party data validators: To achieve more rapid analytical turn-around time, SulTRAC sent selected samples to a private laboratory. SulTRAC incurred costs of approximately $92,000 to analyze samples and validate data that was not included in the original cost estimate.
• Data management: To make data available to the various stakeholders in the project, SulTRAC conducted intensive data management activities, including entering all field data in field tablet computers, the SCRIBE database, and a Geoportal and producing numerous graphics.
Remedy Construction: Estimated costs for remedy construction have increased by approximately $44.4 million between the original and current estimates, as shown in Table 1. These differences are driven primarily by a difference in the estimated volume of soil to be remediated and the increased unit rates for soil excavation and backfill.
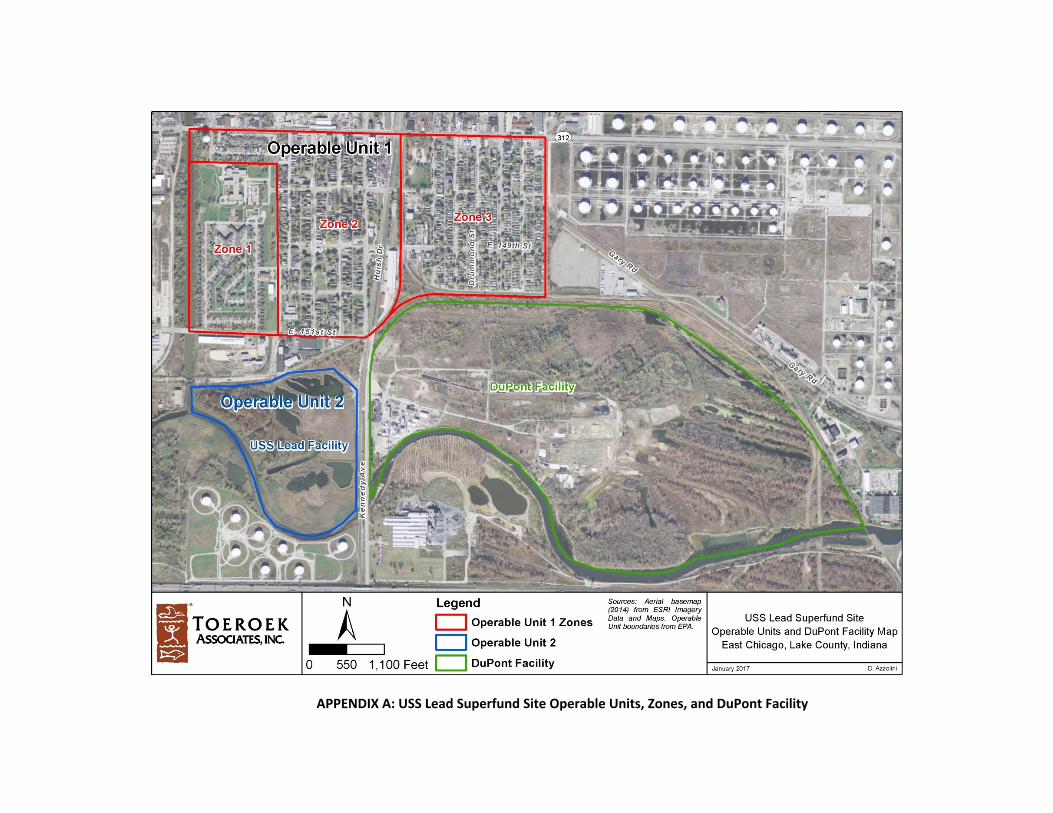
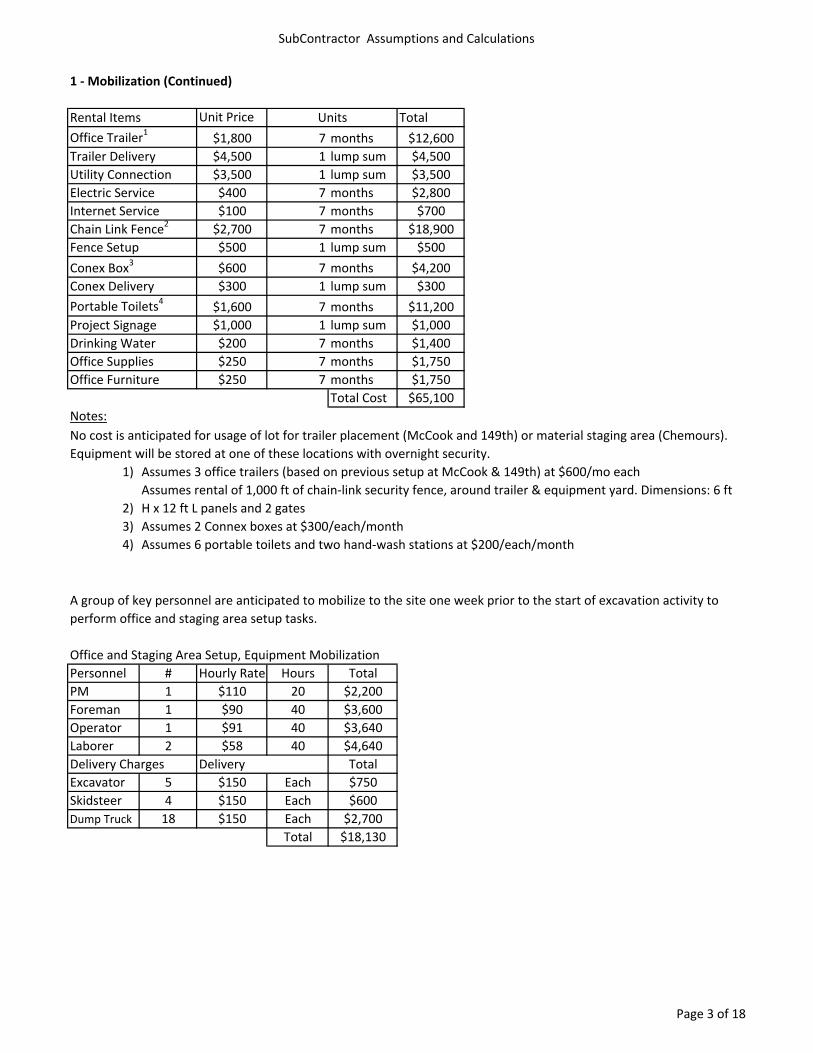
The differences between original and current estimates of soil volumes that require remediation are shown in Table 3. Using the limited sampling conducted during the RI, SulTRAC originally estimated that approximately 47,250 cubic yards (CY) of soil in Zones 2 and 3 would require excavation, disposal, and replacement with clean fill. Based on the much more extensive sampling conducted during the remedial design (RD), SulTRAC now estimates that a total of 88,300 CY of soil in Zones 2 and 3 will require excavation, disposal, and replacement with clean fill, about double the original estimate.
The primary reasons for the increase in estimated soil volume are that the average estimated size of the yards to be remediated has increased, the estimated number properties requiring remediation has increased, and the estimated depth of required remediation at these properties has increased from the original estimates.

Technical Memorandum December 2017 Comparison of Original and Current Cost Estimates for Zones 2 and 3, USS Lead Superfund Site Work Assignment No. 327-TATA-0528
8
• Average size of yards: As shown in Table 2, the average yard sizes originally used to estimate costs were smaller than the current estimated excavation areas used for the current estimated costs. The properties sampled during the Remedial Investigation were selected to achieve an even spatial distribution of properties throughout OU1 rather than on anticipated contaminant concentrations or the size of the property. For the original estimate, only those properties that were sampled were considered when estimating the average yard size.
Average yard size for residential properties increased from 1,254 ft2 to 1,406 ft2 in Zone 2 and from 900 ft2 to 1,512 ft2 in Zone 3. The increase in yard size between the original and current estimates was caused by using a much larger sample size (90% of properties sampled for current estimate vs. 7.4% of properties sampled used for original estimate) and to some degree by combining adjacent parcels with common ownership into single properties for the RD.
Yard size estimates for commercial properties used in the original estimate were biased low because some larger properties (including utility corridors and commercial properties) were not considered during the Feasibility Study, although this effect was mitigated to some extent by including the parks that were sampled.
• Number properties requiring remediation: The estimated number of Zone 2 and Zone 3 properties requiring remediation increased from 512 to 785 (494 in Zone 2 and 291 in Zone 3). This increase was caused by a higher incidence of contamination detected during the more comprehensive sampling of the RD (90% of properties) than the RI (7.4% of properties).
• Depth of required remediation: The original estimate assumed that a small percentage of the properties would require remediation to deeper soil intervals. For example, it was originally assumed that 4% of the residential properties in Zone 2 and 3% of the residential properties in Zone 3 would require remediation to 24-inches. Based on the much more extensive RD sampling, SulTRAC now estimates that 17% of the residential properties in Zone 2 and 14% of the residential properties in Zone 3 will require remediation to 24-inches (see Table 3).
• Unit rates: The estimated unit rates for activities such as preconstruction activities, excavation and backfill, and oversight have increased significantly between the FS and current estimates. Causes for this increase include:
o Labor costs from 2012 were updated based on 2017 prevailing wage requirements (original labor costs were not based on prevailing wages);
o Changes in material and equipment costs from 2012 to 2017;
o Inclusion of manual excavation that was not considered in the formulation of the original cost estimate;
o The original oversight costs assumed four persons would provide oversight (split between construction management and remedy construction), current estimates assume that a team of seven persons will provide remedial construction oversight.
Engineering and construction management: Estimated engineering and construction management costs have increased by approximately $5.0 million between the original and current estimates, as shown in Table 1. Estimated engineering and construction management costs are based on 10% of estimated remedy

Technical Memorandum December 2017 Comparison of Original and Current Cost Estimates for Zones 2 and 3, USS Lead Superfund Site Work Assignment No. 327-TATA-0528
9
construction costs, plus an estimated duration of the project multiplied by a monthly construction oversight cost. Most of the cost difference between the original and the current estimate is the result of the increased remedy construction cost. The expected increase in project duration from 22 months to 48 months accounts for about $140,000 of the cost difference.
5.0 SUMMARY
The disparity between the original cost estimate and the current estimate is accounted for primarily by a difference in quantities of contaminated soils that need to be removed and replaced and differences in unit rates. The principal underlying causes that have increased costs are:
• Estimated volumes of soils that require remediation have increased substantially. The original excavation volume was based on a small sample size of 7.4% of properties and the current estimate is based on much more robust RD soil sampling of 90% of properties in Zones 2 and 3. The RD sampling has shown that more yards require remediation than were originally estimated, and the contaminated intervals are larger and deeper than anticipated.
• Estimated unit rates such as costs to excavate and backfill each cubic yard of soil have increased significantly based on higher wages paid to laborers, a higher level of oversight, and manual excavation that was not considered originally.
• The increased quantity of soils to be remediated increased construction management costs and also required a longer duration of remediation and oversight.
• Contingency costs across all tasks increased with the increased volume of soil and higher unit rates.

Technical Memorandum December 2017 Comparison of Original and Current Cost Estimates for Zones 2 and 3, USS Lead Superfund Site Work Assignment No. 327-TATA-0528
10
6.0 REFERENCES
SulTRAC 2012a. “Feasibility Study, US Smelter and Lead Refinery Superfund Site, Lake County, Indiana.” June 20.
SulTRAC 2012b. “Remedial Investigation Report, U.S. Smelter and Lead Refinery Superfund Site, Lake County, Indiana.” June 20.
SulTRAC 2017. “Draft Remedial Design for 94 Zone 3 Properties, U.S. Smelter and Lead Residential Area Superfund Site East Chicago, Lake County, Indiana.” September.
U.S. EPA 2012. “U.S. Smelter and Lead Refinery, Inc. Superfund Site, Operable Unit 1, East Chicago, Lake County, Indiana, Record of Decision.” November.

Unit Rates Unit Rates2012 FS Current 1
Estimate Category Units Zone 2 Zone 3 Total Zone 2 Zone 3 Total Zone 2 Zone 3 Total Zone 2 Zone 3 Total PRE-REMEDIAL DESIGN SAMPLINGSample Collection Labor & Other Direct Costs
Total Properties * Rate Total Properties $1,315 $2,873 639 514 1,153 594 470 1,064 (89) $840,700 $676,000 $1,516,700 $1,706,562 $1,350,310 $3,056,872 $1,540,172Contract laboratory program (CLP) laboratory costs 4
Lump sum $790,000 $86,500 $876,500 $876,500Pre-remedial Design subtotal $841,000 $676,000 $1,500,000 $2,500,000 $1,400,000 $3,900,000 $2,400,000
REMEDY CONSTRUCTION
Preconstruction Activities 5Yards Requiring Remediation * Rate + Flat Cost of $144,000 per Zone
Unremediated Yards $83 $1,530 626 479 1,105 991 479 1,470 365 $196,000 $180,000 $376,000 $1,516,834 $732,385 $2,249,219 $1,873,219
Site Preparation and Design Agreements Estimated Total Area * RateTotal Area
(sq yd) $7.50 $5.59 96,698 66,796 163,494 163,050 99,813 262,862 99,369 $730,000 $500,000 $1,230,000 $911,447 $557,953 $1,469,400 $239,400
Institutional Controls $5,000 Lump Sum Per Zone Zones $5,000 $5,000 1 1 2 1 1 2 - $5,000 $5,000 $10,000 $5,000 $5,000 $10,000 $0Contaminated Soil Excavation and Backfilling
Estimated Total Volume * RateTotal Volume
(cu yd) $115 $471 28,093 19,157 47,250 55,647 32,642 88,288 41,038 $3,231,000 $2,203,000 $5,434,000 $26,209,547 $15,374,272 $41,583,819 $36,149,819Contaminated Soil Transportation and Disposal
Estimated Total Volume * Rate Volume (cu yd) $79 $46 28,093 19,157 47,250 55,647 32,642 88,288 41,038 $2,219,000 $1,513,000 $3,732,000 $2,559,743 $1,501,521 $4,061,265 $329,265
Soil Barrier for Soil Below 24 inchesTotal Area
(sq yd) $1.35 34,240 20,961 55,201 $2,000 $1,000 $3,000 $46,225 $28,297 $74,521 $71,521
Property Restoration Estimated Total Area * RateTotal Area
(sq yd) $21 $15 96,698 66,796 163,494 163,050 99,813 262,862 99,369 $2,036,000 $1,407,000 $3,443,000 $2,445,745 $1,497,190 $3,942,934 $499,934Contractor's Oversight, Health & Safety, Quality Control
Duration in Each Zone * Rate Months $35,000 $125,407 13 9 22 31 17 48 26 $455,000 $315,000 $770,000 $3,887,617 $2,131,919 $6,019,536 $5,249,536Construction Subtotal $8,900,000 $6,100,000 $15,000,000 $37,600,000 $21,800,000 $59,400,000 $44,400,000
ENGINEERING & CONSTRUCTION MANAGEMENT
Duration in Each Zone * Rate + 10% of Construction Subtotal + $760 per design
Months $35,000 $18,993 13 9 22 31 17 48 26 $1,435,000 $995,000 $2,430,000 $4,681,420 $2,701,785 $7,383,205 $4,953,205
OPERATIONS AND MAINTENANCE $35,000 $27,000 $62,000 $35,000 $27,000 $62,000 $0Project Subtotal $11,200,000 $7,800,000 $19,000,000 $44,800,000 $26,000,000 $70,800,000 $51,800,000
20% Contingency 20% of Project Subtotal $2,240,000 $1,560,000 $3,800,000 $8,960,000 $5,200,000 $14,160,000 $10,360,000Project Total $13,400,000 $9,400,000 $22,800,000 $53,800,000 $31,200,000 $84,900,000 $62,100,000
1 - All values are taken from the last column in Table 42 - Difference in number of units between original and current estimates3 - Cost difference between original and current estimate 4 - Contract laboratory costs were not included in original estimate, current cost estimate includes actual costs for CLP analytical services and data validation5 - Preconstruction activities: A flat cost of $144,000 for mobilization and project plans used in original estimate was not prorated to per property unit rate
Note: Values in this table have been rounded
Difference 3Current Cost Estimate
Original cost estimate Current cost estimate Difference 2
Table 1Original Cost Estimate vs Current Cost Estimate
USS Lead East Chicago, Indiana
Number of Units Number of Units Original Cost Estimate

Number of Yards Property type
% Yards Requiring
RemediationYards Requiring
Remediation
Properties Requiring
Remediation
Average Excavation Area per Yard (sq ft)
Total area requiring
remediation (sq ft)
Total area by property type
(sq ft)
Total volume by property type
(cu yd)Zone 2Residential 1,154 Residential 53% 612 306 1,254 767,448 767,448 24,332 Park/school/church 28 50% 14 4 7,345 102,830 Industrial/commercial/easement 220 0% - - 984 -
Zone total 1,402 626 310 870,278 28,093 Zone 3Residential 974 Residential 41% 399 182 900 359,100 359,100 11,104 Park/school/church 12 67% 8 2 10,026 80,208 Industrial/commercial/easement 96 75% 72 18 2,248 161,856
Zone total 1,082 479 202 601,164 19,157 TOTAL 2,484 1,105 512 1,471,442 47,250
Number of Yards Property type
% Yards Requiring
RemediationYards Requiring
Remediation
Properties Requiring
Remediation
Average Excavation Area per Yard (sq ft)
Total area requiring
remediation (sq ft)
Total area by property type
(sq ft)
Total volume by property type
(cu yd)Zone 2Residential 1,366 68% 934 465 1,406 1,246,167 Park/school/church 72 40% 29 13 2,644 58,463 Industrial/commercial/easement 120 Commercial 24% 29 16 4,367 162,816 162,816 8,367
Zone total 1,558 991 494 1,467,447 55,647 Zone 3Residential 948 46% 434 272 1,512 644,691 Park/school/church 13 38% 5 2 18,588 34,772 Industrial/commercial/easement 109 Commercial 36% 39 17 5,276 218,850 218,850 9,202
Zone total 1,070 479 291 898,314 32,642 TOTAL 2,628 1,470 785 2,365,760 88,288 *Totals may not reflect counts due to rounding
Current Estimate
Residential
Residential
1,304,630 47,280
679,463 23,440
Commercial 242,064 8,053
Table 2Remedial Soil Areas and Volumes Based on Depth
USS LeadEast Chicago, Indiana
Commercial 102,830 3,761
Original Estimate
Total Area Requiring
Remediation (sq ft)
Percent RAL Exceedances
0-6"
Volume 0-6 inches
(cu yd)
Percent RAL Exceedances
0-12"
Volume 0-12 inches
(cu yd)
Percent RAL Exceedances
0-18"
Volume 0-18 inches
(cu yd)
Percent RAL Exceedances
0-24"
Volume 0-24 inches
(cu yd)Total Volume
(cu yd)Zone 2Residential 767,448 42% 5,898 49% 13,786 6% 2,430 4% 2,218 24,332 Park/school/church 102,830 31% 590 50% 1,910 10% 577 9% 684 3,761 Industrial/commercial/easement - 0% - 0% - 0% - 0% - -
Zone Total 870,278 28,093 Zone 3Residential 359,100 44% 2,925 48% 6,384 5% 998 3% 798 11,104 Park/school/church 80,208 36% 538 53% 1,579 6% 258 5% 285 2,660 Industrial/commercial/easement 161,856 35% 1,052 54% 3,240 7% 621 4% 480 5,393
Zone Total 601,164 19,157 TOTAL 1,471,442 47,251
Total Area Requiring
Remediation (sq ft)
Percent RAL Exceedances
0-6"
Volume 0-6 inches
(cu yd)
Percent RAL Exceedances
0-12"
Volume 0-12 inches
(cu yd)
Percent RAL Exceedances
0-18"
Volume 0-18 inches
(cu yd)
Percent RAL Exceedances
0-24"
Volume 0-24 inches
(cu yd)Total Volume
(cu yd)Zone 2Residential 1,246,167 36% 6,781 30% 12,606 17% 10,408 17% 15,082 44,878 Park/school/church 58,463 18% 122 24% 495 41% 1,134 18% 651 2,402 Industrial/commercial/easement 162,816 13% 280 13% 1,490 35% 2,271 39% 4,326 8,367
Zone Total 1,467,447 55,647 Zone 3Residential 644,691 34% 3,770 34% 7,056 18% 5,309 14% 6,723 22,858 Park/school/church 34,772 80% 529 20% 53 0% - 0% - 582 Industrial/commercial/easement 218,850 38% 1,292 38% 2,610 8% 1,126 15% 4,173 9,202
Zone Total 898,314 32,642 TOTAL 2,365,760 88,288 *Totals may not reflect counts due to rounding
Current Estimate
Table 3Removal Volume Estimates Based on Depth of Impacted Soil
USS LeadEast Chicago, Indiana
Original Estimate

Category Description Unit Rates Category Total Cost Lumped Total Cost Units PRE-REMEDIAL DESIGN SAMPLING
Sample LaborLabor for sampling and access agreements. Assumes access agreements needed for all properties.
$1,134 per property
ODCs CLP/TCLP samples and equipment transportation $181 per property
REMEDY CONSTRUCTIONMobilization $292,530Demobilization $21,180
Site Preparation and AccessErosion control, utility locates, site prep, and documentation of yard conditions (including agreements with residents)
$7.5/sq. yd. Pre-construction Assessment $147,470 $147,470 26,391 sq yd $5.59/sq. yd.
Institutional ControlsInstitutional Control Monitoring Plan (not dependent on number of ICs)
$5,000/zone NA NA NA NA -
Excavation (Mechanical) $2,329,558Excavation (Manual) $411,098Backfill Placement $876,681Topsoil Placement $924,889Gravel Placement $204,884Geotechnical Testing $136,600
Contaminated Soil Transportation and Disposal
Transportation & Disposal for haz and non-haz $79/cu. yd.Contaminated Soil Transportation and Disposal 2
NA NA NA $46/cu. yd. 3
Soil CoverVisible barrier for small percentage of properties with impacted soil below 24" (snow fence)
$4,000/site High Visibility Barrier $7,597 $7,597 5,627 sq yd $1.35/sq. yd.
Mulch Placement $15,704Sod Placement $146,639Seed Placement $0Watering $87,850Trees $2,372Shrubs $22,650Stumps $7,924Miscellaneous Landscaping $15,604Property Close-Out $104,080Office rental expense $21,600Field Startup activities $16,400Remediation Oversight $768,600Air Sampling $52,250Soil Sampling $19,000
Procurement $33,250Plan generation $22,500Plan review $10,800Community relations $7,950Close out activities $58,450Remedial Design 2 NA NA NA $760/remedial design 4
OPERATIONS AND MAINTENANCECost of 3 5-year reviews prorated across the three zones
Flat rates Flat rates
1 - Except for the three unit costs highlighted in pale green, the rates in this column are derived from the “Engineer’s Estimate of Remediation Costs” attached to SulTRAC’s September 2017 Remedial Design Document. The Engineer’s Estimate of Remediation Costs is attached to this Technical Memorandum as Appendix A.2 - Pre-remedial design sampling costs were prorated based on actual incurred costs of approximately $2.8 million to sample 966 properties, as described in Section 3.0
$877,850
7 months $132,950
$313,710 205 yards in 94 properties
9,621 cu yd mechanical + 741 cy yd manual = 10,362 cu yd
$4,883,711
26,391 sq yd$402,823
Contractor's Oversight, Health & Safety, Quality Control
$15/sq. yd.$21/sq. yd.
$35,000/mo. + 10% const subtotal
Onsite construction Quality Assurance plus design, procurement, construction management, and reporting
ENGINEERING & CONSTRUCTION MANAGEMENT
$125,407/mo.$35,000/mo.22 mo @ 35000/mo.
Restoration of grass and any removed plantingsProperty Restoration
7 months
$18,993/mo. + 10% const subtotal +
USS Lead Site2012 FS and 2017 RD Cost Estimate Unit Rate Comparison
Table 4
$115/cu. yd.Excavation of impacted soil, backfill with clean soil, and topsoil
Contaminated Soil Excavation and Backfilling
East Chicago, Indiana
$471/cu. yd.
Preconstruction Activities
Sample labor and ODCs 2 $2,873/property 2
Mobilization & Demobilization, preconstruction Plans, Coordination with residents
$144,000 + $83/yard $1,530/yard
2012 Feasibiliy Study Cost Estimate Unit Rates 94 Zone 3 Properties Remedial Design Cost EstimateCurrent Rates1
NA NA NA

APPENDIX A
ENGINEER’S COST ESTIMATE
Originally included as Appendix E in
SulTRAC 2017. “Draft Remedial Design for 94 Zone 3 Properties, U.S. Smelter and Lead Residential Area Superfund Site East Chicago, Lake County, Indiana” September 29.

DESCRIPTION OF ENGINEER’S ESTIMATE OF REMEDIATION COSTS
SUBJECT: Engineer’s Estimate of Remediation Costs for 94 Properties in Zone 3 of Operable Unit 1 of the U.S. Smelter and Lead Refinery, Inc. Superfund Site
FROM: Rik Lantz, SulTRAC Project Manager TO: Sarah Rolfes / Tim Drexler Remedial Project Managers EPA Region 5 DATE: 12/4/2017 The attached Engineer’s Estimate of Remediation Costs describes SulTRAC’s estimate for remediating 94 properties in Zone 3 of Operable Unit 1 of the U.S. Smelter and Lead Refinery, Inc. Superfund Site. This Engineer’s Estimate was prepared by Chris Ore, P.E. in September 2017, and was originally provided to EPA on September 29, 2017 as Appendix E to a set of 94 draft remedial designs for Zone 3 properties. It is the most up-to-date cost estimate we have prepared. It is included separately here because unit rate cost estimates from this Engineer’s Estimate have been used in the Technical Memorandum: Comparison of Original Cost Estimates and Current Cost Estimates for Zones 2 and 3 of OU1. The attached Engineer’s Estimate was prepared consistent with the Statement of Work for Remedial Design (OU1) dated January 28, 2016.
____________________________
Rik Lantz, P.G., LEED-AP Project Manager SulTRAC

Engineer’s Estimate of Remediation Costs
The costs for remediation of 94 properties (including excavation and transportation, restoration, and oversight) within USS Lead Zone 3 was estimated as $6,770,000. Based upon discussion with EPA this estimate assumes, oversight of the remediation will be performed by a primary contractor, and the remediation activity will be performed by a subcontractor. Costs were estimated using applicable Davis Bacon wages and SulTRAC’s experience with similar remediation projects.
This cost estimate has been prepared in accordance with the Statement of Work for Remedial Design (OU1) dated January 28, 2016. Assumptions have been made regarding the number of remediation crews and site workers, rate of production, and labor costs. Actual costs may vary from this cost estimate due to these or other factors. A detailed breakdown of the estimated costs, including descriptions of assumptions, is attached.

Subcontractor Costs
Bid Item Unit Unit Price Est. Qty
Extended
Price
1 Mobilization each $292,530 1 $292,530
2 Pre‐construction Assessment each $1,569 94 $147,470
3 Excavation (Mechanical) yds3 $242 9,621 $2,329,558
4 Excavation (Manual) yds3 $555 741 $411,098
5 Backfill Placement yds3 $304 2,888 $876,681
6 Topsoil Placement yds3 $228 4,064 $924,889
7 Gravel Placement yds3 $60 3407.4 204884
8 Mulch Placement yds3 $196 80 $15,704
9 Geotechnical Testing each $332 266 $136,600
10 High Visibility Barrier ft2 $0.15 50645.2 7596.78
11 Sod Placement ft2 $0.61 242,277 $146,639
12 Seed Placement ft2 0 0 0
13 Watering each $935 94 $87,850
14 Trees each $791 12 $2,372
15 Shrubs each $139 125 $22,650
16 Stumps each $1,132 17 $7,924
17 Miscellaneous Landscaping each $166 94 $15,604
18 Property Close‐Out each $1,107 94 $104,080
19 Demobilization each $21,180 1 $21,180
Total Subcontractor Cost $5,755,311
Oversight Contractor Costs
Procurement $33,250
Plan Generation $22,500
Plan Review $10,800
Community Relations $7,950
Office Rental Expense $21,600
Field Startup Activities $16,400
Remediation Oversight $768,600
Air Sampling $52,250
Soil Sampling $19,000
Close‐Out Activities $58,450
Total Oversight Costs $1,010,800
Subcontractor Costs $5,755,311
Contractor Costs $1,010,800
Total Costs $6,766,111

SubContractor Assumptions and Calculations
Davis Bacon Wages, Lake County, Heavy Category
Personnel Group
Hourly
Base Rate Fringe
Employee
Hourly
Rate1
Sub.
Hourly
Rate2Overtime
Base Rate Fringe
Employee
Overtime
Rate1
Sub.
Overtime
Rate2
Operator 1 $40.50 $32.00 $72.50 $91 $60.75 $32.00 $92.75 $116
Laborer 1 $30.24 $15.63 $45.87 $58 $45.36 $15.63 $60.99 $77
Driver 1 $32.29 $24.38 $56.67 $71 $48.44 $24.38 $72.82 $91
Notes:
1) DBA wages paid to the employee. General Decision Number: IN170001 09/08/2017 IN1
2) Marked up subcontractor hourly rate (Assumed factor of ~1.25)
Non Davis Bacon Personnel Hourly Rate (loaded)
Program Manager $120.00
Project Manager $110.00
Foreman $90.00 Personnel are assumed to be exempt employees
Quality Control Manager (QCM) $80.00 and paid straight time for hours over 40/week
Health & Safety Officer (HSO) $80.00
Agreement Coordinator $65.00
Office Support $60.00
94 Properties to be Remediated
111.4 cubic yards average volume soil per property
740.57 manual excavation cubic yards 5 excavation, 3 backfill crews total
9620.95 mechanical excavation cubic yards
1700
2200 cubic yards per month assumed USS Lead with shorter transportation time and extra crew
21
7
1 ‐ Mobilization
Staff Hours Cost
Program Manager 20 $2,400
Project Manager 60 $6,600
Foreman 80 $7,200
Quality Control Manager 40 $3,200
Health & Safety Officer 40 $3,200
Office Support 160 $9,600
Total Labor 400 $32,200
Plan Reproduction & Shipping Costs $1,000
Total Plan Generation Costs $33,200
cubic yards per month ‐ approximate excavation rate of Jacobsville remediation contractor utilizing
average of 4 excavation crews and five 10 hour days
assumed weeks to complete remediation of 93 USS Lead Zone 3 properties (5.25 months)
Prepare Plans: Site specific plans include work plan, sampling and analysis plan, health and safety plan, transportation
plan, environmental protection plan, and quality control plan
months total project duration including mobilization/setup and project close‐out, estimated April through
October
Page 2 of 18
SubContractor Assumptions and Calculations
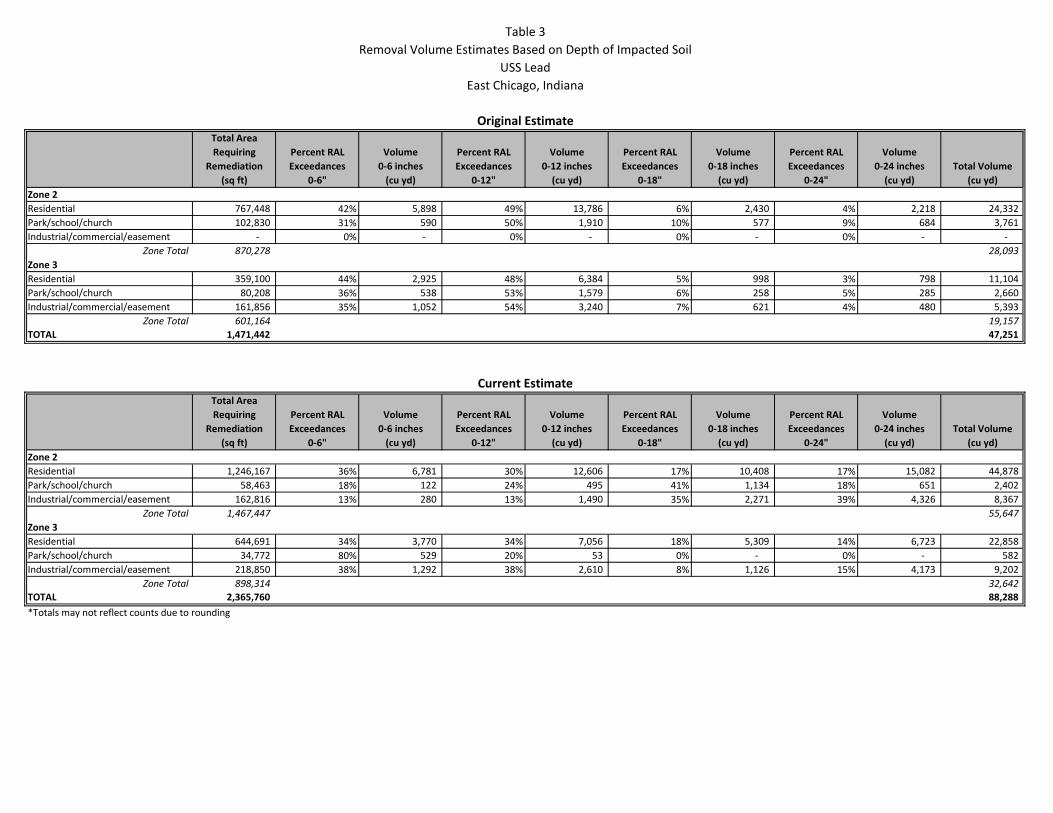
1 ‐ Mobilization (Continued)
Rental Items Unit Price Units Total
Office Trailer1
$1,800 7 months $12,600
Trailer Delivery $4,500 1 lump sum $4,500
Utility Connection $3,500 1 lump sum $3,500
Electric Service $400 7 months $2,800
Internet Service $100 7 months $700
$2,700 7 months $18,900
$500 1 lump sum $500
$600 7 months $4,200
Conex Delivery $300 1 lump sum $300
Portable Toilets4 $1,600 7 months $11,200
Project Signage $1,000 1 lump sum $1,000
Drinking Water $200 7 months $1,400
Office Supplies $250 7 months $1,750
Office Furniture $250 7 months $1,750
Total Cost $65,100
Notes:
1) Assumes 3 office trailers (based on previous setup at McCook & 149th) at $600/mo each
2)
3) Assumes 2 Connex boxes at $300/each/month
4) Assumes 6 portable toilets and two hand‐wash stations at $200/each/month
Office and Staging Area Setup, Equipment Mobilization
Personnel # Hourly Rate Hours Total
PM 1 $110 20 $2,200
Foreman 1 $90 40 $3,600
Operator 1 $91 40 $3,640
Laborer 2 $58 40 $4,640
Delivery Charges Delivery Total
Excavator 5 $150 Each $750
Skidsteer 4 $150 Each $600
Dump Truck 18 $150 Each $2,700
Total $18,130
A group of key personnel are anticipated to mobilize to the site one week prior to the start of excavation activity to
perform office and staging area setup tasks.
Assumes rental of 1,000 ft of chain‐link security fence, around trailer & equipment yard. Dimensions: 6 ft
H x 12 ft L panels and 2 gates
Chain Link Fence2
No cost is anticipated for usage of lot for trailer placement (McCook and 149th) or material staging area (Chemours).
Equipment will be stored at one of these locations with overnight security.
Fence Setup
Conex Box3
Page 3 of 18

SubContractor Assumptions and Calculations
1 ‐ Mobilization (Continued)
Site Security During Non‐Working Hours
Security Costs
Hourly
Rate
Hours
Onsite
Days
Onsite Cost
Weekdays $50 14 147 $102,900
Weekends $50 24 58 $69,600
Holidays $50 24 3 $3,600
Total Cost $176,100
Total Mobilization Costs
Plans $33,200
Rentals $65,100
Delivery / Setup $18,130
Security $176,100
Total $292,530
2 ‐ Pre‐Construction Property Assessment and Property Owner Agreement
Pre‐Construction Property Assessment Costs
Personnel
Hourly
Rate
Hours per
week
Total
Weeks Cost
Agreement Coordinator $65 50 14 $45,500
Office Support $60 50 14 $42,000
Transportation Expenses Monthly Rate
Total
Months Cost
Rental Vehicle $900 per month 3.5 $3,150
Fuel for Rental Vehicle $120 per month 3.5 $420
Surveying Expenses Topographic Survey Properties Cost
Pre‐Construction Survey $600 per prop. 94 $56,400
Total Cost $147,470
Number of Properties 94
Cost per Property $1,569
Security presence is anticipated during non‐working hours for the full duration of temporary office usage (April to
October). Security personnel are anticipated to rotate and not be subject to overtime pay. Subcontractor staff are
anticipated to work M‐F schedule, and will not be present on weekends.
One agreement coordinator will work to complete restoration agreements with property owners and document pre‐
existing conditions after plan approval beginning two weeks prior to the start of excavation activity. Restoration
agreement meetings will continue until all agreements are signed. Agreement coordinator will assist in resolving
property owner and resident issues that arise during remediation, and will provide pre‐excavation photos to
restoration crews. The agreement coordinator will have a company or rental vehicle (14 weeks)
One office support personnel will assist the agreement coordinator with documentation management. Support related
to other tasks will also be provided to project manager and/or superintendant, including utility notification, payroll,
invoicing, etc. (14 weeks)
Page 4 of 18

SubContractor Assumptions and Calculations
3 ‐ Excavation (Mechanical) and Transportation & 4 ‐ Excavation (Manual) and Transportation
Labor
Personnel #
Hourly
Rate
Overtime
Rate
Hours per
Week
Number of
Weeks Cost
Operator 5 $91 $116 50 21 $504,000
Laborer 10 $58 $77 50 21 $648,900
Driver 10 $71 $91 50 21 $787,500
Project Manager1 $110 $110 20 21 $46,200
Superintendant1 $90 $90 60 21 $113,400
QCM1$80 $80 60 21 $100,800
HSO1$80 $80 55 21 $92,400
Surveying Expense Topographic Survey Properties Cost
Post‐Excavation Survey $300 per prop. 94 $28,200
Total $2,321,400
Notes:
1) All time for QCM and HSO has been appliad to excavation task.
Equipment
Type
Equipment
Onsite
Cost per
month
Duration
(months) Cost
Excavator 5 $1,800 5.25 $47,250
Dump Trucks 10 $1,900 5.25 $99,750
Pickup Trucks1 9 $1,000 5.25 $47,250
Trailers 5 $500 5.25 $13,125
Materials
Description Unit Price Units Cost
Fuel2 $3.00 59,850 gallons $179,550
Plastic Sheeting $25 200 rolls $5,000
T‐posts $3 800 posts $2,400
High‐vis fencing3 $0.15 72,874 ft2 $10,931
Safety signage $350 20 signs $7,000
Misc. hand tools $3,000 1 lump sum $3,000
Wheelbarrows $2,000 1 lump sum $2,000
Safety Supplies $2,000 1 lump sum $2,000
Total $419,256
Notes:
1) Included trucks for PM, foreman, QCM, and HSO
2) Estimated fuel consumption of 40 gal/day per dump truck, 25 gal/day for excavator, and 5 gal/day for pickup
Each Excavation Crew is generally anticipated to consist of 1 operator, 2 laborers, and 2 truck drivers (five crews).
Laborers will move between crews if needed at more manual labor‐intensive properties.
Although manual excavation is more time‐consuming, and therefore more expensive, manual and mechanical
excavation will be performed concurrently. Therefore total excavation costs have been estimated, and a higher
proportion of these costs has been assigned to the manual excavation portion
3) High visibility fencing will also be needed to place around excavation boundaries and prevent unauthorized access,
as well as placement at the bottom of some excavations. Upper bound of total; less may be required
Page 5 of 18

SubContractor Assumptions and Calculations
3 ‐ Excavation (Mechanical) and Transportation & 4 ‐ Excavation (Manual) and Transportation (Continued)
Estimated Excavation Volumes Excavation Cost
Mechanical 9,621.0 Labor $2,321,400
Manual 740.6 Equipment and Materials $419,256
Total Volume 10,361.5 Total $2,740,656
Mechanical % Vol. 92.9% Total % of Cost Mechanical $2,329,558
Manual % Volume 7.1% Total % of Cost Manual $411,098
Mechanical % Cost1 85.0% Mechanical cu yd excavated $ $242.13
Manual % Cost1 15.0% Manual cu yd excavated $ $555.11
5 ‐ Backfill Placement
Labor
Personnel #
Hourly
Rate
Overtime
Rate
Hours per
Week
Number of
Weeks Cost
Operator 4 $91 $116 50 11 $211,200
Laborer 6 $58 $77 50 11 $203,940
Driver 6 $71 $91 50 11 $247,500
Surveying Expense Topographic Survey Properties Cost
Post‐Backfill Survey $300 per prop. 94 $28,200
Equipment
Type
Equipment
Onsite
Cost per
month
Duration
(months) Cost
Skidsteer 4 $1,800 2.5 $18,000
Dump Trucks 6 $1,900 2.5 $28,500
Pickup Trucks 4 $1,000 2.5 $10,000
Trailers 5 $500 2.5 $6,250
Materials2
Description Unit Price Units Cost
Backfill $20 2,888.3 yd3 $57,766
Fuel1 $3.00 20,075 gallons $60,225
Plate Compactor $800 2 compactor $1,600
Safety signage $350 5 signs $1,750
Misc. hand tools $1,500 0.5 lump sum $750
Wheelbarrows $1,000 0.5 lump sum $500
Safety Supplies $1,000 0.5 lump sum $500
Total $185,841
Each backfill crew is generally anticipated to consist of 1 operator, 2 laborers, and 2 truck drivers (three crews). One
additional operator and skid‐steer are anticipated to be required at the staging area to accept deliveries, load backfill
into trucks, and manage the backfill stockpile. Two laborers are anticipated to work as the punch‐list crew and
uninstall/reinstall fences, repair damages, etc. Half of the project duration is anticipated to be attributable to backfill
placement, compaction, and testing (10 weeks)
1) As manual excavation is more labor intensive, a higher proportion of cost per cubic yard excavated is attributed to
manual excavation than mechanical
Skidsteer will be used for spreading and
compaction of backfill. Vibratory plate
compactor will be used for compaction of
backfill near foundations and where skidsteer
cannot access.
trailers include dump trailer and equipment
trailers
1) estimated fuel consumption = 40/gal day
dump truck, 25 gal/day skidsteer, and 5 gal/day
pickup (plate compactor negligible)
Page 6 of 18

SubContractor Assumptions and Calculations
5 ‐ Backfill Placement (Continued)
Estimated Backfill Volume Backfill Cost
Backfill (yd3) 2,888 Labor $690,840
Cost per yd3 $303.53 Equipment and Materials $185,841
Total $876,681
6 ‐ Topsoil Placement
Labor
Personnel #
Hourly
Rate
Overtime
Rate
Hours per
Week
Number of
Weeks Cost
Operator 4 $91 $116 50 11 $211,200
Laborer 6 $58 $77 50 11 $167,690
Driver 6 $71 $91 50 11 $247,500
Surveying Expense Topographic Survey Properties Cost
Post‐Topsoil Survey $300 per prop. 94 $28,200
Equipment
Type
Equipment
Onsite
Cost per
month
Duration
(months) Cost
Skidsteer 4 $1,800 2.5 $18,000
Dump Trucks 6 $1,900 2.5 $28,500
Pickup Trucks 4 $1,000 2.5 $10,000
Trailers 5 $500 2.5 $6,250
Materials2
Description Unit Price Units Cost
Topsoil $35 4,063.6 yd3 $142,224
Fuel1 $3.00 20,075 gallons $60,225
Plate Compactor $800 2 compactor $1,600
Safety signage $350 5 signs $1,750
Misc. hand tools $1,500 0.5 lump sum $750
Wheelbarrows $1,000 0.5 lump sum $500
Safety Supplies $1,000 0.5 lump sum $500
Total $270,299
Estimated Topsoil Volume Topsoil Cost
Topsoil (yd3) 4,064 Labor $654,590
Cost per yd3 $228 Equipment and Materials $270,299
Total $924,889
Topsoil placement will be similar to backfill placement. Total equipment costs have been split 50/50 between backfill
and topsoil.
subtracted mulch, shrub,
landscaping etc. hours from total
laborer hours
1) estimated fuel consumption = 40/gal day
dump truck, 25 gal/day skidsteer, and 5 gal/day
pickup (plate compactor negligible)
Skidsteer will be used for spreading and
compaction of topsoil. Vibratory plate
compactor will be used for compaction of
backfill near foundations, under trees, and
where skidsteer cannot access.
Page 7 of 18

SubContractor Assumptions and Calculations
7 ‐ Gravel Placement
Labor
Personnel #
Hourly
Rate Hours Cost
Operator 1 $91 2 $182
Laborer 1 $58 2 $116
Driver 1 $71 2 $142
Materials
Unit
Price Units Cost
Gravel $60 3,407 yd3 $204,444
Total Cost $204,884
Cost per yd3 $60.13
8 ‐ Mulch Placement
Labor
Personnel #
Hourly
Rate Hours Cost
Laborer 2 $58 94 $10,904
Materials
Unit
Price Units Cost
Geotextile $0.10 12,000 ft2 $1,200
Mulch $45 80 yd3 $3,600
Total Cost $15,704
Cost per yd3 $196
Very little gravel is anticipated to be placed, based on review of pre‐existing conditions. Equipment and personnel are
expected to be already be present on‐site for backfill placement while gravel is placed.
Mulch will be agreed with property owner in the Restoration Agreement. Mulch is anticipated to be placed below
trees where sod is not expected to survive and in flowerbeds. 80 yd3 of mulch has been input for estimation purposes.
Mulch is expected to be purchased in bulk and placed by laborers using a pickup truck with an associated trailer (this
equipment is included in backfill/topsoil)
Page 8 of 18

SubContractor Assumptions and Calculations
9 ‐ Geotechnical Testing
Geotechnical Tests (Subcontracted)
Type Units Unit Price Cost
Proctor and gradation test 6 $600 $3,600
In‐place field density 266 $500 $133,000
Total Cost $136,600
Cost per test $332
10 ‐ High Visibility Barrier
High Visibility Barrier
Description Unit Price Units Cost
High‐vis barrier2 $0.15 50,645 ft2 $7,597
11 ‐ Sod Placement
Assumed alternate/subcontracted sod placement crew
Labor
Personnel #
Hourly
Rate Hours Cost
Laborer 6 $58 240 $83,520
Materials
Unit
Price Units Cost
Sod1 $0.25 242,277 ft2 $60,569
Sod staples $0.15 1,000 each $150
Sod knife $10 20 each $200
Roller $200 2 each $400
Equipment
Type
Cost per
day Days Cost
Pickup Truck $50 24 $1,200
Trailer $25 24 $600
Total Cost $146,639
Cost per ft2 $0.61
1) 2% increase to sod square footage applied to account for
cutting end pieces to fit yard
In‐place field density testing requires a representative Proctor test to determine laboratory maximum density, and a
minimum of 2 field tests conducted at each lift placed in the 18‐24", 12‐18", and 6‐12" depths. The testing firm usually
charges by the hour, with a minimum charge (e.g. 3 hours) rather than by the test, so geotechnical testing costs are
highly dependent upon subcontractor work procedures.
A minimum of 266 in‐place field density tests will be required based on the designs (65 six‐inch‐lifts tested). 41 front or
back yards have an excavation depth of 24", 39 yards are 18", and 65 yards are 12". Both the front and back yard or
full four quads will be remediated at 53 properties. An average of 10 tests (5 lifts) will be performed per testing event.
Each testing event is estimated at $500.
High visibility barrier will be used at the bottom of excavations with a depth of 24 inches where contamination is
present below this depth, and over the roots of trees and shrubs within the excavation area where the full excavation
depth was not achieved. Fencing will be used to the extent feasible as excavation perimeter fencing prior to being
placed at the bottom of the excavation.
Page 9 of 18

SubContractor Assumptions and Calculations
12 ‐ Seed Placement
No costs are included for seed placement. If seed is applied, a reduction in sod costs is expected.
13 ‐ Watering
Labor
Personnel #
Hourly
Rate
Overtime
Rate
Hours per
Week
Number of
Weeks Cost
Laborer 1 $58 $77 40 20 $46,400
Driver 1 $71 $91 40 4 $11,360
Materials
Unit
Price Units Cost
Water $200 94 properties $18,800
Hoses $60 4 each $240
Fuel $3.00 750 gallons $2,250
Equipment
Type
Cost per
month Months Cost
Pickup Truck $1,000 6 $6,000
Water Truck $2,800 1 $2,800
Watering Cost
Labor $57,760
Equipment and Materials $30,090
Total $87,850
Number of properties 94
Total $935
It is anticipated that the remediation subcontractor will use the water from the residence for most watering activity.
Two months of residential water bills will be reimbursed (estimated at $200). Sod will be maintained for 30 days after
placement. 1 laborer will work full‐time for 20 weeks to travel to residences, setup hoses, and perform watering. For
vacant lots, it is assumed that these will be scheduled in the same time period to minimize the need for rental of a
water truck. One water truck driver will work full time for 4 weeks to water the lots and other properties as needed.
Page 10 of 18

SubContractor Assumptions and Calculations
14 ‐ Trees
Labor
Personnel #
Hourly
Rate Hours Cost
Laborer 2 $58 4.5 $522
Materials
Unit
Price Units Cost
Tree $150 12 each $1,800
Stakes/ Lines $50.00 1 lump sum $50
Total Cost $2,372
Cost per tree $791
15 ‐ Shrubs
Labor
Personnel #
Hourly
Rate Hours Cost
Laborer 2 $58 125 $14,500
Materials
Unit
Price Units Cost
Shrub $50 163 each $8,150
Total Cost $22,650
Cost per shrub $138.96
16 ‐ Stump Removal
Labor
Personnel #
Hourly
Rate Hours Cost
Laborer 2 $58 14 $1,624
Equipment
Unit
Price Units Cost
Chainsaw $25 36 days $900
Grinder $150 36 days $5,400
Total Cost $7,924
Cost per stump $1,132
Most trees present in Zone 3 (202 trees) are expected to remain in place, and manual excavation of soil within the drip
zone will be performed. 11 trees have a diameter of less than 4 inches and are expected to be removed and replaced.
Watering will be performed concurrent with sod, under the watering line item.
All shrubs have conservatively been estimated to be removed and replaced. Some property owners are expected to
request the shrub(s) stay in place. Shrub removal is expected to take place during the excavation. Watering will be
performed concurrent with sod, under the watering line item.
36 stumps and associated roots will be cleared and grubbed. Removal may or may not occur on different days.
Page 11 of 18

SubContractor Assumptions and Calculations
17 ‐ Miscellaneous Landcaping
Miscellaneous perennial flowers/bulbs, garden edging, etc.
Labor
Personnel #
Hourly
Rate Hours Cost
Laborer 2 $58 94 $10,904
Materials
Unit
Price Units Cost
Misc $50 94 properties $4,700
Total Cost $15,604
Cost per property $166
18 ‐ Property Closeout
Property Close‐Out Costs
Personnel
Hourly
Rate
Hours per
week
Total
Weeks Cost
Agreement Coordinator $65 50 16 $52,000
Office Support $60 50 16 $48,000
Transportation Expenses Monthly Rate
Total
Months Cost
Rental Vehicle $900 per month 4 $3,600
Fuel for Rental Vehicle $120 per month 4 $480
Total Cost $104,080
Number of Properties 94
Cost per Property $1,107
19 ‐ Demobilization
One office support personnel will assist the agreement coordinator with documentation management and the QCM
with As‐Built preparation. (QCM is anticipated to generate draft As Built as part of normal duties accounted for in
excavation line item). Support related to other tasks will also be provided to project manager and/or superintendant,
including utility notification, payroll, invoicing, etc. (16 weeks)
The agreement coordinator will document post‐restoration conditions and meet with property owners to sign
completion agreements after the sod maintenance period is complete. Coordinator will work with punch list crew to
resolve issues.
Page 12 of 18

SubContractor Assumptions and Calculations
Rental Items Unit Price Units Total
Trailer Removal $3,000 1 lump sum $3,000
Fence Removal $500 1 lump sum $500
Conex Removal $300 1 lump sum $300
Excavator Removal $150 4 each $600
Skidsteer Removal $150 4 each $600
Dump Truck $150 14 each $2,100
Labor
Personnel # Hourly Rate Hours Total
PM 1 $110 20 $2,200
Foreman 1 $90 40 $3,600
Operator 1 $91 40 $3,640
Laborer 2 $58 40 $4,640
Total Demobilization Costs
Removal $7,100
Labor $14,080
Total $21,180
The office area and associated rental items will be returned to the rental companies. A small group of key personnel
will remain on‐site to facilitate removal of items and return of the office/staging area to pre‐existing conditions.
Page 13 of 18

Contractor Oversight Assumptions and Calculations
Contractor Personnel Hourly Rate (loaded)
Program Manager $120
Project Manager $110
Field Team Leader $80
Oversight Personnel $60
Office/Clerical Support $45
Procurement
Contractor will prepare RFP, conduct pre‐bid meeting, review bids, and award subcontract.
Staff Staff
Hourly
Rate Hours Cost
Prepare RFP
Program Manager 1 $120 5 $600
Project Manager 1 $110 40 $4,400
Office/Clerical Support 1 $45 10 $450
Conduct Pre‐Bid Meeting
Project Manager 1 $110 20 $2,200
Office/Clerical Support 1 $45 10 $450
Review Bids
Program Manager 1 $120 5 $600
Project Manager 3 $110 60 $19,800
Office/Clerical Support 1 $45 10 $450
Award Subcontract
Program Manager 1 $120 10 $1,200
Project Manager 1 $110 20 $2,200
Office/Clerical Support 1 $45 20 $900
Total Labor $33,250
Plan Generation
Staff
Hourly
Rate Hours Cost
Program Manager $120 10 $1,200
Project Manager $110 40 $4,400
Field Team Leader $80 80 $6,400
Oversight Personnel $60 160 $9,600
Office/Clerical Support $45 20 $900
Total Labor $22,500
Contractor will need to prepare Work Plan, Sampling and Analysis Plan, Health and Safety Plan, and Quality
Assurance Plan
Page 14 of 18

Contractor Oversight Assumptions and Calculations
Plan Review
Contractor will review plans generated by the Subcontractor
Staff
Hourly
Rate Hours Cost
Program Manager $120 5 $600
Project Manager $110 20 $2,200
Field Team Leader $80 40 $3,200
Oversight Personnel $60 80 $4,800
Total Labor $10,800
Community Relations
Three community meetings with 30 hours for preparationa nd attendance per meeting are assumed
Staff
Hourly
Rate Hours Cost
Program Manager $110 60 $6,600
Office/Clerical Support $45 30 $1,350
Total Labor $7,950
Office Rental Expense
Rental of a local office space for oversight personnel is anticipated for a period of 7 months.
Unit Price Units Total
Office Rental $1,600 7 months $11,200
Office Utilities $500 7 months $3,500
Internet Service $100 7 months $700
Office Supplies $250 7 months $1,750
Office Furniture $250 7 months $1,750
Shipping Expenses $150 7 months $1,050
Field Logbooks $20 30 each $600
Digital Cameras $150 7 each $1,050
Total $21,600
Page 15 of 18

Contractor Oversight Assumptions and Calculations
Field Startup Activities
Staff Staff
Hourly
Rate
Hours per
week
Duration
(weeks) Cost
Field Team Leader 1 $80 55 2 $8,800
Oversight Personnel 1 $60 55 2 $6,600
Total Labor $15,400
Travel Expenses Units
Cost (per
week)
Duration
(weeks) Cost
Rental Car 2 $200 2 $800
Fuel 2 $50 2 $200
Travel Costs $1,000
Total Field Startup Costs $16,400
Remediation Oversight
Staff Staff
Hourly
Rate
Hours per
week
Duration
(weeks) Cost
Project Manager 1 $110 20 21 $46,200
Field Team Leader 1 $80 55 21 $92,400
Oversight Personnel 9 $60 55 21 $623,700
Total Labor $716,100
Travel Expenses Units
Cost (per
week)
Duration
(weeks) Cost
Rental Car 10 $200 21 $42,000
Fuel 10 $50 21 $10,500
Travel Costs $52,500
Total Remediation Oversight Costs $768,600
Contractor is anticipated to have 2 personnel onsite for two weeks when plans are approved for office setup
and property owner agreements (FTL and agreement oversight). 10 oversight field staff are anticipated for 5.25
months during remediation (FTL, oversight for agreements, documentation, one oversight per excavation crew
and one oversight per 2 backfill crews). Two oversight personnel are anticipated for 1 month during project
close‐out (FTL and one agreement oversight). Staff are anticipated to be staffed from CH2M Chicago office.
Rental cars will be provided, but not lodging/per‐diem. Staff are anticipated to work 55 hours/week.
Page 16 of 18

Contractor Oversight Assumptions and Calculations
Air Sampling
Equipment Unit Price Units Duration Total
Particulate Monitor $1,000 5 5.25 months $26,250
GilAir Plus $300 12 5.25 months $18,900
Calibrator $250 4 5.25 months $5,250
Total $50,400
Unit Price Units Total
Air Sample Cassettes $60 10 boxes $600
Air Sample Analysis $25 50 samples $1,250
Total $1,850
Total Air Sampling Costs $52,250
Soil Sampling
Staff Staff
Hourly
Rate
Hours /
Sample
Samples
Collected Cost
Project Manager 1 $110 1 20 $2,200
Field Team Leader 1 $80 1 20 $1,600
Oversight Personnel 1 $60 2 20 $2,400
Total Labor $4,000
Unit Price Units Total
Soil Sample Analysis $650 20 samples $13,000
Sampling supplies $25 20 lump sum $500
Shipment supplies $25 20 lump sum $500
Overnight delivery $50 20 each $1,000
Total $15,000
Total Soil Sampling Costs $19,000
Oversight personnel will collect air samples, manage sampling data, and prepare for shipment to the laboratory
during the course of normal remediation oversight responsibilities.
Oversight personnel will collect backfill and topsoil samples for laboratory analysis (est. 20 samples). Hours have
been assumed to be in additon to the normal oversight responsibilities.
Page 17 of 18

Contractor Oversight Assumptions and Calculations
Close‐Out Activities
Staff Staff
Hourly
Rate
Hours per
week
Duration
(weeks) Cost
Field Activities
Field Team Leader 1 $80 55 4 $17,600
Oversight Personnel 1 $60 55 4 $13,200
Total Labor $30,800
Travel Expenses Units
Cost (per
week)
Duration
(weeks) Cost
Rental Car 2 $200 4 $1,600
Fuel 2 $50 4 $400
Travel Costs $2,000
Staff
Hourly
Rate Hours Cost
Remedial Action Report
Program Manager $120 5 $600
Project Manager $110 20 $2,200
Field Team Leader $80 40 $3,200
Oversight Personnel $60 80 $4,800
Office/Clerical Support $45 10 $450
Remediation Complete Letter Preparation and Delivery
Oversight Personnel $60 240 $14,400
Total Labor $25,650
Total Closeout Costs $58,450
Page 18 of 18