Battery Sizing for Serial Plug-in Hybrid Vehicles: A Model ...

EPA Battery Sizing and Cost Analysis for Future Plug-in Vehicles
for the Midterm Evaluation of the2022-2025 Light-Duty GHG Standards
SEPTEMBER 15, 2016

What we will cover Why EPA is projecting battery costs for future plug-in vehicles
How we designed and modeled future batteries for this purpose
How our 2012 projections fared against MY2012-2016 PEVs
Battery design trends since 2012 that have been incorporated into the analysis
How our revised projections compare to the 2012 projections and other sources
2

Why is EPA projecting battery costs? The 2017-2025 Light-Duty GHG/CAFE standards
were developed between 2010-2012
The incremental cost of technologies available for complying with the standards was an important consideration
Plug-in vehicles are one of these technologies, and battery cost is the largest part of their cost
A first set of estimates was made in 2011-2012
They are now being updated for the Midterm Evaluation of the 2022-2025 portion of the rule
3

Draft Technical Assessment Report (TAR) Released July 18, 2016
http://www.epa.gov/otaq/climate/mte.htm
Open for public comment until September 26, 2016
Sections 5.2.4 and 5.3.4.3.7 cover the material of this presentation
To comment, visit www.regulations.gov and search for Docket ID No. EPA-HQ-OAR-2015-0827
Follow the online instructions for submitting comments
4

5
Battery cost modeling approach
5
Define an array of future PEVs1
Determine required batterycapacity, power, and designattributes for each
2
Use ANL BatPaC to estimatedirect manufacturingcost in 2025
3
150 unique vehicles
150 unique batteries
Results fed to
adjoining
analyses
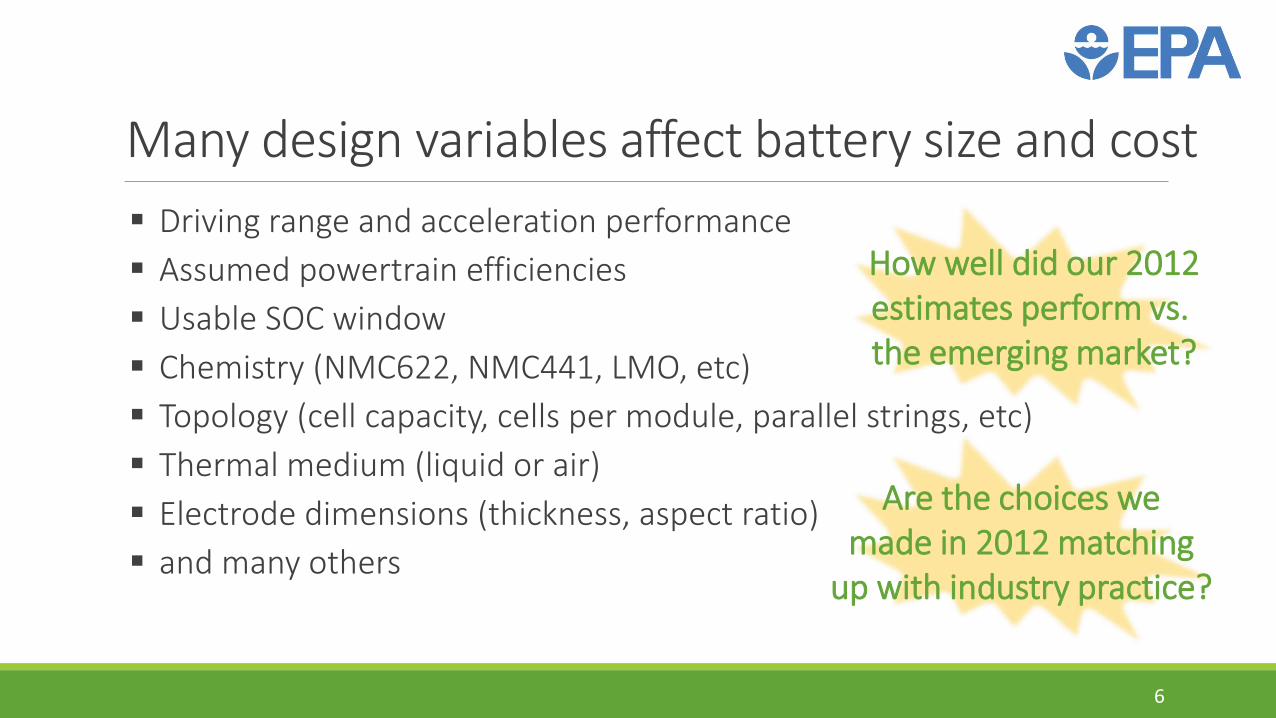
Many design variables affect battery size and cost
Driving range and acceleration performance
Assumed powertrain efficiencies
Usable SOC window
Chemistry (NMC622, NMC441, LMO, etc)
Topology (cell capacity, cells per module, parallel strings, etc)
Thermal medium (liquid or air)
Electrode dimensions (thickness, aspect ratio)
and many others
6
How well did our 2012estimates perform vs. the emerging market?
Are the choices wemade in 2012 matching
up with industry practice?

Projected cost per kWh (all BEV+PHEV40)
7
*Nykvist, B. and Nilsson, M.; "Rapidly Falling Costs of Battery Packs for Electric Vehicles," Nature Climate Change, March 2015; doi: 10.1038/NCLIMATE2564

Chevy Bolt = ~ EV200
These are cell-level costs, not pack-level costs
We aren’t sure if they represent direct manufacturing costs or something different
If we can convert them to pack-level costs, we can make a qualified comparison
8
Comparison to GM Chevy Bolt announcement
Mark Reuss, GM: “When we launch the Bolt, we will have a cost per kWh of
$145, and eventually we will get our cost down to about $100.”
GM Global Business Conference, October 2015
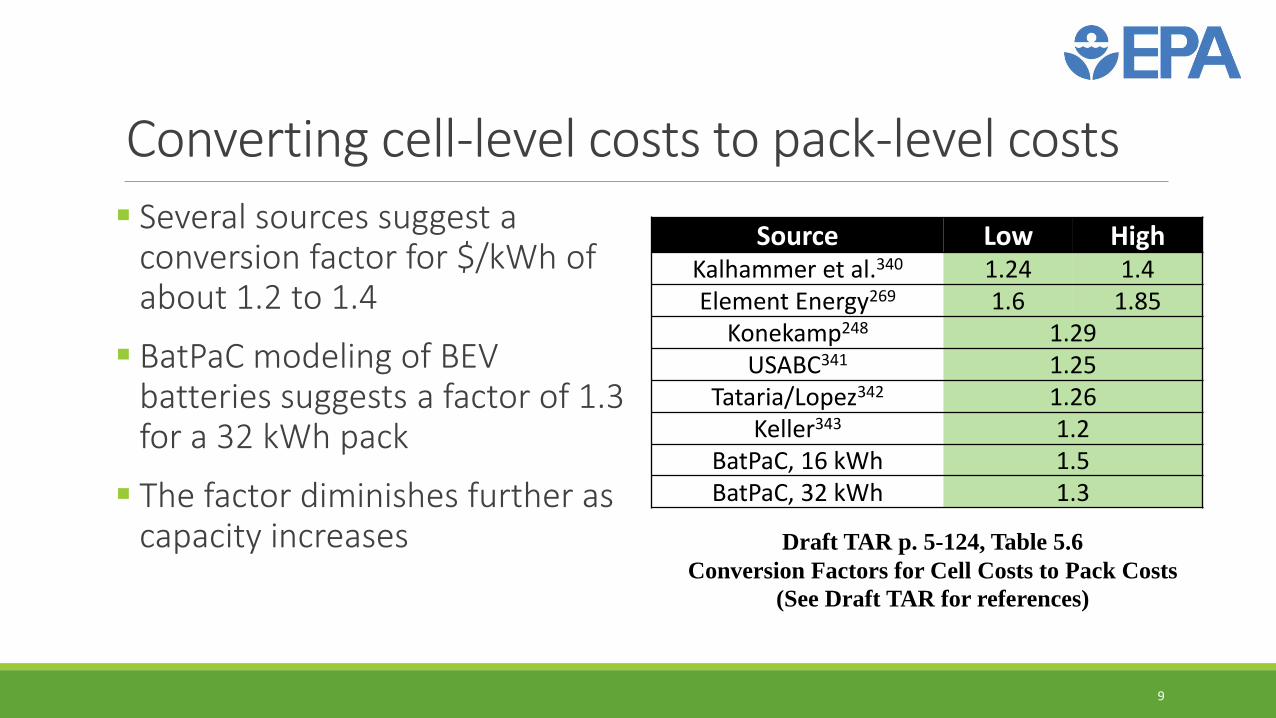
Several sources suggest a conversion factor for $/kWh of about 1.2 to 1.4
BatPaC modeling of BEV batteries suggests a factor of 1.3 for a 32 kWh pack
The factor diminishes further as capacity increases
9
Converting cell-level costs to pack-level costs
Source Low HighKalhammer et al.340 1.24 1.4Element Energy269 1.6 1.85
Konekamp248 1.29USABC341 1.25
Tataria/Lopez342 1.26Keller343 1.2
BatPaC, 16 kWh 1.5BatPaC, 32 kWh 1.3
Draft TAR p. 5-124, Table 5.6
Conversion Factors for Cell Costs to Pack Costs
(See Draft TAR for references)

2012 projections for EV150vs GM/LG estimated pack level cost for EV200
10
Assumingcell-to-pack
conversion factorof 1.3x to 1.5x
1.3x1.5x

Projected peak motor kW Originally, we sized the motor to
provide the power-to-ETW ratio of a baseline conventional vehicle
Manufacturers are providing less nominal power than that, while maintaining or exceeding baseline performance
High low-end torque of electric motors is probably a factor
Right-sizing the motor is important for performance neutrality, motor costing, and battery P/E ratio
11

Projected capacity per unit range BEV manufacturers appear to be
getting more range per kWh than we projected
The sizing model seems to be particularly challenged by longer-range vehicles
Could weight differences or other factors be responsible?
12

The disparity is not explained by differences in vehicle weight
The existing model would fail to explain the Tesla Model S 85, or even a BEV200
Can bumblebees fly?
The sizing model and/or its assumptions needed significant updating to keep up with the industry
13
Projected capacity, normalized to weight

What we changed Driving range target: EV150 changed to EV200
Motor power sizing basis
0-60 acceleration targets updated to MY2014
SOC windows
Pack topology (cell size targets, aspect ratio, modules)
Updated version of ANL BatPaC
Others (see Draft TAR)
14

Originally, we sized the motor to provide the power-to-ETW ratio of a baseline conventional vehicle
Engine power can be related to a 0-60 time by Malliaris equation
To target a 10-sec 0-60 time, size the engine to provide a power-to-ETW ratio of about 0.08
We’ve already suggested that this may not be valid for electric motors
15
Revised motor sizing basis
Malliaris et al. 1975

So we surveyed MY2012-2016 PEVs for their rated peak power and all-electric 0-60 mph time (from manufacturer and press information)
We then related 0-60 time (t) to power-to-ETW* ratio:
16
Revised motor sizing basis
* Equivalent test weight = curb weight + 136 kg
• Motors were resized using the empirical equation
• Targeting MY2014 non-PEV baseline performance
• This also reduced battery P/E ratios, reducing costs
7

Test results and manufacturer information suggest that MY2012-2016 EVs and PHEVs are beginning to use more SOC than anticipated
PHEV40 widened to 75%
EV75, EV100 widened to 85%
EV200 widened to 90%◦ Larger battery capacity may be associated with
fewer cycles in a given lifetime
◦ Cycles potentially shallower on average
17
Revised SOC design windows
SOC design window
FRM draft TAR
HEV 40% 40%
PHEV20 70% 70%
PHEV40 70% 75%
EV75 80% 85%
EV100 80% 85%
EV150/200 80% 90%

Cells per module now varies◦ 24 to 32 instead of 32◦ Better targets pack voltage and preferred cell
capacities
Cell capacities better targeted◦ BEV targets 60 A-hr (max 75)◦ PHEV targets 45 A-hr (max 50)
Electrode aspect ratio 3:1◦ Supports trend toward flat floor mounted packs◦ BatPaC places tabs on short dimension
Module arrangement optimized◦ Again, trend toward flat packs
18
Revised pack topologies
Trend toward flat, floor mounted packsusing large, low-profile cells
Other changes EV200 range derating factor (2-cycle to 5-cycle) increased to
80% (from 70%) based on Tesla practice
Small adjustments to energy consumption calculations
Aero, tire 20% improved from 2008 baseline (was 10%)
Small changes in power oversizing factors
Chemistry updates NMC441 NMC622 LMO blended LMO (75% LMO, 25% NMC)
See the Draft TAR for others
19

On a cost per kWh basis:◦ BEV battery costs fell by about 15%
◦ PHEVs were relatively unchanged (due to changes in battery power levels that offset some cost reductions)
Changes in pack topology, battery power, and material and component costs within ANL BatPaC were significant factors
20
Effects on projected battery cost

On a pack cost basis:◦ BEV pack costs declined by ~ 25%
◦ PHEV pack costs declined by ~ 8-12%
Smaller pack sizes and reduction in cost per kWh drove these reductions
Effects on projected battery cost
Average change from 2012 FRM
Change inprojected pack cost
EV75 -24.9%
EV100 -27.1%
EV200† -24.0%
PHEV20 -8.7%
PHEV40 -12.2%
†Compares EV200 (Draft TAR) to EV150 (FRM)
All configurations target 20% curb weight reduction
21
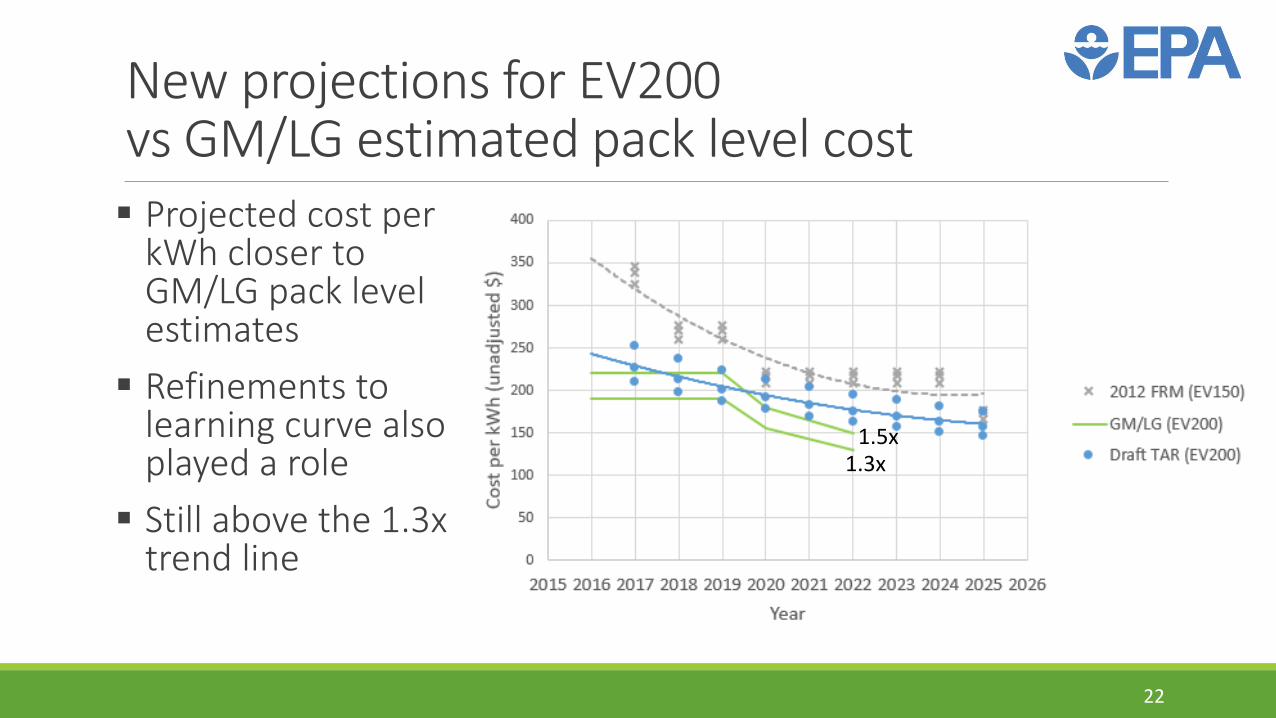
New projections for EV200vs GM/LG estimated pack level cost
22
Projected cost per kWh closer to GM/LG pack level estimates
Refinements to learning curve also played a role
Still above the 1.3x trend line
1.3x1.5x
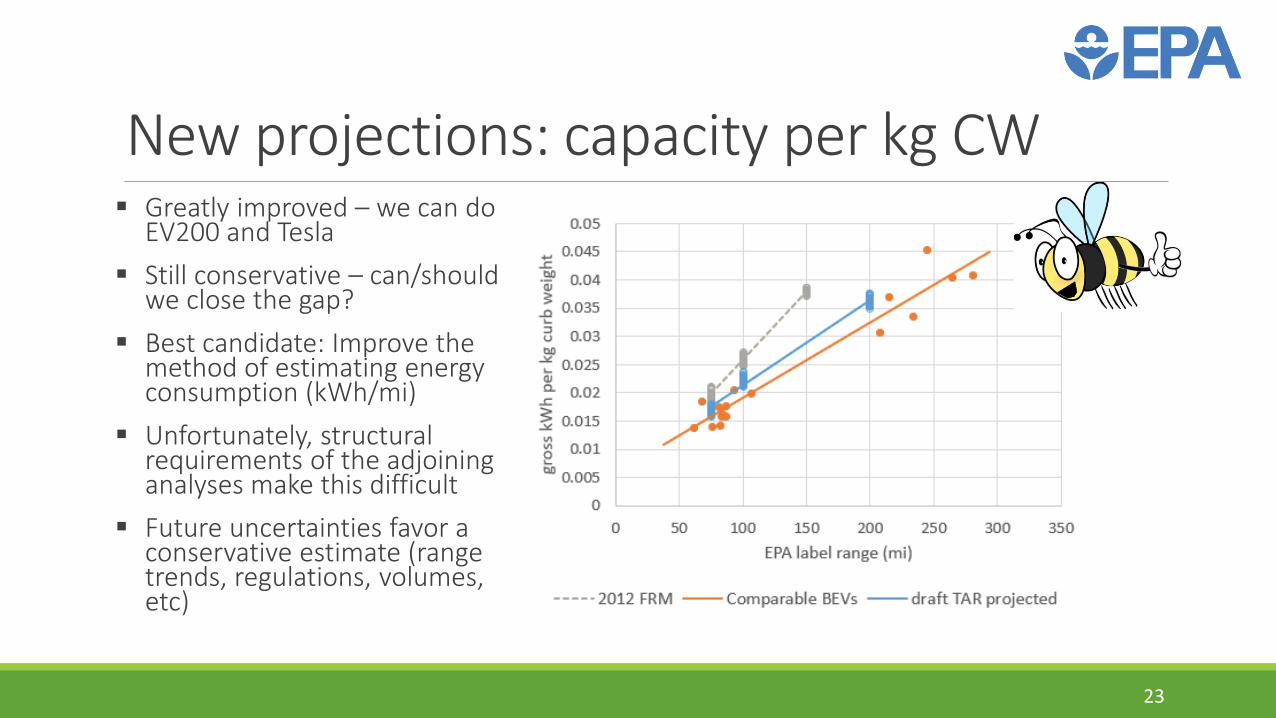
New projections: capacity per kg CW
23
Greatly improved – we can do EV200 and Tesla
Still conservative – can/should we close the gap?
Best candidate: Improve the method of estimating energy consumption (kWh/mi)
Unfortunately, structural requirements of the adjoining analyses make this difficult
Future uncertainties favor a conservative estimate (range trends, regulations, volumes, etc)

Conclusions MY2012-2016 PEVs outperformed our 2012 predictions: 200+ miles range can be expected in mainstream vehicles (vs. 150 miles) Less battery capacity needed for a given range Less nominal motor power needed for equivalent 0-60 acceleration
Trends in battery design have continued to converge Increased cell capacities and more cells per module Flat, low-profile pack and module configurations becoming more popular Advanced chemistries and learning are widening SOC design windows
Revised cost and capacity projections are lower, while maintaining a buffer for future uncertainties
24

Thank you For more information, see Draft TAR Section 5.2.4
and Section 5.3.4.3.7
http://www.epa.gov/otaq/climate/mte.htm
25