EPA 542-R-06-014 June 2006 The American Creosote Works (ACW) site is located on 1800 Gimble Street...
34
REMEDIATION SYSTEM EVALUATION (RSE) AMERICAN CREOSOTE WORKS SITE PENSACOLA, FLORIDA Report of the Remediation System Evaluation Site Visit Conducted October 5, 2005 Final Report June 2006 EPA 542-R-06-014 June 2006 www.epa.gov/tio www.clu-in.org/optimization
Transcript of EPA 542-R-06-014 June 2006 The American Creosote Works (ACW) site is located on 1800 Gimble Street...

REMEDIATION SYSTEM EVALUATION (RSE) AMERICAN CREOSOTE WORKS SITE
PENSACOLA, FLORIDA
Report of the Remediation System Evaluation Site Visit Conducted October 5, 2005
Final Report June 2006
EPA 542-R-06-014 June 2006
www.epa.gov/tio www.clu-in.org/optimization

i
NOTICE
The U.S. Environmental Protection Agency (U.S. EPA) funded the work described herein and the preparation of this document by GeoTrans, Inc. under EPA contract 68-C-02-092 to Dynamac Corporation, Ada, Oklahoma. Mention of trade names or commercial products does not constitute endorsement or recommendation for use.
ii
EXECUTIVE SUMMARY
A Remediation System Evaluation (RSE) involves a team of expert hydrogeologists and engineers, independent of the site, conducting a third-party evaluation of site operations. It is a broad evaluation that considers the goals of the remedy, site conceptual model, above-ground and subsurface performance, and site exit strategy. The evaluation includes reviewing site documents, visiting the site for up to 1.5 days, and compiling a report that includes recommendations to improve the system. Recommendations with cost and cost savings estimates are provided in the following four categories:
• improvements in remedy effectiveness • reductions in operation and maintenance costs • technical improvements • gaining site closeout
The recommendations are intended to help the site team (the responsible party and the regulators) identify opportunities for improvements. In many cases, further analysis of a recommendation, beyond that provided in this report, may be needed prior to implementation of the recommendation. Note that the recommendations are based on an independent evaluation by the RSE team, and represent the opinions of the RSE team. These recommendations do not constitute requirements for future action, but rather are provided for the consideration of all site stakeholders. The American Creosote Works (ACW) site is located on 1800 Gimble Street on the abandoned American Creosote Works wood preserving plant in Pensacola, Florida. The site is approximately 18 acres in area. The site is about 600 yards north of Pensacola Bay and Bayou Chico. The site soil and ground water have been impacted with volatile organic compounds (VOCs) and semi-volatile organic compounds (SVOCs) associated with wood treating. The soil remedy has largely been completed. The ground water remedy, as of the time of the most recent operation, involved automated recovery of dense non-aqueous phase liquid (DNAPL), with ground water extraction occurring only to enhance DNAPL recovery. At the time of the RSE, the system had been down for over one year due to damage from Hurricane Ivan in September 2004. The site team estimated that operation would resume by the end of calendar year 2005. A remedy including ground water extraction is also planned for the site as a second phase to the ground water remedy. This RSE focuses on the ground water remedy as a whole, including optimization of the current DNAPL recovery system and considerations for improved DNAPL and ground water remediation. The observations and recommendations contained in this report are not intended to imply a deficiency in the work of either the system designers or operators but are offered as constructive suggestions in the best interest of the EPA, the public, and the facility. These recommendations have the obvious benefit of being formulated based upon operational data unavailable to the original designers. The RSE team has the following recommendations to improve the effectiveness of the current remedy.
• EPA is encouraged to continue revisiting the ground water and soil cleanup levels for the site because determination of these levels is fundamental to managing the remedy.
• Given relatively shallow ground water (e.g., 5 feet below ground surface) and benzene
concentrations as high as 47 ug/L, the site team is encouraged to consider the potential for vapor intrusion in nearby buildings. This consideration could include evaluation of the structures to
iii
determine if vapor intrusion is likely. Sampling would likely be appropriate only if this preliminary evaluation suggests the need.
• Since operation began in 1999 there have been four exceedances of the discharge criteria. The
RSE team has suggested new criteria for replacing the granular activated carbon on a regular basis.
• The site team should evaluate options to implement stronger institutional controls.
Implementation of these recommendations might require capital costs of $25,000 and an increase in annual costs of $3,000 per year. However, these cost increases might be offset by the following recommendations to reduce costs.
• The RSE team suggests proceeding with a semi-annual monitoring program in place of an anticipated quarterly monitoring program. Implementing this recommendation might save $40,000 per year.
• Once the pump and treat (P&T) system reaches steady state operation, the RSE team anticipates
the annual labor costs can be reduced from $160,000 to $120,000 per year without reducing remedy protectiveness. This could save an additional $40,000 per year, if implemented.
The RSE team also provides a recommendation for technical improvement, which involves repiping the DNAPL line between the treatment shed and the DNAPL storage tank. The majority of RSE team input, however, is a recommended strategy for moving forward with the ground water remedy. This strategy involves additional investigation and considerations for addressing both DNAPL and contaminated groundwater. A table summarizing the recommendations, including estimated costs and/or savings associated with those recommendations, is presented in Section 7.0 of this report.

iv
PREFACE
This report was prepared as part of a project conducted by the United States Environmental Protection Agency Office of Superfund Remediation and Technology Innovation (U.S. EPA OSRTI) in support of the "Action Plan for Ground Water Remedy Optimization" (OSWER 9283.1-25, August 25, 2004). The objective of this project is to conduct Remediation System Evaluations (RSEs) at selected pump and treat (P&T) systems that are jointly funded by EPA and the associated State agency. The project contacts are as follows:
Organization Key Contact Contact Information
U.S. EPA Office of Superfund Remediation and Technology Innovation (OSRTI)
Jennifer Hovis 1235 S. Clark Street, 12th floor Arlington, VA 22202 Mail Code 5201G phone: 703-603-8888 [email protected]
Dynamac Corporation (Contractor to U.S. EPA)
Daniel F. Pope Dynamac Corporation 3601 Oakridge Boulevard Ada, OK 74820 phone: 580-436-5740 fax: 580-436-6496 [email protected]
GeoTrans, Inc. (Contractor to Dynamac)
Doug Sutton GeoTrans, Inc. 2 Paragon Way Freehold, NJ 07728 phone: 732-409-0344 fax: 732-409-3020 [email protected]

v
TABLE OF CONTENTS
NOTICE............................................................................................................................................................... I
EXECUTIVE SUMMARY ................................................................................................................................ II
PREFACE......................................................................................................................................................... IV
TABLE OF CONTENTS....................................................................................................................................V
1.0 INTRODUCTION ........................................................................................................................................1 1.1 PURPOSE.....................................................................................................................................1 1.2 TEAM COMPOSITION ..................................................................................................................2 1.3 DOCUMENTS REVIEWED ............................................................................................................2 1.4 PERSONS CONTACTED................................................................................................................2 1.5 SITE LOCATION, HISTORY, AND CHARACTERISTICS..................................................................3
1.5.1 LOCATION..................................................................................................................3 1.5.2 POTENTIAL SOURCES.................................................................................................3 1.5.3 HYDROGEOLOGIC SETTING .......................................................................................3 1.5.4 DESCRIPTION OF GROUND WATER CONTAMINATION ...............................................4
2.0 SYSTEM DESCRIPTION............................................................................................................................5 2.1 SYSTEM OVERVIEW ...................................................................................................................5 2.2 EXTRACTION SYSTEM ................................................................................................................5 2.3 TREATMENT SYSTEM .................................................................................................................5 2.4 MONITORING PROGRAM ............................................................................................................6
3.0 SUMMARY OF TREATMENT SYSTEM ACTIVITIES...........................................................................7 3.1 CURRENT SYSTEM OBJECTIVES AND CLOSURE CRITERIA.........................................................7 3.2 TREATMENT PLANT OPERATION GOALS ...................................................................................8
4.0 FINDINGS AND OBSERVATIONS FROM THE RSE SITE VISIT.........................................................9 4.1 FINDINGS....................................................................................................................................9 4.2 SUBSURFACE PERFORMANCE AND RESPONSE ...........................................................................9
4.2.1 WATER LEVELS .........................................................................................................9 4.2.2 CAPTURE ZONE..........................................................................................................9 4.2.3 DNAPL RECOVERY.................................................................................................10
4.3 COMPONENT PERFORMANCE ...................................................................................................10 4.3.1 WELL PUMPS ...........................................................................................................10 4.3.2 PIPELINES.................................................................................................................10 4.3.3 AIR COMPRESSORS ..................................................................................................11 4.3.4 OIL/WATER SEPARATOR .........................................................................................11 4.3.5 BAG FILTER .............................................................................................................11 4.3.6 GRANULAR ACTIVATED CARBON UNITS.................................................................11 4.3.7 PAH METER.............................................................................................................11 4.3.8 TREATED WATER DISCHARGE.................................................................................12 4.3.9 CONTROLS ...............................................................................................................12
vi
4.3.10 OTHER MAINTENANCE ITEMS .................................................................................12 4.4 COMPONENTS OR PROCESSES THAT ACCOUNT FOR MAJORITY OF COSTS ..............................12
4.4.1 UTILITIES .................................................................................................................12 4.4.2 NON-UTILITY CONSUMABLES AND DISPOSAL COSTS.............................................13 4.4.3 LABOR......................................................................................................................13 4.4.4 CHEMICAL ANALYSIS ..............................................................................................13
4.5 RECURRING PROBLEMS OR ISSUES ..........................................................................................13 4.6 REGULATORY COMPLIANCE ....................................................................................................13 4.7 TREATMENT PROCESS EXCURSIONS AND UPSETS, ACCIDENTAL
CONTAMINATION/REAGENT RELEASES...................................................................................13 4.8 SAFETY RECORD ......................................................................................................................14
5.0 EFFECTIVENESS OF THE SYSTEM TO PROTECT HUMAN HEALTH AND THE ENVIRONMENT ......................................................................................................................................15
5.1 GROUND WATER......................................................................................................................15 5.2 SURFACE WATER .....................................................................................................................15 5.3 AIR ...........................................................................................................................................15 5.4 SOILS........................................................................................................................................15 5.5 WETLANDS...............................................................................................................................16
6.0 RECOMMENDATIONS............................................................................................................................17 6.1 RECOMMENDATIONS TO ENSURE EFFECTIVENESS ..................................................................17
6.1.1 CONTINUE REVISITING SOIL CLEANUP LEVELS AND ACLS....................................17 6.1.2 CONSIDER POTENTIAL FOR VAPOR INTRUSION.......................................................17 6.1.3 REVISE PROGRAM FOR DETERMINING GAC REPLACEMENT ..................................17 6.1.4 EVALUATE OPTIONS TO IMPLEMENT STRONGER INSTITUTIONAL CONTROLS ........18
6.2 RECOMMENDED CHANGES TO REDUCE COSTS........................................................................18 6.2.1 REVISE THE GROUND WATER SAMPLING PROGRAM ..............................................18 6.2.2 REVIEW LABOR COSTS ONCE SYSTEM OPERATION HAS STABILIZED ....................18
6.3 MODIFICATIONS INTENDED FOR TECHNICAL IMPROVEMENT..................................................19 6.3.1 REPIPE DNAPL FROM TREATMENT SHED TO DNAPL STORAGE TANK.................19
6.4 MODIFICATIONS INTENDED TO GAIN SITE CLOSEOUT ............................................................19 7.0 SUMMARY................................................................................................................................................22 Figures Figure 1-1. Site Plan Figure 1-2. North-South Geologic Cross-Section Figure 5-1. Historical Soil Excavation and Results from the Sanders Beach Study
1
1.-1 INTRODUCTION
1.1 PURPOSE During fiscal years 2000 and 2001 Remediation System Evaluations (RSEs) were conducted at 20 Fund-lead pump and treat (P&T) sites (i.e., those sites with pump and treat systems funded and managed by Superfund and the States). Due to the opportunities for system optimization that arose from those RSEs, EPA OSRTI has incorporated RSEs into a larger post-construction complete strategy for Fund-lead remedies as documented in OSWER Directive No. 9283.1-25, Action Plan for Ground Water Remedy Optimization. OSRTI has since commissioned RSEs at approximately 10 additional Fund-lead sites with P&T systems. An independent EPA contractor is conducting these RSEs, and representatives from EPA OSRTI are participating as observers. The Remediation System Evaluation (RSE) process was developed by the U.S. Army Corps of Engineers (USACE) and is documented on the following website:
http://www.environmental.usace.army.mil/library/guide/rsechk/rsechk.html RSEs involve a team of expert hydrogeologists and engineers, independent of the site, conducting a third-party evaluation of site operations. They are broad evaluations that consider the goals of a remedy, site conceptual model, above-ground and subsurface performance, and site exit strategy. An RSE includes reviewing site documents, visiting the site for 1 to 1.5 days, and compiling a report that includes recommendations to improve the system. Additional conference calls and/or email exchanges can be used for further communication. RSE recommendations with cost and cost savings estimates are provided in the following four categories:
• improvements in remedy effectiveness • reductions in operation and maintenance costs • technical improvements • gaining site closeout
The recommendations are intended to help the site team identify opportunities for improvements. In many cases, further analysis of a recommendation, beyond that provided in this report, might be needed prior to implementation of the recommendation. Note that the recommendations are based on an independent evaluation by the RSE team, and represent the opinions of the RSE team. These recommendations do not constitute requirements for future action, but rather are provided for the consideration of all site stakeholders. The American Creosote Works (ACW) Site was chosen based on the site complexity, remedy progress, and forecasted expenditures. This report provides a brief background on the site and current operations, a summary of the observations made during a site visit, and recommendations for changes and additional studies.
2
1.2 TEAM COMPOSITION The team conducting the RSE consisted of the following individuals:
Rob Greenwald, Hydrogeologist, GeoTrans, Inc. Anna Kekis, Civil/Environmental Engineer, GeoTrans, Inc. Doug Sutton, Water Resources Engineer, GeoTrans, Inc.
1.3 DOCUMENTS REVIEWED
Author Date Title/Description
US EPA 2/03/1994 Record of Decision, American Creosote Works, Inc. OU2, Pensacola, FL
US EPA May, 2001 American Creosote Works Site, Pensacola, Florida, Fact Sheet
US EPA August 1991 Phase 3 Remedial Investigation Report, American Creosote Works Site
US EPA 9/24/2001 5 Year Review, American Creosote Works Superfund Site
US Army Corps of Engineers Mobile District October 2002 SCAPS Investigation at American Creosote Works
Superfund Site
US EPA January, 2003 American Creosote Works Site, Pensacola, Florida, Fact Sheet
BEM Environmental Engineers and Scientists 5/24/2004
Extraction Well and Recovery System Optimization Desk Study Evaluation American Creosote Works Superfund Site
US Army Corps of Engineers Mobile District June, 2005
Operation and Maintenance Report, April 1 1999 to September 30, 2004 for OU2 Phase I DNAPL Recovery and Recycling American Creosote Works Superfund Site
1.4 PERSONS CONTACTED The following individuals were present for the site visit:
• Jeff Day, BEM Systems • Ed Herman, US Army Corps of Engineers Mobile District • Shea Jones, Remedial Project Manager, EPA Region 4 • Richard Kinsella, US Army Corps of Engineers Mobile District • Ross McCollum, US Army Corps of Engineers Mobile District • Chuck Sands, US EPA Headquarters • John Sykes III, State Regulator, Florida Department of Environmental Protection • Kay Wischkaemper, EPA Region 4

3
1.5 SITE LOCATION, HISTORY, AND CHARACTERISTICS
1.5.1 LOCATION
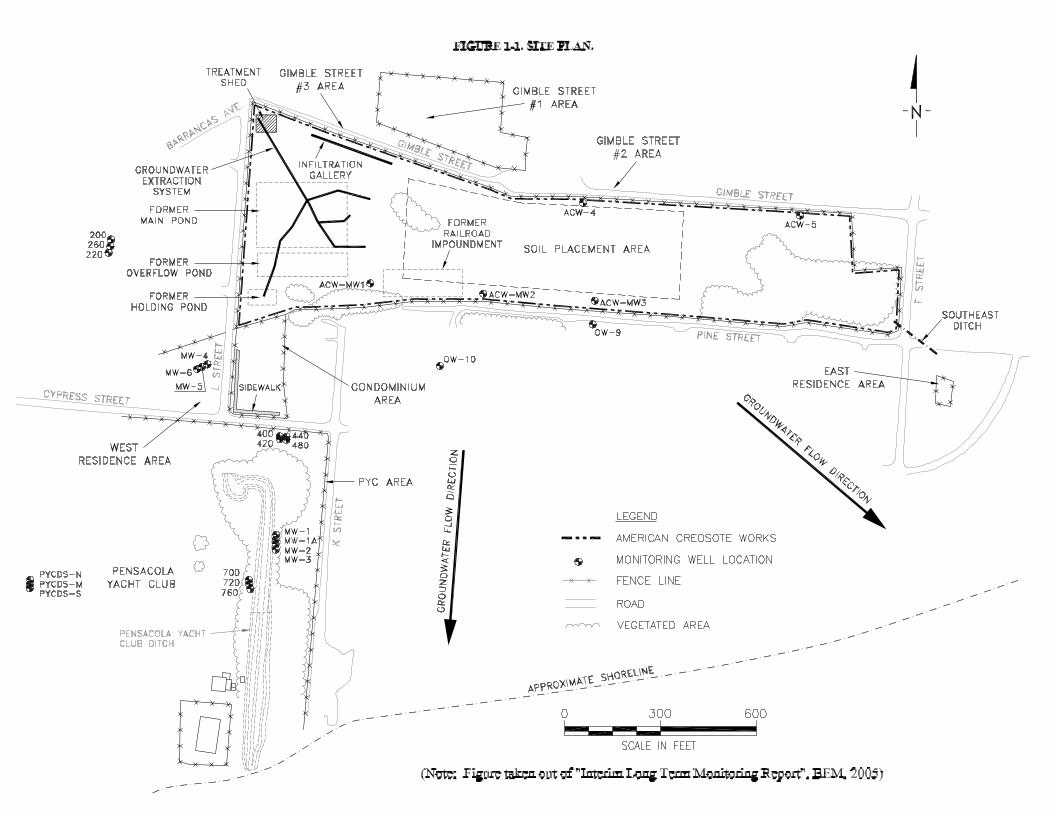
The ACW site is located on 1800 Gimble Street on the abandoned American Creosote Works wood preserving plant in Pensacola, Florida. The site is approximately 18 acres in area. The site is bounded by Gimble Street to the north, F Street to the east, Pine Street and an apartment condominium complex to the South, and L Street to the west. A lumber company, an auto body shop, a produce distributor, and an appliance sales and repair shop lie to the north of the site, residential areas are to the south and east, and the Pensacola Yacht Club (PYC) lies to the southwest of the site. The site is about 600 yards north of Pensacola Bay and Bayou Chico. A site plan is included as Figure 1-1.
1.5.2 POTENTIAL SOURCES
The ACW site has been impacted by creosote and pentachlorophenol (PCP) resulting from wood preserving activities that took place from 1902 to 1981. The main sources of contamination to soil and groundwater are three ponds (main, overflow, and holding), a natural drainage course to Bayou Chico and Pensacola Bay leading from the ponds, and the railroad impoundment. Contamination also resulted from overland flow of impacted water from the ponds during periods of heavy rain and hurricanes. During a Category 3 hurricane, the water surge reaches the edge of the site, and during a Category 4 hurricane, the surge extends to the current treatment shed at the northern end of the property. In late 1983, the ponds were cleaned out, solidified, and capped. Current sources of groundwater contamination are the creosote and PCP dense non-aqueous phase liquid (DNAPL) in the ground. In 1994, EPA estimated that there were 7.25 million gallons of DNAPL and 152 million gallons of contaminated groundwater. In September 1998, a DNAPL recovery system was installed and operated until about September 2004, when it was damaged during Hurricane Ivan. The current groundwater and soil contaminants are VOCs, phenols, PAHs, PCPs, and dioxins.
1.5.3 HYDROGEOLOGIC SETTING
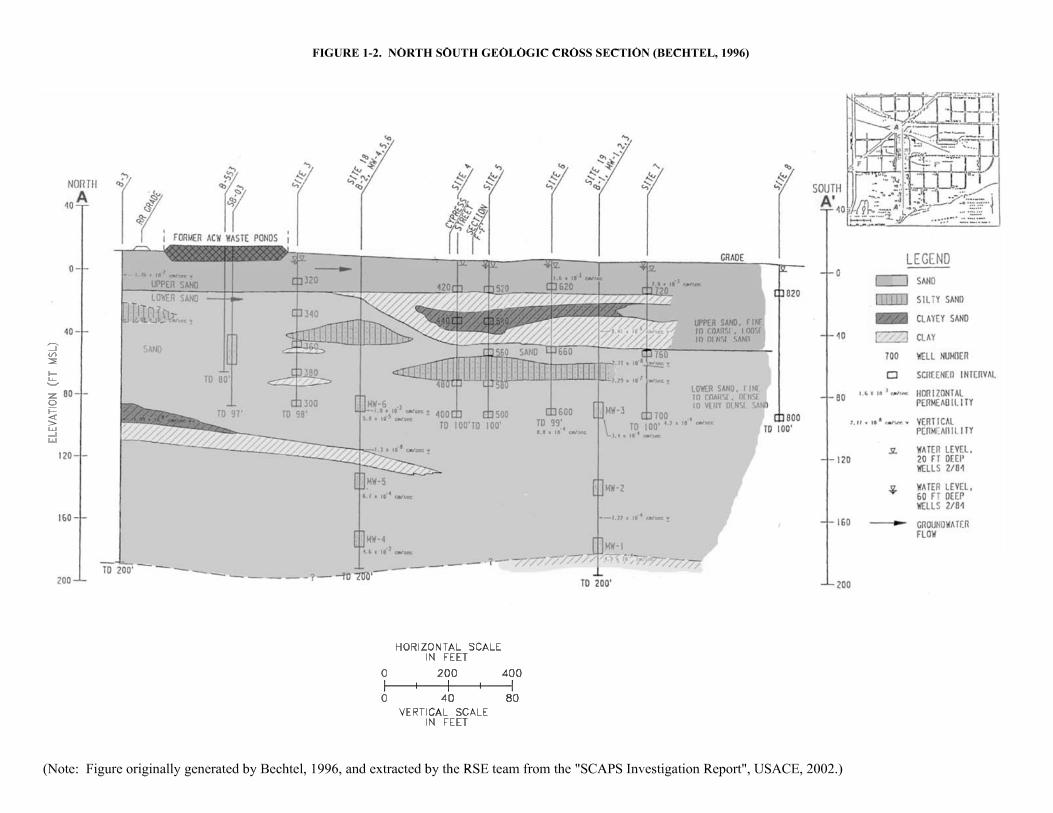
Pensacola lies within the Coastal Lowlands, which consist mainly of sand and gravel. This aquifer is exposed at the surface and deepens to as much as 1,100 feet below ground surface. The upper 25 feet of the ACW site consists of fine to coarse sand. From about 25 feet to 200 feet below ground surface there is very dense sand, fine to medium grained, with interbedded silt and clay nodules and lenses. There is a clay layer directly under the ACW ponds at about 100 feet below ground surface. The Pensacola Clay underlies the sand and gravel aquifer at approximately 200 feet below ground surface and is approximately 250 to 300 feet thick, reportedly providing a hydraulic barrier to vertical contaminant migration. Based on the characteristics of the sands, the water-bearing zone can be divided into two distinct strata identified as the upper and lower sand. The upper sand extends to approximately 25 or 30 feet below ground surface. Representative hydraulic properties for the upper sand include a horizontal hydraulic conductivity of 10-3 cm/s (approximately 3 feet/day) and a hydraulic gradient magnitude of 0.003. South of the site, a clay layer up to 38 feet thick underlies the Pensacola Yacht Club property beginning at a depth of about 20 feet. This clay layer extends south toward Pensacola Bay. The lower sand extends from 30 feet below ground surface to 200 feet below ground surface. Representative hydraulic conductivities for the lower sand from the Remedial Investigation range from 3.4×10⁻⁴ cm/sec to 4.6×10⁻⁴ cm/sec. A representative hydraulic gradient magnitude is 0.0016. Ground water flow direction at the ACW site in the lower sand zones is to the southwest. In the upper sand, ground water flow direction is to the southwest on the western part of the site and southeast on the eastern part of the site. A north-south geologic cross-section is included as Figure 1-2.

4
1.5.4 DESCRIPTION OF GROUND WATER CONTAMINATION
DNAPL has been observed in the upper and lower sands underlying the ACW site. DNAPL migration in the upper sand seems to follow the outline of the former waste ponds and the drainage area. During the RSE site visit this contamination in the upper sand was referred to as the “surface runoff plume”. It is estimated that in the upper sand, DNAPL migration extends 300 ft to the south of Cypress Street, below the PYC property. Its greatest depth is 10 to 30 feet below ground surface, following the upper boundary of the shallow clay layer in this area. DNAPL occurs in the upper sand as stratified layers from less than 1 inch to 7 feet thick. The actual lateral extent of DNAPL in the upper sand layer is not known at this time. DNAPL in the lower sand has been observed at depths 35 to 75 feet below ground, mostly near the former main pond. The actual lateral and downgradient extend of DNAPL in the lower sand layer is not known at this time either. It is possible that DNAPL in the lower sand extends underneath Pensacola Bay. DNAPL in the subsurface provides a continuing source of PCP, PAH, and dioxin/furan contamination to the groundwater. Ground water contamination reportedly extends to as deep as 192 feet. In 2004, VOCs and SVOCs were detected in well MW-4 (screened from 182 to 192 feet below ground surface) just southwest of the site. Ground water contamination extends as far as 1,000 feet south of the site. In 2004, benzene was detected at concentrations ranging from 28 ug/L to 84 ug/L, and acenaphthene was detected at concentrations ranging from 58 ug/L to 130 ug/L in wells 28-1 and 28-5, which are located along the PYC drain. It is possible that the contamination extends further south, perhaps discharging to Pensacola Bay.
5
2.0 SYSTEM DESCRIPTION
2.1 SYSTEM OVERVIEW The pump and treat (P&T) system began operation in 1998 as part of the first phase of remediation of operable unit (OU) 2 (DNAPL remediation). When operating, the system extracts both water and DNAPL, but water is only extracted to enhance DNAPL recovery rather than to remediate or control groundwater contamination. The system was damaged during Hurricane Ivan in September 2004 and has not operated since that time. Repairs are ongoing, and the site team expects to resume operation by the end of calendar year 2005.
2.2 EXTRACTION SYSTEM The P&T extraction system has consisted of 13 extraction wells. Each extraction well has a stainless steel casing and a riser. Extraction wells are installed at depths ranging from 20 feet to 76.5 feet below ground surface. Historically, each operating well was outfitted with two pneumatic pumps: one for extracting DNAPL and one for extracting ground water. The pumps in eight wells are controlled by a series of four sensors (two for each ground water pump and two for each DNAPL pump) to minimize the amount of DNAPL extracted by the ground water pump and to minimize the amount of ground water extracted by the DNAPL pump. At the remaining extraction wells, the sensors and controllers were not installed because the wells were not removing enough DNAPL. Before the P&T system was shut down due to damage from Hurricane Ivan, only four of the extraction wells were effective (EW-3, EW-5, EW-7, and EW-12). These four wells will operate when system operation is resumed. In addition, four other wells (EW-2, EW-6, EW-8, and EW-11) will also operate when the system is resumed. These four other wells were not very productive prior to system shut down, but the site team believes that this lack of production was likely due to drought conditions. Now that there are no longer drought conditions, the site team anticipates that productivity of these wells may improve. The other five extraction wells have not recovered a significant portion of DNAPL, presumably because the well screens do not intercept the intervals impacted with DNAPL.
2.3 TREATMENT SYSTEM The treatment system is designed to treat the relatively low flow of water that is extracted to enhance DNAPL recovery. The system consists of the following:
• 10,000-gallon DNAPL holding tank • 630-gallon oil/water separator • One 25 micron bag filter • Two 1,500-pound liquid phase GAC units arranged in series • An automated Turner Designs PAH monitoring meter • Infiltration gallery • Programmable logic control (PLC) system

6
2.4 MONITORING PROGRAM Process Monitoring
Process monitoring consists of quarterly sampling at three locations: prior to the GAC units, in between the GAC units, and after the GAC units. Analysis is for VOCs, dioxins/furans, and BNAs. An existing PAH meter for evaluating the effluent does not work reliably.
Ground Water Monitoring
The four on-site monitoring wells (ACWMW-5 cluster and ACWMW-6 cluster) are sampled semi-annually for VOCs, SVOCs, and dioxins/furans. Additional on-site monitoring wells ACW-4, ACW-5, ACW-MW1, ACW-MW2, ACW-MW3, off-site monitoring wells (OPYC-1 through OPYC-5), and 22 other off-site monitoring wells have been sampled for VOCs, SVOCs, and dioxins/furans quarterly since April 2004. These 32 wells have been part of the interim long-term monitoring program. The sampling events were April 2004, July 2004, October 2004, and January 2005. Long-term ground water monitoring is expected to continue at the site.

7
3.-1 SUMMARY OF TREATMENT SYSTEM ACTIVITIES
3.1 CURRENT SYSTEM OBJECTIVES AND CLOSURE CRITERIA The site has two operable units (OUs):
• OU1 deals with the remediation of contaminated soil, sludge, and sediment. The amended Record of Decision (ROD) for OU1 was written in 1999. The OU1 remedy was largely completed by January 2004 and is not a primary focus of this RSE.
• OU2 addresses remediation of DNAPL and contaminated groundwater. The OU2 remedy is
divided into two phases:
Phase 1 of the OU2 remedy focuses on DNAPL recovery. The ROD specifies the following components for this phase of the remedy:
◦ Enhanced DNAPL recovery using a combination of water, alkaline, surfactant,
and polymer flooding
◦ DNAPL/water separation and ground water treatment
◦ Off-site transport and recycling of recovered DNAPL and injection of treated ground water
◦ Periodic ground water monitoring to evaluated DNAPL recovery efficiency
◦ Sampling, plugging and abandoning private wells for which owner consent is granted
◦ Implementation of State-imposed well permit restrictions
Phase 2 of the remedy focuses on residual ground water contamination after DNAPL recovery has ended. The ROD specifies the following components for Phase 2:
◦ Ground water removal by pumping extraction wells
◦ On-site treatment of contaminated ground water
◦ Nutrient and hydrogen peroxide addition to the treated water
◦ Injection of the treated ground water, with nutrients, into the contaminated
portion of the aquifer to stimulate in-situ biological treatment activity
◦ Dewatering of waste sludge from the treatment process and disposal at an off-site RCRA landfill
◦ Periodic ground water and surface water monitoring to evaluate treatment system performance
8
The OU2 ROD specifies points of compliance for meeting the ACLs established for ground water at this site. These ACLs were designed to insure that groundwater exceeding surface water standards would not discharge to Pensacola Bay and the PYC ditch. The remedy will be considered effective when groundwater wells immediately upgradient of the surface water bodies meet surface water standards and ACLs are met in ground water at the points of compliance. These ACLs have been used in place of MCLs for cleanup criteria because area residences and businesses use city water and potable use of the aquifer has been restricted. ACLs are currently being reviewed by the EPA. The current ACLs are provided in the following table for reference.
Compound Remedial Goals, µg/L Volatile Organics Benzene 91
Semi-Volatile Organics Acenaphthene 9,000 Fluoranthene 1,5000 Naphthalene 21,900 Total cPAHs 1,100 Benzo(a)Anthracene Benzo(a)Pyrene Benzo(b&k)Fluoranthene Chrysene Anthracene Fluorene Phenanthrene Pyrene Dibenzofuran 44 Pentachlorophenol 296,000
The current P&T system represents work associated with the first phase of OU2. Use of surfactants and alkaline have not been employed. State restrictions for permitting wells have been implemented, but there is a question as to the effectiveness of these restrictions at the local level.
3.2 TREATMENT PLANT OPERATION GOALS When restarted, the DNAPL recovery system will run 24 hours a day 7 days a week. Water discharge standards are set to the ACLs. The current ACLs are provided in the above table for reference; however, the ACLs are being reviewed by EPA.

9
4.-1 FINDINGS AND OBSERVATIONS FROM THE RSE SITE VISIT
4.1 FINDINGS The observations provided below are not intended to imply a deficiency in the work of the system designers, system operators, or site managers but are offered as constructive suggestions in the best interest of the EPA and the public. These observations obviously have the benefit of being formulated based upon operational data unavailable to the original designers. Furthermore, it is likely that site conditions and general knowledge of ground water remediation have changed over time.
4.2 SUBSURFACE PERFORMANCE AND RESPONSE
4.2.1 WATER LEVELS
Water elevation measurements were not collected at the ACW site until a quarterly water level measurement program was recommended by the 5-year review report in 2001. The water elevation contour maps and bedrock potentiometric maps indicate groundwater flow direction to the south towards Pensacola Bay. Water levels also confirm a significant downward gradient of 0.05 ft/ft based on water level measurements from wells 400 and 440 in January 2005.
4.2.2 CAPTURE ZONE
The extraction of groundwater during the first phase of the OU2 remedy is to enhance DNAPL recovery and not to provide capture of contaminated ground water. When the system is operating, the average ground water extraction rate is 0.4 gpm. On the other hand, the flow of ground water through the site is approximately 6 gpm based on the following equation.
KibwQ = where the definitions and values for the above parameters are provided in the following table.
Parameter Definition Parameter Value for This Site Provided by Site Documents
K = the hydraulic conductivity ~ 3 feet/day i = hydraulic gradient ~ 0.003 ft/ft b = thickness of the aquifer where contamination is present ~ 200 feet w = width of the ground water contamination ~ 600 feet
Calculated Q = the flow rate of ground water flowing through the contaminated portion of the site
~ 6 gpm
Note: A conversion factor of 7.48 gallons per cubic foot is used in the calculation of Q. Assuming that an appropriate extraction rate for capture is double the amount of water flowing through the site, the extraction rate needed for capture would be approximately 12 gpm. Therefore, the historical

10
average extraction rate of approximately 0.4 gpm, which is intended to aid in DNAPL recovery, would likely not be sufficient for effective hydraulic capture.
4.2.3 DNAPL RECOVERY
DNAPL recovery decreased dramatically the last two years that the system operated. During the first four years of the OU2 Phase 1 Remedy, 20,000 to 26,000 gallons of DNAPL were removed per year. During the last two years of operation only about 11,000 gallons of DNAPL were removed per year. The following table has DNAPL removal estimates from startup in September 1998 until the shutdown in August-September 2004 due to Hurricane Ivan.
Time Period Approximate DNAPL Removal (gallons) September 1998 to August 1999 20,246 September 1999 to August 2000 20,246 September 2000 to August 2001 23,027 September 2001 to August 2002 26,434 September 2002 to August 2003 10,723 September 2003 to August 2004 10,723
Total 111,399 The site team does not believe this decrease is due to well fouling. Rather, they attribute it to reduced precipitation and infiltration, which appears to correlate with DNAPL recovery. Precipitation has increased recently, and the site team is expecting recovery rates to increase once the system is restarted.
4.3 COMPONENT PERFORMANCE
4.3.1 WELL PUMPS
Each extraction wellhead is protected by a 3 feet square 2 feet deep steel vault with poured concrete base and a steel lid. The well pumps are maintained as follows:
• The check valves on pump controls are cleaned quarterly.
• The plastic parts of pumps that are damaged by DNAPL are changed as needed (quarterly on average).
• The sensors in wells are cleaned approximately twice per year. The sensors and pump controllers have been effective at reducing ground water extraction by the DNAPL pumps and DNAPL extraction by the ground water pumps.
4.3.2 PIPELINES
Groundwater and DNAPL is conveyed from the extraction wells to the treatment system through above-ground pipelines. The DNAPL line is then routed from the treatment shed to the DNAPL storage tank. The pneumatic lines from the air compressor in the treatment shed to the pumps in the wells also run in

11
above-ground pipelines. All above-ground pipelines used to be PVC; but currently, the pipelines are being upgraded as follows:
• Ground water pipelines will be 1.5 inch PVC
• DNAPL pipelines will be ¾ inch kynar
• The containment piping around the groundwater and DNAPL pipelines will be 4” stainless steel
• High voltage electricity wires for solenoid control will be in galvanized steel pipelines
• Low voltage electricity wires for sensors will be in galvanized steel pipelines The site team expects to finish the pipeline upgrade project around November 2005.
4.3.3 AIR COMPRESSORS
A 10 horsepower air compressor powers the pneumatic pumps. The site team did not report any maintenance problems with the air compressor.
4.3.4 OIL/WATER SEPARATOR
The treatment system is equipped with a 630 gallon oil water separator. The accumulating DNAPL is manually transferred into 55 gallon drums for storage until a tanker truck comes to pump out the drums. If storage space in the drums is not adequate between pick-up events, the contents of the drums are pumped into the DNAPL storage tank.
4.3.5 BAG FILTER
The treatment system has one 25 micron bag filter. The filter is changed weekly.
4.3.6 GRANULAR ACTIVATED CARBON UNITS
There are two 1,500-pound GAC units piped in series with no ability to change the lead and lag units. Since startup of the DNAPL extraction the carbon was changed out twice: on 8/17/01 and on 5/04/04. This frequency of carbon change equates to about 3,000 pounds of carbon use over a 3-year period. Therefore, the current system uses approximately 1,000 pounds of carbon every year. After removal, spent carbon is brought to a regeneration facility. There were a number of exceedances of the discharge criteria during the past few years of operation, suggesting that GAC may have needed more frequent replacement.
4.3.7 PAH METER
The PAH meter used to determine the presence of contaminants in the effluent has been recently ineffective for the site because the process water flow rate is too slow for the meter to gather a reliable reading. The site team relies on the quarterly process sampling to determine when GAC requires replacement.
12
4.3.8 TREATED WATER DISCHARGE
The infiltration gallery is about 120 feet away from the treatment shed and is about 150 feet long. The gallery runs parallel to the northern boundary of the site. The site team has not reported any problems associated with maintenance.
4.3.9 CONTROLS
Data from the treatment system is downloaded to the operator’s laptop routinely. There are appropriate controls to prevent releases.
4.3.10 OTHER MAINTENANCE ITEMS
The following maintenance activities are necessary for optimal treatment system operation:
• change absorbent pads around treatment plant weekly
• weekly general site check
• occasional service to floor float
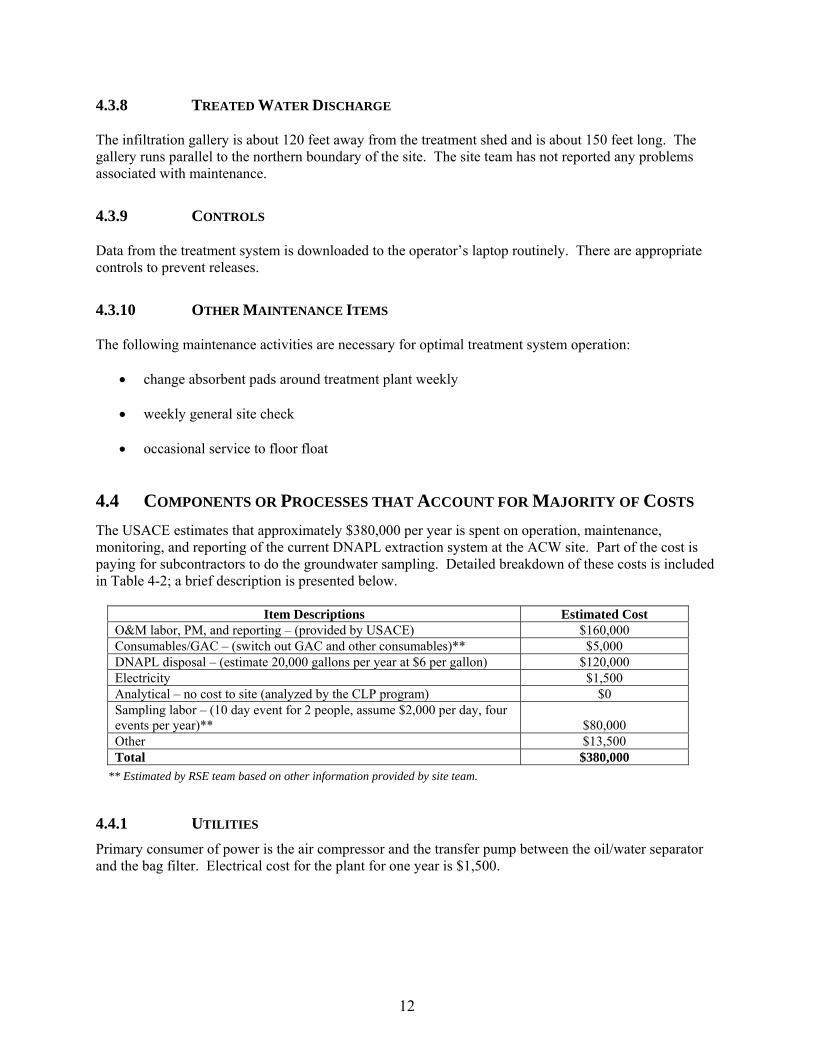
4.4 COMPONENTS OR PROCESSES THAT ACCOUNT FOR MAJORITY OF COSTS The USACE estimates that approximately $380,000 per year is spent on operation, maintenance, monitoring, and reporting of the current DNAPL extraction system at the ACW site. Part of the cost is paying for subcontractors to do the groundwater sampling. Detailed breakdown of these costs is included in Table 4-2; a brief description is presented below.
Item Descriptions Estimated Cost O&M labor, PM, and reporting – (provided by USACE) $160,000 Consumables/GAC – (switch out GAC and other consumables)** $5,000 DNAPL disposal – (estimate 20,000 gallons per year at $6 per gallon) $120,000 Electricity $1,500 Analytical – no cost to site (analyzed by the CLP program) $0 Sampling labor – (10 day event for 2 people, assume $2,000 per day, four events per year)** $80,000 Other $13,500 Total $380,000
** Estimated by RSE team based on other information provided by site team.
4.4.1 UTILITIES Primary consumer of power is the air compressor and the transfer pump between the oil/water separator and the bag filter. Electrical cost for the plant for one year is $1,500.
13
4.4.2 NON-UTILITY CONSUMABLES AND DISPOSAL COSTS
DNAPL disposal (off-site incineration) for one year, assuming 20,000 gallons of DNAPL, is approximately $120,000. GAC usage is approximately 1,000 pounds per year, but more frequent changeouts may be needed to avoid future exceedances of the discharge criteria. The cost for GAC is likely between $1,000 and $2,000 per year. The bag filter is replaced weekly and likely contributes a minimal amount to annual costs. Total non-utility consumables and disposal cost for one year is approximately $125,000.
4.4.3 LABOR
Labor costs for the treatment system include project management, reporting, and operation and maintenance of the treatment system. Maintenance activities include weekly treatment system maintenance (described in Section 4.3.9), quarterly and semiannual extraction well maintenance (described in Section 4.3.1), and quarterly ground water sampling.
4.4.4 CHEMICAL ANALYSIS
The chemical analysis for the site is provided by the CLP program, and the costs are not charged to the site.
4.5 RECURRING PROBLEMS OR ISSUES Recurring problems for the DNAPL extraction system are as follows: • Electrical problems due to lightning at least twice a year • Clogging of the Kynar tubing between the treatment shed and the DNAPL storage tank • Occasional hurricanes that cause damage
4.6 REGULATORY COMPLIANCE Discharge standards (which are the remedial goals or ACLs) have been met with the exception of four occasions. On April 2001, April 2002, October 2002, and June 2003 benzene in the treatment plant effluent exceeded its ACL.
4.7 TREATMENT PROCESS EXCURSIONS AND UPSETS, ACCIDENTAL CONTAMINATION/REAGENT RELEASES
The site team did not report any treatment process excursions that would lead to a health and safety hazard or additional site contamination.

14
4.8 SAFETY RECORD The site has a trailer that has a telephone, health & safety equipment, and a bathroom. The site is not in a remote location, and the operators have cell phones as well. No health and safety incidents were reported to the RSE team.
15
5.-1 EFFECTIVENESS OF THE SYSTEM TO PROTECT HUMAN HEALTH AND THE ENVIRONMENT
5.1 GROUND WATER Dissolved and freephase PCP and PAHs exist underneath the ACW site. The vertical and horizontal extent of this contamination is not entirely known. The existing P&T system is designed for DNAPL extraction and not containment of groundwater. Groundwater is migrating offsite at concentrations well above MCLs but below the current ACLs for a number of constituents (except for dibenzofuran which is routinely detected above the ACLs). It is noted, however, that EPA is reviewing the ACLs. Residences and businesses in the area are connected to the public water system, and the public water supply wells are upgradient of the ACW site. Therefore, the remedy should be protective of human health with respect to ingesting ground water. However, the site team reports that the implemented institutional control is a Florida Department of Environmental Protection rule. The site team reports, however, that these institutional controls may not be effective since there are lots of exceptions to the rules, such as allowing installation of wells for irrigation. There is a concern that these rules may not provide adequate notification and that the Department of Health (which samples private wells) may not be aware of the institutional controls and the potential for impacts to local wells.
5.2 SURFACE WATER Site contamination extends downgradient from the site and likely reaches Pensacola Bay, Bayou Chico, and/or the water in the PYC ditch. To date, contaminant concentrations in ground water are generally below the ACLs; however, EPA is reviewing these ACLs.
5.3 AIR Site contaminants include VOCs, such as benzene and naphthalene. In general, contaminant concentrations are higher at 60 feet below ground surface than in shallow ground water. However, benzene concentrations as high as 47 ug/L have been detected in monitoring well 28-5, which screens an interval from 5 to 10 feet below ground surface. Given the shallow depth to ground water, this benzene concentration may be sufficiently high to cause a potential indoor air problem, if an overlying structure is present that is not adequately isolated from soil vapor.
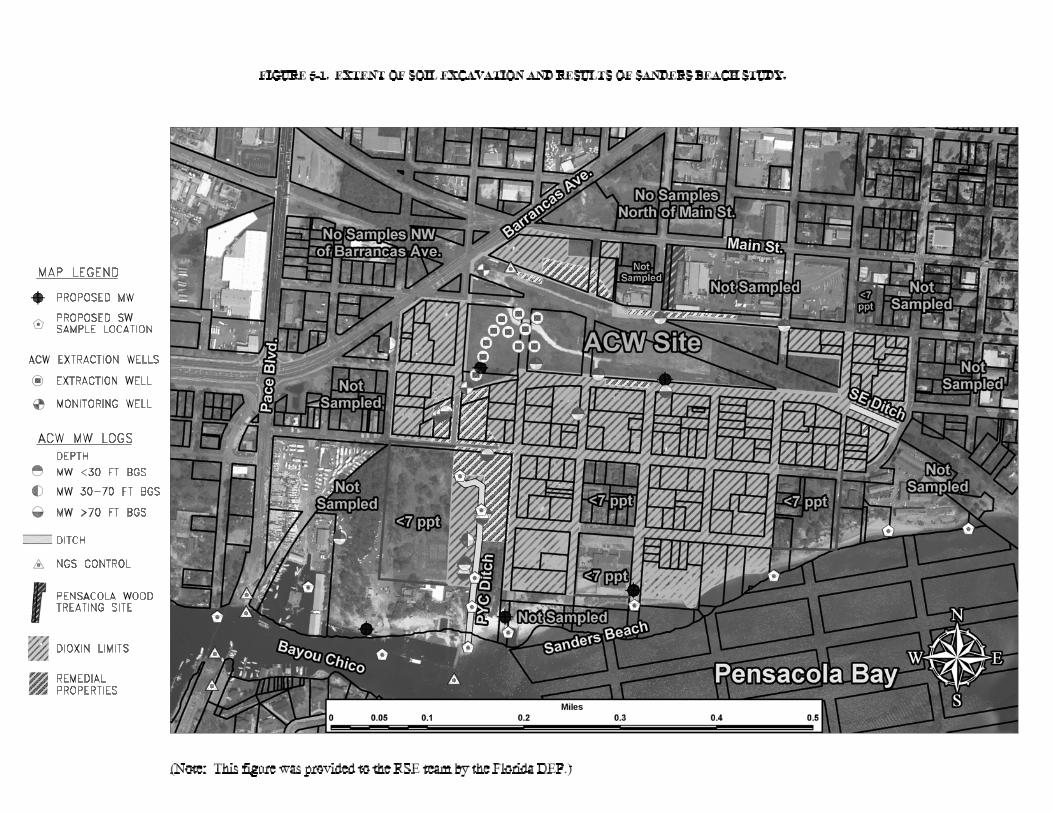
5.4 SOILS On-site soil contamination from the three ponds has been addressed. In late 1983, the contamination in the ponds was removed, solidified, and capped. In addition, in 2003, contaminated surface soils from the condominium area just south of the site, in the PYC area, and in the east and west residence areas were excavated. Figure 5-1 illustrates areas where soil removal has been completed.

16
The residential areas downgradient of the site, shown on Figure 5-1, were investigated in 1997 during the “Sanders Beach Study”. During this study, dioxin TEQ concentrations up to 1 ppb were identified. In addition, the 1991 Phase III RI indicates TEQ concentrations as high as 1,500 ng/kg (i.e., 1.5 ppb) on residential property immediately south of the site. This surface soil contamination represents a potential human exposure pathway. For establishing cleanup criteria, the site team refers to the 1998 EPA Directive titled Approach for Addressing Dioxin in Soil at CERCLA AND RCRA Sites (OSWER Directive 9200.4-26), which established a TEQ concentration of 1 ppb as a starting point for establishing dioxin cleanup levels at CERCLA and RCRA sites. According to this directive, a TEQ of 1 ppb represents an increased cancer risk of 2.3 x 10⁻⁴. If these levels are revisited along with the ACLs for ground water, the site team may find that remedial action of these surface soils is merited. The site team notes that a risk-based corrective action approach consistent with new Florida Department of Environmental Protection regulations may be appropriate for this soil contamination. This regulation sets a default soil cleanup target of 7 parts per trillion (ppt) for dioxin. The site team is in the process of investigating possible surface soil contamination present along the southeast ditch. The contamination might be due to the rail line or to overland flow from the site.
5.5 WETLANDS Additional investigation is proposed for the PYC ditch, which may have been impacted from overland flow of contamination and/or discharge of impacted ground water to the ditch.
17
6.-1 RECOMMENDATIONS
The recommendations provided in this section are based on a review of site documents and discussions with the site team during the site visit. The recommendations in Sections 6.1 through 6.3 are intended to be implemented immediately while the current system is operating. The items in Section 6.4 are provided to give the site team direction in modifying the overall OU2 remedy to be consistent with the ROD and better achieve the goals stated in the ROD. Cost estimates provided herein have levels of certainty comparable to those done for CERCLA Feasibility Studies (-30/+50%), and these cost estimates have been prepared in a manner consistent with EPA 540-R-00-002, A Guide to Developing and Documenting Cost Estimates During the Feasibility Study, July 2000. 6.1 RECOMMENDATIONS TO ENSURE EFFECTIVENESS
6.1.1 CONTINUE REVISITING SOIL CLEANUP LEVELS AND ACLS
EPA indicated that they are reviewing the ACLs that have been selected for the site to determine if they are appropriate for ground water discharging to Pensacola Bay, Bayou Chico, and/or the PYC ditch. The RSE team encourages EPA to continue with this review because the determination of new ACLs will significantly affect the implementation of the second phase of the OU2 remedy. The RSE team also suggests that EPA revisit the soil cleanup standards for dioxin. The current level of 1 ppb represents an increased cancer risk of 2.3 x 10⁻⁴ and was meant to serve as a starting value for sites. It is possible that a lower concentration is more appropriate as a cleanup level. The site team notes that the Florida Department of Environmental Protection’s new risk-based regulation establishes a default soil cleanup target level of 7 ppt for dioxin.
6.1.2 CONSIDER POTENTIAL FOR VAPOR INTRUSION
Given the benzene concentration of 47 ug/L at monitoring well 28-5 and the relatively shallow depth to water (5 to 10 feet), the site team may want to review residential and business structures in the area to see if such concentrations in ground water could result in an adverse impact to indoor air. This recommendation does not necessarily suggest that vapor sampling or indoor air sampling be implemented. Such sampling would be contingent on the results from the review of building construction. For example, if the buildings are on stilts, it would be unlikely for there to be an indoor air problem caused by the ground water plume. The RSE team estimates that the cost for this evaluation is less than $5,000, including documentation in a short technical memo to EPA.
6.1.3 REVISE PROGRAM FOR DETERMINING GAC REPLACEMENT
The treatment plant includes an automated sensor for detecting PAHs in the GAC effluent. If working properly, this sensor can indicate to the site team when the GAC should be replaced. However, the sensor has not been effective because the process water flow rate is too low. In its relatively short operating
18
history from June 1999 through September 2004, there were four instances of exceedances of discharge criteria from the treatment plant effluent. The site team collects samples from the GAC influent, mid-point, and effluent on a quarterly basis, and the RSE team believes that this routine monitoring and historical data is sufficient to determine when GAC replacement is necessary. Historical process monitoring suggests that the two GAC units reach their chemical loading capacity every year, but GAC has only been replaced twice since June 1999. The RSE team suggests that the site team replace the GAC in twice the amount of time it takes for there to be a significant detection of benzene at the sampling point between the two GAC units, or every year of operation, whichever is less. That is, during a period of continuous operation, if there is no detection of benzene at the midpoint for six or nine months, the site team should replace both GAC units after 12 months of operation. On the other hand, if there is a significant detection of benzene after three months of operation, the site team should replace both GAC units three months later (i.e., after 6 total months of operation or twice the amount of time it took for the detection at the midpoint). This recommendation will likely increase the cost of GAC changeouts from approximately $1,500 per year (e.g., two changeouts during five to six years of operation) to approximately $4,500 per year (e.g., one changeout per year), but it should reduce the likelihood of the treatment plant effluent exceeding the ACLs.
6.1.4 EVALUATE OPTIONS TO IMPLEMENT STRONGER INSTITUTIONAL CONTROLS
As discussed in Section 5.1, there is some concern that local parties, including the Department of Health, may not be aware of the current institutional controls. It is recommended that the EPA and State regulators work with local officials to insure that the intent of the institutional controls is adequately addressed. This might require approximately $20,000 of contractor support.
6.2 RECOMMENDED CHANGES TO REDUCE COSTS
6.2.1 REVISE THE GROUND WATER SAMPLING PROGRAM
The site team conducted four quarters of ground water monitoring between April 2004 and January 2005. It is appropriate to conduct long-term ground water monitoring at this site, and the RSE team suggests that an appropriate, cost-effective program would likely consist of semi-annual events that include sampling of water quality, measuring water levels, and gaging DNAPL levels in monitoring wells. Based on information provided by the site team, the RSE team estimates that the monitoring costs (excluding analysis) are on the order of $20,000 per event. Therefore, continuing with quarterly sampling would likely cost $80,000 per year and moving forward with semi-annual sampling would likely cost $40,000 per year. The RSE team assumes that the site team would have eventually proceeded with a quarterly sampling program in the absence of an RSE recommendation. Therefore, the RSE team estimates that implementing this recommendation could save the site approximately $40,000 per year.
6.2.2 REVIEW LABOR COSTS ONCE SYSTEM OPERATION HAS STABILIZED
The current annual O&M cost for the system is $380,000. If recommendation to continue annual sampling, but on a semi-annual basis, is implemented, the annual costs should decrease by approximately $40,000 per year to $340,000. This is relatively cost-effective for a Fund-lead site of this nature, especially since there is not much flexibility in DNAPL disposal costs. Once the system is operating on a steady-state basis, the labor costs for project management, reporting, and plant operations could likely be reduced to approximately $120,000 from $160,000. This would leave $25,000 per year for project
19
management, $20,000 per year for annual reports, $50,000 for weekly operator visits, and $25,000 for non-routine repairs. This should further reduce long-term O&M costs to approximately $300,000.
6.3 MODIFICATIONS INTENDED FOR TECHNICAL IMPROVEMENT
6.3.1 REPIPE DNAPL FROM TREATMENT SHED TO DNAPL STORAGE TANK
The kynar DNAPL line from the treatment plant to the DNAPL storage tank makes a series of right-angle turns, including one turn from a vertical direction to a horizontal direction. At this particular turn, the kynar tubing kinks. During the past several winters when temperatures drop, the line clogs at this kink. The kink and clog could likely be avoided by hard-piping this portion of the line with either galvanized or painted steel. This effort should reduce the number of shutdowns and reduce the potential for DNAPL leaks. The costs for this modification should be less than $1,000.
6.4 MODIFICATIONS INTENDED TO GAIN SITE CLOSEOUT
The items in this section are provided as a proposed strategy for a cost-effective means of implementing the ROD. It should be noted that this strategy is, in many ways, consistent with the approach taken to date and should not necessarily represent a large departure from activities that have been conducted to date. However, the suggested strategy will involve implementation of Phases I and II of the OU2 ROD simultaneously with the purpose of improving remedy protectiveness. The RSE team suggests the following path forward (items 1 to 4 pertain to the upper sand only): 1. Conduct a shallow SCAPS event to determine the DNAPL distribution and extent south of the
site toward and onto the PYC property, between the water table and the top of the shallow clay layer that begins at approximately -10 ft MSL.
2. Based on the SCAPS results, install two monitoring wells (constructed so they could potentially be converted to extraction wells) near the downgradient edge of the DNAPL plume but within this offsite shallow DNAPL plume to determine how mobile the product is and the potential for recovering NAPL from this location. If the mobile DNAPL in the shallow sand extends all the way to the Bay, these wells would likely be located in an area where establishing a DNAPL cutoff is appropriate and where access is optimal.
3. Based on the data from steps 1 and 2, determine the potential for DNAPL in the upper sand to continue migrating (based on recovery rates and DNAPL thickness in the new wells) and the need for actively containing this offsite DNAPL. Three options may exist for addressing this shallow DNAPL:
• No action – might be appropriate if the product plume is stable and not mobile • Manual collection from wells or collection trench – might be appropriate if product is
mobile but sufficiently limited to not merit a more aggressive containment approach.
• Recovery trench with automated collection – only appropriate if the other two other options are not sufficient, and DNAPL will almost certainly migrate into the PYC ditch or discharge directly to the bay.
20
4. If the DNAPL is mobile and “no action” is not an option, discuss the potential with PYC to use their property for remediation of shallow DNAPL. Remedial options to be discussed with PYC might range from periodic manual collection to the installation and operation of a DNAPL recovery trench and an on-site AST system for collected DNAPL.
5. Implement a comprehensive ground water remedy as follows:
• Increase shallow DNAPL recovery on-site to reduce mobile DNAPL mass. This component of the remedy is important to reduce/minimize the amount of DNAPL that can continue to migrate downward or horizontally at depth. The on-site SCAPS data (already collected) should be used to locate wells in three different intervals: a shallow interval, an intermediate interval, and a deep interval. Each of the recovery wells should have a screened interval that covers the extent of the DNAPL zone it is intended to screen. According to the SCAPS report the screen lengths would be 5 feet for the shallow zone, 20 feet for the intermediate zone, and 20+ feet for the deep zone. Effort should be taken to stay within these intervals so that the wells do not act as preferential pathways for further downward migration. Effort should also be taken to place the wells in areas with relatively high permeability so that DNAPL recovery is effective. (Note that the previous SCAPS data concluded that the reason that some wells don’t produce is that they might be screened in areas with relatively low permeability.) Estimate approximately four wells per interval for a total of approximately 12 new recovery wells.
• If the revised ACLs are lowered and the offsite dissolved plume has concentrations that
exceed these new standards, ground water extraction wells should be installed to contain the dissolved contamination in both the upper sand and the lower sand. Ground water extraction should likely occur at multiple depth intervals at or near the downgradient edge of the ACW property. Extracted water should be pumped to the on-site treatment system for treatment. Treated water should be discharged to the subsurface in an infiltration gallery that is located side-gradient of the capture zone, presumably on the eastern side of the property, so that the capture zone of the extraction wells is not negatively impacted. By cutting off the primary source of dissolved contamination at this location, the concentrations at locations downgradient of the capture zone that are not in direct contact with DNAPL should begin to decrease. Evaluating concentration trends at the 400 monitoring well cluster will help evaluate the effectiveness of this effort to contain the dissolved plume (unless significant DNAPL is present in the vicinity, or if it is within the capture zone of the extraction wells). Concentrations in other wells, such as well 760 and 28-1, should also begin to decrease. Groundwater modeling with a relatively simple software package, such as QuickflowTM, should be used to help determine the appropriate pumping locations, infiltration gallery location, and pumping rates.
• The recovery from the DNAPL recovery wells and the ground water extraction wells (if
installed) should be evaluated to determine if the existing treatment plant can handle the capacity. If a new treatment plant is needed, the plant should include the following:
◦ Appropriately sized oil-water separator
◦ Appropriately sized organoclay vessel to remove emulsified product that may be
present in the oil-water separator effluent

21
◦ Two appropriately-sized GAC vessels arranged in series with the capability to swap lead and lag units
◦ Sample ports to sample the influent, between the GAC vessels, and the effluent (use of the automated BTEX/PAH sensor should not be needed)
◦ Discharge to an infiltration gallery that is constructed side-gradient to the former waste ponds so that it does not reduce the ability of the groundwater extraction wells to provide containment.
If the data in steps 1 through 4 clearly suggest the need for downgradient containment of shallow DNAPL, consider construction of a shallow interceptor trench at a practical location to contain the downgradient plume. This location would preferably as close to the downgradient edge of the plume as possible. The trench should be completed one to two feet into the shallow clay. A horizontal perforated pipe should be placed at the bottom of the trench with a sump, riser, and dedicated pump. The trench should be back filled with gravel such that the permeability of the fill is substantially greater than the native sandy material. The site team should also consider installing a geomembrane on the downgradient edge of the lower half of the trench to further prevent DNAPL from migrating through the trench. DNAPL migrating along the top of the clay or in stringers in the sand above the clay should reach the trench, migrate downward through the gravel, and collect at the bottom of the trench where it is gathered in the perforated pipe and directed to the sump. Depending on the amount of DNAPL, recovery can occur from regularly scheduled manual events or through automated pumping. All attempts should be made to avoid automated pumping due to the inconvenience of treating extracted water and storing extracted DNAPL. If automated pumping is needed, DNAPL should be stored in a local AST to minimize potential problems with conveying DNAPL over 1,000 feet back to the ACW site. There are two options for the treated water: treat the water near the point of extraction with a separate treatment system; or, pipe the water back to the ACW treatment plant. The most cost-effective solution is likely to pipe the water back to the treatment system (over 1,000 feet through public right of ways). Because the pipe will be buried and difficult to replace, pipe that is resistant to naphthalene and other creosote compounds should be used, such as 304 stainless steel. Because of the open-ended nature of this recommendation, the RSE team has not provided a cost estimate for implementation.

22
7.-1 SUMMARY
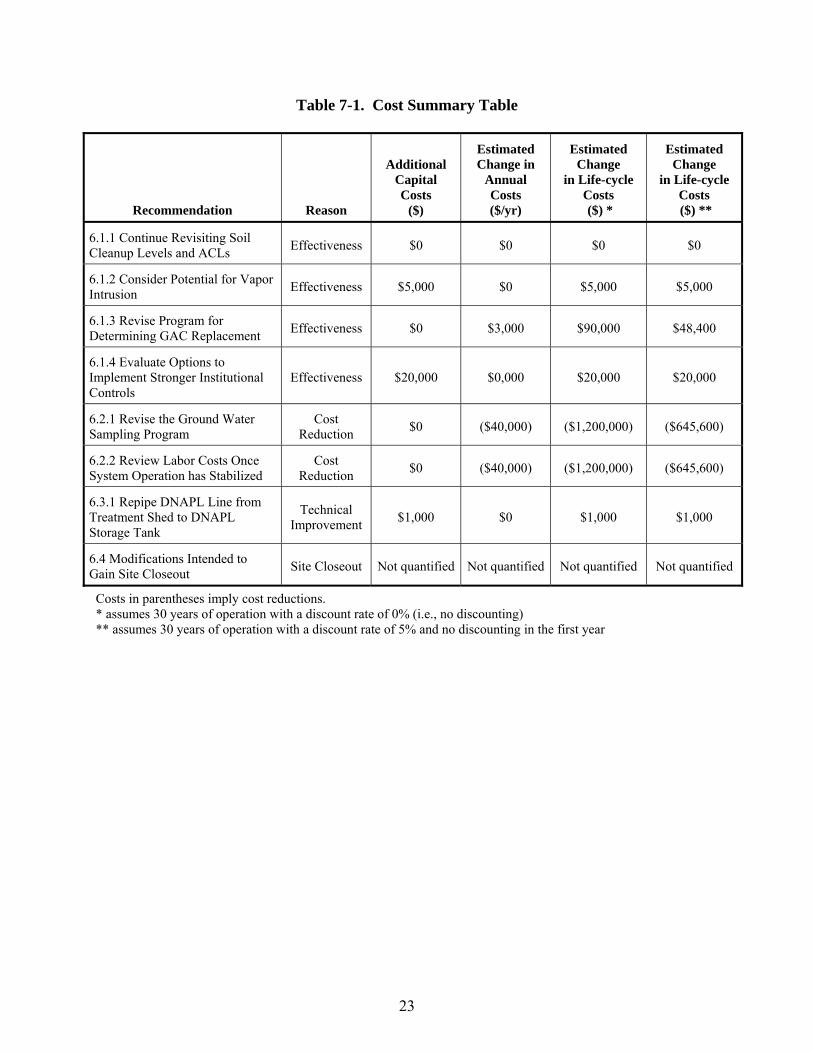
The observations and recommendations contained in this report are not intended to imply a deficiency in the work of either the system designers or operators, but are offered as constructive suggestions in the best interest of the EPA and the public. These recommendations have the obvious benefit of being formulated based upon operational data unavailable to the original designers. Recommendations are provided in all four categories: effectiveness, cost reduction, technical improvement, and site closeout. Recommendations for effectiveness are primarily focused on reviewing cleanup standards, considering the potential for vapor intrusion, revising the procedure for determining the GAC replacement frequency, and evaluating options for stronger institutional controls. Recommendations for cost reduction include revising the ground water monitoring program and reducing overall labor once the system operation has stabilized. The technical improvement recommendations include repiping the DNAPL line to avoid clogging. With respect to site closure, a strategy is provided for improving the overall remedy. Table 7-1 summarizes the costs and cost savings associated with each. Both capital and annual costs are presented. Also presented is the expected change in life-cycle costs over a 30-year period for each recommendation both with discounting (i.e., net present value) and without it.
23
Table 7-1. Cost Summary Table
Recommendation Reason
Additional Capital Costs
($)
Estimated Change in
Annual Costs ($/yr)
Estimated Change
in Life-cycle Costs ($) *
Estimated Change
in Life-cycle Costs ($) **
6.1.1 Continue Revisiting Soil Cleanup Levels and ACLs Effectiveness $0 $0 $0 $0
6.1.2 Consider Potential for Vapor Intrusion Effectiveness $5,000 $0 $5,000 $5,000
6.1.3 Revise Program for Determining GAC Replacement Effectiveness $0 $3,000 $90,000 $48,400
6.1.4 Evaluate Options to Implement Stronger Institutional Controls
Effectiveness $20,000 $0,000 $20,000 $20,000
6.2.1 Revise the Ground Water Sampling Program
Cost Reduction $0 ($40,000) ($1,200,000) ($645,600)
6.2.2 Review Labor Costs Once System Operation has Stabilized
Cost Reduction $0 ($40,000) ($1,200,000) ($645,600)
6.3.1 Repipe DNAPL Line from Treatment Shed to DNAPL Storage Tank
Technical Improvement $1,000 $0 $1,000 $1,000
6.4 Modifications Intended to Gain Site Closeout Site Closeout Not quantified Not quantified Not quantified Not quantified
Costs in parentheses imply cost reductions. * assumes 30 years of operation with a discount rate of 0% (i.e., no discounting) ** assumes 30 years of operation with a discount rate of 5% and no discounting in the first year

24
FIGURES


![Adipose-Derived Stem Cells [Methods in Molec Bio 0702] - J. Gimble, B. Bunnell (Humana, 2011) WW](https://static.fdocuments.in/doc/165x107/613caa3c9cc893456e1e96aa/adipose-derived-stem-cells-methods-in-molec-bio-0702-j-gimble-b-bunnell-humana.jpg)