E.ON Roadshow March 2017 from long-term customer relations built on satisfaction and trust ~15% >6...
39
March 2017 E.ON Roadshow
Transcript of E.ON Roadshow March 2017 from long-term customer relations built on satisfaction and trust ~15% >6...

March 2017
E.ON Roadshow
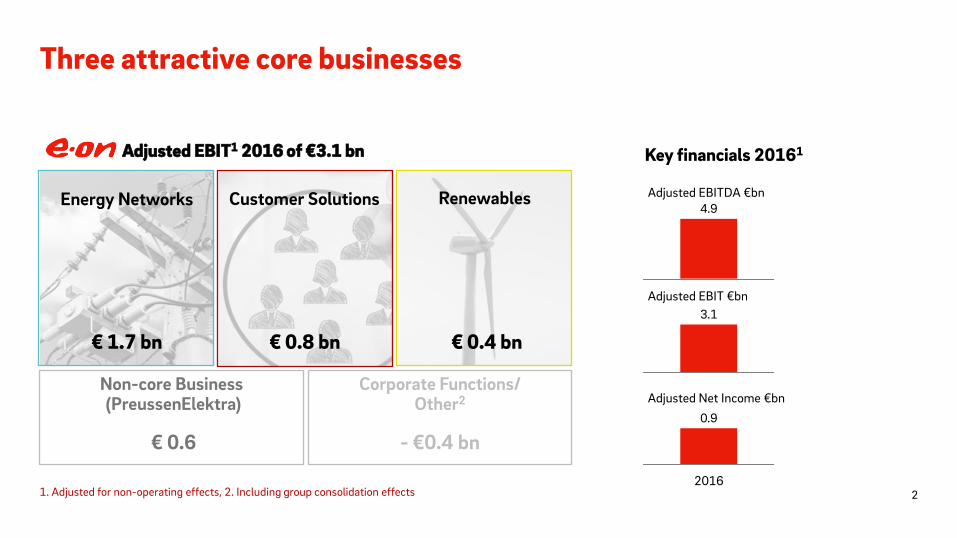
Three attractive core businesses
2
Adjusted EBITDA €bn
Adjusted EBIT €bn
Adjusted Net Income €bn
Adjusted EBIT1 2016 of €3.1 bn
4.9
3.1
0.9
2016
Corporate Functions/ Other2
- €0.4 bn
Non-core Business (PreussenElektra)
€ 0.6
€ 1.7 bn € 0.4 bn € 0.8 bn
Key financials 20161
1. Adjusted for non-operating effects, 2. Including group consolidation effects
Energy Networks Customer Solutions Renewables
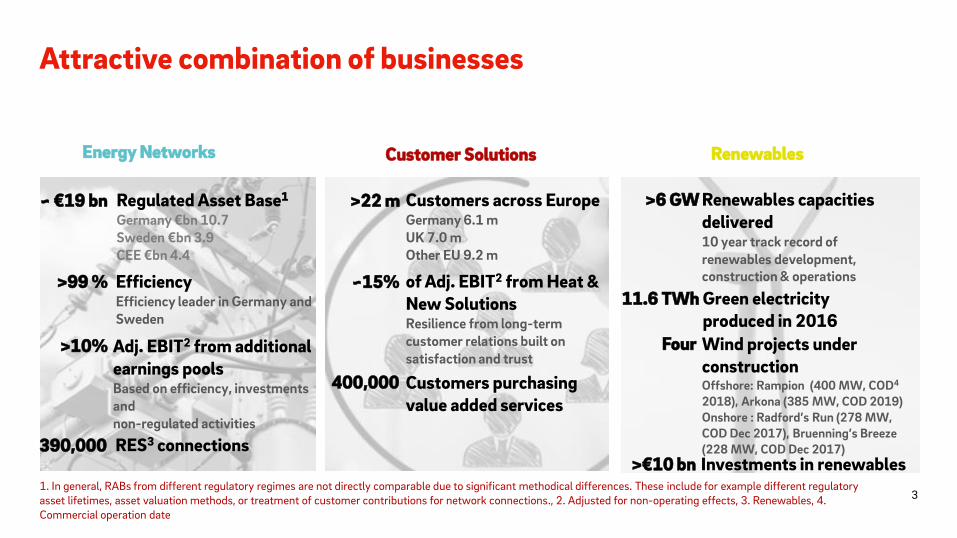
Attractive combination of businesses
1. In general, RABs from different regulatory regimes are not directly comparable due to significant methodical differences. These include for example different regulatory asset lifetimes, asset valuation methods, or treatment of customer contributions for network connections., 2. Adjusted for non-operating effects, 3. Renewables, 4. Commercial operation date
Energy Networks Renewables Customer Solutions
~ €19 bn Regulated Asset Base1 Germany €bn 10.7 Sweden €bn 3.9 CEE €bn 4.4
Efficiency Efficiency leader in Germany and Sweden
>99 %
Adj. EBIT2 from additional earnings pools Based on efficiency, investments and non-regulated activities
>10%
>22 m Customers across Europe Germany 6.1 m UK 7.0 m Other EU 9.2 m
Customers purchasing value added services
400,000
of Adj. EBIT2 from Heat & New Solutions Resilience from long-term customer relations built on satisfaction and trust
~15%
>6 GW Renewables capacities delivered 10 year track record of renewables development, construction & operations
Wind projects under construction Offshore: Rampion (400 MW, COD4 2018), Arkona (385 MW, COD 2019) Onshore : Radford’s Run (278 MW, COD Dec 2017), Bruenning’s Breeze (228 MW, COD Dec 2017)
Four
Green electricity produced in 2016
11.6 TWh
RES3 connections 390,000 Investments in renewables
>€10 bn
3
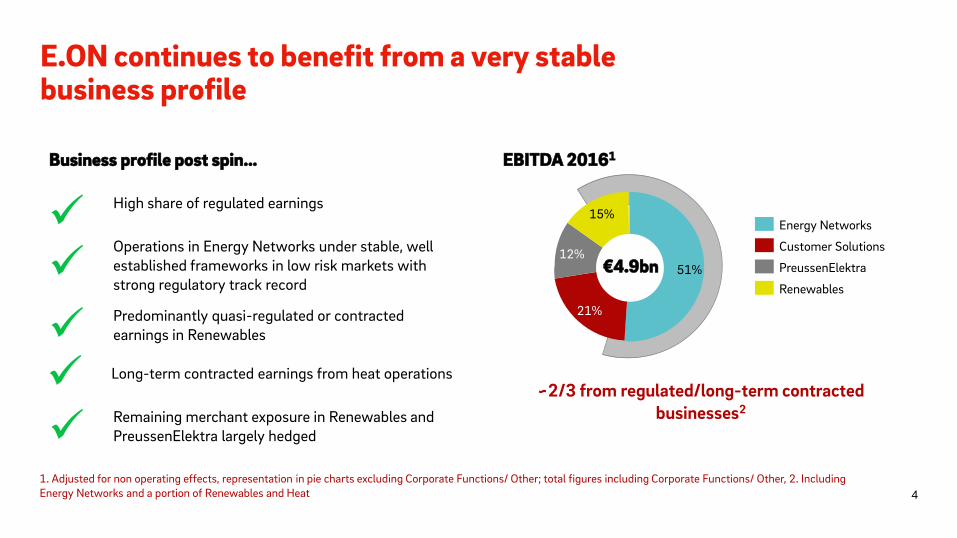
E.ON continues to benefit from a very stable business profile
Business profile post spin…
High share of regulated earnings
Predominantly quasi-regulated or contracted earnings in Renewables
Remaining merchant exposure in Renewables and PreussenElektra largely hedged
Operations in Energy Networks under stable, well established frameworks in low risk markets with strong regulatory track record
Long-term contracted earnings from heat operations
EBITDA 20161
~2/3 from regulated/long-term contracted businesses2
1. Adjusted for non operating effects, representation in pie charts excluding Corporate Functions/ Other; total figures including Corporate Functions/ Other, 2. Including Energy Networks and a portion of Renewables and Heat
51%
15%
12%
21%
Energy Networks
Customer Solutions
PreussenElektra
Renewables
€4.9bn
4

Solid delivery of full year 2016 targets
EBIT1 and EBITDA1 at top end of full year guidance
Adj. Net Income1 at the upper end of the guidance range
Dividend proposal: €0.21/share
Efficiency program initiated - securing sustainable competitiveness
Focus on disciplined capital allocation - CAPEX spending reduced
Uniper spin-off and KFK law led to high extraordinary effects and total reported IFRS loss of €16.0 bn in 2016
Highlights
904
Adj. Net Income1 EBIT1
3.112
EBITDA1
4.939
2016 key figures
1. Adjusted for non operating effects
€ m
2016 Outlook range
2.700-3.100
600 - 1.000
4.600 - 5.000
5

KFK implementation in final stages
6
Status / Next steps Total payment amount for E.ON confirmed
2.00.2
10.0
7.8
Premium1 Provisions Payment amount1
Provision for interest costs
€ bn
• German legislative process completed
• Law approved by Bundestag and Bundesrat in December 16
• State aid approval by the EU Commission expected in Q2 17
• Additional contract finalized
• Nuclear operators are dropping storage-related legal claims and moratorium court cases
• Signing of contract expected closely after law enters into force
• Payment planned around 1st July 2017
• Financing of premium via capital measures
• Financing of base amount via liquidity on balance sheet and bond issues (up to €3 bn) as well as Commercial Paper (CP)
1. Excluding €0.2 bn for minority shareholders
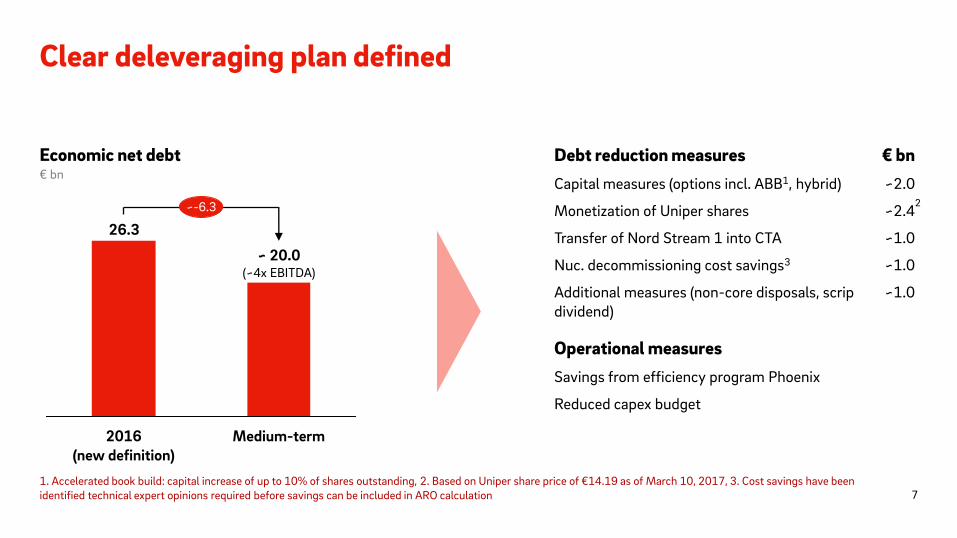
Clear deleveraging plan defined
Economic net debt Debt reduction measures
Capital measures (options incl. ABB1, hybrid)
Monetization of Uniper shares
Transfer of Nord Stream 1 into CTA
Nuc. decommissioning cost savings3
Additional measures (non-core disposals, scrip dividend)
Operational measures
Savings from efficiency program Phoenix
Reduced capex budget
€ bn
26.3
~ 20.0 (~4x EBITDA)
2016 (new definition)
~-6.3
Medium-term
€ bn
~2.0
~2.4
~1.0
~1.0
~1.0
1. Accelerated book build: capital increase of up to 10% of shares outstanding, 2. Based on Uniper share price of €14.19 as of March 10, 2017, 3. Cost savings have been identified technical expert opinions required before savings can be included in ARO calculation
2
7

Efficiency program Phoenix: Securing sustainable competitiveness
Principles Scope Targets, status, and next steps
Competitive services 4
Business empowerment 1
Lean management holding 2
Divisional steering 3
1.2
Costs in scope of Phoenix
4.1
Total E.ON
5.3
Controllable cost1 baseline
€ bn
• Phoenix target: €400 m EBIT contribution p.a. from 2018 onwards
• About €300 m from central overhead & support functions
• Restructuring of pension plans & other measures deliver ~€100 m
• Status/ Next steps
• 100% of target measures identified
• First measures being implemented
• Negotiations with workers’ council in Q2 2017
8
1. Controllable Costs include operational costs that management can meaningfully influence, such as material expenses, consultancy and personnel expenses. Margin-effective components such as fuel costs as well as cost item that are largely uncontrollable by the management are not included.
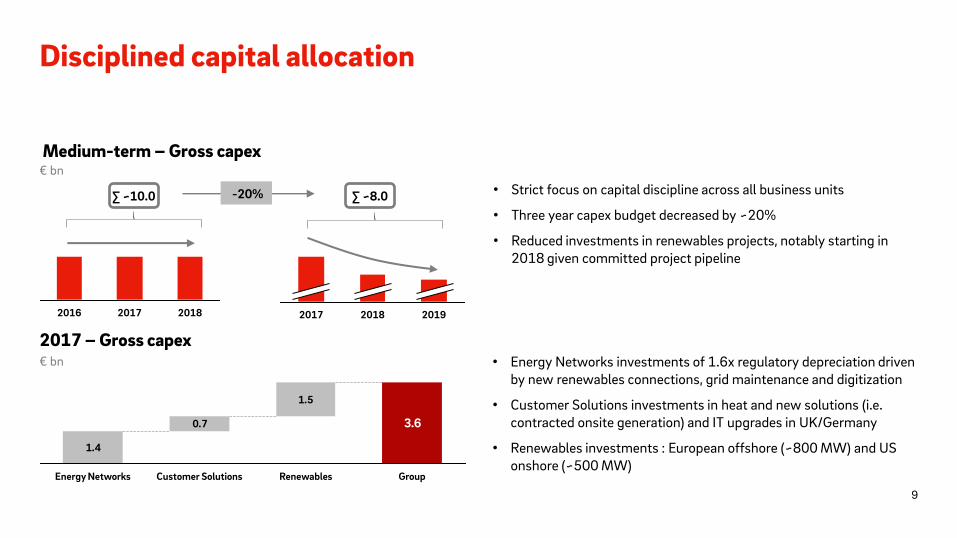
Disciplined capital allocation
Medium-term – Gross capex
• Strict focus on capital discipline across all business units
• Three year capex budget decreased by ~20%
• Reduced investments in renewables projects, notably starting in 2018 given committed project pipeline
2017 – Gross capex
2018 2017 2016
-20%
2019 2018 2017
1.4
0.7
1.5
3.6
Group Renewables Customer Solutions Energy Networks
€ bn
€ bn • Energy Networks investments of 1.6x regulatory depreciation driven by new renewables connections, grid maintenance and digitization
• Customer Solutions investments in heat and new solutions (i.e. contracted onsite generation) and IT upgrades in UK/Germany
• Renewables investments : European offshore (~800 MW) and US onshore (~500 MW)
∑ ~10.0 ∑ ~8.0
9
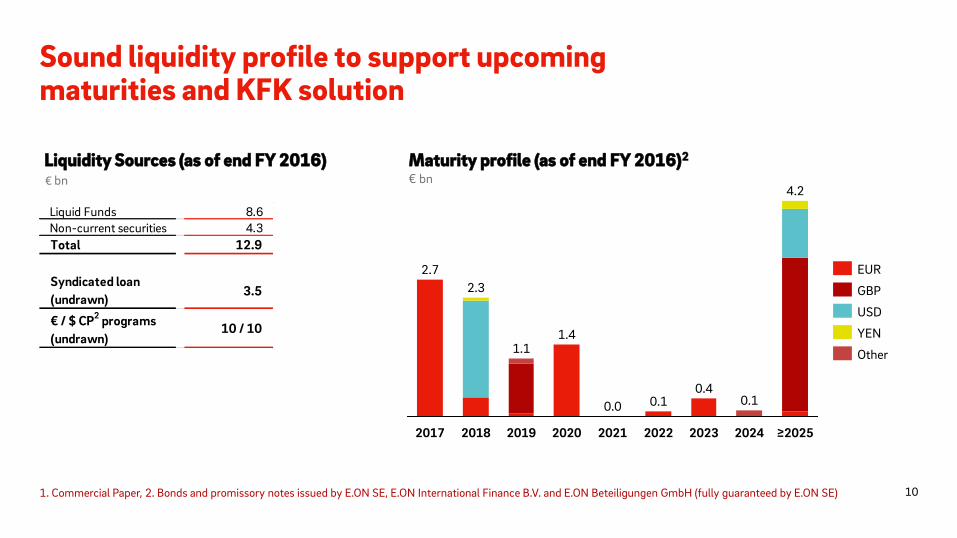
Sound liquidity profile to support upcoming maturities and KFK solution
Liquidity Sources (as of end FY 2016) Maturity profile (as of end FY 2016)2
€ bn
2022 2021
2.7
2020
2.3
2019
1.1
2018 2017
0.1 0.0
1.4
2024 2023
0.4
4.2
≥2025
0.1
€ bn
Other
YEN
USD
GBP
EUR
1. Commercial Paper, 2. Bonds and promissory notes issued by E.ON SE, E.ON International Finance B.V. and E.ON Beteiligungen GmbH (fully guaranteed by E.ON SE) 10
Liquid Funds 8.6
Non-current securities 4.3
Total 12.9
Syndicated loan
(undrawn)3.5
€ / $ CP2 programs
(undrawn) 10 / 10
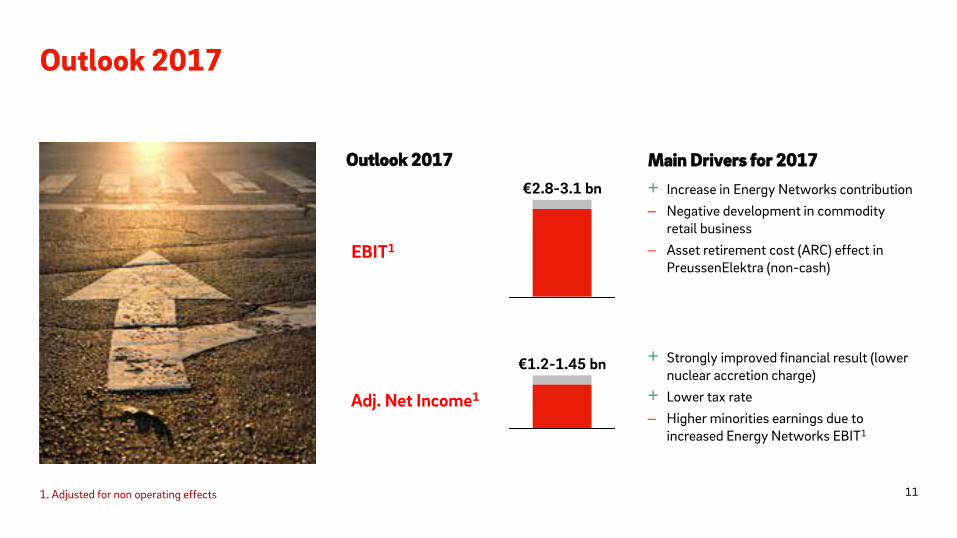
Outlook 2017
EBIT1
Adj. Net Income1
Outlook 2017
1. Adjusted for non operating effects
€2.8-3.1 bn
€1.2-1.45 bn
+ Increase in Energy Networks contribution
– Negative development in commodity retail business
– Asset retirement cost (ARC) effect in PreussenElektra (non-cash)
Main Drivers for 2017
+ Strongly improved financial result (lower nuclear accretion charge)
+ Lower tax rate
– Higher minorities earnings due to increased Energy Networks EBIT1
11
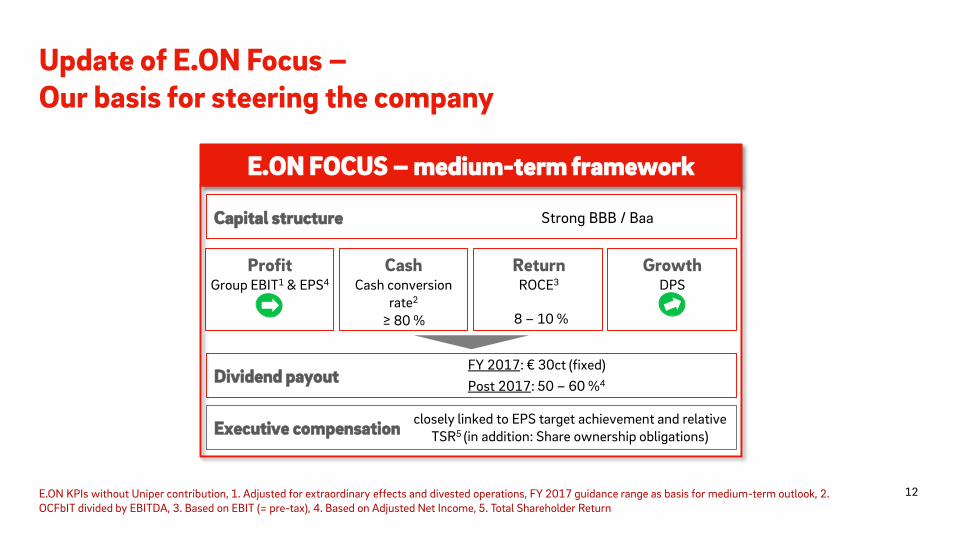
Executive compensation
Profit Group EBIT1 & EPS4
Cash Cash conversion
rate2 ≥ 80 %
Return ROCE3
8 – 10 %
Growth DPS
Capital structure Strong BBB / Baa
Dividend payout FY 2017: € 30ct (fixed)
Post 2017: 50 – 60 %4
E.ON FOCUS – medium-term framework
closely linked to EPS target achievement and relative TSR5 (in addition: Share ownership obligations)
Update of E.ON Focus – Our basis for steering the company
E.ON KPIs without Uniper contribution, 1. Adjusted for extraordinary effects and divested operations, FY 2017 guidance range as basis for medium-term outlook, 2. OCFbIT divided by EBITDA, 3. Based on EBIT (= pre-tax), 4. Based on Adjusted Net Income, 5. Total Shareholder Return
12
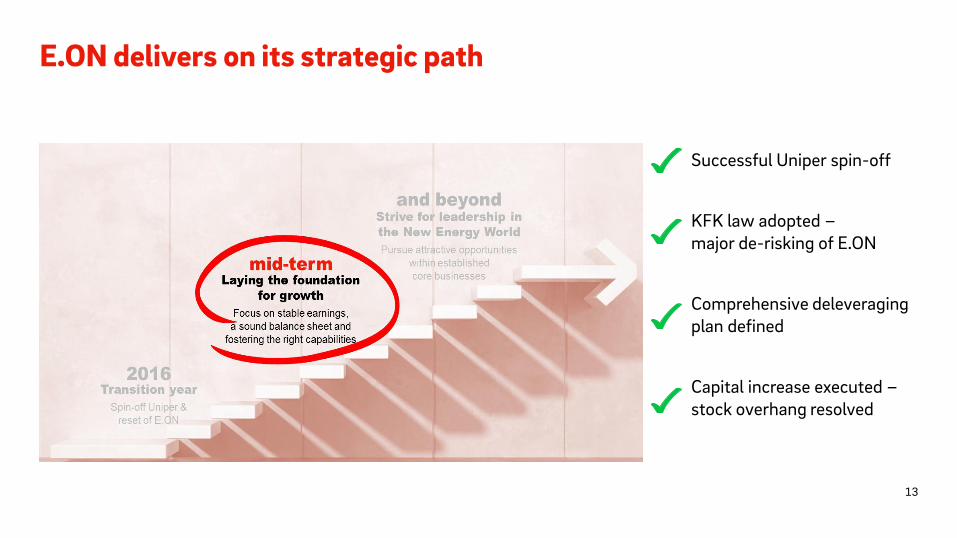
E.ON delivers on its strategic path
13
Successful Uniper spin-off
KFK law adopted – major de-risking of E.ON
Comprehensive deleveraging plan defined
Capital increase executed – stock overhang resolved

Appendix
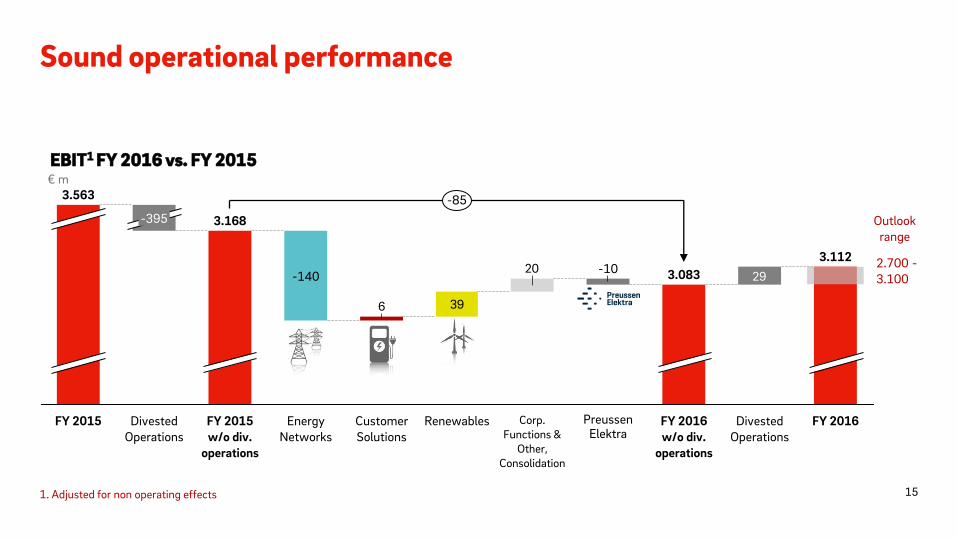
Sound operational performance
2920
396
-85
FY 2016 w/o div.
operations
Divested Operations
3.112
FY 2016
3.083
Preussen Elektra
-10
Corp. Functions &
Other, Consolidation
Renewables Customer Solutions
Energy Networks
-140
FY 2015 w/o div.
operations
3.168
Divested Operations
-395
FY 2015
3.563
EBIT1 FY 2016 vs. FY 2015 € m
1. Adjusted for non operating effects
2.700 -3.100
Outlook range
15

Adjusted Net Income and EPS up by ~10%
EPS (€ per share)
FY 2016 € m
0.46 904Adjusted
Net Income1
Minorities -278
Tax expense -478
Profit before Taxes1
1.660
Other interest expenses
-838
Interest on fin. assets/
liabilities2
-614
Group EBIT1 3.112
Improvement vs. previous year due to bond repayment in January
Slightly weaker than previous year; mainly driven by lower construction interest capitalization
Tax rate of 29% (FY 2015: 34%)
Slightly lower on YoY basis
Underlying net income (excl. divested operations) increased by ~10% YoY
1. Adjusted for non operating effects, 2. Without accretion of nuclear provisions 16
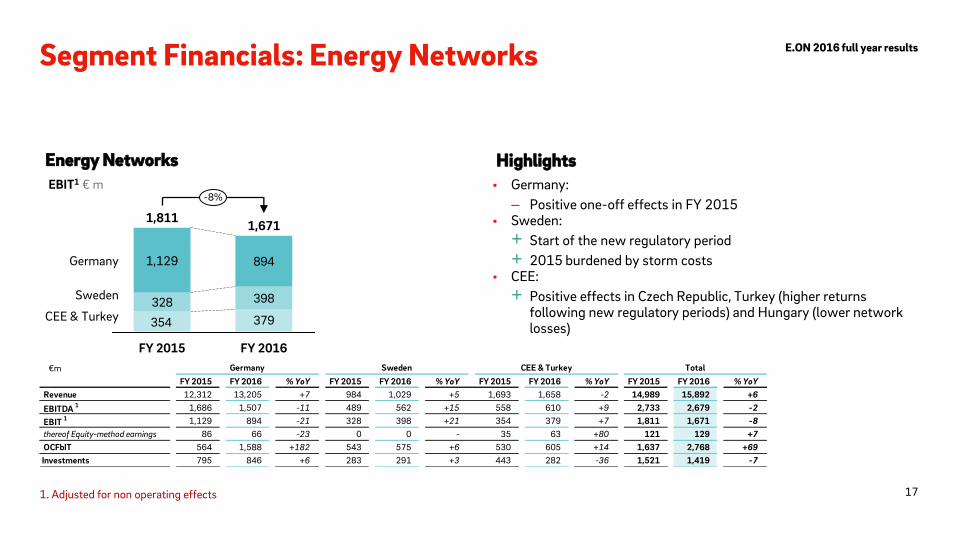
Segment Financials: Energy Networks
• Germany:
– Positive one-off effects in FY 2015 • Sweden:
+ Start of the new regulatory period
+ 2015 burdened by storm costs • CEE:
+ Positive effects in Czech Republic, Turkey (higher returns following new regulatory periods) and Hungary (lower network losses)
Energy Networks Highlights
328 398
379354
894
Sweden
CEE & Turkey
-8%
Germany
FY 2016
1,671
FY 2015
1,811
1,129
1. Adjusted for non operating effects
EBIT1 € m
€m
FY 2015 FY 2016 % YoY FY 2015 FY 2016 % YoY FY 2015 FY 2016 % YoY FY 2015 FY 2016 % YoY
Revenue 12,312 13,205 +7 984 1,029 +5 1,693 1,658 -2 14,989 15,892 +6
EBITDA 1 1,686 1,507 -11 489 562 +15 558 610 +9 2,733 2,679 -2
EBIT 1 1,129 894 -21 328 398 +21 354 379 +7 1,811 1,671 -8
thereof Equity-method earnings 86 66 -23 0 0 - 35 63 +80 121 129 +7
OCFbIT 564 1,588 +182 543 575 +6 530 605 +14 1,637 2,768 +69
Investments 795 846 +6 283 291 +3 443 282 -36 1,521 1,419 -7
TotalGermany Sweden CEE & Turkey
17
E.ON 2016 full year results
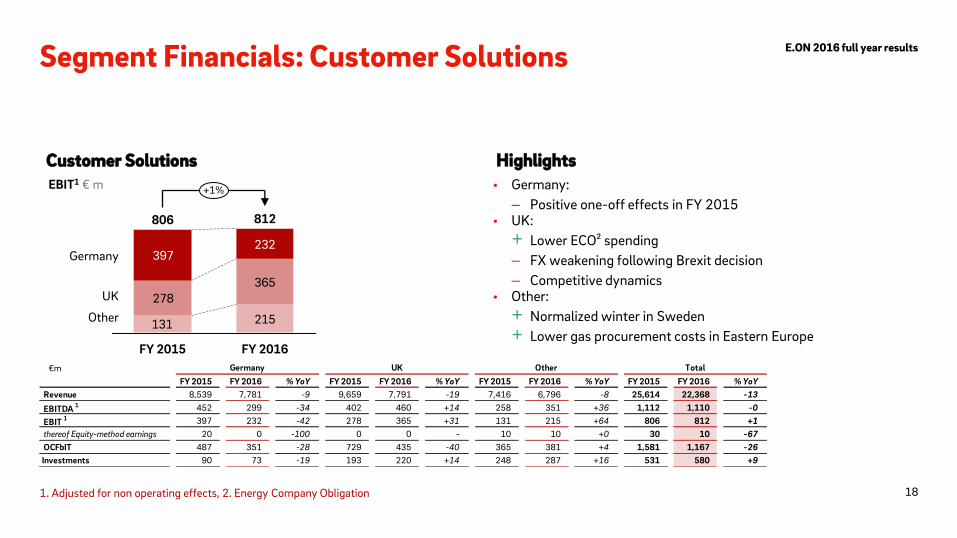
Segment Financials: Customer Solutions
Customer Solutions Highlights
• Germany:
– Positive one-off effects in FY 2015 • UK:
+ Lower ECO² spending
– FX weakening following Brexit decision
– Competitive dynamics • Other:
+ Normalized winter in Sweden
+ Lower gas procurement costs in Eastern Europe 215
278365
397232
131
+1%
Other
UK
Germany
FY 2016
812
FY 2015
806
EBIT1 € m
1. Adjusted for non operating effects, 2. Energy Company Obligation
€m
FY 2015 FY 2016 % YoY FY 2015 FY 2016 % YoY FY 2015 FY 2016 % YoY FY 2015 FY 2016 % YoY
Revenue 8,539 7,781 -9 9,659 7,791 -19 7,416 6,796 -8 25,614 22,368 -13
EBITDA 1 452 299 -34 402 460 +14 258 351 +36 1,112 1,110 -0
EBIT 1 397 232 -42 278 365 +31 131 215 +64 806 812 +1
thereof Equity-method earnings 20 0 -100 0 0 - 10 10 +0 30 10 -67
OCFbIT 487 351 -28 729 435 -40 365 381 +4 1,581 1,167 -26
Investments 90 73 -19 193 220 +14 248 287 +16 531 580 +9
TotalUKGermany Other
18
E.ON 2016 full year results

• Offshore:
+ Positive contribution from Humber & Amrumbank, book gain from Arkona stake sale (Q2 2016)
– Negative effects from lower wind yields & adverse FX development following Brexit decision
• Onshore:
– Positive one-off effects in FY 2015 (incl. book gains)
– Lower prices in FY 2016, phase-out of UK LEC scheme
Segment Financials: Renewables
Renewables Highlights
189
202338
92
+10%
Offshore/Other
Onshore/Solar
FY 2016
391 430
FY 2015
EBIT1 € m
1. Adjusted for non operating effects
€m
FY 2015 FY 2016 % YoY FY 2015 FY 2016 % YoY FY 2015 FY 2016 % YoY
Revenue 957 728 -24 524 629 +20 1,481 1,357 -8
EBITDA 1 422 308 -27 328 488 +49 750 796 +6
EBIT 1 189 92 -51 202 338 +67 391 430 +10
thereof Equity-method earnings 16 15 -6
OCFbit 563 699 +24
Investments 1,010 1,070 +6
Onshore Wind / Solar Offshore Wind / Others Total
19
E.ON 2016 full year results
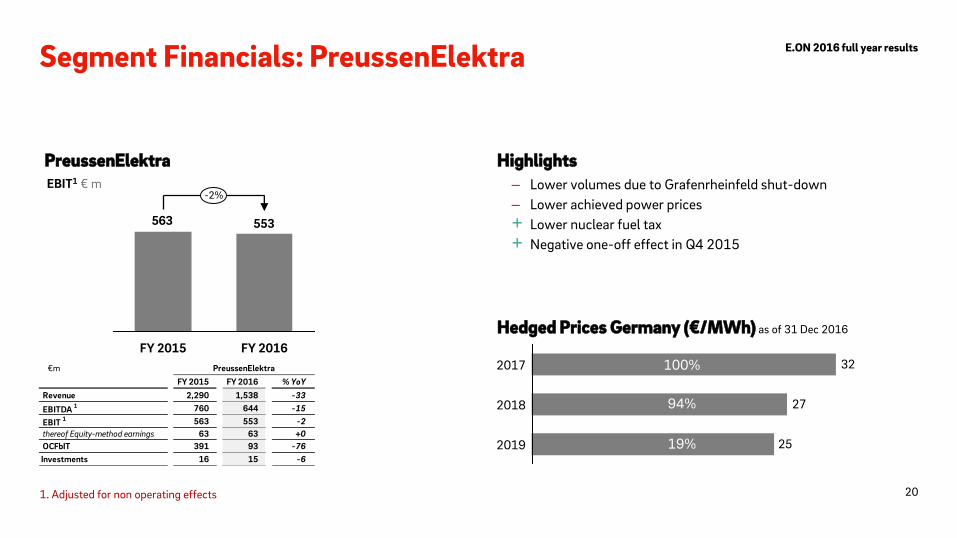
Segment Financials: PreussenElektra
PreussenElektra Highlights
553563
FY 2016
-2%
FY 2015
– Lower volumes due to Grafenrheinfeld shut-down
– Lower achieved power prices
+ Lower nuclear fuel tax
+ Negative one-off effect in Q4 2015
25
27
32
2019
2018
2017
Hedged Prices Germany (€/MWh) as of 31 Dec 2016
100%
94%
19%
EBIT1 € m
1. Adjusted for non operating effects
€m
FY 2015 FY 2016 % YoY
Revenue 2,290 1,538 -33
EBITDA 1 760 644 -15
EBIT 1 563 553 -2
thereof Equity-method earnings 63 63 +0
OCFbIT 391 93 -76
Investments 16 15 -6
PreussenElektra
20
E.ON 2016 full year results
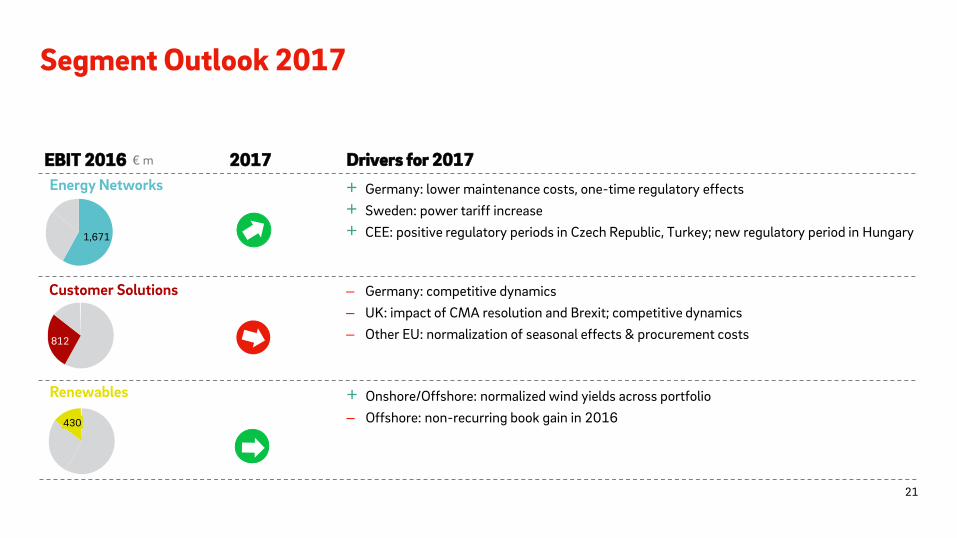
+ Germany: lower maintenance costs, one-time regulatory effects
+ Sweden: power tariff increase
+ CEE: positive regulatory periods in Czech Republic, Turkey; new regulatory period in Hungary
+ Onshore/Offshore: normalized wind yields across portfolio
– Offshore: non-recurring book gain in 2016
Segment Outlook 2017
EBIT 2016 Drivers for 2017
Renewables
Customer Solutions
2017
Energy Networks
1,671
812
430
– Germany: competitive dynamics
– UK: impact of CMA resolution and Brexit; competitive dynamics
– Other EU: normalization of seasonal effects & procurement costs
€ m
21
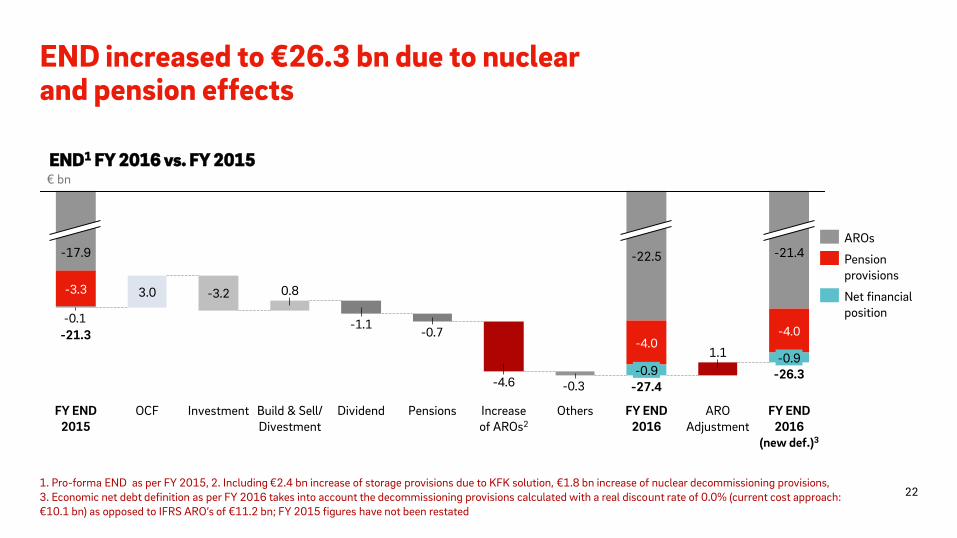
END increased to €26.3 bn due to nuclear and pension effects
-0.3-4.6
-0.7-1.1
-3.2
-4.0-4.0
-3.3
-0.1
ARO Adjustment
1.1
FY END 2016
-27.4 -0.9
-22.5
Others Investment
-17.9
0.8
-21.3
FY END 2015
Build & Sell/ Divestment
Dividend OCF Increase of AROs2
Pensions
3.0
FY END 2016
(new def.)3
-26.3 -0.9
-21.4
€ bn
END1 FY 2016 vs. FY 2015
1. Pro-forma END as per FY 2015, 2. Including €2.4 bn increase of storage provisions due to KFK solution, €1.8 bn increase of nuclear decommissioning provisions, 3. Economic net debt definition as per FY 2016 takes into account the decommissioning provisions calculated with a real discount rate of 0.0% (current cost approach: €10.1 bn) as opposed to IFRS ARO’s of €11.2 bn; FY 2015 figures have not been restated
Net financial position
Pension provisions
AROs
22
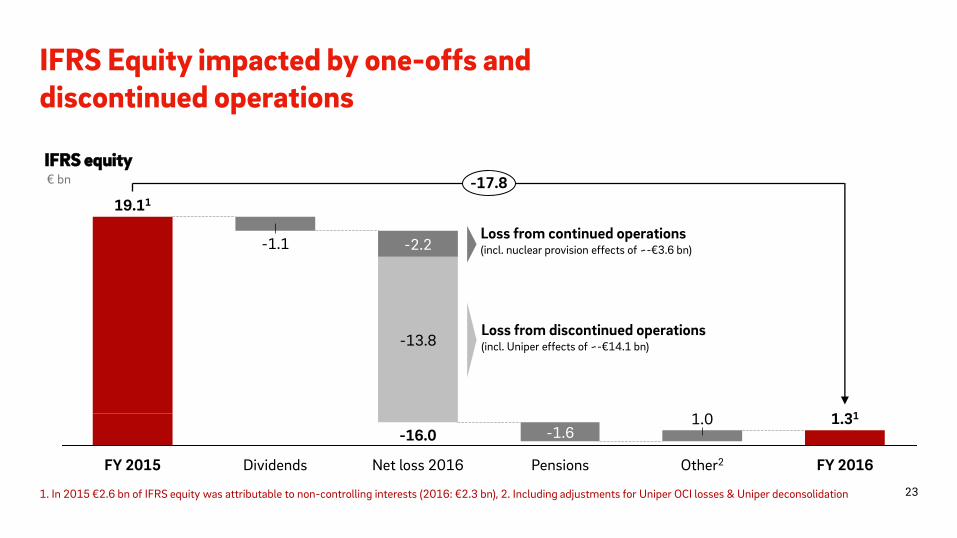
IFRS Equity impacted by one-offs and discontinued operations
1.0
Other2 Pensions
-1.6
Net loss 2016
-16.0
-13.8
-2.2
Dividends
-17.8
1.31
-1.1
FY 2015
19.11
FY 2016
IFRS equity € bn
Loss from continued operations (incl. nuclear provision effects of ~-€3.6 bn)
Loss from discontinued operations (incl. Uniper effects of ~-€14.1 bn)
1. In 2015 €2.6 bn of IFRS equity was attributable to non-controlling interests (2016: €2.3 bn), 2. Including adjustments for Uniper OCI losses & Uniper deconsolidation 23
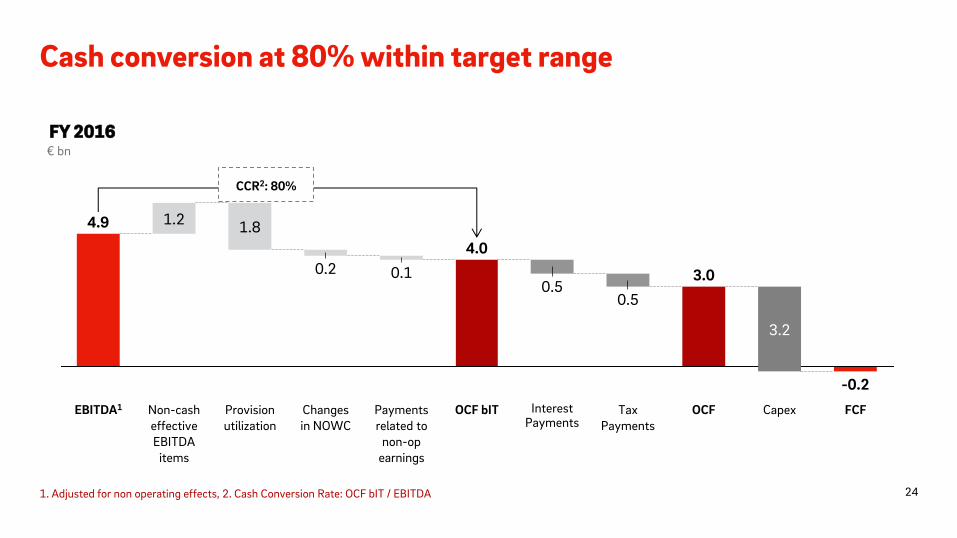
Cash conversion at 80% within target range
FY 2016 € bn
Capex
-0.2
FCF
3.2
OCF Interest Payments
0.5
OCF bIT
4.0
Payments related to
non-op earnings
0.1
Changes in NOWC
0.2
Provision utilization
1.8
Non-cash effective EBITDA
items
1.2
EBITDA1
0.5
Tax Payments
3.0
4.9
CCR2: 80%
1. Adjusted for non operating effects, 2. Cash Conversion Rate: OCF bIT / EBITDA 24
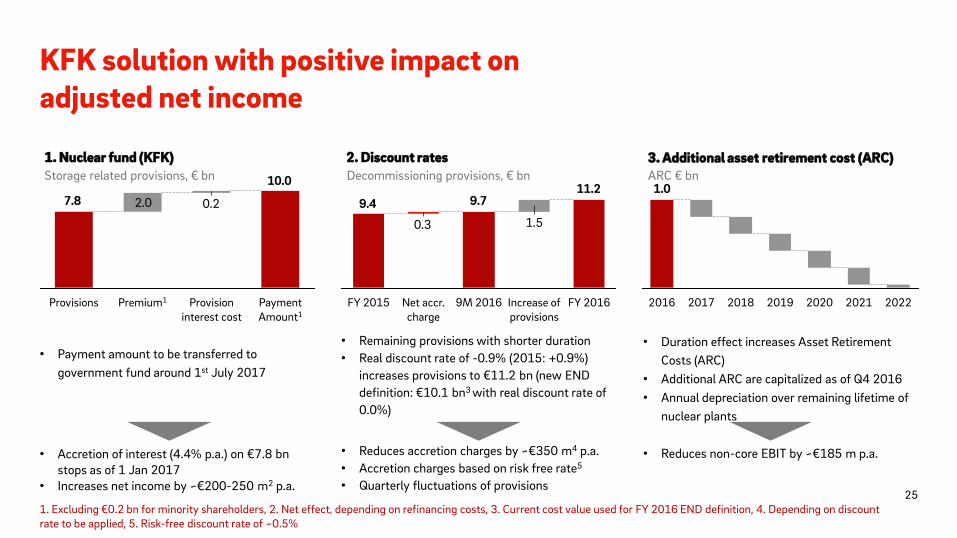
KFK solution with positive impact on adjusted net income
• Payment amount to be transferred to
government fund around 1st July 2017
• Accretion of interest (4.4% p.a.) on €7.8 bn stops as of 1 Jan 2017
• Increases net income by ~€200-250 m2 p.a.
1. Nuclear fund (KFK) 2. Discount rates 3. Additional asset retirement cost (ARC)
2.0 0.2
10.0
7.8
Payment Amount1
Provision interest cost
Premium1 Provisions
1. Excluding €0.2 bn for minority shareholders, 2. Net effect, depending on refinancing costs, 3. Current cost value used for FY 2016 END definition, 4. Depending on discount rate to be applied, 5. Risk-free discount rate of ~0.5%
11.29.79.4
1.50.3
FY 2016 Increase of provisions
9M 2016 Net accr. charge
FY 2015
Storage related provisions, € bn
• Remaining provisions with shorter duration
• Real discount rate of -0.9% (2015: +0.9%)
increases provisions to €11.2 bn (new END
definition: €10.1 bn3 with real discount rate of
0.0%)
• Reduces accretion charges by ~€350 m4 p.a.
• Accretion charges based on risk free rate5
• Quarterly fluctuations of provisions
1.0
2022 2021 2020 2019 2018 2017 2016
ARC € bn
• Duration effect increases Asset Retirement
Costs (ARC)
• Additional ARC are capitalized as of Q4 2016
• Annual depreciation over remaining lifetime of
nuclear plants
• Reduces non-core EBIT by ~€185 m p.a.
Decommissioning provisions, € bn
25
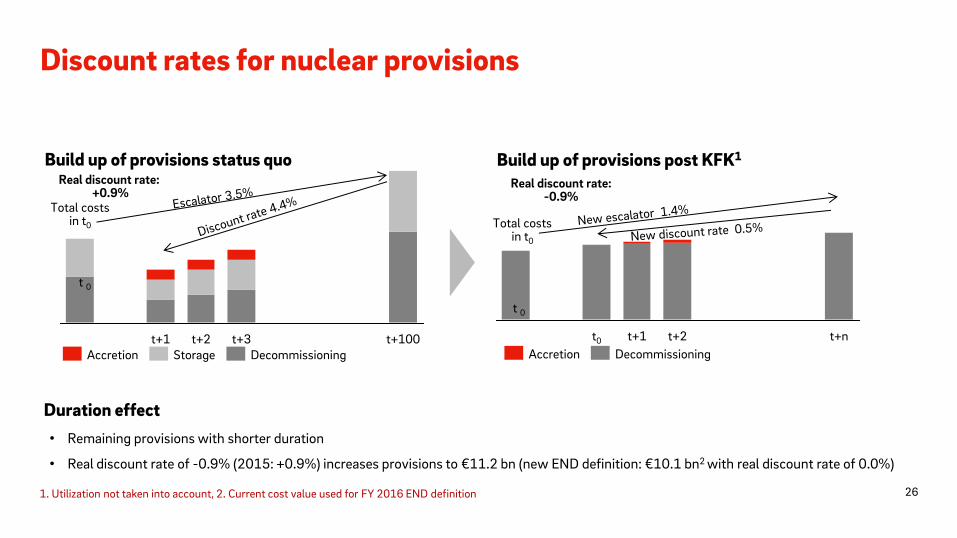
Discount rates for nuclear provisions
Build up of provisions status quo
t+3 t+100 t+2 t+1 Storage Accretion Decommissioning
Real discount rate: +0.9%
Build up of provisions post KFK1
t+2 t+1 t+n t0
Accretion Decommissioning
Real discount rate: -0.9%
• Remaining provisions with shorter duration
• Real discount rate of -0.9% (2015: +0.9%) increases provisions to €11.2 bn (new END definition: €10.1 bn2 with real discount rate of 0.0%)
Duration effect
Total costs in t0 Total costs
in t0
t 0
t 0
26 1. Utilization not taken into account, 2. Current cost value used for FY 2016 END definition
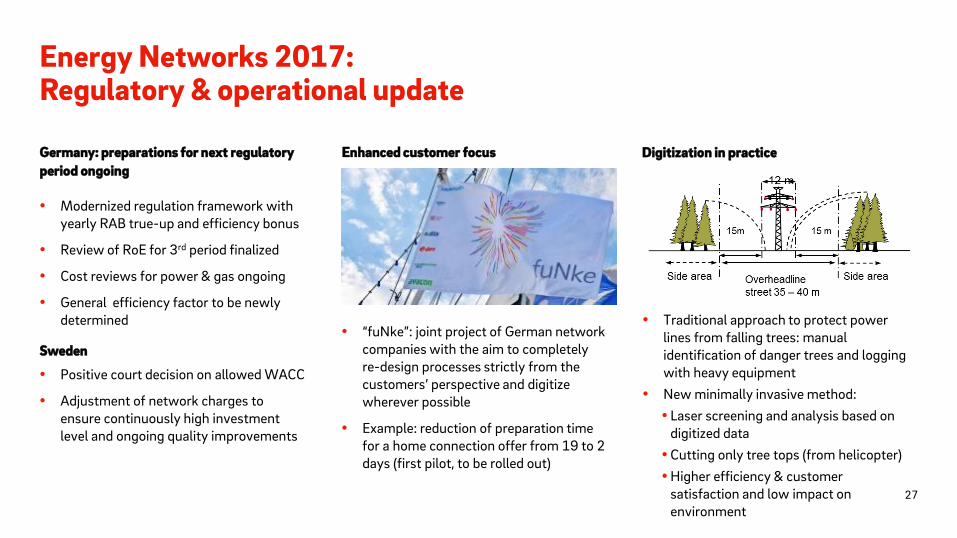
Digitization in practice
Energy Networks 2017: Regulatory & operational update
Germany: preparations for next regulatory
period ongoing
Enhanced customer focus
Modernized regulation framework with yearly RAB true-up and efficiency bonus
Review of RoE for 3rd period finalized
Cost reviews for power & gas ongoing
General efficiency factor to be newly determined
“fuNke”: joint project of German network companies with the aim to completely re-design processes strictly from the customers’ perspective and digitize wherever possible
Example: reduction of preparation time for a home connection offer from 19 to 2 days (first pilot, to be rolled out)
Traditional approach to protect power lines from falling trees: manual identification of danger trees and logging with heavy equipment
New minimally invasive method:
Laser screening and analysis based on digitized data
Cutting only tree tops (from helicopter)
Higher efficiency & customer satisfaction and low impact on environment
27
Sweden
Positive court decision on allowed WACC
Adjustment of network charges to ensure continuously high investment level and ongoing quality improvements
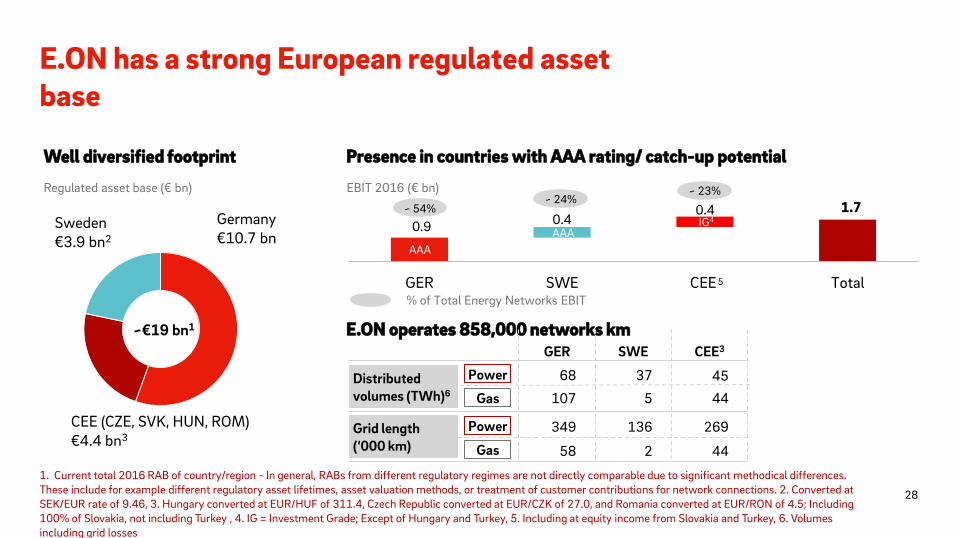
E.ON has a strong European regulated asset base
0.9 0.4 0.4
GER SWE CEE Total
IG4
E.ON operates 858,000 networks km
Presence in countries with AAA rating/ catch-up potential
CEE (CZE, SVK, HUN, ROM)
€4.4 bn3
Sweden €3.9 bn2
Germany €10.7 bn
~€19 bn1
EBIT 2016 (€ bn)
1.7 ~ 54% ~ 24%
~ 23%
% of Total Energy Networks EBIT
AAA
Well diversified footprint
5
Regulated asset base (€ bn)
68
107
349
58
Power
Gas
Power
Gas
37
5
136
2
269
44
45
44
GER SWE
Distributed volumes (TWh)6
Grid length (‘000 km)
CEE3
1. Current total 2016 RAB of country/region - In general, RABs from different regulatory regimes are not directly comparable due to significant methodical differences. These include for example different regulatory asset lifetimes, asset valuation methods, or treatment of customer contributions for network connections. 2. Converted at SEK/EUR rate of 9.46, 3. Hungary converted at EUR/HUF of 311.4, Czech Republic converted at EUR/CZK of 27.0, and Romania converted at EUR/RON of 4.5; Including 100% of Slovakia, not including Turkey , 4. IG = Investment Grade; Except of Hungary and Turkey, 5. Including at equity income from Slovakia and Turkey, 6. Volumes including grid losses
28
AAA
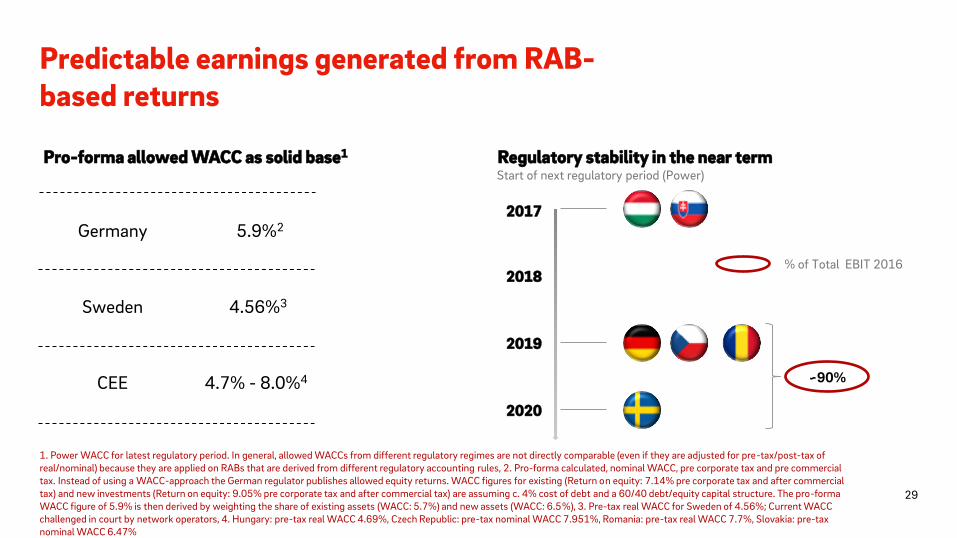
Predictable earnings generated from RAB-based returns
Start of next regulatory period (Power)
2017
2019
2018
2020
Germany 5.9%2
Sweden 4.56%3
CEE 4.7% - 8.0%4
% of Total EBIT 2016
Pro-forma allowed WACC as solid base1 Regulatory stability in the near term
~90%
1. Power WACC for latest regulatory period. In general, allowed WACCs from different regulatory regimes are not directly comparable (even if they are adjusted for pre-tax/post-tax of real/nominal) because they are applied on RABs that are derived from different regulatory accounting rules, 2. Pro-forma calculated, nominal WACC, pre corporate tax and pre commercial tax. Instead of using a WACC-approach the German regulator publishes allowed equity returns. WACC figures for existing (Return on equity: 7.14% pre corporate tax and after commercial tax) and new investments (Return on equity: 9.05% pre corporate tax and after commercial tax) are assuming c. 4% cost of debt and a 60/40 debt/equity capital structure. The pro-forma WACC figure of 5.9% is then derived by weighting the share of existing assets (WACC: 5.7%) and new assets (WACC: 6.5%), 3. Pre-tax real WACC for Sweden of 4.56%; Current WACC challenged in court by network operators, 4. Hungary: pre-tax real WACC 4.69%, Czech Republic: pre-tax nominal WACC 7.951%, Romania: pre-tax real WACC 7.7%, Slovakia: pre-tax nominal WACC 6.47%
29
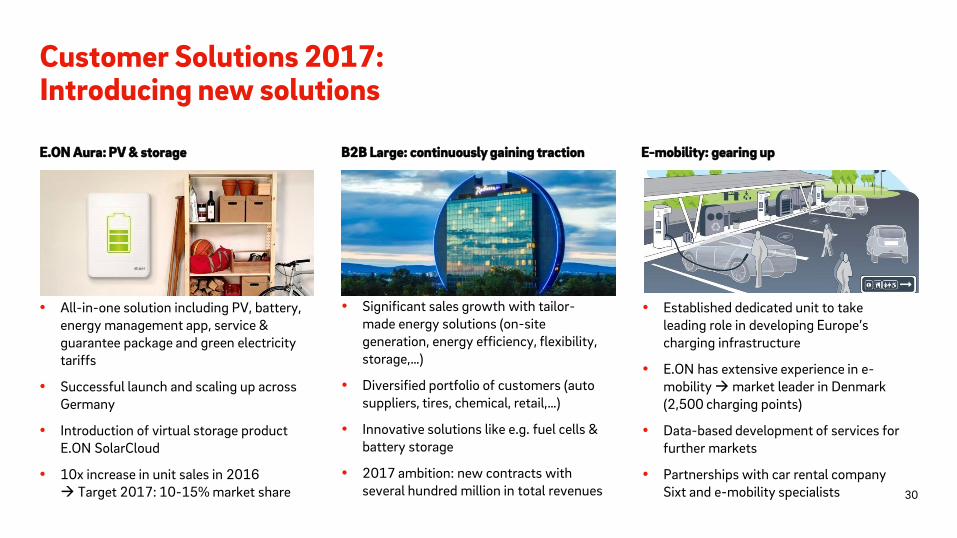
Customer Solutions 2017: Introducing new solutions
E.ON Aura: PV & storage B2B Large: continuously gaining traction
All-in-one solution including PV, battery, energy management app, service & guarantee package and green electricity tariffs
Successful launch and scaling up across Germany
Introduction of virtual storage product E.ON SolarCloud
10x increase in unit sales in 2016 Target 2017: 10-15% market share
E-mobility: gearing up
Significant sales growth with tailor-made energy solutions (on-site generation, energy efficiency, flexibility, storage,…)
Diversified portfolio of customers (auto suppliers, tires, chemical, retail,…)
Innovative solutions like e.g. fuel cells & battery storage
2017 ambition: new contracts with several hundred million in total revenues
Established dedicated unit to take leading role in developing Europe’s charging infrastructure
E.ON has extensive experience in e-mobility market leader in Denmark (2,500 charging points)
Data-based development of services for further markets
Partnerships with car rental company Sixt and e-mobility specialists 30
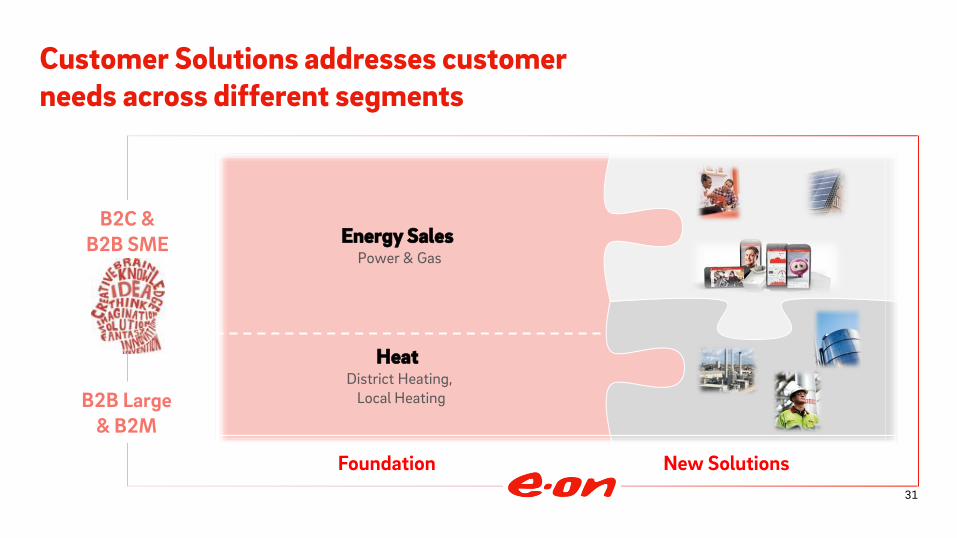
Customer Solutions addresses customer needs across different segments
Energy Sales Power & Gas
Heat District Heating,
Local Heating
Foundation New Solutions
B2B Large & B2M
B2C & B2B SME
31
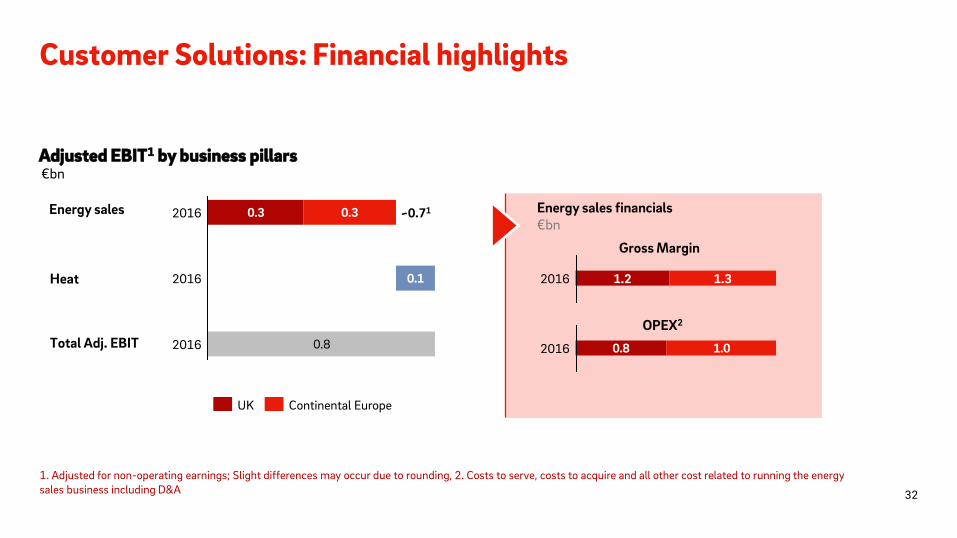
Customer Solutions: Financial highlights
Energy sales
Adjusted EBIT1 by business pillars
Heat
0.3
0.8
0.3
0.1
2016
2016
2016 ~0.71
Total Adj. EBIT
Energy sales financials
1.2 1.3 2016
Gross Margin
0.8 1.02016
OPEX2
Continental Europe UK
€bn
€bn
1. Adjusted for non-operating earnings; Slight differences may occur due to rounding, 2. Costs to serve, costs to acquire and all other cost related to running the energy sales business including D&A 32

Renewables 2017: Build-out fully on track
Rampion (400 MW in UK)
Installations of 116 mono-pile foundations completed
On time and within budget for completion in 2018
Arkona (385 MW in Germany)
Installation of 60 wind turbine foundations planned for 2017
Expected to be fully operational in 2019
US Onshore
US Storage
Radford’s Run (278 MW in Illinois)
Bruenning’s Breeze (228 MW in Texas)
Both farms scheduled to be in commercial operation in December 2017
E.ON actively developing projects in fast-growing energy storage market
Iron Horse (10 MW/2.5 MWh): first grid-scale project to support grid stability in Arizona (planned COD in H1 2017)
Texas Wave: two further projects (10 MW/5 MWh) in Texas on track to be completed in late 2017
Europe Offshore
Repowering projects started in Germany & UK
Won 57 MW auction in Italy with 20 years tariff of €66/ MWh
Europe Onshore
33
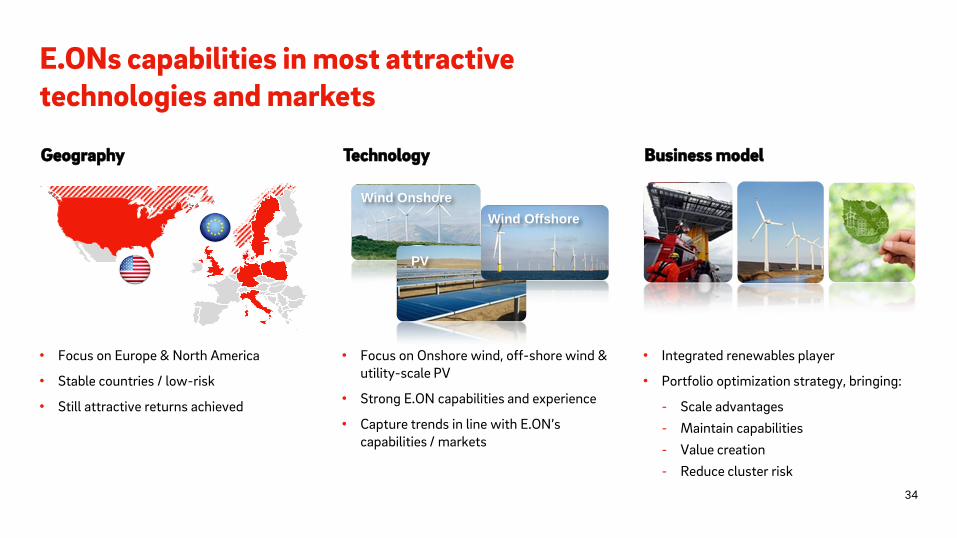
E.ONs capabilities in most attractive technologies and markets
Technology Geography Business model
• Focus on Onshore wind, off-shore wind & utility-scale PV
• Strong E.ON capabilities and experience
• Capture trends in line with E.ON’s capabilities / markets
Wind Onshore
PV
Wind Offshore
• Focus on Europe & North America
• Stable countries / low-risk
• Still attractive returns achieved
• Integrated renewables player
• Portfolio optimization strategy, bringing:
- Scale advantages
- Maintain capabilities
- Value creation
- Reduce cluster risk
1
34
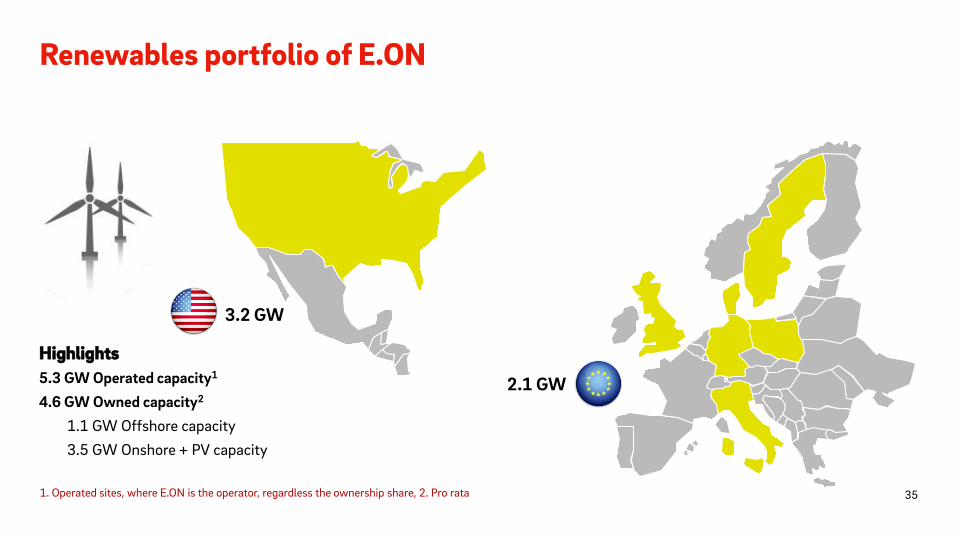
Highlights
5.3 GW Operated capacity1
4.6 GW Owned capacity2
1.1 GW Offshore capacity
3.5 GW Onshore + PV capacity
Renewables portfolio of E.ON
1. Operated sites, where E.ON is the operator, regardless the ownership share, 2. Pro rata
2.1 GW
3.2 GW
35
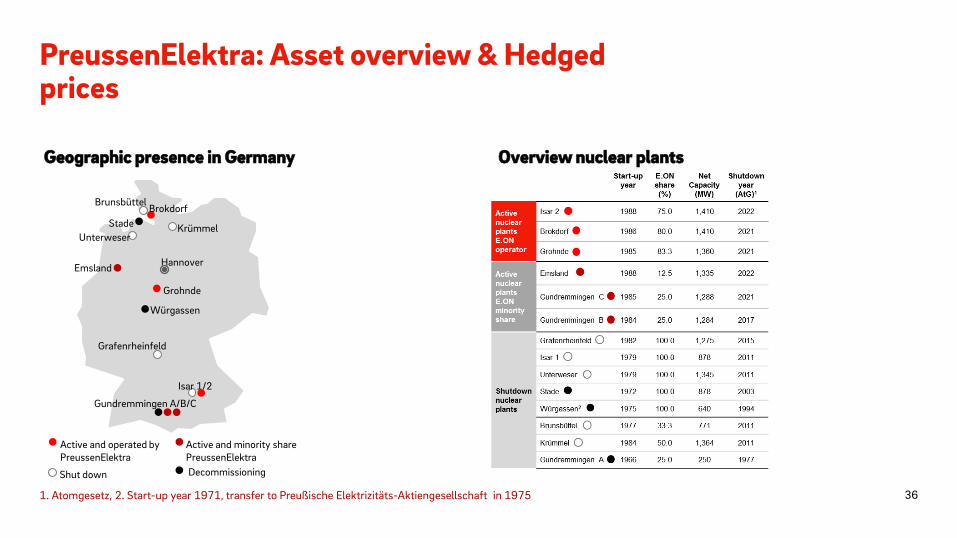
PreussenElektra: Asset overview & Hedged prices
36
Decommissioning Shut down
Active and operated by PreussenElektra
Active and minority share PreussenElektra
Brunsbüttel Brokdorf
Stade
Unterweser Krümmel
Hannover Emsland
Grohnde
Würgassen
Grafenrheinfeld
Isar 1/2
Gundremmingen A/B/C
Geographic presence in Germany Overview nuclear plants
1. Atomgesetz, 2. Start-up year 1971, transfer to Preußische Elektrizitäts-Aktiengesellschaft in 1975 36

Stringent incentive plan for the Management Board
KPI
Relative TSR1
EPS & individual performance
Cap
200% of target value
200% of target value
Calculation
TSR development relative to STOXX Europe 600 Utilities over 4 years
EPS × individual performance multiplier
Long-Term Incentive
Short-Term Incentive
Share Ownership Guidelines
Board members obliged to acquire E.ON shares equaling 150 – 200% of annual base salary
1. Total Shareholder Return 37

Martina Burger T +49 (201) 184 28 07
Manager Investor Relations [email protected]
Conny Ripphahn T +49 (201) 184 28 34
Manager Investor Relations [email protected]
E.ON Investor Relations contacts
T +49 (201) 184 2806 [email protected]
Dr. Stephan Schönefuß T +49 (201) 184 28 22
Manager Investor Relations [email protected]
Alexander Karnick T+49 (201) 184 28 38
Vice President Investor Relations [email protected]
Florian Floßmann T+49 (201) 184 28 33
Head of Investor Relations [email protected]
38
Rouven Fleischer T +49 (201) 184 72 30
Debt Investor Relations [email protected]

Financial calendar & important links
Financial calendar
May 9, 2017 Interim Report I: January – March 2017
May 10, 2017 2017 Annual Shareholders Meeting
August 9, 2017 Interim Report II: January – June 2017
November 8, 2017 Interim Report III: January – September 2017
March 14, 2018 Annual Report 2017
Important links
Presentations http://www.eon.com/en/investors/presentations.html
Annual Reports http://www.eon.com/en/investors/financial-publications/annual-report.html
Interim Reports http://www.eon.com/en/investors/financial-publications/interim-report.html
Shareholders Meeting http://www.eon.com/en/investors/shareholders-meeting.html
Creditor Relations http://www.eon.com/en/investors/presentations/bonds.html
39