Environmentally friendly hybrid coatings for corrosion...
259
Doctoral School in Materials Engineering – XXII cycle Environmentally friendly hybrid coatings for corrosion protection: silane based pre-treatments and nanostructured waterborne coatings Michele Fedel January 2010
Transcript of Environmentally friendly hybrid coatings for corrosion...
Doctoral School in Materials Engineering – XXII cycle
EEnnvviirroonnmmeennttaallllyy ffrriieennddllyy hhyybbrriidd ccooaattiinnggss ffoorr
ccoorrrroossiioonn pprrootteeccttiioonn:: ssiillaannee bbaasseedd pprree--ttrreeaattmmeennttss
aanndd nnaannoossttrruuccttuurreedd wwaatteerrbboorrnnee ccooaattiinnggss
MMiicchheellee FFeeddeell
January 2010

Book cover: Mikolas Ales (1852-1913), illustration for “Old Czech Tales”, ink and pen, 1899

“Objectivity cannot be equated with mental blankness; rather, objectivity resides in recognizing your preferences and then subjecting them to especially harsh scrutiny - and also in a willingness to revise or abandon your theories when the tests fail (as they usually do).” Stephen Jay Gould "Capturing the Center" Natural History 107 (1998) 18

Abstract
This thesis considers a nanotechnology approach based on the production of
metals pre-treatments and organic coatings (a complete protection system at all)
designed from the nanoscale. The final aim is to develop protection systems
with improved corrosion protection properties and a low environmental
impact. In particular, multifunctional silane hybrid molecules were used to
design sol-gel pre-treatments for metals and to modify the inner structure of
UV curable waterborne organic coatings. In the first part of this thesis thin
(hundreds of nanometers) sol-gel films consisting of an experimental mixture of
hybrid silicon alkoxides molecules were applied onto aluminium and hot dip
galvanized (HDG) steel for the development of effective and environmentally
friendly corrosion protection systems A chemical and electrochemical
characterization of the sol-gel films highlighted their good corrosion protection
properties both for aluminium and HDG steel. To test the effectiveness of the
sol-gel coatings as coupling agent between metallic substrates and organic
coatings (paints) both a powder coating paint and a cataphoretic coating paint
were applied on the silane pre-treated substrates. The electrochemical
measurements and the accelerated tests carried out on these protection systems
proved the capability of these sol-gel conversion coatings to improve the
corrosion protection properties of the traditional protective cycles. The
performance of the silane pre-treatments was also compared to commonly used
surface conversion coatings for metals. The result of this comparison evidenced
that the corrosion protection properties ensured by the sol-gel conversion
treatment is comparable or higher than most of the commonly used pre-
treatments.
A study about the incorporation of inorganic nanoparticles into these sol-gel
films gave evidences of an improved corrosion resistance due to the addition of
certain amount of montmorillonite nanoparticles in the sol-gel matrix. The
same hybrid silicon alkoxide molecules used to perform the pre-treatments
were used modify the inner structure of UV curable waterborne coatings in
order to improve the corrosion protection properties maintaining the
environmental compatibility of the protecting system. The design, application
and characterisation of urethane, acrylic and epoxy waterborne UV curing
coatings modified with the hybrid silicon molecules in order to obtain nano-
structured waterborne films with improved corrosion resistance and thermo-
mechanical properties were studied. The characterization proved the great
potential of the silicon alkoxide molecules as a tool to modify the properties of
the organic matrix of the paint: silicon alkoxides can promote the self assembly
of inorganic nanoparticles into the matrix or can act as an effective coupling
agent between inorganic nanoparticles and the polymeric matrix. Silicon
alkoxide molecules were proved to be an efficient tool to design a protection
system from the nanoscale leading to the prospective of an accurate control of
the overall properties of the macroscopic systems.
Acknowledgments
I would like to express my gratitude to my supervisors, Flavio Deflorian and Stefano Rossi, for their scientific guidance and support during my Ph.D. studies. I gratefully acknowledge Prof. M. Olivier (Université de Mons, Belgium), Dr. M. Poelmann (Materia Nova, Belgium) and all their co-workers, for the very interesting collaboration, the useful comments and suggestions and for the great time I spent in Mons. I would also acknowledge Prof. R. Bongiovanni (Polytechnic of Turin, Italy), Prof. S. Turri (Polytechnic of Milan, Italy) and all their co-workers for the work carried out on the PRIN project. Many thanks to Dr. L. Maines and Prof. S. Gialanella (University of Trento, Italy) for the TEM images and Dr. I. Lonardelli (University of Trento, Italy) for the assistance in the analysis and interpretation of the electron diffraction patterns. I would also acknowledge A. Pipers for the work performed on the sol-gel pre-treatments. Thanks to L. Benedetti (University of Trento, Italy) for the support for the setup of the experimental analysis. I would also like to thank Dr. Peter Kamarchik (PPG, USA) for the useful and constructive discussions about organic coatings. Thanks to ArcelorMittal (Belgium) for supplying galvanized steel, PPG Industries (France) for supplying the electrocoating bath and Pintarelli s.r.l (Italy) for the powder coating application.

Contents Preface ................................................................................................................................... I Introduction ....................................................................................................................... III 1 Preliminary remarks ......................................................................................................1
1.1 On some environmental concerns about corrosion protection through organic coatings.............................................................................................................................1 1.2 Hybrid silane sol-gel coatings ................................................................................7 1.3 UV curable waterborne coatings..........................................................................16
2 Silane sol-gel pre-treatments.......................................................................................21
2.1 Synthesis and application of silane sol-gel films .................................................22 2.1.1 Silanes mixture: properties & preparation....................................................22 2.1.2 Pre-treatment of the substrates.....................................................................27 2.1.3 Application and curing of the sol-gel films ..................................................28
2.2 Silane sol-gel films as pre-treatment for aluminium...........................................31 2.2.1 Materials and experimental procedure .........................................................33 2.2.2 Experimental results and discussion .............................................................34 2.2.3 Comments ......................................................................................................49
2.3 Development of silane sol-gel films for duplex systems .....................................50 2.3.1 Materials and experimental procedure .........................................................52 2.3.2 Experimental results and discussion .............................................................54
2.4 Silane sol-gel films containing montmorillonite nanoparticles........................113 2.4.1 Materials and experimental procedure .......................................................116 2.4.2 Experimental results and discussion ...........................................................117
2.5 Final comments...................................................................................................151 3 Ultra violet cured nanocomposite coatings ..............................................................153
3.1 Urethane acrylic coatings ...................................................................................155 3.1.1 Preparation of the UV curable urethane acrylic coatings..........................156 3.1.2 Characterization of the UV curable urethane acrylic coatings .................161
3.2 Modified urethane acrylic coatings....................................................................174 3.2.1 Preparation of the modified UV curable urethane acrylic coatings..........175 3.2.2 Characterization of the modified UV curable urethane acrylic coatings..178
3.3 UV-cured nanostructured epoxy coatings containing modified montmorillonite nanoparticles ................................................................................................................194
3.3.1 Preparation of the UV curable epoxy coatings containing modified montmorillonite nanoparticles ..............................................................................198 3.3.2 Characterization of the UV curable epoxy coatings containing modified montmorillonite nanoparticles ..............................................................................203
3.4 Final comments...................................................................................................224 4 Conclusions and Future Works.................................................................................229 References .........................................................................................................................233
Preface
I
Preface
This work summarizes the experimental research activity performed during my
Ph.D. studies in Materials Engineering. Chapter 1 is a bibliographic research
work devoted to the analysis of the environmental concerns related to
traditional solutions for corrosion protection and to the explanation of some
basic theoretical concepts useful to appreciate the experimental sections,
Chapters 2 and 3. Chapter 2 is devoted to the analysis of the potential of
experimental mixtures of hybrid silicon alkoxides molecules as sol-gel pre-
treatments for the development of ecological protection systems. An extension
of this work has been published in [a]. Part of the work presented in Chapter 2
was performed in collaboration with the University of Mons (Belgium), and it
has been object of publication in [b]. This collaboration led to other
publications, which will appear in [c] and [d]. Chapter 3 introduces a
contribution to the development of hybrid silane molecules modified UV
curable water-borne coatings carried out in collaboration with the Polytechnic
of Milan (Italy) and the Polytechnic of Turin (Italy) as a part of a project
founded by the Italian Ministry of Research (PRIN 2005 no. 2005099532). An
extension of this work has been published in [e] and [f].
Preface
II
[a] F. Deflorian, S. Rossi, M. Fedel, Corrosion Engineering, Science and Technology (2009) In press.
[b] M. Fedel, M. Olivier, M. Poelman, F. Deflorian, S. Rossi, M.-E. Druart, Prog. Org. Coat., 66 (2009) 118
[c] M.Fedel, M.-E. Druart, M. Olivier, M. Poelman, F. Deflorian, S. Rossi, Prog. Org. Coat., Submitted (2009)
[d] F. Deflorian, S. Rossi, M. Fedel, C. Motte, Prog. Org. Coat., Submitted (2009) [e] F. Deflorian, M. Fedel, A. Di Gianni, R. Bongiovanni, S. Turri, Corrosion
Engineering, Science and Technology, 43 (2008) 81 [f] G. Malucelli, A. Di Gianni, F. Deflorian, M. Fedel, R. Bongiovanni, Corros.
Sci., 51 (2009) 1762
Introduction
III
Introduction
Corrosion protection of metallic manufactures through improved
environmentally friendly surface treatment and organic coatings are becoming
more and more critical needs. In fact, in the last few years, the restrictions on
the use of traditional pre-treatments and organic coating for corrosion
protection have been strictly limited due to both human health and
environmental concerns. The thresholds values for the dangerous and
hazardous substances involved in the production and application of some of the
most common pre-treatments and organic coatings of proved corrosion
protection efficiency are becoming more and more stringent year by year. The
need of alternatives to conventional protection systems promoted a huge
number of studies and investigations aiming at the development of innovative
and effective solutions with low environmental impact. In this sense,
nanotechnology attracted considerable interest. The likelihood to design a
protection system from the nanoscale leads to the prospective of an accurate
control of the overall macroscopic properties. This potential aroused great
interest, especially in the last decades, and lot of work was done to develop
commercial available metal pre-treatments and organic coatings based on a
nanotechnology approach. In this context, this thesis considers a
nanotechnology approach based on the production of metals pre-treatments and
Introduction
IV
organic coatings (a complete protection system at all) designed from the
nanoscale. By means of multifunctional silane hybrid molecules it is possible to
design the final properties of pre-treatments and organic coatings.
In particular, the hybrid silicon alkoxides molecules technology was chosen for
the development of effective and environmentally friendly protection systems
against corrosion. In other words, in this work the potential of hybrid silicon
base molecules as multifunctional materials to produce efficient pre-treatments
and organic coatings to protect metals against corrosion was investigated. In
particular, the development of hybrid silane sol-gel pre-treatments containing
nanoparticles and UV cured water-bone coatings conveniently modified with
hybrid silicon molecules and nanoparticles will be discussed in this thesis. The
hybrid molecules consist of hybrid silicon alkoxides and organically modified
hybrid silicon alkoxides molecules while the above mentioned nanoparticles
consist of montmorillonite nanoparticles.
The final aim is to develop protection system with improved corrosion
protection properties and a low environmental impact. In this framework, this
thesis is a contribution to the efforts of other many research groups for the
replacement of traditional approaches to corrosion protection by creating new
materials and new processing solutions.
Chapter 1 Preliminary remarks
1
1 Preliminary remarks
In this chapter same environmental issues dealing with traditional and
innovative solution for metal pre-treatments and corrosion protection by means
of organic coatings are discussed. In particular, the most relevant aspects of the
application of silanes based sol-gel coating onto metal substrates and the
radiation curing of waterborne organic coatings are briefly discussed. To
complete the theoretical remarks, the chemistry of the hybrid alkoxysilane
molecules as well as the photochemistry of the UV photo-initiators are
thoroughly analysed.
1.1 On some environmental concerns about corrosion
protection through organic coatings
Commonly, metals surfaces are pre-treated prior the application of an organic
coating: thus, the overall properties of the complete protection system improve
remarkably [1]. For many decades, chromium conversion treatments involving
the use of chromic acid containing Cr6+ species have been used for their
corrosion protection and adhesion promotion performances [2]. Their success
Chapter 1 Preliminary remarks
2
was due to the formation of a few decades of nanometers of complex mixture of
chromium compounds as a consequence of Cr6+ reduction, to the reduction of
either water, hydrogen ion or dissolved oxygen to form hydroxyl ions at the
metal surface and to the presence of oxidising Cr6+ species, responsible of the
self-healing potential in presence of defects [3]. Moreover, the chromate
conversion coatings promote a very good initial adhesion with paint, lacquer,
and organic finishes [4]. However, in the early nineties, the restrictions on the
use of Cr6+ based conversion treatments became more and more stringent owing
to the health and environmental issues related to the use of these kinds of metal
finishing [5]. In fact, it was proved that hexavalent chromium can cause lung
cancer in humans as a result of inhalation exposure in certain occupational
settings. Hexavalent chromium was recognised as a known carcinogen by the
World Health Organisation (WHO) and by the U.S. Environmental Protection
Agency (EPA) but it is also toxic and it can lead to allergic contact dermatitis as
a result of direct skin exposure to powders or liquids containing hexavalent
chromium [6,7]. In addition, Cr6+ has a high oxidizing potential and, thus, it is
also dangerous for the environment. Aiming at the replacement of chromate
conversion treatment in the metal finishing industry, in the last two decades
several different “environmental friendly” pre-treatments were studied. Among
them, a lot of studies deal with:
Chapter 1 Preliminary remarks
3
Pre-treatments with protecting mechanism similar to Cr6+, acting as
passivating agents, such as molybdates, permanganates, vanadates, and
tungstates [8,9];
Rare earth based conversion treatment, mainly based on cerium and
lanthanium salts [10-12];
Cr3+ conversion layers which do not contain oxidising Cr6+ species,
responsible of the self-healing of flaws [13];
Fluo-titanate and fluo-zirconate conversion treatment, obtained using
acidic compounds of titanium and zirconium oxides [14];
Phosphate conversion treatment which lead to the formation of
phosphate compound on metals surface [15,16];
Metal alkoxides and/or organically modified metal alkoxides, applied
onto the metal substrates via sol-gel route [17,18];
In this panorama, in the last few decades, thin sol-gel films from hybrid silicon
alkoxides precursors are of growing interest as efficient pre-treatments to
promote the adhesion between organic coatings and metal surfaces addressing
the environmental issues [19]. In particular, in the very last few years, the
development of water based silicon alkoxides sol-gel pre-treatments promoted a
great diffusion of these conversion layers as a “green” technology [20].
As far as the organic coating itself is concerned, volatile organic compounds
(VOCs) are among the most common pollutants emitted by paints industries
dealing with processing of chemicals such as solvents, thinners, degreasers and
Chapter 1 Preliminary remarks
4
cleaners [21]. In the past, solvent-borne organic coatings were the most
widespread sort of painting system. Due to their volatility, compounds coming
from the solvent used in paints, varnishes and vehicle refinishing are emitted
directly into the atmosphere, after having undergone physical or chemical
transformation [22]. The presence of organic compounds deriving from organic
solvents lead to the formation of ozone in the troposphere as a consequence of
the photochemical reactions of VOCs with atmospheric nitrogen oxides (NOx)
[21]. This concern with regard to tropospheric ozone pollution has given rise to
a number of initiatives to reduce emissions of the precursors which lead to
ozone formation [23]. In 1999, the Gothenburg Protocol set new restrictive
emission thresholds (to be reached, at least, in 2010) for abating acidification,
eutrophication and ground-level ozone, for four types of pollutants, including
VOCs. It is expected that 2010 will see further changes of VOCs limits
concerning organic coatings [24]. In addition, VOCs have been perceived as a
contributor to global warming [25]. These drawbacks of using solvent-borne
organic coatings led to an increasing interest, over the recent years, in research
and development activities towards reducing the VOCs within the legal ceilings
in a way that is both technically feasible and economically viable [26] without
losing the corrosion protection properties of solvent-borne coatings. A few
different solutions were proposed:
High solid coatings (solvent about 20% by volume), obtained lowering
the molecular weight of resins and simultaneously increasing their
Chapter 1 Preliminary remarks
5
molecular branching [27]: highly branched structure in the polymer
backbone are obtained using multifunctional monomers or building
blocks [28];
Powder coating, consisting in the sintering of powders of the organic
coating to apply on the substrate (no solvent is present) containing
binder, hardener pigments and additives: melting, flow, gel point and
cure completion are the different phases in film formation of powder
coatings [29,30];
Water-borne coatings, consisting of aqueous compositions with only a
small amount of organic solvent (water reducible coatings) or no organic
solvent at all (water soluble polymers and latexes), where water is the
only solvent present [31,32];
Despite the difficulties related to the formulation, the needs of specific
additives, the critical control of wetting properties and the complexity of the
thermodynamic concerns [33,34], water-borne coating are a very promising
solution for the replacement of solvent-borne coatings. Moreover, the
environmental impact of waterborne coatings can be even improved combining
the potential of water based coating technology with the UV curing process. UV
irradiation curing have a lot of advantages over traditional thermal curing, such
as rapid polymerization, high efficiency, very low energy, consumption [35] in
addition to low temperature operation, application versatility, good viscosity
control, high cross-linking density and, consequently, superior mechanical and
Chapter 1 Preliminary remarks
6
thermal properties [36]. It was proved that, compared to conventional curing
methods, UV curing processes use only 5-50% of energy [37]. Thus, concerning
the environmental impact of UV curing process, this technology has a relevant
impact in the lowering of the energy consumption for the curing of an organic
coating.
In the previously discussed overture on the new environmental friendly
solution for metals pre-treatment and protection through organic coatings, two
innovative solutions were highlighted: silicon alkoxides sol-gel pre-treatments
and UV curable waterborne coatings.
The corrosion protection properties of these low environmental impact very
promising materials can be further increased conveniently modifying their
structure by using hybrid silane molecules and nanoparticles, or, more in
general, by applying the chemical nanotechnology to design coatings with
special corrosion protection related properties. An improvement in corrosion
protection properties can lead to both ecological and economical beneficial
effects, related to the higher service life and the lower material consumption to
ensure a sufficient protection level.
Nanotechnology is likely to be the answer to the need of efficient and definitive
solution for the development of new effective environmental friendly
protection systems, as stated a few years ago by D. R. Baer et al. [38]:
“Coatings and coating processes will play a major role in the
future of nanotechnology regardless of the directions in which
Chapter 1 Preliminary remarks
7
they will be taken. Because nanostructured materials, in
whatever form they are produced, will be incorporated into
larger mesoscopic and macroscopic systems, coating processes
will play a critical role in the success of nanotechnology in many
different applications.”
1.2 Hybrid silane sol-gel coatings
In the last two decades, the potential of organofunctional silane molecules for
the replacement of chrome conversion treatments has been the topic of a huge
number of studies [39-46]. Silanes have been widely studied as coupling agents
between inorganic and organic materials since the first works of E. P.
Pueddlemann [47]. Concerning corrosion science, a lot of efforts have been
made to apply these materials as adhesion promoters between metallic
substrates and the organic coatings used for protection against corrosion
phenomena [48-50]. The chemistry of silanes and the mechanism of interaction
of these molecules with a metallic substrate and an organic coating have been
widely explained and are reported elsewhere in literature [51-53]. Silanes
molecules are applied onto metal surfaces by means of the sol-gel process. The
deposition of hybrid silane sol-gel coatings generally occurs in four stages [54]:
Chapter 1 Preliminary remarks
8
1. Hydrolysis of the silicon alkoxides molecules;
2. Condensation reactions and polymerization of monomers to form
chains and particles;
3. Growth of the particles (or chains);
4. Agglomeration of the polymer structures followed by the formation of a
network;
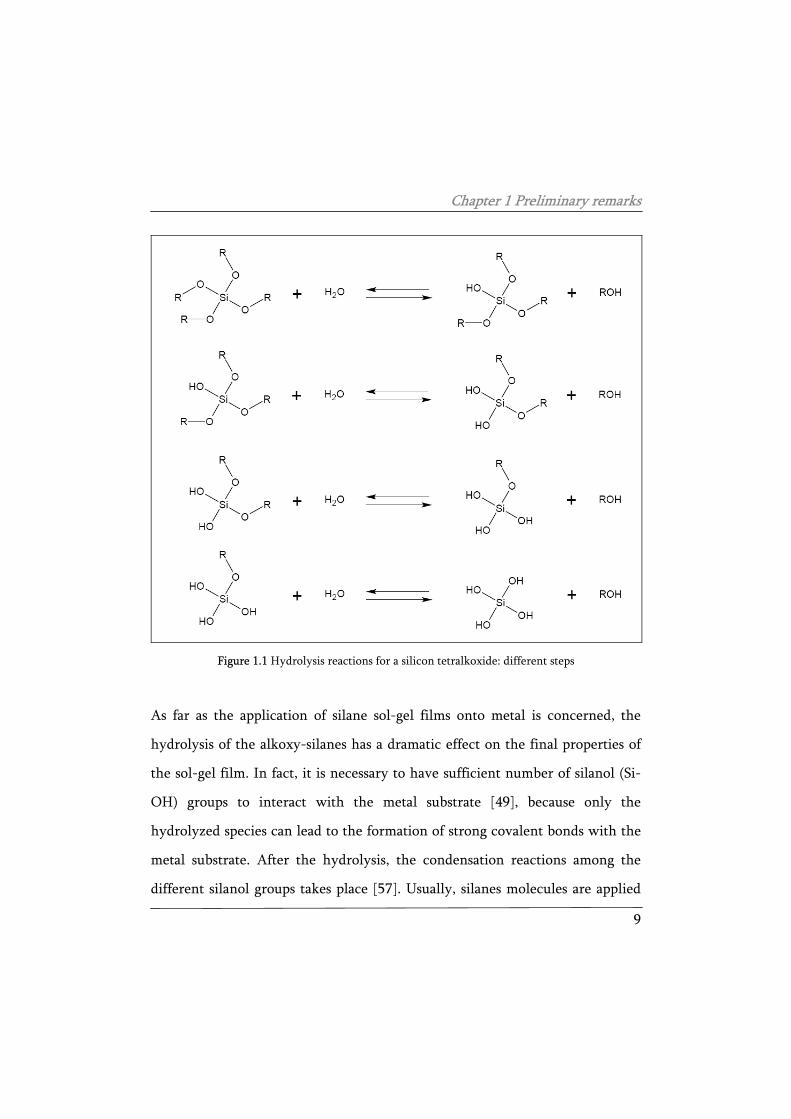
The hydrolysis occurs in presence of water. Alkoxy-silanes molecules generate
Si-OH groups from Si-OR groups (where R is an organic group) following
approximately the steps schematically reported in Figure 1.1 [55]. Notice that
alcohols are by-products produced by the hydrolysis reaction. Without going
into details, it is worthy to highlight that hydrolysis reactions are affected by a
huge number of parameters, such as temperature, pH, nature of the alkoxides,
age of the solution, etc. [38-43,56] that can affect and modify the reaction
kinetics.
Chapter 1 Preliminary remarks
9
Figure 1.1 Hydrolysis reactions for a silicon tetralkoxide: different steps
As far as the application of silane sol-gel films onto metal is concerned, the
hydrolysis of the alkoxy-silanes has a dramatic effect on the final properties of
the sol-gel film. In fact, it is necessary to have sufficient number of silanol (Si-
OH) groups to interact with the metal substrate [49], because only the
hydrolyzed species can lead to the formation of strong covalent bonds with the
metal substrate. After the hydrolysis, the condensation reactions among the
different silanol groups takes place [57]. Usually, silanes molecules are applied
Chapter 1 Preliminary remarks
10
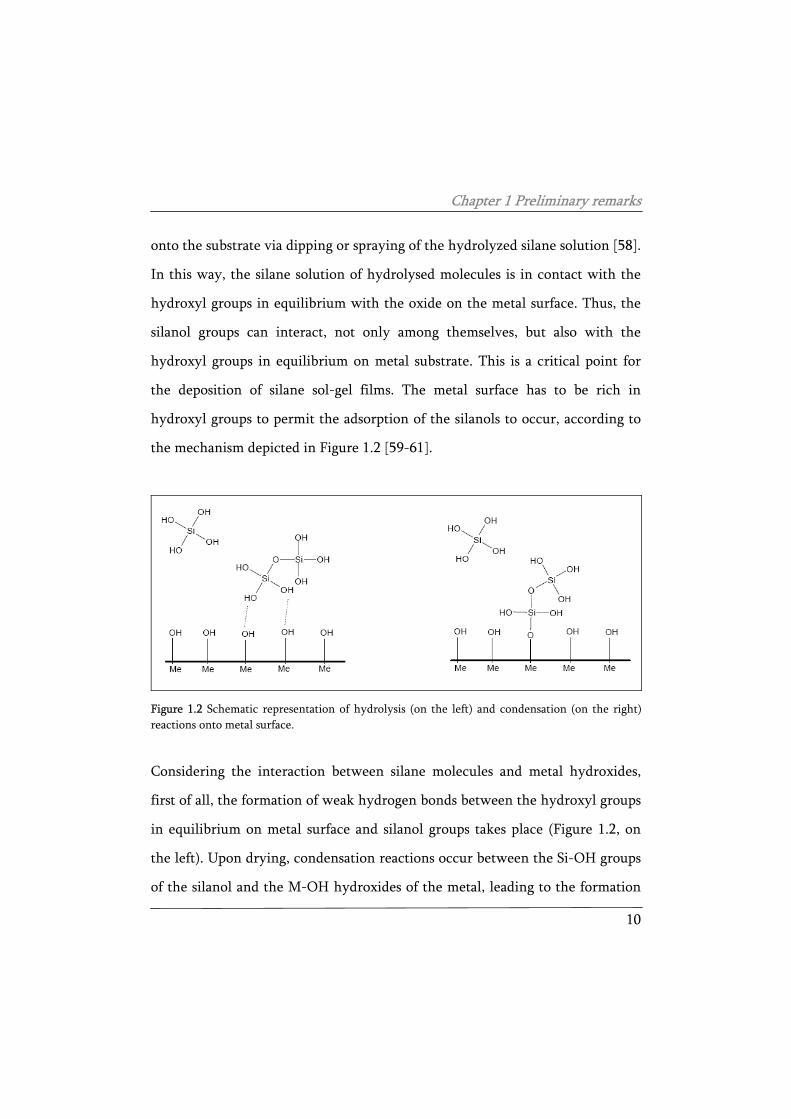
onto the substrate via dipping or spraying of the hydrolyzed silane solution [58].
In this way, the silane solution of hydrolysed molecules is in contact with the
hydroxyl groups in equilibrium with the oxide on the metal surface. Thus, the
silanol groups can interact, not only among themselves, but also with the
hydroxyl groups in equilibrium on metal substrate. This is a critical point for
the deposition of silane sol-gel films. The metal surface has to be rich in
hydroxyl groups to permit the adsorption of the silanols to occur, according to
the mechanism depicted in Figure 1.2 [59-61].
Figure 1.2 Schematic representation of hydrolysis (on the left) and condensation (on the right) reactions onto metal surface.
Considering the interaction between silane molecules and metal hydroxides,
first of all, the formation of weak hydrogen bonds between the hydroxyl groups
in equilibrium on metal surface and silanol groups takes place (Figure 1.2, on
the left). Upon drying, condensation reactions occur between the Si-OH groups
of the silanol and the M-OH hydroxides of the metal, leading to the formation
Chapter 1 Preliminary remarks
11
of covalent metal-siloxane bonds (M-O-Si), according to the mechanism
depicted in Figure 1.2 on the right and the following reaction (silanization
reaction) [62].
( ) ( ) (int ) 2solution surface erfaceSi OH M OH Si O M H O− + − − − +
If the rate of hydrolysis is sufficiently high compared to the condensation
between silanols groups, many Si-O-M bonds can be formed between small-
sized silanols and the metal. On the other hand, if the rate of hydrolysis is
relatively low compared to the condensation between silanols groups, few Si-O-
M bonds are formed between large-sized hindered silanols and the substrate
[57,63].
In fact, the silanization reaction occurs in competition with the condensation
reaction of the silanol groups which interact among themselves, according to:
( ) ( ) ( _ _ ) 2solution solution solution or filmSi OH Si OH Si O Si H O− + − − − +
As a result of the hydrolysis and, consequently, the condensation reactions of
the alkoxy groups linked to the silicon atom, a sol-gel film is formed [64]. The
structure of the film is strongly related to the chemistry of the silane molecules
involved, the deposition condition and the properties of the silane diluted
solution.
Chapter 1 Preliminary remarks
12
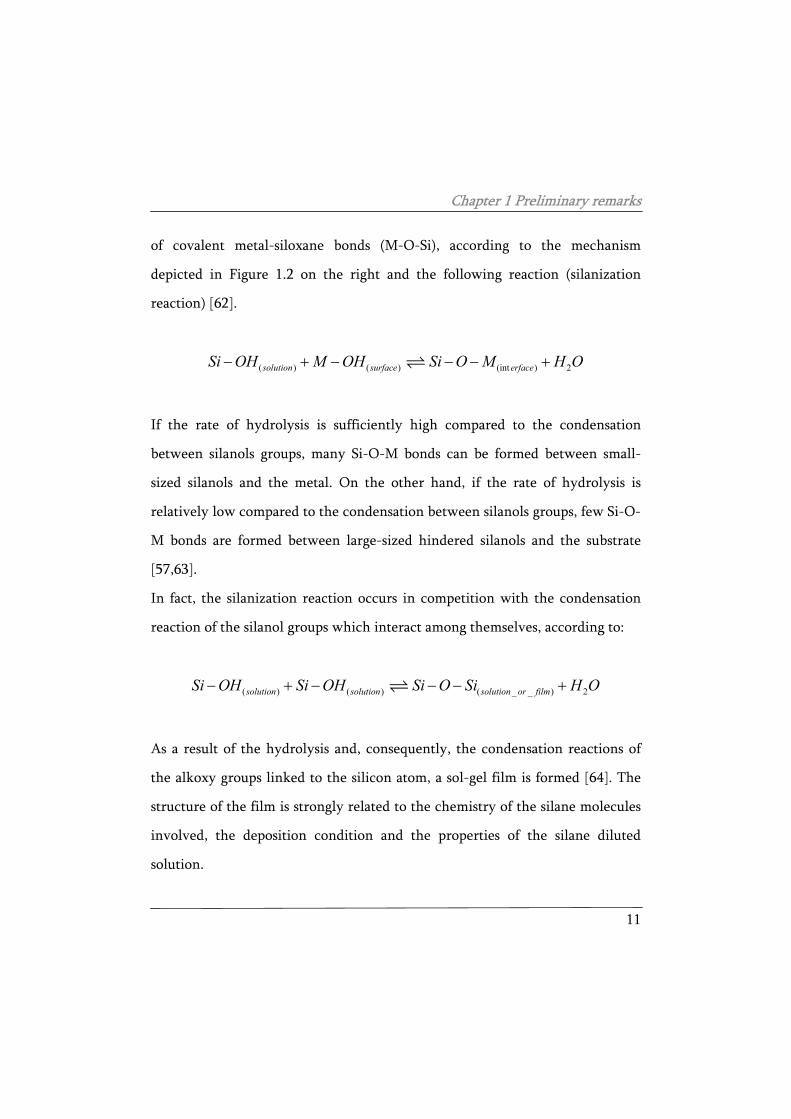
However, the final structure can be schematically represented as depicted in
Figure 1.3, where M represents the metal substrate.
Figure 1.3 Two-dimension schematic representation of the structure of a silane sol-gel film bonded onto a metal (M) substrate
Considering Figure 1.3, notice that the number of hydroxyls groups depends on
the curing process: higher the temperature and/or longer the heat treatment,
lower the number of uncondensed Si-OH bonds.
As far as organofunctional alkoxy-silanes are concerned, the mechanism of film
formation is very similar. Organofunctional alkoxy-silanes are hybrid molecules
containing one or more non-hydrolysable substituent linked to the silicon
atom. The structure of this kind of molecules is approximately:
Chapter 1 Preliminary remarks
13
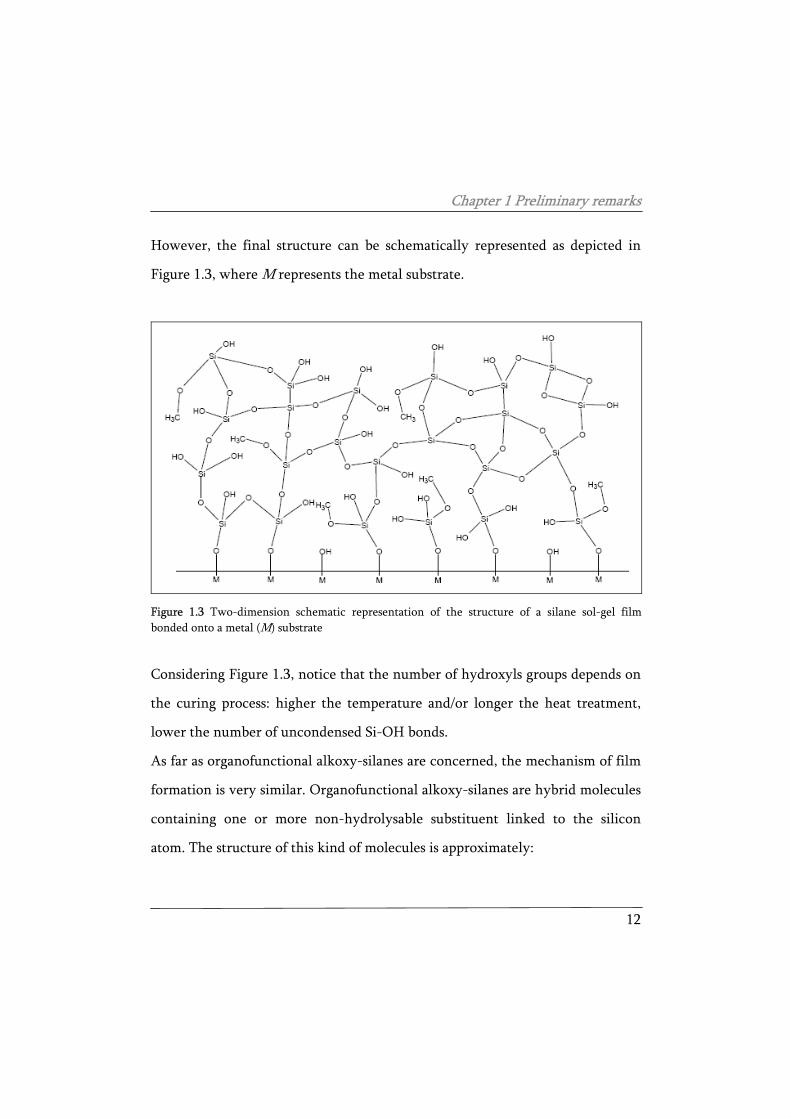
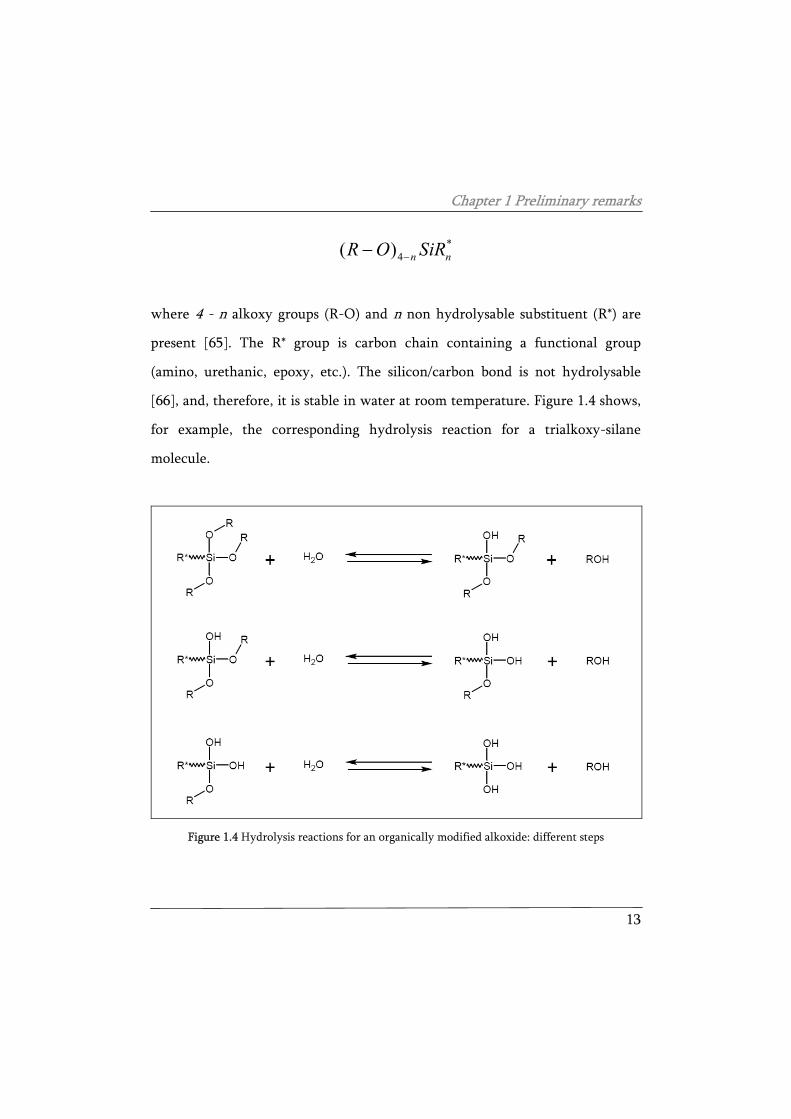
*4( ) n nR O SiR−−
where 4 - n alkoxy groups (R-O) and n non hydrolysable substituent (R*) are
present [65]. The R* group is carbon chain containing a functional group
(amino, urethanic, epoxy, etc.). The silicon/carbon bond is not hydrolysable
[66], and, therefore, it is stable in water at room temperature. Figure 1.4 shows,
for example, the corresponding hydrolysis reaction for a trialkoxy-silane
molecule.
Figure 1.4 Hydrolysis reactions for an organically modified alkoxide: different steps
Chapter 1 Preliminary remarks
14
These kinds of molecules usually contains one organically modified group
(stable in water) which ensures a second step polymerization if either thermal
or photochemical curing are carried out [64]. Moreover, the organic
functionalization of the alkoxy-silane molecules with organic groups allows the
sol-gel film to chemically interact with organic molecules, such as polymers. A
sol gel film made up of organofunctional molecules contains organic chemical
groups able to interact with an organic coating. In this sense, it is possible to
design sol-gel film with organically modified silane molecules which can act as
coupling agent between metallic inorganic substrates and an organic coating
[67]. In fact, organofunctional silane molecules contains both alkoxide groups,
which hydrolyse reacting with water, generate the sol-gel network and bond to
the metal substrate, and organic functionalities which are embedded in the
silane film and can polymerize and chemically interact with an organic coating.
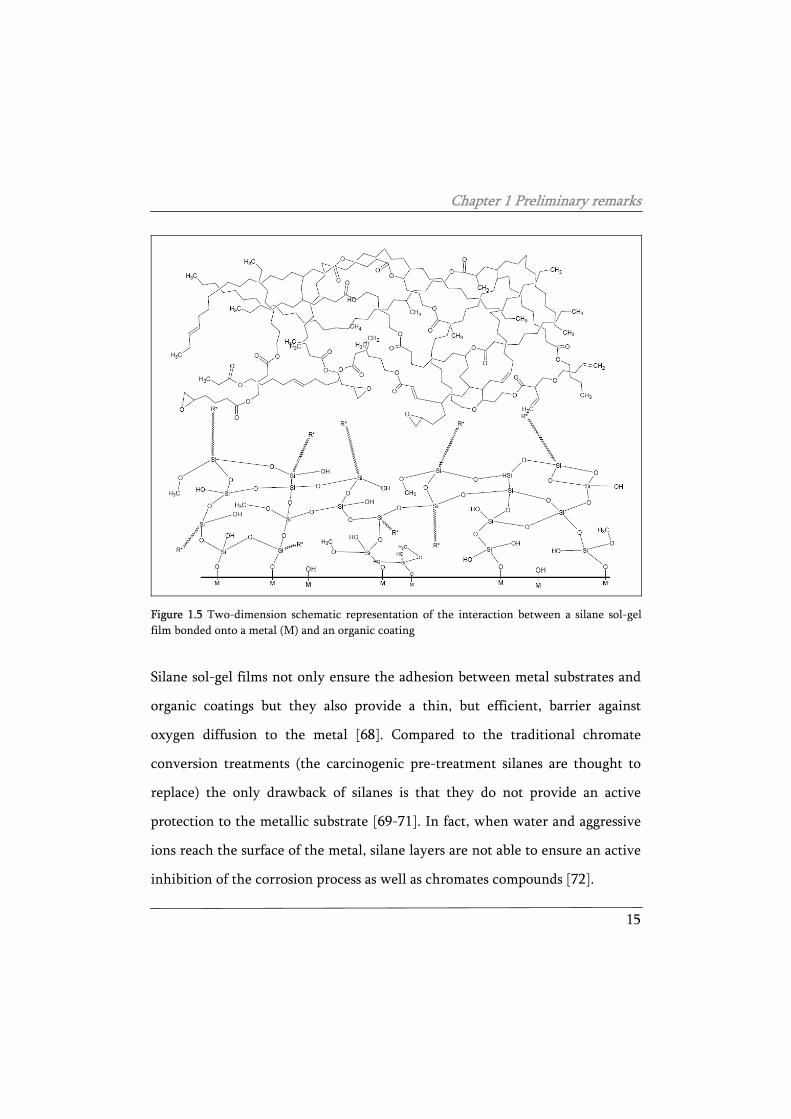
This latter mechanism of interaction is schematically represented in Figure 1.5.
The organic group linked to the silicon atom can be properly designed to
chemically interact with the organic coating to form covalent bonds between
the hybrid organically modified sol-gel film and the polymer itself.
Chapter 1 Preliminary remarks
15
Figure 1.5 Two-dimension schematic representation of the interaction between a silane sol-gel film bonded onto a metal (M) and an organic coating
Silane sol-gel films not only ensure the adhesion between metal substrates and
organic coatings but they also provide a thin, but efficient, barrier against
oxygen diffusion to the metal [68]. Compared to the traditional chromate
conversion treatments (the carcinogenic pre-treatment silanes are thought to
replace) the only drawback of silanes is that they do not provide an active
protection to the metallic substrate [69-71]. In fact, when water and aggressive
ions reach the surface of the metal, silane layers are not able to ensure an active
inhibition of the corrosion process as well as chromates compounds [72].
Chapter 1 Preliminary remarks
16
For this reason, and in general to improve the protection properties of the silane
layers, several attempts were made adding corrosion inhibitors such as cerium
and lanthanum salts [73-75] or CeO2 and LaO2 nanopowders [76] to the silane
sol-gel films. In addition, the performances of silane layers filled with silica
particles were also evaluated [77-80], aiming at an improvement of the barrier
properties of the sol-gel film itself.
1.3 UV curable waterborne coatings
More and more national and international scientific communities are moving
towards the development of sustainable and low impact chemical technologies.
In this respect the issue of environmentally friendly organic coatings is very
important. Reduction or elimination of toxic anticorrosive pigments and
organic solvents are among the main targets. Together with high solid and
powder coatings, waterborne coatings represent an interesting solution to
address the present ecological issues. Water based paints offer significant
advantages especially for in field applications, where the problem of solvent
emission of volatile organic compounds (VOC) is really stringent since no
recycling process is feasible. UV curing coatings cross-link by reaction initiated
by radiation, rather than heat: these coatings are indefinitely stable when stored
in absence of radiation, while after UV application, cross-linking occurs rapidly,
also at room temperature [81]. Thus, owing the UV curable coatings do not
Chapter 1 Preliminary remarks
17
need, in principle, thermal energy to crosslink, the ultra-violet curing process
can be considered “environmentally friendly”. A waterborne UV curable
coating can be considered is a low environmental impact technology, owing to
both the absence of organic solvents and, therefore, the restriction related to
VOCs and the replacement of the heat treatment with a curing procedure at
room temperature. Concerning the UV curing process, a molecule which
contains unsaturations that are capable of reacting with other unsaturated
molecules when subjected to UV light energy is necessary in the UV curable
mixture [82]. Thus, exposing the polymeric mixture to a suitable UV light
source it is possible to produce a solid coherent film. The waterborne UV-
curable resins usually consists of a mixture of a photoinitiator, a functionalized
oligomer and a low vapour pressure monomer serving as a reactive diluent to
meet the formulation viscosity requirements [83]. Two different types of photo-
polymerization or photo-crosslinking process can be employed:
- Free radical chain process;
- Ionic (commonly cationic) chain process;
The free radical chain process consist in the photogeneration (obtained by
irradiation with a UV source) of a radical which initiate the polymerization by
adding to vinyl double bonds. The mechanism by which the initiator molecules
generate the free radicals that initiate the polymerization or crosslinking is
Chapter 1 Preliminary remarks
18
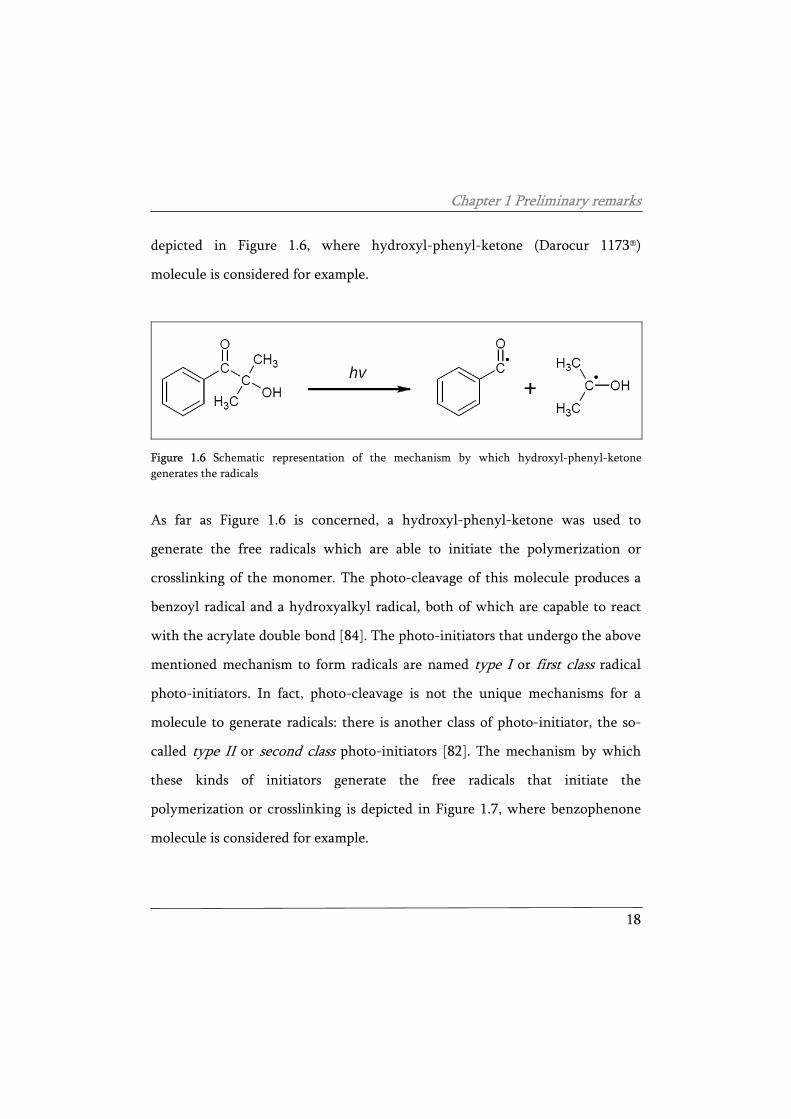
depicted in Figure 1.6, where hydroxyl-phenyl-ketone (Darocur 1173®)
molecule is considered for example.
Figure 1.6 Schematic representation of the mechanism by which hydroxyl-phenyl-ketone generates the radicals
As far as Figure 1.6 is concerned, a hydroxyl-phenyl-ketone was used to
generate the free radicals which are able to initiate the polymerization or
crosslinking of the monomer. The photo-cleavage of this molecule produces a
benzoyl radical and a hydroxyalkyl radical, both of which are capable to react
with the acrylate double bond [84]. The photo-initiators that undergo the above
mentioned mechanism to form radicals are named type I or first class radical
photo-initiators. In fact, photo-cleavage is not the unique mechanisms for a
molecule to generate radicals: there is another class of photo-initiator, the so-
called type II or second class photo-initiators [82]. The mechanism by which
these kinds of initiators generate the free radicals that initiate the
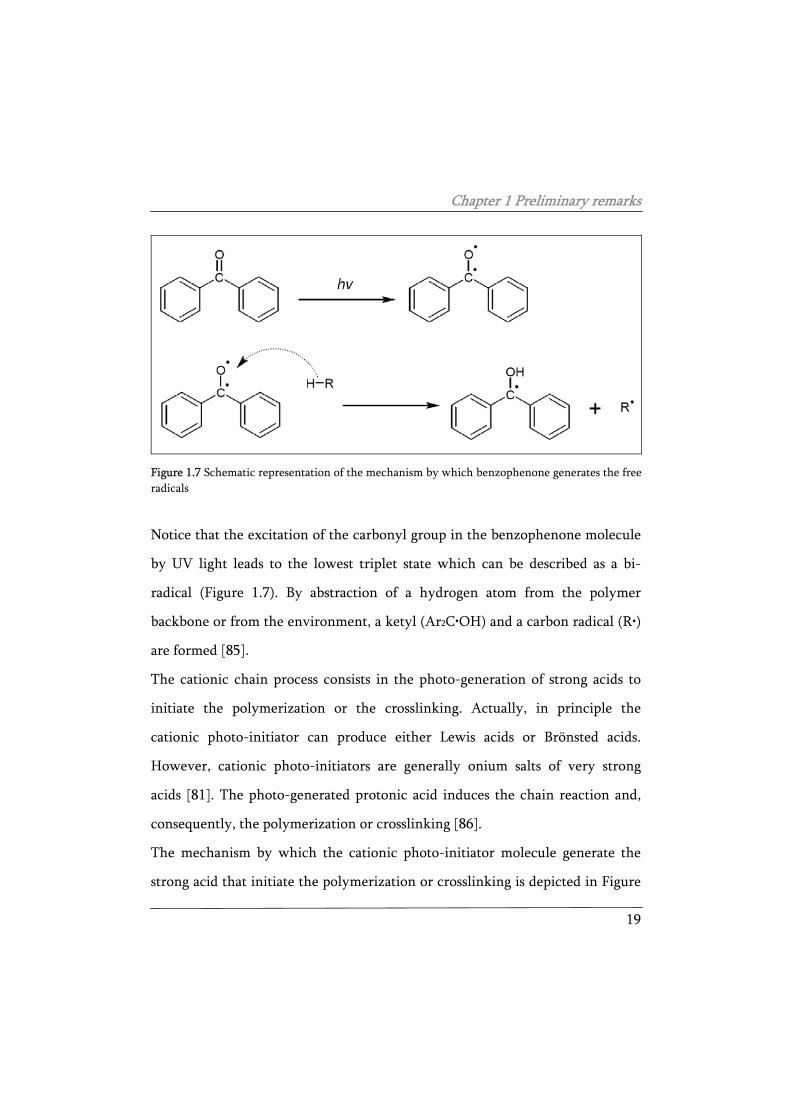
polymerization or crosslinking is depicted in Figure 1.7, where benzophenone
molecule is considered for example.
Chapter 1 Preliminary remarks
19
Figure 1.7 Schematic representation of the mechanism by which benzophenone generates the free radicals
Notice that the excitation of the carbonyl group in the benzophenone molecule
by UV light leads to the lowest triplet state which can be described as a bi-
radical (Figure 1.7). By abstraction of a hydrogen atom from the polymer
backbone or from the environment, a ketyl (Ar2C•OH) and a carbon radical (R•)
are formed [85].
The cationic chain process consists in the photo-generation of strong acids to
initiate the polymerization or the crosslinking. Actually, in principle the
cationic photo-initiator can produce either Lewis acids or Brönsted acids.
However, cationic photo-initiators are generally onium salts of very strong
acids [81]. The photo-generated protonic acid induces the chain reaction and,
consequently, the polymerization or crosslinking [86].
The mechanism by which the cationic photo-initiator molecule generate the
strong acid that initiate the polymerization or crosslinking is depicted in Figure
Chapter 1 Preliminary remarks
20
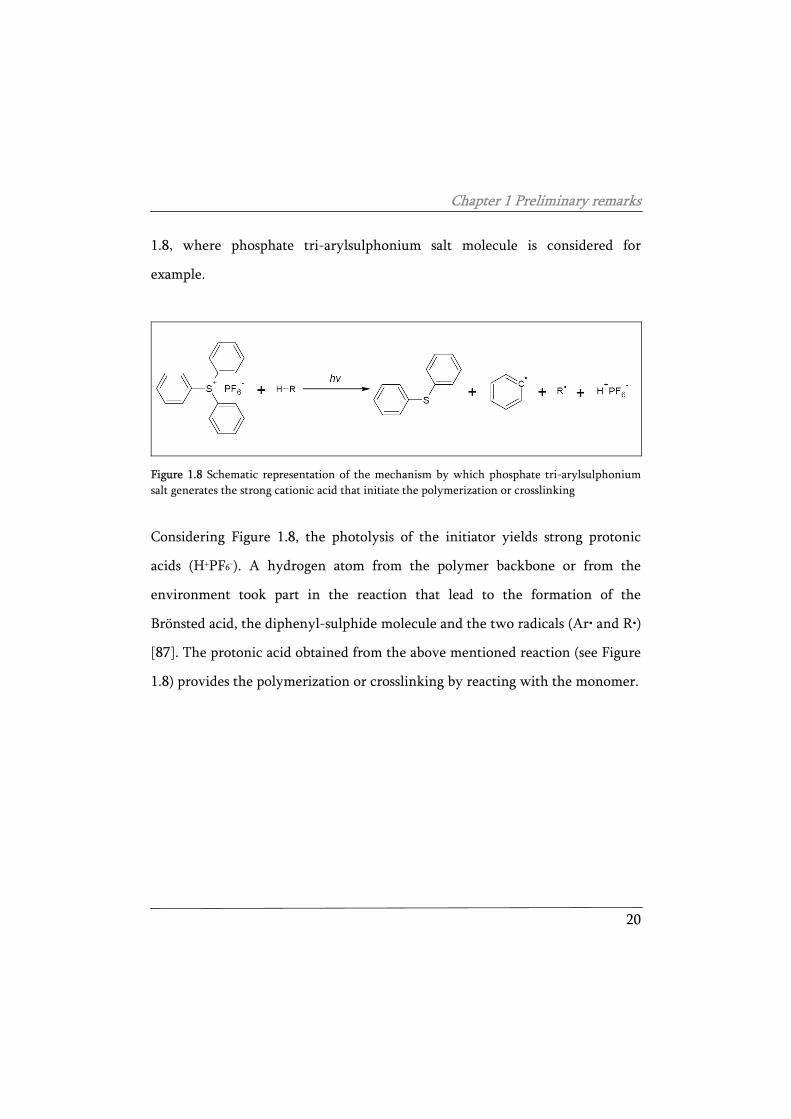
1.8, where phosphate tri-arylsulphonium salt molecule is considered for
example.
Figure 1.8 Schematic representation of the mechanism by which phosphate tri-arylsulphonium salt generates the strong cationic acid that initiate the polymerization or crosslinking
Considering Figure 1.8, the photolysis of the initiator yields strong protonic
acids (H+PF6-). A hydrogen atom from the polymer backbone or from the
environment took part in the reaction that lead to the formation of the
Brönsted acid, the diphenyl-sulphide molecule and the two radicals (Ar• and R•)
[87]. The protonic acid obtained from the above mentioned reaction (see Figure
1.8) provides the polymerization or crosslinking by reacting with the monomer.
Chapter 2 Silane sol-gel pre-treatments
21
2 Silane sol-gel pre-treatments
In literature there is a huge number of studies concerning the potential of
organofunctional silane molecules as adhesion promoters between metallic
substrates and organic coatings used for protection against corrosion
phenomena [39-52]. Besides being one of the most interesting way to replace
chromate conversion treatments it has been widely demonstrated that silane
sol-gel coatings are also environmentally friendly. The silanes molecules used in
the field of corrosion protection are hybrid molecules designed to bond at the
same time with a metallic substrate and with an organic coating. As anticipated
in the previous chapter, silane sol-gel films ensure not only the adhesion
between metal substrates and organic coatings but they also provide a certain
corrosion protection. In this chapter, several experimental silane based films
applied on aluminium and hot dip galvanized steel were evaluated. A
preliminary study of the performance and the potential of silane sol-gel pre-
treatment for the development of improved duplex systems is carried out. A
duplex system consist in the combination of two different coating to protect the
steel substrate: metallic zinc/zinc alloy coating (galvanization) applied on the
metallic substrate and an organic coating (paint) applied the galvanization. The
performances of two different environmentally friendly complete duplex
protection systems were evaluated. In fact, two different painting systems were
Chapter 2 Silane sol-gel pre-treatments
22
applied on the silane pre-treated galvanized steel: an electro-coated epoxy
cataphoretic paint and an epoxy-polyester powder coating paint were applied.
Notice that these protection systems are designed to be completely
environmentally friendly. In fact the organic coating does not contain solvents,
the cataphoretic coating and the sol–gel pre-treatment are water based and the
galvanization of the HDG steel used in this study is lead free. Remark that lead
is a heavy metal, dangerous for both human health and the environment. In this
sense, the restrictions on the use of this metal are becoming more and more
stringent. Eventually, some attempts were made to modify the inner structure
of the sol-gel film by embedding montmorillonite nanoparticles into the hybrid
films. A complete corrosion testing was carried out on the different protection
system, in order to deeply investigate the potential of the different protecting
system with high environmental compatibility.
2.1 Synthesis and application of silane sol-gel films
2.1.1 Silanes mixture: properties & preparation
The diluted silane solution consists of an experimental mix of three different
silanes molecules: γGlycidil-oxypropil-triethoxy-silane (γGPS), Tetraethoxy-
silane (TEOS) and Methyl–triethoxy-silane (MTES).
Chapter 2 Silane sol-gel pre-treatments
23
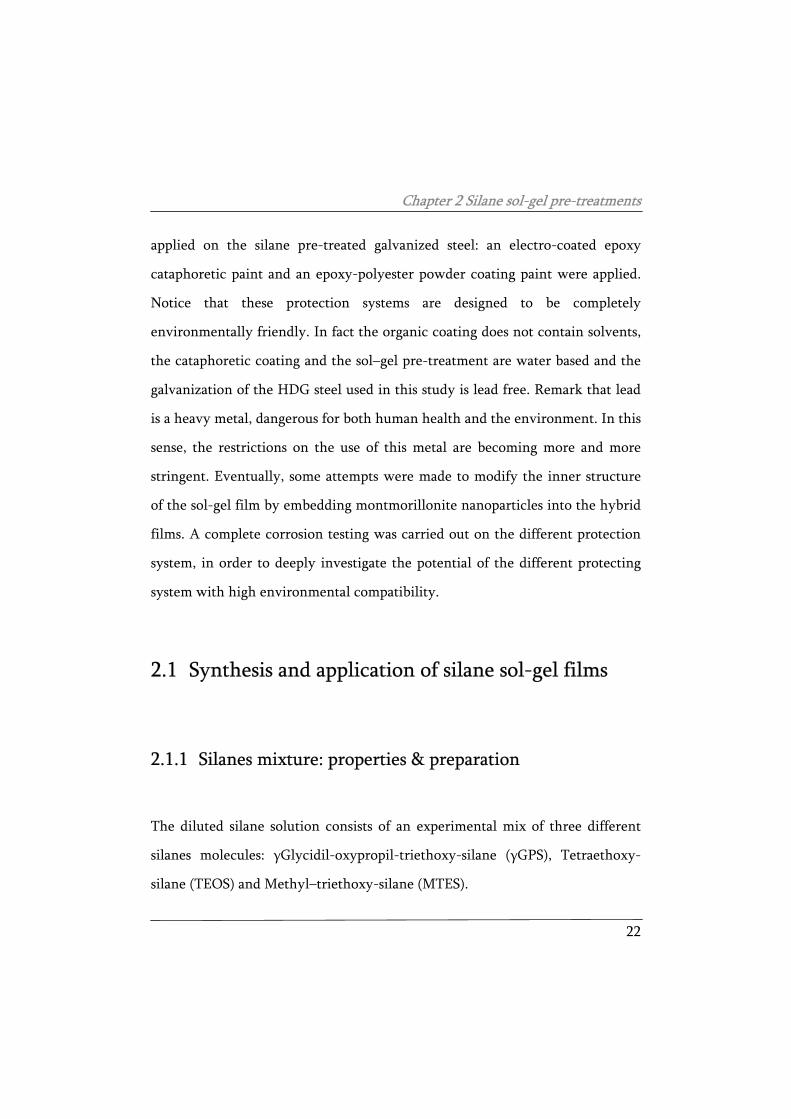
γGPS (depicted in Figure 2.1) is an organo-functional silane composed of a short
carbon backbone of 3 carbon atoms with an epoxy functionalized tail and a
silicon atom substituted with 3 (–O-CH2-CH3) groups as head. The main organic
fraction of the hybrid sol-gel coating is carried into the film by this molecule.
OO
Si
O
OO
CH3
CH3
CH3
OO
Si
O
OO
CH3
CH3
CH3
Figure 2.1 Schematic representation of γGlycidil-oxypropil-trimethoxy-silane
The silicon – oxygen bonds can hydrolyze in presence of water, leading to the
formation of Si-OH bonds, following the reactions discussed in the previous
chapter. The hydroxyl groups are responsible for the chemical bonding to metal
substrate, by means of condensation reaction with the hydroxides present on
metal substrates.
The silicon – carbon bond is not susceptible to hydrolysis and is stable in water.
Due to the presence of the epoxy group this molecule ensures an active
interaction with the organic coating. Under proper conditions, i.e. adding
thermal energy, the epoxy ring opens and leads to the formation of covalent
bonds with an organic coating. This molecule contributes to the formation of
the inorganic network as well as acts as an effective coupling agent with
Chapter 2 Silane sol-gel pre-treatments
24
polymers. The stability and the efficiency of the organic coating/sol-gel film
interface depend mainly on the interaction between this hybrid molecule and
the macromolecules or polymer chains of the organic coating. In order to
ensure a chemical compatibility between the sol-gel film and the organic
coating, in this study only epoxy functionalized polymers have been used. In
fact, pure epoxy polymers or epoxy-polyesters copolymer have been used as
coating for the evaluation of the performances of the silane sol-gel film as a
coupling agent between metallic substrate and the organic coating.
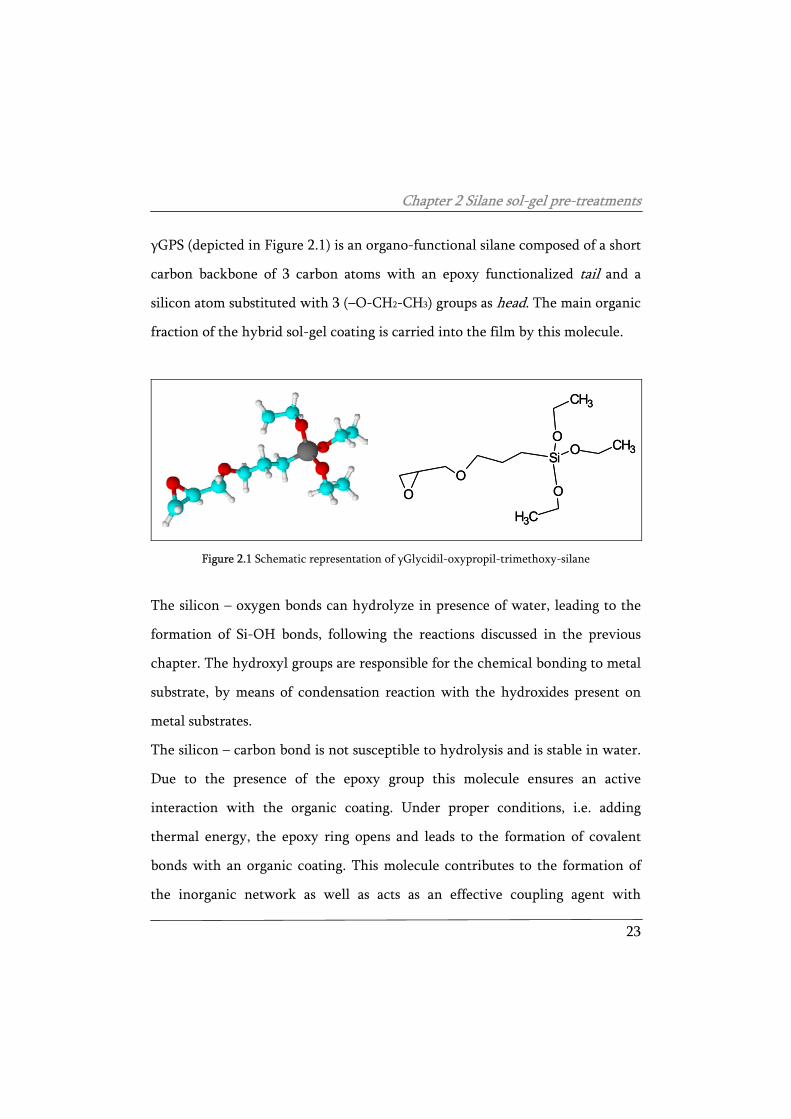
TEOS (depicted in Figure 2.2) is a very simple molecule composed of a silicon
atom bonded to four (–O-CH2-CH3) groups.
Si
O
OOO
CH3CH3
CH3CH3
Si
O
OOO
CH3CH3
CH3CH3
Figure 2.2 Schematic representation of Tetraethoxy-silane
As a function of the hydrolysis condition, all the Si–O-(CH2-CH3) bonds can,
potentially, hydrolyze and form Si–OH bonds. For this reason, TEOS is a sort of
network former, owing to it promotes the formation of an inorganic network
and inorganic domains of silica. The inorganic phase is likely to be responsible
of the improved barrier properties of the silane sol-gel films. In addition, the
Chapter 2 Silane sol-gel pre-treatments
25
hydroxyl groups can interact with the metal substrate, leading to the formation
of covalent bonds after hydrolysis (as well as the γGPS molecules).
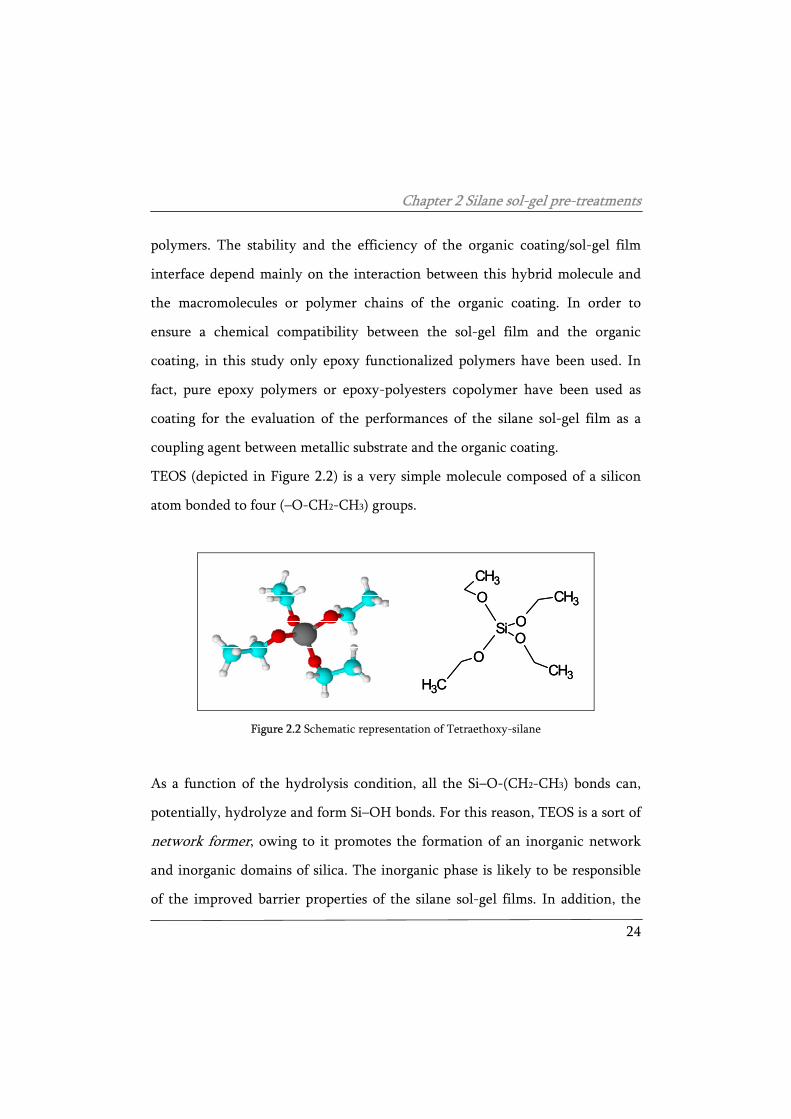
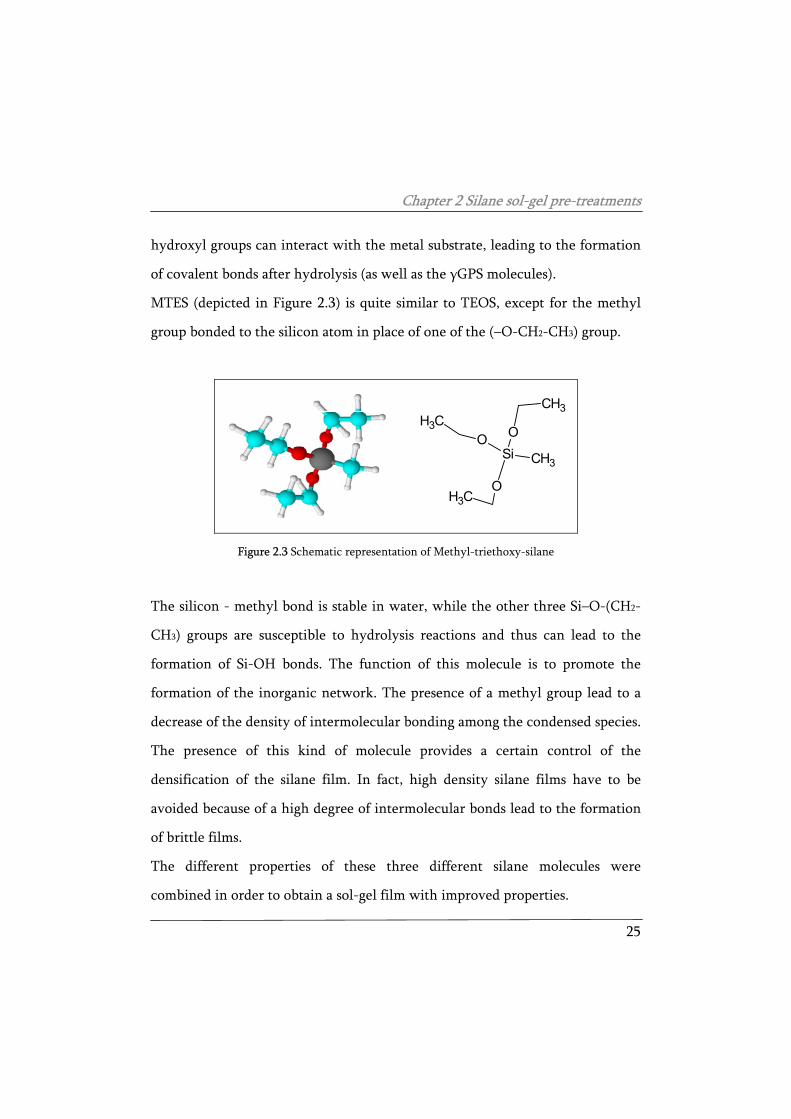
MTES (depicted in Figure 2.3) is quite similar to TEOS, except for the methyl
group bonded to the silicon atom in place of one of the (–O-CH2-CH3) group.
Si CH3
O
O O
CH3
CH3
CH3
Figure 2.3 Schematic representation of Methyl-triethoxy-silane
The silicon - methyl bond is stable in water, while the other three Si–O-(CH2-
CH3) groups are susceptible to hydrolysis reactions and thus can lead to the
formation of Si-OH bonds. The function of this molecule is to promote the
formation of the inorganic network. The presence of a methyl group lead to a
decrease of the density of intermolecular bonding among the condensed species.
The presence of this kind of molecule provides a certain control of the
densification of the silane film. In fact, high density silane films have to be
avoided because of a high degree of intermolecular bonds lead to the formation
of brittle films.
The different properties of these three different silane molecules were
combined in order to obtain a sol-gel film with improved properties.
Chapter 2 Silane sol-gel pre-treatments
26
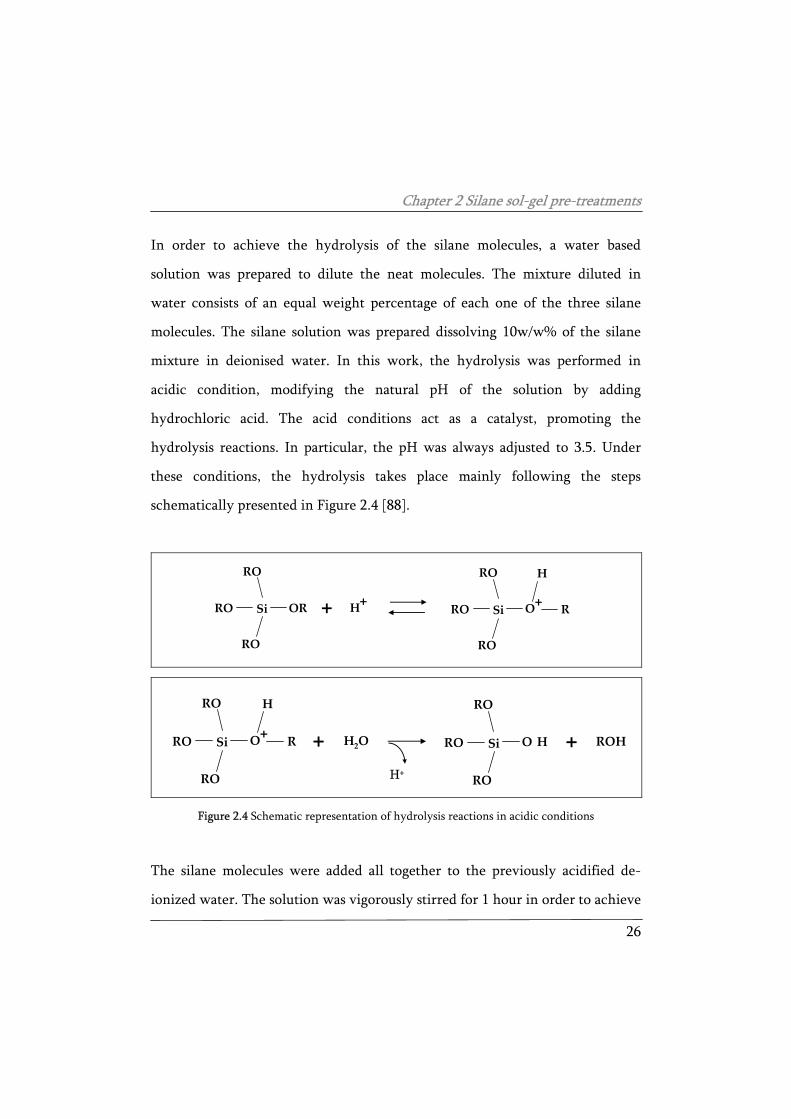
In order to achieve the hydrolysis of the silane molecules, a water based
solution was prepared to dilute the neat molecules. The mixture diluted in
water consists of an equal weight percentage of each one of the three silane
molecules. The silane solution was prepared dissolving 10w/w% of the silane
mixture in deionised water. In this work, the hydrolysis was performed in
acidic condition, modifying the natural pH of the solution by adding
hydrochloric acid. The acid conditions act as a catalyst, promoting the
hydrolysis reactions. In particular, the pH was always adjusted to 3.5. Under
these conditions, the hydrolysis takes place mainly following the steps
schematically presented in Figure 2.4 [88].
Si
RO
RO
RO
OR H++ Si
RO
RO
RO
O+
H
R
+Si
RO
RO
RO
O+
H
R H2O +Si
RO
RO
RO
O-H ROH
H+
Figure 2.4 Schematic representation of hydrolysis reactions in acidic conditions
The silane molecules were added all together to the previously acidified de-
ionized water. The solution was vigorously stirred for 1 hour in order to achieve
Chapter 2 Silane sol-gel pre-treatments
27
the optimal degree of hydrolysis. After this lapse of time, the solution is ready
for the application onto the metal substrates.
2.1.2 Pre-treatment of the substrates
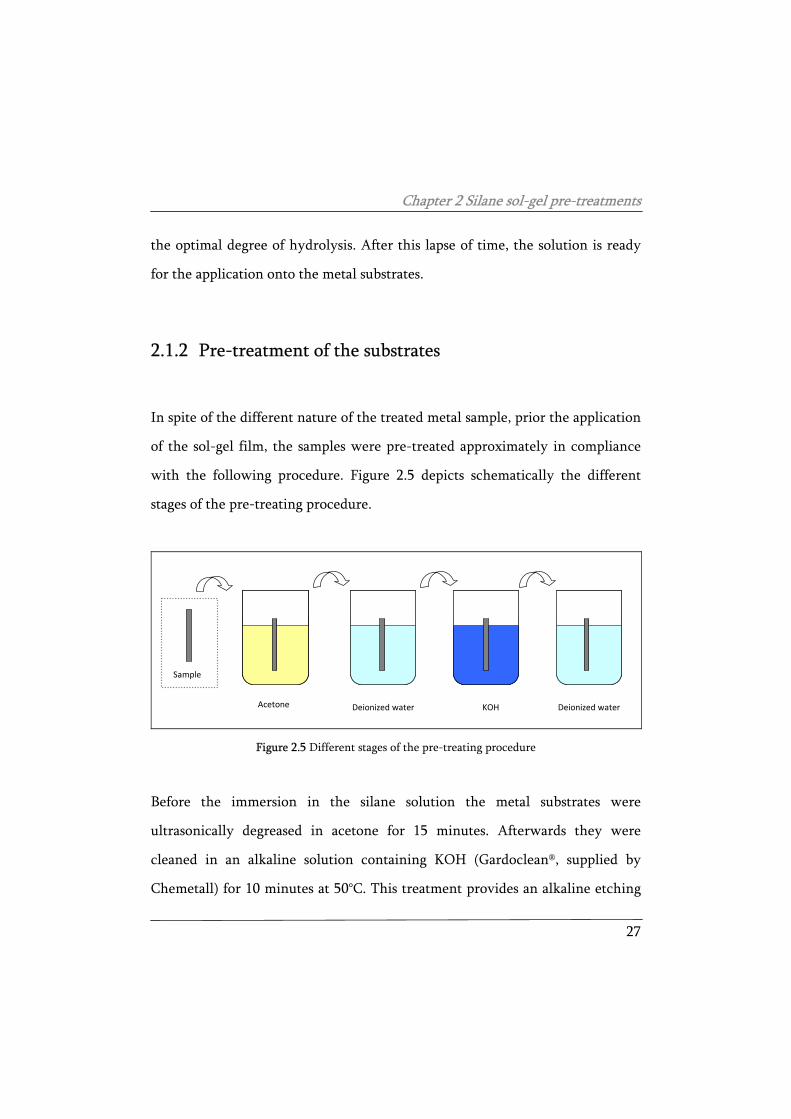
In spite of the different nature of the treated metal sample, prior the application
of the sol-gel film, the samples were pre-treated approximately in compliance
with the following procedure. Figure 2.5 depicts schematically the different
stages of the pre-treating procedure.
Acetone Deionized water KOH Deionized water
Sample
Figure 2.5 Different stages of the pre-treating procedure
Before the immersion in the silane solution the metal substrates were
ultrasonically degreased in acetone for 15 minutes. Afterwards they were
cleaned in an alkaline solution containing KOH (Gardoclean®, supplied by
Chemetall) for 10 minutes at 50°C. This treatment provides an alkaline etching
Chapter 2 Silane sol-gel pre-treatments
28
and a chemical activation of the surface. The alkaline treatment leads to the
formation of a high surface density of hydroxyl groups on the metal sample.
The presence of M-OH bonds (were “M” stands for “metal”) is responsible for
the subsequent interaction between the metal surface and the hydrolyzed silane
molecules [89]. In fact, as described in the previous chapter, the condensation
reactions occur at the metal interface between the metal hydroxides and the
silane molecules. After this treatment, followed a rinse in tap water and then in
de-ionized water.
2.1.3 Application and curing of the sol-gel films
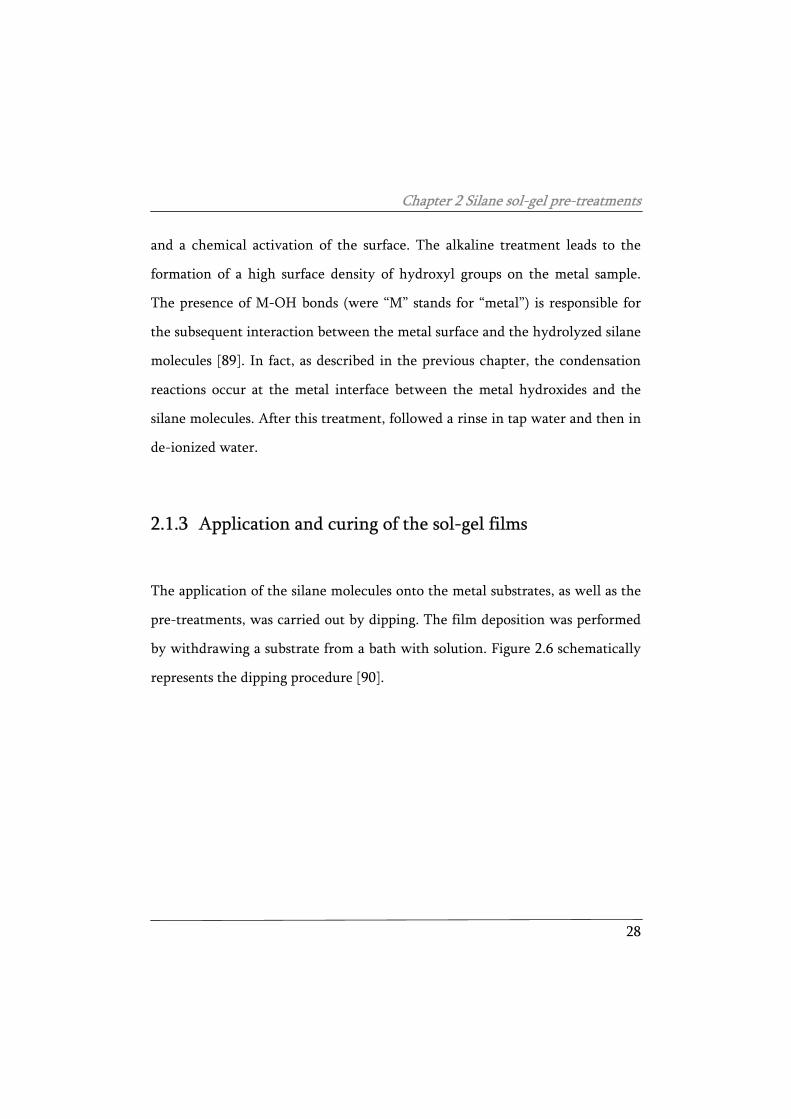
The application of the silane molecules onto the metal substrates, as well as the
pre-treatments, was carried out by dipping. The film deposition was performed
by withdrawing a substrate from a bath with solution. Figure 2.6 schematically
represents the dipping procedure [90].
Chapter 2 Silane sol-gel pre-treatments
29
Immersion Start Up Deposition - Dreinage
Figure 2.6 Schematic representation of the dipping procedure
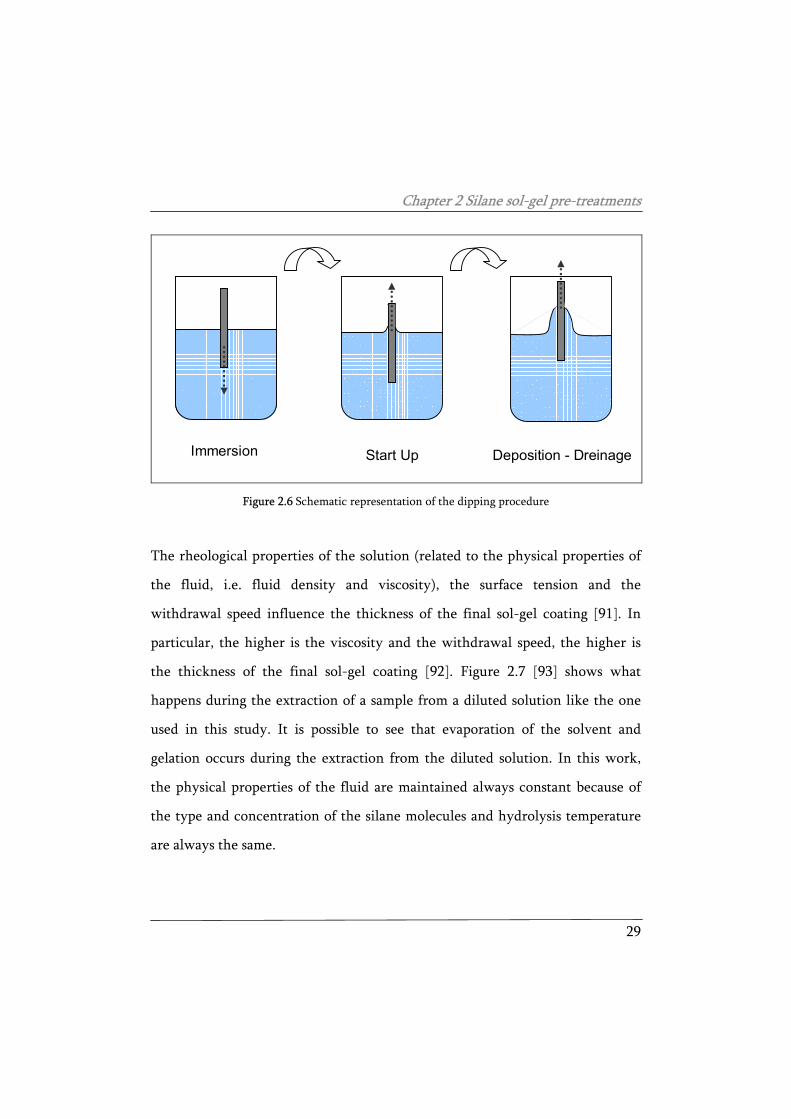
The rheological properties of the solution (related to the physical properties of
the fluid, i.e. fluid density and viscosity), the surface tension and the
withdrawal speed influence the thickness of the final sol-gel coating [91]. In
particular, the higher is the viscosity and the withdrawal speed, the higher is
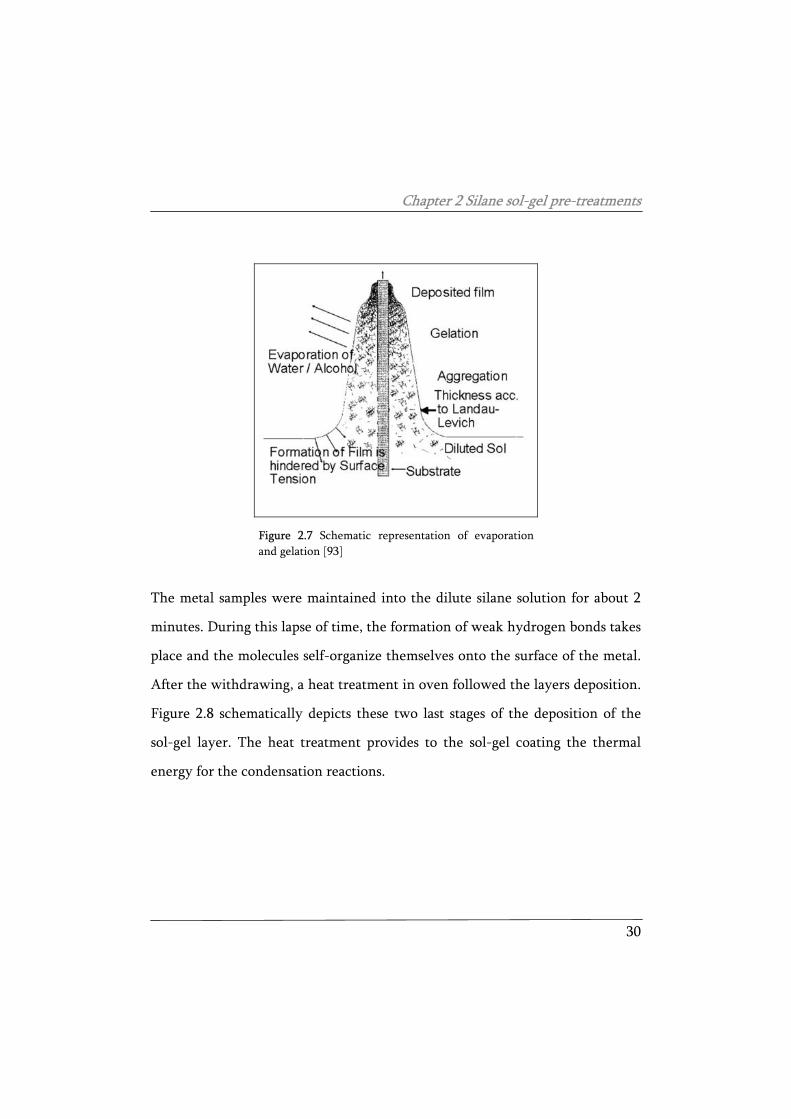
the thickness of the final sol-gel coating [92]. Figure 2.7 [93] shows what
happens during the extraction of a sample from a diluted solution like the one
used in this study. It is possible to see that evaporation of the solvent and
gelation occurs during the extraction from the diluted solution. In this work,
the physical properties of the fluid are maintained always constant because of
the type and concentration of the silane molecules and hydrolysis temperature
are always the same.
Chapter 2 Silane sol-gel pre-treatments
30
Figure 2.7 Schematic representation of evaporation and gelation [93]
The metal samples were maintained into the dilute silane solution for about 2
minutes. During this lapse of time, the formation of weak hydrogen bonds takes
place and the molecules self-organize themselves onto the surface of the metal.
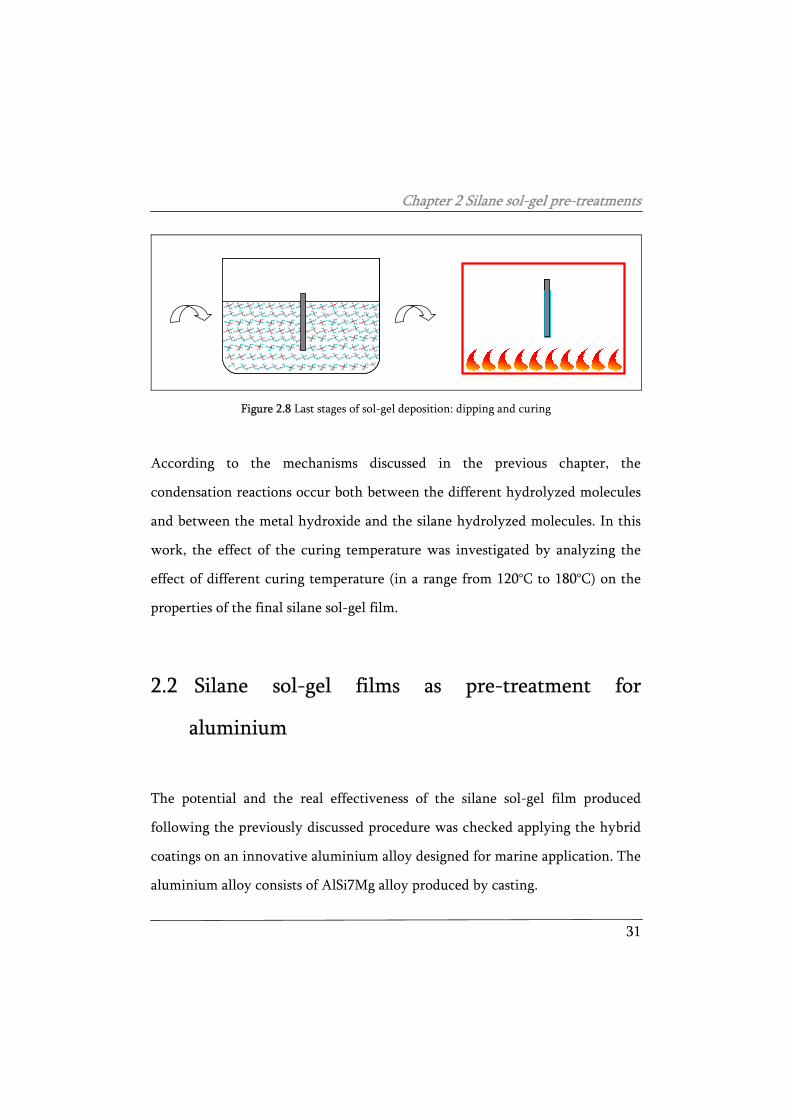
After the withdrawing, a heat treatment in oven followed the layers deposition.
Figure 2.8 schematically depicts these two last stages of the deposition of the
sol-gel layer. The heat treatment provides to the sol-gel coating the thermal
energy for the condensation reactions.
Chapter 2 Silane sol-gel pre-treatments
31
Figure 2.8 Last stages of sol-gel deposition: dipping and curing
According to the mechanisms discussed in the previous chapter, the
condensation reactions occur both between the different hydrolyzed molecules
and between the metal hydroxide and the silane hydrolyzed molecules. In this
work, the effect of the curing temperature was investigated by analyzing the
effect of different curing temperature (in a range from 120°C to 180°C) on the
properties of the final silane sol-gel film.
2.2 Silane sol-gel films as pre-treatment for
aluminium
The potential and the real effectiveness of the silane sol-gel film produced
following the previously discussed procedure was checked applying the hybrid
coatings on an innovative aluminium alloy designed for marine application. The
aluminium alloy consists of AlSi7Mg alloy produced by casting.
Chapter 2 Silane sol-gel pre-treatments
32
The performance of the silane sol-gel film as coupling agent as well as barrier
against corrosion was compared to traditional pre-treatments [94].
Traditionally, to reduce the corrosion rate of aluminium alloys, chemical
conversion layers based on CrVI, able to increase the passivation tendency of
the alloys (chromating) were used [95]. This is probably the most effective pre-
treatment for aluminium alloys, because of this treatment is also effective for
improving the adhesion of organic coatings deposited on the metal surface.
However, as previously stated, nowadays there are strong restrictions in the use
of these compounds due to the environmental protection legislation. In this
chapter the performances of the experimental silane sol-gel layer are compared
with other traditional pre-treatment, such as CrIII chemical conversion layer,
CrVI chemical conversion layer, and a fluorotitanate/zirconate acid based
conversion treatment. The electrochemical properties of the pre-treatments for
the aluminium samples and their corrosion protection properties were
analyzed. Eventually, an organic coating was applied onto the pre-treated
samples, in order to test the effectiveness of the pre-treatment to improve the
adhesion and the corrosion protection properties of the whole protection
system. This allows us to test the potential of the silane sol gel film as a coupling
agent for the enhancement of the adhesion between the metal substrates and
the organic coating. The samples were characterised by electrochemical
techniques (mainly EIS measurements), electron microscopy observations,
adhesion tests, anodic polarisation test and exposure in the salt spray chamber.
Chapter 2 Silane sol-gel pre-treatments
33
2.2.1 Materials and experimental procedure
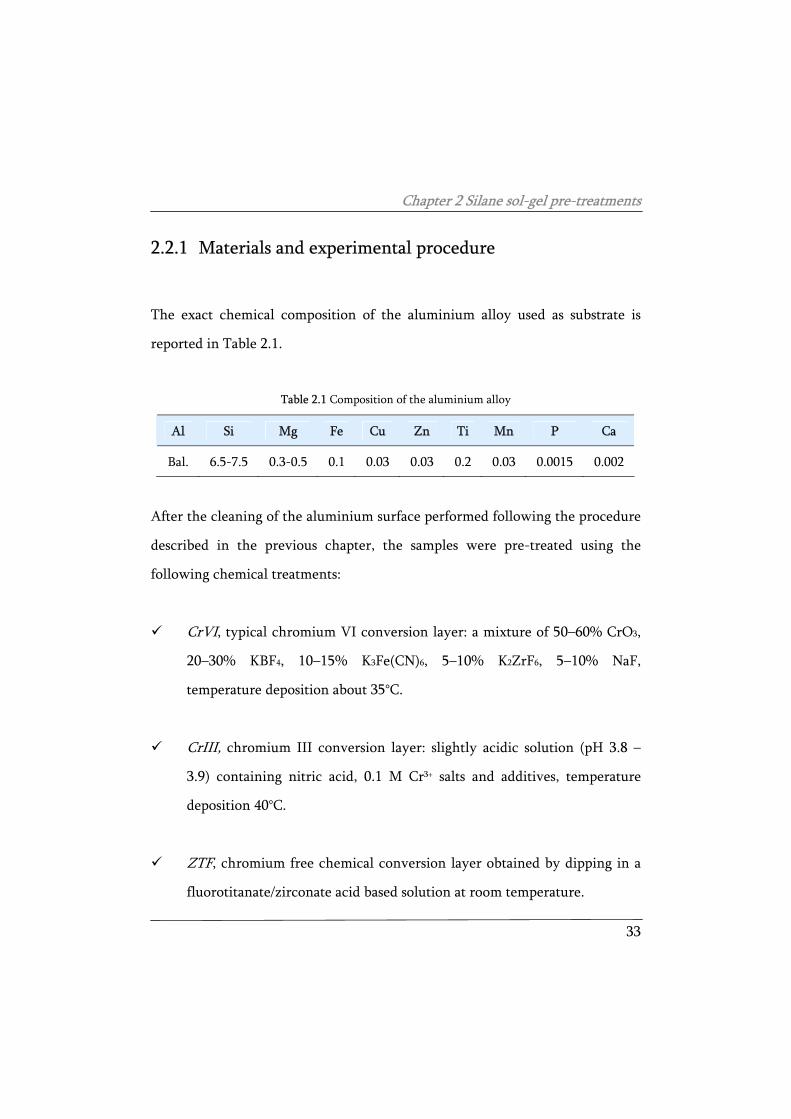
The exact chemical composition of the aluminium alloy used as substrate is
reported in Table 2.1.
Table 2.1 Composition of the aluminium alloy
Al Si Mg Fe Cu Zn Ti Mn P Ca
Bal. 6.5-7.5 0.3-0.5 0.1 0.03 0.03 0.2 0.03 0.0015 0.002
After the cleaning of the aluminium surface performed following the procedure
described in the previous chapter, the samples were pre-treated using the
following chemical treatments:
CrVI, typical chromium VI conversion layer: a mixture of 50–60% CrO3,
20–30% KBF4, 10–15% K3Fe(CN)6, 5–10% K2ZrF6, 5–10% NaF,
temperature deposition about 35°C.
CrIII, chromium III conversion layer: slightly acidic solution (pH 3.8 –
3.9) containing nitric acid, 0.1 M Cr3+ salts and additives, temperature
deposition 40°C.
ZTF, chromium free chemical conversion layer obtained by dipping in a
fluorotitanate/zirconate acid based solution at room temperature.
Chapter 2 Silane sol-gel pre-treatments
34
Silane, hybrid silicon based sol-gel film applied following the previously
described standard procedure: deposition temperature about 20°C and
curing temperature at 120°C.
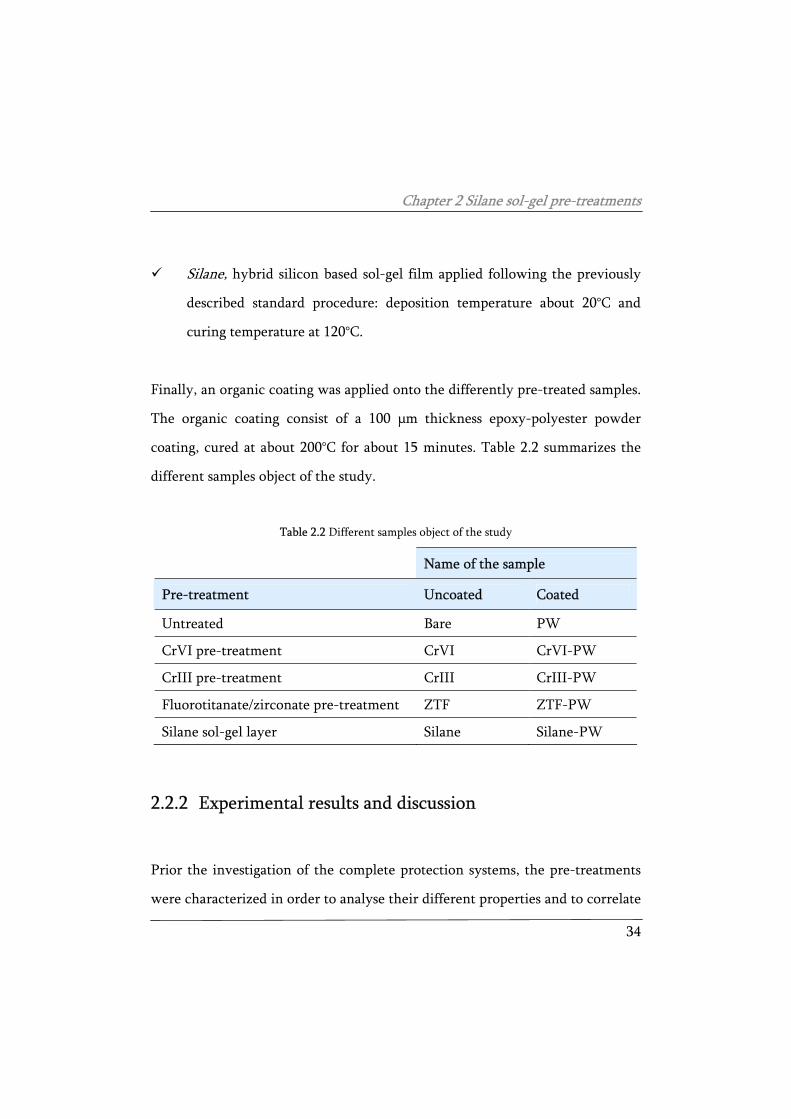
Finally, an organic coating was applied onto the differently pre-treated samples.
The organic coating consist of a 100 μm thickness epoxy-polyester powder
coating, cured at about 200°C for about 15 minutes. Table 2.2 summarizes the
different samples object of the study.
Table 2.2 Different samples object of the study
Name of the sample
Pre-treatment Uncoated Coated
Untreated Bare PW
CrVI pre-treatment CrVI CrVI-PW
CrIII pre-treatment CrIII CrIII-PW
Fluorotitanate/zirconate pre-treatment ZTF ZTF-PW
Silane sol-gel layer Silane Silane-PW
2.2.2 Experimental results and discussion
Prior the investigation of the complete protection systems, the pre-treatments
were characterized in order to analyse their different properties and to correlate
Chapter 2 Silane sol-gel pre-treatments
35
the final performances of the protection cycle to the characteristics of the pre-
treatments.
Pre-treated aluminium alloy samples
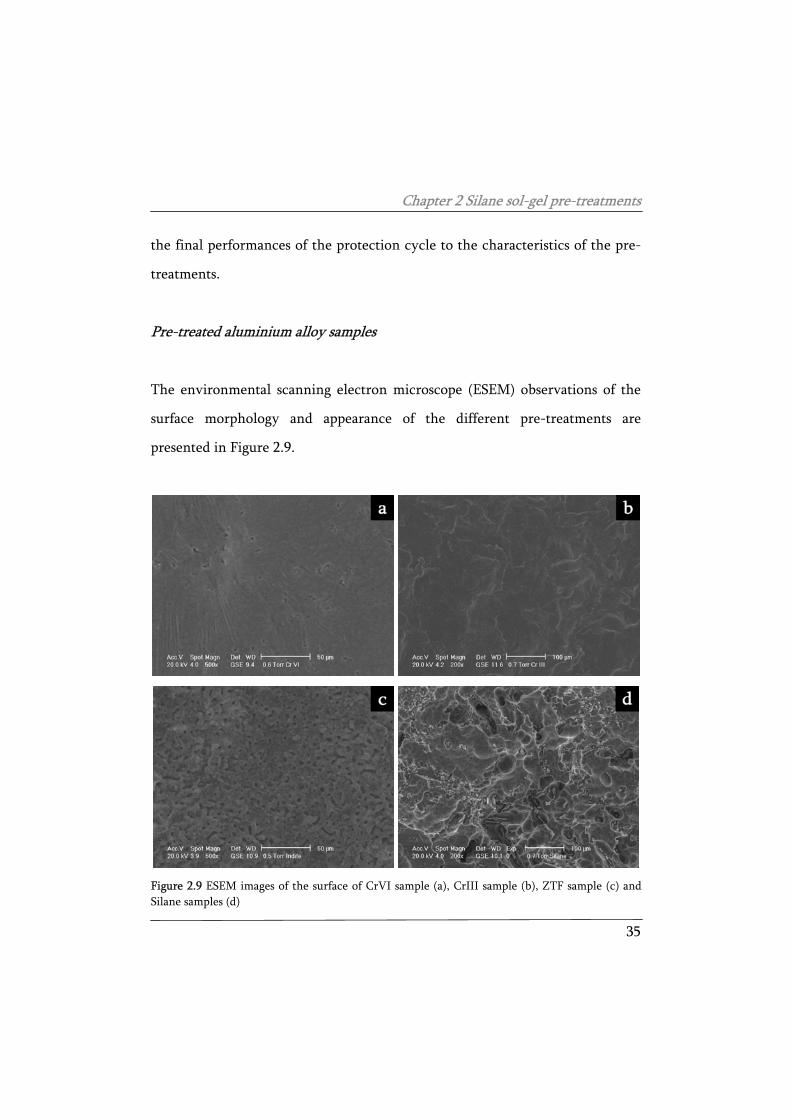
The environmental scanning electron microscope (ESEM) observations of the
surface morphology and appearance of the different pre-treatments are
presented in Figure 2.9.
Figure 2.9 ESEM images of the surface of CrVI sample (a), CrIII sample (b), ZTF sample (c) and Silane samples (d)
Chapter 2 Silane sol-gel pre-treatments
36
The samples pre-treated with chromium baths (CrVI, Figure 2.9a, and CrIII,
Figure 2.9b) show a surface morphology without any evident features, because
of the very limited thickness of the conversion layer. The only visible
heterogeneities are related to the aluminium surface roughness. Different is the
appearance of the other two pre-treatments. The ZTF pre-treatment (Figure
2.9c) shows a rough and apparently porous surface as consequence of the
conversion layer deposition which is able to modify the surface morphology.
Also the silane pre-treatment (Figure 2.9d) modify the surface appearance due
to the presence of the hybrid sol gel film. The silane layer is very thin
(hundreds on nano-meters) and it complies with the surface roughness.
However, a sort of globular structure is observable.
More important is to verify if the pre-treatment is able to give sufficient
protection properties. For this purpose, electrochemical impedance
spectroscopy measurements were performed. A classical three electrodes
arrangement was used. An Ag/AgCl (+0.207 V vs SHE) electrode and a platinum
ring were used as reference and counter electrode, respectively. The frequency
range used for these measurements was from 100 kHz to 10 mHz, while the
signal amplitude was 5 mV. The immersed area was about 15 cm2 and the
testing solution was 3.5w/w% NaCl.
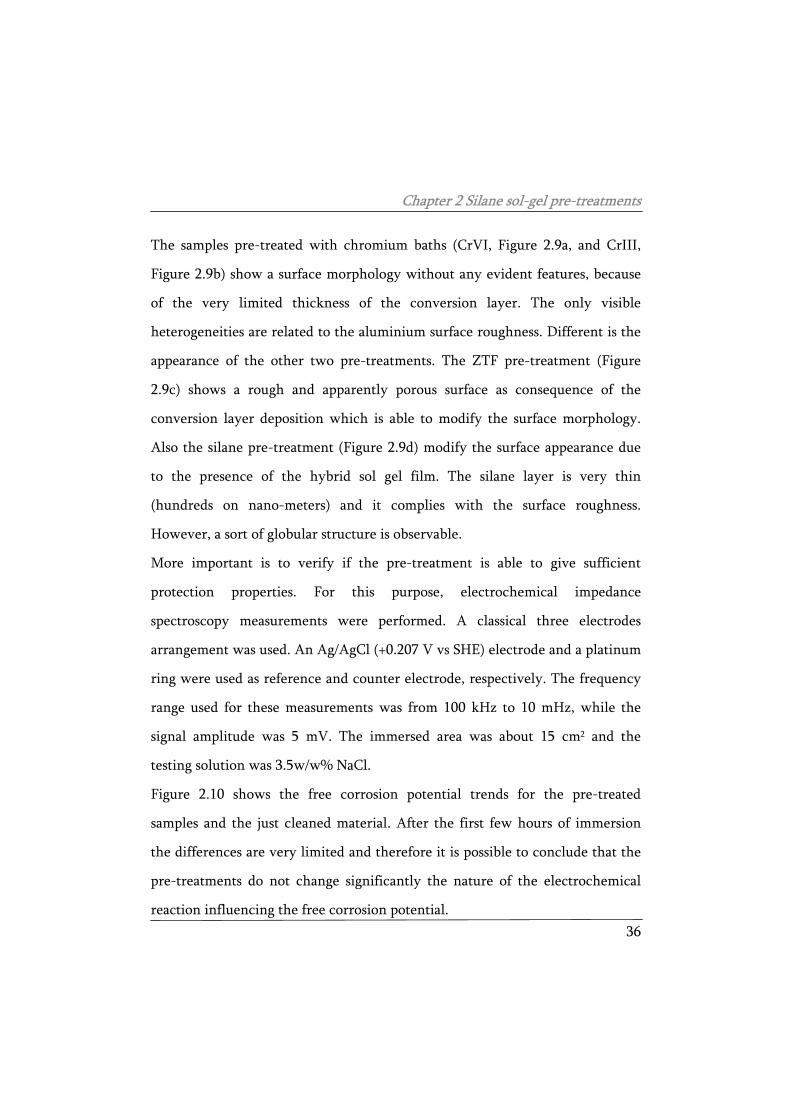
Figure 2.10 shows the free corrosion potential trends for the pre-treated
samples and the just cleaned material. After the first few hours of immersion
the differences are very limited and therefore it is possible to conclude that the
pre-treatments do not change significantly the nature of the electrochemical
reaction influencing the free corrosion potential.
Chapter 2 Silane sol-gel pre-treatments
37
0 10 20 30 40 50-1.0
-0.9
-0.8
-0.7
-0.6
-0.5
Pot
entia
l [V
, vs
Ag/
AgC
l]
Time [Hours]
CrVI Bare Aluminium CrIII Silane ZTF
Figure 2.10 Free corrosion potential trends for the pre-treated samples
More interesting is the analysis of the EIS spectra. For the pre-treated samples,
it was possible to model the EIS data using an equivalent electrical circuit with
two times constant: the first one, at higher frequencies, is related to the surface
layer contribution (i.e. the contribution to the total impedance due to the
conversion layer or silane layer) together with the presence of possible
corrosion products [96]. The second one, at lower frequencies, can be attributed
to the corrosion reaction (the electrochemical reaction at the metal surface can
be modelled using a resistance, the charge transfer resistance and a capacitance,
the double layer capacitance) [97].
Chapter 2 Silane sol-gel pre-treatments
38
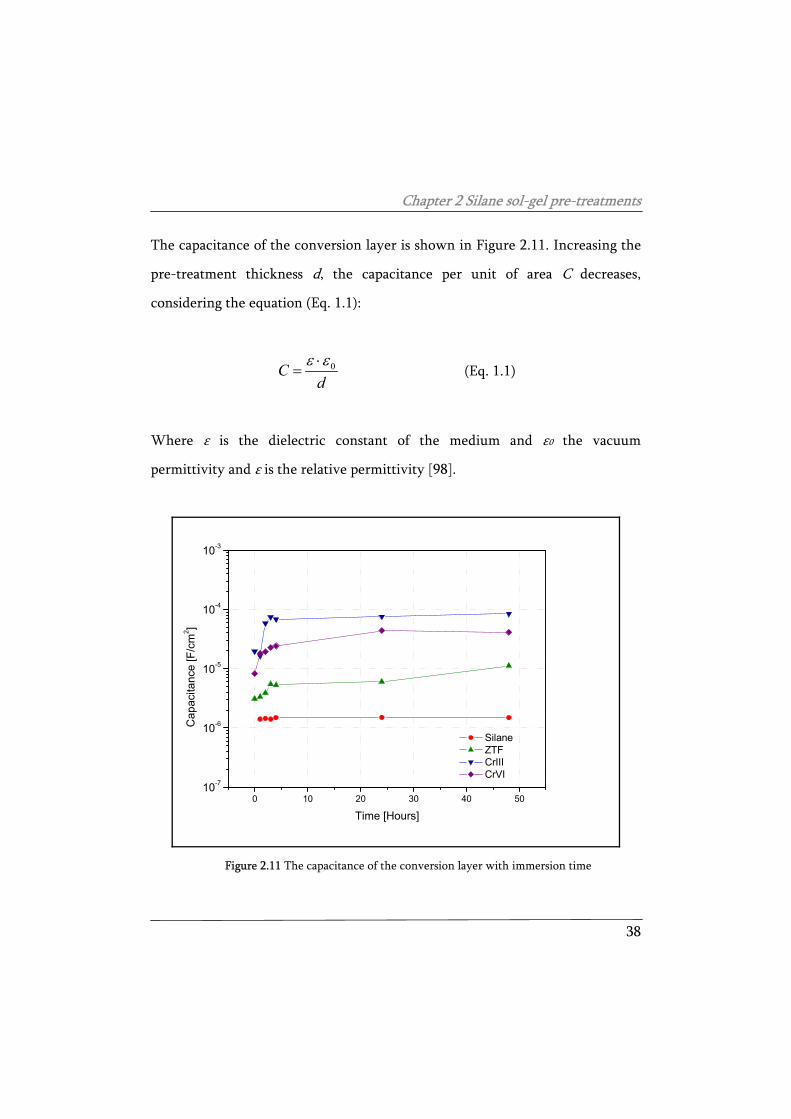
The capacitance of the conversion layer is shown in Figure 2.11. Increasing the
pre-treatment thickness d, the capacitance per unit of area C decreases,
considering the equation (Eq. 1.1):
0Cd
ε ε⋅= (Eq. 1.1)
Where ε is the dielectric constant of the medium and ε0 the vacuum
permittivity and ε is the relative permittivity [98].
0 10 20 30 40 5010-7
10-6
10-5
10-4
10-3
Cap
acita
nce
[F/c
m2 ]
Time [Hours]
Silane ZTF CrIII CrVI
Figure 2.11 The capacitance of the conversion layer with immersion time
Chapter 2 Silane sol-gel pre-treatments
39
The pre-treatments with the supposed higher thickness are the silane pre-
treatment and the conversion layer ZTF (see also the microstructure in Figure
2.9). These pre-treatments shows the lower capacitance values, while the CrIII
and CrVI pre-treatments show capacitance values quite close to bare metal,
proving the presence of a very thin conversion layer. In the literature the
typical thickness of these layers is a few decade of nanometres [99], while in the
case of silane layer the thickness is at least hundred of nanometres [100].
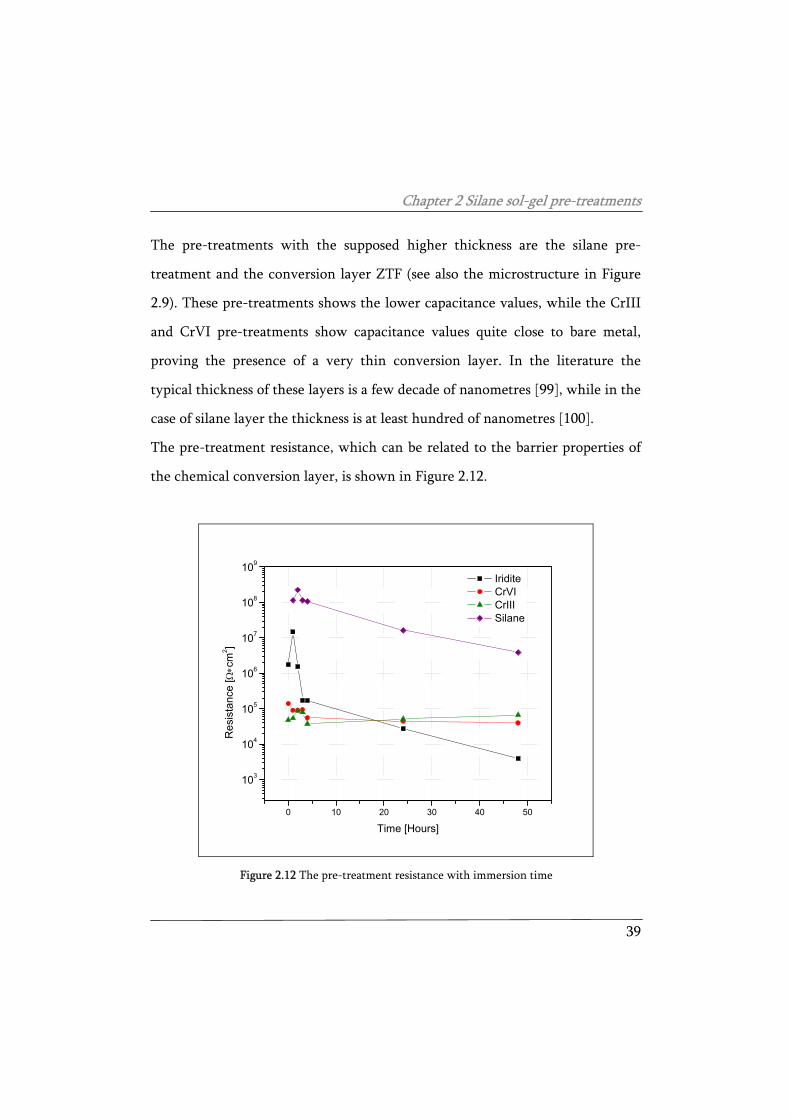
The pre-treatment resistance, which can be related to the barrier properties of
the chemical conversion layer, is shown in Figure 2.12.
0 10 20 30 40 50
103
104
105
106
107
108
109
Res
ista
nce
[Ω∗c
m2 ]
Time [Hours]
Iridite CrVI CrIII Silane
Figure 2.12 The pre-treatment resistance with immersion time
Chapter 2 Silane sol-gel pre-treatments
40
The behaviour of all the pre-treatments, not considering the silane layer, is very
similar. Only the pre-treatment ZTF, probably because of the layer thickness
and microstructure, shows relevant temporary barrier properties just for short
immersion time. On the contrary, the silane layer shows important barrier
properties, reducing with the immersion time. The coating resistance of the
silane pre-treatment reaches about 107 Ω·cm2 after 2 days of immersion in the
testing solution.
The conclusion of this preliminary pre-treatments characterisation is that silane
layer shows the better corrosion protection performances respect to the other
pre-treatments. It has to be underlined that the silane sol-gel coating is really
thicker than the other pre-treatments, but, however, the protection
performances of this conversion treatment remains very interesting in the light
of the high absolute values of the resistance (showed in Figure 2.12). The sol-gel
film provides the metal with an efficient barrier against water and ions,
dramatically slowing down the corrosion rate.
Pre-treated aluminium alloy covered with the organic coating
The samples covered with the organic coating were investigated by means of
electrochemical impedance spectroscopy. All the studied complete protective
cycles showed very high impedance values (higher than 1010 Ω·cm2) because of
the very good barrier properties of the organic coating systems and the high
thickness. The degradation time for these systems is, therefore, very long in our
testing conditions. In order to obtain earlier corrosion information accelerating
Chapter 2 Silane sol-gel pre-treatments
41
the degradation process and in order to better highlight the pre-treatment
influence, we produced an artificial defect (scratch) in the coating, promoting
the system degradation [101]. In particular, it is possible to monitor the
delamination of the coating starting from the defect and quantify the interface
stability induced by the pre-treatment. The measurements arrangement of the
electrodes as well as the electrolyte were the same used for the surface
conversion treatments. The experimental spectra were acquired and modelled
in order to determine the suitable electrochemical data.
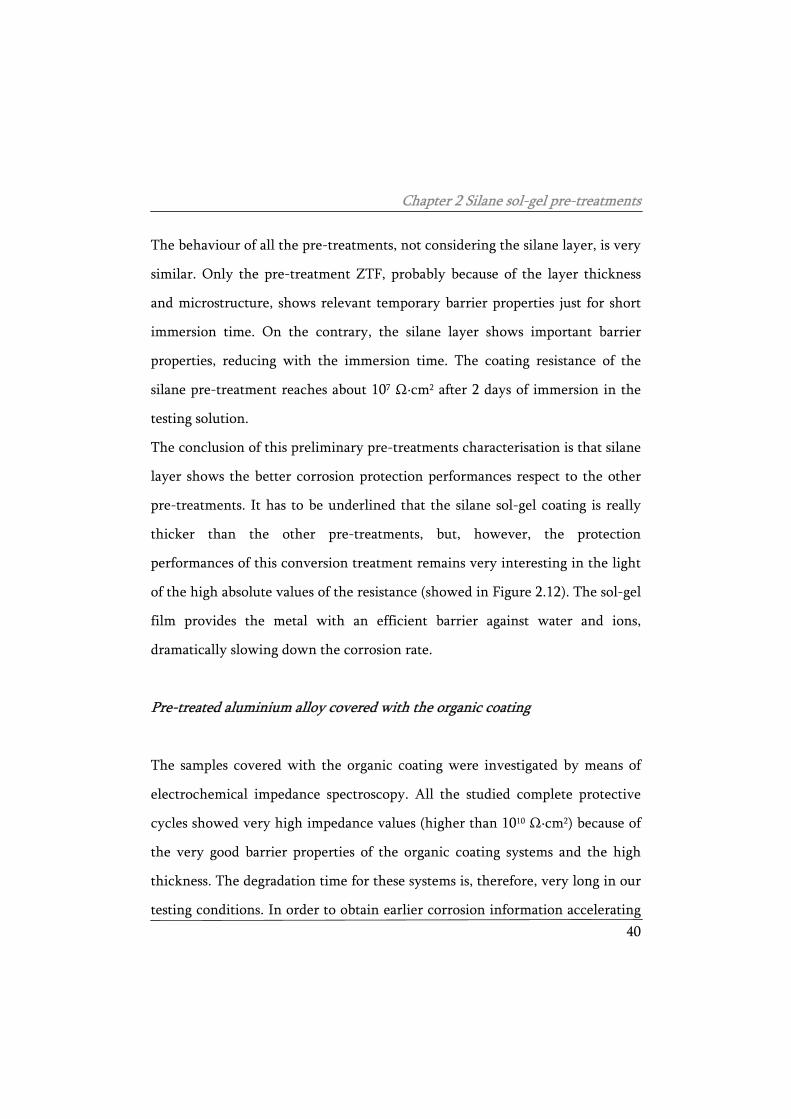
The equivalent electrical circuit for the modelling of our system is shown in
Figure 2.13 where, in addition to the coating capacitance Qc and the coating
resistance Rp (the contribution of the organic coatings to the total impedance
which is in this case very low because of the artificial defect), a second time
constant related to the faradic reaction is visible with the double layer
capacitance Qdl and charge transfer resistance Rct [102].
Rc
Qdl
Rct
Q c
Re
a
Figure 2.13 Equivalent electrical circuit used for the modelling of the experimental spectra
Chapter 2 Silane sol-gel pre-treatments
42
Because of the artificial defect, damaging also the surface pre-treatment, the
chemical conversion layer and the silane sol-gel pre-treatment are not
detectable any more in the EIS data and, therefore, they are not included in the
equivalent electrical model.
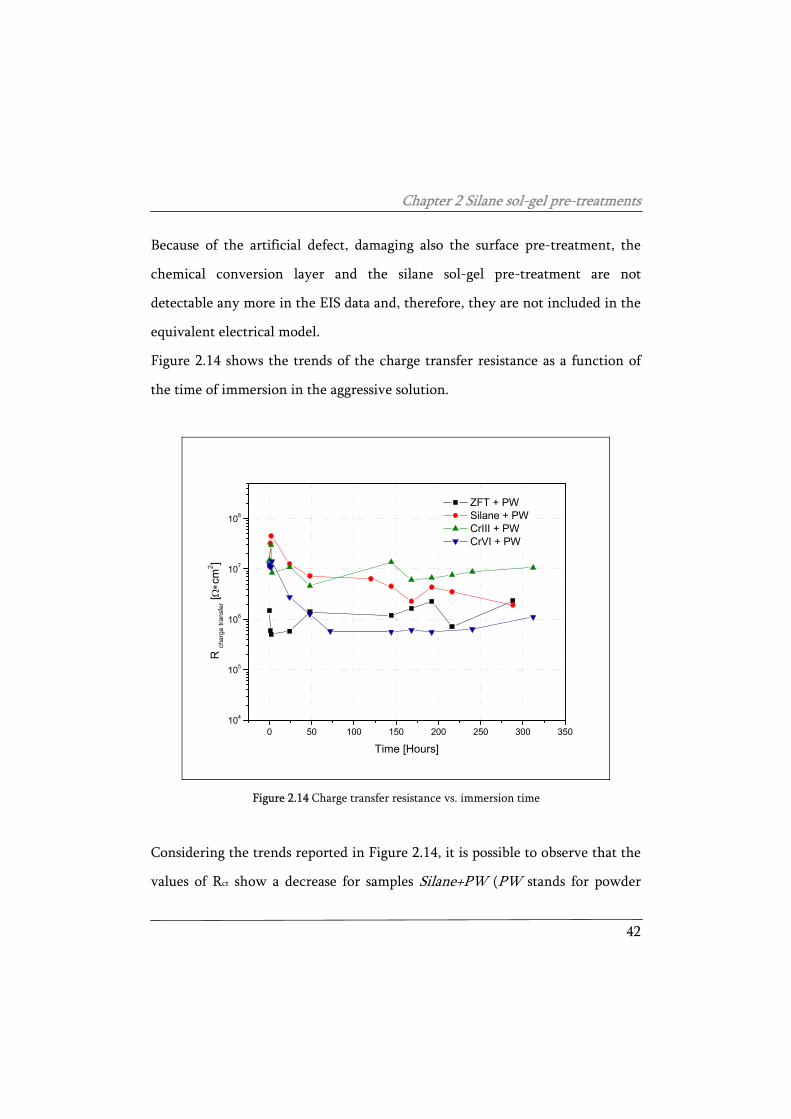
Figure 2.14 shows the trends of the charge transfer resistance as a function of
the time of immersion in the aggressive solution.
0 50 100 150 200 250 300 350104
105
106
107
108
R ch
arge
tran
sfer [Ω
∗cm
2 ]
Time [Hours]
ZFT + PW Silane + PW CrIII + PW CrVI + PW
Figure 2.14 Charge transfer resistance vs. immersion time
Considering the trends reported in Figure 2.14, it is possible to observe that the
values of Rct show a decrease for samples Silane+PW (PW stands for powder
Chapter 2 Silane sol-gel pre-treatments
43
coating)and CrVI+PW while samples CrIII+PW and ZTF+PW maintain a stable
value of this parameter.
After the initial scattering (about 50 hours of testing) of the experimental data
of the Rct values due to the activation of the corrosion reaction, an almost
stationary condition is reached. The highest Rct values, related to lower
corrosion rate, are measured on CrIII and silane pre-treatments, while the
highest corrosion rate is measured on CrVI samples despite the corrosion
inhibition action of these kinds of materials. The silane sol-gel pre-treatment
shows the higher starting values of the charge transfer resistance, which is
inversely proportional to the corrosion rate [103]. More interesting to
discriminate the different effectiveness of the pre-treatments is the analysis of
the double layer capacitance (Qdl). This parameter is directly proportional to the
extent of the metal surface in contact with the electrolyte. Thus, the double
layer capacitance can be considered as an indicator for monitoring the stability
of the metal-coating interface. In fact, as a consequence of the corrosion
reactions, the coating can delaminate from the scratch, allowing the electrolyte
to wet the metal surface. The ratio between the double layer capacitance after a
certain time of immersion (Qdlx) and the initial double layer capacitance (Qdl0) is
an indication of the increase of wetted metal surface and therefore it measures
the loss of adhesion of the coating [104].
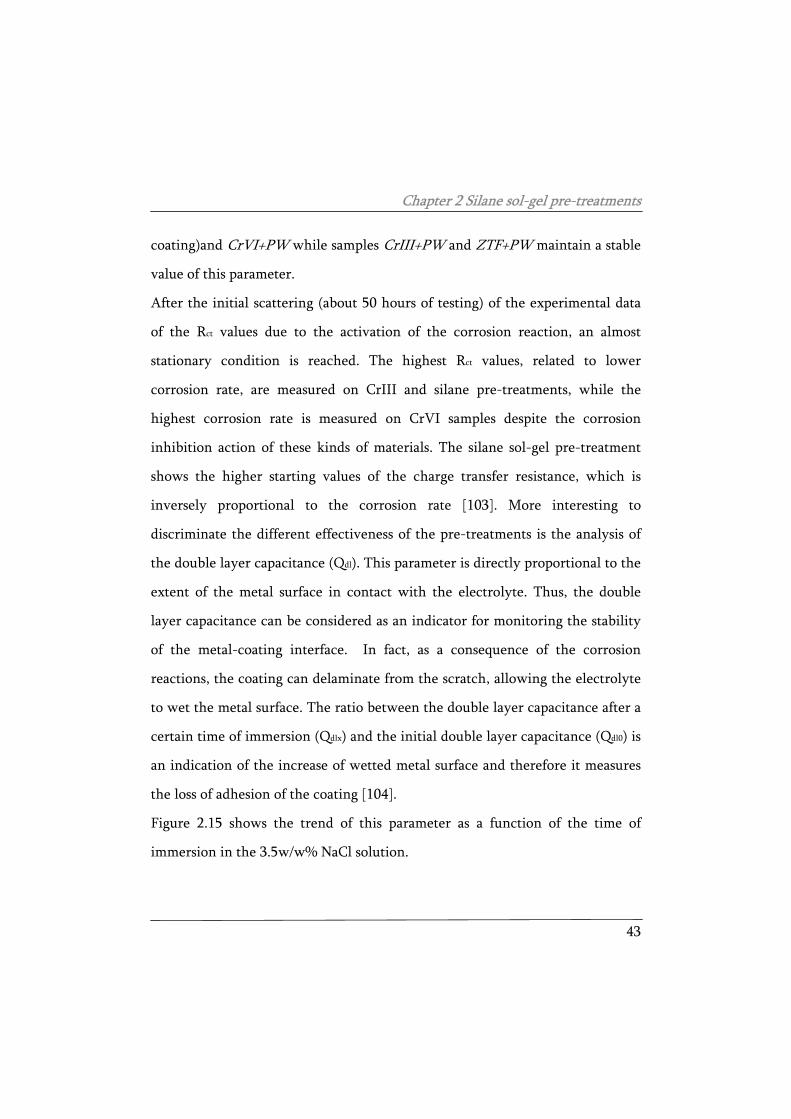
Figure 2.15 shows the trend of this parameter as a function of the time of
immersion in the 3.5w/w% NaCl solution.
Chapter 2 Silane sol-gel pre-treatments
44
0 50 100 150 200 250 300 35010-2
10-1
100
101
102
103
Qdl
x/Qdl
o
Time [Hours]
ZTF + PW Silane + PW CrIII + PW CrVI + PW
Figure 2.15 Qx/Q0 with time of immersion
CrIII and ZTF pre-treatments show a very high adhesion stability being the
delamination process almost negligible. A very limited delamination was
measured in the case of silane layers, while the only pre-treatment showing a
relevant delamination is the pre-treatment CrVI. It is important to remember
that the pre-treatments based on chromates (CrVI) have certain solubility for
leaching the Cr6+ ions able to favour the surface passivation and therefore they
are intrinsically less stable in aqueous solutions. However, the values of the
double layer capacitance for the CrVI treated sample are quite high for this kind
of pre-treatment. It is likely that the conversion layer is particularly thin
compared to the other pre-treatments and, consequently, less efficient.
Chapter 2 Silane sol-gel pre-treatments
45
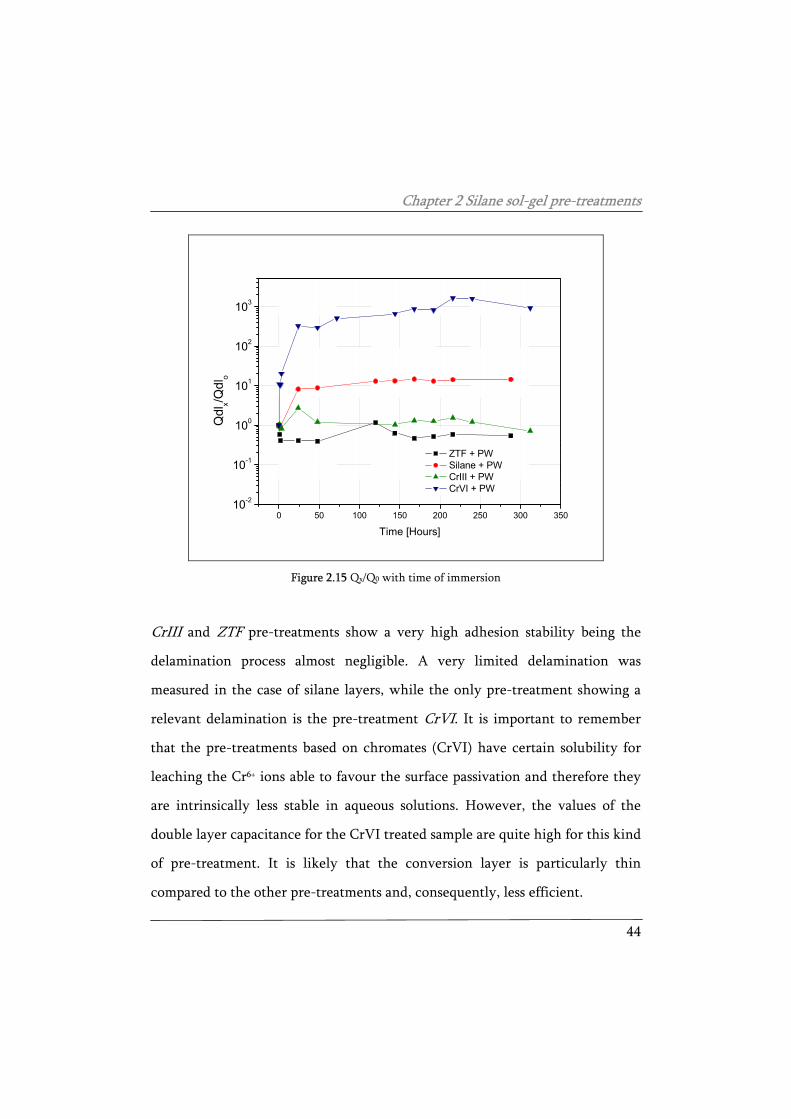
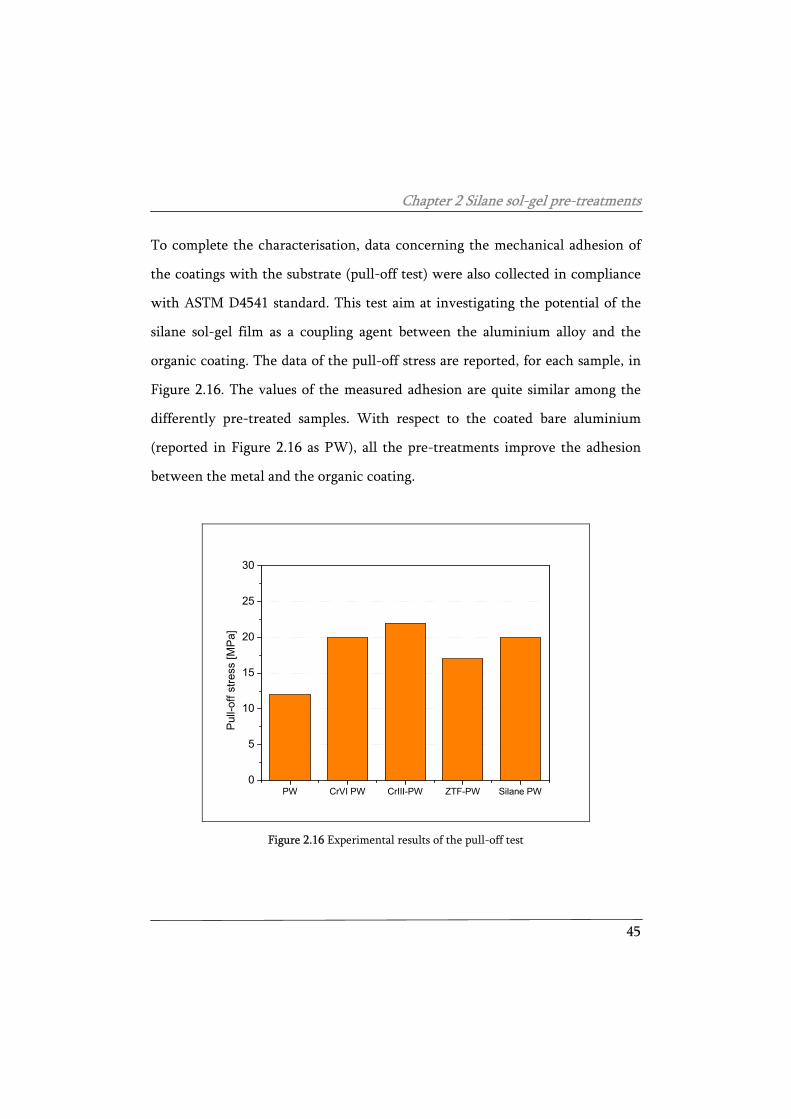
To complete the characterisation, data concerning the mechanical adhesion of
the coatings with the substrate (pull-off test) were also collected in compliance
with ASTM D4541 standard. This test aim at investigating the potential of the
silane sol-gel film as a coupling agent between the aluminium alloy and the
organic coating. The data of the pull-off stress are reported, for each sample, in
Figure 2.16. The values of the measured adhesion are quite similar among the
differently pre-treated samples. With respect to the coated bare aluminium
(reported in Figure 2.16 as PW), all the pre-treatments improve the adhesion
between the metal and the organic coating.
PW CrVI PW CrIII-PW ZTF-PW Silane PW0
5
10
15
20
25
30
Pul
l-off
stre
ss [M
Pa]
Figure 2.16 Experimental results of the pull-off test
Chapter 2 Silane sol-gel pre-treatments
46
CrIII, CrVI and Silane pre-treatments show high and very comparable values of
the adhesion, while ZTF pre-treatment shows a lower value. However, in
general the adhesion values are quite good for all the materials, being not lower
than 10 MPa.
Observe that great difference between the results of the interfacial stability
during corrosion process (Figure 2.15) and the values of the dry adhesion
(Figure 2.16). The differences in pull-off measurements are very limited and the
pronounced differences among the samples visible in Figure 2.15 are not
reproduced (CrVI pull-off values are actually higher than the values of ZTF pre-
treatment). This fact is not unusual, proving that the two experimental
approaches are different, being the dry adhesion test different from the
adhesion stability evaluated in wet environments. It is possible to conclude that
the dry pull-off measurements are not sufficient to characterise the adhesion
stability.
A further way to test the stability of the polymer/metal interface (the adhesion
of the organic coating in wet condition and under active electrochemical
reaction), is the anodic delamination. The application of an anodic potential
increases the aluminium substrate activity (corrosion) promoting the anodic
undermining process [105]. In practice, a 25mm long scratch was performed on
the intact samples. Also in this case, the electrolyte and the arrangement were
the same discussed for EIS measurement. The samples were polarized at -200
mV vs. Ag/AgCl (+207 vs. SHE) for 240 hours. This particular value of the
potential can represent a real situation when a galvanic coupling of the
aluminium component with a nobler metal (such as stainless steel) occurs in
Chapter 2 Silane sol-gel pre-treatments
47
service. In fact, in this case the corrosion process is forced by the coupling of
the two metals with different potential. After the polarization period, the extent
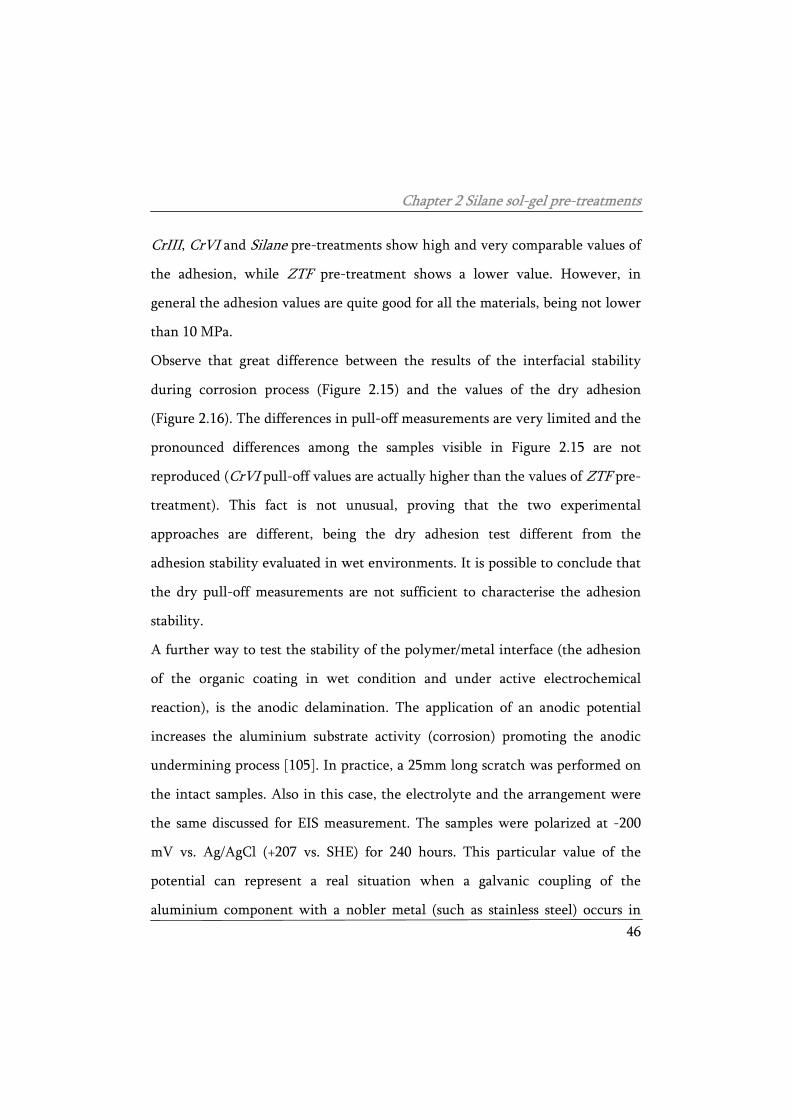
of the produced defect was measured for each sample. For example, Figure 2.17
(a,b) shows the appearance of the sample ZTF+PW (a) and Silane+PW (b) after
240 hours of anodic polarisation.
Figure 2.17 . ZTF+PW (a) and Silane+PW (b) after 240 hours of anodic polarisation @ -200mV (vs. Ag/AgCl)
The coating and metal degradation around the defect is evident, showing the
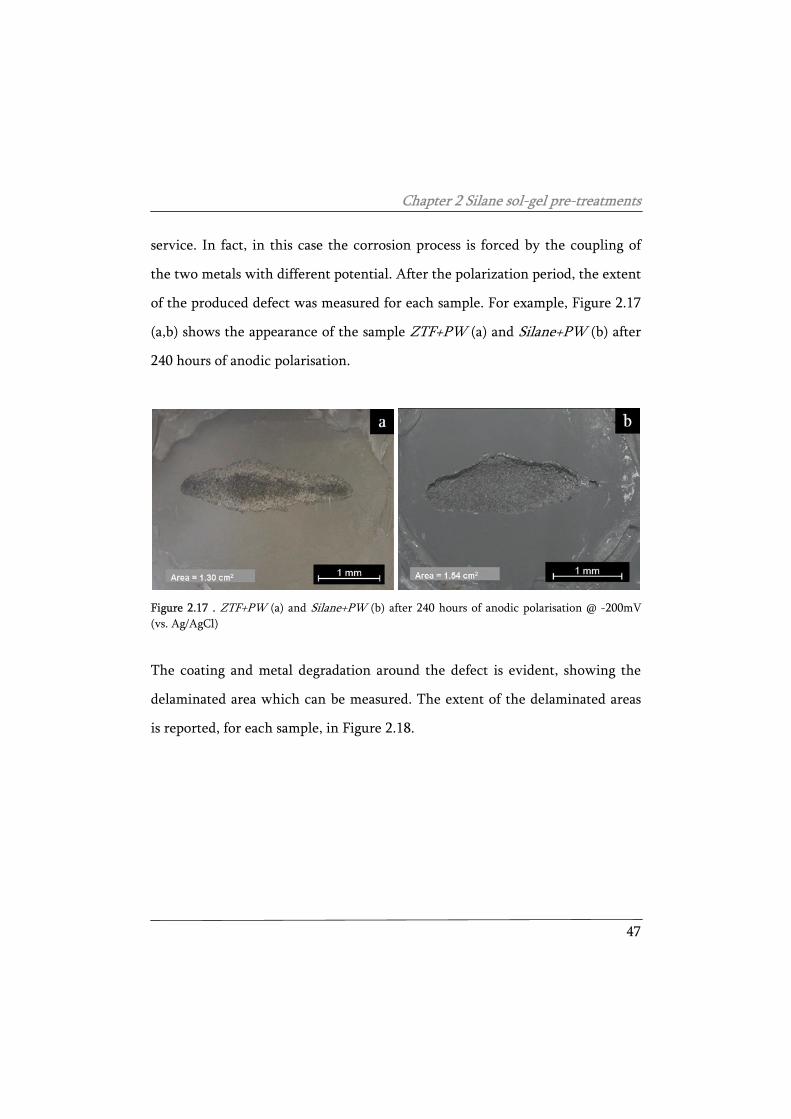
delaminated area which can be measured. The extent of the delaminated areas
is reported, for each sample, in Figure 2.18.
Chapter 2 Silane sol-gel pre-treatments
48
Cr VI + PW Silane + PW ZTF + PW Cr III + PW0.0
0.5
1.0
1.5
2.0
2.5
3.0
3.5
Mea
sure
d A
rea
[cm
2 ]
Figure 2.18 . The extent of the delaminated areas after 240 hours of anodic polarisation @ -200mV (vs. Ag/AgCl)
The lowest delamination is shown by the samples pre-treated with ZTF or
Silane layers, while a higher, even if limited, delamination was measured for
the Cr based pre-treatments. The corrosion properties of the differently pre-
treated aluminium samples were finally evaluated by means of exposure in the
salt spray chamber, performed in compliance with the ASTM B117 standard.
The aim of this test is to obtain experimental data easy to compare with other
materials characterisation and to confirm, using an industrial test, the corrosion
performance of the studied systems obtained by the previously discussed
electrochemical tests. Scratched samples were exposed in the salt spray chamber
and the samples were considered deteriorated when the average linear
detachment of the coating from the scratch was about 5 mm. Table 2.3
Chapter 2 Silane sol-gel pre-treatments
49
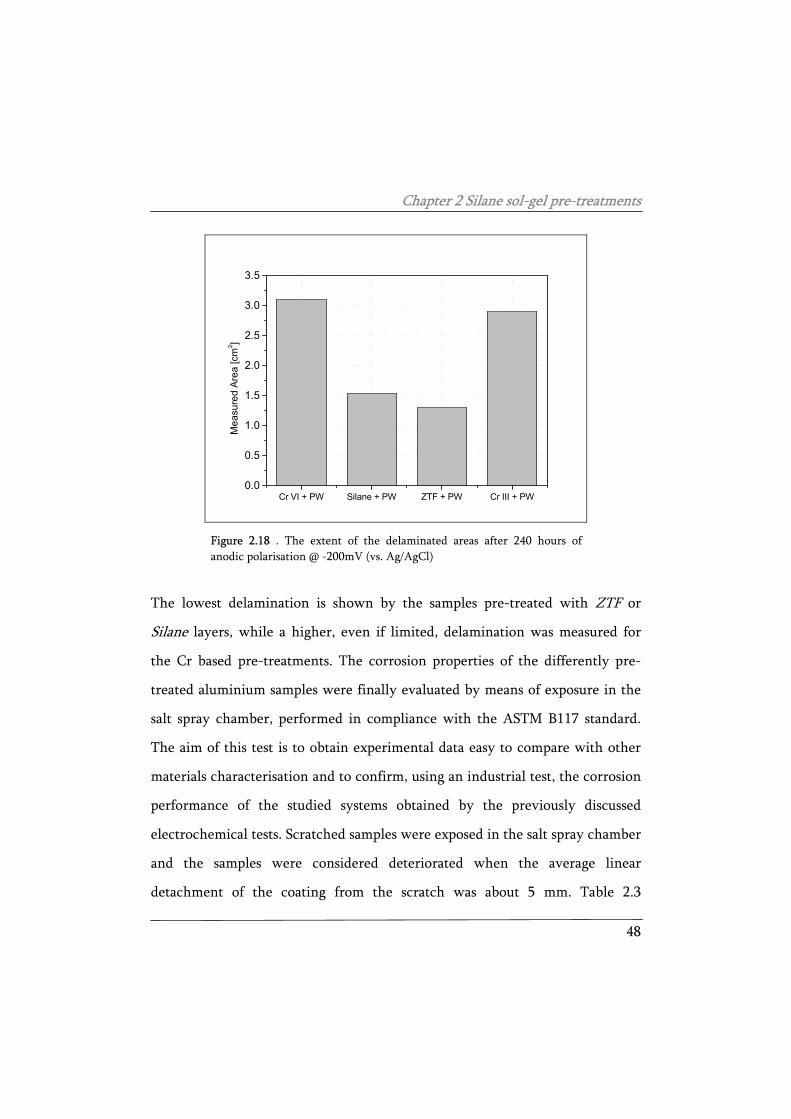
summarizes the experimental results of the resistance in the salt spray chamber.
In order to quantitatively estimate the wet adhesion, the threshold of 5 mm of
disbonding (starting from the artificial defect) was set to consider no more
protective the coating.
Table 2.3 Salt spray chamber results
Sample Resistance (hours)
CrVI+PW >2500
CrIII+PW 1500
ZTF+PW 1500
Silane+PW 2200
All the different samples show a good resistance in the salt spray chamber. The
sample pre-treated with the CrVI conversion treatment shows the higher
resistance, followed by the silane sol-gel treated sample. CrIII and ZTF treated
samples shows the lowest resistances among the different samples, despite the
absolute values are, actually, high.
2.2.3 Comments
The aim of this chapter was to compare the effectiveness of the sol-gel film
produced starting from an innovative and experimental mixture of silane
molecules with other traditional pre-treatments. For this purpose, the corrosion
Chapter 2 Silane sol-gel pre-treatments
50
protection properties and the potential as coupling agent of the experimental
silane sol-gel film was compared with other traditional pre-treatments for
aluminium. The tests performed on the aluminium alloy samples investigated a
few properties of the different combination of pre-treatment and coating, such
as adhesion, stability of the interface and barrier properties. The experimental
measurements proved that silane sol-gel films provide a good corrosion
protection of the substrate, even in the absence of the organic coating, in
consideration of the fact that it is just a few hundreds of nanometers thick. In
addition, the experimental measurements highlighted that they act as a
coupling agent. In fact, the silane sol-gel coating provide good adhesion
properties between the metal and the organic coating both in dry (see pull-off
test, Figure 2.16) and wet (see salt spray test, Table 2.3) conditions.
2.3 Development of silane sol-gel films for duplex
systems
In the previous section the efficiency of the silane sol-gel film produced from
the experimental mixture was proved to be comparable or higher than other
traditional pre-treatment on an aluminium alloy. In this chapter, this same
silane sol-gel layer (of proved effectiveness) was investigated as a pre-treatment
for the development of high performance duplex systems for the protection of
steel structure. A duplex system consists of a fine combination of a zinc metallic
Chapter 2 Silane sol-gel pre-treatments
51
coating, a galvanization, to protect the steel and an organic coating to protect
the whole structure. In particular, the corrosion performances of hot dip
galvanized steel treated with silane molecules and covered with an organic
coating were analyzed. The aim is to develop a corrosion resistant protection
system consisting of only “environmentally friendly” elements.
For this purpose, besides using silanes pre-treatments instead of chromates,
galvanization bath contains no lead, considered dangerous for human health
and the environment [106]. The organic coating was applied on the galvanized
and pre-treated by means of two different environmentally friendly techniques
which prevent problems due to volatile organic compounds (VOCs). As
anticipated in the previous section, these techniques are powder coating
painting and cataphoretic coating painting. As cited many times, the silane
solution is completely water based and, therefore, no organic solvent is present.
Because of the experimental nature of the silane mixture, a commercial water
based silane pre-treatment was used for comparison. In addition, a common
industrial pre-treatment such as fluozirconate conversion treatment was applied
for a further comparison, in order to have a complete overview of the different
performances of the different pre-treatments.
In the first part of chapter the properties of the silane sol-gel layers applied onto
galvanized steel surfaces were investigated. In the second part the analysis and
characterization of the complete protection system considering the two
different organic coatings were carried out. Concerning the cataphoretic
electrodeposition, a preliminary study on the compatibility between the
Chapter 2 Silane sol-gel pre-treatments
52
electrodeposition process and the silane film was performed and it is reported
for comprehensiveness.
The characterization of the corrosion protection performances of the complete
protection system and the analysis of the silane pre-treatment as neat were
performed by means of chemical and electrochemical techniques (FT-IR, ToF-
Sims, XPS, EIS, potentiodynamic polarization), accelerated laboratory tests (salt
spray chamber, cathodic polarization) and observations with environmental
scanning electron microscope (ESEM). The properties of the different silane
layers were underlined and the corrosion protection properties of the complete
system were analyzed and discussed.
2.3.1 Materials and experimental procedure
Hot dip galvanized steel sheets (Zn alloy: 0.25 w/w% Al, supplied by Arcelor
Mittal, Belgium) with a mean roughness of 1.59 μm were used as substrate for
the development of the duplex systems.
After the cleaning of the galvanized steel substrate performed following the
previously discussed procedure, the samples were pre-treated using the
following chemical treatments:
Silane mixture sol-gel film applied following the standard procedure at
about 20°C and 40% r.h.. The effect of the curing temperature was
Chapter 2 Silane sol-gel pre-treatments
53
investigated: the fresh films were cured at two different temperatures, 120
and 180°C, for about 20 minutes.
A commercial water-based silane, SIVO® silane (supplied by Degussa),
whose composition is patented. The dilution is 10 w/w% in water. No
modification of the pH of the solution was performed (product
specification). Also this solution was stirred for 1 hour before the dipping
of the galvanized samples. The heat treatment was performed at 120°C for
15 minutes in compliance with the product specification.
A fluozirconate treatment obtained by dipping the galvanized sample into
a solution containing an acid solution of HF and ZrO2 compounds at room
temperature. This treatment provides the formation of a protective film of
hydrated compounds of fluorine, zinc, zirconium and oxygen on the zinc
surface.
Two kinds of organic coatings were applied onto the pre-treated samples:
an about 70 μm thick epoxy-polyester powder coating (supplied by
Pintarelli s.r.l., Italy) cured at about 210°C for 15 minutes;
an about 20 μm thick lead free epoxy cataphoretic electro-coating
(supplied by PPG, France) obtained applying 180V for 3 minutes between
the target and a stainless steel electrode at a bath temperature of 30°C.
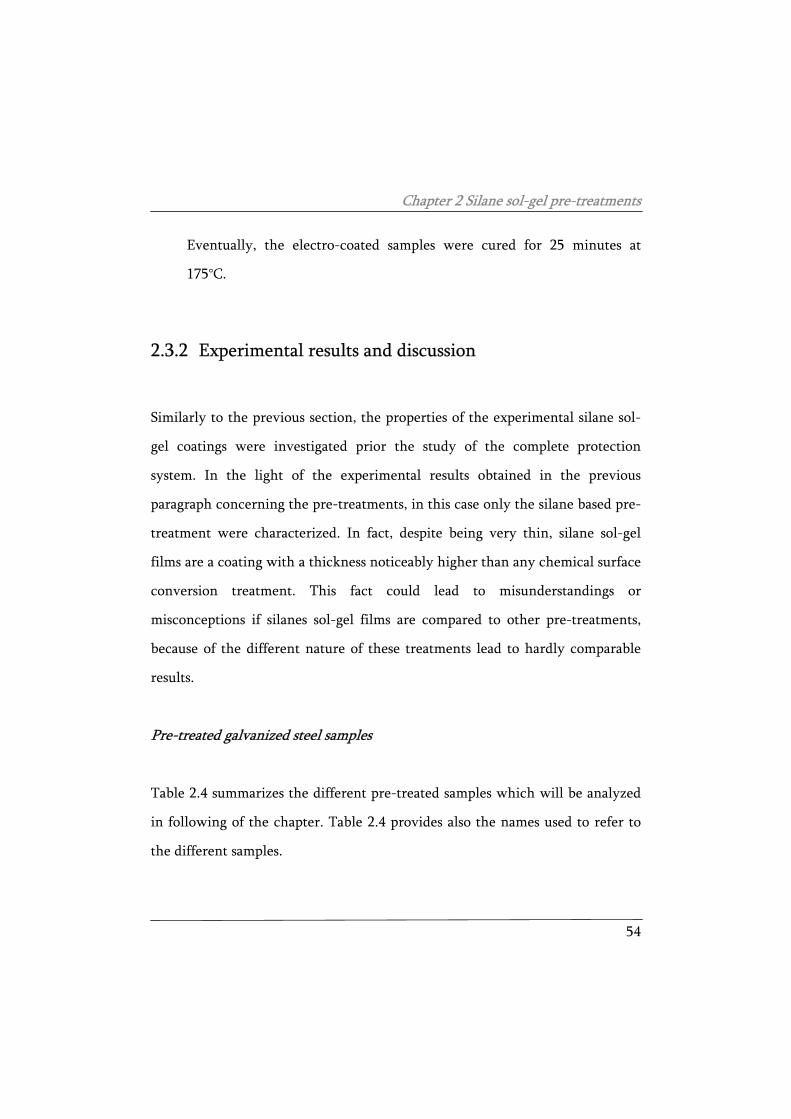
Chapter 2 Silane sol-gel pre-treatments
54
Eventually, the electro-coated samples were cured for 25 minutes at
175°C.
2.3.2 Experimental results and discussion
Similarly to the previous section, the properties of the experimental silane sol-
gel coatings were investigated prior the study of the complete protection
system. In the light of the experimental results obtained in the previous
paragraph concerning the pre-treatments, in this case only the silane based pre-
treatment were characterized. In fact, despite being very thin, silane sol-gel
films are a coating with a thickness noticeably higher than any chemical surface
conversion treatment. This fact could lead to misunderstandings or
misconceptions if silanes sol-gel films are compared to other pre-treatments,
because of the different nature of these treatments lead to hardly comparable
results.
Pre-treated galvanized steel samples
Table 2.4 summarizes the different pre-treated samples which will be analyzed
in following of the chapter. Table 2.4 provides also the names used to refer to
the different samples.
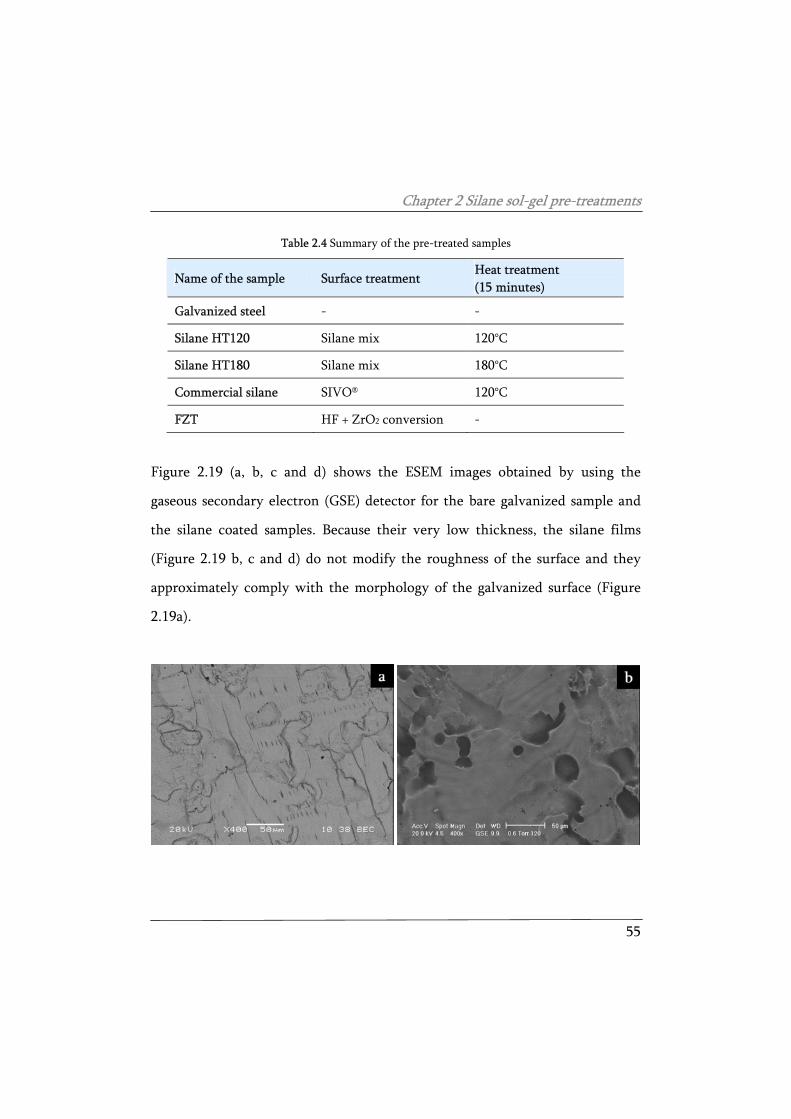
Chapter 2 Silane sol-gel pre-treatments
55
Table 2.4 Summary of the pre-treated samples
Name of the sample Surface treatment Heat treatment (15 minutes)
Galvanized steel - -
Silane HT120 Silane mix 120°C
Silane HT180 Silane mix 180°C
Commercial silane SIVO® 120°C
FZT HF + ZrO2 conversion -
Figure 2.19 (a, b, c and d) shows the ESEM images obtained by using the
gaseous secondary electron (GSE) detector for the bare galvanized sample and
the silane coated samples. Because their very low thickness, the silane films
(Figure 2.19 b, c and d) do not modify the roughness of the surface and they
approximately comply with the morphology of the galvanized surface (Figure
2.19a).
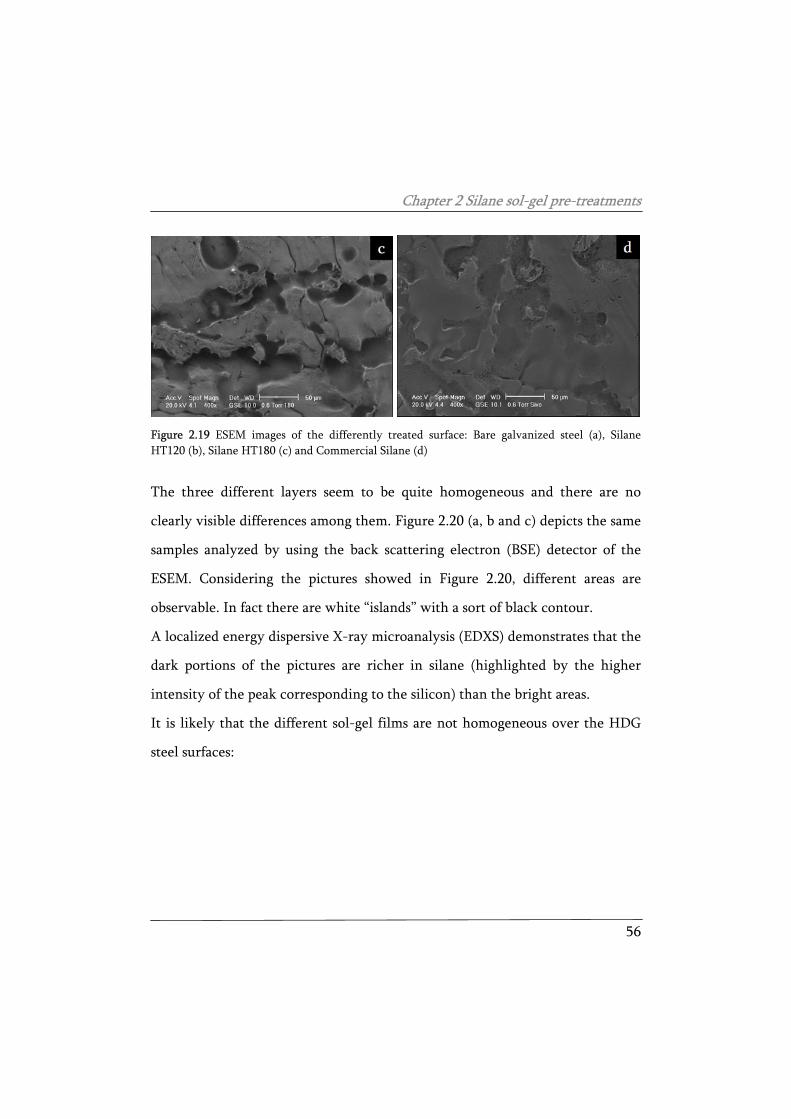
Chapter 2 Silane sol-gel pre-treatments
56
Figure 2.19 ESEM images of the differently treated surface: Bare galvanized steel (a), Silane HT120 (b), Silane HT180 (c) and Commercial Silane (d)
The three different layers seem to be quite homogeneous and there are no
clearly visible differences among them. Figure 2.20 (a, b and c) depicts the same
samples analyzed by using the back scattering electron (BSE) detector of the
ESEM. Considering the pictures showed in Figure 2.20, different areas are
observable. In fact there are white “islands” with a sort of black contour.
A localized energy dispersive X-ray microanalysis (EDXS) demonstrates that the
dark portions of the pictures are richer in silane (highlighted by the higher
intensity of the peak corresponding to the silicon) than the bright areas.
It is likely that the different sol-gel films are not homogeneous over the HDG
steel surfaces:
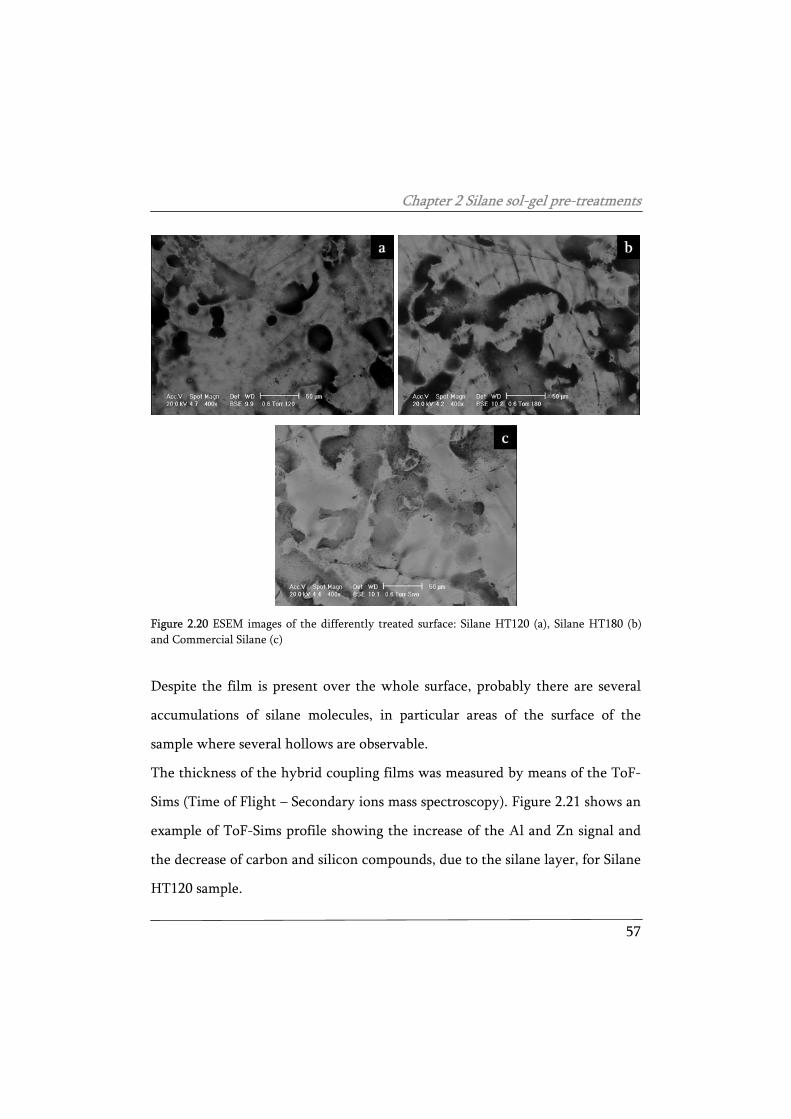
Chapter 2 Silane sol-gel pre-treatments
57
Figure 2.20 ESEM images of the differently treated surface: Silane HT120 (a), Silane HT180 (b) and Commercial Silane (c)
Despite the film is present over the whole surface, probably there are several
accumulations of silane molecules, in particular areas of the surface of the
sample where several hollows are observable.
The thickness of the hybrid coupling films was measured by means of the ToF-
Sims (Time of Flight – Secondary ions mass spectroscopy). Figure 2.21 shows an
example of ToF-Sims profile showing the increase of the Al and Zn signal and
the decrease of carbon and silicon compounds, due to the silane layer, for Silane
HT120 sample.
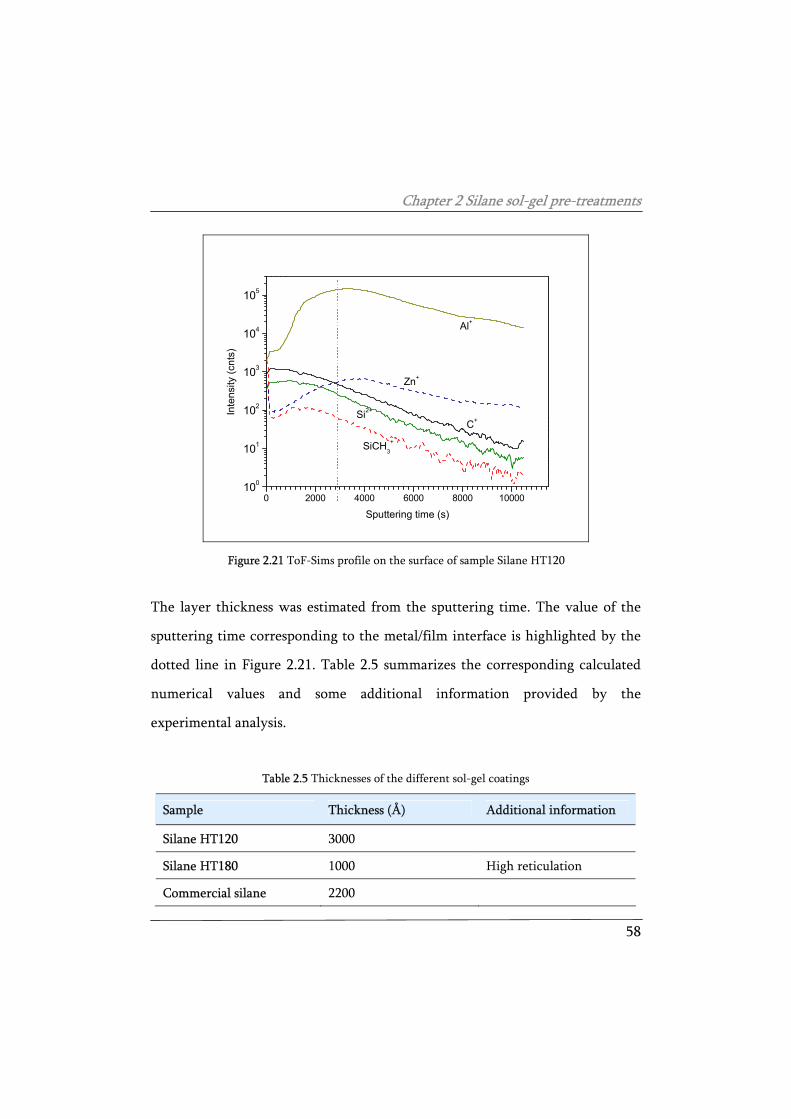
Chapter 2 Silane sol-gel pre-treatments
58
0 2000 4000 6000 8000 10000100
101
102
103
104
105
Si2+
Zn+
Inte
nsity
(cnt
s)
Sputtering time (s)
Al+
C+
SiCH3+
Figure 2.21 ToF-Sims profile on the surface of sample Silane HT120
The layer thickness was estimated from the sputtering time. The value of the
sputtering time corresponding to the metal/film interface is highlighted by the
dotted line in Figure 2.21. Table 2.5 summarizes the corresponding calculated
numerical values and some additional information provided by the
experimental analysis.
Table 2.5 Thicknesses of the different sol-gel coatings
Sample Thickness (Å) Additional information
Silane HT120 3000
Silane HT180 1000 High reticulation
Commercial silane 2200
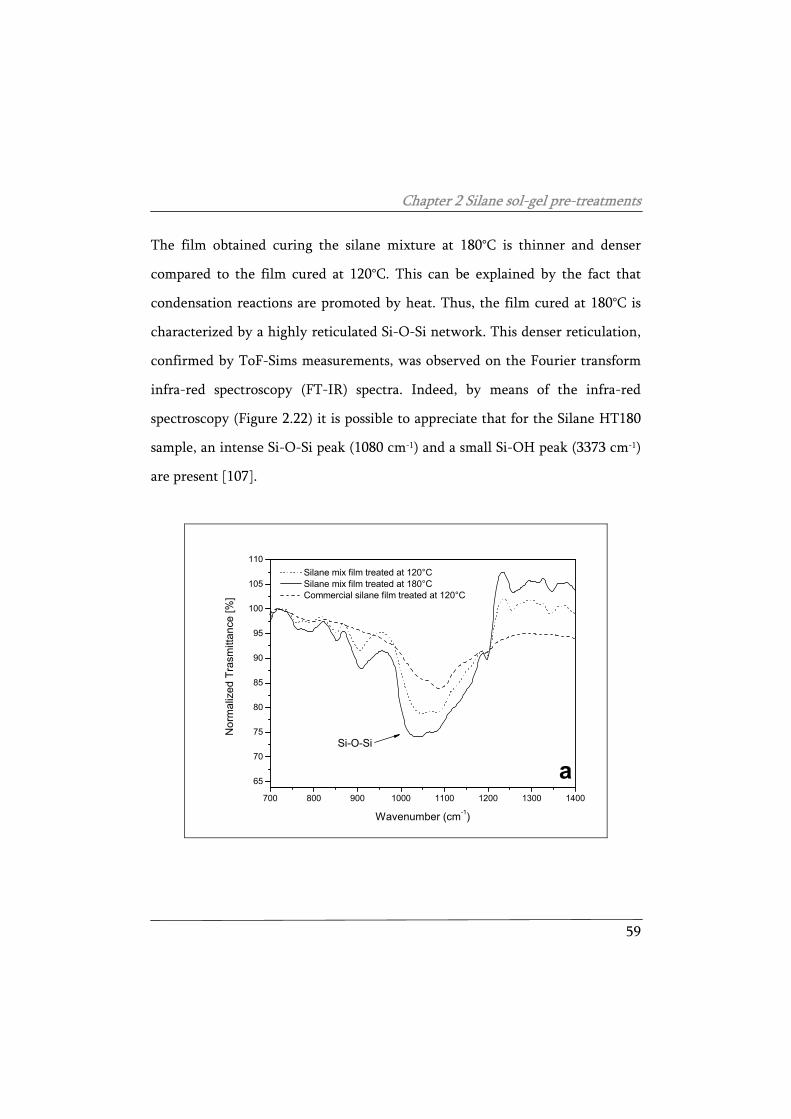
Chapter 2 Silane sol-gel pre-treatments
59
The film obtained curing the silane mixture at 180°C is thinner and denser
compared to the film cured at 120°C. This can be explained by the fact that
condensation reactions are promoted by heat. Thus, the film cured at 180°C is
characterized by a highly reticulated Si-O-Si network. This denser reticulation,
confirmed by ToF-Sims measurements, was observed on the Fourier transform
infra-red spectroscopy (FT-IR) spectra. Indeed, by means of the infra-red
spectroscopy (Figure 2.22) it is possible to appreciate that for the Silane HT180
sample, an intense Si-O-Si peak (1080 cm-1) and a small Si-OH peak (3373 cm-1)
are present [107].
700 800 900 1000 1100 1200 1300 1400
65
70
75
80
85
90
95
100
105
110
a
Nor
mal
ized
Tra
smitt
ance
[%]
Wavenumber (cm-1)
Silane mix film treated at 120°C Silane mix film treated at 180°C Commercial silane film treated at 120°C
Si-O-Si
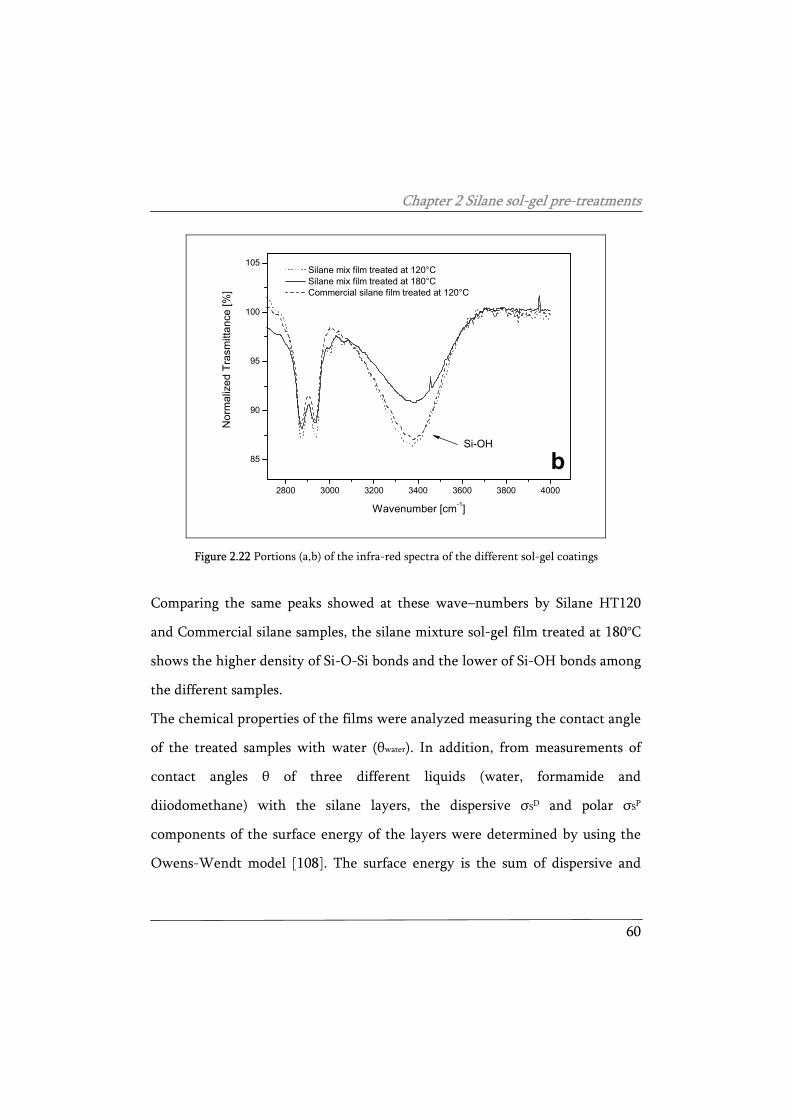
Chapter 2 Silane sol-gel pre-treatments
60
2800 3000 3200 3400 3600 3800 4000
85
90
95
100
105
Nor
mal
ized
Tra
smitt
ance
[%]
Wavenumber [cm-1]
Silane mix film treated at 120°C Silane mix film treated at 180°C Commercial silane film treated at 120°C
Si-OH
b
Figure 2.22 Portions (a,b) of the infra-red spectra of the different sol-gel coatings
Comparing the same peaks showed at these wave–numbers by Silane HT120
and Commercial silane samples, the silane mixture sol-gel film treated at 180°C
shows the higher density of Si-O-Si bonds and the lower of Si-OH bonds among
the different samples.
The chemical properties of the films were analyzed measuring the contact angle
of the treated samples with water (θwater). In addition, from measurements of
contact angles θ of three different liquids (water, formamide and
diiodomethane) with the silane layers, the dispersive σSD and polar σSP
components of the surface energy of the layers were determined by using the
Owens-Wendt model [108]. The surface energy is the sum of dispersive and
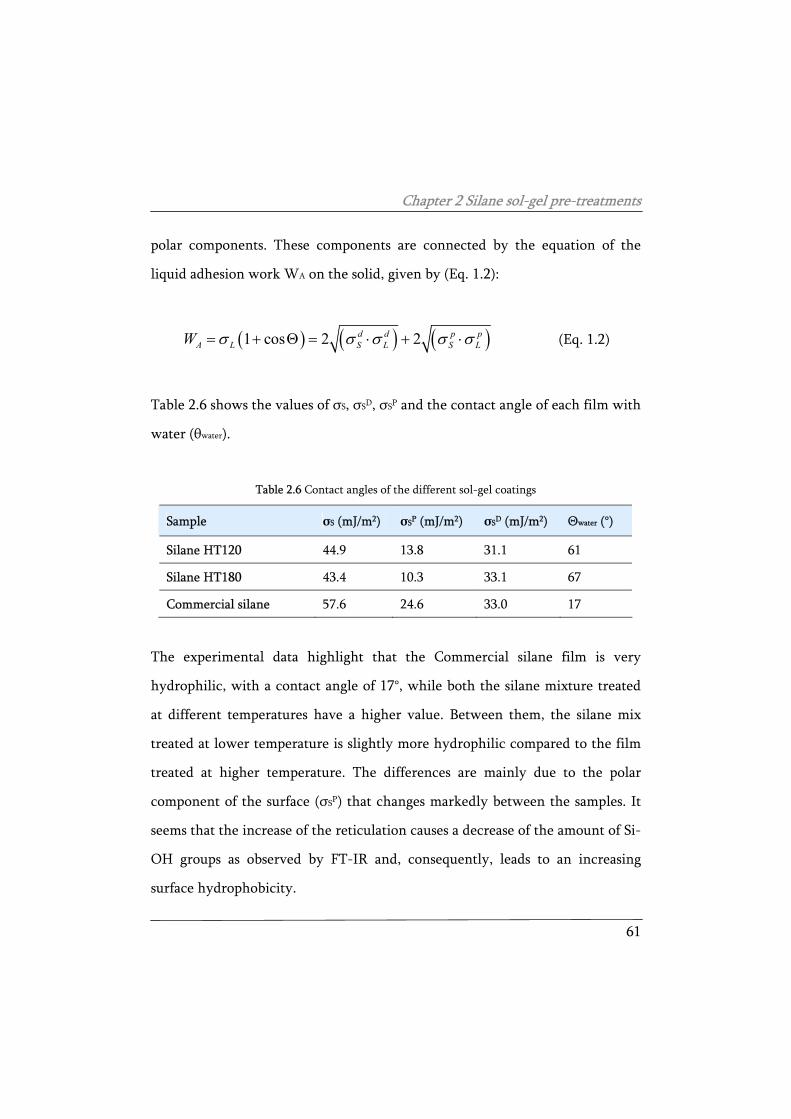
Chapter 2 Silane sol-gel pre-treatments
61
polar components. These components are connected by the equation of the
liquid adhesion work WA on the solid, given by (Eq. 1.2):
( ) ( ) ( )1 cos 2 2d d p pA L S L S LW σ σ σ σ σ= + Θ = ⋅ + ⋅ (Eq. 1.2)
Table 2.6 shows the values of σS, σSD, σSP and the contact angle of each film with
water (θwater).
Table 2.6 Contact angles of the different sol-gel coatings
Sample σS (mJ/m2) σSP (mJ/m2) σSD (mJ/m2) Θwater (°)
Silane HT120 44.9 13.8 31.1 61
Silane HT180 43.4 10.3 33.1 67
Commercial silane 57.6 24.6 33.0 17
The experimental data highlight that the Commercial silane film is very
hydrophilic, with a contact angle of 17°, while both the silane mixture treated
at different temperatures have a higher value. Between them, the silane mix
treated at lower temperature is slightly more hydrophilic compared to the film
treated at higher temperature. The differences are mainly due to the polar
component of the surface (σSP) that changes markedly between the samples. It
seems that the increase of the reticulation causes a decrease of the amount of Si-
OH groups as observed by FT-IR and, consequently, leads to an increasing
surface hydrophobicity.
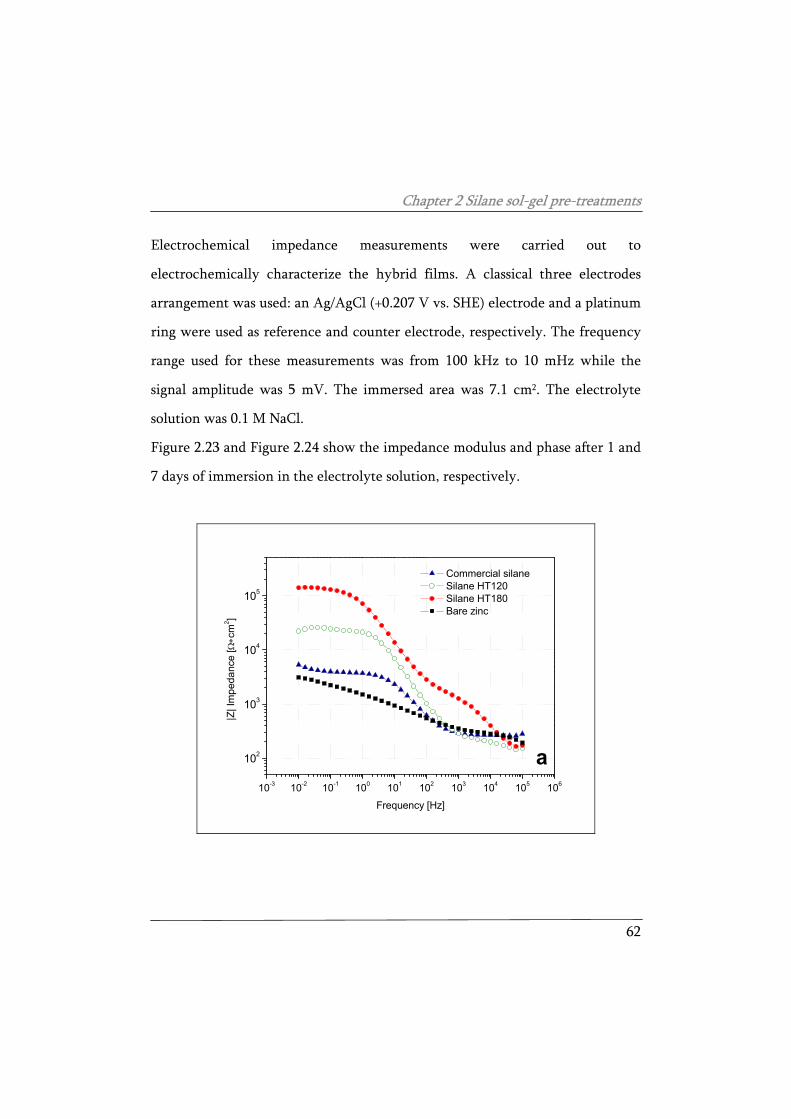
Chapter 2 Silane sol-gel pre-treatments
62
Electrochemical impedance measurements were carried out to
electrochemically characterize the hybrid films. A classical three electrodes
arrangement was used: an Ag/AgCl (+0.207 V vs. SHE) electrode and a platinum
ring were used as reference and counter electrode, respectively. The frequency
range used for these measurements was from 100 kHz to 10 mHz while the
signal amplitude was 5 mV. The immersed area was 7.1 cm2. The electrolyte
solution was 0.1 M NaCl.
Figure 2.23 and Figure 2.24 show the impedance modulus and phase after 1 and
7 days of immersion in the electrolyte solution, respectively.
10-3 10-2 10-1 100 101 102 103 104 105 106
102
103
104
105
Commercial silane Silane HT120 Silane HT180 Bare zinc
|Z| I
mpe
danc
e [Ω∗c
m2 ]
Frequency [Hz]
a
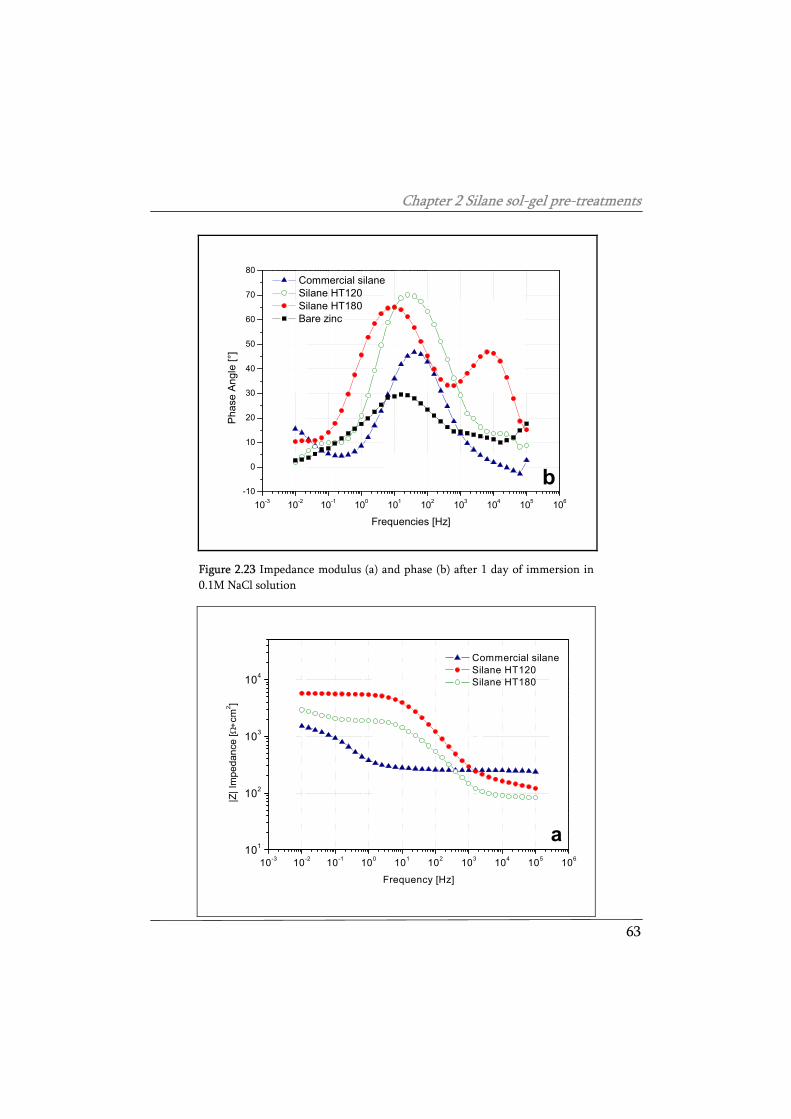
Chapter 2 Silane sol-gel pre-treatments
63
10-3 10-2 10-1 100 101 102 103 104 105 106-10
0
10
20
30
40
50
60
70
80
b
Commercial silane Silane HT120 Silane HT180 Bare zinc
Pha
se A
ngle
[°]
Frequencies [Hz]
Figure 2.23 Impedance modulus (a) and phase (b) after 1 day of immersion in 0.1M NaCl solution
10-3 10-2 10-1 100 101 102 103 104 105 106101
102
103
104
a
Commercial silane Silane HT120 Silane HT180
|Z| I
mpe
danc
e [Ω∗c
m2 ]
Frequency [Hz]
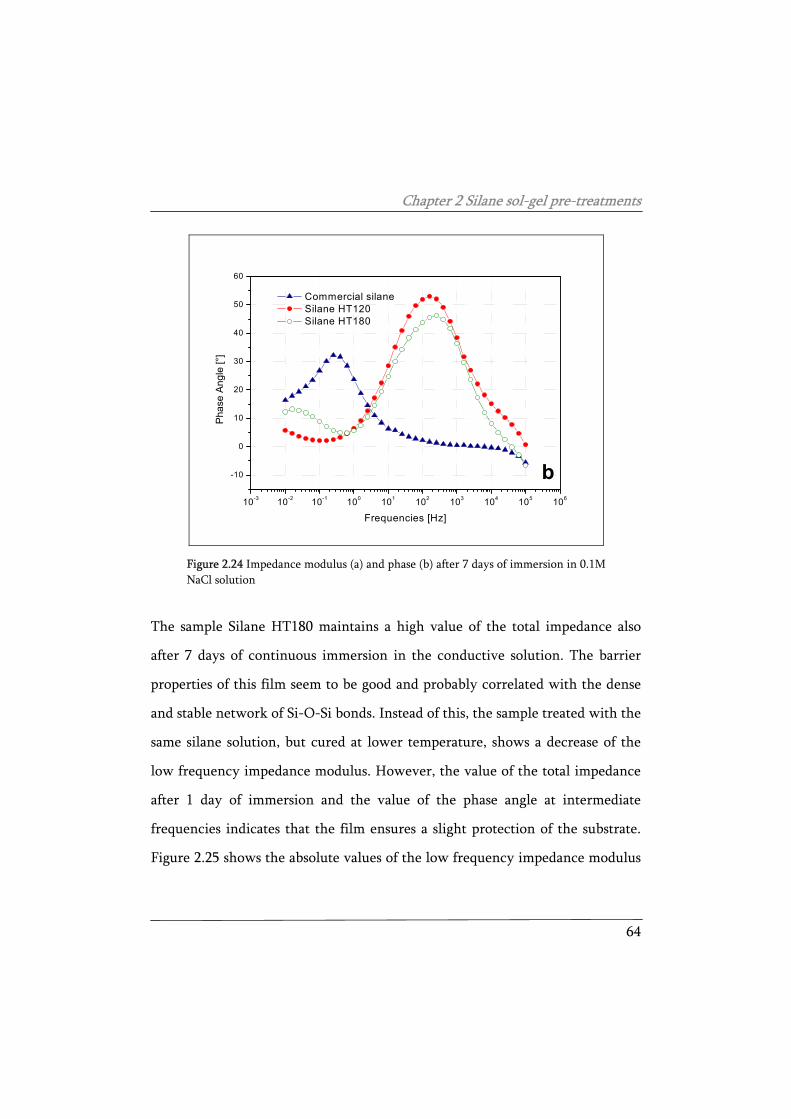
Chapter 2 Silane sol-gel pre-treatments
64
10-3 10-2 10-1 100 101 102 103 104 105 106
-10
0
10
20
30
40
50
60
b
Commercial silane Silane HT120 Silane HT180
Pha
se A
ngle
[°]
Frequencies [Hz]
Figure 2.24 Impedance modulus (a) and phase (b) after 7 days of immersion in 0.1M NaCl solution
The sample Silane HT180 maintains a high value of the total impedance also
after 7 days of continuous immersion in the conductive solution. The barrier
properties of this film seem to be good and probably correlated with the dense
and stable network of Si-O-Si bonds. Instead of this, the sample treated with the
same silane solution, but cured at lower temperature, shows a decrease of the
low frequency impedance modulus. However, the value of the total impedance
after 1 day of immersion and the value of the phase angle at intermediate
frequencies indicates that the film ensures a slight protection of the substrate.
Figure 2.25 shows the absolute values of the low frequency impedance modulus
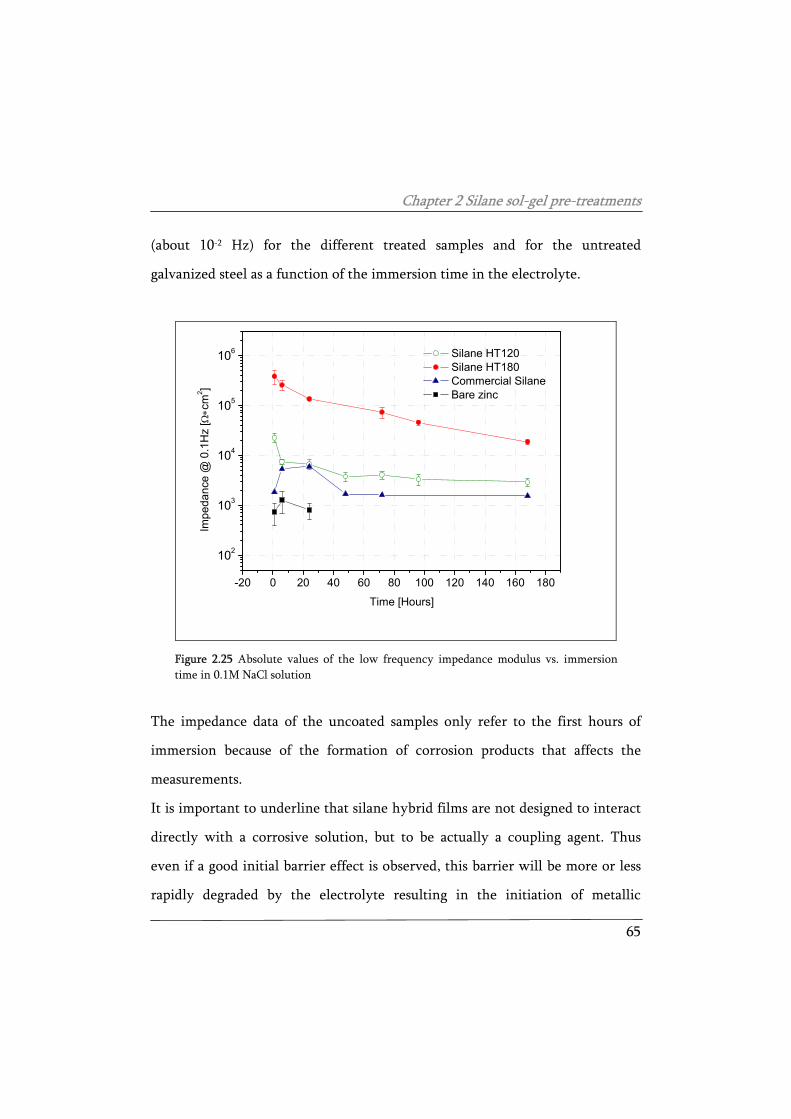
Chapter 2 Silane sol-gel pre-treatments
65
(about 10-2 Hz) for the different treated samples and for the untreated
galvanized steel as a function of the immersion time in the electrolyte.
-20 0 20 40 60 80 100 120 140 160 180
102
103
104
105
106 Silane HT120 Silane HT180 Commercial Silane Bare zinc
Impe
danc
e @
0.1
Hz
[ Ω∗c
m2 ]
Time [Hours]
Figure 2.25 Absolute values of the low frequency impedance modulus vs. immersion time in 0.1M NaCl solution
The impedance data of the uncoated samples only refer to the first hours of
immersion because of the formation of corrosion products that affects the
measurements.
It is important to underline that silane hybrid films are not designed to interact
directly with a corrosive solution, but to be actually a coupling agent. Thus
even if a good initial barrier effect is observed, this barrier will be more or less
rapidly degraded by the electrolyte resulting in the initiation of metallic
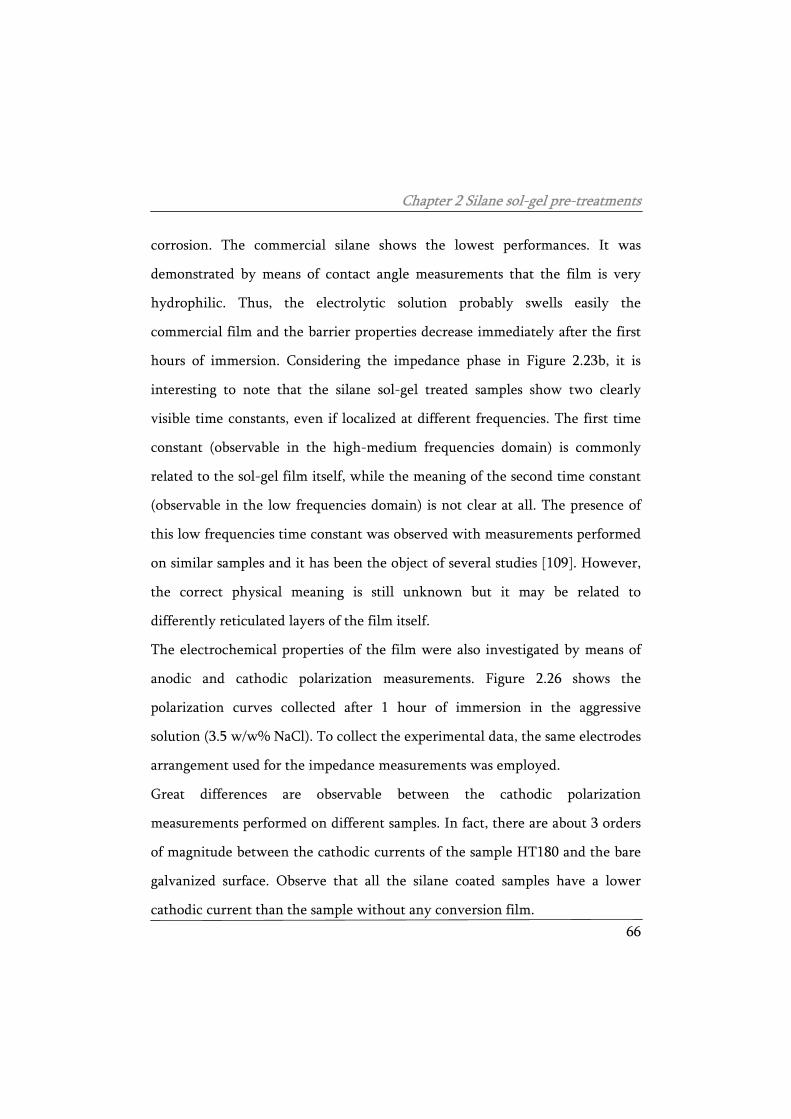
Chapter 2 Silane sol-gel pre-treatments
66
corrosion. The commercial silane shows the lowest performances. It was
demonstrated by means of contact angle measurements that the film is very
hydrophilic. Thus, the electrolytic solution probably swells easily the
commercial film and the barrier properties decrease immediately after the first
hours of immersion. Considering the impedance phase in Figure 2.23b, it is
interesting to note that the silane sol-gel treated samples show two clearly
visible time constants, even if localized at different frequencies. The first time
constant (observable in the high-medium frequencies domain) is commonly
related to the sol-gel film itself, while the meaning of the second time constant
(observable in the low frequencies domain) is not clear at all. The presence of
this low frequencies time constant was observed with measurements performed
on similar samples and it has been the object of several studies [109]. However,
the correct physical meaning is still unknown but it may be related to
differently reticulated layers of the film itself.
The electrochemical properties of the film were also investigated by means of
anodic and cathodic polarization measurements. Figure 2.26 shows the
polarization curves collected after 1 hour of immersion in the aggressive
solution (3.5 w/w% NaCl). To collect the experimental data, the same electrodes
arrangement used for the impedance measurements was employed.
Great differences are observable between the cathodic polarization
measurements performed on different samples. In fact, there are about 3 orders
of magnitude between the cathodic currents of the sample HT180 and the bare
galvanized surface. Observe that all the silane coated samples have a lower
cathodic current than the sample without any conversion film.
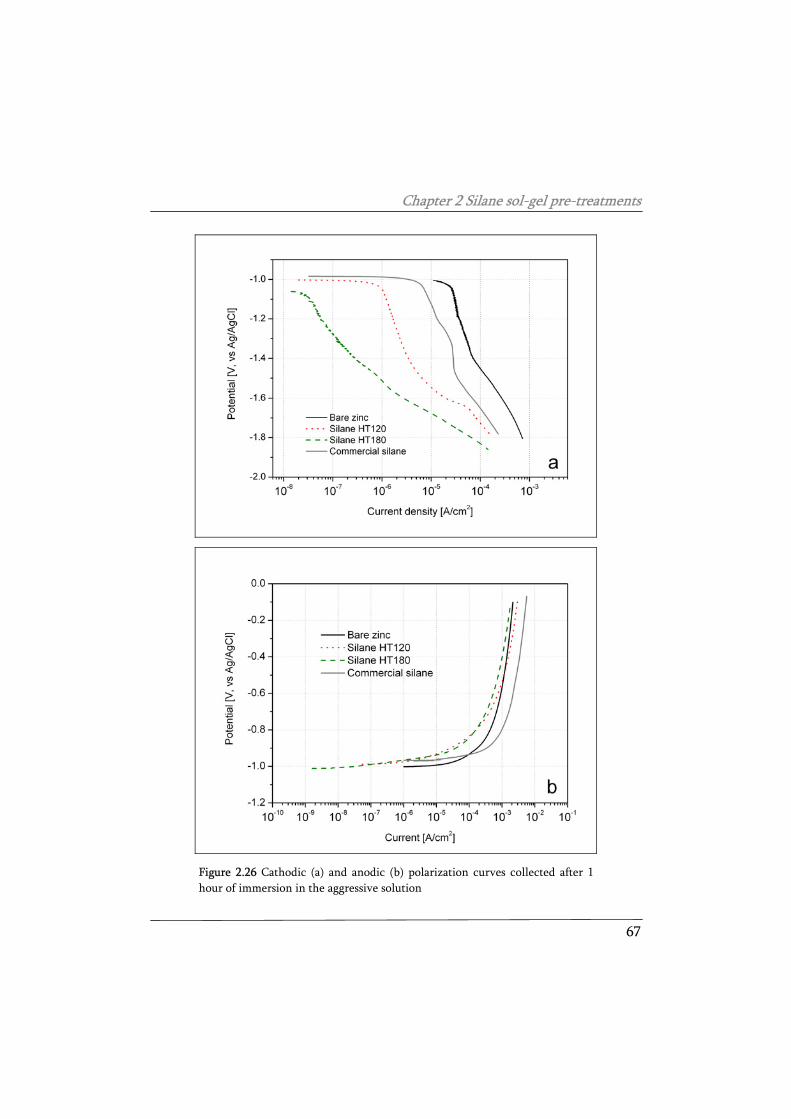
Chapter 2 Silane sol-gel pre-treatments
67
Figure 2.26 Cathodic (a) and anodic (b) polarization curves collected after 1 hour of immersion in the aggressive solution
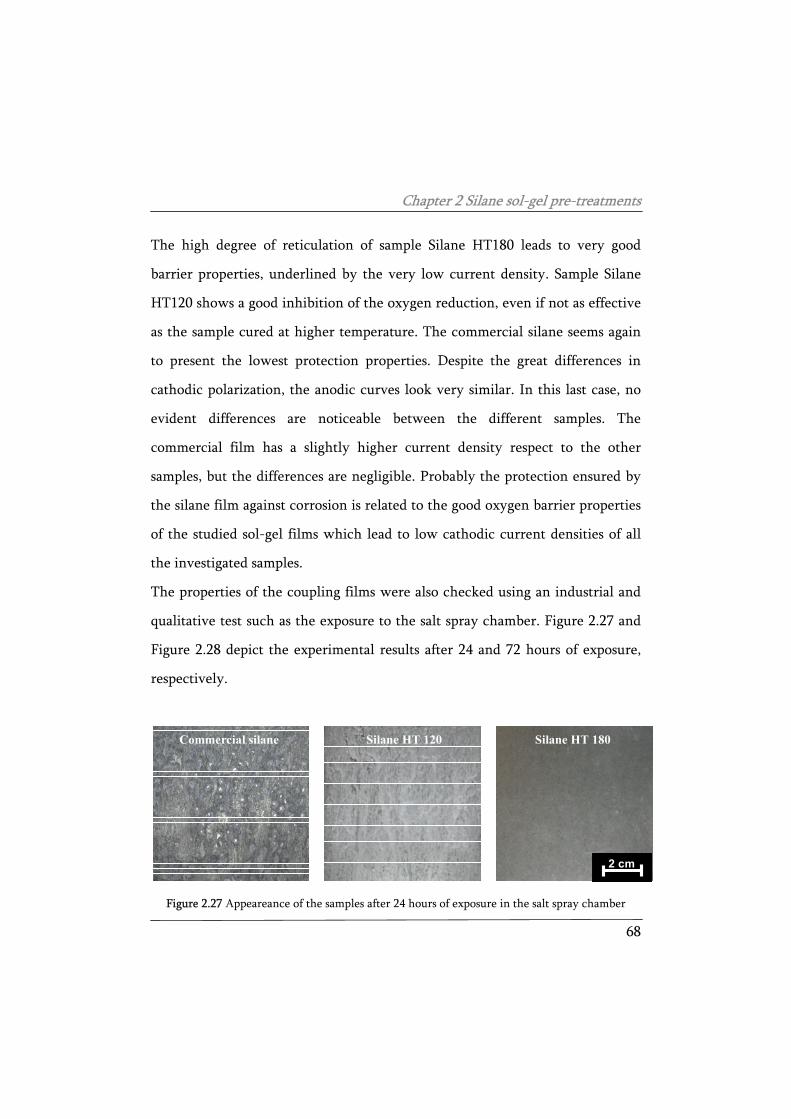
Chapter 2 Silane sol-gel pre-treatments
68
The high degree of reticulation of sample Silane HT180 leads to very good
barrier properties, underlined by the very low current density. Sample Silane
HT120 shows a good inhibition of the oxygen reduction, even if not as effective
as the sample cured at higher temperature. The commercial silane seems again
to present the lowest protection properties. Despite the great differences in
cathodic polarization, the anodic curves look very similar. In this last case, no
evident differences are noticeable between the different samples. The
commercial film has a slightly higher current density respect to the other
samples, but the differences are negligible. Probably the protection ensured by
the silane film against corrosion is related to the good oxygen barrier properties
of the studied sol-gel films which lead to low cathodic current densities of all
the investigated samples.
The properties of the coupling films were also checked using an industrial and
qualitative test such as the exposure to the salt spray chamber. Figure 2.27 and
Figure 2.28 depict the experimental results after 24 and 72 hours of exposure,
respectively.
2 cm
Commercial silane Silane HT 120 Silane HT 180
2 cm2 cm
Commercial silane Silane HT 120 Silane HT 180
Figure 2.27 Appeareance of the samples after 24 hours of exposure in the salt spray chamber
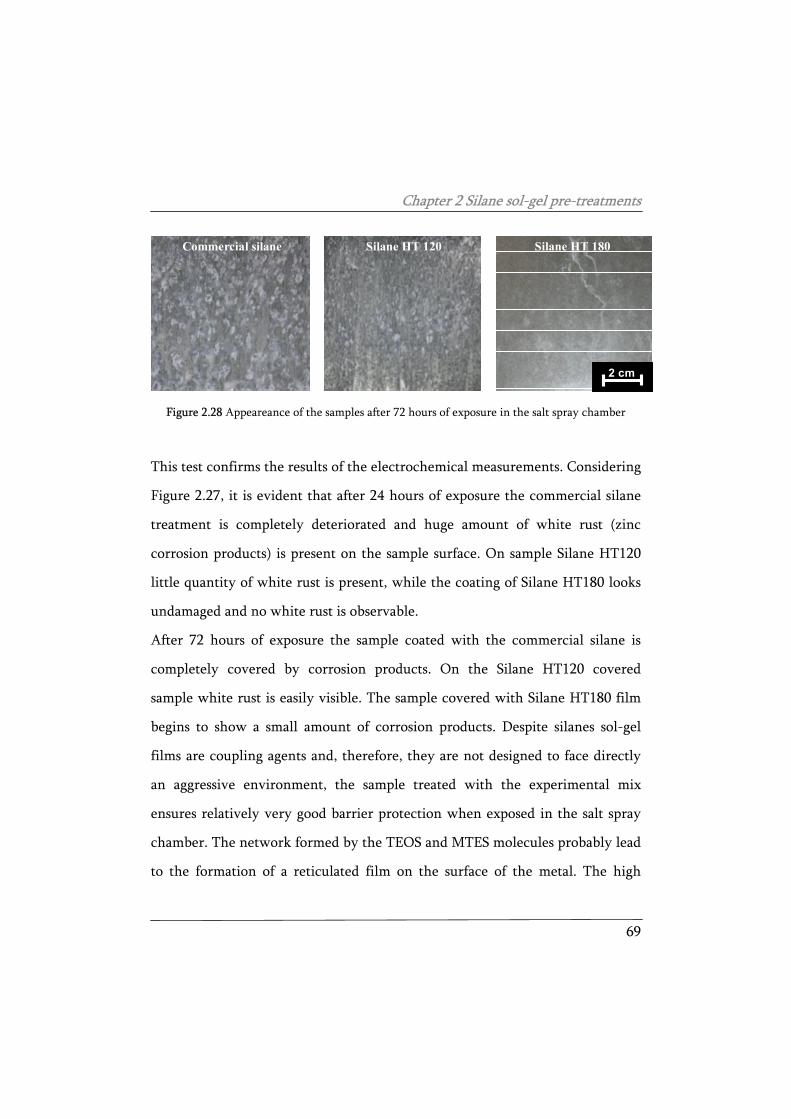
Chapter 2 Silane sol-gel pre-treatments
69
2 cm
Silane HT 180Silane HT 120Commercial silane
2 cm2 cm
Silane HT 180Silane HT 120Commercial silane
Figure 2.28 Appeareance of the samples after 72 hours of exposure in the salt spray chamber
This test confirms the results of the electrochemical measurements. Considering
Figure 2.27, it is evident that after 24 hours of exposure the commercial silane
treatment is completely deteriorated and huge amount of white rust (zinc
corrosion products) is present on the sample surface. On sample Silane HT120
little quantity of white rust is present, while the coating of Silane HT180 looks
undamaged and no white rust is observable.
After 72 hours of exposure the sample coated with the commercial silane is
completely covered by corrosion products. On the Silane HT120 covered
sample white rust is easily visible. The sample covered with Silane HT180 film
begins to show a small amount of corrosion products. Despite silanes sol-gel
films are coupling agents and, therefore, they are not designed to face directly
an aggressive environment, the sample treated with the experimental mix
ensures relatively very good barrier protection when exposed in the salt spray
chamber. The network formed by the TEOS and MTES molecules probably lead
to the formation of a reticulated film on the surface of the metal. The high
Chapter 2 Silane sol-gel pre-treatments
70
degree of intermolecular bonds (Si-O-Si) lead to the formation of a film with
considerable barrier properties, in particular for a pre-treatment.
The sample treated with the silane sol-gel film shows good corrosion resistance
in the very first days of immersion or exposure in salt spray chamber. Despite
the very low thickness, silane sol-gel films ensure a very good inhibition of the
cathodic reaction, up to 3 orders of magnitude respect to the bare HDG.
The curing treatment performed at 180°C improves noticeably the barrier
properties of the sol-gel coating, enhancing the resistance against corrosion
both in the salt spray chamber and in immersion in the sodium chloride
solution. The commercial silane treatment shows worse performances than the
experimental mixture silane sol-gel films. However, these kinds of pre-
treatment are actually coupling agents. Thus, the performances of the complete
protection system has to be investigated, in order to compare the potential of
the different treatments as coupling agent between the inorganic substrate and
organic coating. For this purpose, in the following paragraphs, the interaction
between silane sol-gel films and two different kind of organic coating were
investigated, in order to check the overall properties of the complete duplex
system.
Chapter 2 Silane sol-gel pre-treatments
71
Interaction between the pre-treatments and powder coating
Powder coating is a widely used organic coating application technique. This
technique allows obtaining homogeneous paint film with high impedance
values. In addition, this is a solvent-free application technique, which does not
imply the production of VOCs, dangerous for both human health and the
environment.
By applying a powder coating onto the pre-treated samples it is possible to
check the effect of the silane coupling film on the properties of the complete
protection system. It is also possible to investigate if the heat treatment at high
temperature affects the coupling potential of the silane molecules. In fact, it was
proved in the previous paragraph that the curing at high temperature provides a
high reticulation of the silane sol-gel film leading to the formation of a dense
interconnection of Si-O-Si bonds. It is not obvious that this curing treatment is
also convenient for the compatibility between the film itself and the organic
coating.
As previously specified, an epoxy-polyester powder coating has been applied on
the pre-treated samples. For comparison, the organic coating has been also
applied on the untreated galvanized steel and on a fluozirconated galvanized
steel sample, in order to characterise the interfacial stability, and thus the
ability of the pre-treatment to assure coating adhesion even in the presence of
defects, two different experimental approaches were used.
The samples with an artificial scratch were characterised using electrochemical
impedance spectroscopy (EIS) measurements in order to monitor the loss of
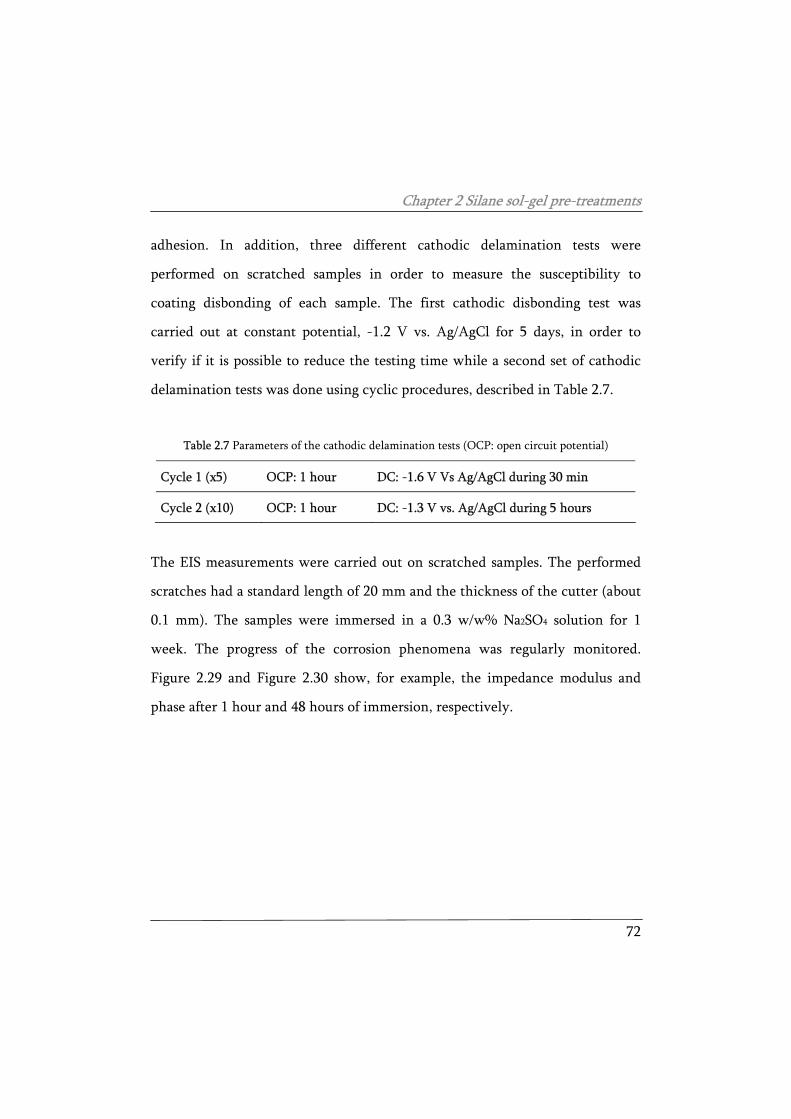
Chapter 2 Silane sol-gel pre-treatments
72
adhesion. In addition, three different cathodic delamination tests were
performed on scratched samples in order to measure the susceptibility to
coating disbonding of each sample. The first cathodic disbonding test was
carried out at constant potential, -1.2 V vs. Ag/AgCl for 5 days, in order to
verify if it is possible to reduce the testing time while a second set of cathodic
delamination tests was done using cyclic procedures, described in Table 2.7.
Table 2.7 Parameters of the cathodic delamination tests (OCP: open circuit potential)
Cycle 1 (x5) OCP: 1 hour DC: -1.6 V Vs Ag/AgCl during 30 min
Cycle 2 (x10) OCP: 1 hour DC: -1.3 V vs. Ag/AgCl during 5 hours
The EIS measurements were carried out on scratched samples. The performed
scratches had a standard length of 20 mm and the thickness of the cutter (about
0.1 mm). The samples were immersed in a 0.3 w/w% Na2SO4 solution for 1
week. The progress of the corrosion phenomena was regularly monitored.
Figure 2.29 and Figure 2.30 show, for example, the impedance modulus and
phase after 1 hour and 48 hours of immersion, respectively.
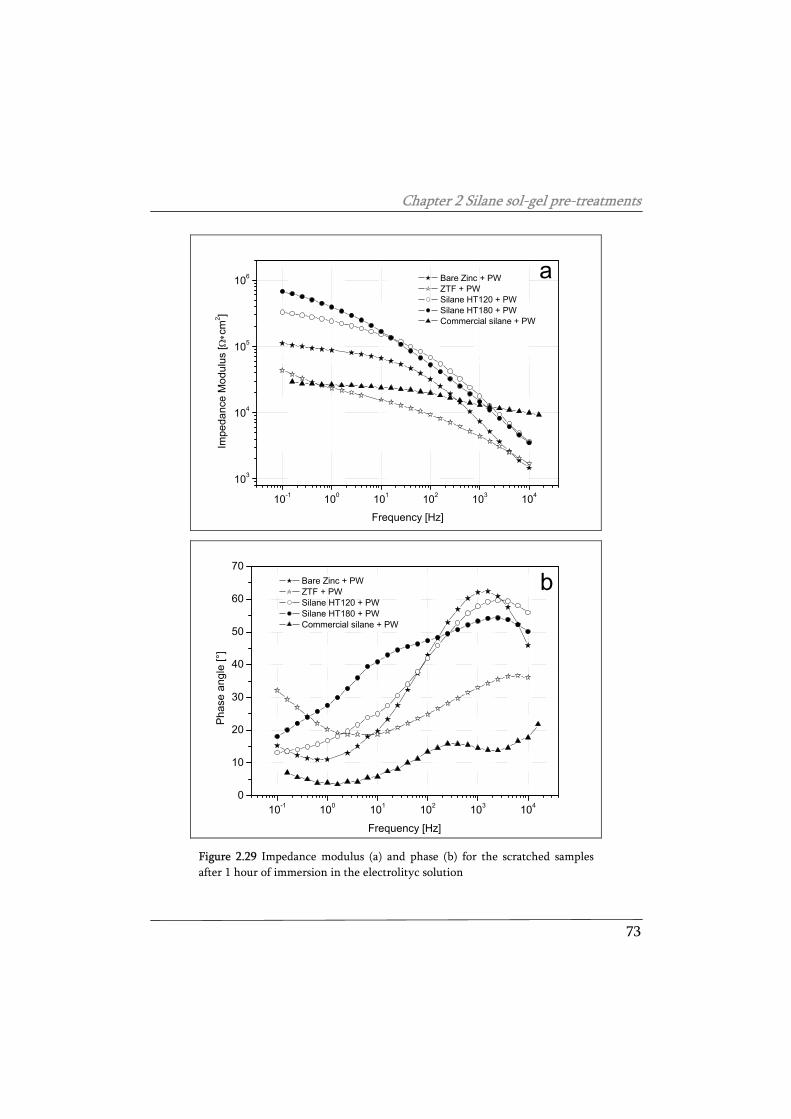
Chapter 2 Silane sol-gel pre-treatments
73
10-1 100 101 102 103 104
103
104
105
106 Bare Zinc + PW ZTF + PW Silane HT120 + PW Silane HT180 + PW Commercial silane + PW
Impe
danc
e M
odul
us [Ω
∗cm
2 ]
Frequency [Hz]
a
10-1 100 101 102 103 1040
10
20
30
40
50
60
70
Phas
e an
gle
[°]
Frequency [Hz]
Bare Zinc + PW ZTF + PW Silane HT120 + PW Silane HT180 + PW Commercial silane + PW
b
Figure 2.29 Impedance modulus (a) and phase (b) for the scratched samples after 1 hour of immersion in the electrolityc solution
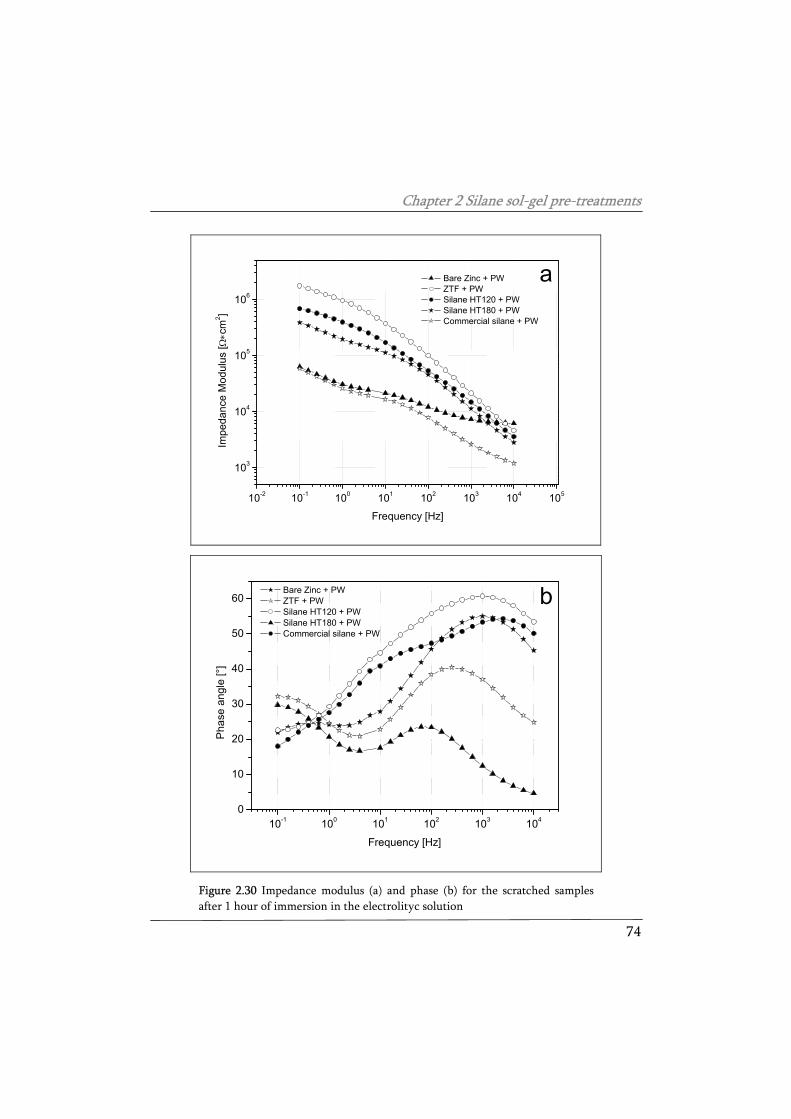
Chapter 2 Silane sol-gel pre-treatments
74
10-2 10-1 100 101 102 103 104 105
103
104
105
106
Impe
danc
e M
odul
us [Ω
∗cm
2 ]
Frequency [Hz]
Bare Zinc + PW ZTF + PW Silane HT120 + PW Silane HT180 + PW Commercial silane + PW
a
10-1 100 101 102 103 1040
10
20
30
40
50
60
Pha
se a
ngle
[°]
Frequency [Hz]
Bare Zinc + PW ZTF + PW Silane HT120 + PW Silane HT180 + PW Commercial silane + PW
b
Figure 2.30 Impedance modulus (a) and phase (b) for the scratched samples after 1 hour of immersion in the electrolityc solution
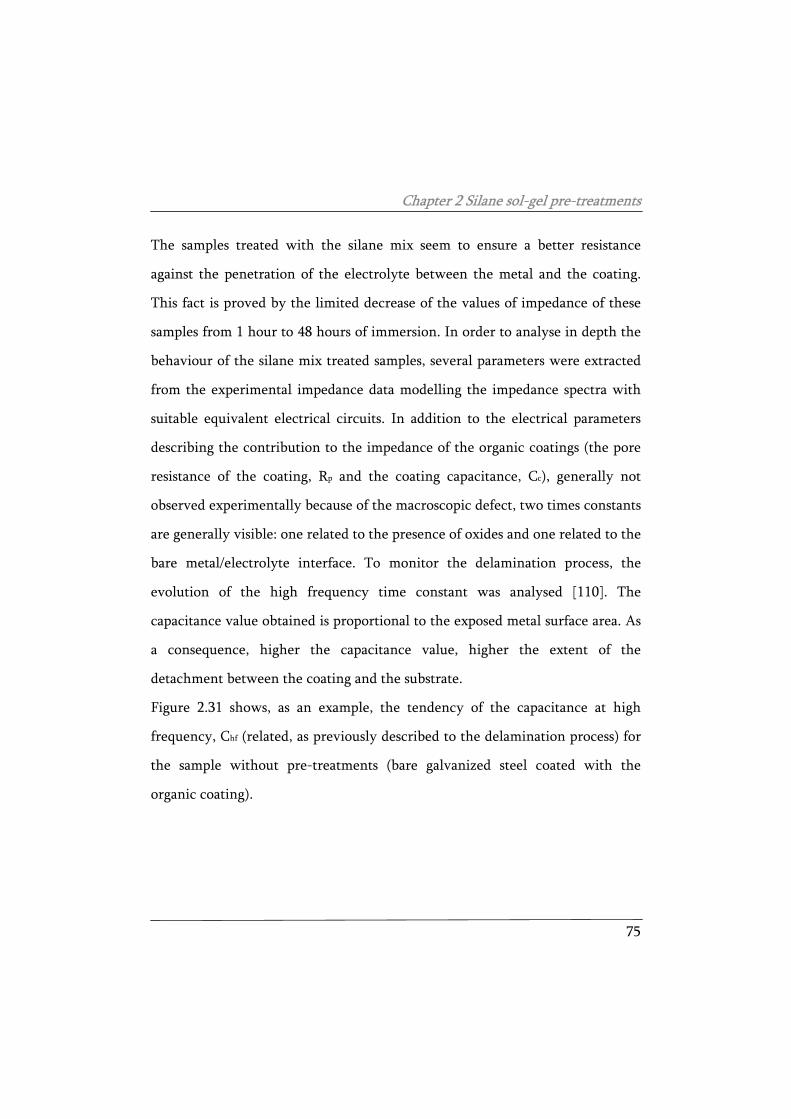
Chapter 2 Silane sol-gel pre-treatments
75
The samples treated with the silane mix seem to ensure a better resistance
against the penetration of the electrolyte between the metal and the coating.
This fact is proved by the limited decrease of the values of impedance of these
samples from 1 hour to 48 hours of immersion. In order to analyse in depth the
behaviour of the silane mix treated samples, several parameters were extracted
from the experimental impedance data modelling the impedance spectra with
suitable equivalent electrical circuits. In addition to the electrical parameters
describing the contribution to the impedance of the organic coatings (the pore
resistance of the coating, Rp and the coating capacitance, Cc), generally not
observed experimentally because of the macroscopic defect, two times constants
are generally visible: one related to the presence of oxides and one related to the
bare metal/electrolyte interface. To monitor the delamination process, the
evolution of the high frequency time constant was analysed [110]. The
capacitance value obtained is proportional to the exposed metal surface area. As
a consequence, higher the capacitance value, higher the extent of the
detachment between the coating and the substrate.
Figure 2.31 shows, as an example, the tendency of the capacitance at high
frequency, Chf (related, as previously described to the delamination process) for
the sample without pre-treatments (bare galvanized steel coated with the
organic coating).
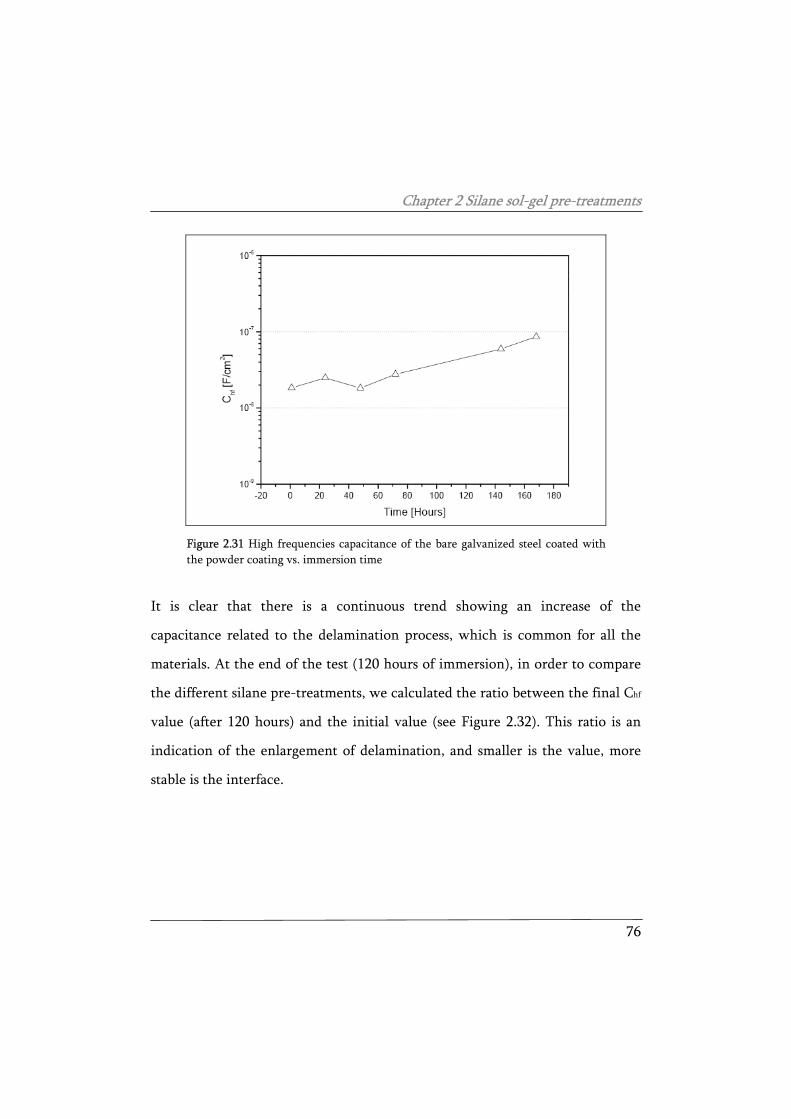
Chapter 2 Silane sol-gel pre-treatments
76
Figure 2.31 High frequencies capacitance of the bare galvanized steel coated with the powder coating vs. immersion time
It is clear that there is a continuous trend showing an increase of the
capacitance related to the delamination process, which is common for all the
materials. At the end of the test (120 hours of immersion), in order to compare
the different silane pre-treatments, we calculated the ratio between the final Chf
value (after 120 hours) and the initial value (see Figure 2.32). This ratio is an
indication of the enlargement of delamination, and smaller is the value, more
stable is the interface.
Chapter 2 Silane sol-gel pre-treatments
77
Figure 2.32 Extent of delamination (normalized) after the end of the immersion in the aggressive solution
From the data in Figure 2.32 it is clear that the stability of the silane mix cured
at 180°C (Silane HT 180) is higher.
In order to better highlight the different resistances against the disbonding of
the coating of the differently pre-treated samples, cathodic disbonding tests
were performed. For this purpose, also in this case scratched samples were used.
This experimental test was carried out with an arrangement similar to the one
used for the EIS measurements, with the same electrolytic solution. However,
differently from the previous test, an external voltage was imposed. In
particular, a cathodic potential (with respect to zinc) was applied to the
samples, in order to force the oxygen reduction on the metal surface and to
consequently induce a strong increase of the local value of the pH. In fact, it is
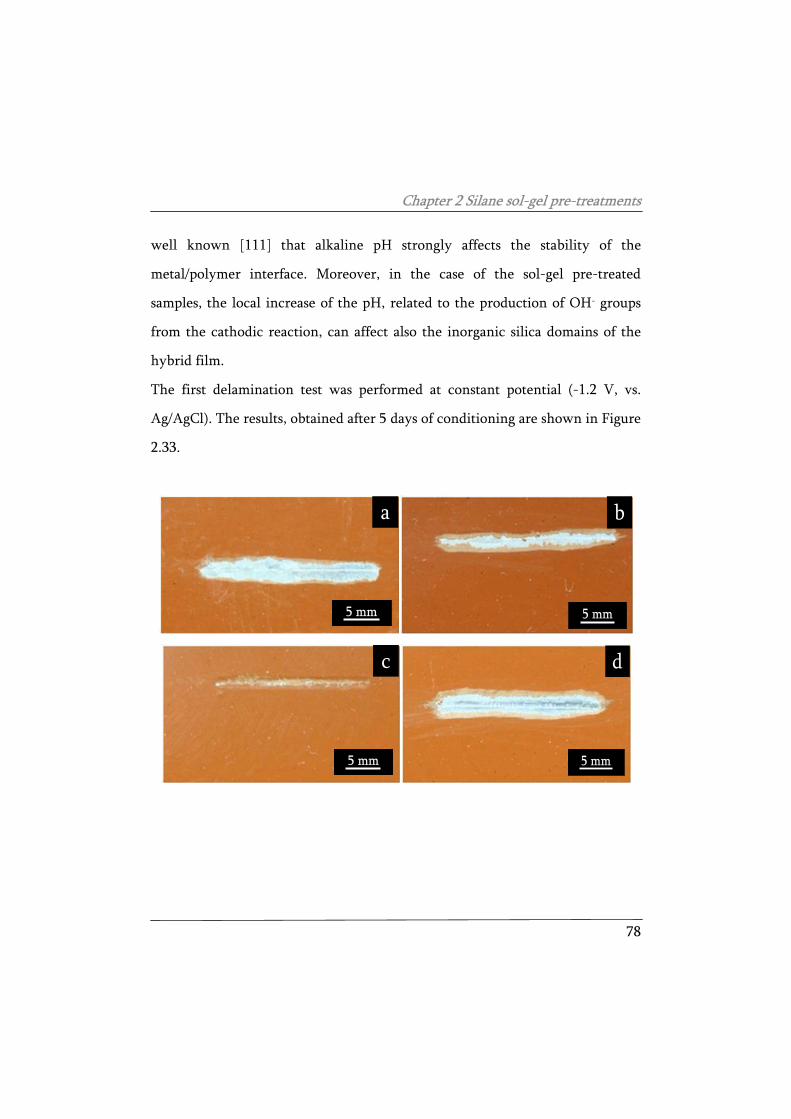
Chapter 2 Silane sol-gel pre-treatments
78
well known [111] that alkaline pH strongly affects the stability of the
metal/polymer interface. Moreover, in the case of the sol-gel pre-treated
samples, the local increase of the pH, related to the production of OH- groups
from the cathodic reaction, can affect also the inorganic silica domains of the
hybrid film.
The first delamination test was performed at constant potential (-1.2 V, vs.
Ag/AgCl). The results, obtained after 5 days of conditioning are shown in Figure
2.33.
a
5 mm5 mm
b
5 mm5 mm
c
5 mm5 mm
d
5 mm5 mm
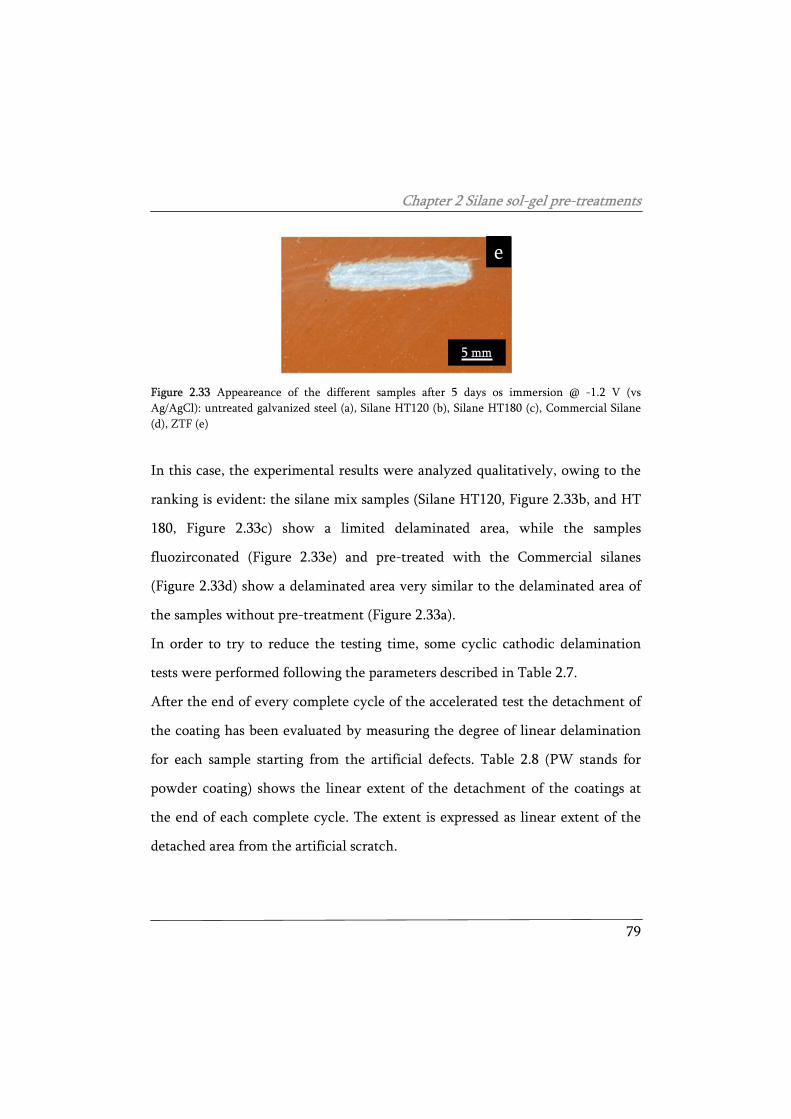
Chapter 2 Silane sol-gel pre-treatments
79
e
5 mm
Figure 2.33 Appeareance of the different samples after 5 days os immersion @ -1.2 V (vs Ag/AgCl): untreated galvanized steel (a), Silane HT120 (b), Silane HT180 (c), Commercial Silane (d), ZTF (e)
In this case, the experimental results were analyzed qualitatively, owing to the
ranking is evident: the silane mix samples (Silane HT120, Figure 2.33b, and HT
180, Figure 2.33c) show a limited delaminated area, while the samples
fluozirconated (Figure 2.33e) and pre-treated with the Commercial silanes
(Figure 2.33d) show a delaminated area very similar to the delaminated area of
the samples without pre-treatment (Figure 2.33a).
In order to try to reduce the testing time, some cyclic cathodic delamination
tests were performed following the parameters described in Table 2.7.
After the end of every complete cycle of the accelerated test the detachment of
the coating has been evaluated by measuring the degree of linear delamination
for each sample starting from the artificial defects. Table 2.8 (PW stands for
powder coating) shows the linear extent of the detachment of the coatings at
the end of each complete cycle. The extent is expressed as linear extent of the
detached area from the artificial scratch.
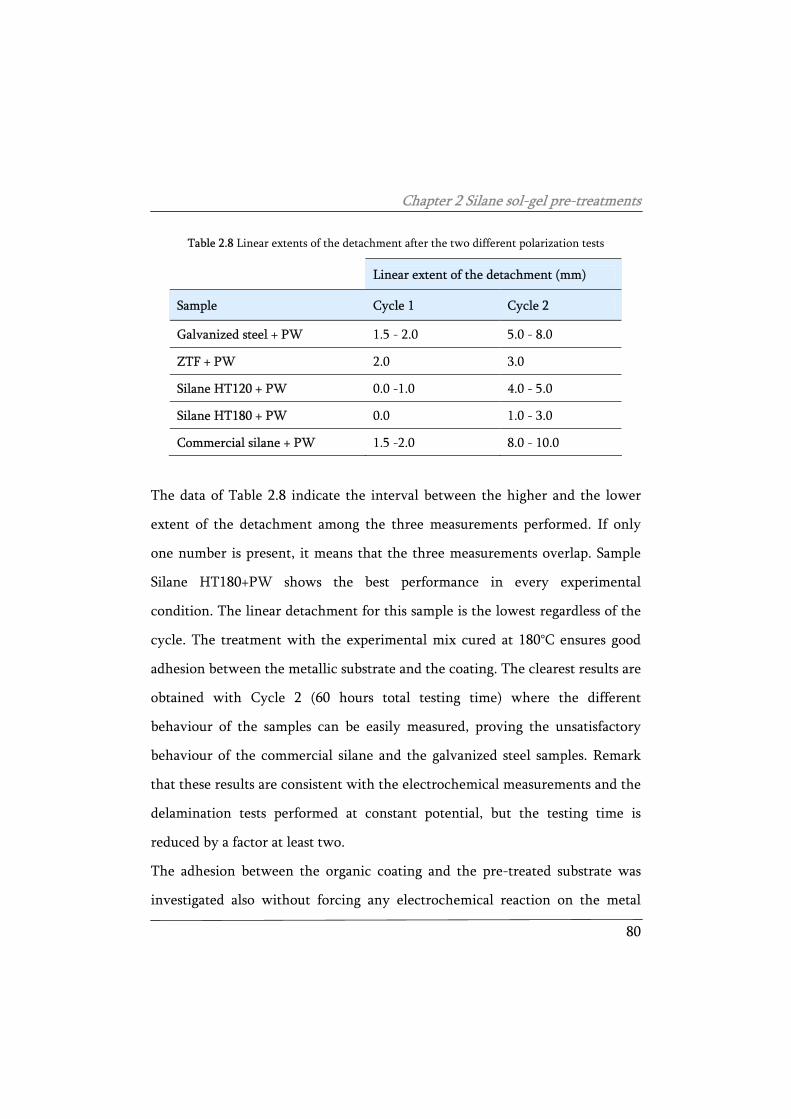
Chapter 2 Silane sol-gel pre-treatments
80
Table 2.8 Linear extents of the detachment after the two different polarization tests
Linear extent of the detachment (mm)
Sample Cycle 1 Cycle 2
Galvanized steel + PW 1.5 - 2.0 5.0 - 8.0
ZTF + PW 2.0 3.0
Silane HT120 + PW 0.0 -1.0 4.0 - 5.0
Silane HT180 + PW 0.0 1.0 - 3.0
Commercial silane + PW 1.5 -2.0 8.0 - 10.0
The data of Table 2.8 indicate the interval between the higher and the lower
extent of the detachment among the three measurements performed. If only
one number is present, it means that the three measurements overlap. Sample
Silane HT180+PW shows the best performance in every experimental
condition. The linear detachment for this sample is the lowest regardless of the
cycle. The treatment with the experimental mix cured at 180°C ensures good
adhesion between the metallic substrate and the coating. The clearest results are
obtained with Cycle 2 (60 hours total testing time) where the different
behaviour of the samples can be easily measured, proving the unsatisfactory
behaviour of the commercial silane and the galvanized steel samples. Remark
that these results are consistent with the electrochemical measurements and the
delamination tests performed at constant potential, but the testing time is
reduced by a factor at least two.
The adhesion between the organic coating and the pre-treated substrate was
investigated also without forcing any electrochemical reaction on the metal
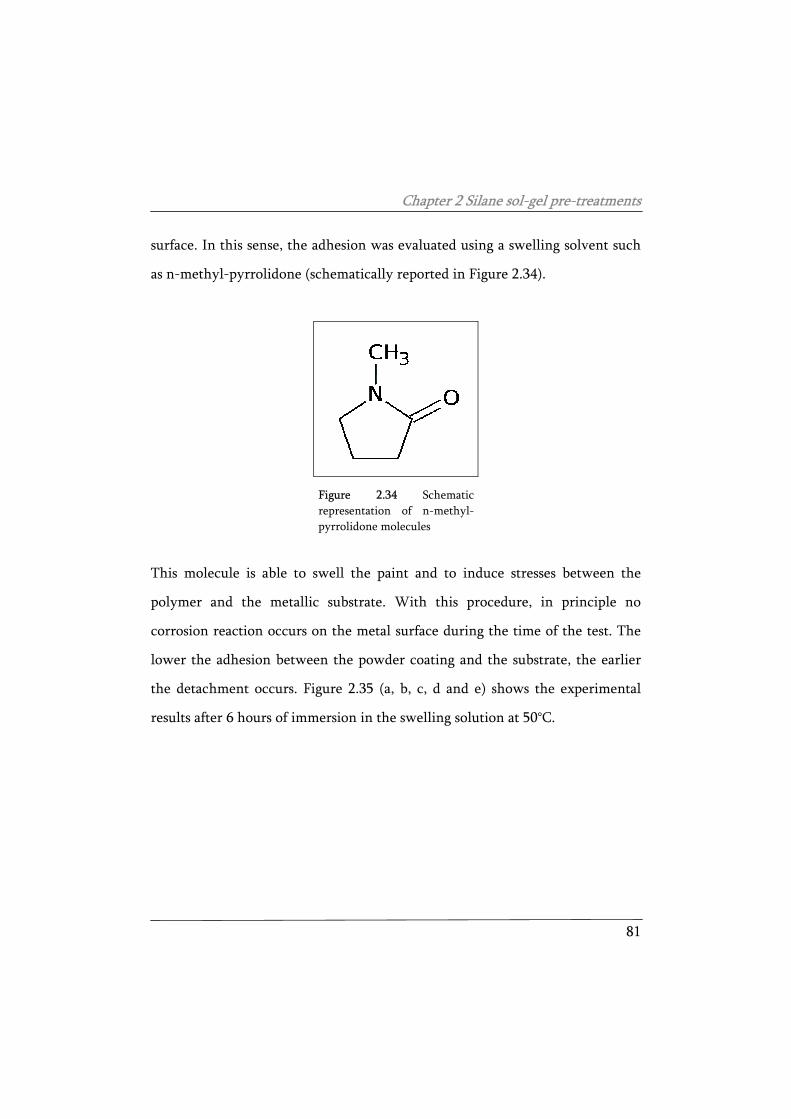
Chapter 2 Silane sol-gel pre-treatments
81
surface. In this sense, the adhesion was evaluated using a swelling solvent such
as n-methyl-pyrrolidone (schematically reported in Figure 2.34).
Figure 2.34 Schematic representation of n-methyl-pyrrolidone molecules
This molecule is able to swell the paint and to induce stresses between the
polymer and the metallic substrate. With this procedure, in principle no
corrosion reaction occurs on the metal surface during the time of the test. The
lower the adhesion between the powder coating and the substrate, the earlier
the detachment occurs. Figure 2.35 (a, b, c, d and e) shows the experimental
results after 6 hours of immersion in the swelling solution at 50°C.
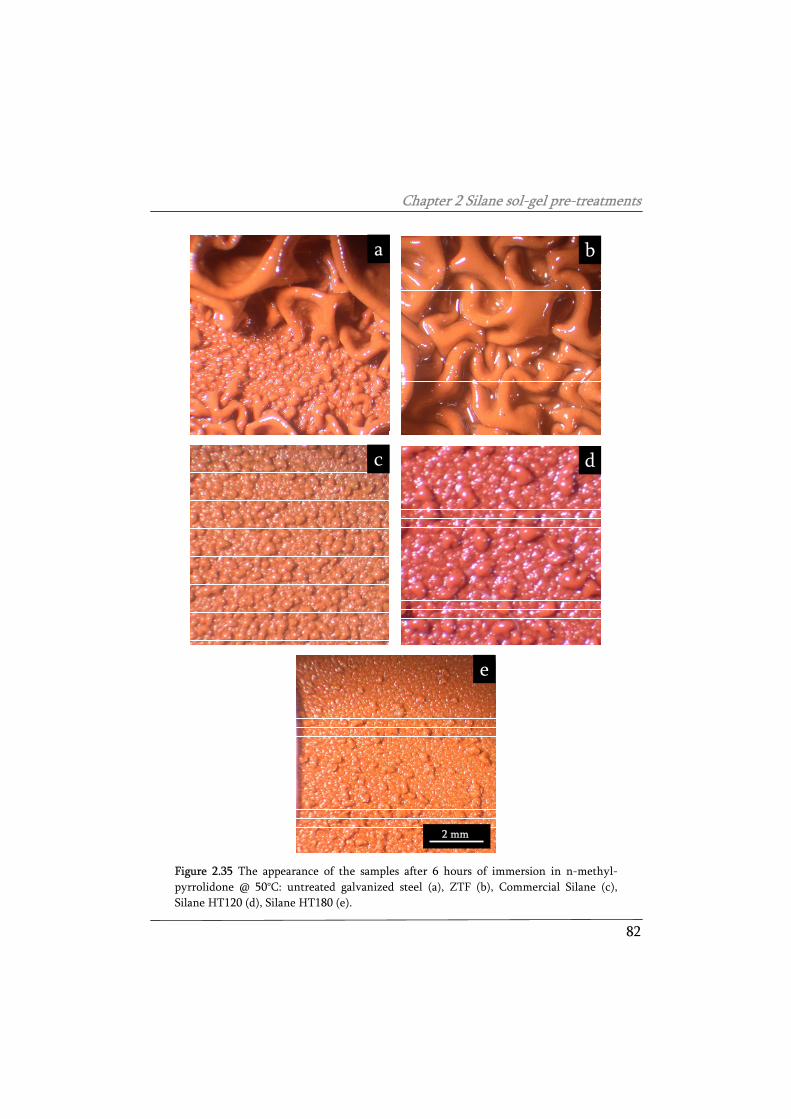
Chapter 2 Silane sol-gel pre-treatments
82
a
b
c
d
e
2 mm
Figure 2.35 The appearance of the samples after 6 hours of immersion in n-methyl-pyrrolidone @ 50°C: untreated galvanized steel (a), ZTF (b), Commercial Silane (c), Silane HT120 (d), Silane HT180 (e).
Chapter 2 Silane sol-gel pre-treatments
83
The untreated sample and the sample with the ZTF conversion treatment
(Figure 2.35a and Figure 2.35b, respectively) show a clearly visible detachment
of the coating. Concerning the other samples, the detachment of the organic
coating is not complete but a huge number of blisters are observable. Since this
test is purely qualitative, sample Silane HT180+PW (Figure 2.35e) seems to
ensure the highest adhesion between the substrate and the coating. This fact is
highlighted by the lower density of blisters. Sample Silane HT120+PW (Figure
2.35d) and Commercial silane+PW (Figure 2.35c) are quite similar, even if the
blisters of the sample treated with the experimental mix look bigger than the
blisters on the commercial silane treated sample. The good results obtained
with a curing temperature of 180°C must consider the fact that this temperature
has not to be exceeded, because it is very close to the temperature at which the
epoxy ring opens. This event has to be avoided because the premature opening
of the epoxy ring can affect negatively the adhesion between the polymer and
the hybrid film. This technological test partially corroborates the results of the
other experiments. In particular it confirms the low adhesion between the
samples treated with no silane coupling films. In addition, it confirms the very
good performance of sample Silane HT180+PW. Note that, in this case, the
sample treated with the Commercial silane does not behave as bad as
demonstrated with other experimental tests (i.e. cathodic disbanding
measurements). This fact can be explained by the assumption that the
Commercial silane treatment ensures a rather good dry adhesion between the
polymer and the substrate. Despite of this, when a scratch is performed on the
surface, the silane film is directly in contact with the environment (or
Chapter 2 Silane sol-gel pre-treatments
84
aggressive solution, as in the experimental test) and it can be easily attacked.
The test performed on the uncoated pre-treated samples proved the low
resistance of this coupling film against a corrosive environment. In the cathodic
disbonding test, the electrolyte is directly in contact with the cut edge of the
coupling film and, thus, the conductive solution probably hydrolyzes it and
penetrates through the interface between the polymer and the metal
accelerating the detachment of the powder coating.
The characterization was completed by means of exposure of the scratched
samples in the salt spray chamber. The experimental procedure was carried out
in compliance with the ASTM B117 standard, performing an artificial “X-
shaped” scratch on the painted samples using a cutting tool. The experimental
results after 500 hours of exposure confirmed the different performances among
the different samples (see Figure 2.36).
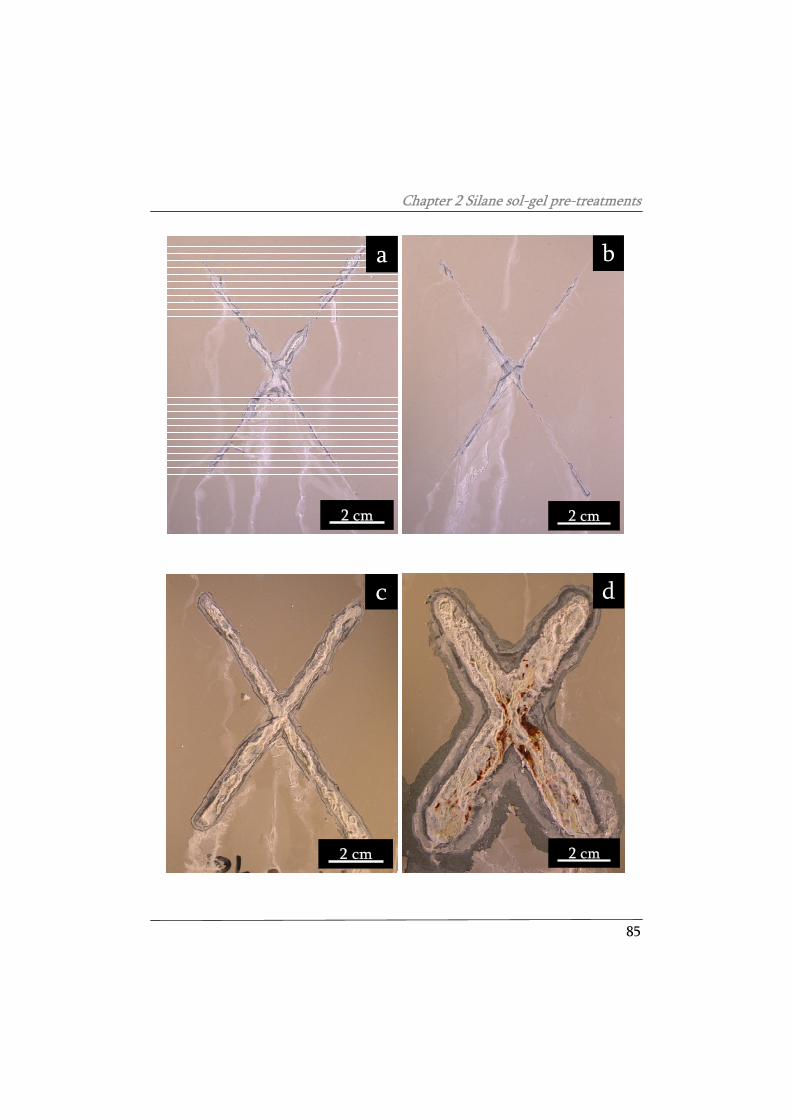
Chapter 2 Silane sol-gel pre-treatments
85
a
2 cm
b
2 cm
c
2 cm
d
2 cm
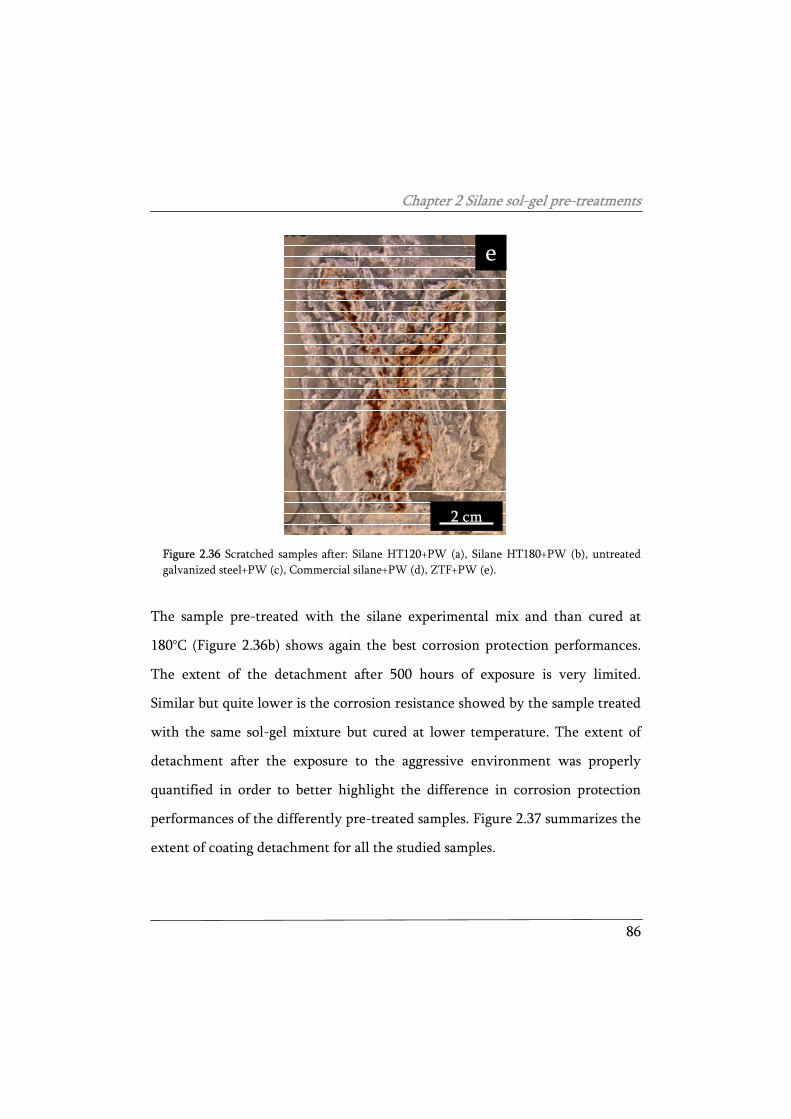
Chapter 2 Silane sol-gel pre-treatments
86
e
2 cm
Figure 2.36 Scratched samples after: Silane HT120+PW (a), Silane HT180+PW (b), untreated galvanized steel+PW (c), Commercial silane+PW (d), ZTF+PW (e).
The sample pre-treated with the silane experimental mix and than cured at
180°C (Figure 2.36b) shows again the best corrosion protection performances.
The extent of the detachment after 500 hours of exposure is very limited.
Similar but quite lower is the corrosion resistance showed by the sample treated
with the same sol-gel mixture but cured at lower temperature. The extent of
detachment after the exposure to the aggressive environment was properly
quantified in order to better highlight the difference in corrosion protection
performances of the differently pre-treated samples. Figure 2.37 summarizes the
extent of coating detachment for all the studied samples.
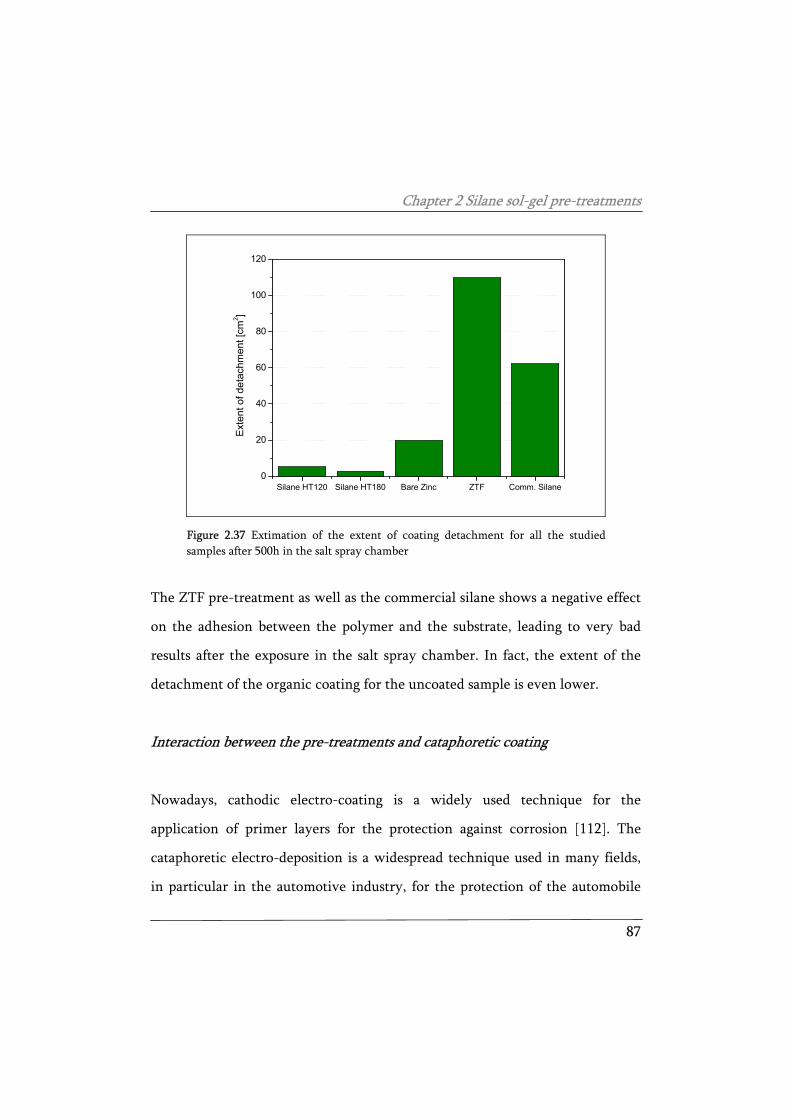
Chapter 2 Silane sol-gel pre-treatments
87
Silane HT120 Silane HT180 Bare Zinc ZTF Comm. Silane0
20
40
60
80
100
120
Ex
tent
of d
etac
hmen
t [cm
2 ]
Figure 2.37 Extimation of the extent of coating detachment for all the studied samples after 500h in the salt spray chamber
The ZTF pre-treatment as well as the commercial silane shows a negative effect
on the adhesion between the polymer and the substrate, leading to very bad
results after the exposure in the salt spray chamber. In fact, the extent of the
detachment of the organic coating for the uncoated sample is even lower.
Interaction between the pre-treatments and cataphoretic coating
Nowadays, cathodic electro-coating is a widely used technique for the
application of primer layers for the protection against corrosion [112]. The
cataphoretic electro-deposition is a widespread technique used in many fields,
in particular in the automotive industry, for the protection of the automobile
Chapter 2 Silane sol-gel pre-treatments
88
bodywork [113,114]. This deposition method has numerous advantages, such as
high protection against corrosion of the coating and high material utilization,
but it is also an environmentally friendly technique, owing to the absence of
organic solvents (it is an aqueous system) [115]. This last statement is growing
of importance, in the light of the recent legislation restriction in the use of
organic solvents containing VOCs (volatile organic carbon) [116].
Differently from the previous paragraph, first of all a simulation of the
deposition conditions of the cataphoretic coating on the silane pre-treated
galvanized steel samples was carried out. The aim is to determine if the electro-
coat conditions destroy or not the silane pre-treatment. Indeed, the electro-coat
is accompanied by a hydrogen release on the surface on the galvanized steel
samples (the cathode) [117]. This release can generate degradation or
destruction of the pre-treatment. The estimation of the produced damage was
investigated by means of electrochemical impedance spectroscopy (EIS),
comparing the impedance spectra before and after the simulation. In order to
deeply investigate the effect of electro-coating conditions on the silane sol-gel
film, two different thickness of the sol-gel coating were investigated, both
cured at two different temperatures. The second part of the paragraph deals
with the analysis of the performances of the cataphoretic coating applied on the
different silane films. The characterization of the corrosion protection cycles
was accomplished by EIS measurements and exposures in salt spray chamber. In
this case the characterization of the protection system is not as detailed as in the
case of the powder coating. In fact, as previously evidenced, the cataphoretic
film is a primer and is not a final coating, as the powder coating investigated in
Chapter 2 Silane sol-gel pre-treatments
89
the previous paragraph. For this reason, the investigation was mainly focused
on the compatibility between the powder electro-coating and the pre-
treatments with respect to the complete protection system containing the
powder coating [118]. In addition, in this part of the work, the pre-treatments
performed in the acid zirconium compounds solution, as well as the silane
SIVO® commercial treatment, were not analyzed any more. In fact, the first is
not commonly used as pre-treatment prior a cataphoretic deposition, while the
commercial treatment is no more investigated because the supplier do not
considered it a suitable product for this kind of application. The compatibility
between the electro-coat and the experimental silane sol-gel films treated at
two different temperatures (120 and 180°C) were compared only to the
uncoated galvanized steel substrate.
Prior to the application of the cataphoretic coating, the effect of a simulation of
the electro-coat conditions on silane layer properties was investigated. The
main goal of this simulation was to determine if the electro-coat conditions
destroy or not the silane pre-treatment. The simulation of the electro-coat was
performed in a Na2SO4 aqueous solution, modifying its pH to 6 and the
conductivity to 1600µS. This solution simulates the most important parameters
of the cataphoretic paint bath during electrocoating process. A stainless steel
panel was used as anode, while the sol-gel coated samples were used as cathode.
In the cataphoretic process the cathode corresponds to the target to coat with
the paint. In this study, a current of 2 mA/cm² was applied on the sample
during 10s and 20s. These conditions are slightly more drastic than the
conditions used to study the building layer mechanisms (around 1 mA/cm2). A
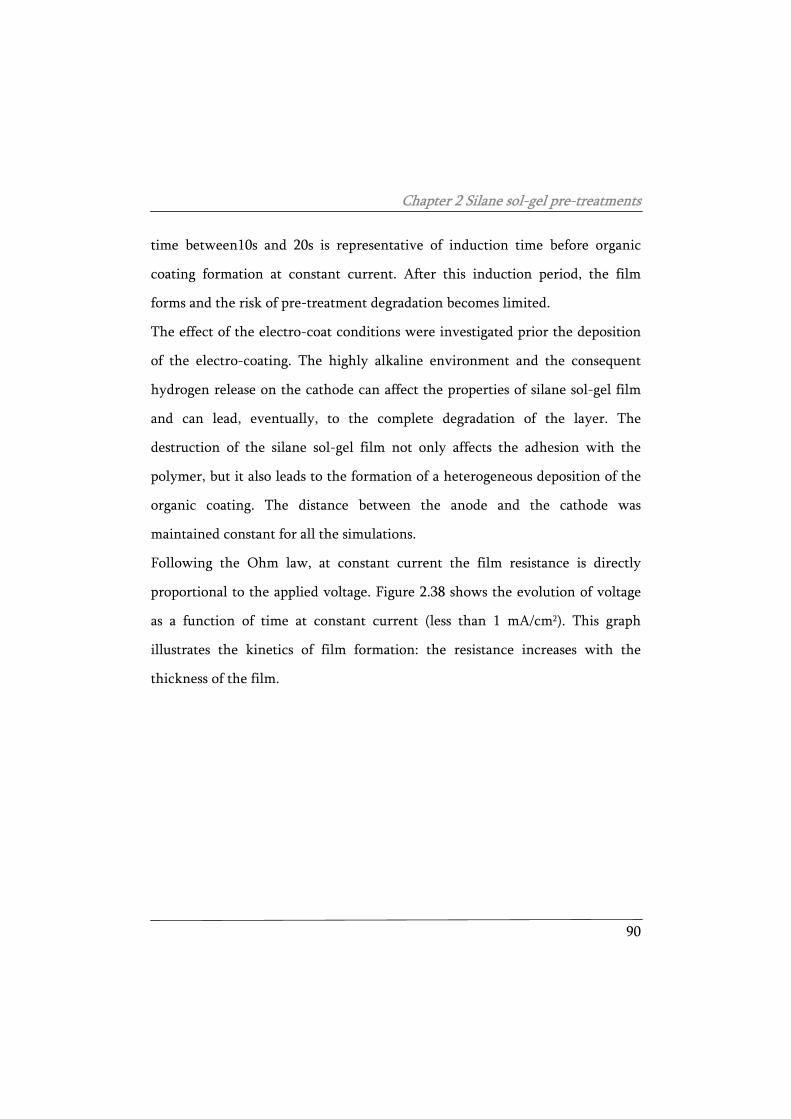
Chapter 2 Silane sol-gel pre-treatments
90
time between10s and 20s is representative of induction time before organic
coating formation at constant current. After this induction period, the film
forms and the risk of pre-treatment degradation becomes limited.
The effect of the electro-coat conditions were investigated prior the deposition
of the electro-coating. The highly alkaline environment and the consequent
hydrogen release on the cathode can affect the properties of silane sol-gel film
and can lead, eventually, to the complete degradation of the layer. The
destruction of the silane sol-gel film not only affects the adhesion with the
polymer, but it also leads to the formation of a heterogeneous deposition of the
organic coating. The distance between the anode and the cathode was
maintained constant for all the simulations.
Following the Ohm law, at constant current the film resistance is directly
proportional to the applied voltage. Figure 2.38 shows the evolution of voltage
as a function of time at constant current (less than 1 mA/cm2). This graph
illustrates the kinetics of film formation: the resistance increases with the
thickness of the film.
Chapter 2 Silane sol-gel pre-treatments
91
Voltage (V)
Times (seconds)
100
200
50 100
Figure 2.38 Simulation of film formation: voltage vs. time at constant current (about 1 mA/cm2)
Considering the graph depicted in Figure 2.38, three parts can be distinguished:
- in red, a first part corresponding to water electrolysis at the cathode.
This part represents the time to reach the pH corresponding to electro-
coagulation. Film resistance is practically zero.
- in green: electro-deposition begins. The film resistance slightly
increases.
- in yellow: the increase of the resistance corresponding to film
formation. The rate of the film formation progressively decreases as the
coating thickness increases due to the high resistance of electro-coating.
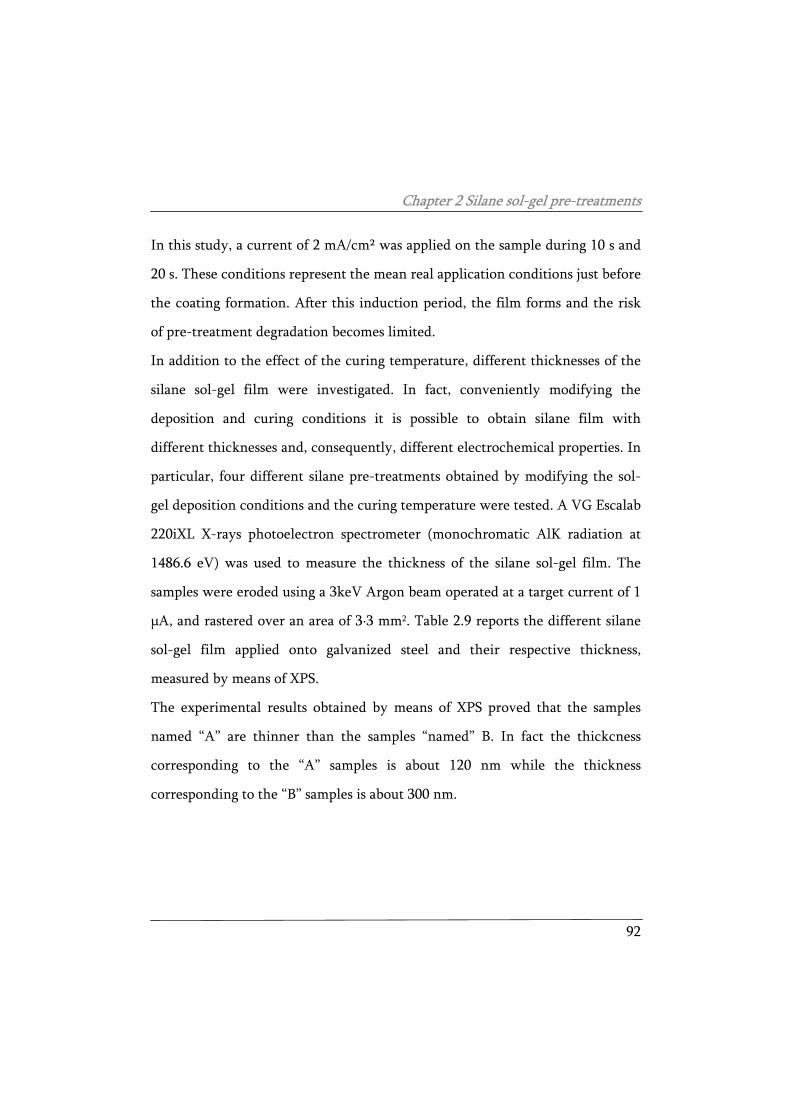
Chapter 2 Silane sol-gel pre-treatments
92
In this study, a current of 2 mA/cm² was applied on the sample during 10 s and
20 s. These conditions represent the mean real application conditions just before
the coating formation. After this induction period, the film forms and the risk
of pre-treatment degradation becomes limited.
In addition to the effect of the curing temperature, different thicknesses of the
silane sol-gel film were investigated. In fact, conveniently modifying the
deposition and curing conditions it is possible to obtain silane film with
different thicknesses and, consequently, different electrochemical properties. In
particular, four different silane pre-treatments obtained by modifying the sol-
gel deposition conditions and the curing temperature were tested. A VG Escalab
220iXL X-rays photoelectron spectrometer (monochromatic AlK radiation at
1486.6 eV) was used to measure the thickness of the silane sol-gel film. The
samples were eroded using a 3keV Argon beam operated at a target current of 1
μA, and rastered over an area of 3·3 mm2. Table 2.9 reports the different silane
sol-gel film applied onto galvanized steel and their respective thickness,
measured by means of XPS.
The experimental results obtained by means of XPS proved that the samples
named “A” are thinner than the samples “named” B. In fact the thickcness
corresponding to the “A” samples is about 120 nm while the thickness
corresponding to the “B” samples is about 300 nm.
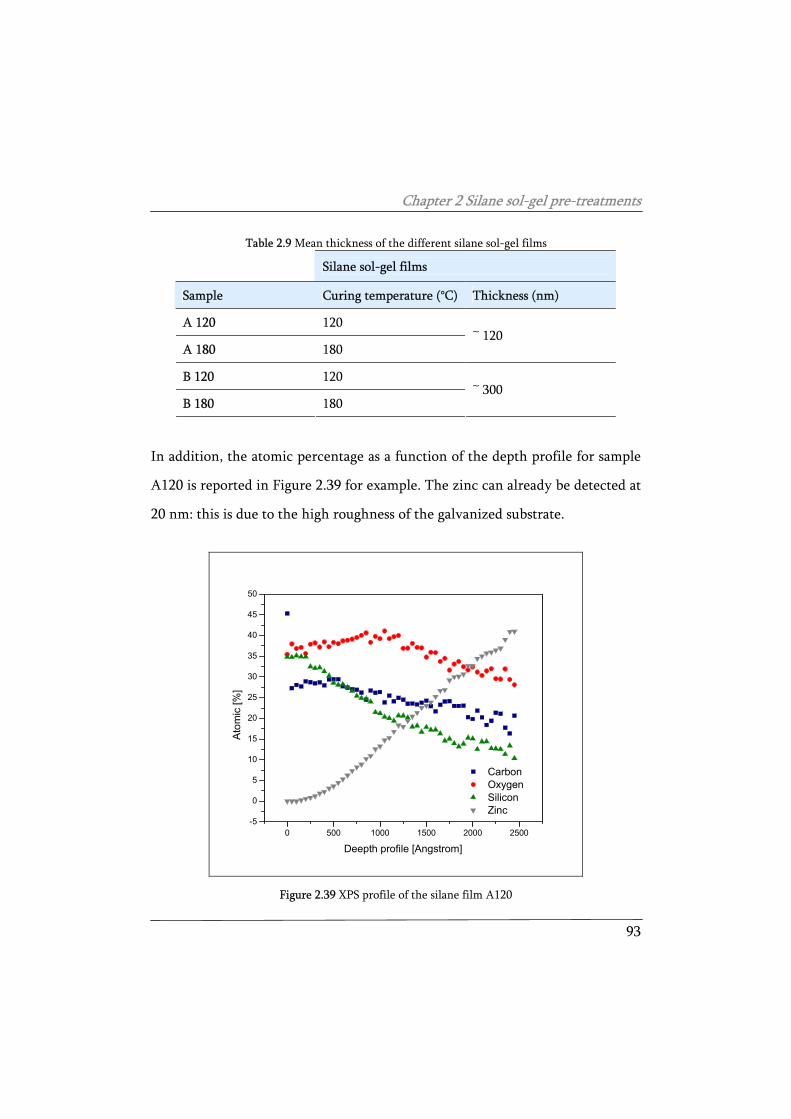
Chapter 2 Silane sol-gel pre-treatments
93
Table 2.9 Mean thickness of the different silane sol-gel films
Silane sol-gel films
Sample Curing temperature (°C) Thickness (nm)
A 120 120
A 180 180 ~ 120
B 120 120
B 180 180 ~ 300
In addition, the atomic percentage as a function of the depth profile for sample
A120 is reported in Figure 2.39 for example. The zinc can already be detected at
20 nm: this is due to the high roughness of the galvanized substrate.
0 500 1000 1500 2000 2500-5
0
5
10
15
20
25
30
35
40
45
50
Ato
mic
[%]
Deepth profile [Angstrom]
Carbon Oxygen Silicon Zinc
Figure 2.39 XPS profile of the silane film A120
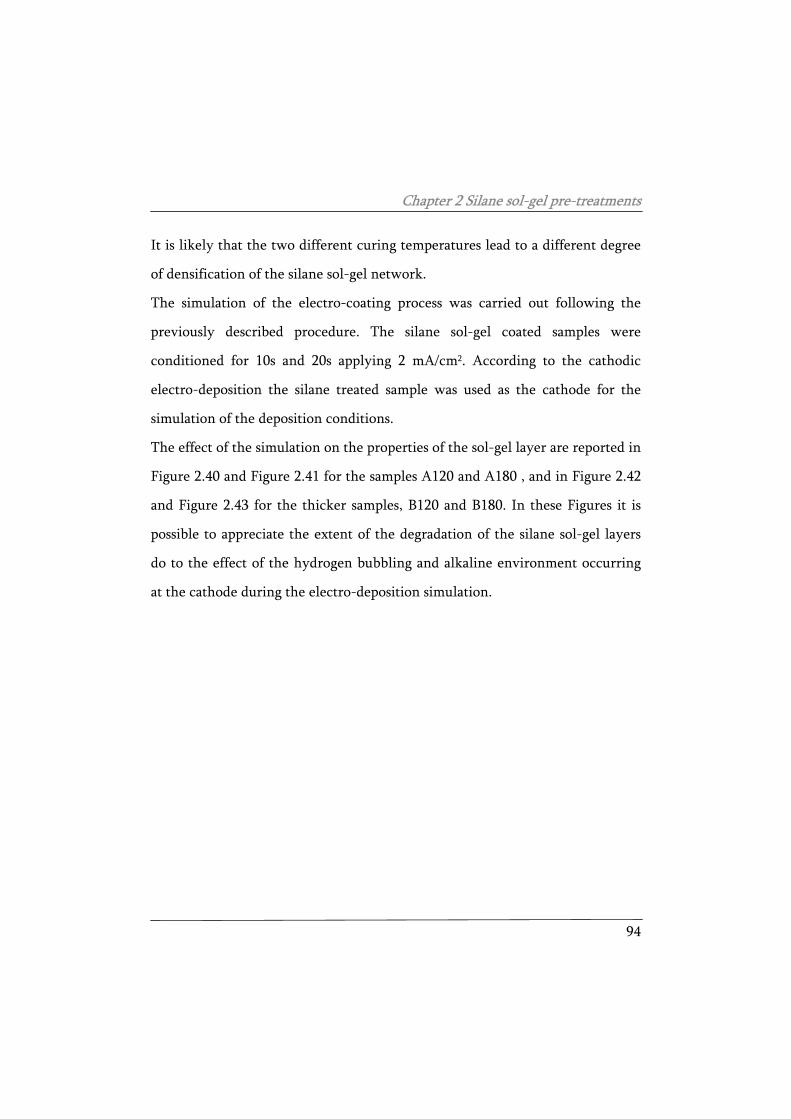
Chapter 2 Silane sol-gel pre-treatments
94
It is likely that the two different curing temperatures lead to a different degree
of densification of the silane sol-gel network.
The simulation of the electro-coating process was carried out following the
previously described procedure. The silane sol-gel coated samples were
conditioned for 10s and 20s applying 2 mA/cm2. According to the cathodic
electro-deposition the silane treated sample was used as the cathode for the
simulation of the deposition conditions.
The effect of the simulation on the properties of the sol-gel layer are reported in
Figure 2.40 and Figure 2.41 for the samples A120 and A180 , and in Figure 2.42
and Figure 2.43 for the thicker samples, B120 and B180. In these Figures it is
possible to appreciate the extent of the degradation of the silane sol-gel layers
do to the effect of the hydrogen bubbling and alkaline environment occurring
at the cathode during the electro-deposition simulation.
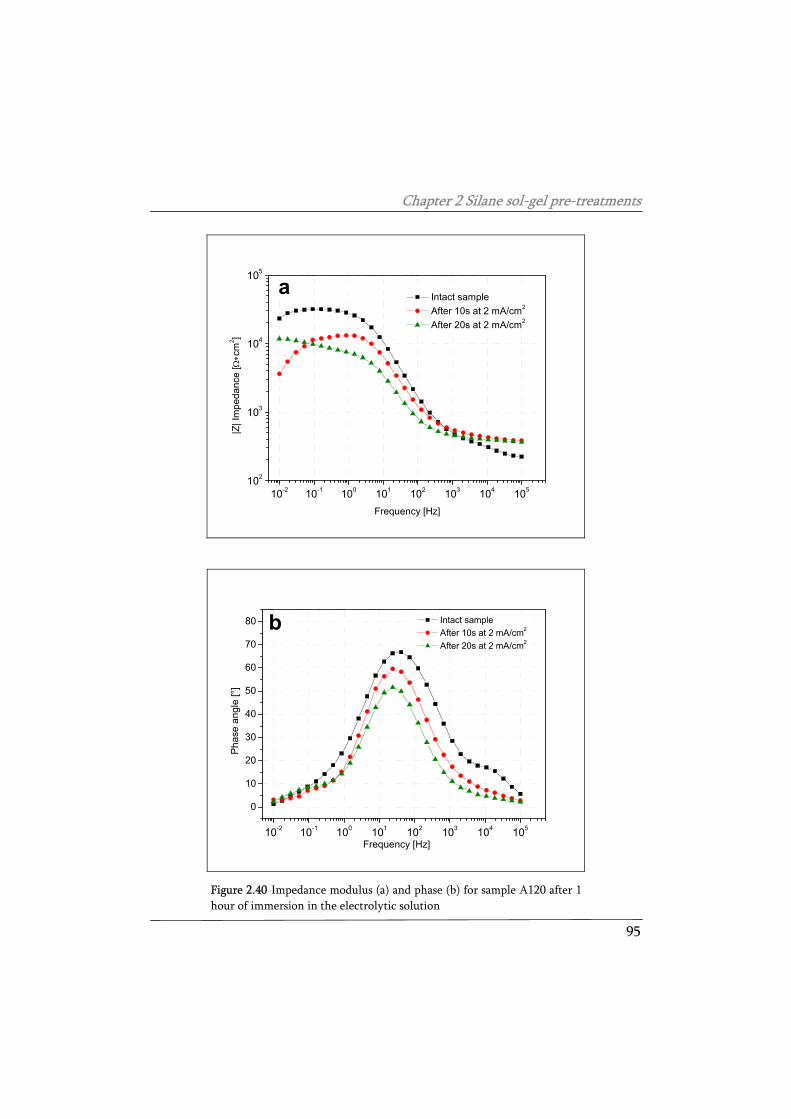
Chapter 2 Silane sol-gel pre-treatments
95
10-2 10-1 100 101 102 103 104 105102
103
104
105
a Intact sample After 10s at 2 mA/cm2
After 20s at 2 mA/cm2
|Z| I
mpe
danc
e [Ω∗c
m2 ]
Frequency [Hz]
10-2 10-1 100 101 102 103 104 105
0
10
20
30
40
50
60
70
80 Intact sample After 10s at 2 mA/cm2
After 20s at 2 mA/cm2
Frequency [Hz]
Phas
e an
gle
[°]
b
Figure 2.40 Impedance modulus (a) and phase (b) for sample A120 after 1 hour of immersion in the electrolytic solution
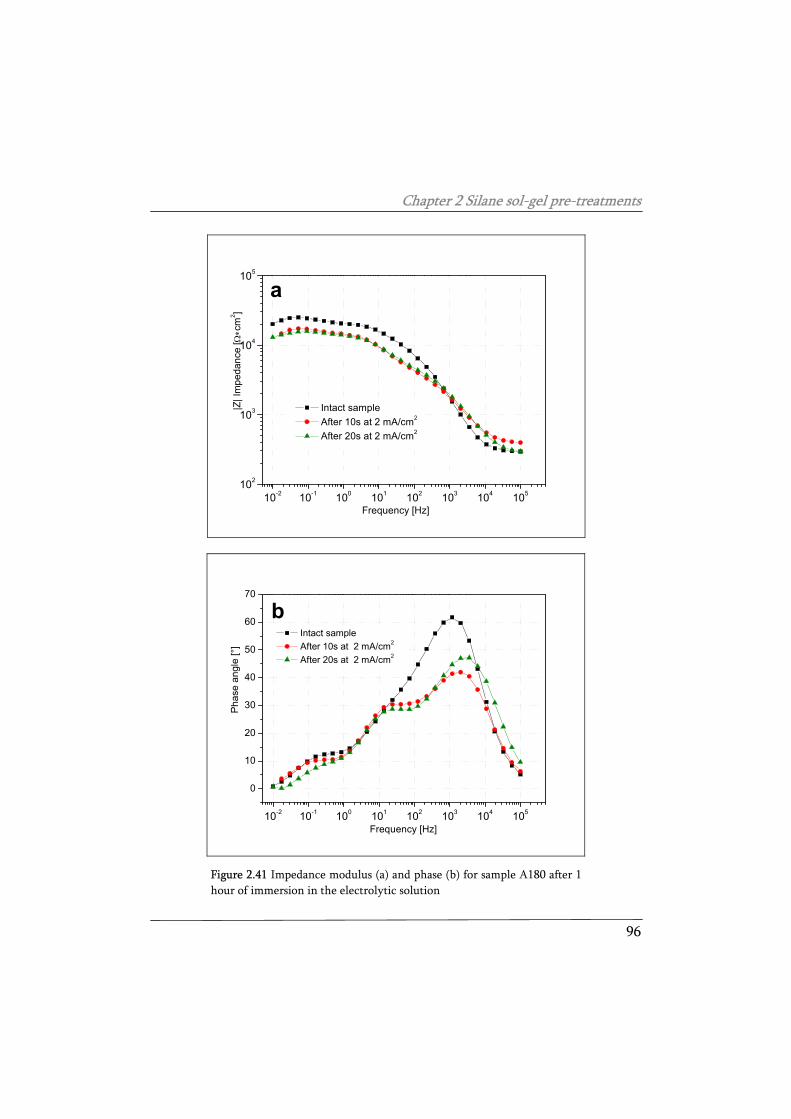
Chapter 2 Silane sol-gel pre-treatments
96
10-2 10-1 100 101 102 103 104 105102
103
104
105
a
|Z| I
mpe
danc
e [Ω∗c
m2 ]
Frequency [Hz]
Intact sample After 10s at 2 mA/cm2
After 20s at 2 mA/cm2
10-2 10-1 100 101 102 103 104 105
0
10
20
30
40
50
60
70
b Intact sample After 10s at 2 mA/cm2
After 20s at 2 mA/cm2
Phas
e an
gle
[°]
Frequency [Hz]
Figure 2.41 Impedance modulus (a) and phase (b) for sample A180 after 1 hour of immersion in the electrolytic solution
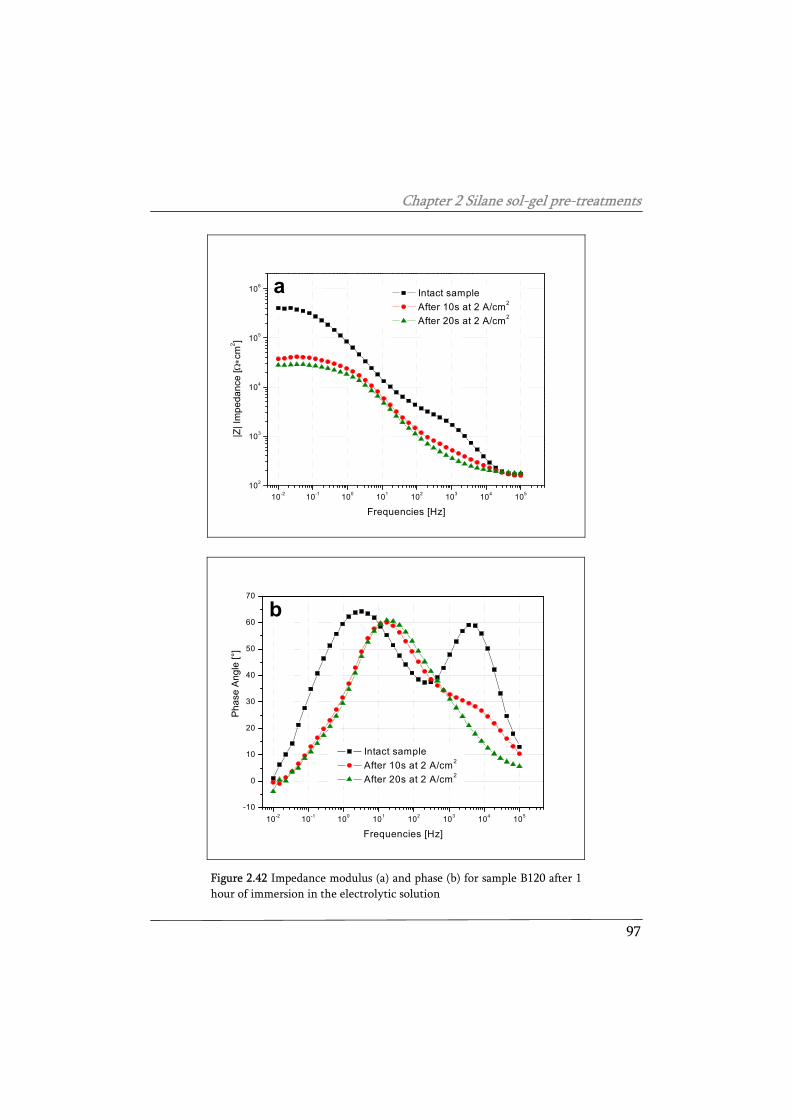
Chapter 2 Silane sol-gel pre-treatments
97
10-2 10-1 100 101 102 103 104 105102
103
104
105
106
|Z| I
mpe
danc
e [Ω∗c
m2 ]
Frequencies [Hz]
Intact sample After 10s at 2 A/cm2
After 20s at 2 A/cm2
a
10-2 10-1 100 101 102 103 104 105-10
0
10
20
30
40
50
60
70
b
Pha
se A
ngle
[°]
Intact sample After 10s at 2 A/cm2
After 20s at 2 A/cm2
Frequencies [Hz]
Figure 2.42 Impedance modulus (a) and phase (b) for sample B120 after 1 hour of immersion in the electrolytic solution
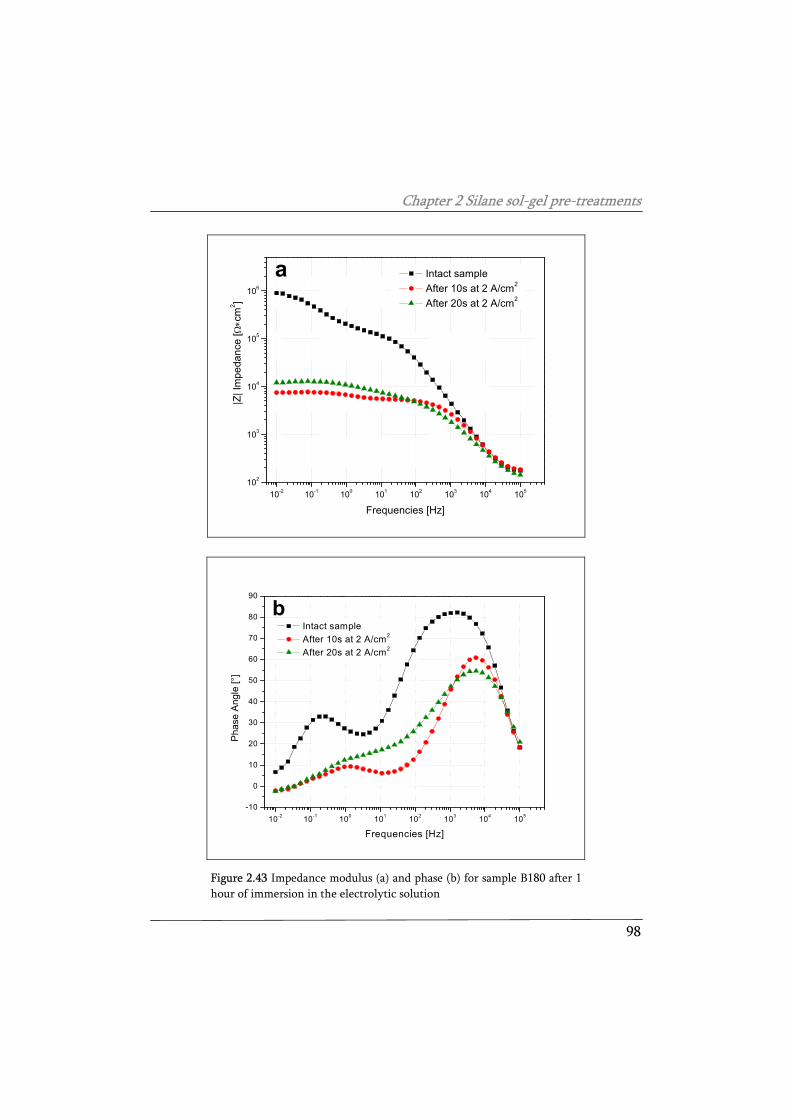
Chapter 2 Silane sol-gel pre-treatments
98
10-2 10-1 100 101 102 103 104 105102
103
104
105
106
a|Z
| Im
peda
nce
[Ω∗c
m2 ]
Intact sample After 10s at 2 A/cm2
After 20s at 2 A/cm2
Frequencies [Hz]
10-2 10-1 100 101 102 103 104 105-10
0
10
20
30
40
50
60
70
80
90
b Intact sample After 10s at 2 A/cm2
After 20s at 2 A/cm2
Pha
se A
ngle
[°]
Frequencies [Hz]
Figure 2.43 Impedance modulus (a) and phase (b) for sample B180 after 1 hour of immersion in the electrolytic solution
Chapter 2 Silane sol-gel pre-treatments
99
First of all, notice the great differences between the impedance at low
frequencies of the two different kinds of samples. The samples with the thinner
sol-gel film are characterized by values of the low frequencies impedance in the
order of 104 Ω•cm2, while in the order of 106 Ω•cm2 the other samples. This
difference is directly related to the different thickness of the samples. A higher
thickness leads to higher barrier properties of the silane sol-gel film but also to
an increasing electrical resistance during the electrodeposition. By considering
the impedance modulus in Figures 2.43, 2.41, 2.42 and 2.43, it seems that the
simulation leads to a considerable degradation of the properties of the thicker
films. On the other hand, the thinner silane sol-gel layers show little decrease
of the low frequencies impedance. In particular, sample A180 has very
comparable values of the low frequencies impedance before and after the
simulation. It is likely that the highest conductivity and lowest impedance of
the low barrier samples lead to a lower extent of deterioration. This could be
explained by a more uniform distribution of the current and hydrogen
evolution on the entire surface. Indeed, the samples with high initial impedance
does not allow the hydrogen evolution and the forced bubbling could be
responsible of the decrease of the properties.
It is possible to evaluate the influence of the simulated deposition conditions by
considering the phase diagrams of Figures 2.40, 2.41, 2.42 and 2.43. The high
frequencies time constant (around 103 -104 Hz) is commonly related to the
silane sol-gel film [119]. Thus, by monitoring the evolution of the maximum
value of the phase angle of the first time constant, it is possible to detect the
degradation of the silane sol-gel layer. For the sample A120 the first time
Chapter 2 Silane sol-gel pre-treatments
100
constant shows a very low phase angle even before the simulation. After the 20
seconds of simulation, the high frequency time constant is no more noticeable.
The B120 silane behaves similarly. In fact, even if it shows an easily detectable
high frequency time constant, the application of the 2 mA/cm2 leads to a quick
decrease of the silane sol-gel properties. The maximum value of the phase angle
of the time constant at around 103-104 Hz shows a great decrease after 10
seconds of simulation, and eventually, it disappears completely after 20 seconds.
The silane sol-gel films designed with high thickness show a huge decrease of
the low frequencies impedance, up to two orders of magnitude. It is likely that
this kind of pre-treatments have too high barrier properties, they are thick and,
maybe, brittle. In spite of the correct reason, it is evident that the synergic
effect of the hydrogen evolution and the local increase of the pH affect strongly
the properties of this kind of films.
After the different simulations the low frequencies impedance are
approximately the same for all the samples, in the order of 104 Ω•cm2.
Regarding the different conditioning time, there is a slightly different
behaviour after 10 or 20 seconds of simulation. In general, the longest the
application of the current, the highest is the damage of the silane sol-gel film.
Coating the silane pre-treated samples with the electro-coat paint will allow to
verify if the degradation induced by the deposition conditions affects the final
properties of the complete protection system.
According to the previously explained parameters, the electro-coat was applied
on the different silane sol-gel treated samples and, for comparison, on bare
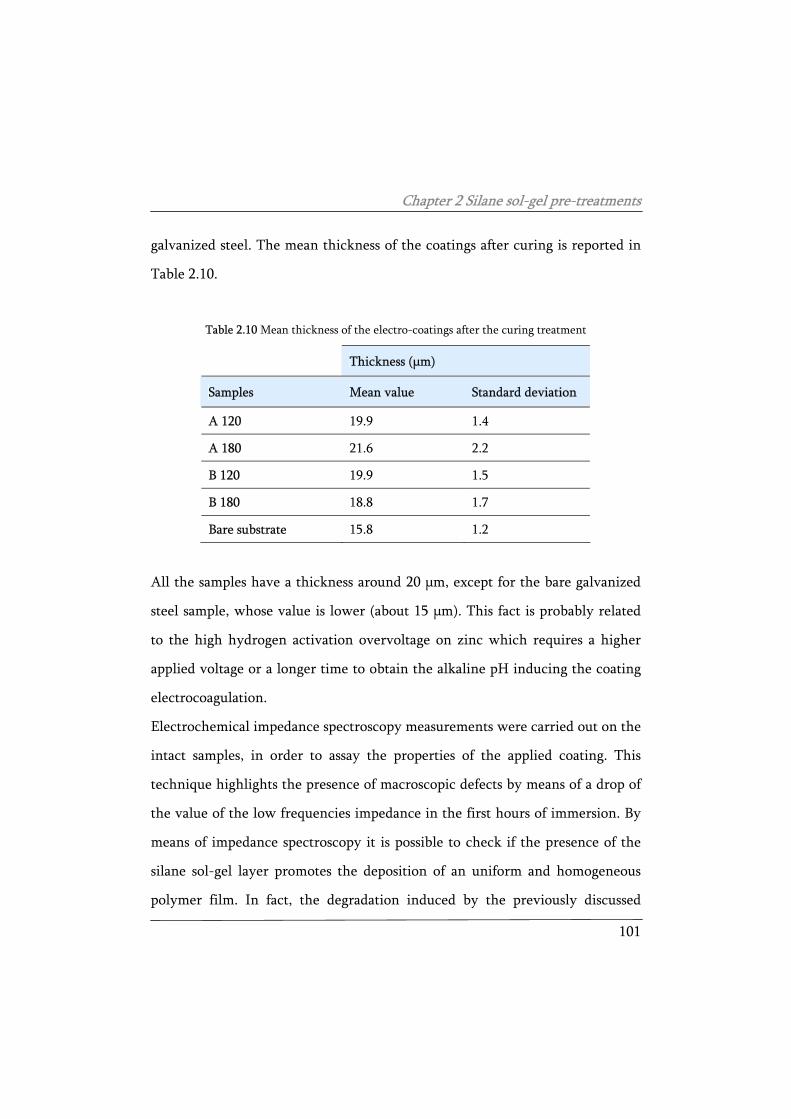
Chapter 2 Silane sol-gel pre-treatments
101
galvanized steel. The mean thickness of the coatings after curing is reported in
Table 2.10.
Table 2.10 Mean thickness of the electro-coatings after the curing treatment
Thickness (μm)
Samples Mean value Standard deviation
A 120 19.9 1.4
A 180 21.6 2.2
B 120 19.9 1.5
B 180 18.8 1.7
Bare substrate 15.8 1.2
All the samples have a thickness around 20 μm, except for the bare galvanized
steel sample, whose value is lower (about 15 μm). This fact is probably related
to the high hydrogen activation overvoltage on zinc which requires a higher
applied voltage or a longer time to obtain the alkaline pH inducing the coating
electrocoagulation.
Electrochemical impedance spectroscopy measurements were carried out on the
intact samples, in order to assay the properties of the applied coating. This
technique highlights the presence of macroscopic defects by means of a drop of
the value of the low frequencies impedance in the first hours of immersion. By
means of impedance spectroscopy it is possible to check if the presence of the
silane sol-gel layer promotes the deposition of an uniform and homogeneous
polymer film. In fact, the degradation induced by the previously discussed
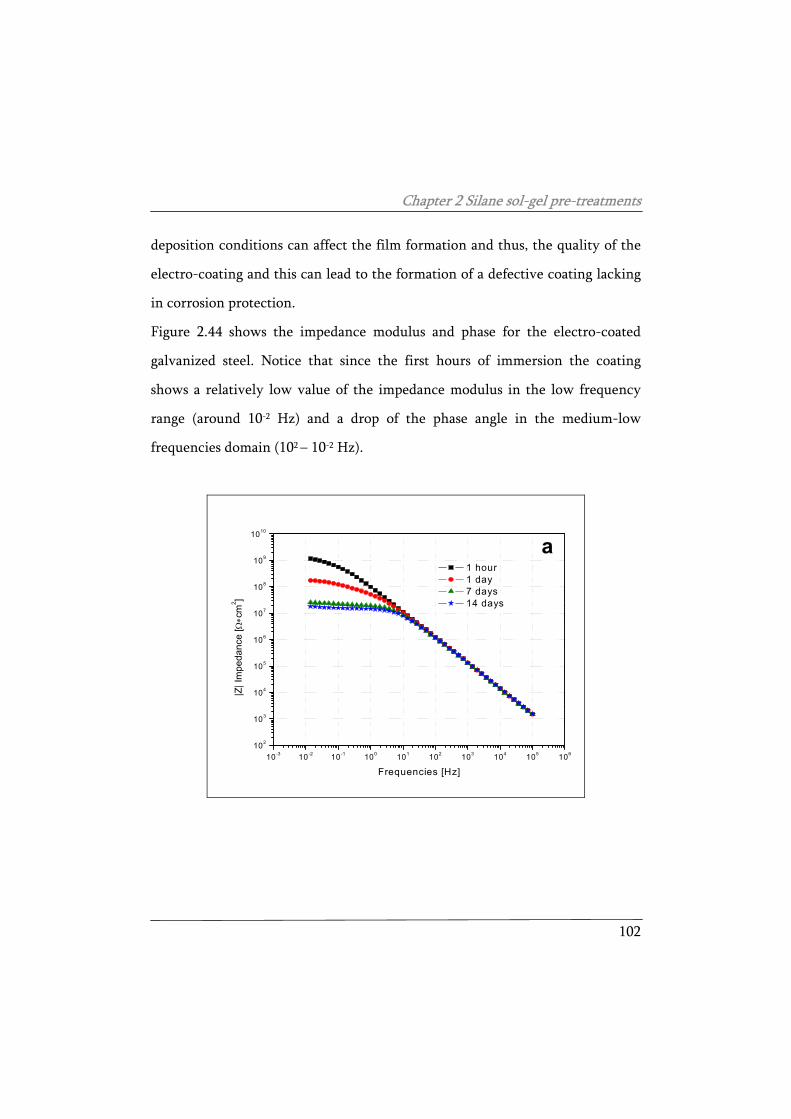
Chapter 2 Silane sol-gel pre-treatments
102
deposition conditions can affect the film formation and thus, the quality of the
electro-coating and this can lead to the formation of a defective coating lacking
in corrosion protection.
Figure 2.44 shows the impedance modulus and phase for the electro-coated
galvanized steel. Notice that since the first hours of immersion the coating
shows a relatively low value of the impedance modulus in the low frequency
range (around 10-2 Hz) and a drop of the phase angle in the medium-low
frequencies domain (102 – 10-2 Hz).
10-3 10-2 10-1 100 101 102 103 104 105 106102
103
104
105
106
107
108
109
1010
1 hour 1 day 7 days 14 days
|Z| I
mpe
danc
e [Ω∗c
m2 ]
Frequencies [Hz]
a
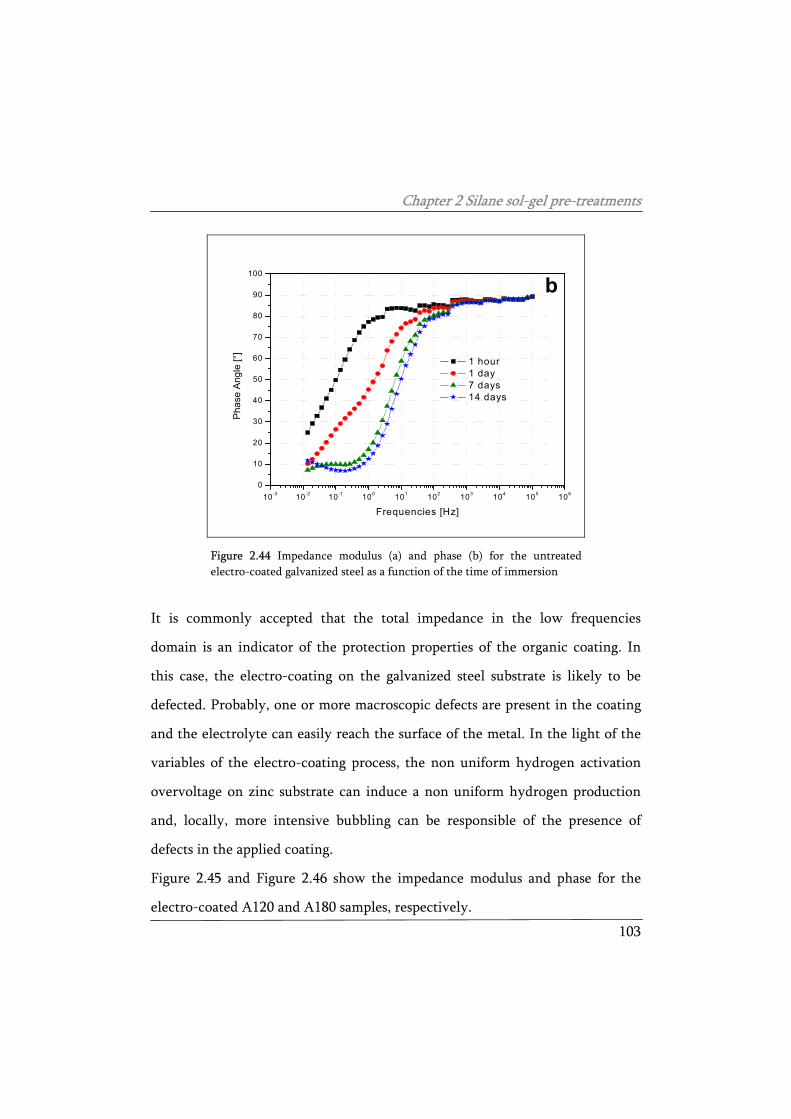
Chapter 2 Silane sol-gel pre-treatments
103
10-3 10-2 10-1 100 101 102 103 104 105 1060
10
20
30
40
50
60
70
80
90
100
b
1 hour 1 day 7 days 14 days
Pha
se A
ngle
[°]
Frequencies [Hz]
Figure 2.44 Impedance modulus (a) and phase (b) for the untreated electro-coated galvanized steel as a function of the time of immersion
It is commonly accepted that the total impedance in the low frequencies
domain is an indicator of the protection properties of the organic coating. In
this case, the electro-coating on the galvanized steel substrate is likely to be
defected. Probably, one or more macroscopic defects are present in the coating
and the electrolyte can easily reach the surface of the metal. In the light of the
variables of the electro-coating process, the non uniform hydrogen activation
overvoltage on zinc substrate can induce a non uniform hydrogen production
and, locally, more intensive bubbling can be responsible of the presence of
defects in the applied coating.
Figure 2.45 and Figure 2.46 show the impedance modulus and phase for the
electro-coated A120 and A180 samples, respectively.
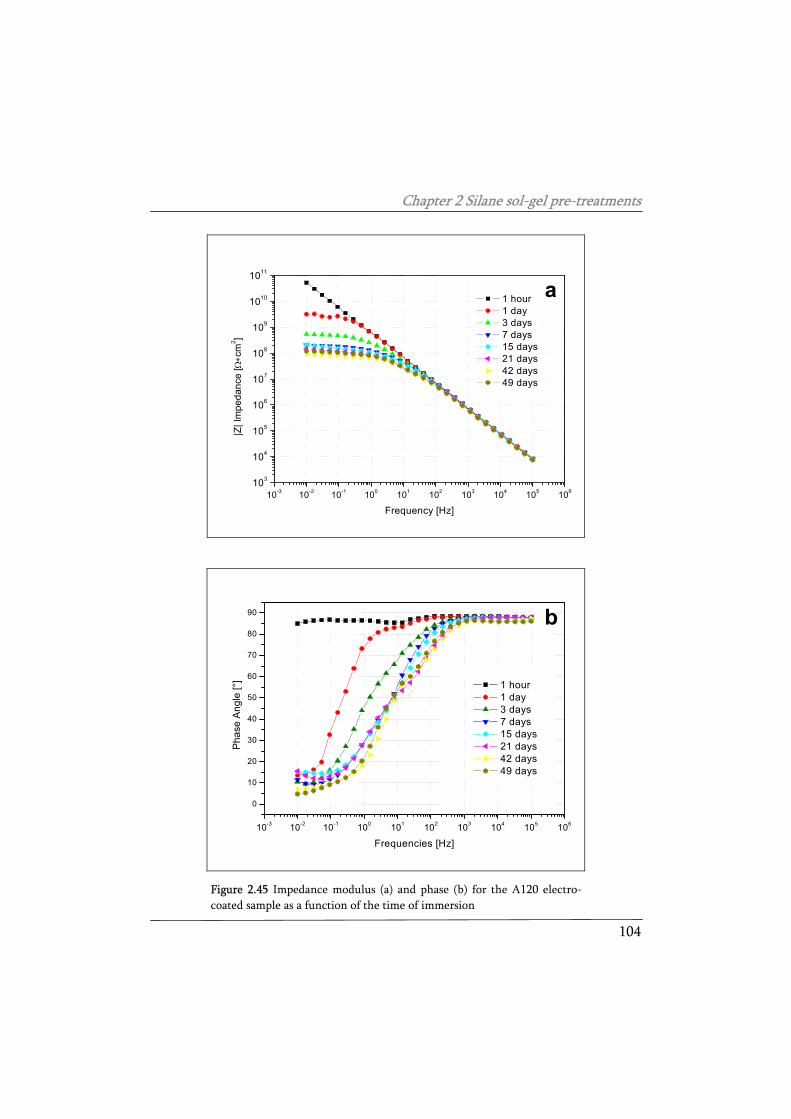
Chapter 2 Silane sol-gel pre-treatments
104
10-3 10-2 10-1 100 101 102 103 104 105 106103
104
105
106
107
108
109
1010
1011
|Z| I
mpe
danc
e [Ω∗c
m2 ]
Frequency [Hz]
1 hour 1 day 3 days 7 days 15 days 21 days 42 days 49 days
a
10-3 10-2 10-1 100 101 102 103 104 105 106
0
10
20
30
40
50
60
70
80
90
1 hour 1 day 3 days 7 days 15 days 21 days 42 days 49 days
Pha
se A
ngle
[°]
Frequencies [Hz]
b
Figure 2.45 Impedance modulus (a) and phase (b) for the A120 electro-coated sample as a function of the time of immersion
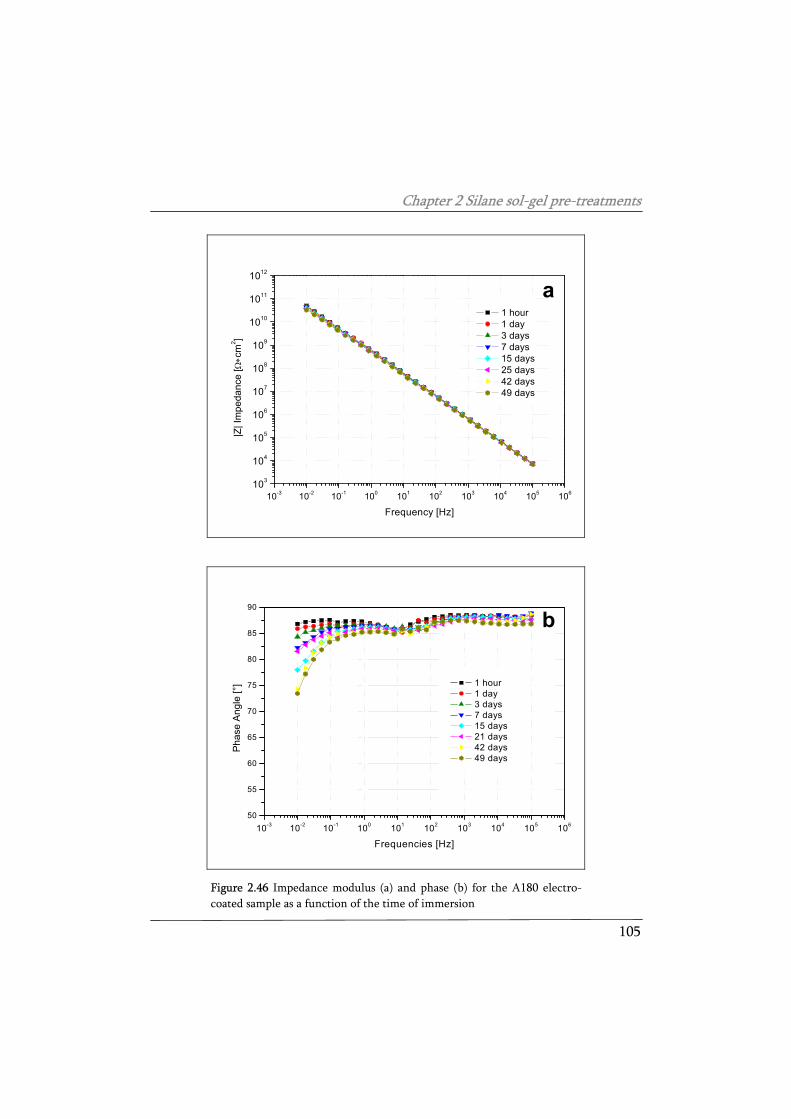
Chapter 2 Silane sol-gel pre-treatments
105
10-3 10-2 10-1 100 101 102 103 104 105 106103
104
105
106
107
108
109
1010
1011
1012
|Z| I
mpe
danc
e [Ω∗c
m2 ]
Frequency [Hz]
1 hour 1 day 3 days 7 days 15 days 25 days 42 days 49 days
a
10-3 10-2 10-1 100 101 102 103 104 105 10650
55
60
65
70
75
80
85
90
1 hour 1 day 3 days 7 days 15 days 21 days 42 days 49 days
Phas
e An
gle
[°]
Frequencies [Hz]
b
Figure 2.46 Impedance modulus (a) and phase (b) for the A180 electro-coated sample as a function of the time of immersion
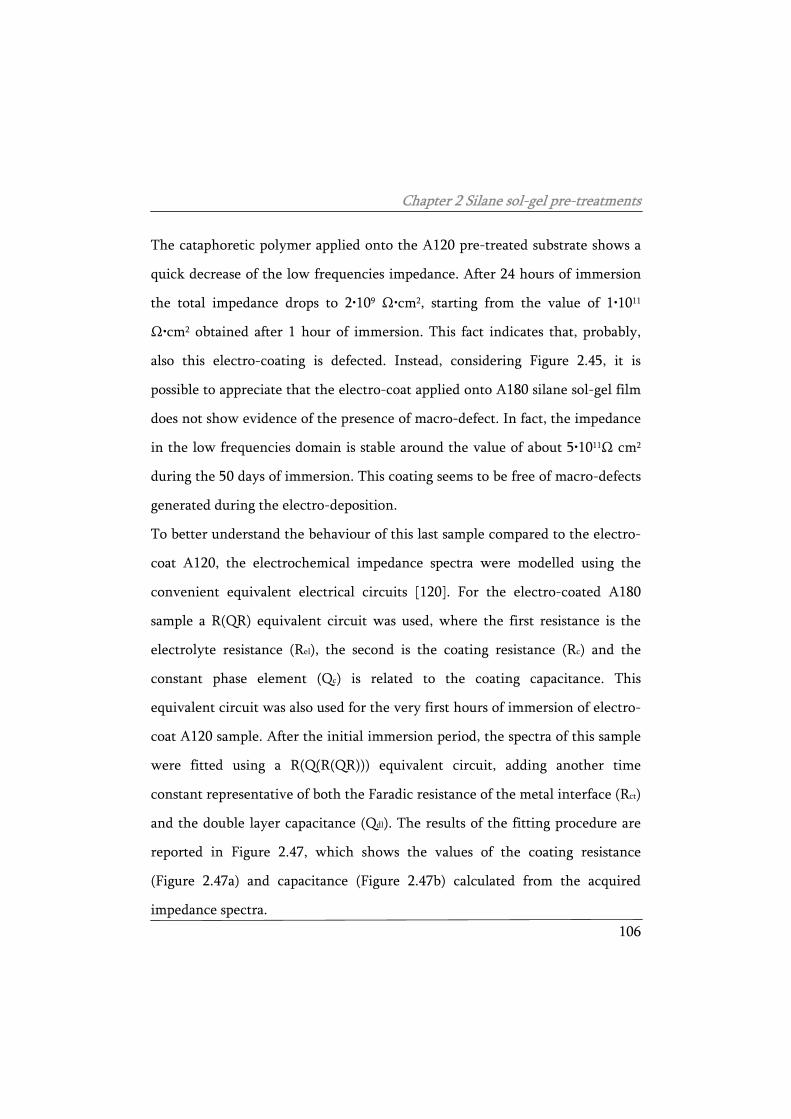
Chapter 2 Silane sol-gel pre-treatments
106
The cataphoretic polymer applied onto the A120 pre-treated substrate shows a
quick decrease of the low frequencies impedance. After 24 hours of immersion
the total impedance drops to 2•109 Ω•cm2, starting from the value of 1•1011
Ω•cm2 obtained after 1 hour of immersion. This fact indicates that, probably,
also this electro-coating is defected. Instead, considering Figure 2.45, it is
possible to appreciate that the electro-coat applied onto A180 silane sol-gel film
does not show evidence of the presence of macro-defect. In fact, the impedance
in the low frequencies domain is stable around the value of about 5•1011Ω cm2
during the 50 days of immersion. This coating seems to be free of macro-defects
generated during the electro-deposition.
To better understand the behaviour of this last sample compared to the electro-
coat A120, the electrochemical impedance spectra were modelled using the
convenient equivalent electrical circuits [120]. For the electro-coated A180
sample a R(QR) equivalent circuit was used, where the first resistance is the
electrolyte resistance (Rel), the second is the coating resistance (Rc) and the
constant phase element (Qc) is related to the coating capacitance. This
equivalent circuit was also used for the very first hours of immersion of electro-
coat A120 sample. After the initial immersion period, the spectra of this sample
were fitted using a R(Q(R(QR))) equivalent circuit, adding another time
constant representative of both the Faradic resistance of the metal interface (Rct)
and the double layer capacitance (Qdl). The results of the fitting procedure are
reported in Figure 2.47, which shows the values of the coating resistance
(Figure 2.47a) and capacitance (Figure 2.47b) calculated from the acquired
impedance spectra.
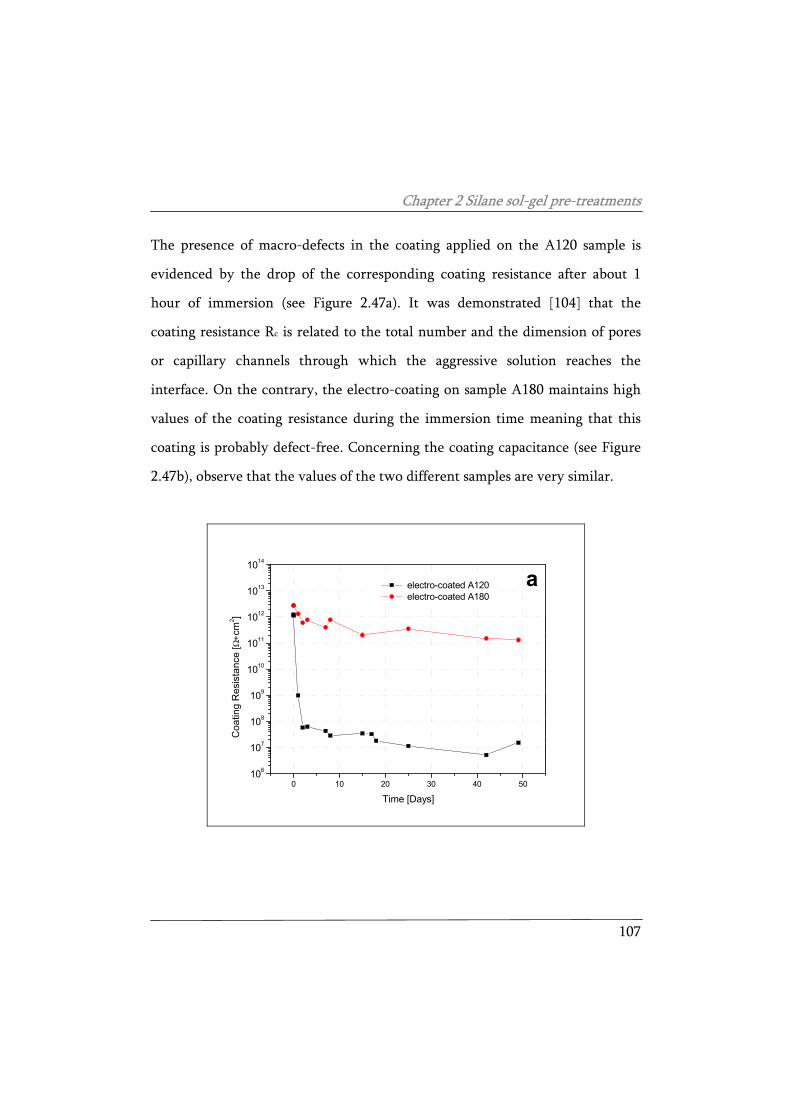
Chapter 2 Silane sol-gel pre-treatments
107
The presence of macro-defects in the coating applied on the A120 sample is
evidenced by the drop of the corresponding coating resistance after about 1
hour of immersion (see Figure 2.47a). It was demonstrated [104] that the
coating resistance Rc is related to the total number and the dimension of pores
or capillary channels through which the aggressive solution reaches the
interface. On the contrary, the electro-coating on sample A180 maintains high
values of the coating resistance during the immersion time meaning that this
coating is probably defect-free. Concerning the coating capacitance (see Figure
2.47b), observe that the values of the two different samples are very similar.
0 10 20 30 40 50106
107
108
109
1010
1011
1012
1013
1014
electro-coated A120 electro-coated A180
Coa
ting
Res
ista
nce
[Ω∗c
m2 ]
Time [Days]
a
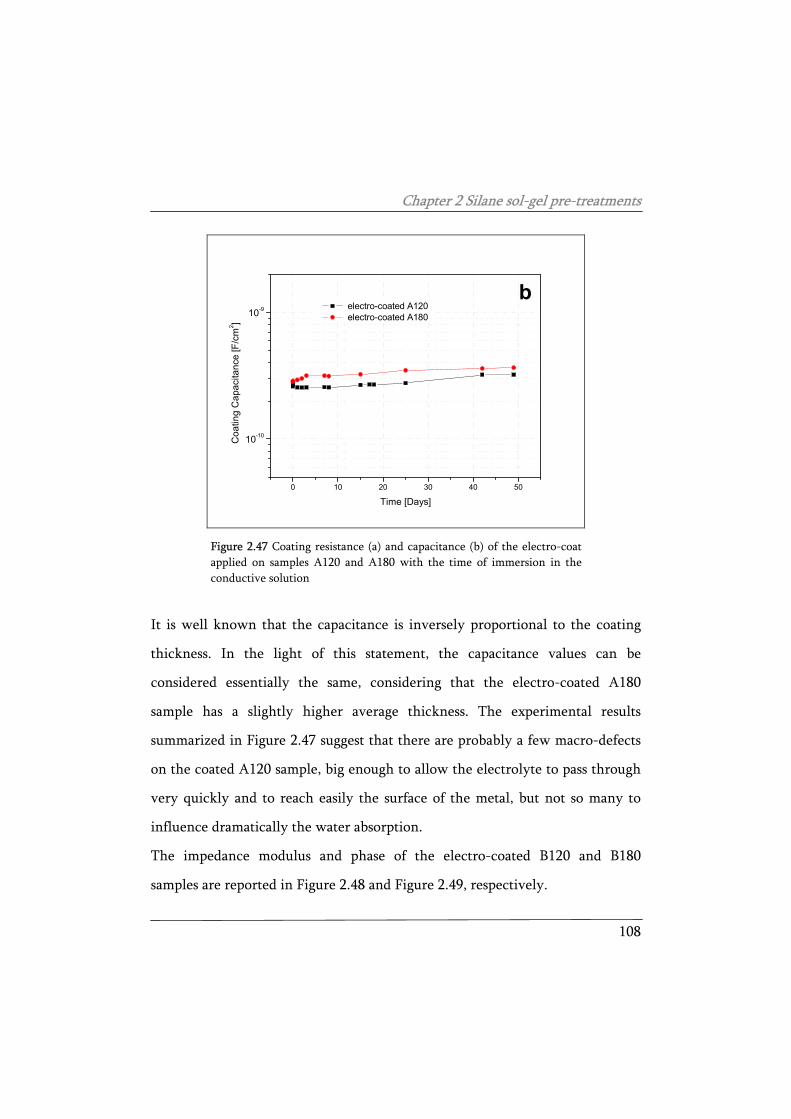
Chapter 2 Silane sol-gel pre-treatments
108
0 10 20 30 40 50
10-10
10-9 electro-coated A120 electro-coated A180
Coa
ting
Cap
acita
nce
[F/c
m2 ]
Time [Days]
b
Figure 2.47 Coating resistance (a) and capacitance (b) of the electro-coat applied on samples A120 and A180 with the time of immersion in the conductive solution
It is well known that the capacitance is inversely proportional to the coating
thickness. In the light of this statement, the capacitance values can be
considered essentially the same, considering that the electro-coated A180
sample has a slightly higher average thickness. The experimental results
summarized in Figure 2.47 suggest that there are probably a few macro-defects
on the coated A120 sample, big enough to allow the electrolyte to pass through
very quickly and to reach easily the surface of the metal, but not so many to
influence dramatically the water absorption.
The impedance modulus and phase of the electro-coated B120 and B180
samples are reported in Figure 2.48 and Figure 2.49, respectively.
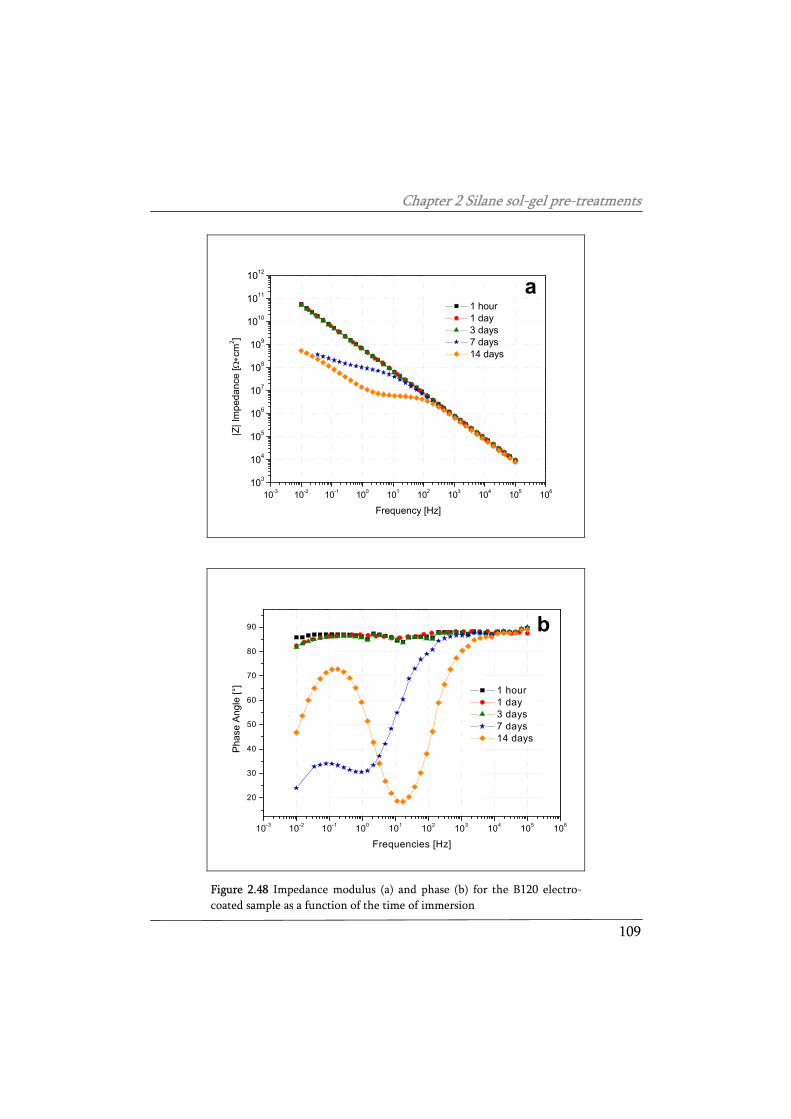
Chapter 2 Silane sol-gel pre-treatments
109
10-3 10-2 10-1 100 101 102 103 104 105 106103
104
105
106
107
108
109
1010
1011
1012
|Z| I
mpe
danc
e [Ω∗c
m2 ]
Frequency [Hz]
1 hour 1 day 3 days 7 days 14 days
a
10-3 10-2 10-1 100 101 102 103 104 105 106
20
30
40
50
60
70
80
90 b
1 hour 1 day 3 days 7 days 14 days
Pha
se A
ngle
[°]
Frequencies [Hz]
Figure 2.48 Impedance modulus (a) and phase (b) for the B120 electro-coated sample as a function of the time of immersion
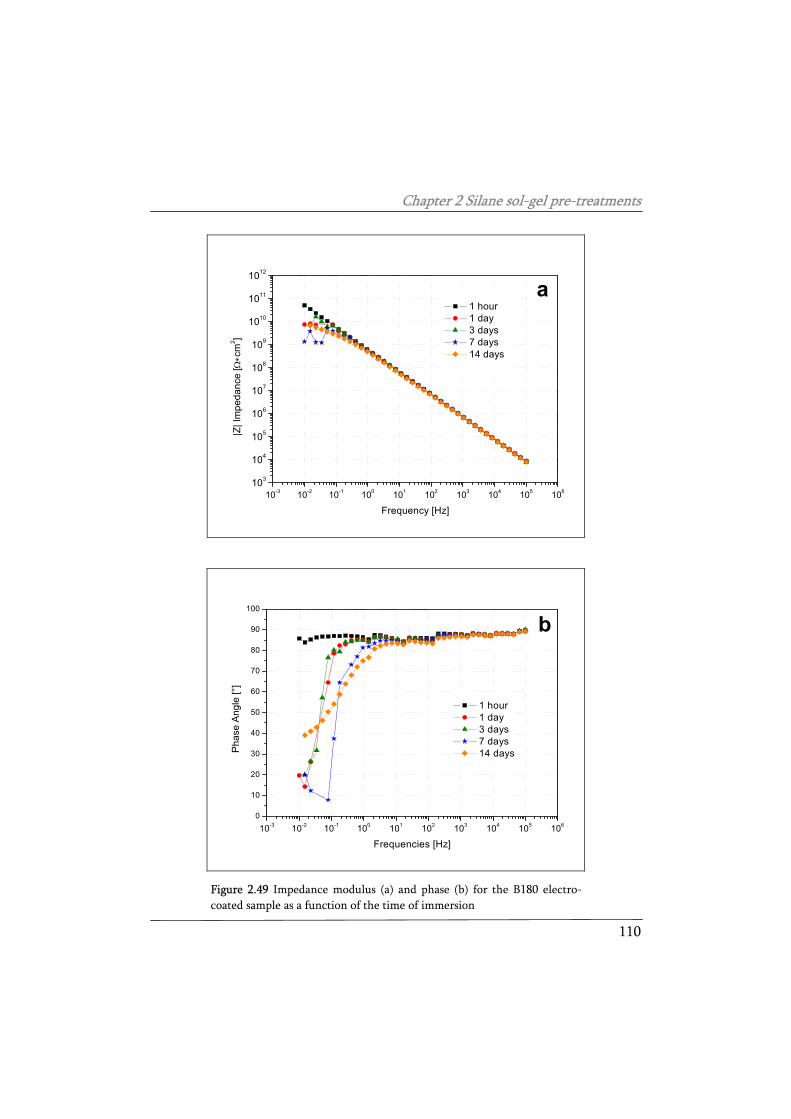
Chapter 2 Silane sol-gel pre-treatments
110
10-3 10-2 10-1 100 101 102 103 104 105 106103
104
105
106
107
108
109
1010
1011
1012
|Z| I
mpe
danc
e [Ω∗c
m2 ]
Frequency [Hz]
1 hour 1 day 3 days 7 days 14 days
a
10-3 10-2 10-1 100 101 102 103 104 105 1060
10
20
30
40
50
60
70
80
90
100
1 hour 1 day 3 days 7 days 14 days
Pha
se A
ngle
[°]
Frequencies [Hz]
b
Figure 2.49 Impedance modulus (a) and phase (b) for the B180 electro-coated sample as a function of the time of immersion
Chapter 2 Silane sol-gel pre-treatments
111
Observe that for both samples the low frequencies impedance decreases very
quickly. In particular, the drop of the total impedance occurs after a few hours
of immersion for the electro-coated B120 sample, while the other sample
maintains high values of the total impedance for about one week. After this
lapse of time a second time constant is also noticeable in the Bode phase graph
of sample B120 (see Figure 2.48a). It is evidence that corrosion is occurring
under-paint. Owing to the low protection properties of the electro-coat coating
on sample B120 and B180 and the beginning of the corrosion processes on
sample B120, the immersion in the aggressive solution was stopped after two
weeks. It is likely that the electro-coatings applied on the thicker sol-gel films
have a few macro-defects due to hydrogen release during the electro-coating
process. It was previously highlighted that the deposition conditions have a
remarkable effect on the properties of the B120 and B180 sol-gel gel layer. The
results of the experimental measurements performed on the electro-coated
samples confirm that the degradation of the sol-gel film caused by the chemical
reactions on the cathode is more pronounced for the high resistance sol-gel
layers.
The wet adhesion and the resistance to the under-paint propagation of the
cathodic front were roughly estimated by means of salt spray test. Scratched
samples were exposed in the salt spray chamber for about 500 hours. The
comparison between the experimental results of the exposure is reported in
Figure 2.50.
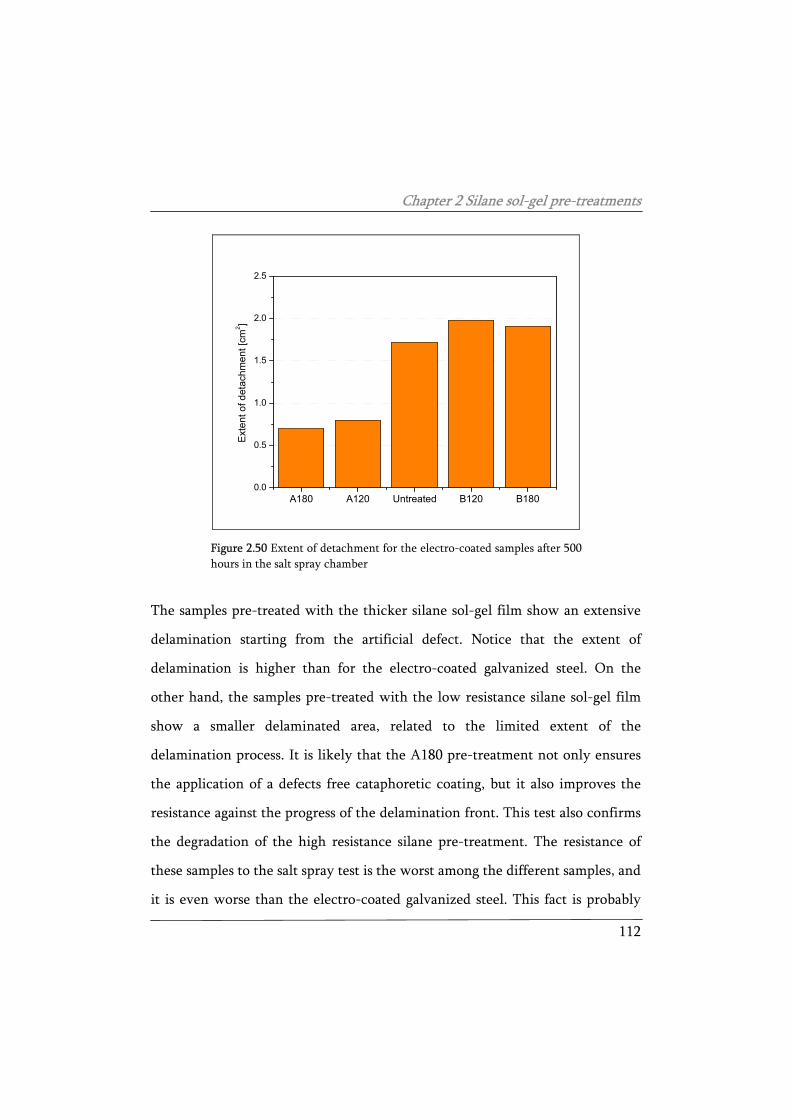
Chapter 2 Silane sol-gel pre-treatments
112
A180 A120 Untreated B120 B1800.0
0.5
1.0
1.5
2.0
2.5
Exte
nt o
f det
achm
ent [
cm2 ]
Figure 2.50 Extent of detachment for the electro-coated samples after 500 hours in the salt spray chamber
The samples pre-treated with the thicker silane sol-gel film show an extensive
delamination starting from the artificial defect. Notice that the extent of
delamination is higher than for the electro-coated galvanized steel. On the
other hand, the samples pre-treated with the low resistance silane sol-gel film
show a smaller delaminated area, related to the limited extent of the
delamination process. It is likely that the A180 pre-treatment not only ensures
the application of a defects free cataphoretic coating, but it also improves the
resistance against the progress of the delamination front. This test also confirms
the degradation of the high resistance silane pre-treatment. The resistance of
these samples to the salt spray test is the worst among the different samples, and
it is even worse than the electro-coated galvanized steel. This fact is probably
Chapter 2 Silane sol-gel pre-treatments
113
due to the deterioration of the silane sol-gel films, which leads to the formation
of an inhomogeneous and defected cataphoretic film, characterized by poor
adhesion to the substrate.
The experimental tests seems to indicate that a proper control of the barrier
properties (and the thickness) of the silane sol-gel conversion layer can lead to
the production of hybrid conversion film with suitable performance to improve
the adhesion of a cataphoretic paint of galvanized steel. Moreover, the sol-gel
film produced with the experimental mixture of silane molecules allows the
formation of a defect free and homogeneous cataphoretic paint film. The final
properties of the complete protection system can be explained in the light of the
flexibility of the sol-gel process and the effectiveness of the experimental silane
mixture.
2.4 Silane sol-gel films containing montmorillonite
nanoparticles
This part of the work aims at investigating the effect of montmorillonite
nanoparticles on the properties of silane mixture sol-gel films for the protection
of galvanized steel. In the previous paragraph, the properties of different silane
sol-gel films were analysed and compared to other traditional pre-treatment for
galvanized steel. It was concluded that the experimental mixture investigated in
this work improve the adhesion between the substrate and a protective organic
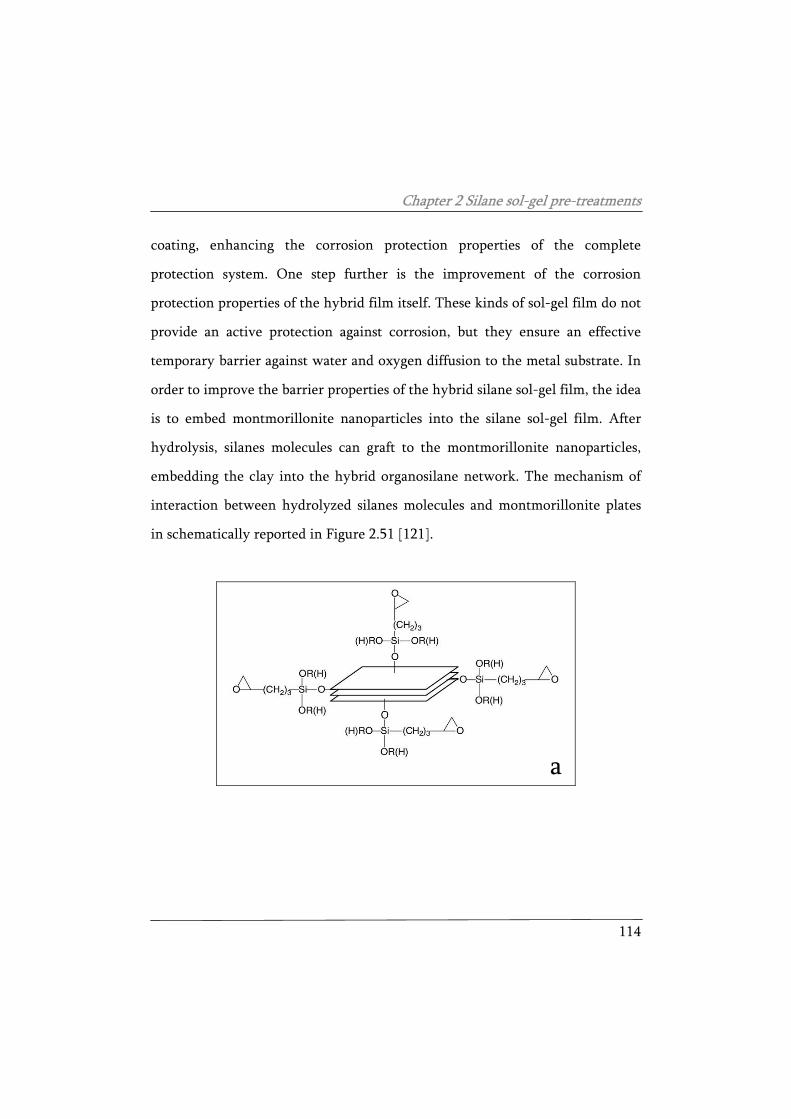
Chapter 2 Silane sol-gel pre-treatments
114
coating, enhancing the corrosion protection properties of the complete
protection system. One step further is the improvement of the corrosion
protection properties of the hybrid film itself. These kinds of sol-gel film do not
provide an active protection against corrosion, but they ensure an effective
temporary barrier against water and oxygen diffusion to the metal substrate. In
order to improve the barrier properties of the hybrid silane sol-gel film, the idea
is to embed montmorillonite nanoparticles into the silane sol-gel film. After
hydrolysis, silanes molecules can graft to the montmorillonite nanoparticles,
embedding the clay into the hybrid organosilane network. The mechanism of
interaction between hydrolyzed silanes molecules and montmorillonite plates
in schematically reported in Figure 2.51 [121].
a
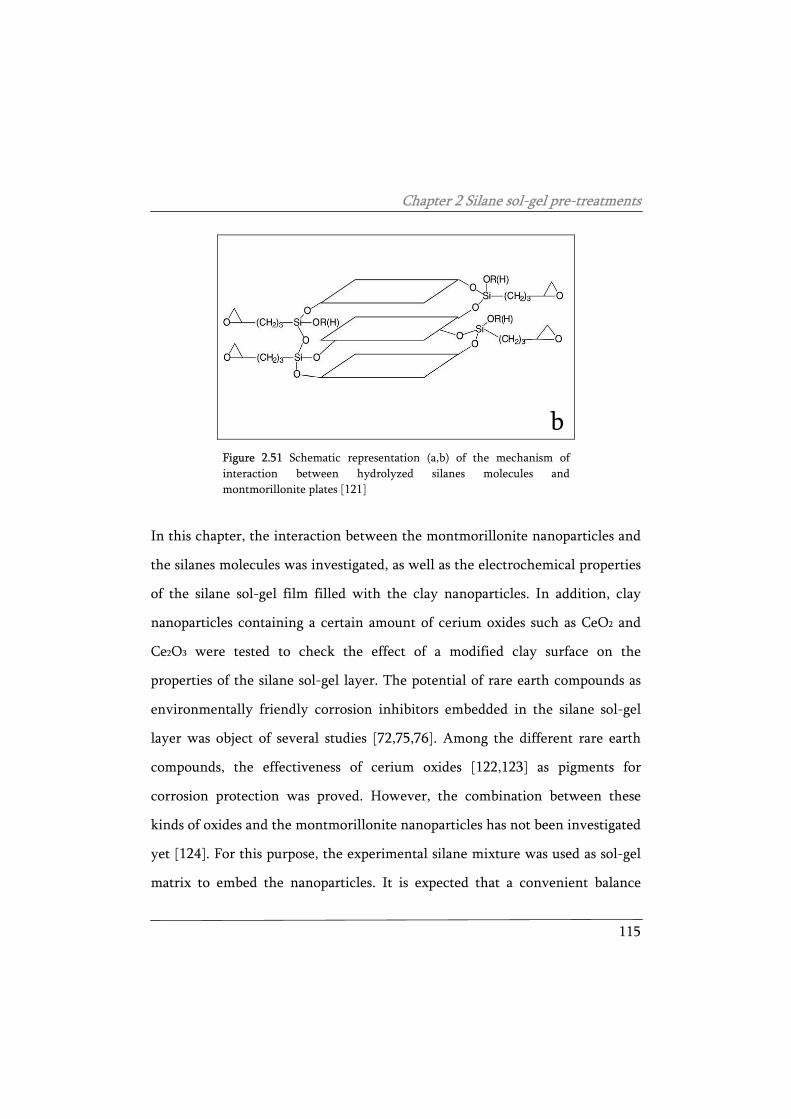
Chapter 2 Silane sol-gel pre-treatments
115
Figure 2.51 Schematic representation (a,b) of the mechanism of interaction between hydrolyzed silanes molecules and montmorillonite plates [121]
In this chapter, the interaction between the montmorillonite nanoparticles and
the silanes molecules was investigated, as well as the electrochemical properties
of the silane sol-gel film filled with the clay nanoparticles. In addition, clay
nanoparticles containing a certain amount of cerium oxides such as CeO2 and
Ce2O3 were tested to check the effect of a modified clay surface on the
properties of the silane sol-gel layer. The potential of rare earth compounds as
environmentally friendly corrosion inhibitors embedded in the silane sol-gel
layer was object of several studies [72,75,76]. Among the different rare earth
compounds, the effectiveness of cerium oxides [122,123] as pigments for
corrosion protection was proved. However, the combination between these
kinds of oxides and the montmorillonite nanoparticles has not been investigated
yet [124]. For this purpose, the experimental silane mixture was used as sol-gel
matrix to embed the nanoparticles. It is expected that a convenient balance
b
Chapter 2 Silane sol-gel pre-treatments
116
between the different silanes molecules and the montmorillonite nanoparticles
provide the sol-gel film with improved corrosion protection properties.
2.4.1 Materials and experimental procedure
The same hot dip galvanized steel sheets (Zn alloy: 0.25 w/w% Al, supplied by
Arcelor Mittal, Belgium) with a mean roughness of were 1.59 μm used in the
previous part were employed as substrate for the application of the
montmorillonite enriched silane sol-gel films.
After the cleaning of the galvanized steel substrate, performed following the
previously discussed procedure, the samples were pre-treated with the sol-gel
conversion coatings.
The neat clay mineral used as fillers was a sodium montmorillonite (supplied by
South Clay Products, USA), also called cloisite. The surface of the clay
nanoparticles was modified by adding cerium oxides. The cerium oxides grafted
to the montmorillonite nanoparticles are Ce2O3 and CeO2. In particular, the
amount of the different kinds of cerium oxides used to modify the nanoparticles
is 5 w/w% respect to the weight of the montmorillonite particles.
The clay nanoparticles were ultrasonically dispersed in an aqueous solution.
The pH of the dispersion was properly modified (pH 3.5) adding hydrochloric
acid. Concentrations of 250ppm, 500ppm, 1000ppm of neat montmorillonite
particles in the solution were tested.
Chapter 2 Silane sol-gel pre-treatments
117
The mixture obtained was added to 10 w/w% of silanes molecules. Silane
mixture sol-gel films were applied following the standard procedure at about
20°C and 40% r.h.. The fresh films were cured in oven at 150°C for about 20
minutes.
2.4.2 Experimental results and discussion
Neat montmorillonite particles embedded into the silane sol-gel matrix
The appearance of the montmorillonite particles was observed by means of
Transmission electron microscope (TEM). For this purpose, a Philips CM12
transmission electron microscope was used to collect images of the samples. The
analysis and interpretation of the reported diffraction patterns was performed
using the ring diffraction patterns modelling software Process Diffraction [125].
The nanopowders were ultrasonically dispersed in ethanol to facilitate the
observations. Figure 2.52 shows a few examples of the appearance of the
powders and their corresponding electron diffraction pattern.
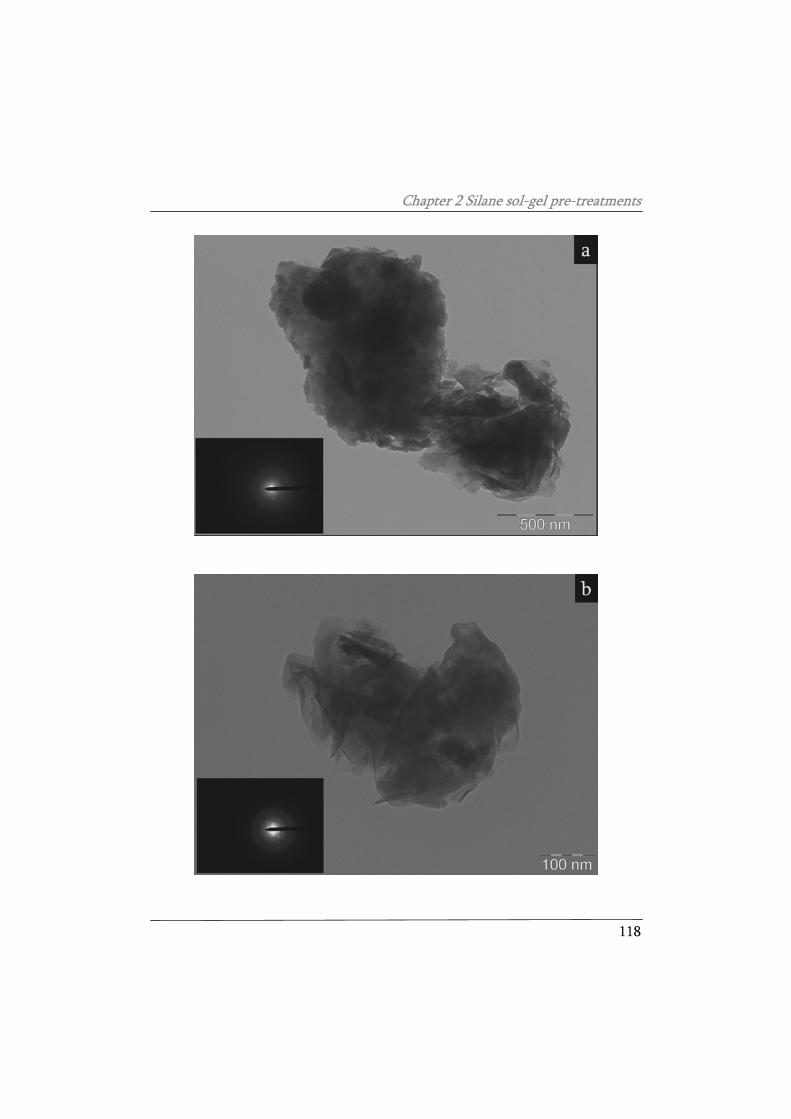
Chapter 2 Silane sol-gel pre-treatments
118
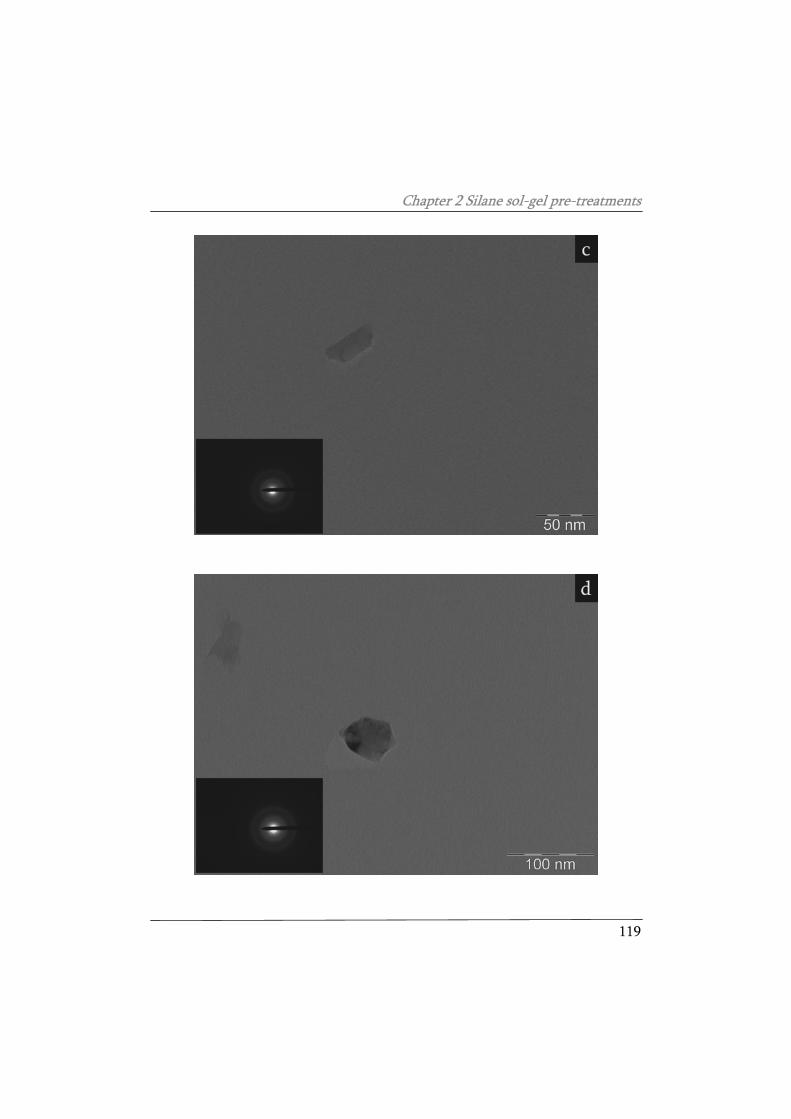
Chapter 2 Silane sol-gel pre-treatments
119
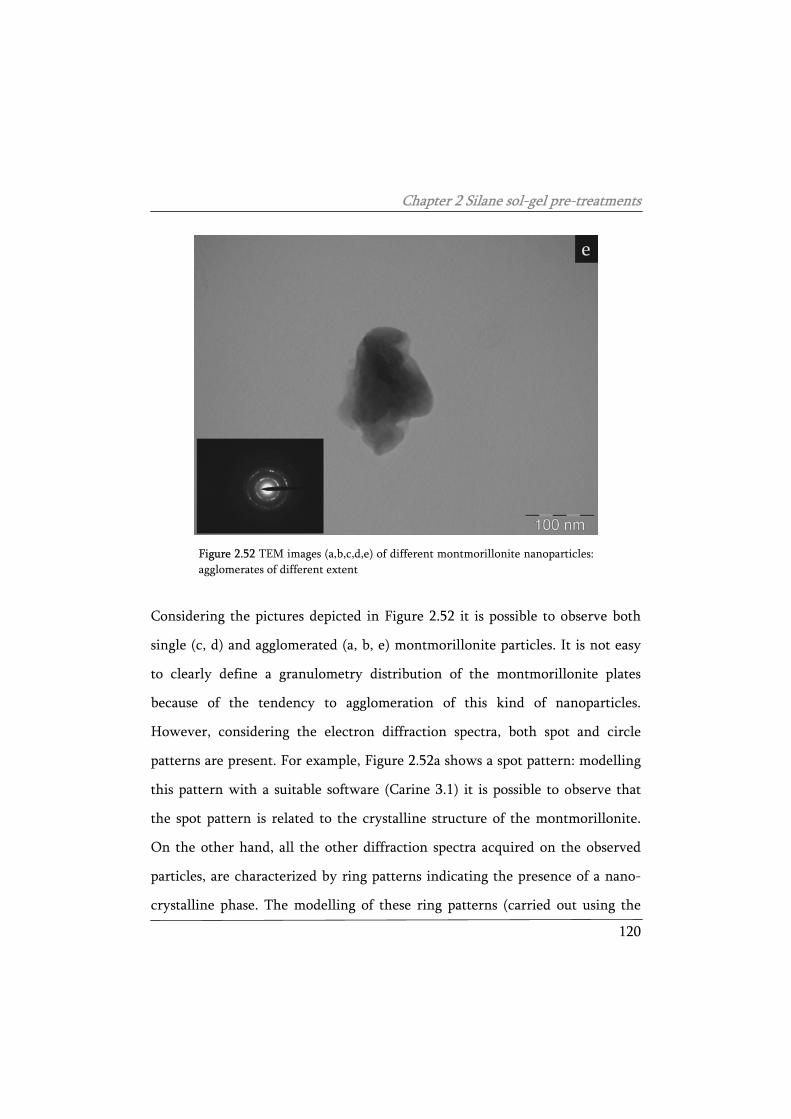
Chapter 2 Silane sol-gel pre-treatments
120
Figure 2.52 TEM images (a,b,c,d,e) of different montmorillonite nanoparticles: agglomerates of different extent
Considering the pictures depicted in Figure 2.52 it is possible to observe both
single (c, d) and agglomerated (a, b, e) montmorillonite particles. It is not easy
to clearly define a granulometry distribution of the montmorillonite plates
because of the tendency to agglomeration of this kind of nanoparticles.
However, considering the electron diffraction spectra, both spot and circle
patterns are present. For example, Figure 2.52a shows a spot pattern: modelling
this pattern with a suitable software (Carine 3.1) it is possible to observe that
the spot pattern is related to the crystalline structure of the montmorillonite.
On the other hand, all the other diffraction spectra acquired on the observed
particles, are characterized by ring patterns indicating the presence of a nano-
crystalline phase. The modelling of these ring patterns (carried out using the
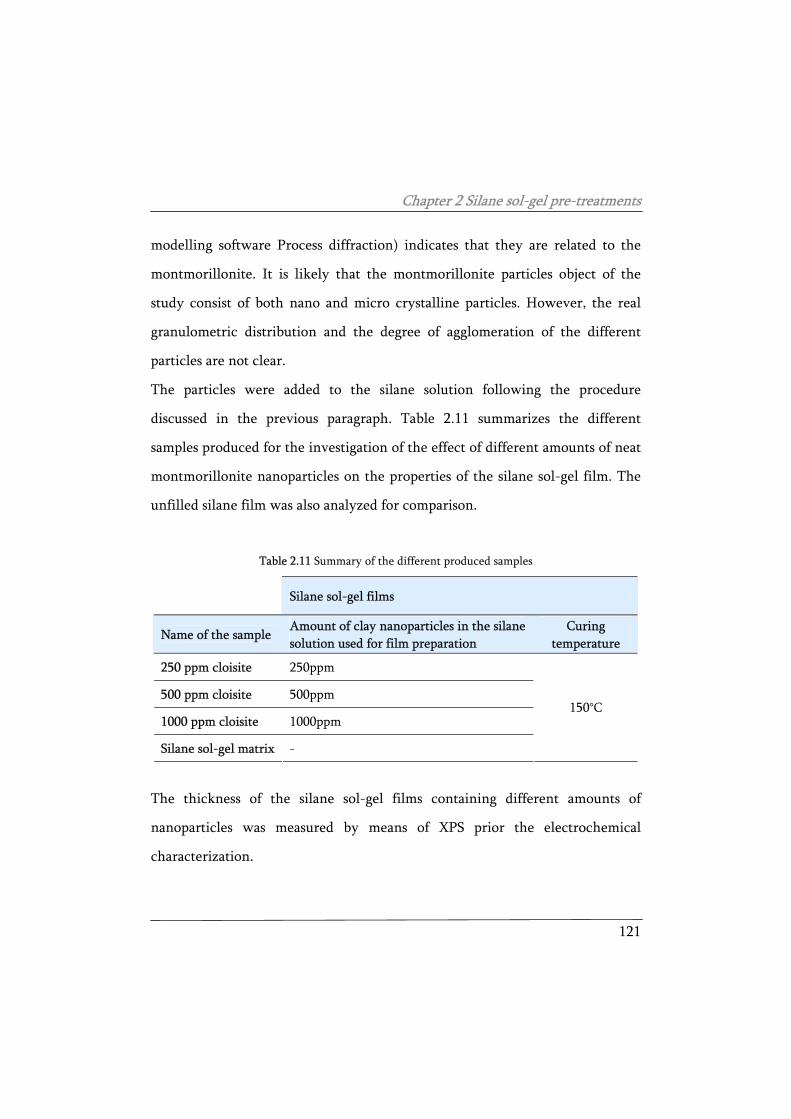
Chapter 2 Silane sol-gel pre-treatments
121
modelling software Process diffraction) indicates that they are related to the
montmorillonite. It is likely that the montmorillonite particles object of the
study consist of both nano and micro crystalline particles. However, the real
granulometric distribution and the degree of agglomeration of the different
particles are not clear.
The particles were added to the silane solution following the procedure
discussed in the previous paragraph. Table 2.11 summarizes the different
samples produced for the investigation of the effect of different amounts of neat
montmorillonite nanoparticles on the properties of the silane sol-gel film. The
unfilled silane film was also analyzed for comparison.
Table 2.11 Summary of the different produced samples
Silane sol-gel films
Name of the sample Amount of clay nanoparticles in the silane solution used for film preparation
Curing temperature
250 ppm cloisite 250ppm
500 ppm cloisite 500ppm
1000 ppm cloisite 1000ppm
Silane sol-gel matrix -
150°C
The thickness of the silane sol-gel films containing different amounts of
nanoparticles was measured by means of XPS prior the electrochemical
characterization.
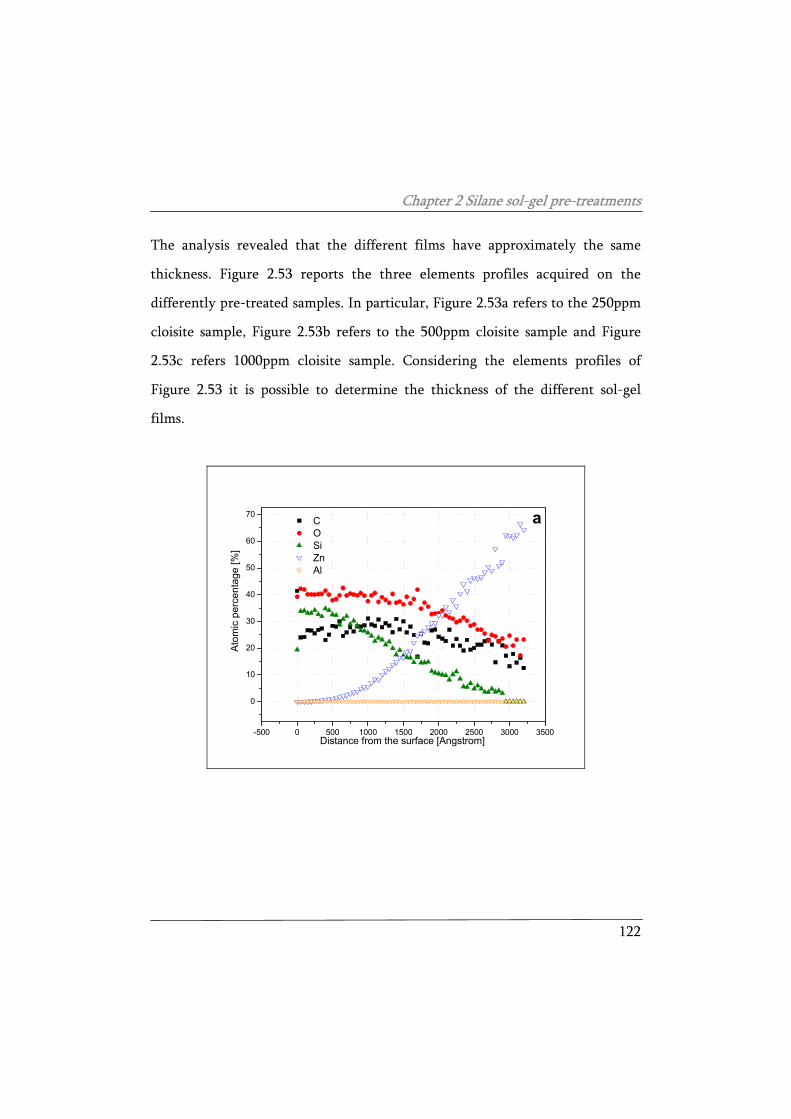
Chapter 2 Silane sol-gel pre-treatments
122
The analysis revealed that the different films have approximately the same
thickness. Figure 2.53 reports the three elements profiles acquired on the
differently pre-treated samples. In particular, Figure 2.53a refers to the 250ppm
cloisite sample, Figure 2.53b refers to the 500ppm cloisite sample and Figure
2.53c refers 1000ppm cloisite sample. Considering the elements profiles of
Figure 2.53 it is possible to determine the thickness of the different sol-gel
films.
-500 0 500 1000 1500 2000 2500 3000 3500
0
10
20
30
40
50
60
70 a
C O Si Zn Al
Atom
ic p
erce
ntag
e [%
]
Distance from the surface [Angstrom]
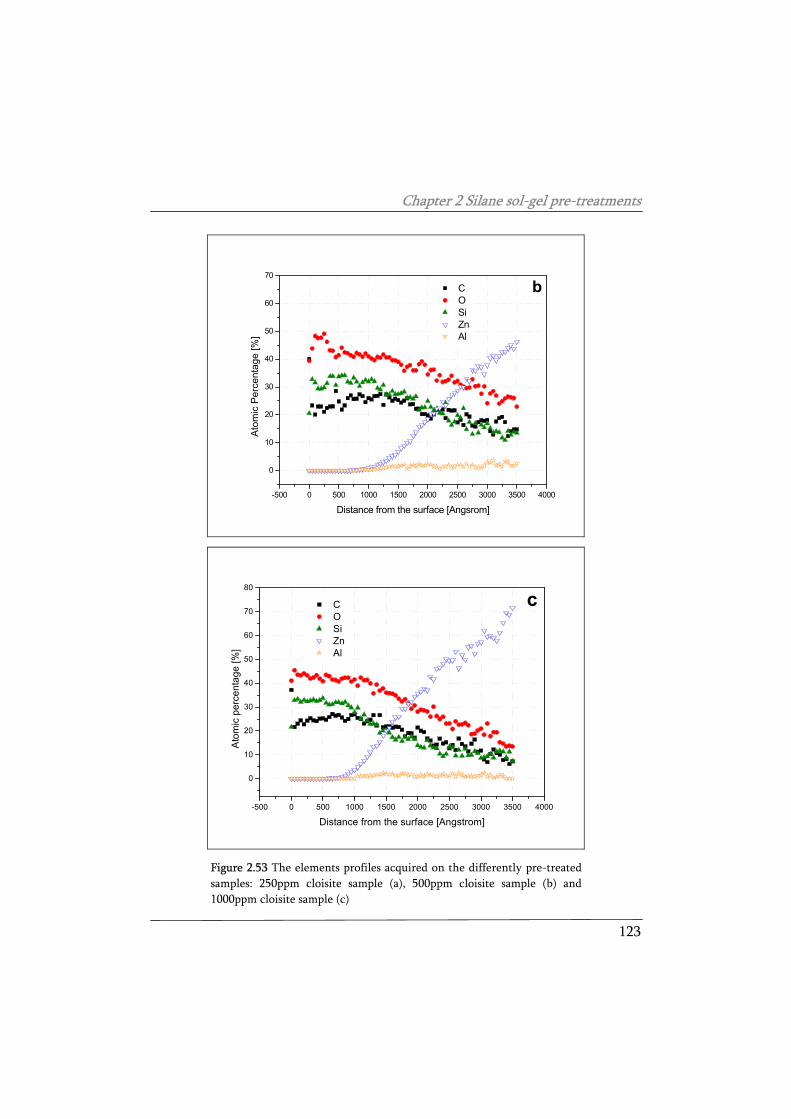
Chapter 2 Silane sol-gel pre-treatments
123
-500 0 500 1000 1500 2000 2500 3000 3500 4000
0
10
20
30
40
50
60
70
A
tom
ic P
erce
ntag
e [%
]
Distance from the surface [Angsrom]
C O Si Zn Al
b
-500 0 500 1000 1500 2000 2500 3000 3500 4000
0
10
20
30
40
50
60
70
80
Ato
mic
per
cent
age
[%]
Distance from the surface [Angstrom]
C O Si Zn Al
c
Figure 2.53 The elements profiles acquired on the differently pre-treated samples: 250ppm cloisite sample (a), 500ppm cloisite sample (b) and 1000ppm cloisite sample (c)
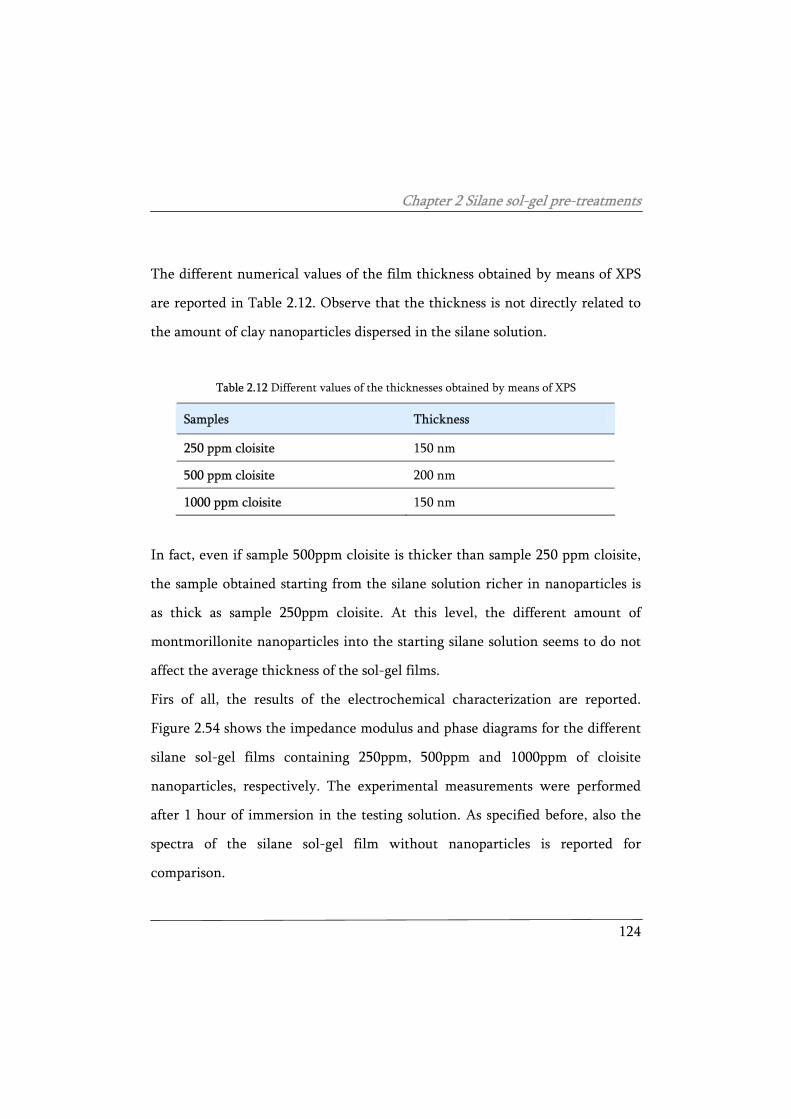
Chapter 2 Silane sol-gel pre-treatments
124
The different numerical values of the film thickness obtained by means of XPS
are reported in Table 2.12. Observe that the thickness is not directly related to
the amount of clay nanoparticles dispersed in the silane solution.
Table 2.12 Different values of the thicknesses obtained by means of XPS
Samples Thickness
250 ppm cloisite 150 nm
500 ppm cloisite 200 nm
1000 ppm cloisite 150 nm
In fact, even if sample 500ppm cloisite is thicker than sample 250 ppm cloisite,
the sample obtained starting from the silane solution richer in nanoparticles is
as thick as sample 250ppm cloisite. At this level, the different amount of
montmorillonite nanoparticles into the starting silane solution seems to do not
affect the average thickness of the sol-gel films. Firs of all, the results of the electrochemical characterization are reported.
Figure 2.54 shows the impedance modulus and phase diagrams for the different
silane sol-gel films containing 250ppm, 500ppm and 1000ppm of cloisite
nanoparticles, respectively. The experimental measurements were performed
after 1 hour of immersion in the testing solution. As specified before, also the
spectra of the silane sol-gel film without nanoparticles is reported for
comparison.
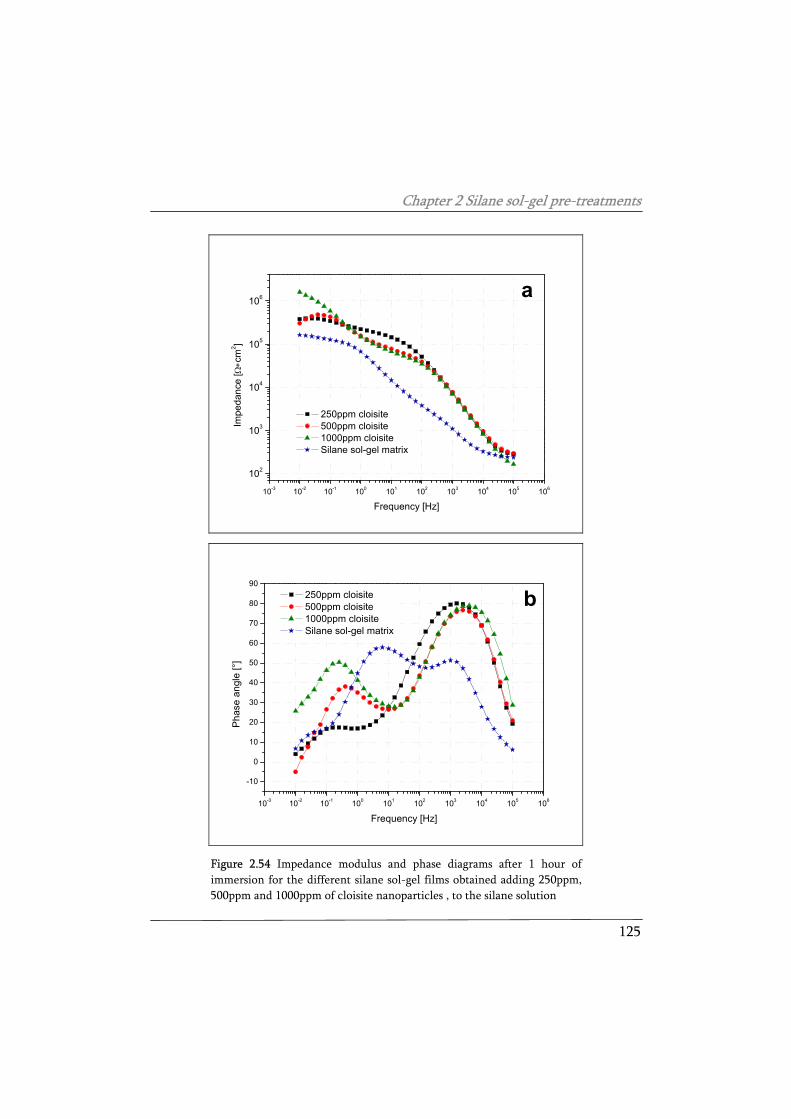
Chapter 2 Silane sol-gel pre-treatments
125
10-3 10-2 10-1 100 101 102 103 104 105 106
102
103
104
105
106
Impe
danc
e [Ω∗c
m2 ]
Frequency [Hz]
250ppm cloisite 500ppm cloisite 1000ppm cloisite Silane sol-gel matrix
a
10-3 10-2 10-1 100 101 102 103 104 105 106
-10
0
10
20
30
40
50
60
70
80
90
b
250ppm cloisite 500ppm cloisite 1000ppm cloisite Silane sol-gel matrix
Phas
e an
gle
[°]
Frequency [Hz]
Figure 2.54 Impedance modulus and phase diagrams after 1 hour of immersion for the different silane sol-gel films obtained adding 250ppm, 500ppm and 1000ppm of cloisite nanoparticles , to the silane solution
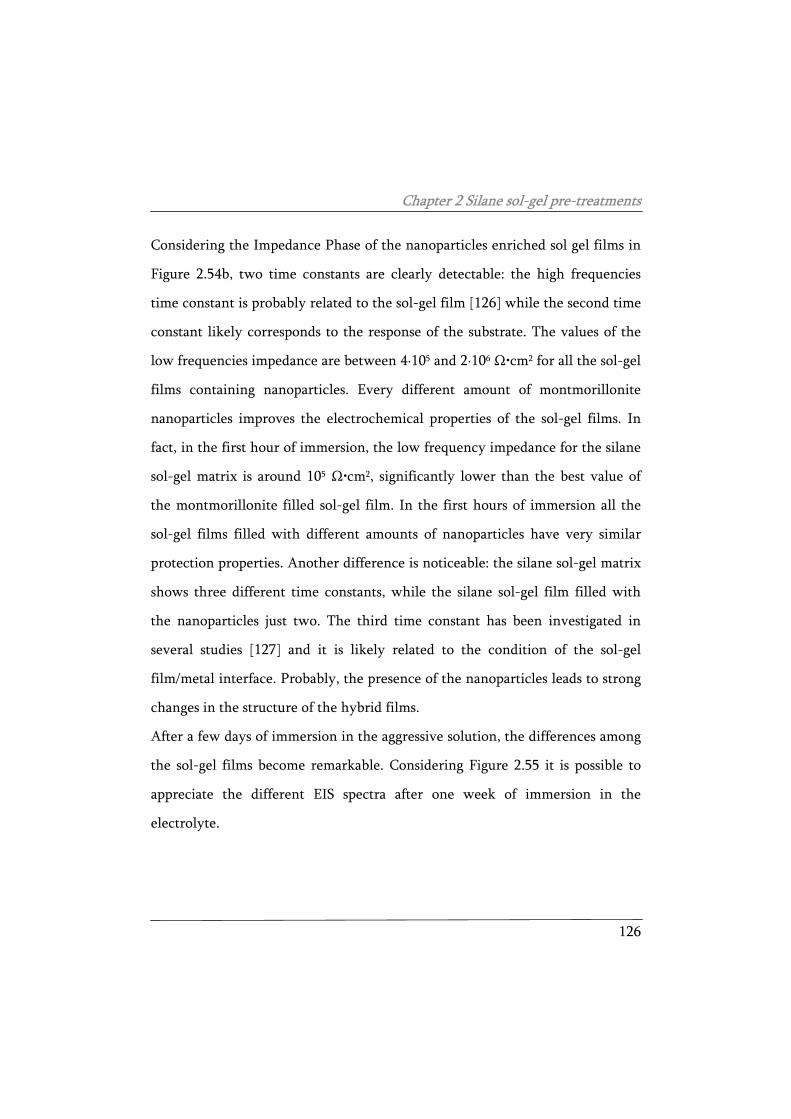
Chapter 2 Silane sol-gel pre-treatments
126
Considering the Impedance Phase of the nanoparticles enriched sol gel films in
Figure 2.54b, two time constants are clearly detectable: the high frequencies
time constant is probably related to the sol-gel film [126] while the second time
constant likely corresponds to the response of the substrate. The values of the
low frequencies impedance are between 4·105 and 2·106 Ω•cm2 for all the sol-gel
films containing nanoparticles. Every different amount of montmorillonite
nanoparticles improves the electrochemical properties of the sol-gel films. In
fact, in the first hour of immersion, the low frequency impedance for the silane
sol-gel matrix is around 105 Ω•cm2, significantly lower than the best value of
the montmorillonite filled sol-gel film. In the first hours of immersion all the
sol-gel films filled with different amounts of nanoparticles have very similar
protection properties. Another difference is noticeable: the silane sol-gel matrix
shows three different time constants, while the silane sol-gel film filled with
the nanoparticles just two. The third time constant has been investigated in
several studies [127] and it is likely related to the condition of the sol-gel
film/metal interface. Probably, the presence of the nanoparticles leads to strong
changes in the structure of the hybrid films.
After a few days of immersion in the aggressive solution, the differences among
the sol-gel films become remarkable. Considering Figure 2.55 it is possible to
appreciate the different EIS spectra after one week of immersion in the
electrolyte.
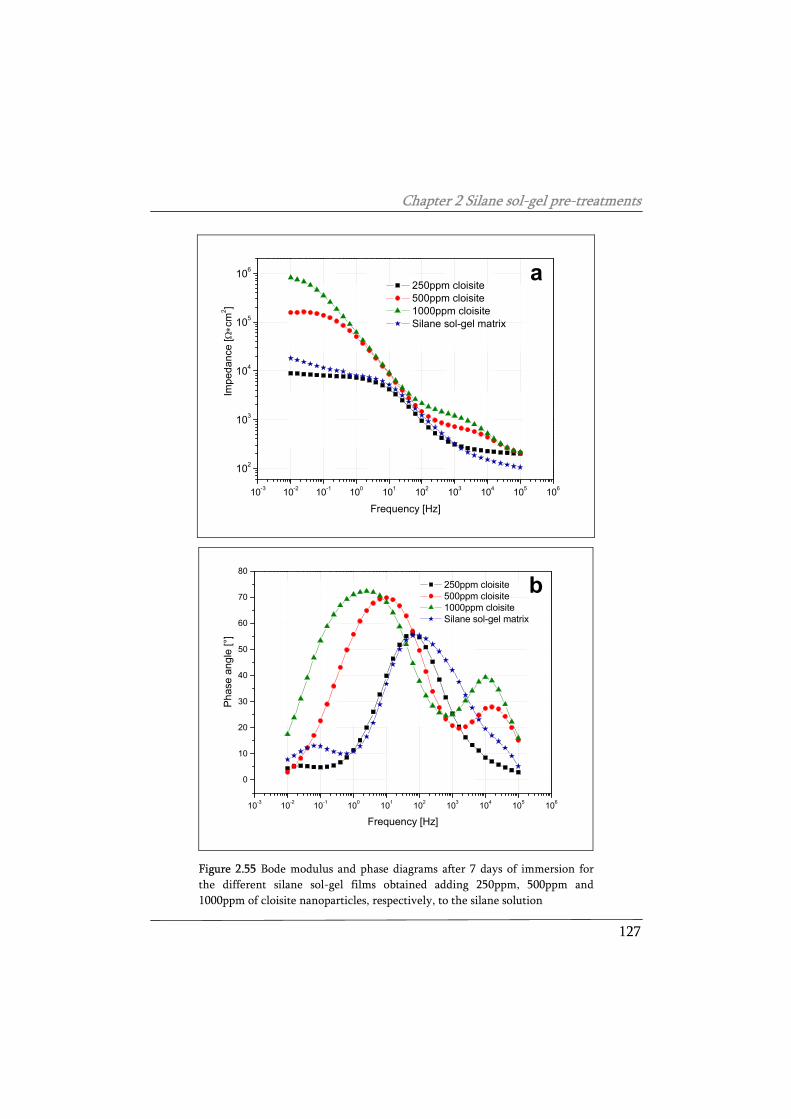
Chapter 2 Silane sol-gel pre-treatments
127
10-3 10-2 10-1 100 101 102 103 104 105 106
102
103
104
105
106
Impe
danc
e [Ω∗c
m2 ]
250ppm cloisite 500ppm cloisite 1000ppm cloisite Silane sol-gel matrix
Frequency [Hz]
a
10-3 10-2 10-1 100 101 102 103 104 105 106
0
10
20
30
40
50
60
70
80
b
Pha
se a
ngle
[°]
250ppm cloisite 500ppm cloisite 1000ppm cloisite Silane sol-gel matrix
Frequency [Hz]
Figure 2.55 Bode modulus and phase diagrams after 7 days of immersion for the different silane sol-gel films obtained adding 250ppm, 500ppm and 1000ppm of cloisite nanoparticles, respectively, to the silane solution
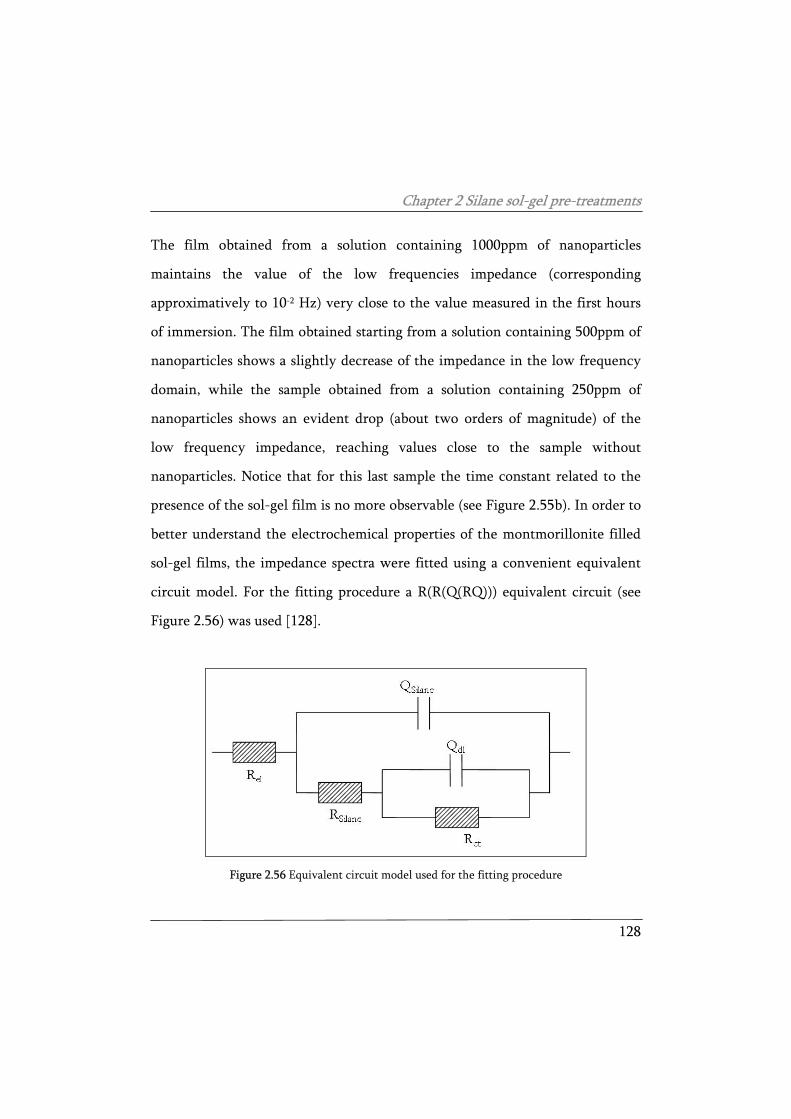
Chapter 2 Silane sol-gel pre-treatments
128
The film obtained from a solution containing 1000ppm of nanoparticles
maintains the value of the low frequencies impedance (corresponding
approximatively to 10-2 Hz) very close to the value measured in the first hours
of immersion. The film obtained starting from a solution containing 500ppm of
nanoparticles shows a slightly decrease of the impedance in the low frequency
domain, while the sample obtained from a solution containing 250ppm of
nanoparticles shows an evident drop (about two orders of magnitude) of the
low frequency impedance, reaching values close to the sample without
nanoparticles. Notice that for this last sample the time constant related to the
presence of the sol-gel film is no more observable (see Figure 2.55b). In order to
better understand the electrochemical properties of the montmorillonite filled
sol-gel films, the impedance spectra were fitted using a convenient equivalent
circuit model. For the fitting procedure a R(R(Q(RQ))) equivalent circuit (see
Figure 2.56) was used [128].
Figure 2.56 Equivalent circuit model used for the fitting procedure
Chapter 2 Silane sol-gel pre-treatments
129
The first resistance is the electrolyte resistance, the second corresponds to silane
sol-gel film resistance (Rsilane), the first constant phase element is related to the
silane sol-gel film capacitance (Qsilane), while the other time constant is
representative of both the Faradic resistance of the metal interface (Rct) and the
double layer capacitance (Qdl)
The results of the fitting procedure are reported in Figure 2.57, which shows
the values of the silane sol-gel resistance (a) and capacitance (b) calculated from
the acquired impedance spectra.
0 40 80 120 160 200
102
103
104
105
Sol
-gel
film
resi
stan
ce [Ω
∗cm
2 ] 250ppm Cloisite 500ppm Cloisite 1000ppm Cloisite
Time [Hours]
a
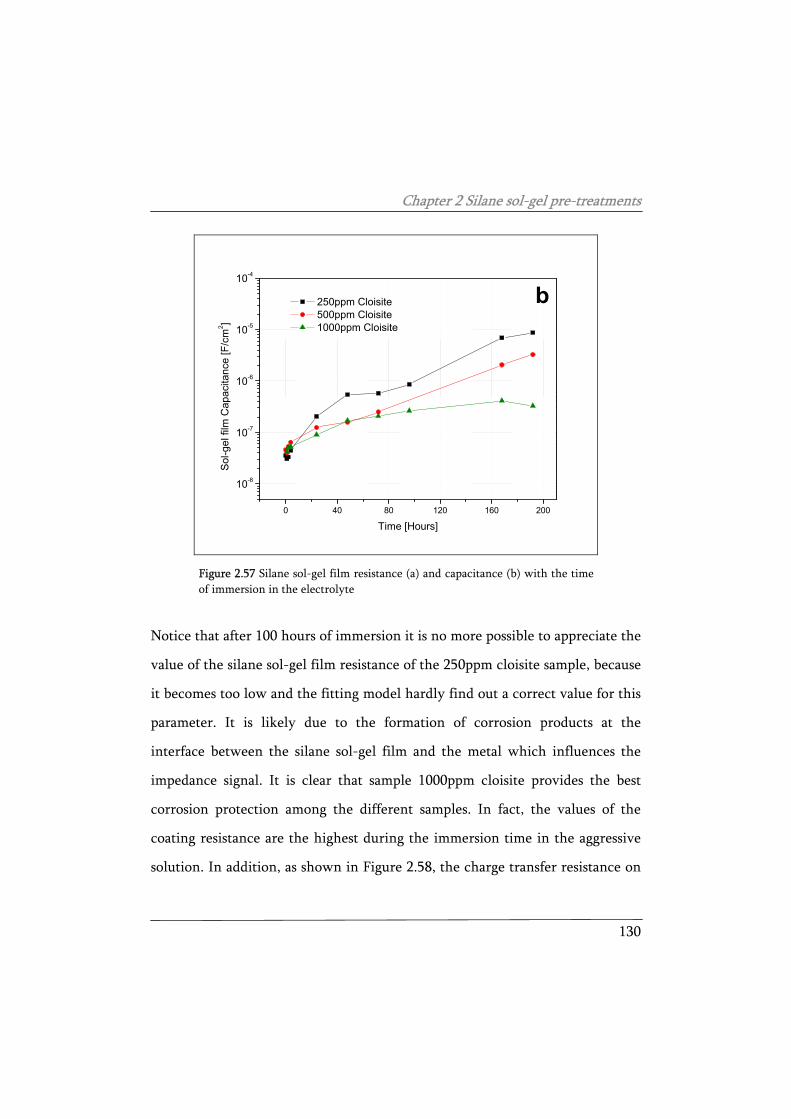
Chapter 2 Silane sol-gel pre-treatments
130
0 40 80 120 160 200
10-8
10-7
10-6
10-5
10-4
250ppm Cloisite 500ppm Cloisite 1000ppm Cloisite
Sol
-gel
film
Cap
acita
nce
[F/c
m2 ]
Time [Hours]
b
Figure 2.57 Silane sol-gel film resistance (a) and capacitance (b) with the time of immersion in the electrolyte
Notice that after 100 hours of immersion it is no more possible to appreciate the
value of the silane sol-gel film resistance of the 250ppm cloisite sample, because
it becomes too low and the fitting model hardly find out a correct value for this
parameter. It is likely due to the formation of corrosion products at the
interface between the silane sol-gel film and the metal which influences the
impedance signal. It is clear that sample 1000ppm cloisite provides the best
corrosion protection among the different samples. In fact, the values of the
coating resistance are the highest during the immersion time in the aggressive
solution. In addition, as shown in Figure 2.58, the charge transfer resistance on
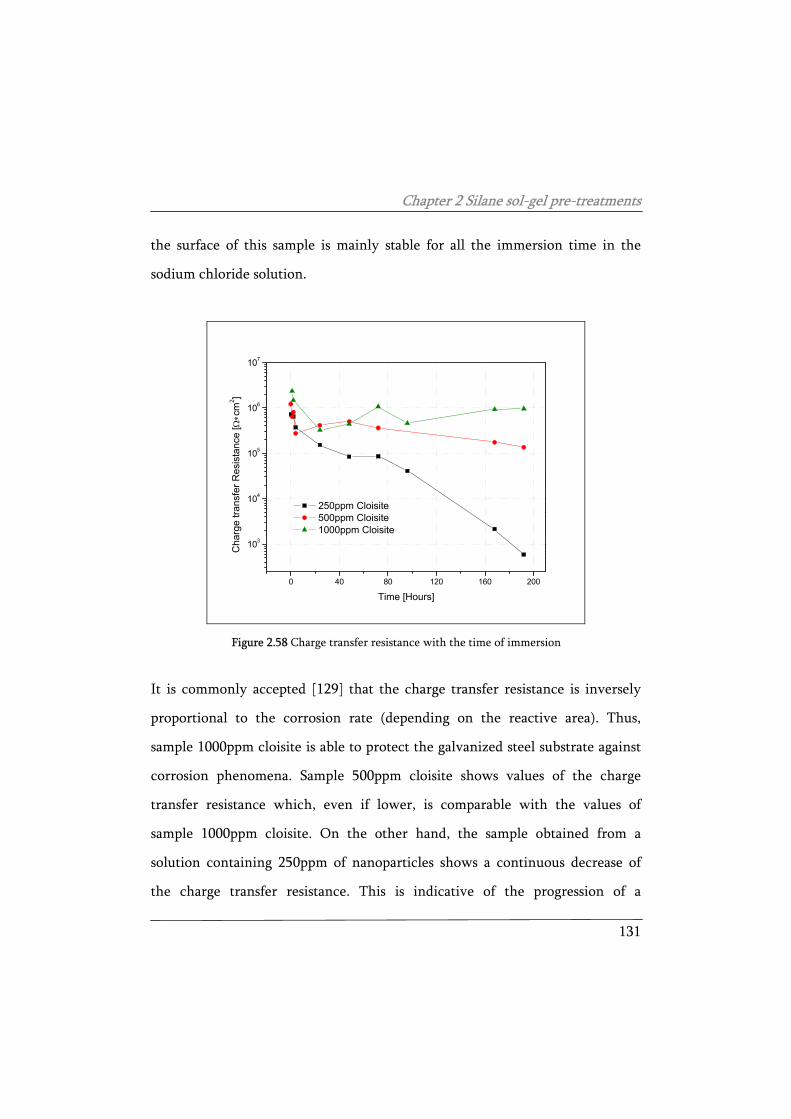
Chapter 2 Silane sol-gel pre-treatments
131
the surface of this sample is mainly stable for all the immersion time in the
sodium chloride solution.
0 40 80 120 160 200
103
104
105
106
107
Cha
rge
trans
fer R
esis
tanc
e [Ω∗c
m2 ]
Time [Hours]
250ppm Cloisite 500ppm Cloisite 1000ppm Cloisite
Figure 2.58 Charge transfer resistance with the time of immersion
It is commonly accepted [129] that the charge transfer resistance is inversely
proportional to the corrosion rate (depending on the reactive area). Thus,
sample 1000ppm cloisite is able to protect the galvanized steel substrate against
corrosion phenomena. Sample 500ppm cloisite shows values of the charge
transfer resistance which, even if lower, is comparable with the values of
sample 1000ppm cloisite. On the other hand, the sample obtained from a
solution containing 250ppm of nanoparticles shows a continuous decrease of
the charge transfer resistance. This is indicative of the progression of a
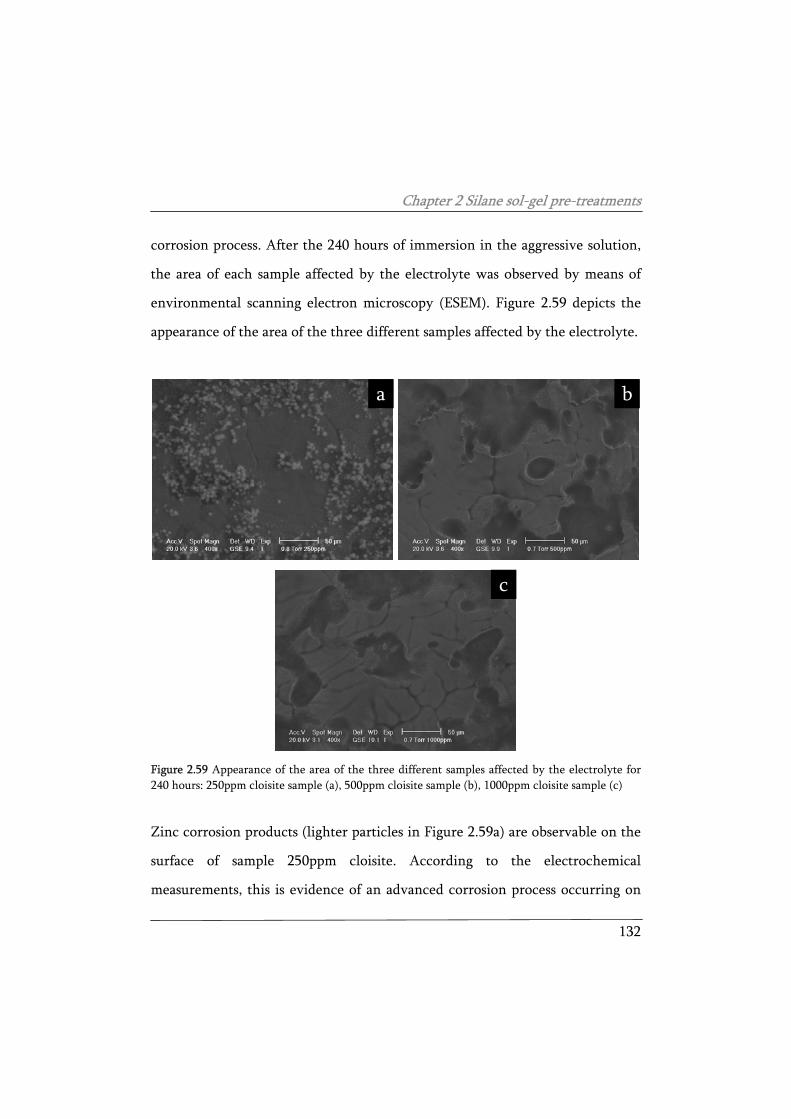
Chapter 2 Silane sol-gel pre-treatments
132
corrosion process. After the 240 hours of immersion in the aggressive solution,
the area of each sample affected by the electrolyte was observed by means of
environmental scanning electron microscopy (ESEM). Figure 2.59 depicts the
appearance of the area of the three different samples affected by the electrolyte.
a
b
c
Figure 2.59 Appearance of the area of the three different samples affected by the electrolyte for 240 hours: 250ppm cloisite sample (a), 500ppm cloisite sample (b), 1000ppm cloisite sample (c)
Zinc corrosion products (lighter particles in Figure 2.59a) are observable on the
surface of sample 250ppm cloisite. According to the electrochemical
measurements, this is evidence of an advanced corrosion process occurring on
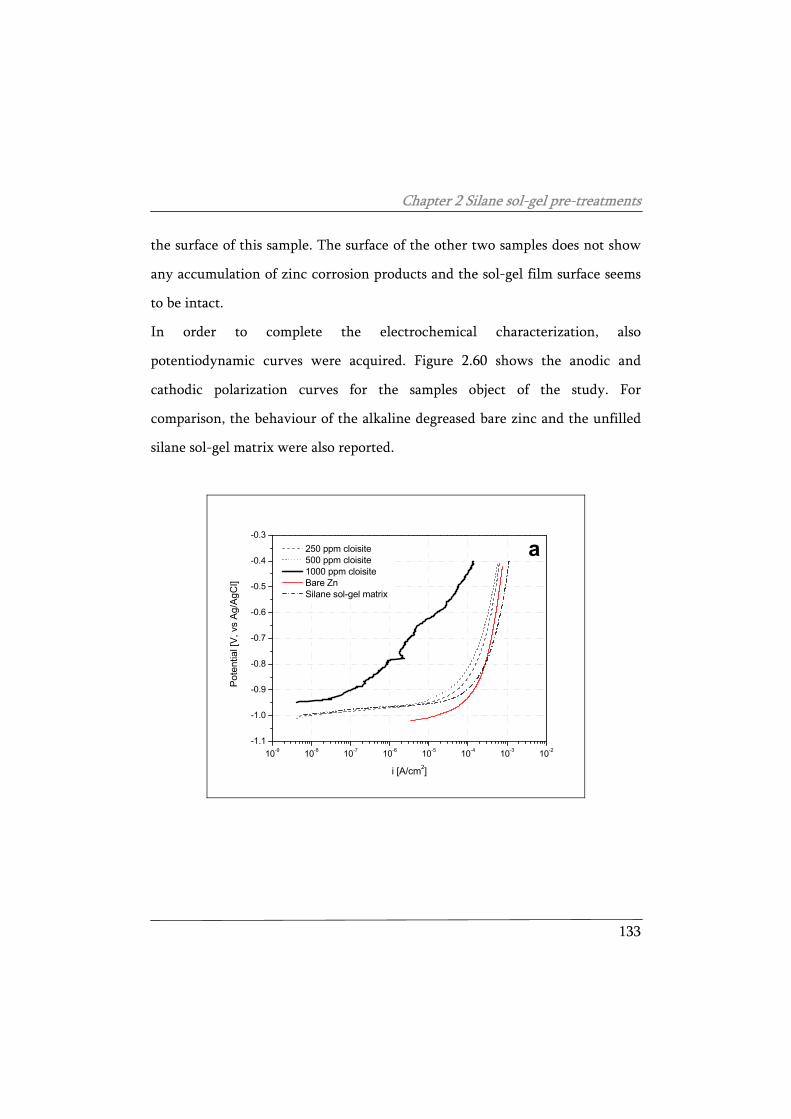
Chapter 2 Silane sol-gel pre-treatments
133
the surface of this sample. The surface of the other two samples does not show
any accumulation of zinc corrosion products and the sol-gel film surface seems
to be intact.
In order to complete the electrochemical characterization, also
potentiodynamic curves were acquired. Figure 2.60 shows the anodic and
cathodic polarization curves for the samples object of the study. For
comparison, the behaviour of the alkaline degreased bare zinc and the unfilled
silane sol-gel matrix were also reported.
10-9 10-8 10-7 10-6 10-5 10-4 10-3 10-2-1.1
-1.0
-0.9
-0.8
-0.7
-0.6
-0.5
-0.4
-0.3
Pot
entia
l [V
, vs
Ag/
AgC
l]
i [A/cm2]
250 ppm cloisite 500 ppm cloisite 1000 ppm cloisite Bare Zn Silane sol-gel matrix
a
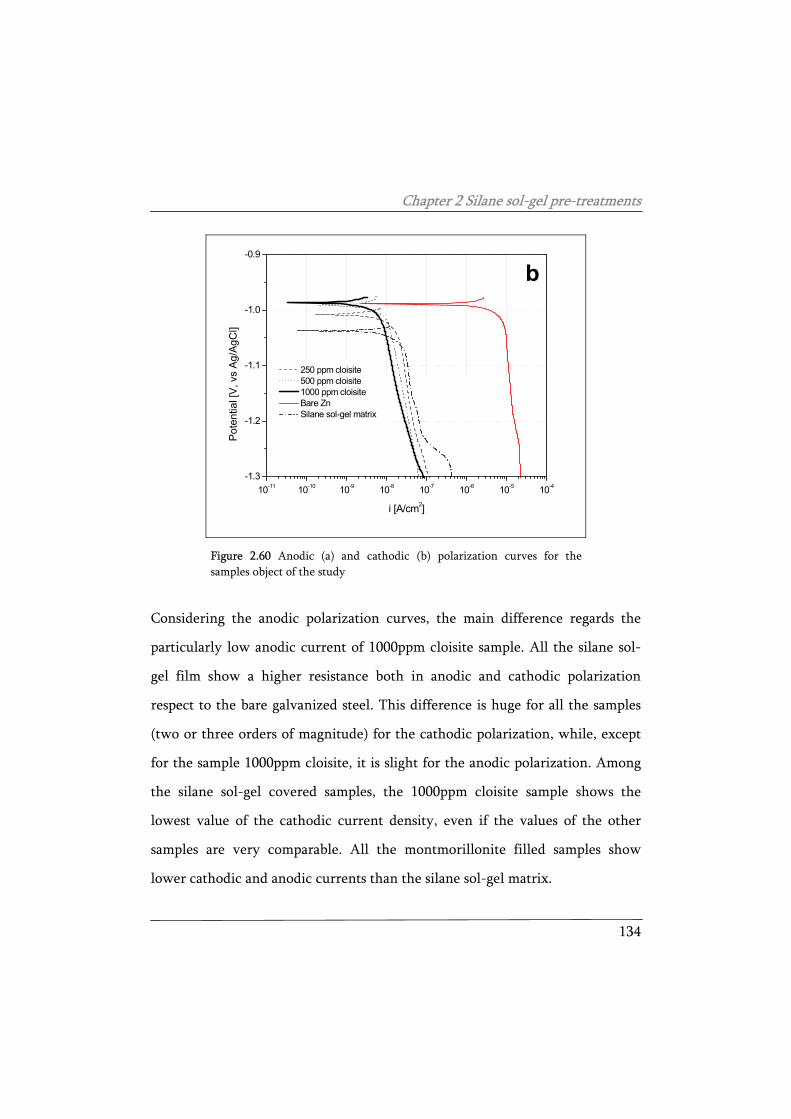
Chapter 2 Silane sol-gel pre-treatments
134
10-11 10-10 10-9 10-8 10-7 10-6 10-5 10-4-1.3
-1.2
-1.1
-1.0
-0.9
b
250 ppm cloisite 500 ppm cloisite 1000 ppm cloisite Bare Zn Silane sol-gel matrix
Pote
ntia
l [V
, vs
Ag/A
gCl]
i [A/cm2]
Figure 2.60 Anodic (a) and cathodic (b) polarization curves for the samples object of the study
Considering the anodic polarization curves, the main difference regards the
particularly low anodic current of 1000ppm cloisite sample. All the silane sol-
gel film show a higher resistance both in anodic and cathodic polarization
respect to the bare galvanized steel. This difference is huge for all the samples
(two or three orders of magnitude) for the cathodic polarization, while, except
for the sample 1000ppm cloisite, it is slight for the anodic polarization. Among
the silane sol-gel covered samples, the 1000ppm cloisite sample shows the
lowest value of the cathodic current density, even if the values of the other
samples are very comparable. All the montmorillonite filled samples show
lower cathodic and anodic currents than the silane sol-gel matrix.
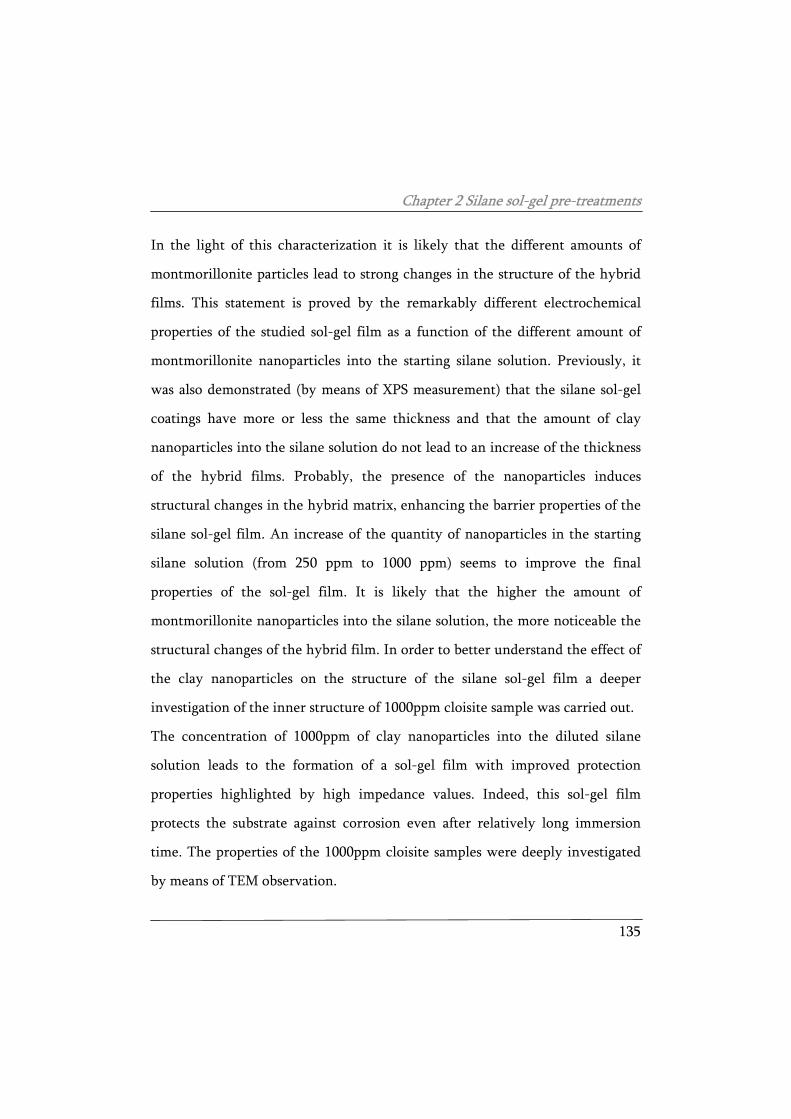
Chapter 2 Silane sol-gel pre-treatments
135
In the light of this characterization it is likely that the different amounts of
montmorillonite particles lead to strong changes in the structure of the hybrid
films. This statement is proved by the remarkably different electrochemical
properties of the studied sol-gel film as a function of the different amount of
montmorillonite nanoparticles into the starting silane solution. Previously, it
was also demonstrated (by means of XPS measurement) that the silane sol-gel
coatings have more or less the same thickness and that the amount of clay
nanoparticles into the silane solution do not lead to an increase of the thickness
of the hybrid films. Probably, the presence of the nanoparticles induces
structural changes in the hybrid matrix, enhancing the barrier properties of the
silane sol-gel film. An increase of the quantity of nanoparticles in the starting
silane solution (from 250 ppm to 1000 ppm) seems to improve the final
properties of the sol-gel film. It is likely that the higher the amount of
montmorillonite nanoparticles into the silane solution, the more noticeable the
structural changes of the hybrid film. In order to better understand the effect of
the clay nanoparticles on the structure of the silane sol-gel film a deeper
investigation of the inner structure of 1000ppm cloisite sample was carried out.
The concentration of 1000ppm of clay nanoparticles into the diluted silane
solution leads to the formation of a sol-gel film with improved protection
properties highlighted by high impedance values. Indeed, this sol-gel film
protects the substrate against corrosion even after relatively long immersion
time. The properties of the 1000ppm cloisite samples were deeply investigated
by means of TEM observation.
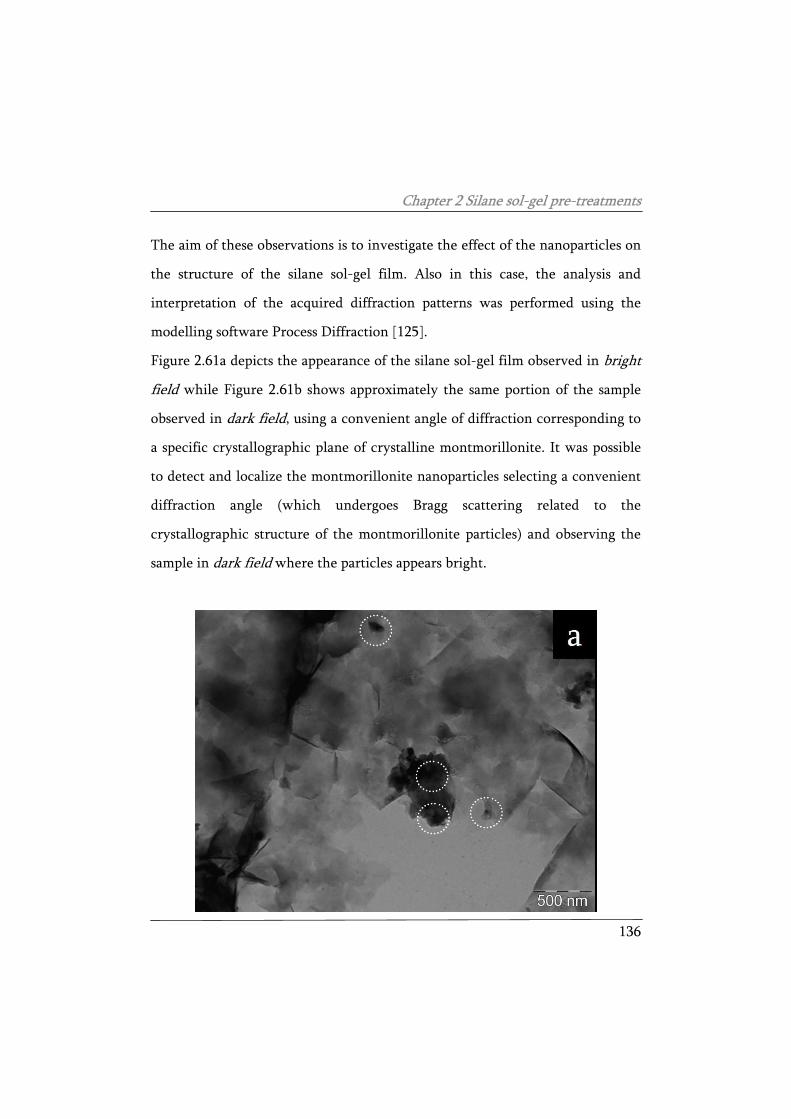
Chapter 2 Silane sol-gel pre-treatments
136
The aim of these observations is to investigate the effect of the nanoparticles on
the structure of the silane sol-gel film. Also in this case, the analysis and
interpretation of the acquired diffraction patterns was performed using the
modelling software Process Diffraction [125].
Figure 2.61a depicts the appearance of the silane sol-gel film observed in bright
field while Figure 2.61b shows approximately the same portion of the sample
observed in dark field, using a convenient angle of diffraction corresponding to
a specific crystallographic plane of crystalline montmorillonite. It was possible
to detect and localize the montmorillonite nanoparticles selecting a convenient
diffraction angle (which undergoes Bragg scattering related to the
crystallographic structure of the montmorillonite particles) and observing the
sample in dark field where the particles appears bright.
Chapter 2 Silane sol-gel pre-treatments
137
Figure 2.61 Appearance of a portion the silane sol-gel film (a) approximately the same portion of the sample observed in dark field (b)
The bright particles observable in the dark field images (Figure 2.61b)
correspond to crystalline domains. The bright particles, detected and localized
selecting a convenient diffraction angle and observing the sample in dark field
were proved to be montmorillonite nanoparticles performing an electron
diffraction spectrum on them, The electron diffraction pattern in Figure 2.62
was acquired all over the area of the sample depicted in Figure 2.61.
Considering the diffraction pattern of Figure 2.62 it is possible to notice that
both a ring and a spot pattern are visible. By analysing the spot pattern using
the modelling software Carine 3.1 and Process Diffraction, it seems that the spot
pattern refers to montmorillonite crystalline domains, while the ring pattern is
related to the presence of a nano-crystalline phase.
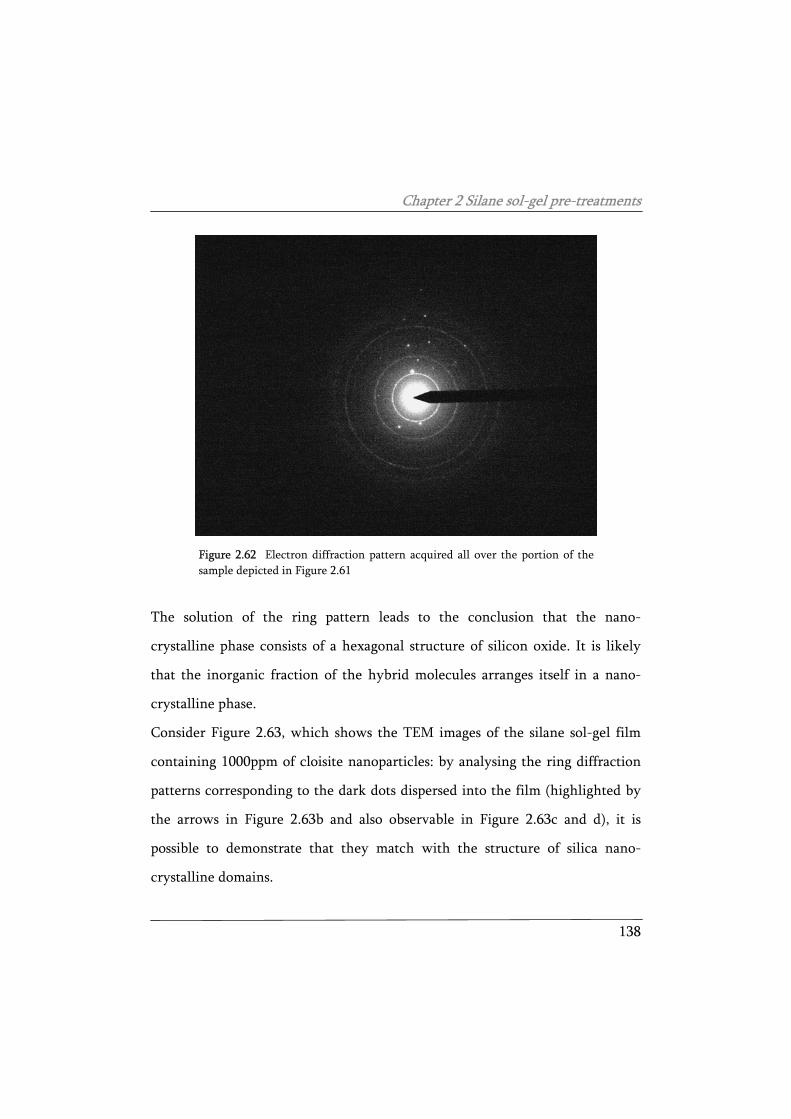
Chapter 2 Silane sol-gel pre-treatments
138
Figure 2.62 Electron diffraction pattern acquired all over the portion of the sample depicted in Figure 2.61
The solution of the ring pattern leads to the conclusion that the nano-
crystalline phase consists of a hexagonal structure of silicon oxide. It is likely
that the inorganic fraction of the hybrid molecules arranges itself in a nano-
crystalline phase.
Consider Figure 2.63, which shows the TEM images of the silane sol-gel film
containing 1000ppm of cloisite nanoparticles: by analysing the ring diffraction
patterns corresponding to the dark dots dispersed into the film (highlighted by
the arrows in Figure 2.63b and also observable in Figure 2.63c and d), it is
possible to demonstrate that they match with the structure of silica nano-
crystalline domains.
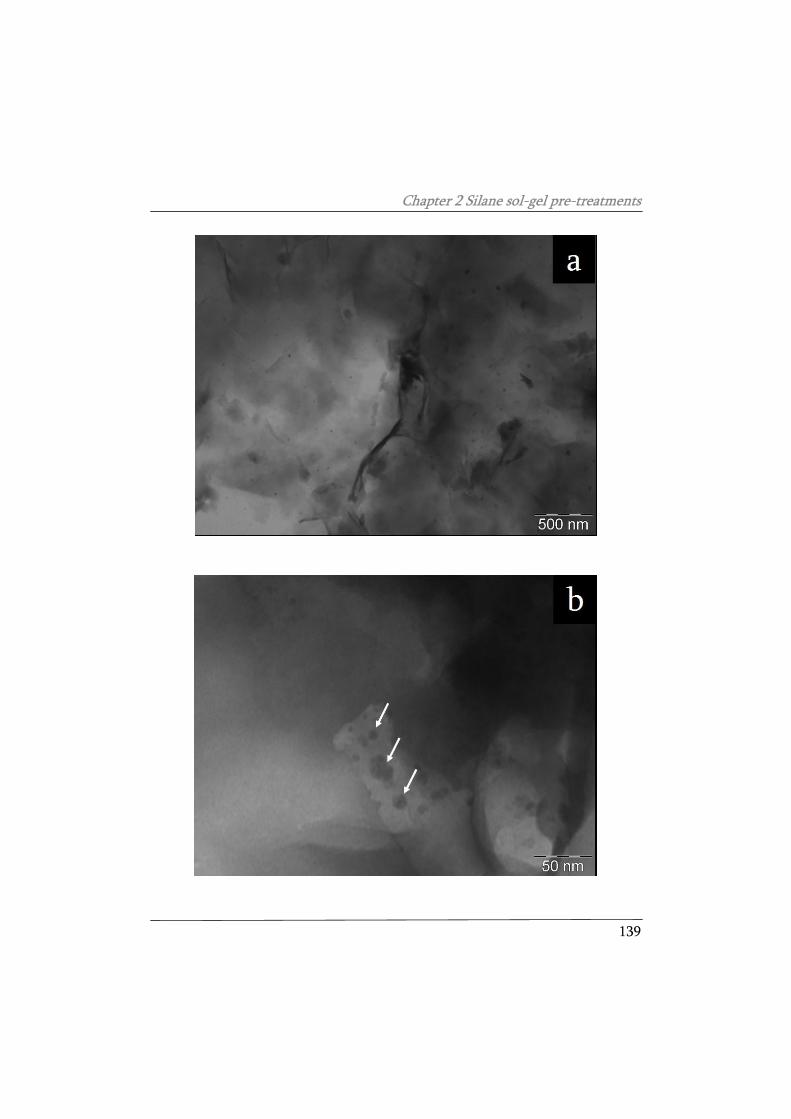
Chapter 2 Silane sol-gel pre-treatments
139
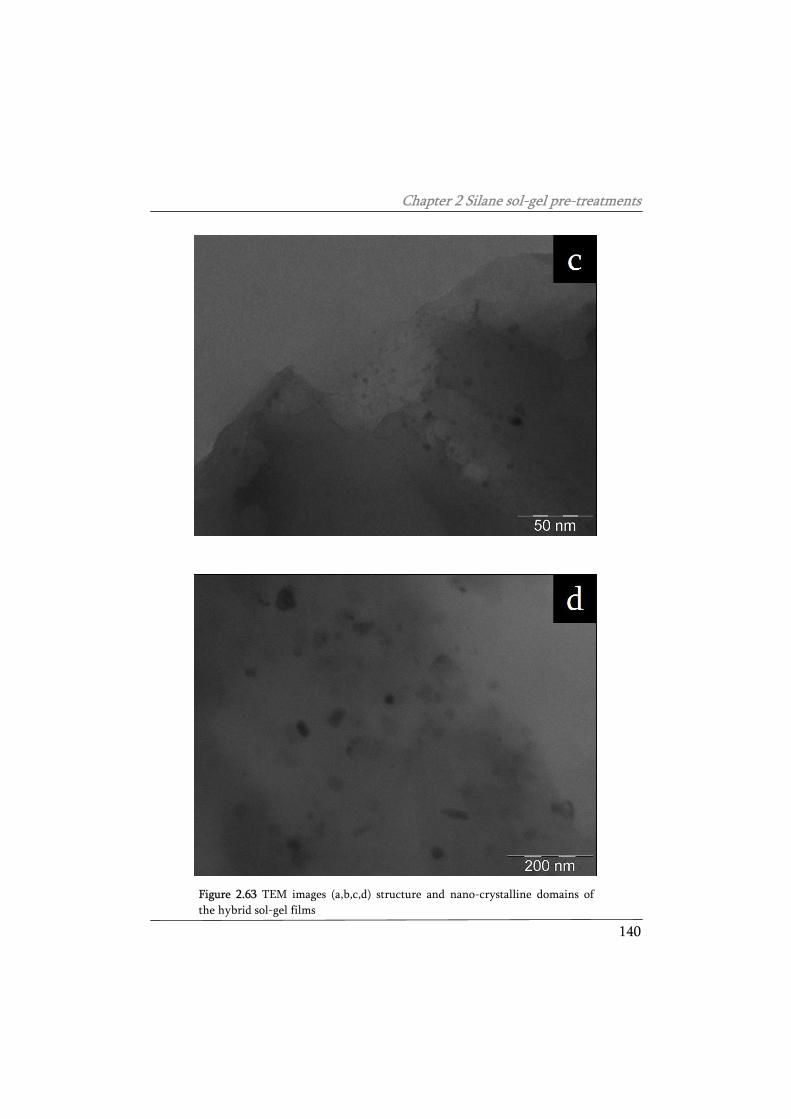
Chapter 2 Silane sol-gel pre-treatments
140
Figure 2.63 TEM images (a,b,c,d) structure and nano-crystalline domains of the hybrid sol-gel films
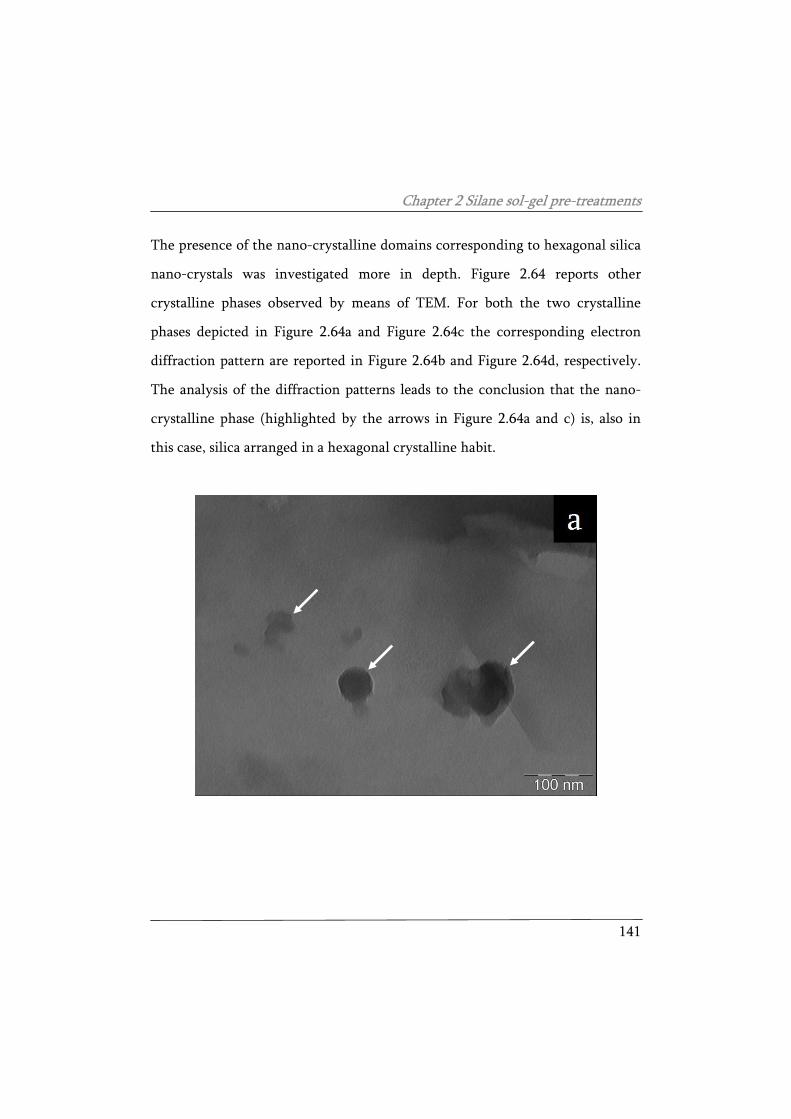
Chapter 2 Silane sol-gel pre-treatments
141
The presence of the nano-crystalline domains corresponding to hexagonal silica
nano-crystals was investigated more in depth. Figure 2.64 reports other
crystalline phases observed by means of TEM. For both the two crystalline
phases depicted in Figure 2.64a and Figure 2.64c the corresponding electron
diffraction pattern are reported in Figure 2.64b and Figure 2.64d, respectively.
The analysis of the diffraction patterns leads to the conclusion that the nano-
crystalline phase (highlighted by the arrows in Figure 2.64a and c) is, also in
this case, silica arranged in a hexagonal crystalline habit.
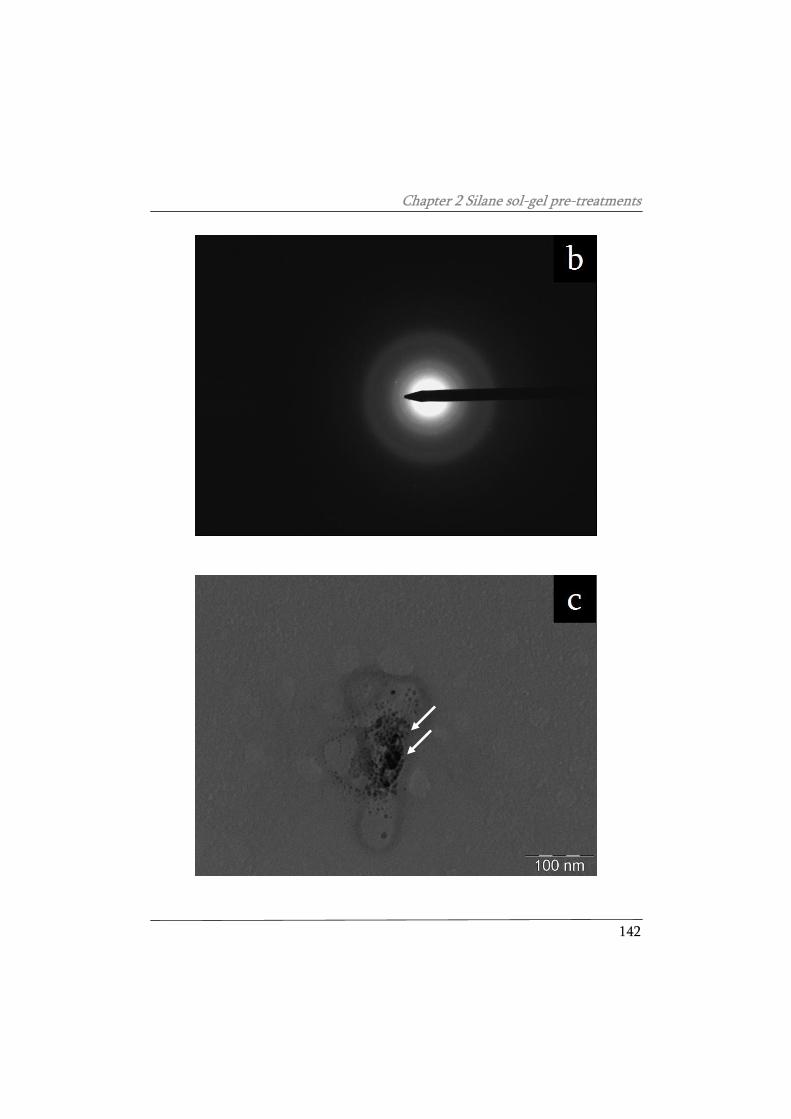
Chapter 2 Silane sol-gel pre-treatments
142
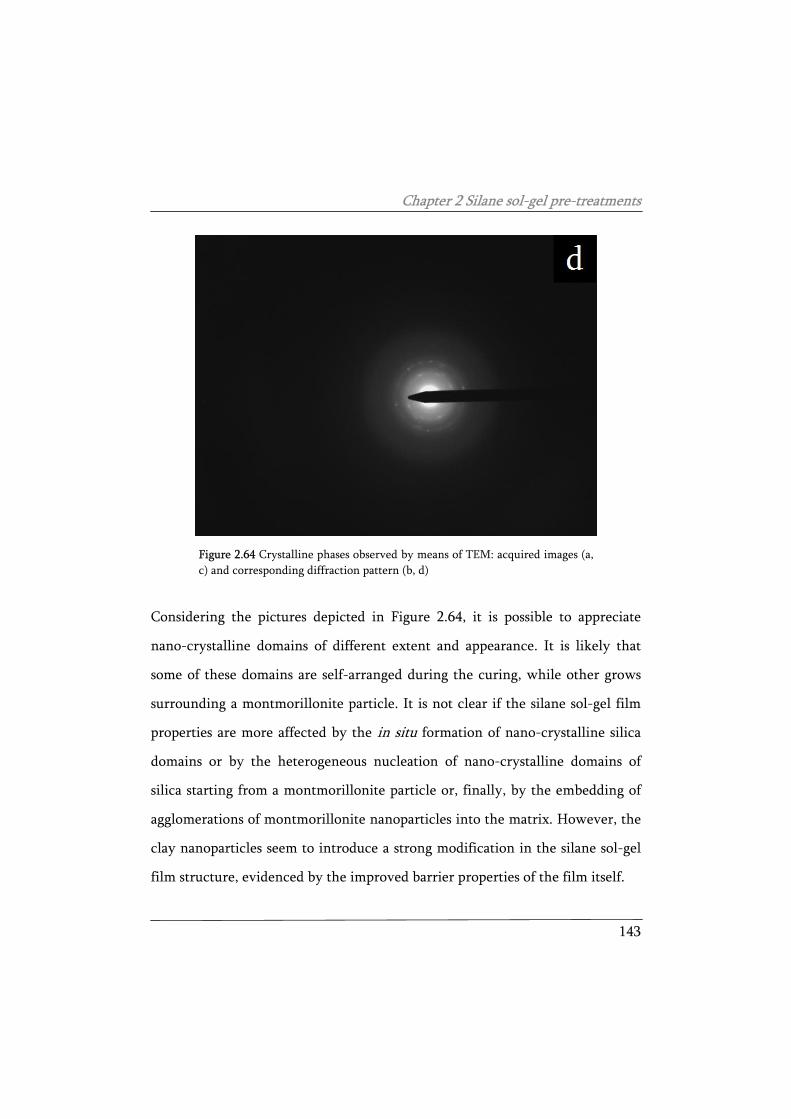
Chapter 2 Silane sol-gel pre-treatments
143
Figure 2.64 Crystalline phases observed by means of TEM: acquired images (a, c) and corresponding diffraction pattern (b, d)
Considering the pictures depicted in Figure 2.64, it is possible to appreciate
nano-crystalline domains of different extent and appearance. It is likely that
some of these domains are self-arranged during the curing, while other grows
surrounding a montmorillonite particle. It is not clear if the silane sol-gel film
properties are more affected by the in situ formation of nano-crystalline silica
domains or by the heterogeneous nucleation of nano-crystalline domains of
silica starting from a montmorillonite particle or, finally, by the embedding of
agglomerations of montmorillonite nanoparticles into the matrix. However, the
clay nanoparticles seem to introduce a strong modification in the silane sol-gel
film structure, evidenced by the improved barrier properties of the film itself.
Chapter 2 Silane sol-gel pre-treatments
144
The montmorillonite induces a local arrangement of the molecules which lead
to a lower permeability of the sol-gel film and the consequent higher resistance
to the penetration of to water and oxygen.
Concerning the silica domain self arranged in the hexagonal crystalline habit, it
is likely that it consist of hydrolyzed TEOS condensed during the curing in the
in a crystal structure. In fact, among the studied molecules, only the TEOS can
form, after hydrolysis and condensation reactions, a pure silica structure.
Cerium oxides enriched montmorillonite particles embedded into the silane sol-
gel matrix
In the previous section, it was evidenced that the concentration of 1000ppm of
nanoparticles in the starting diluted solution enhances the corrosion protection
of the sol-gel film. Next step is to try to embed into the silane sol-gel film clay
nanoparticles modified adding a corrosion inhibitor, in order to try to
functionalize the inorganic particles. The final aim is to produce sol-gel films
improved by means of an active corrosion protection potential. The inhibitors
used in this study consist of different cerium oxides. Cerium oxides can act as
corrosion inhibitors [73-76], even if the mechanism through which they act is
not completely understood.
In particular, two different nanoparticles were studied: montmorillonite
tailored with two different cerium oxides. The study aims also to test the effect
of a surface modification on final properties of the silane sol-gel film containing
Chapter 2 Silane sol-gel pre-treatments
145
clay nanoparticles and if the inhibitors improve the corrosion protection
performances of the sol-gel coatings.
Silane sol-gel layers containing the montmorillonite particles enriched with the
cerium oxides were applied on the galvanized steel plates, in order to compare
the performances of this pre-treatment with the sol-gel film containing the neat
nanoparticles. For this purpose, 1000ppm of, respectively, neat
montmorillonite, 5 w/w% Ce2O3 enriched montmorillonite and 5 w/w% CeO2
enriched montmorillonite were dispersed in the diluted silanes solution to
obtain three different sol-gel films (the procedure to graft the cerium oxides to
the clay is protected by patent). The films were obtained following the
procedure previously discussed in the experimental part. The corrosion
protection properties of these sol-gel films were evaluated, as before, by means
of electrochemical impedance spectroscopy. Figure 2.65 shows the silane sol-gel
resistance (a) and the charge transfer resistance (b) for the different sol-gel films
with the time of immersion in the aggressive solution.
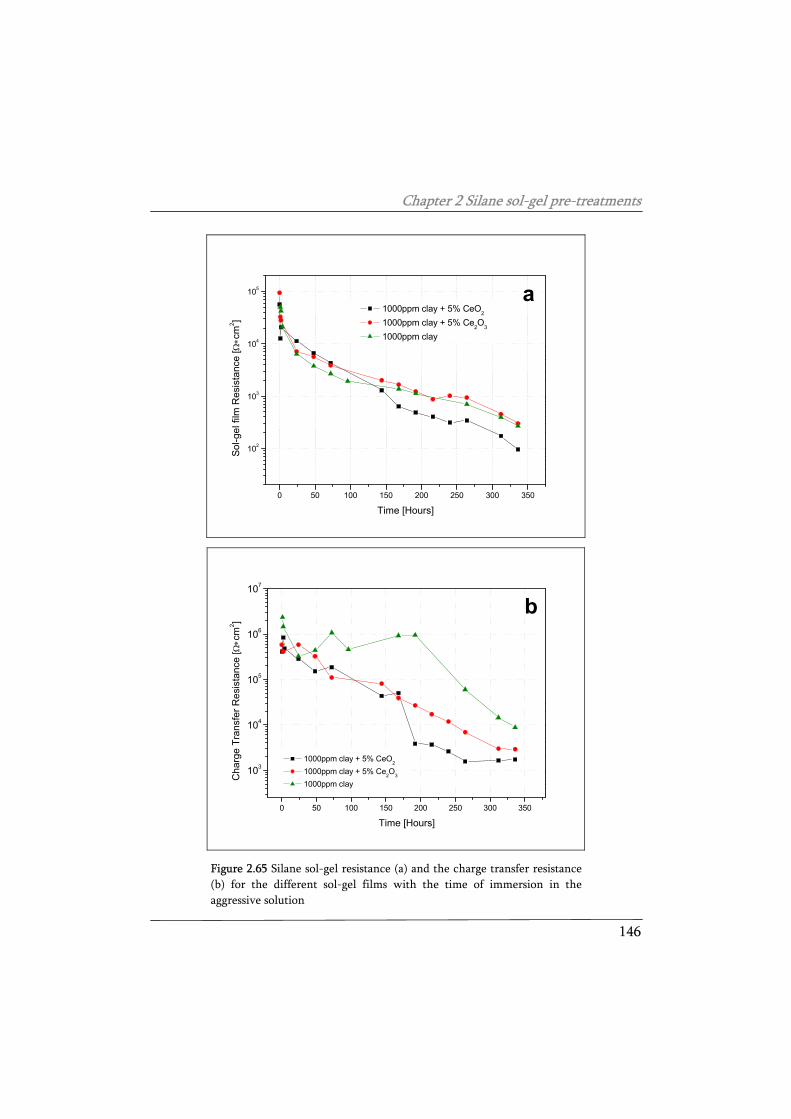
Chapter 2 Silane sol-gel pre-treatments
146
0 50 100 150 200 250 300 350
102
103
104
105 a 1000ppm clay + 5% CeO2 1000ppm clay + 5% Ce2O3 1000ppm clay
Sol-g
el fi
lm R
esis
tanc
e [Ω∗c
m2 ]
Time [Hours]
0 50 100 150 200 250 300 350
103
104
105
106
107
1000ppm clay + 5% CeO2 1000ppm clay + 5% Ce2O3 1000ppm clay
Cha
rge
Tran
sfer
Res
ista
nce
[Ω∗c
m2 ]
Time [Hours]
b
Figure 2.65 Silane sol-gel resistance (a) and the charge transfer resistance (b) for the different sol-gel films with the time of immersion in the aggressive solution
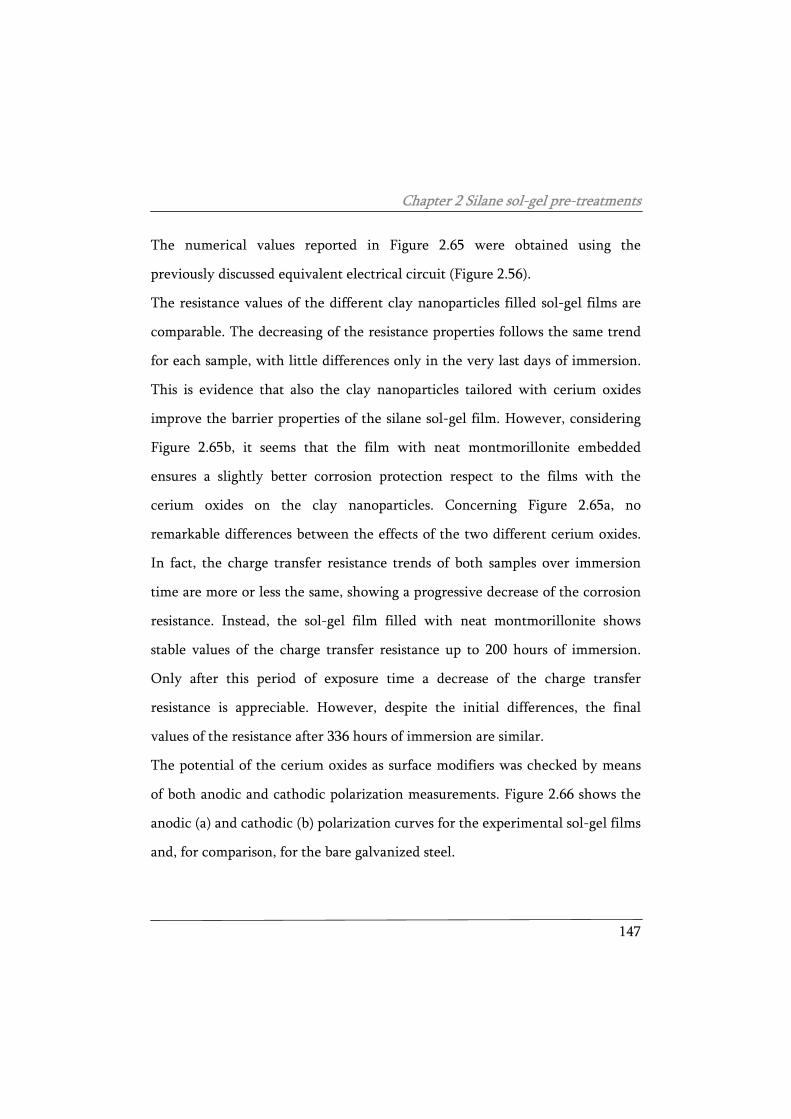
Chapter 2 Silane sol-gel pre-treatments
147
The numerical values reported in Figure 2.65 were obtained using the
previously discussed equivalent electrical circuit (Figure 2.56).
The resistance values of the different clay nanoparticles filled sol-gel films are
comparable. The decreasing of the resistance properties follows the same trend
for each sample, with little differences only in the very last days of immersion.
This is evidence that also the clay nanoparticles tailored with cerium oxides
improve the barrier properties of the silane sol-gel film. However, considering
Figure 2.65b, it seems that the film with neat montmorillonite embedded
ensures a slightly better corrosion protection respect to the films with the
cerium oxides on the clay nanoparticles. Concerning Figure 2.65a, no
remarkable differences between the effects of the two different cerium oxides.
In fact, the charge transfer resistance trends of both samples over immersion
time are more or less the same, showing a progressive decrease of the corrosion
resistance. Instead, the sol-gel film filled with neat montmorillonite shows
stable values of the charge transfer resistance up to 200 hours of immersion.
Only after this period of exposure time a decrease of the charge transfer
resistance is appreciable. However, despite the initial differences, the final
values of the resistance after 336 hours of immersion are similar.
The potential of the cerium oxides as surface modifiers was checked by means
of both anodic and cathodic polarization measurements. Figure 2.66 shows the
anodic (a) and cathodic (b) polarization curves for the experimental sol-gel films
and, for comparison, for the bare galvanized steel.
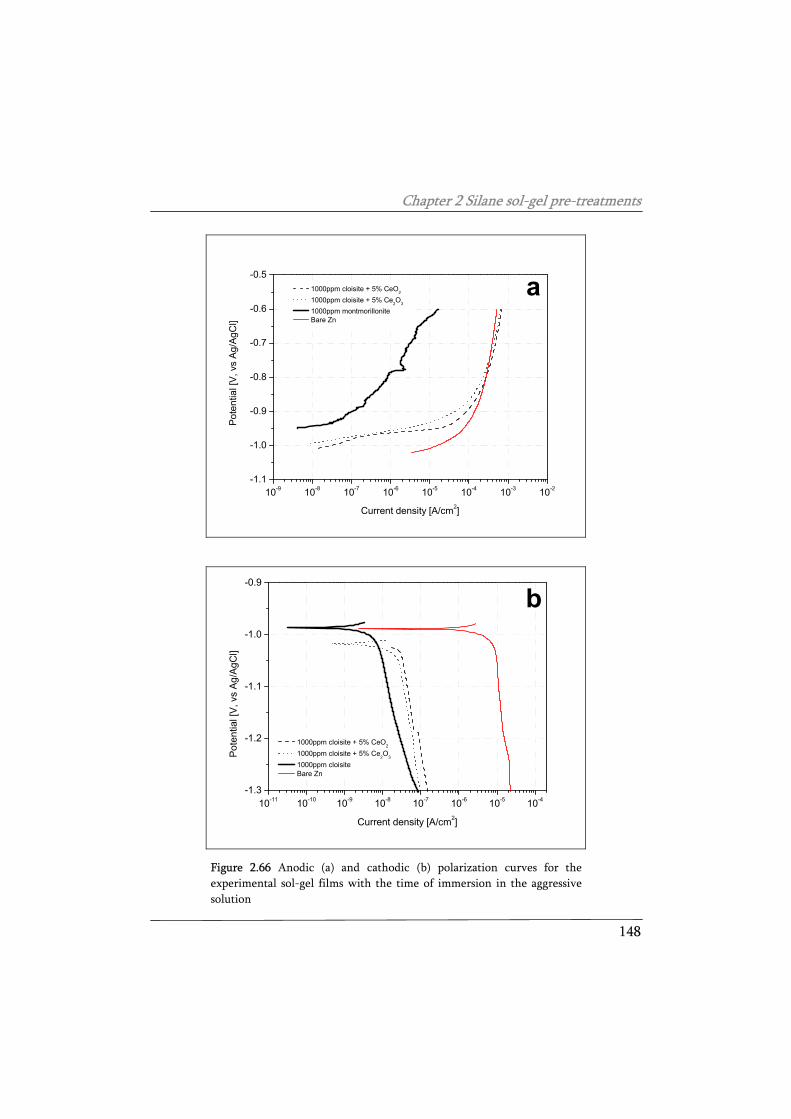
Chapter 2 Silane sol-gel pre-treatments
148
10-9 10-8 10-7 10-6 10-5 10-4 10-3 10-2-1.1
-1.0
-0.9
-0.8
-0.7
-0.6
-0.5 1000ppm cloisite + 5% CeO2
1000ppm cloisite + 5% Ce2O3
1000ppm montmorillonite Bare Zn
Pote
ntia
l [V
, vs
Ag/
AgC
l]
Current density [A/cm2]
a
10-11 10-10 10-9 10-8 10-7 10-6 10-5 10-4-1.3
-1.2
-1.1
-1.0
-0.9
1000ppm cloisite + 5% CeO2
1000ppm cloisite + 5% Ce2O3
1000ppm cloisite Bare Zn
Pote
ntia
l [V,
vs
Ag/A
gCl]
Current density [A/cm2]
b
Figure 2.66 Anodic (a) and cathodic (b) polarization curves for the experimental sol-gel films with the time of immersion in the aggressive solution
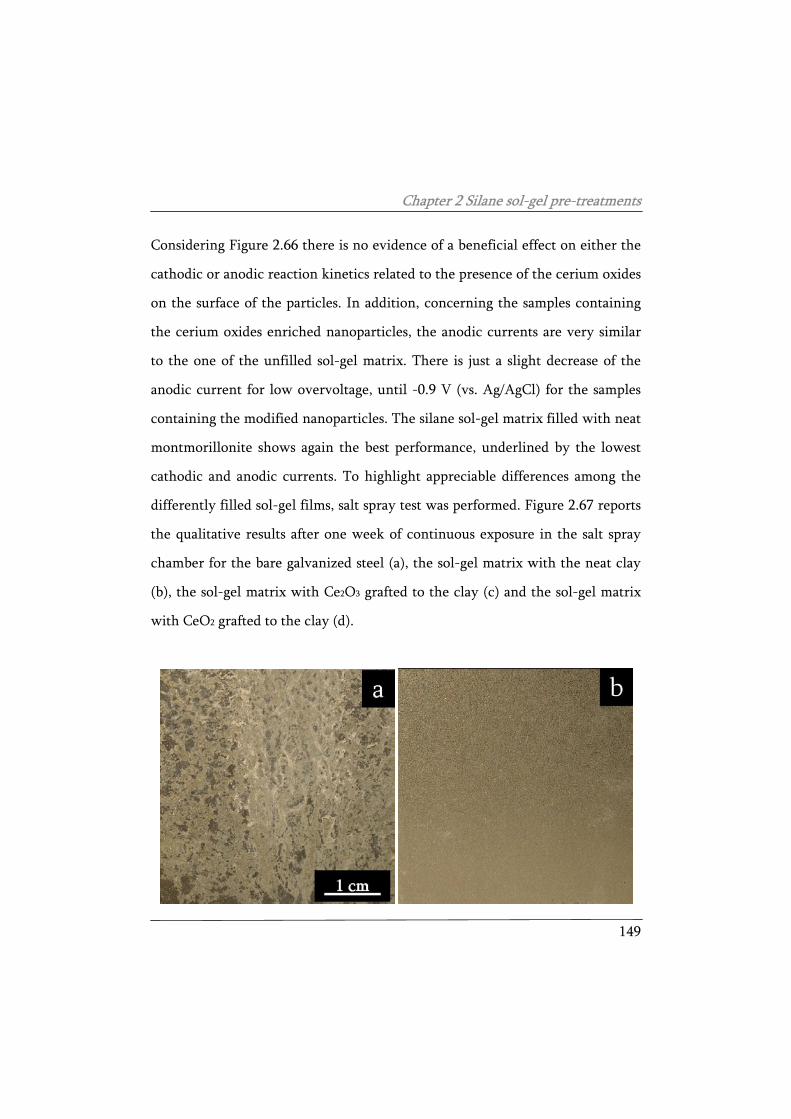
Chapter 2 Silane sol-gel pre-treatments
149
Considering Figure 2.66 there is no evidence of a beneficial effect on either the
cathodic or anodic reaction kinetics related to the presence of the cerium oxides
on the surface of the particles. In addition, concerning the samples containing
the cerium oxides enriched nanoparticles, the anodic currents are very similar
to the one of the unfilled sol-gel matrix. There is just a slight decrease of the
anodic current for low overvoltage, until -0.9 V (vs. Ag/AgCl) for the samples
containing the modified nanoparticles. The silane sol-gel matrix filled with neat
montmorillonite shows again the best performance, underlined by the lowest
cathodic and anodic currents. To highlight appreciable differences among the
differently filled sol-gel films, salt spray test was performed. Figure 2.67 reports
the qualitative results after one week of continuous exposure in the salt spray
chamber for the bare galvanized steel (a), the sol-gel matrix with the neat clay
(b), the sol-gel matrix with Ce2O3 grafted to the clay (c) and the sol-gel matrix
with CeO2 grafted to the clay (d).
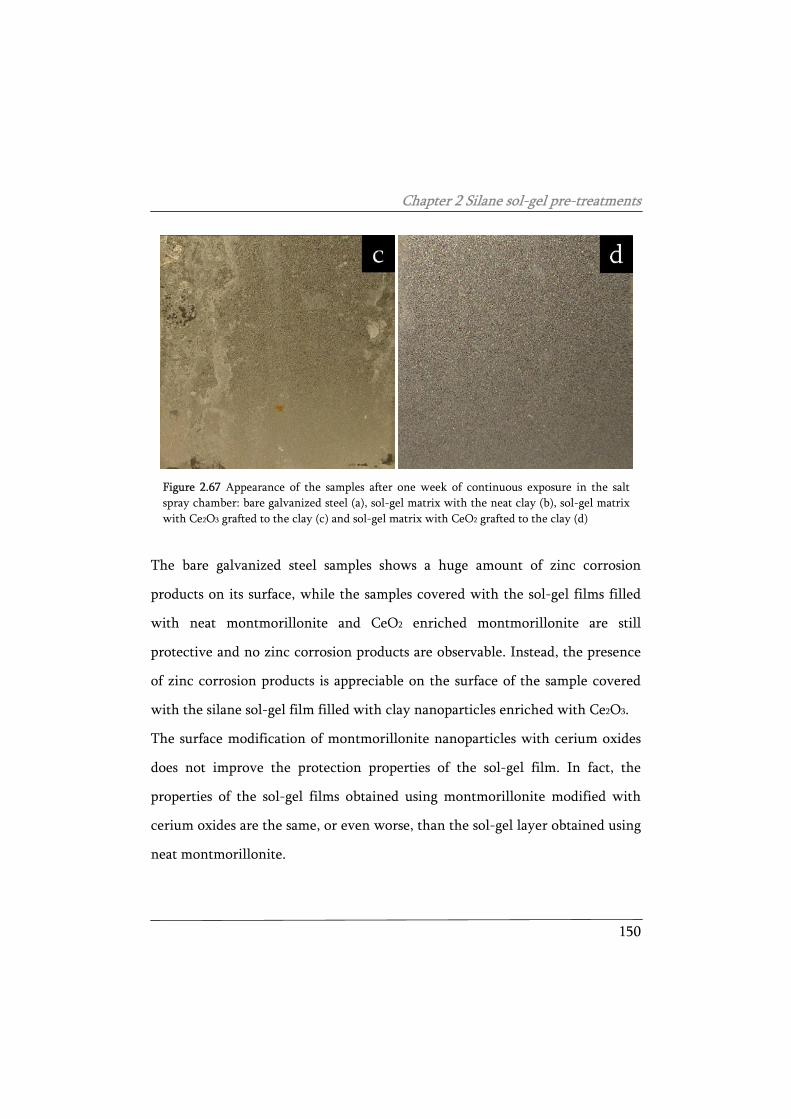
Chapter 2 Silane sol-gel pre-treatments
150
Figure 2.67 Appearance of the samples after one week of continuous exposure in the salt spray chamber: bare galvanized steel (a), sol-gel matrix with the neat clay (b), sol-gel matrix with Ce2O3 grafted to the clay (c) and sol-gel matrix with CeO2 grafted to the clay (d)
The bare galvanized steel samples shows a huge amount of zinc corrosion
products on its surface, while the samples covered with the sol-gel films filled
with neat montmorillonite and CeO2 enriched montmorillonite are still
protective and no zinc corrosion products are observable. Instead, the presence
of zinc corrosion products is appreciable on the surface of the sample covered
with the silane sol-gel film filled with clay nanoparticles enriched with Ce2O3.
The surface modification of montmorillonite nanoparticles with cerium oxides
does not improve the protection properties of the sol-gel film. In fact, the
properties of the sol-gel films obtained using montmorillonite modified with
cerium oxides are the same, or even worse, than the sol-gel layer obtained using
neat montmorillonite.
Chapter 2 Silane sol-gel pre-treatments
151
Maybe the cerium oxides modify the clay particles interfering with the
embedding procedure. Indeed, the surface modification of montmorillonite
nanoparticles, due to the presence of the oxides, may negatively affect the
performances of the silane films, by influencing the silane – clay interaction. In
any case, it is not possible to appreciate an evidence of an inhibition of the
corrosion processes carried out by the cerium oxides.
2.5 Final comments
Hybrid silicon alkoxides molecules were used for the production of sol-gel
coatings to protect aluminium and HDG steel. These sol-gel pre-treatments
were tested as adhesion promoters in combination with both powder and
cataphoretic coatings for the development of environmentally friendly
protection cycles to prevent corrosion and degradation of the studied metals.
The same experimental mixture of silicon alkoxides was tested both on an
aluminium alloy and on HDG steel. The results on aluminium proved that the
silane treatment provides the substrate with an effective barrier against
corrosion. In addition, it acts as a coupling agent improving the adhesion with
the epoxy-polyester organic coating and, in general, the corrosion protection
properties. The comparison with other pre-treatment technologies highlighted
that the experimental silane sol-gel pre-treatment ensures good performance,
comparable or higher than the other surface conversion treatments tested in
Chapter 2 Silane sol-gel pre-treatments
152
this work. Considering the application onto galvanized steel, an effective
combination of silicon alkoxides, deposition procedure and curing temperature
has been carried out to optimize the corrosion protection properties of the sol-
gel film itself and the interaction with both powder coating and cataphoretic
paints. The test carried out on HDG steel proved that covered with an organic
coating and cured at high temperatures, the produced silanes sol-gel pre-
treatments act both as an efficient barrier against moisture and oxygen
permeation (relatively to their thickness) and also as a coupling agent
improving the corrosion resistance of the complete protection system.
Concerning the cataphoretic coating the experimental sol-gel treatment can be
properly designed to inhibit the hydrogen release leading to the formation of a
continuous and defect-free electrodeposited coating. As a further result, the
barrier properties of the sol-gel coating itself were improved adding
montmorillonite nanoparticles to the silane mixtures. The preliminary analysis
demonstrated that the nanoparticles modify the film formation mechanism
leading to the formation of sol-gel coating with enhanced resistance to water
uptake and oxygen permeation.
Chapter 3 Ultra violet cured nano composite coatings
153
3 Ultra violet cured nanocomposite coatings
Generally speaking, at present waterborne coatings offer the advantage of an
environmentally friendly technology, but still show some drawbacks with
respect to conventional solventborne systems: poorer film forming properties
onto low surface energy substrates, low viscosity, non Newtonian rheological
behaviour and sagging, difficult formation of defect free films with constant
thickness and poor control of stoichiometry during cross-linking. As a
consequence, unsatisfactory substrate adhesion, weatherability, barrier and
mechanical properties can be expected. Aqueous dispersions which can be
cross-linked by UV exposure are an alternative promising approach.
The UV curing technique is an efficient and environmentally friendly
technology for the production of protective coatings for wood, metals, paper,
plastics and glass. The technique is based on the bulk polymerisation of a
radiation curable resin without the use of solvents. The process takes place at
room temperature, upon irradiation of UV light if a suitable photoinitiator is
used: in a very short time (from milliseconds to seconds) the coating is cross-
linked [130]. The curable formulation can contain different monomers and
resins, depending on the application. Water, as the non-toxic diluent thinner,
already largely used for traditional paints and varnishes, has been introduced in
Chapter 3 Ultra violet cured nano composite coatings
154
UV curable formulation very recently and few products of this type are
available [83,131,132].
In this chapter, the design, application and characterisation of well defined
model structures of waterborne UV curing coatings as neat and modified on
purpose in order to obtain nano-structured waterborne films with improved
corrosion resistance and thermo-mechanical properties are described. The
modification of the waterborne matrix was performed adding silicon based
hybrid molecules, such as TEOS and GPTS (already used in the previous chapter
to form hybrid sol-gel coupling films on different metals), to the polymeric
matrix. The aim is to enhance the corrosion protection properties of the UV
curable organic coating using the silicon alkoxides molecules. For this purpose,
two approaches were used:
- to use the silicon alkoxides to promote the formation of inorganic
domains directly into the polymeric matrix (in situ);
- to use the silicon alkoxides as coupling agents between inorganic
nanoparticles and the organic matrix of the polymer:
The corrosion protection properties of this new coatings materials are not well
known, but the possible application in the field of corrosion protection of
metallic substrates are very interesting because of the environmental
compatibility of the protecting system [133].
Chapter 3 Ultra violet cured nano composite coatings
155
3.1 Urethane acrylic coatings
In this section the synthesis and characterization of UV curable anionomeric
polyurethane resins having polyether backbones of different molecular weight
and acrylic functional groups were carried out [134]. In this case no
modification of the matrix with silicon alkoxides was carried out because of this
was a preliminary study on the properties of the neat polymeric matrix. The
results obtained in this section were used for comparison with the silicon
alkoxides modified organic coatings.
Thus, in this section the design, application and characterisation of well defined
model structures of polyurethane waterborne UV curing coatings are presented.
Polyurethane aqueous dispersions are widely accepted owing to their better
durability, adhesion and mechanical properties [135,136]. These products
basically consist of ionomeric structures [137] where the polymeric backbones
bear salified groups like carboxyls –COO-M+ or quaternary ammonium salts -
NR4+X-. Basically, these ionic groups act like internal emulsifiers of the
hydrophobic polymer allowing its dispersion in water as stabilised particles
(macromolecular aggregates of 103 nm size as an average). Both
monocomponent and bicomponent waterborne polyurethanes [138–140] are
known in the literature. In particular, monocomponent systems are
substantially thermoplastics, which can be eventually crosslinked after film
formation and physical drying. Bicomponent systems [141–145] are made of
functionalised polyurethanes, for example with hydroxyl groups, and are
Chapter 3 Ultra violet cured nano composite coatings
156
formulated with suitable cross-linkers, such as water dispersible
polyisocyanates. In this case the formulation has a limited pot life: beyond a
limit time, gelling occurs and the polymeric system shows poor, if any, film
forming properties. The aqueous dispersion used in this study contains a
polyurethane ionomeric structure with acrylic end groups and after water
removal are easily cured.
In this section, the synthesis of new anionomeric polyurethane resins having
polyether backbones of different molecular weight and acrylic functional
groups will be discussed. The thermo-mechanical properties of the coatings
were investigated by means of both Thermal gravimetric analysis (TGA),
performed on the cured coatings, DSC measurements and dynamic-mechanical
analyses (DMA) on self-supported films.
Moreover a complete electrochemical characterisation of the corrosion
protection properties of the UV curable waterborne urethane acrylic coatings
was carried out by means of electrochemical impedance spectroscopy [EIS].
3.1.1 Preparation of the UV curable urethane acrylic coatings
The waterborne resins considered in this section are segmented anionomeric
polyurethanes functionalized with acrylic end groups. They were prepared
starting from polytetramethylene glycol (PTMG, see Figure 3.1), isophorone
diisocyanate (IPDI, see Figure 3.2), dimethylol propionic acid (DMPA, see
Figure 3.3), and hydroxyethylacrylate (HEA, see Figure 3.4), according to
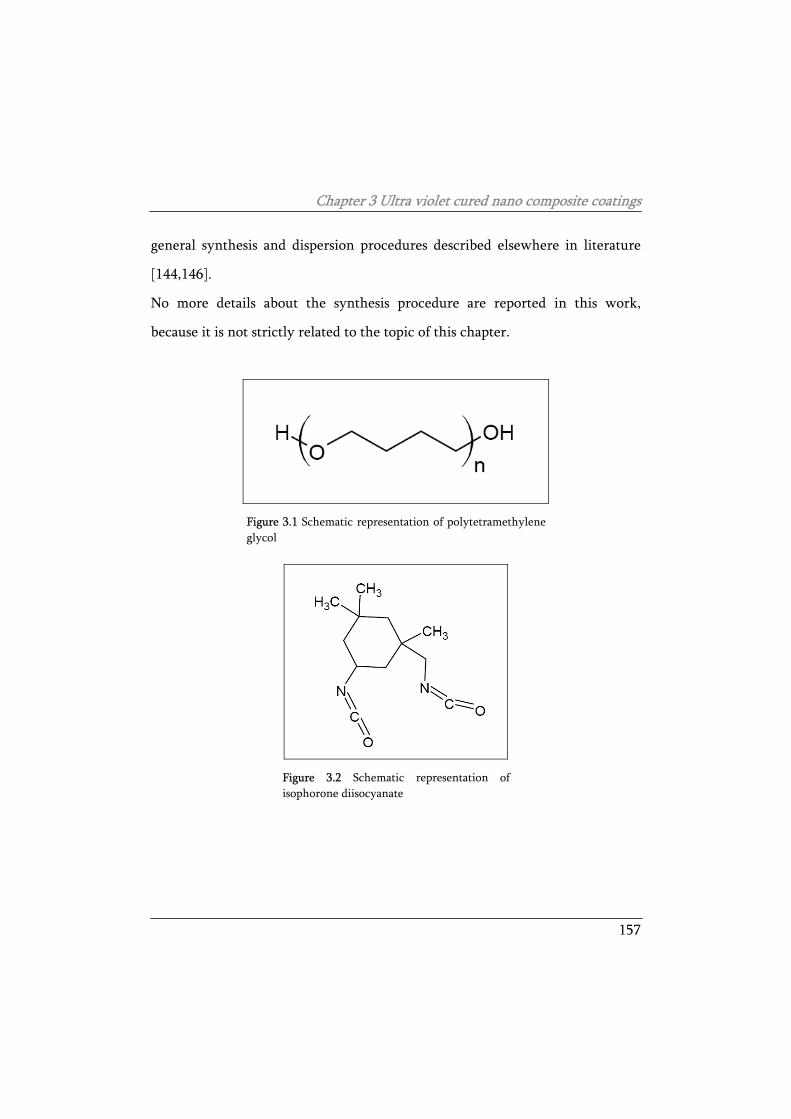
Chapter 3 Ultra violet cured nano composite coatings
157
general synthesis and dispersion procedures described elsewhere in literature
[144,146].
No more details about the synthesis procedure are reported in this work,
because it is not strictly related to the topic of this chapter.
Figure 3.1 Schematic representation of polytetramethylene glycol
Figure 3.2 Schematic representation of isophorone diisocyanate
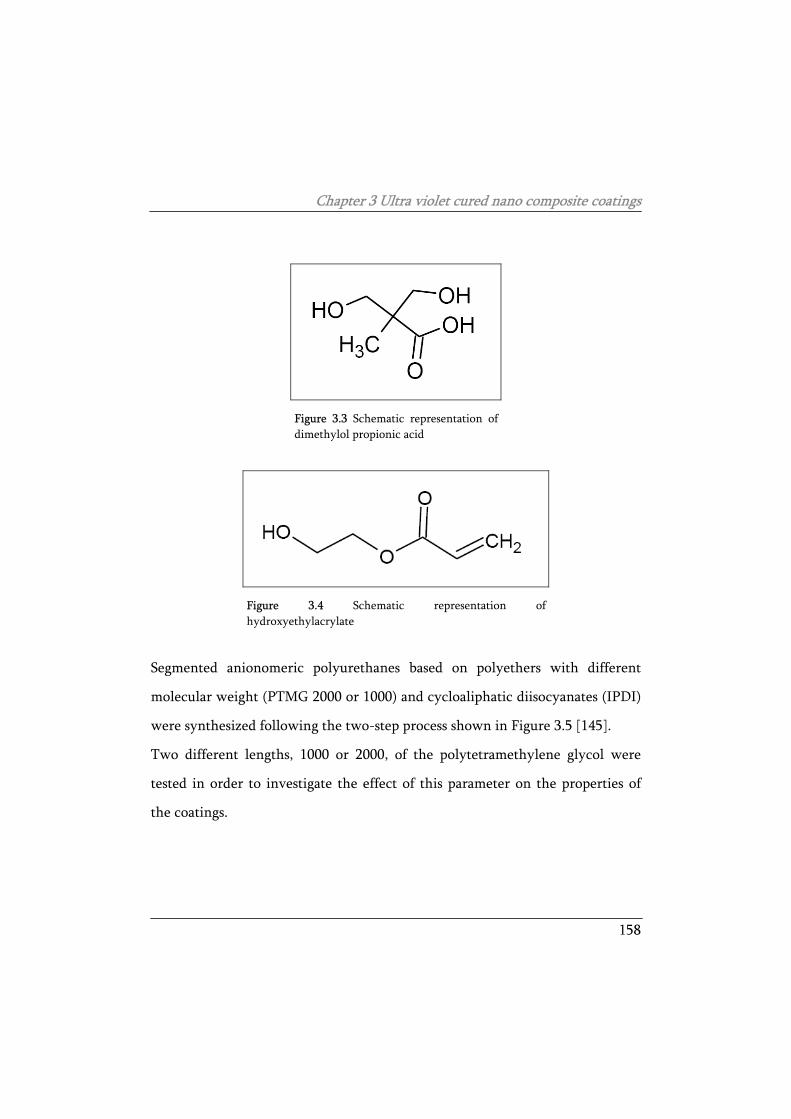
Chapter 3 Ultra violet cured nano composite coatings
158
Figure 3.3 Schematic representation of dimethylol propionic acid
Figure 3.4 Schematic representation of hydroxyethylacrylate
Segmented anionomeric polyurethanes based on polyethers with different
molecular weight (PTMG 2000 or 1000) and cycloaliphatic diisocyanates (IPDI)
were synthesized following the two-step process shown in Figure 3.5 [145].
Two different lengths, 1000 or 2000, of the polytetramethylene glycol were
tested in order to investigate the effect of this parameter on the properties of
the coatings.
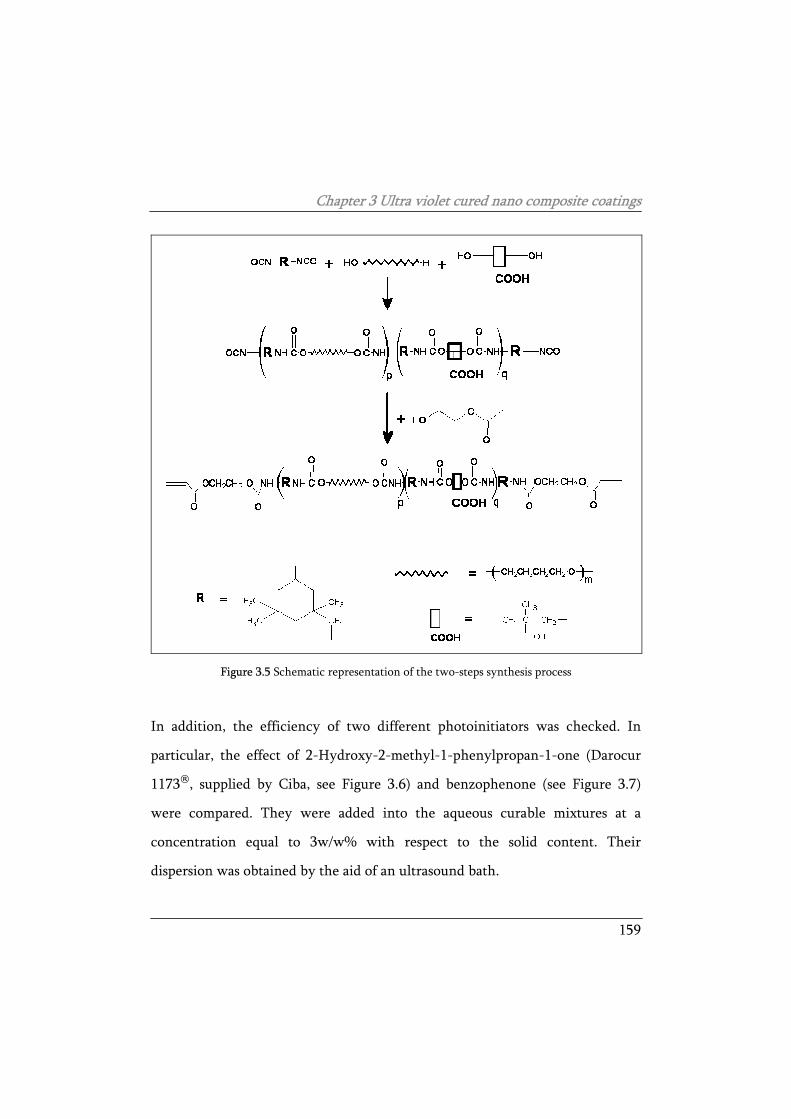
Chapter 3 Ultra violet cured nano composite coatings
159
Figure 3.5 Schematic representation of the two-steps synthesis process
In addition, the efficiency of two different photoinitiators was checked. In
particular, the effect of 2-Hydroxy-2-methyl-1-phenylpropan-1-one (Darocur
1173®, supplied by Ciba, see Figure 3.6) and benzophenone (see Figure 3.7)
were compared. They were added into the aqueous curable mixtures at a
concentration equal to 3w/w% with respect to the solid content. Their
dispersion was obtained by the aid of an ultrasound bath.
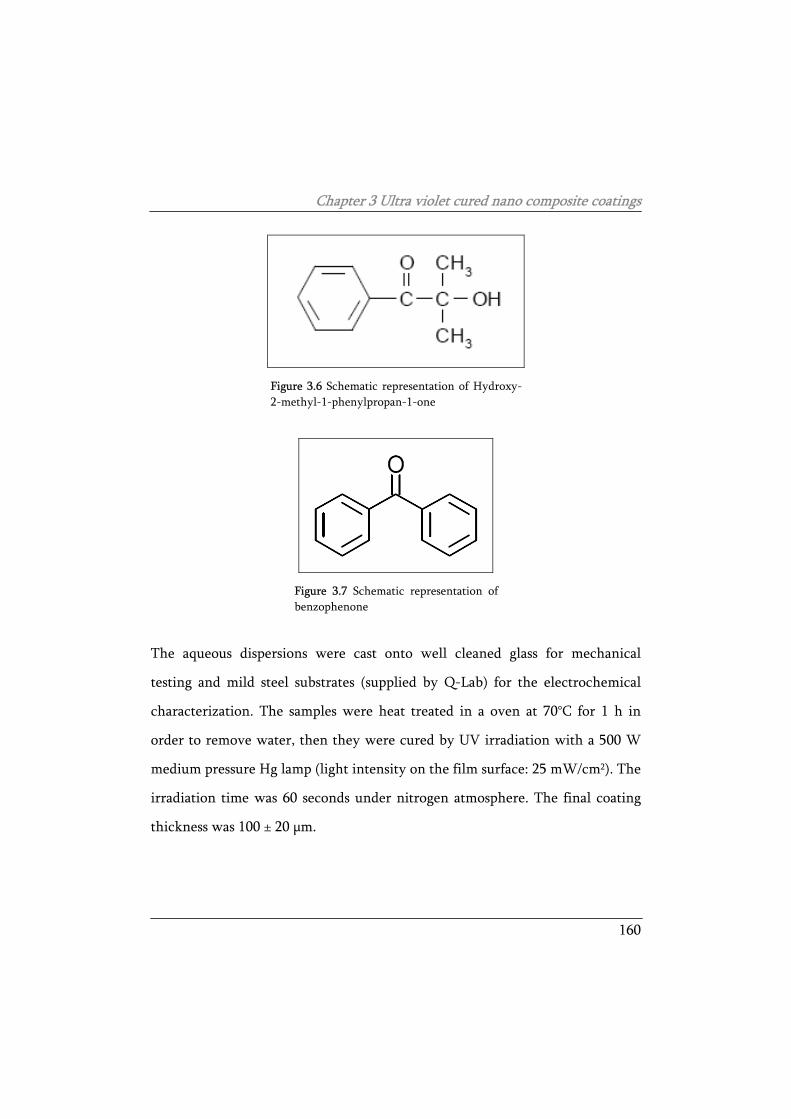
Chapter 3 Ultra violet cured nano composite coatings
160
Figure 3.6 Schematic representation of Hydroxy-2-methyl-1-phenylpropan-1-one
Figure 3.7 Schematic representation of benzophenone
The aqueous dispersions were cast onto well cleaned glass for mechanical
testing and mild steel substrates (supplied by Q-Lab) for the electrochemical
characterization. The samples were heat treated in a oven at 70°C for 1 h in
order to remove water, then they were cured by UV irradiation with a 500 W
medium pressure Hg lamp (light intensity on the film surface: 25 mW/cm2). The
irradiation time was 60 seconds under nitrogen atmosphere. The final coating
thickness was 100 ± 20 µm.
Chapter 3 Ultra violet cured nano composite coatings
161
3.1.2 Characterization of the UV curable urethane acrylic
coatings
As stated beforehand, the influence of two different lengths of the chain of the
polytetramethylene glycol and the effect of two sorts of photoinitiator (2-
Hydroxy-2-methyl-1-phenylpropan-1-one and benzophenone) were
investigated. Table 3.1 indicates the different properties of the two resins
obtained starting from a 1000 Mn or a 2000 Mn PTMG macromolecule,
indicated as PUD-A and PUD-B, respectively. The molecular characterization
of resins was made by chemical titration according to ASTM D2572, by FTIR
spectroscopy with a Nicolet Nexus spectrometer, and by GPC with a Waters
instrument calibrated with polystyrene narrow standards and equipped with a
refractive index detector. During the first step a NCO terminated prepolymer
was formed and its isocyanate content was checked by dibutylamine/HCl
backtitration. Then the prepolymer was endcapped with HEA after dilution
with N-methyl Pyrrolidone (NMP, 10% on solid). FTIR spectroscopy and Gel
Permeation Chromatography (GPC) were used to control conversion
(disappearance of NCO stretching band at 2260 cm-1) and molecular weight of
the resin obtained. The structures synthesized are indicated as anionomers since
they contain DMPA which can be neutralized with triethylamine allowing its
dispersion in water. Consequently, once formed, the anionomer was poured in
water under high speed stirring obtaining the final aqueous dispersion at solid
30%.
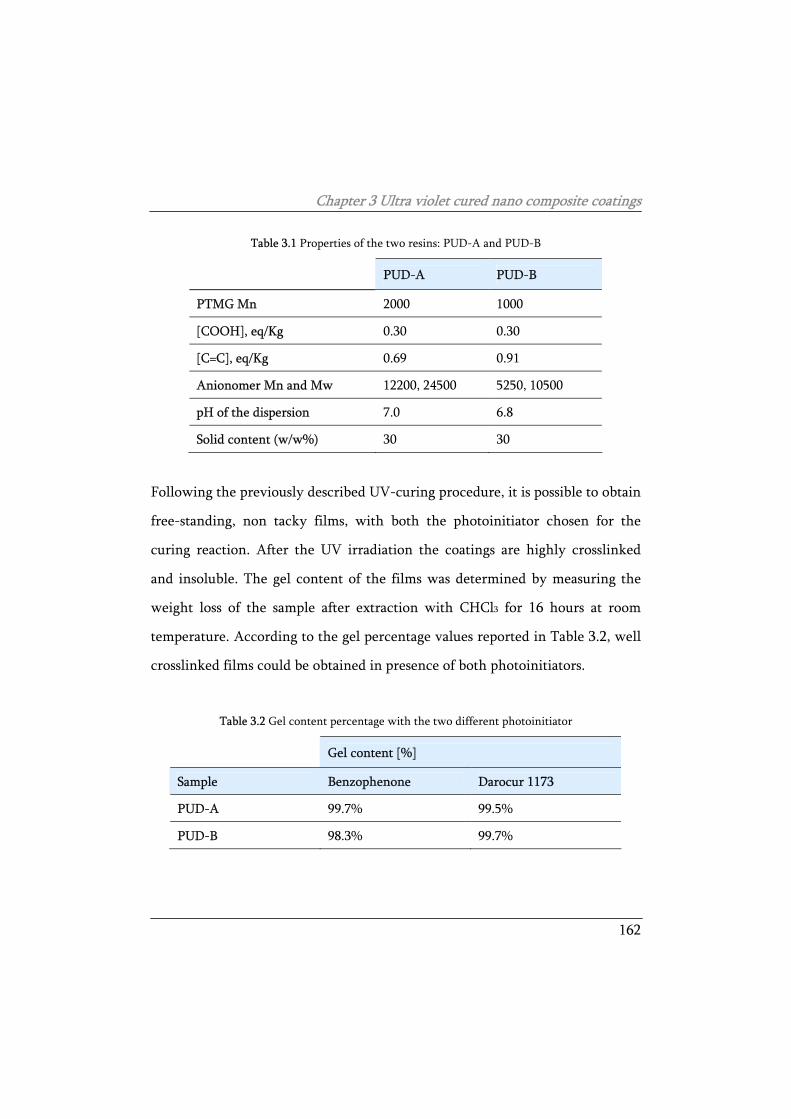
Chapter 3 Ultra violet cured nano composite coatings
162
Table 3.1 Properties of the two resins: PUD-A and PUD-B
PUD-A PUD-B
PTMG Mn 2000 1000
[COOH], eq/Kg 0.30 0.30
[C=C], eq/Kg 0.69 0.91
Anionomer Mn and Mw 12200, 24500 5250, 10500
pH of the dispersion 7.0 6.8
Solid content (w/w%) 30 30
Following the previously described UV-curing procedure, it is possible to obtain
free-standing, non tacky films, with both the photoinitiator chosen for the
curing reaction. After the UV irradiation the coatings are highly crosslinked
and insoluble. The gel content of the films was determined by measuring the
weight loss of the sample after extraction with CHCl3 for 16 hours at room
temperature. According to the gel percentage values reported in Table 3.2, well
crosslinked films could be obtained in presence of both photoinitiators.
Table 3.2 Gel content percentage with the two different photoinitiator
Gel content [%]
Sample Benzophenone Darocur 1173
PUD-A 99.7% 99.5%
PUD-B 98.3% 99.7%
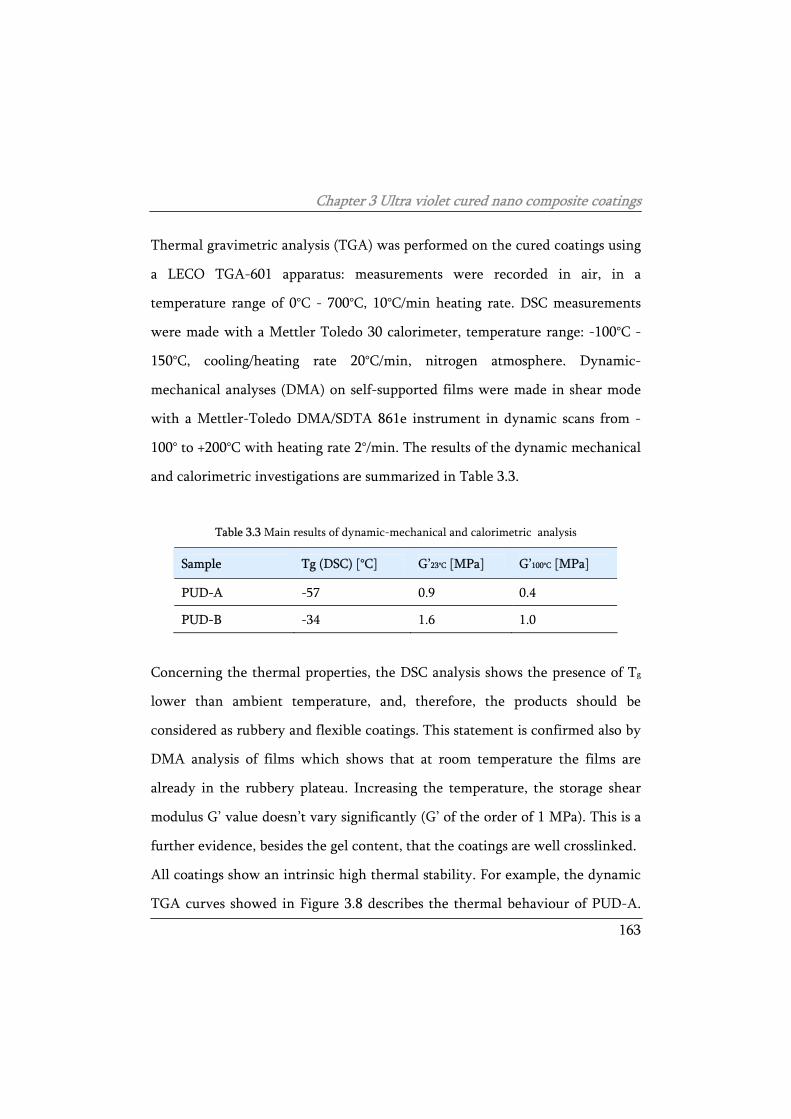
Chapter 3 Ultra violet cured nano composite coatings
163
Thermal gravimetric analysis (TGA) was performed on the cured coatings using
a LECO TGA-601 apparatus: measurements were recorded in air, in a
temperature range of 0°C - 700°C, 10°C/min heating rate. DSC measurements
were made with a Mettler Toledo 30 calorimeter, temperature range: -100°C -
150°C, cooling/heating rate 20°C/min, nitrogen atmosphere. Dynamic-
mechanical analyses (DMA) on self-supported films were made in shear mode
with a Mettler-Toledo DMA/SDTA 861e instrument in dynamic scans from -
100° to +200°C with heating rate 2°/min. The results of the dynamic mechanical
and calorimetric investigations are summarized in Table 3.3.
Table 3.3 Main results of dynamic-mechanical and calorimetric analysis
Sample Tg (DSC) [°C] G’23°C [MPa] G’100°C [MPa]
PUD-A -57 0.9 0.4
PUD-B -34 1.6 1.0
Concerning the thermal properties, the DSC analysis shows the presence of Tg
lower than ambient temperature, and, therefore, the products should be
considered as rubbery and flexible coatings. This statement is confirmed also by
DMA analysis of films which shows that at room temperature the films are
already in the rubbery plateau. Increasing the temperature, the storage shear
modulus G’ value doesn’t vary significantly (G’ of the order of 1 MPa). This is a
further evidence, besides the gel content, that the coatings are well crosslinked.
All coatings show an intrinsic high thermal stability. For example, the dynamic
TGA curves showed in Figure 3.8 describes the thermal behaviour of PUD-A.
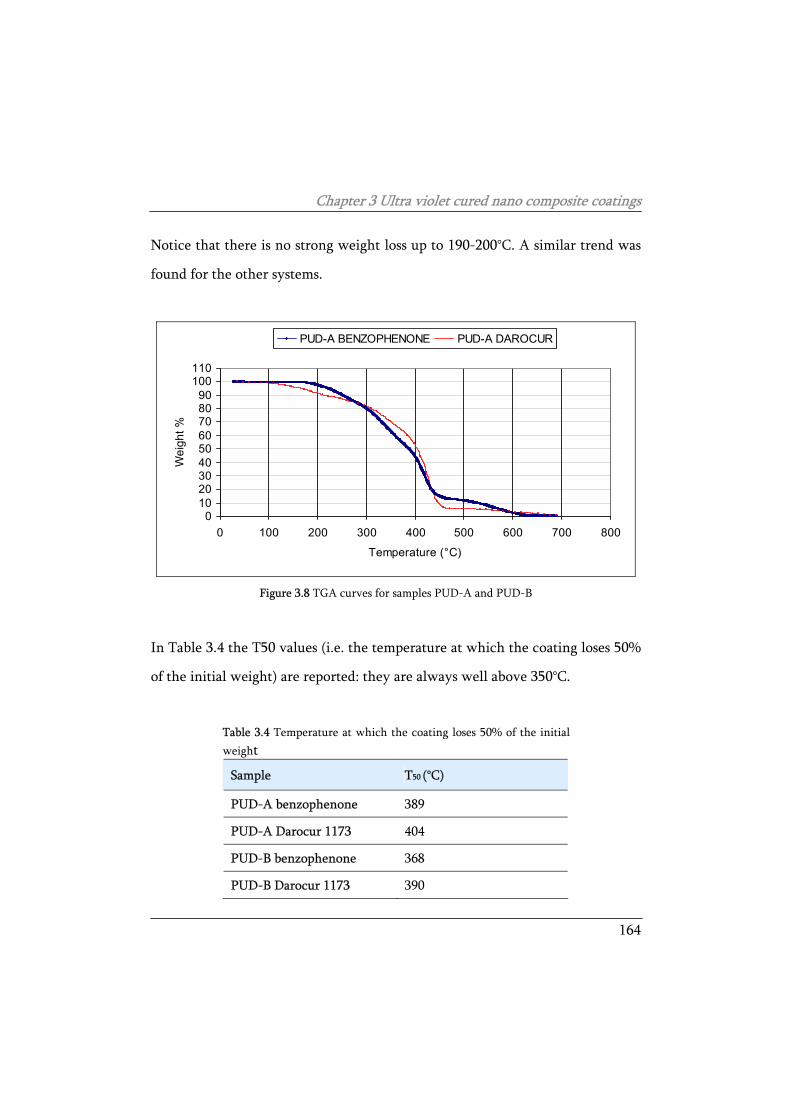
Chapter 3 Ultra violet cured nano composite coatings
164
Notice that there is no strong weight loss up to 190-200°C. A similar trend was
found for the other systems.
0102030405060708090
100110
0 100 200 300 400 500 600 700 800
Temperature (°C)
Wei
ght %
PUD-A BENZOPHENONE PUD-A DAROCUR
Figure 3.8 TGA curves for samples PUD-A and PUD-B
In Table 3.4 the T50 values (i.e. the temperature at which the coating loses 50%
of the initial weight) are reported: they are always well above 350°C.
Table 3.4 Temperature at which the coating loses 50% of the initial weight
Sample T50 (°C)
PUD-A benzophenone 389
PUD-A Darocur 1173 404
PUD-B benzophenone 368
PUD-B Darocur 1173 390
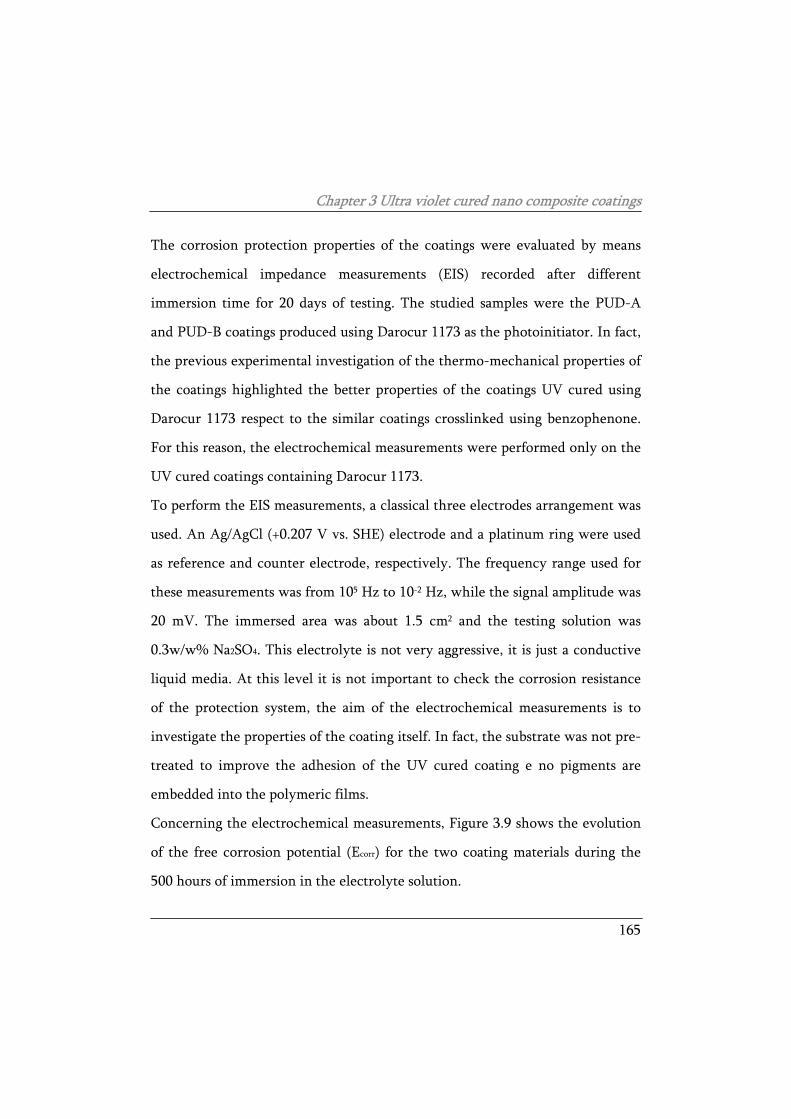
Chapter 3 Ultra violet cured nano composite coatings
165
The corrosion protection properties of the coatings were evaluated by means
electrochemical impedance measurements (EIS) recorded after different
immersion time for 20 days of testing. The studied samples were the PUD-A
and PUD-B coatings produced using Darocur 1173 as the photoinitiator. In fact,
the previous experimental investigation of the thermo-mechanical properties of
the coatings highlighted the better properties of the coatings UV cured using
Darocur 1173 respect to the similar coatings crosslinked using benzophenone.
For this reason, the electrochemical measurements were performed only on the
UV cured coatings containing Darocur 1173.
To perform the EIS measurements, a classical three electrodes arrangement was
used. An Ag/AgCl (+0.207 V vs. SHE) electrode and a platinum ring were used
as reference and counter electrode, respectively. The frequency range used for
these measurements was from 105 Hz to 10-2 Hz, while the signal amplitude was
20 mV. The immersed area was about 1.5 cm2 and the testing solution was
0.3w/w% Na2SO4. This electrolyte is not very aggressive, it is just a conductive
liquid media. At this level it is not important to check the corrosion resistance
of the protection system, the aim of the electrochemical measurements is to
investigate the properties of the coating itself. In fact, the substrate was not pre-
treated to improve the adhesion of the UV cured coating e no pigments are
embedded into the polymeric films.
Concerning the electrochemical measurements, Figure 3.9 shows the evolution
of the free corrosion potential (Ecorr) for the two coating materials during the
500 hours of immersion in the electrolyte solution.
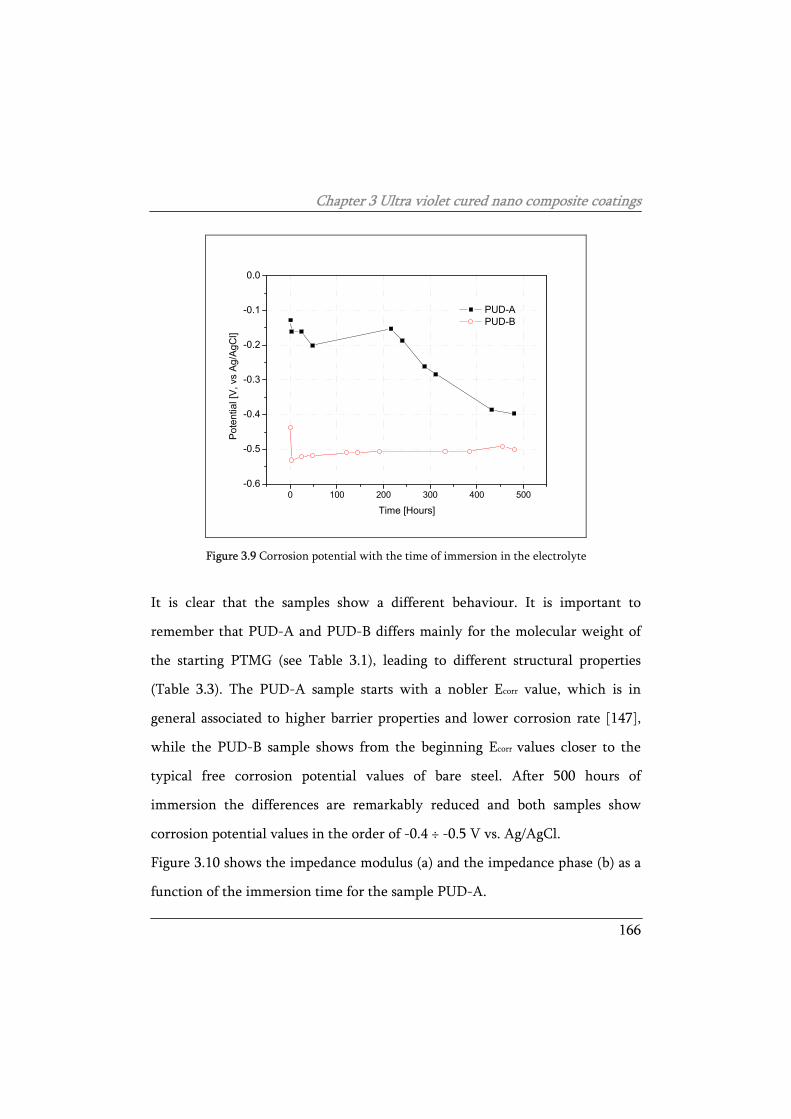
Chapter 3 Ultra violet cured nano composite coatings
166
0 100 200 300 400 500-0.6
-0.5
-0.4
-0.3
-0.2
-0.1
0.0
Pote
ntia
l [V,
vs
Ag/A
gCl]
Time [Hours]
PUD-A PUD-B
Figure 3.9 Corrosion potential with the time of immersion in the electrolyte
It is clear that the samples show a different behaviour. It is important to
remember that PUD-A and PUD-B differs mainly for the molecular weight of
the starting PTMG (see Table 3.1), leading to different structural properties
(Table 3.3). The PUD-A sample starts with a nobler Ecorr value, which is in
general associated to higher barrier properties and lower corrosion rate [147],
while the PUD-B sample shows from the beginning Ecorr values closer to the
typical free corrosion potential values of bare steel. After 500 hours of
immersion the differences are remarkably reduced and both samples show
corrosion potential values in the order of -0.4 ÷ -0.5 V vs. Ag/AgCl.
Figure 3.10 shows the impedance modulus (a) and the impedance phase (b) as a
function of the immersion time for the sample PUD-A.
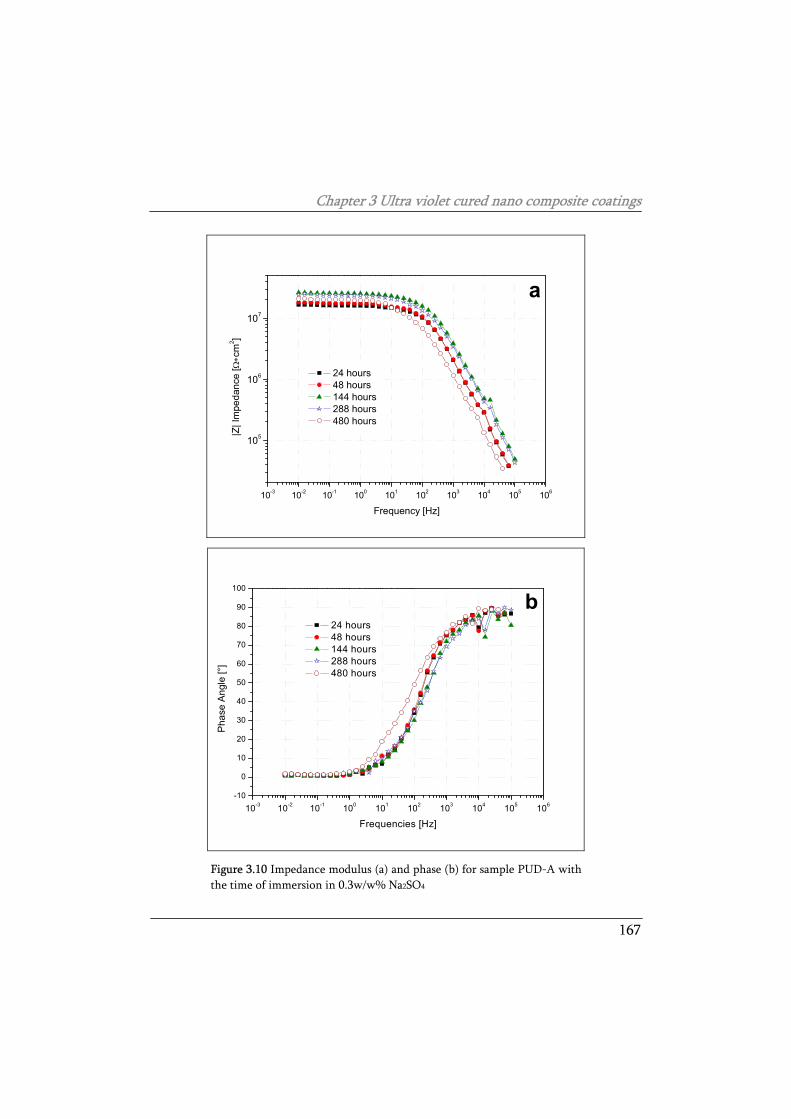
Chapter 3 Ultra violet cured nano composite coatings
167
10-3 10-2 10-1 100 101 102 103 104 105 106
105
106
107
24 hours 48 hours 144 hours 288 hours 480 hours
|Z| I
mpe
danc
e [Ω∗c
m2 ]
Frequency [Hz]
a
10-3 10-2 10-1 100 101 102 103 104 105 106-10
0
10
20
30
40
50
60
70
80
90
100
b 24 hours 48 hours 144 hours 288 hours 480 hours
Pha
se A
ngle
[°]
Frequencies [Hz]
Figure 3.10 Impedance modulus (a) and phase (b) for sample PUD-A with the time of immersion in 0.3w/w% Na2SO4
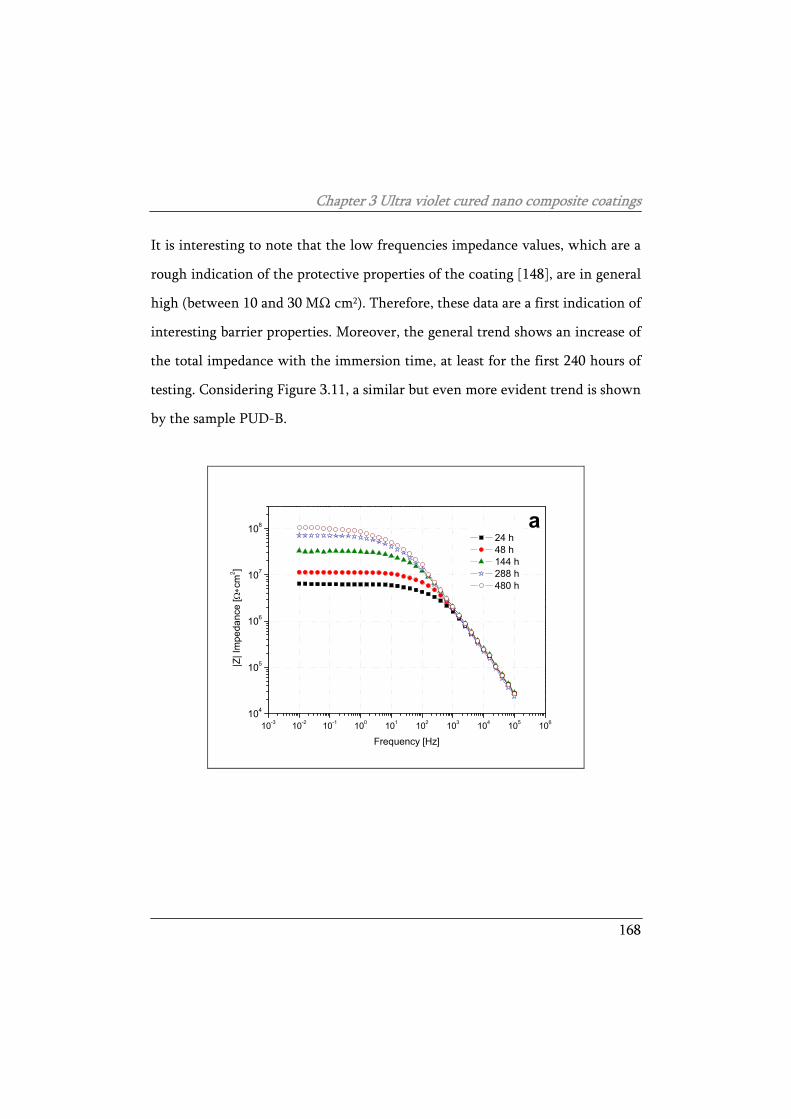
Chapter 3 Ultra violet cured nano composite coatings
168
It is interesting to note that the low frequencies impedance values, which are a
rough indication of the protective properties of the coating [148], are in general
high (between 10 and 30 MΩ cm2). Therefore, these data are a first indication of
interesting barrier properties. Moreover, the general trend shows an increase of
the total impedance with the immersion time, at least for the first 240 hours of
testing. Considering Figure 3.11, a similar but even more evident trend is shown
by the sample PUD-B.
10-3 10-2 10-1 100 101 102 103 104 105 106104
105
106
107
108 a 24 h 48 h 144 h 288 h 480 h
|Z| I
mpe
danc
e [Ω∗c
m2 ]
Frequency [Hz]
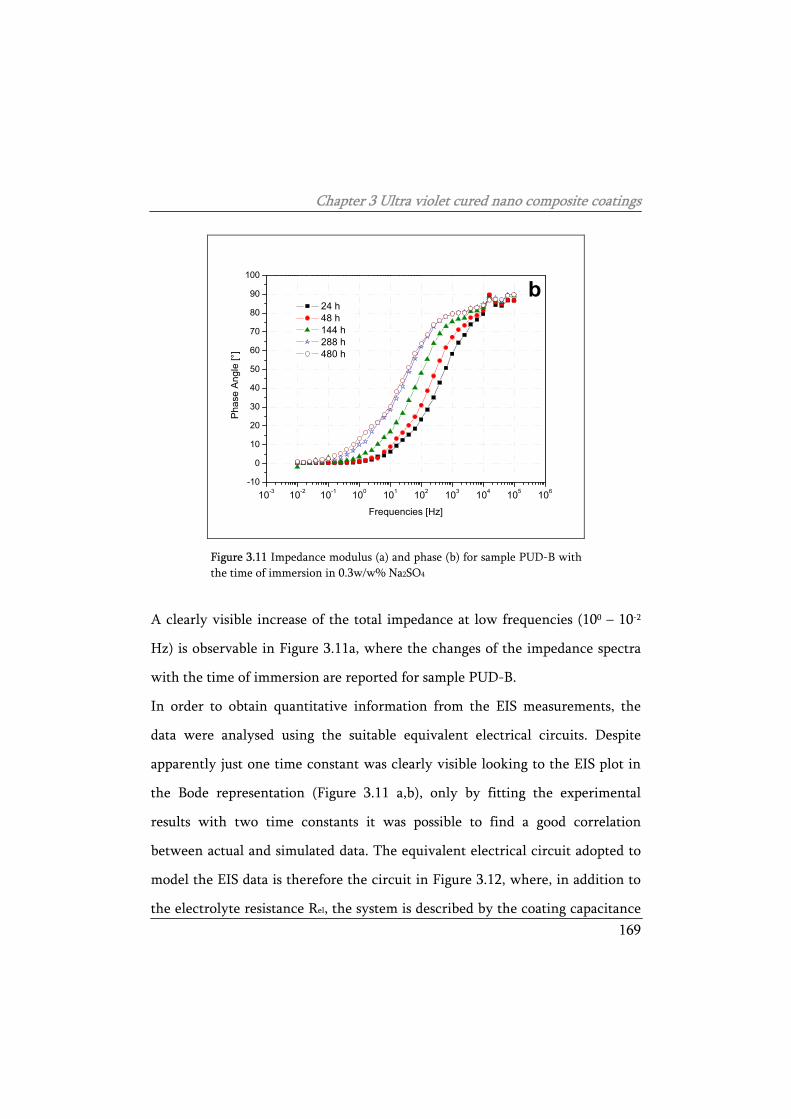
Chapter 3 Ultra violet cured nano composite coatings
169
10-3 10-2 10-1 100 101 102 103 104 105 106-10
0
10
20
30
40
50
60
70
80
90
100
b 24 h 48 h 144 h 288 h 480 h
Phas
e An
gle
[°]
Frequencies [Hz]
Figure 3.11 Impedance modulus (a) and phase (b) for sample PUD-B with the time of immersion in 0.3w/w% Na2SO4
A clearly visible increase of the total impedance at low frequencies (100 – 10-2
Hz) is observable in Figure 3.11a, where the changes of the impedance spectra
with the time of immersion are reported for sample PUD-B.
In order to obtain quantitative information from the EIS measurements, the
data were analysed using the suitable equivalent electrical circuits. Despite
apparently just one time constant was clearly visible looking to the EIS plot in
the Bode representation (Figure 3.11 a,b), only by fitting the experimental
results with two time constants it was possible to find a good correlation
between actual and simulated data. The equivalent electrical circuit adopted to
model the EIS data is therefore the circuit in Figure 3.12, where, in addition to
the electrolyte resistance Rel, the system is described by the coating capacitance
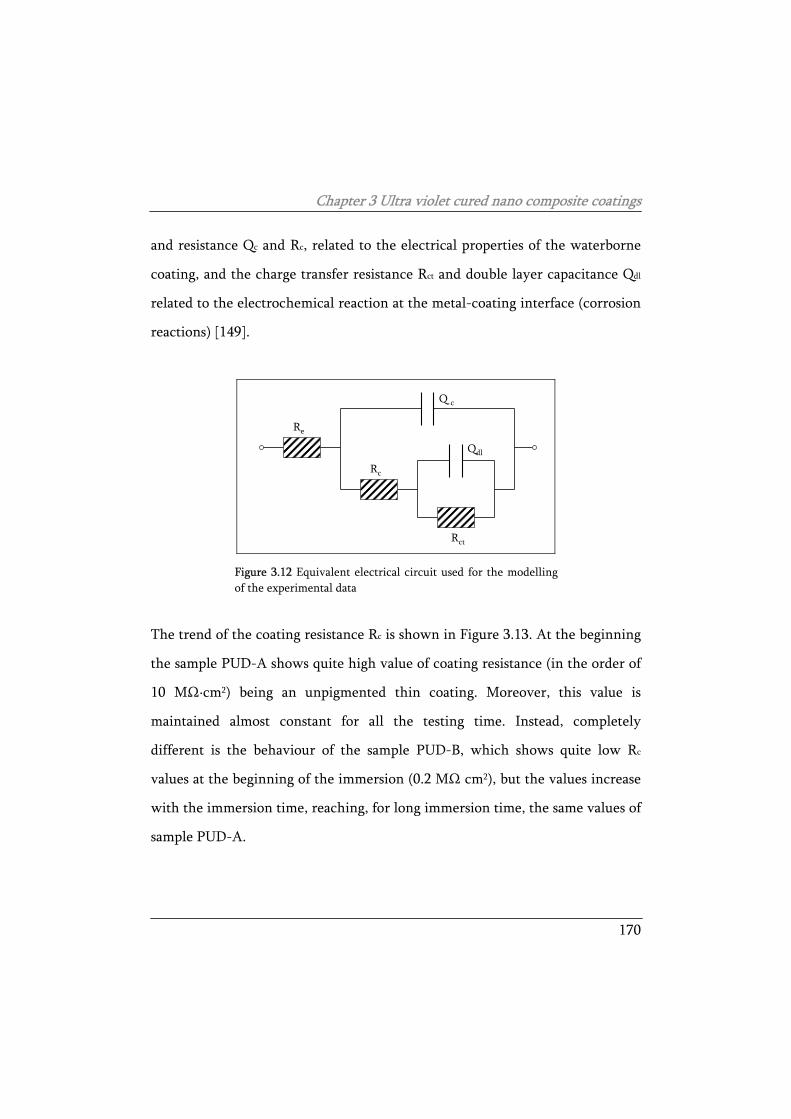
Chapter 3 Ultra violet cured nano composite coatings
170
and resistance Qc and Rc, related to the electrical properties of the waterborne
coating, and the charge transfer resistance Rct and double layer capacitance Qdl
related to the electrochemical reaction at the metal-coating interface (corrosion
reactions) [149].
Rc
Qdl
Rct
Q c
Re
a
Figure 3.12 Equivalent electrical circuit used for the modelling of the experimental data
The trend of the coating resistance Rc is shown in Figure 3.13. At the beginning
the sample PUD-A shows quite high value of coating resistance (in the order of
10 MΩ·cm2) being an unpigmented thin coating. Moreover, this value is
maintained almost constant for all the testing time. Instead, completely
different is the behaviour of the sample PUD-B, which shows quite low Rc
values at the beginning of the immersion (0.2 MΩ cm2), but the values increase
with the immersion time, reaching, for long immersion time, the same values of
sample PUD-A.
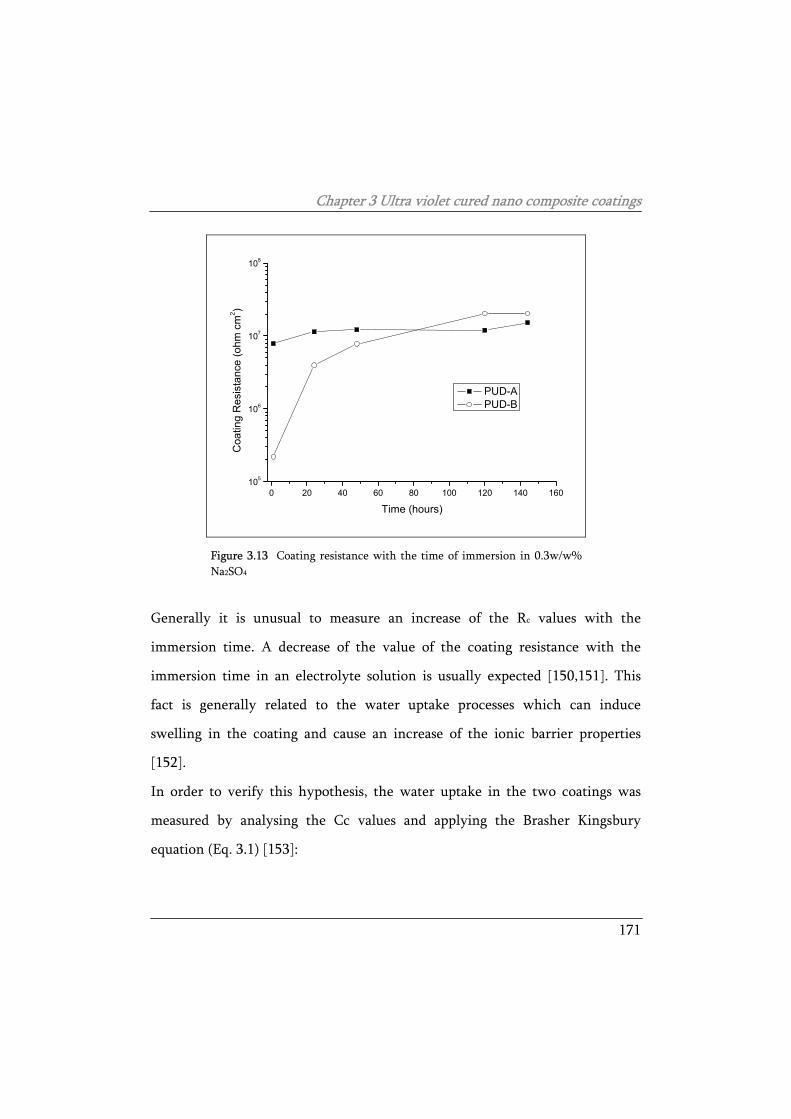
Chapter 3 Ultra violet cured nano composite coatings
171
0 20 40 60 80 100 120 140 160105
106
107
108
Coa
ting
Res
ista
nce
(ohm
cm
2 )
Time (hours)
PUD-A PUD-B
Figure 3.13 Coating resistance with the time of immersion in 0.3w/w% Na2SO4
Generally it is unusual to measure an increase of the Rc values with the
immersion time. A decrease of the value of the coating resistance with the
immersion time in an electrolyte solution is usually expected [150,151]. This
fact is generally related to the water uptake processes which can induce
swelling in the coating and cause an increase of the ionic barrier properties
[152].
In order to verify this hypothesis, the water uptake in the two coatings was
measured by analysing the Cc values and applying the Brasher Kingsbury
equation (Eq. 3.1) [153]:
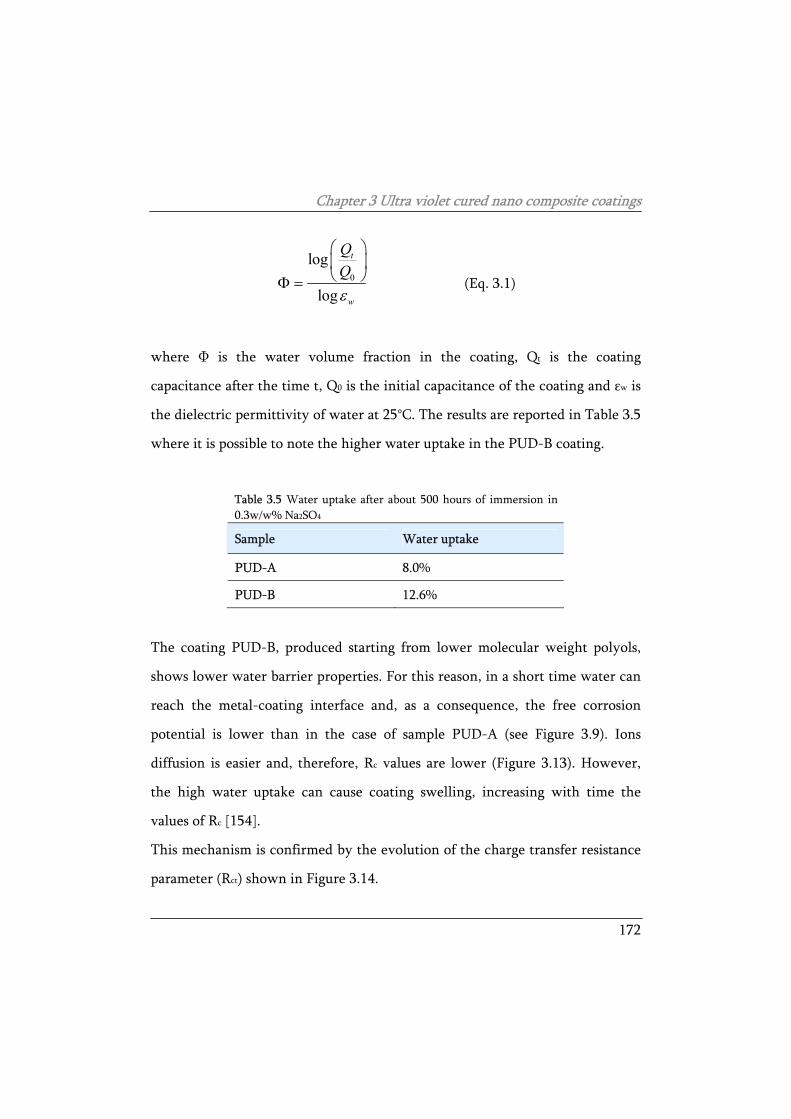
Chapter 3 Ultra violet cured nano composite coatings
172
0
log
log
t
w
QQε
Φ = (Eq. 3.1)
where Φ is the water volume fraction in the coating, Qt is the coating
capacitance after the time t, Q0 is the initial capacitance of the coating and εw is
the dielectric permittivity of water at 25°C. The results are reported in Table 3.5
where it is possible to note the higher water uptake in the PUD-B coating.
Table 3.5 Water uptake after about 500 hours of immersion in 0.3w/w% Na2SO4
Sample Water uptake
PUD-A 8.0%
PUD-B 12.6%
The coating PUD-B, produced starting from lower molecular weight polyols,
shows lower water barrier properties. For this reason, in a short time water can
reach the metal-coating interface and, as a consequence, the free corrosion
potential is lower than in the case of sample PUD-A (see Figure 3.9). Ions
diffusion is easier and, therefore, Rc values are lower (Figure 3.13). However,
the high water uptake can cause coating swelling, increasing with time the
values of Rc [154].
This mechanism is confirmed by the evolution of the charge transfer resistance
parameter (Rct) shown in Figure 3.14.
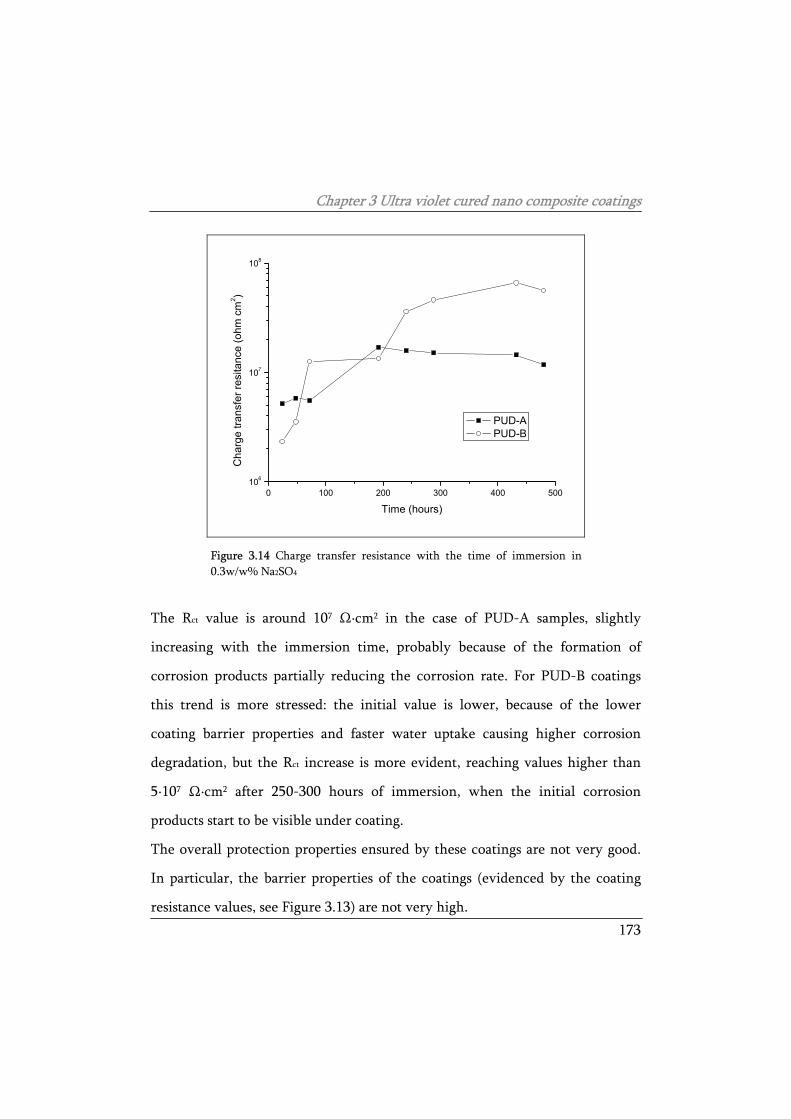
Chapter 3 Ultra violet cured nano composite coatings
173
0 100 200 300 400 500106
107
108
Cha
rge
trans
fer r
esita
nce
(ohm
cm
2 )
Time (hours)
PUD-A PUD-B
Figure 3.14 Charge transfer resistance with the time of immersion in 0.3w/w% Na2SO4
The Rct value is around 107 Ω·cm2 in the case of PUD-A samples, slightly
increasing with the immersion time, probably because of the formation of
corrosion products partially reducing the corrosion rate. For PUD-B coatings
this trend is more stressed: the initial value is lower, because of the lower
coating barrier properties and faster water uptake causing higher corrosion
degradation, but the Rct increase is more evident, reaching values higher than
5·107 Ω·cm2 after 250-300 hours of immersion, when the initial corrosion
products start to be visible under coating.
The overall protection properties ensured by these coatings are not very good.
In particular, the barrier properties of the coatings (evidenced by the coating
resistance values, see Figure 3.13) are not very high.
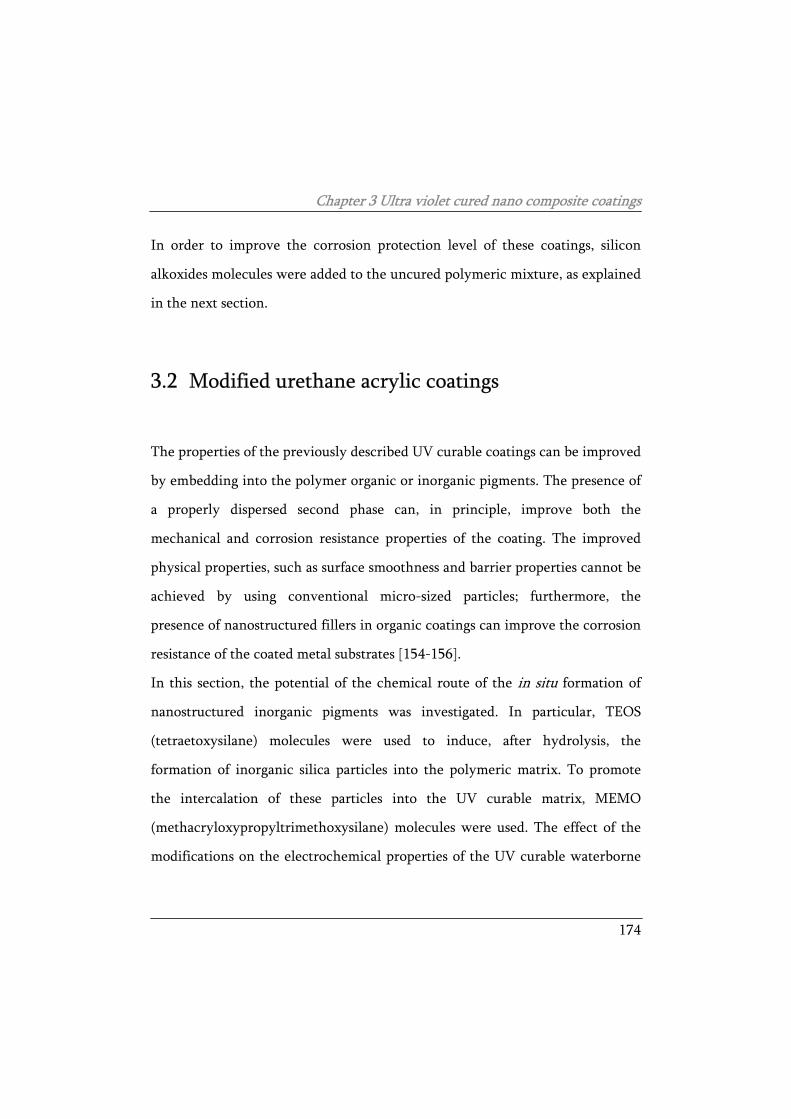
Chapter 3 Ultra violet cured nano composite coatings
174
In order to improve the corrosion protection level of these coatings, silicon
alkoxides molecules were added to the uncured polymeric mixture, as explained
in the next section.
3.2 Modified urethane acrylic coatings
The properties of the previously described UV curable coatings can be improved
by embedding into the polymer organic or inorganic pigments. The presence of
a properly dispersed second phase can, in principle, improve both the
mechanical and corrosion resistance properties of the coating. The improved
physical properties, such as surface smoothness and barrier properties cannot be
achieved by using conventional micro-sized particles; furthermore, the
presence of nanostructured fillers in organic coatings can improve the corrosion
resistance of the coated metal substrates [154-156].
In this section, the potential of the chemical route of the in situ formation of
nanostructured inorganic pigments was investigated. In particular, TEOS
(tetraetoxysilane) molecules were used to induce, after hydrolysis, the
formation of inorganic silica particles into the polymeric matrix. To promote
the intercalation of these particles into the UV curable matrix, MEMO
(methacryloxypropyltrimethoxysilane) molecules were used. The effect of the
modifications on the electrochemical properties of the UV curable waterborne
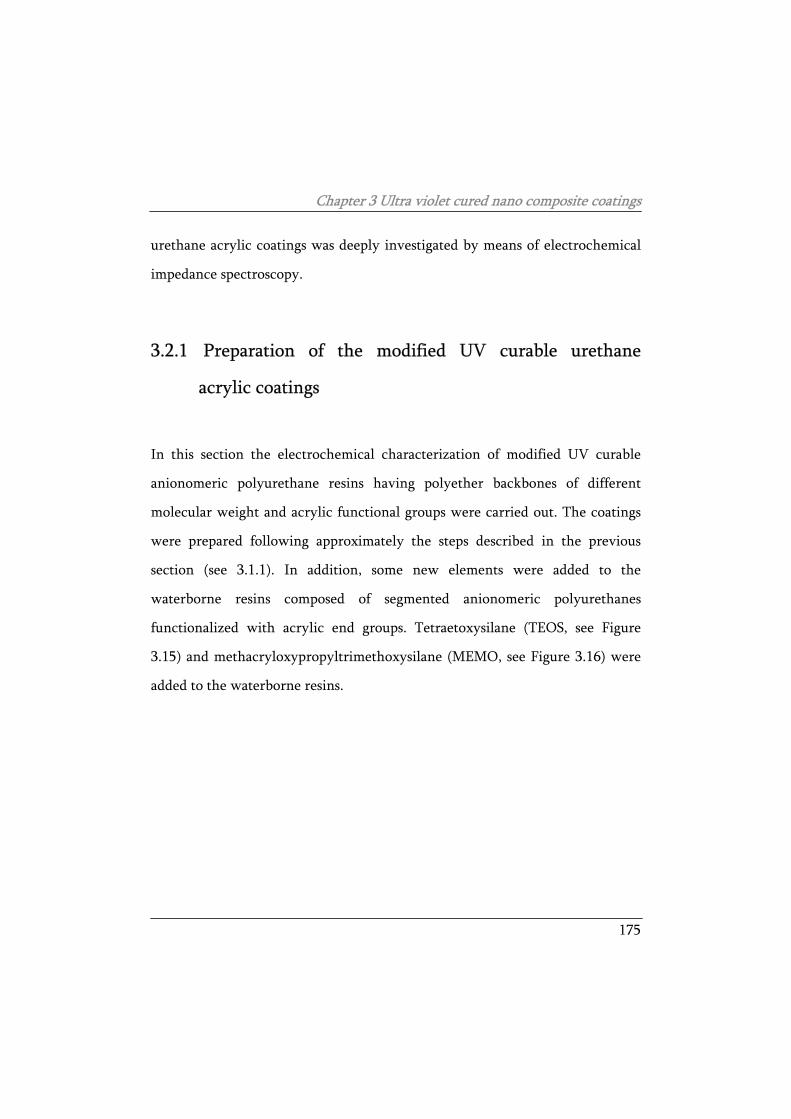
Chapter 3 Ultra violet cured nano composite coatings
175
urethane acrylic coatings was deeply investigated by means of electrochemical
impedance spectroscopy.
3.2.1 Preparation of the modified UV curable urethane
acrylic coatings
In this section the electrochemical characterization of modified UV curable
anionomeric polyurethane resins having polyether backbones of different
molecular weight and acrylic functional groups were carried out. The coatings
were prepared following approximately the steps described in the previous
section (see 3.1.1). In addition, some new elements were added to the
waterborne resins composed of segmented anionomeric polyurethanes
functionalized with acrylic end groups. Tetraetoxysilane (TEOS, see Figure
3.15) and methacryloxypropyltrimethoxysilane (MEMO, see Figure 3.16) were
added to the waterborne resins.
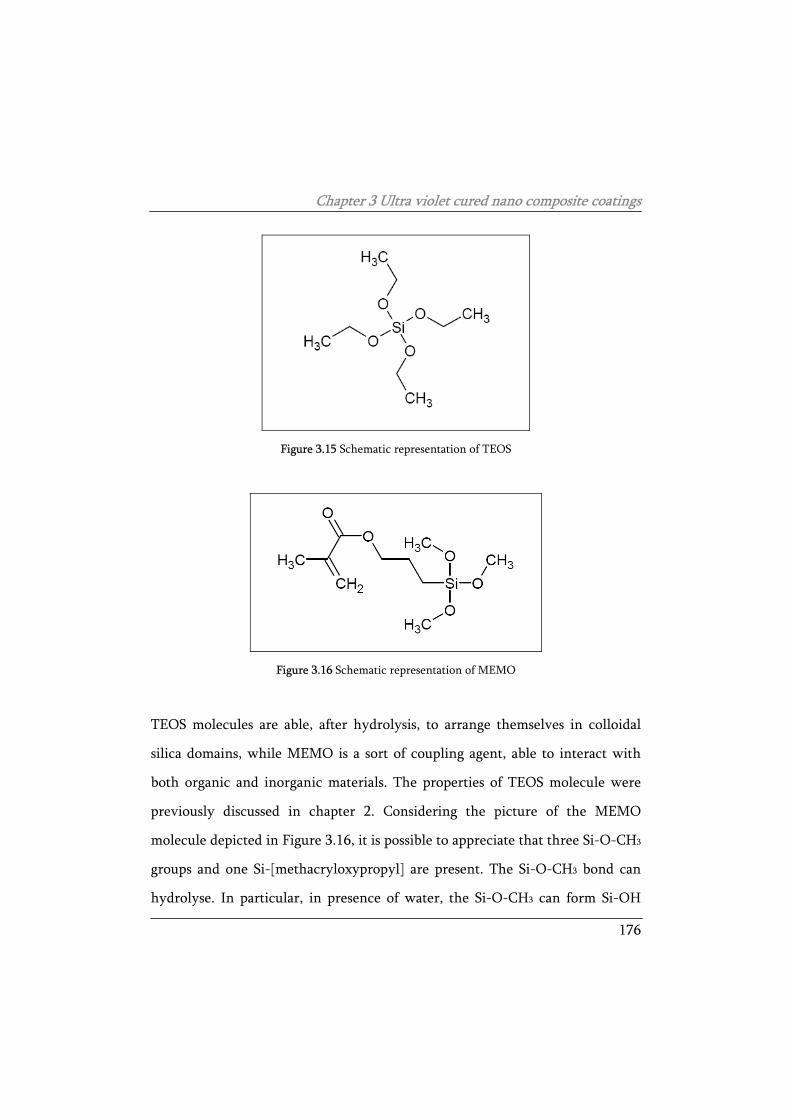
Chapter 3 Ultra violet cured nano composite coatings
176
Figure 3.15 Schematic representation of TEOS
Figure 3.16 Schematic representation of MEMO
TEOS molecules are able, after hydrolysis, to arrange themselves in colloidal
silica domains, while MEMO is a sort of coupling agent, able to interact with
both organic and inorganic materials. The properties of TEOS molecule were
previously discussed in chapter 2. Considering the picture of the MEMO
molecule depicted in Figure 3.16, it is possible to appreciate that three Si-O-CH3
groups and one Si-[methacryloxypropyl] are present. The Si-O-CH3 bond can
hydrolyse. In particular, in presence of water, the Si-O-CH3 can form Si-OH
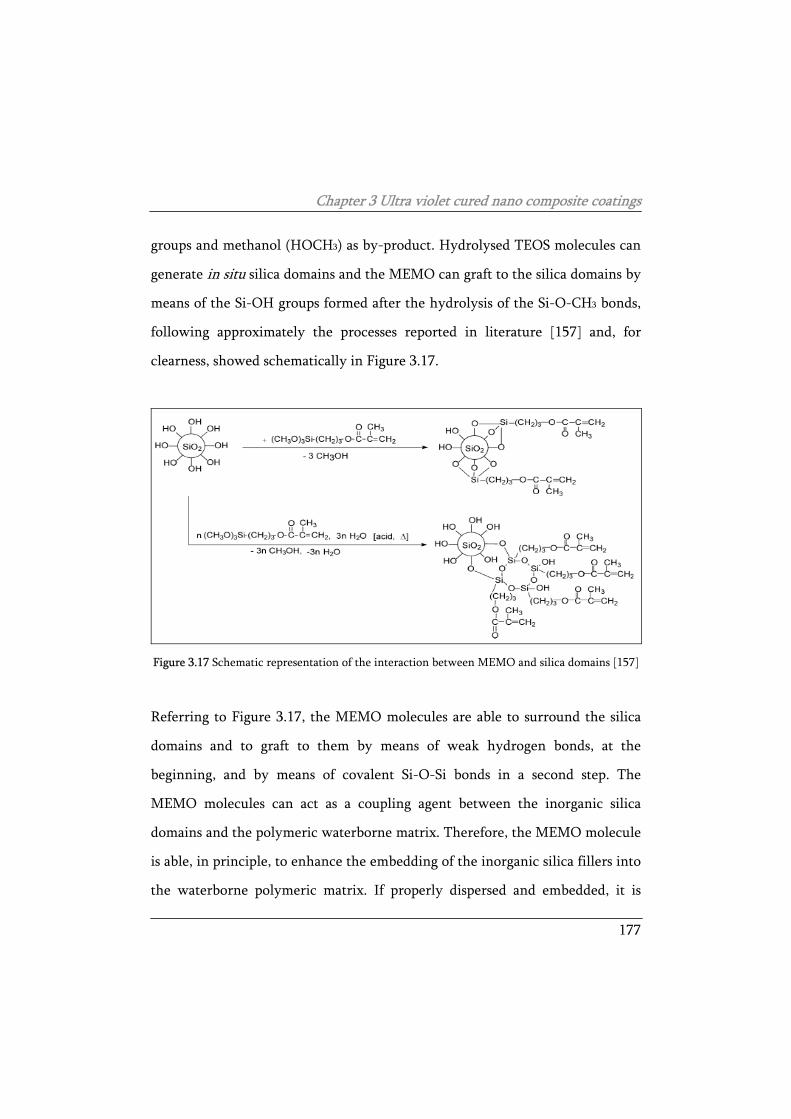
Chapter 3 Ultra violet cured nano composite coatings
177
groups and methanol (HOCH3) as by-product. Hydrolysed TEOS molecules can
generate in situ silica domains and the MEMO can graft to the silica domains by
means of the Si-OH groups formed after the hydrolysis of the Si-O-CH3 bonds,
following approximately the processes reported in literature [157] and, for
clearness, showed schematically in Figure 3.17.
Figure 3.17 Schematic representation of the interaction between MEMO and silica domains [157]
Referring to Figure 3.17, the MEMO molecules are able to surround the silica
domains and to graft to them by means of weak hydrogen bonds, at the
beginning, and by means of covalent Si-O-Si bonds in a second step. The
MEMO molecules can act as a coupling agent between the inorganic silica
domains and the polymeric waterborne matrix. Therefore, the MEMO molecule
is able, in principle, to enhance the embedding of the inorganic silica fillers into
the waterborne polymeric matrix. If properly dispersed and embedded, it is
Chapter 3 Ultra violet cured nano composite coatings
178
expected that the presence of an inorganic pigment into the matrix (formed in
situ after the hydrolysis and condensation reactions) can improve the barrier
properties of the UV cured coating.
In this section, the effectiveness of the modification of the waterborne coatings
by adding TEOS and MEMO was investigated. In particular, 20 w/w% of TEOS
and 5w/w% of MEMO were added to the original waterborne polymeric matrix.
Also in this case, two different lengths, 1000 or 2000, of the polytetramethylene
glycol were tested in order to investigate the effect of this parameter on the
properties of the different coatings. The drying and the UV curing of the
coating was carried out following approximately the previously discussed (see
previous section) procedure. Also in this case, acetone degreased mild steel
(supplied by Q-Lab) was used as substrate, without any surface conversion
treatment.
3.2.2 Characterization of the modified UV curable urethane
acrylic coatings
The samples investigated in this section are summarized in Table 3.6, which
reports, for each sample, the different additives added to modify the waterborne
resin.
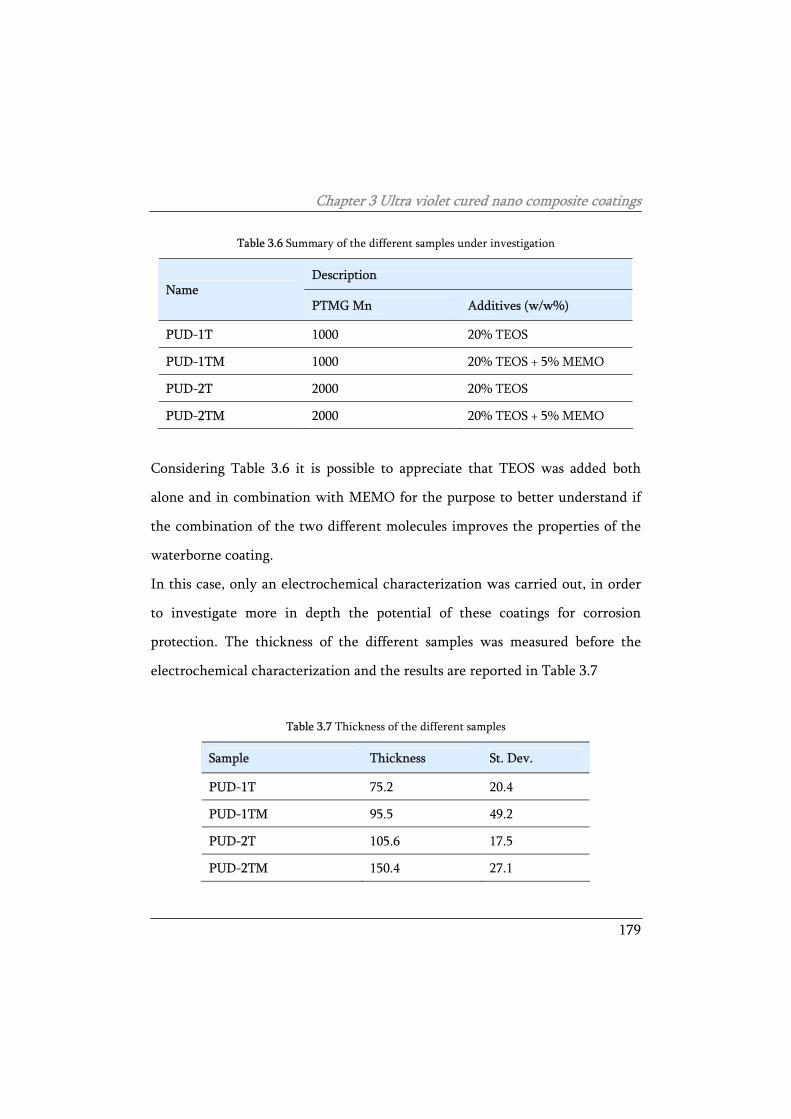
Chapter 3 Ultra violet cured nano composite coatings
179
Table 3.6 Summary of the different samples under investigation
Description Name
PTMG Mn Additives (w/w%)
PUD-1T 1000 20% TEOS
PUD-1TM 1000 20% TEOS + 5% MEMO
PUD-2T 2000 20% TEOS
PUD-2TM 2000 20% TEOS + 5% MEMO
Considering Table 3.6 it is possible to appreciate that TEOS was added both
alone and in combination with MEMO for the purpose to better understand if
the combination of the two different molecules improves the properties of the
waterborne coating.
In this case, only an electrochemical characterization was carried out, in order
to investigate more in depth the potential of these coatings for corrosion
protection. The thickness of the different samples was measured before the
electrochemical characterization and the results are reported in Table 3.7
Table 3.7 Thickness of the different samples
Sample Thickness St. Dev.
PUD-1T 75.2 20.4
PUD-1TM 95.5 49.2
PUD-2T 105.6 17.5
PUD-2TM 150.4 27.1
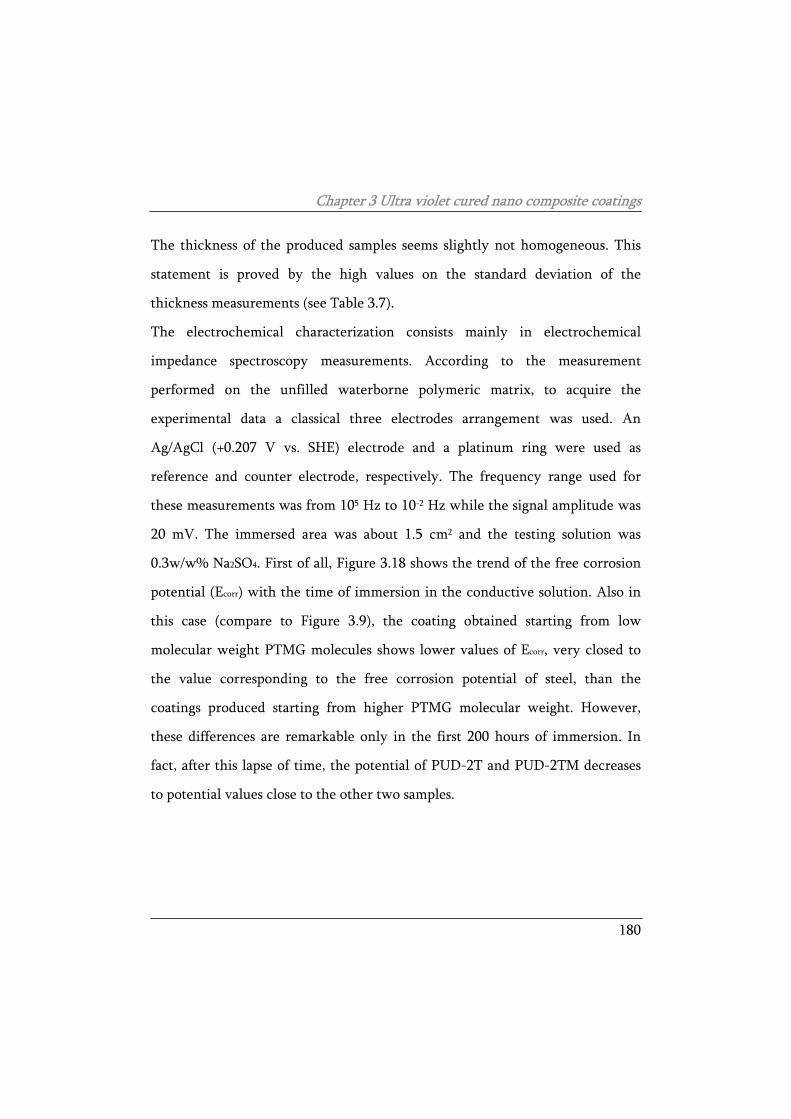
Chapter 3 Ultra violet cured nano composite coatings
180
The thickness of the produced samples seems slightly not homogeneous. This
statement is proved by the high values on the standard deviation of the
thickness measurements (see Table 3.7).
The electrochemical characterization consists mainly in electrochemical
impedance spectroscopy measurements. According to the measurement
performed on the unfilled waterborne polymeric matrix, to acquire the
experimental data a classical three electrodes arrangement was used. An
Ag/AgCl (+0.207 V vs. SHE) electrode and a platinum ring were used as
reference and counter electrode, respectively. The frequency range used for
these measurements was from 105 Hz to 10-2 Hz while the signal amplitude was
20 mV. The immersed area was about 1.5 cm2 and the testing solution was
0.3w/w% Na2SO4. First of all, Figure 3.18 shows the trend of the free corrosion
potential (Ecorr) with the time of immersion in the conductive solution. Also in
this case (compare to Figure 3.9), the coating obtained starting from low
molecular weight PTMG molecules shows lower values of Ecorr, very closed to
the value corresponding to the free corrosion potential of steel, than the
coatings produced starting from higher PTMG molecular weight. However,
these differences are remarkable only in the first 200 hours of immersion. In
fact, after this lapse of time, the potential of PUD-2T and PUD-2TM decreases
to potential values close to the other two samples.
Chapter 3 Ultra violet cured nano composite coatings
181
0 50 100 150 200 250 300 350 400-1.0
-0.8
-0.6
-0.4
-0.2
0.0
0.2
0.4
0.6
0.8
Pote
ntia
l [V,
vs
Ag/A
gCl]
Time [Hours]
PUD-1T PUD-1TM PUD-2T PUD-2TM
Figure 3.18 Potential vs. time of immersion in 0.3w/w% Na2SO4
The EIS spectra were acquired during the immersion of the samples in the
conductive solution, in order to monitor the evolution of the electrochemical
properties of the coatings with time. As specified in the previous section, at this
level of the study the attention was mainly focused on the properties of the
waterborne coating itself, not on the other aspects (such as adhesion which,
actually has a dramatic effect of the corrosion protection level ensured by an
organic coating) which affect the corrosion protection performances of the
protection systems.
The evolution of the electrochemical impedance spectra of the different samples
are reported in Figure 3.19, after 1 hour of immersion in the electrolyte, and in
Figure 3.20, at the end of the test, after about 360 hours of immersion.
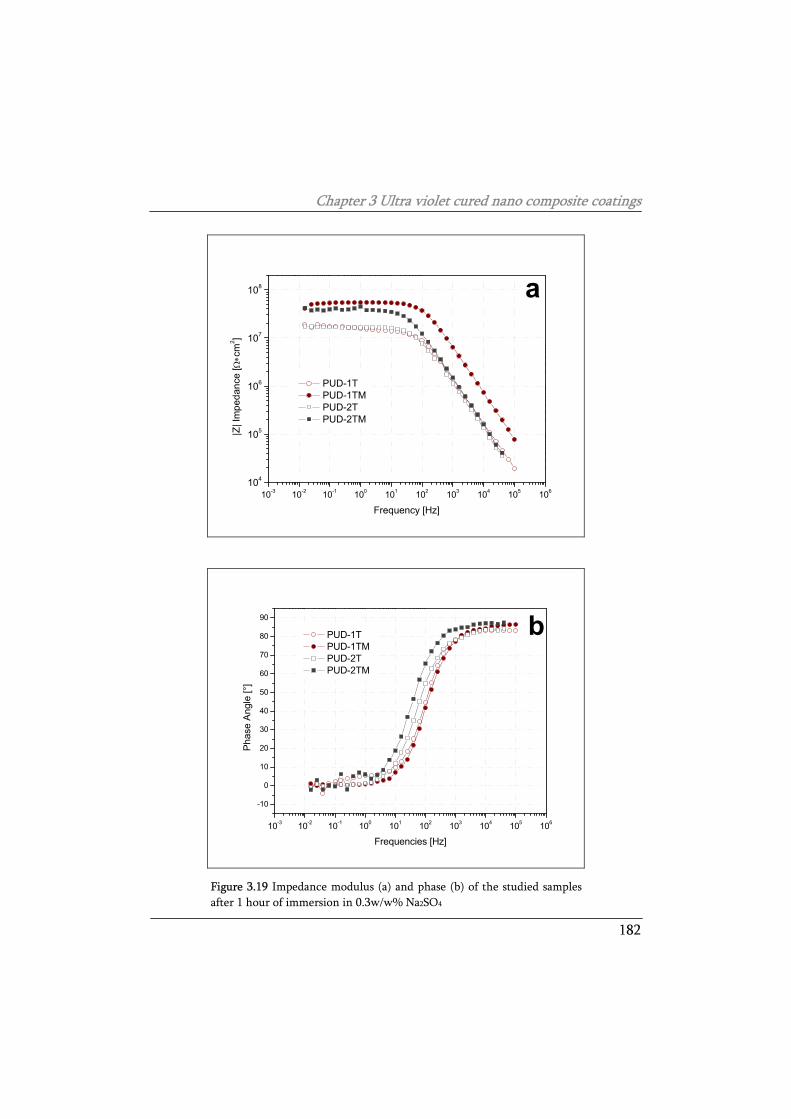
Chapter 3 Ultra violet cured nano composite coatings
182
10-3 10-2 10-1 100 101 102 103 104 105 106104
105
106
107
108
PUD-1T PUD-1TM PUD-2T PUD-2TM
|Z| I
mpe
danc
e [Ω∗c
m2 ]
Frequency [Hz]
a
10-3 10-2 10-1 100 101 102 103 104 105 106
-10
0
10
20
30
40
50
60
70
80
90 b PUD-1T PUD-1TM PUD-2T PUD-2TM
Pha
se A
ngle
[°]
Frequencies [Hz]
Figure 3.19 Impedance modulus (a) and phase (b) of the studied samples after 1 hour of immersion in 0.3w/w% Na2SO4

Chapter 3 Ultra violet cured nano composite coatings
183
After 1 hour of immersion (see Figure 3.19), the EIS spectra of the different
samples are quite similar. However, the samples containing only TEOS show
impedance values at low frequencies around 107 Ω cm2, while the coatings
containing the combination of TEOS and MEMO show quite higher values of
the impedance, in the order of 5·107 Ω cm2. At this level, it seems that the
presence of the MEMO enhances the performances of the waterborne coatings.
Considering the shape of the Bode modulus spectra, reported in Figure 3.19b,
there are not noticeable differences, except for a sort of second time constant
for sample PUD-1T, appreciable in the low frequencies domain (100 – 10-1 Hz).
10-3 10-2 10-1 100 101 102 103 104 105 106
104
105
106
107
108 a
PUD-1T PUD-1TM PUD-2T PUD-2TM
|Z| I
mpe
danc
e [Ω∗c
m2 ]
Frequency [Hz]
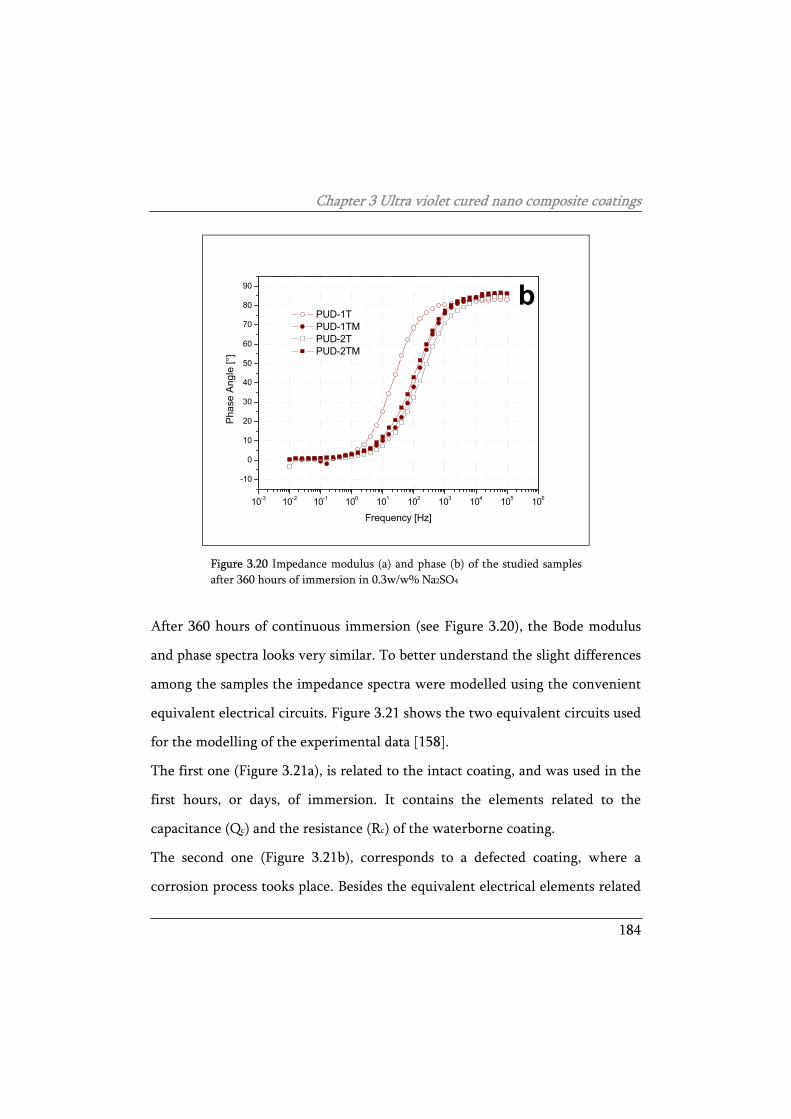
Chapter 3 Ultra violet cured nano composite coatings
184
10-3 10-2 10-1 100 101 102 103 104 105 106
-10
0
10
20
30
40
50
60
70
80
90 b PUD-1T PUD-1TM PUD-2T PUD-2TM
Pha
se A
ngle
[°]
Frequency [Hz]
Figure 3.20 Impedance modulus (a) and phase (b) of the studied samples after 360 hours of immersion in 0.3w/w% Na2SO4
After 360 hours of continuous immersion (see Figure 3.20), the Bode modulus
and phase spectra looks very similar. To better understand the slight differences
among the samples the impedance spectra were modelled using the convenient
equivalent electrical circuits. Figure 3.21 shows the two equivalent circuits used
for the modelling of the experimental data [158].
The first one (Figure 3.21a), is related to the intact coating, and was used in the
first hours, or days, of immersion. It contains the elements related to the
capacitance (Qc) and the resistance (Rc) of the waterborne coating.
The second one (Figure 3.21b), corresponds to a defected coating, where a
corrosion process tooks place. Besides the equivalent electrical elements related
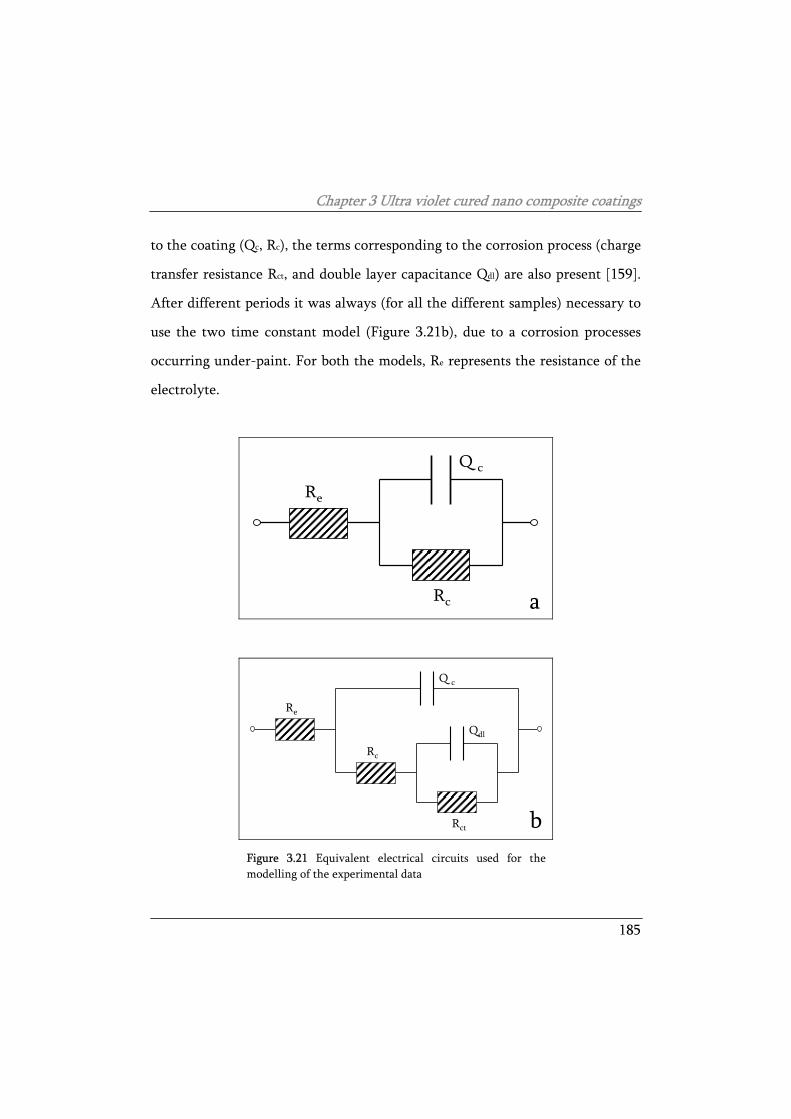
Chapter 3 Ultra violet cured nano composite coatings
185
to the coating (Qc, Rc), the terms corresponding to the corrosion process (charge
transfer resistance Rct, and double layer capacitance Qdl) are also present [159].
After different periods it was always (for all the different samples) necessary to
use the two time constant model (Figure 3.21b), due to a corrosion processes
occurring under-paint. For both the models, Re represents the resistance of the
electrolyte.
Re
Q c
Rc
Rc
Qdl
Rct
Q c
Re
Figure 3.21 Equivalent electrical circuits used for the modelling of the experimental data
a
b
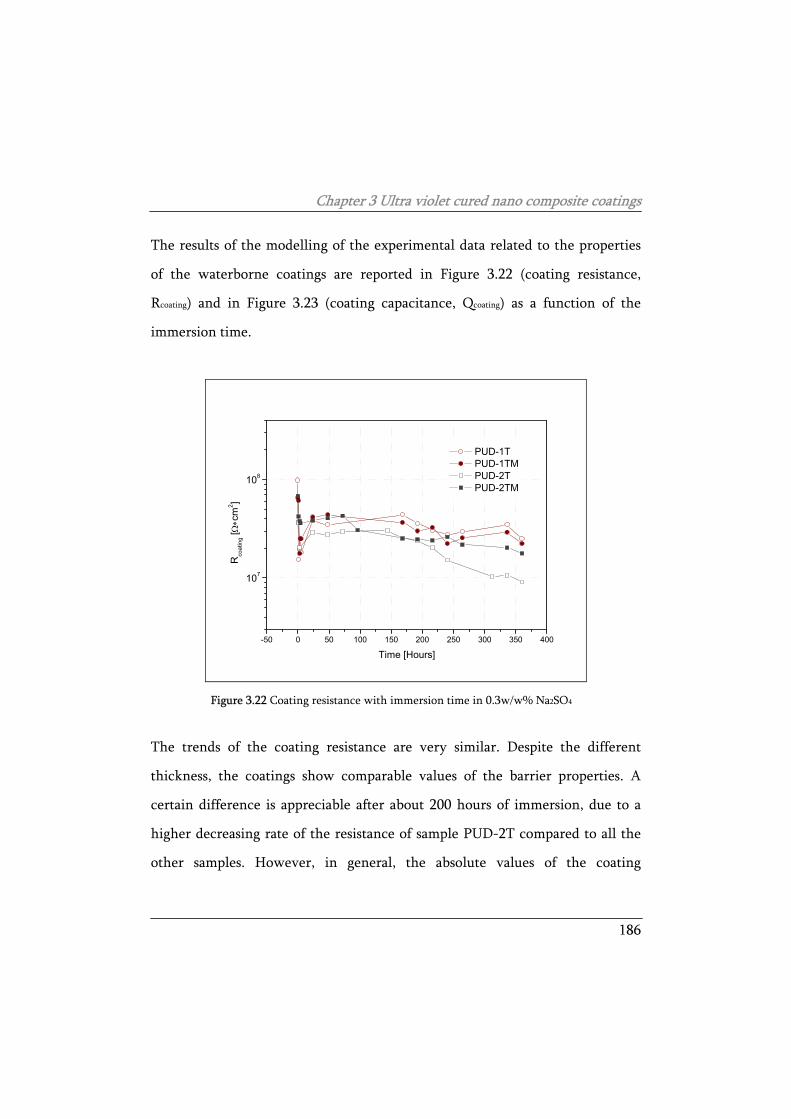
Chapter 3 Ultra violet cured nano composite coatings
186
The results of the modelling of the experimental data related to the properties
of the waterborne coatings are reported in Figure 3.22 (coating resistance,
Rcoating) and in Figure 3.23 (coating capacitance, Qcoating) as a function of the
immersion time.
-50 0 50 100 150 200 250 300 350 400
107
108
Rco
atin
g [Ω∗c
m2 ]
Time [Hours]
PUD-1T PUD-1TM PUD-2T PUD-2TM
Figure 3.22 Coating resistance with immersion time in 0.3w/w% Na2SO4
The trends of the coating resistance are very similar. Despite the different
thickness, the coatings show comparable values of the barrier properties. A
certain difference is appreciable after about 200 hours of immersion, due to a
higher decreasing rate of the resistance of sample PUD-2T compared to all the
other samples. However, in general, the absolute values of the coating
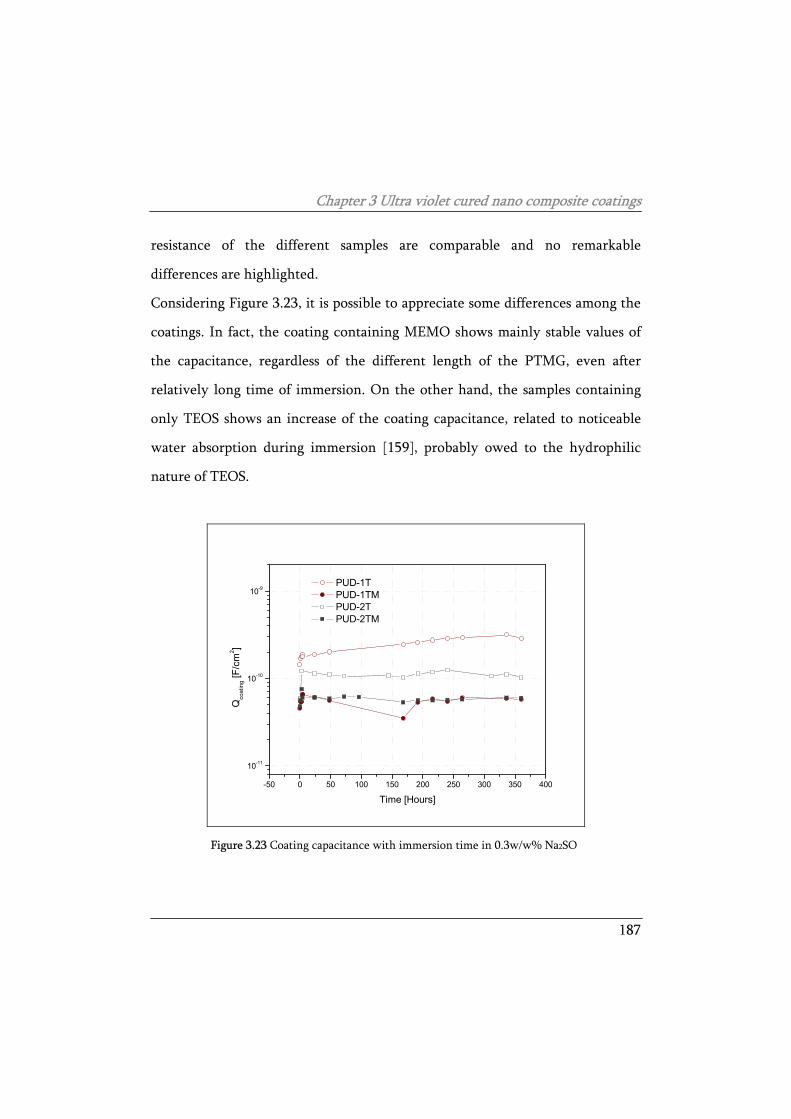
Chapter 3 Ultra violet cured nano composite coatings
187
resistance of the different samples are comparable and no remarkable
differences are highlighted.
Considering Figure 3.23, it is possible to appreciate some differences among the
coatings. In fact, the coating containing MEMO shows mainly stable values of
the capacitance, regardless of the different length of the PTMG, even after
relatively long time of immersion. On the other hand, the samples containing
only TEOS shows an increase of the coating capacitance, related to noticeable
water absorption during immersion [159], probably owed to the hydrophilic
nature of TEOS.
-50 0 50 100 150 200 250 300 350 400
10-11
10-10
10-9
Qco
atin
g [F/
cm2 ]
Time [Hours]
PUD-1T PUD-1TM PUD-2T PUD-2TM
Figure 3.23 Coating capacitance with immersion time in 0.3w/w% Na2SO
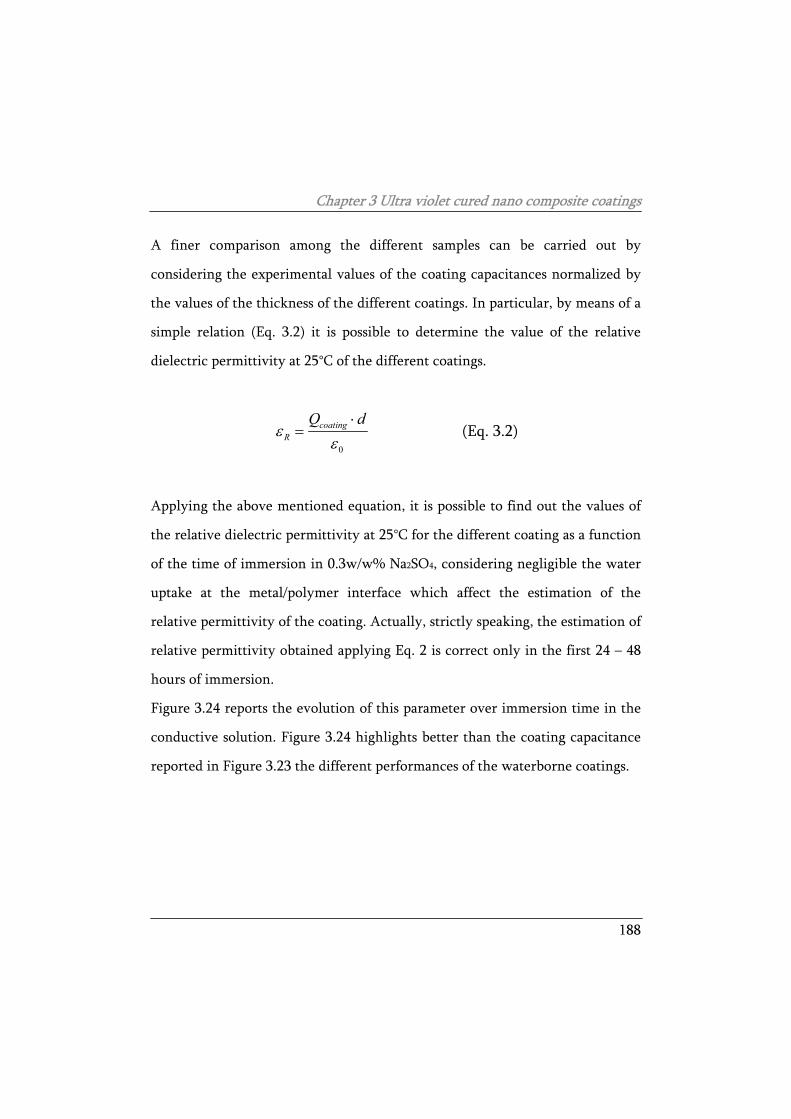
Chapter 3 Ultra violet cured nano composite coatings
188
A finer comparison among the different samples can be carried out by
considering the experimental values of the coating capacitances normalized by
the values of the thickness of the different coatings. In particular, by means of a
simple relation (Eq. 3.2) it is possible to determine the value of the relative
dielectric permittivity at 25°C of the different coatings.
0
coatingR
Q dε
ε⋅
= (Eq. 3.2)
Applying the above mentioned equation, it is possible to find out the values of
the relative dielectric permittivity at 25°C for the different coating as a function
of the time of immersion in 0.3w/w% Na2SO4, considering negligible the water
uptake at the metal/polymer interface which affect the estimation of the
relative permittivity of the coating. Actually, strictly speaking, the estimation of
relative permittivity obtained applying Eq. 2 is correct only in the first 24 – 48
hours of immersion.
Figure 3.24 reports the evolution of this parameter over immersion time in the
conductive solution. Figure 3.24 highlights better than the coating capacitance
reported in Figure 3.23 the different performances of the waterborne coatings.
Chapter 3 Ultra violet cured nano composite coatings
189
-50 0 50 100 150 200 250 300 350 4000
5
10
15
20
25
30
Rel
ativ
e pe
rmitt
ivity
@ 2
5°C
Time [Hours]
PUD-1T PUD-1TM PUD-2T PUD-2TM
Figure 3.24 Relative dielectric permittivity at 25°C with the time of immersion in 0.3w/w% Na2SO4
Sample PUD-1TM is characterized by the lowest values of the relative
permittivity (5-6), very close to the values of a dry polymer (3-4). In addition,
these values are really stable.
Sample PUD-2TM shows higher values of εr, around 10, but, also in this case, a
certain stability of the relative permittivity value is appreciable, except for the
first hours of immersion, when an increase of εr is observable (starting from
values around 7). Sample PUD-2T shows εr values around 13. Starting from the
value of 7, it gets quickly higher values of the permittivity, around 13-14.
However, after the very fast initial increase, the values of the relative
permittivity stabilize. The values of εr for sample PUD-1T increases with an
approximately constant rate during all the immersion time. In particular, it
Chapter 3 Ultra violet cured nano composite coatings
190
starts from a value around 12 and get, at the end of the immersion test, a value
higher than 25. Remark that the estimation of εr carried out by applying Eq. 2 is
correct at all only in the firs ours of immersion (24-48). After this period, the
effect of the water accumulation at the metal/polymer interface affects the
calculated values of εr. However, this fact does not change the meaning of the
discussion about the different properties of the coatings. These experimental
results evidences that the presence of MEMO seems to have a positive effect on
the properties of the coatings. In particular, this effect seems to be more
considerable in combination with a low molecular weight PTMG in the starting
polymer. It is likely that the presence of TEOS without MEMO leads to a high
hydrophilic behaviour of the coating which draws in a huge amount of water
molecules.
The corrosion protection properties of the coatings were investigated more in
depth considering the equivalent electrical parameters related to the
electrochemical processes occurring at the metal/polymer interface. In fact,
when to water reaches the metal surface, corrosion reactions takes place. Figure
3.25 and Figure 3.26 show the evolution of the charge transfer resistance, Rct,
and the double layer capacitance, Qdl, respectively.
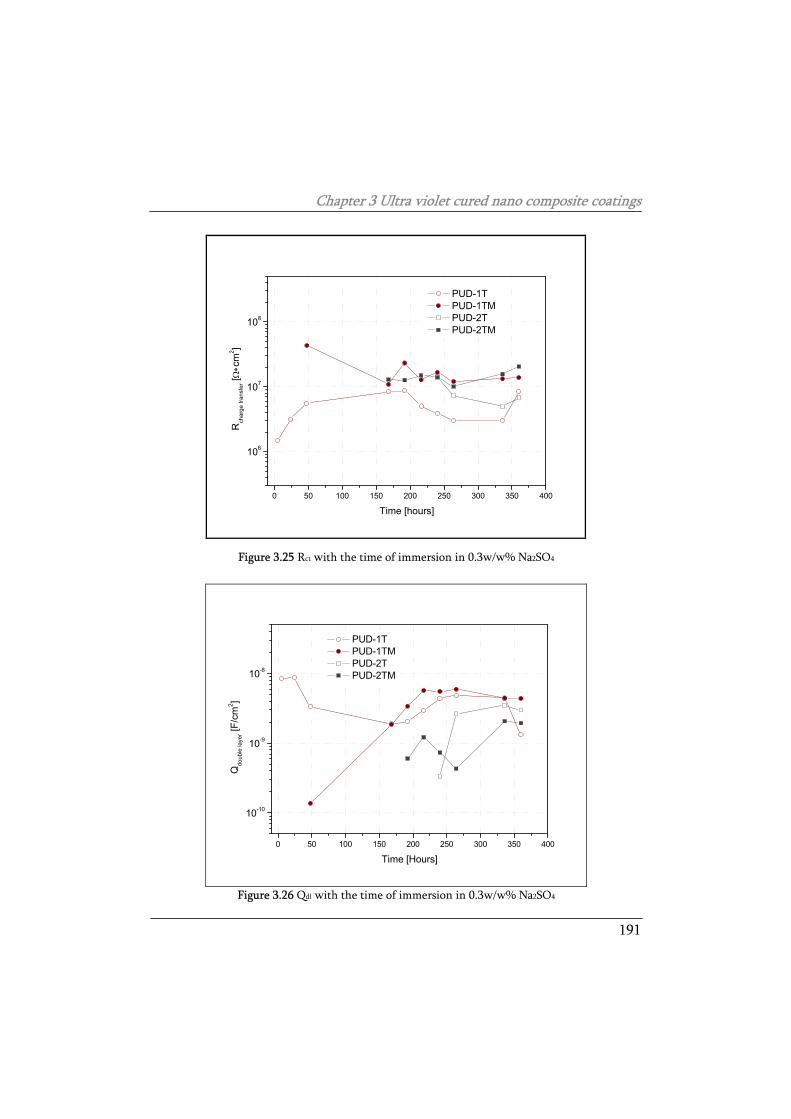
Chapter 3 Ultra violet cured nano composite coatings
191
0 50 100 150 200 250 300 350 400
106
107
108
Rch
arge
tran
sfer [Ω
∗cm
2 ]
Time [hours]
PUD-1T PUD-1TM PUD-2T PUD-2TM
Figure 3.25 Rct with the time of immersion in 0.3w/w% Na2SO4
0 50 100 150 200 250 300 350 400
10-10
10-9
10-8
Qdo
uble
laye
r [F/
cm2 ]
Time [Hours]
PUD-1T PUD-1TM PUD-2T PUD-2TM
Figure 3.26 Qdl with the time of immersion in 0.3w/w% Na2SO4
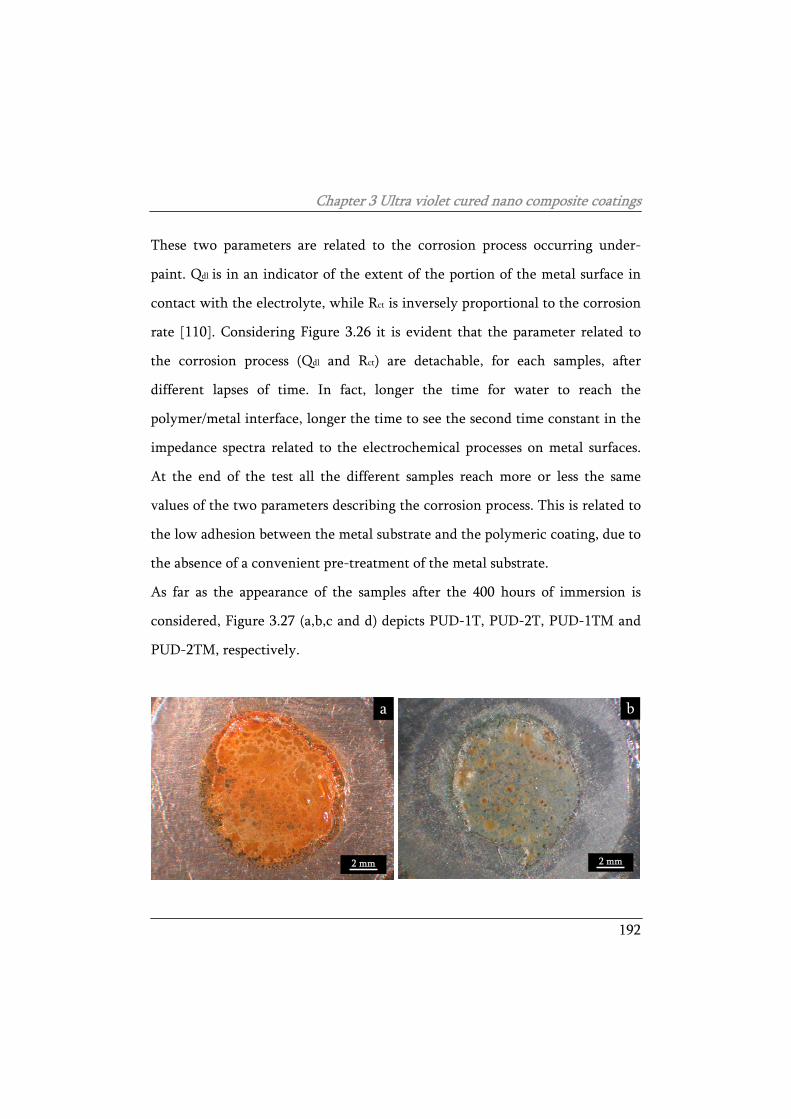
Chapter 3 Ultra violet cured nano composite coatings
192
These two parameters are related to the corrosion process occurring under-
paint. Qdl is in an indicator of the extent of the portion of the metal surface in
contact with the electrolyte, while Rct is inversely proportional to the corrosion
rate [110]. Considering Figure 3.26 it is evident that the parameter related to
the corrosion process (Qdl and Rct) are detachable, for each samples, after
different lapses of time. In fact, longer the time for water to reach the
polymer/metal interface, longer the time to see the second time constant in the
impedance spectra related to the electrochemical processes on metal surfaces.
At the end of the test all the different samples reach more or less the same
values of the two parameters describing the corrosion process. This is related to
the low adhesion between the metal substrate and the polymeric coating, due to
the absence of a convenient pre-treatment of the metal substrate.
As far as the appearance of the samples after the 400 hours of immersion is
considered, Figure 3.27 (a,b,c and d) depicts PUD-1T, PUD-2T, PUD-1TM and
PUD-2TM, respectively.
a
2 mm
b
2 mm
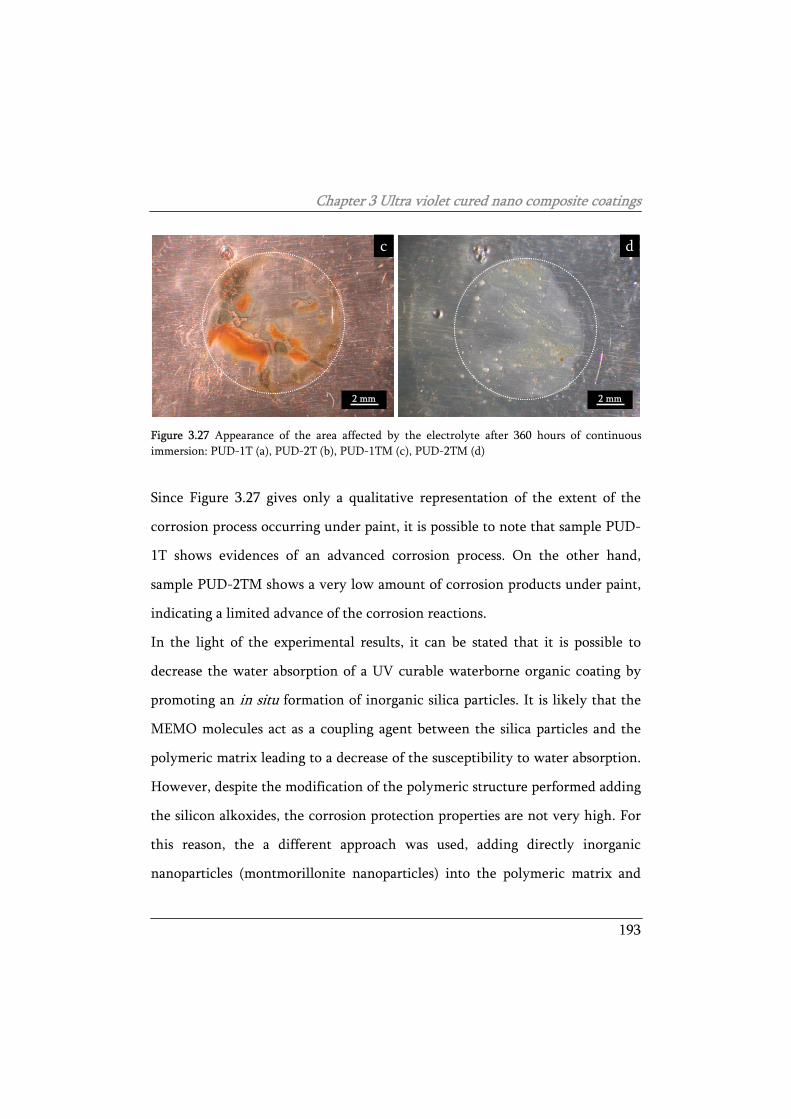
Chapter 3 Ultra violet cured nano composite coatings
193
c
2 mm
d
2 mm
Figure 3.27 Appearance of the area affected by the electrolyte after 360 hours of continuous immersion: PUD-1T (a), PUD-2T (b), PUD-1TM (c), PUD-2TM (d)
Since Figure 3.27 gives only a qualitative representation of the extent of the
corrosion process occurring under paint, it is possible to note that sample PUD-
1T shows evidences of an advanced corrosion process. On the other hand,
sample PUD-2TM shows a very low amount of corrosion products under paint,
indicating a limited advance of the corrosion reactions.
In the light of the experimental results, it can be stated that it is possible to
decrease the water absorption of a UV curable waterborne organic coating by
promoting an in situ formation of inorganic silica particles. It is likely that the
MEMO molecules act as a coupling agent between the silica particles and the
polymeric matrix leading to a decrease of the susceptibility to water absorption.
However, despite the modification of the polymeric structure performed adding
the silicon alkoxides, the corrosion protection properties are not very high. For
this reason, the a different approach was used, adding directly inorganic
nanoparticles (montmorillonite nanoparticles) into the polymeric matrix and
Chapter 3 Ultra violet cured nano composite coatings
194
using silicon alkoxides molecules as coupling agents to embed the particles into
the polymeric matrix.
3.3 UV-cured nanostructured epoxy coatings
containing modified montmorillonite
nanoparticles
In the light of the experimental results obtained in the previous section a
different approach was used to improve the corrosion protection properties of
the UV curable water-borne coatings. Silicon alkoxides were used to graft
montmorillonite nanoparticles to the polymeric matrix. For this purpose, the
γGPS was employed. This molecule (as described in the previous chapter)
contains an epoxy group bonded to the carbon backbone. For this reason, an
epoxy based UV curable waterborne polymer was used: the chemical affinity
between the γGPS molecule and the polymeric matrix can lead to the formation
of strong covalent bonds
Polymer nanocoatings consist of nanosized mineral particles dispersed into a
polymer matrix; among them, polymer–clay nanocomposites are within the
most promising materials, since they exhibit good improvements of the
aforementioned properties and their cost is quite low.
Chapter 3 Ultra violet cured nano composite coatings
195
Polymer/clay mineral composite coatings can be classified in three different
types: conventional microcomposites, where stacks of silicate layers are
dispersed at a microscale inside the matrix, intercalated nanocomposites, in
which some polymer chains are able to insert between the platelets maintaining
a long-range order, exfoliated nanocomposites, in which the platelets are not
ordered any more but separately and homogeneously dispersed into the matrix
as single platelets. In many cases a mixture of intercalated and exfoliated
structure is obtained, thus single platelets and tactoids are both present in the
material. Although the best final properties are achieved when the clay mineral
platelets are fully exfoliated and well dispersed, also their intercalated
morphology can ensure good improvements [160].
In order to achieve a good dispersion of the clay minerals into the polymer it is
often necessary to modify their surface in order to make them more
organophilic and compatible with the polymer matrix. Furthermore, a suitable
modification can enhance the interlayer distance of the clay mineral and, thus,
facilitate a better swelling of the clay mineral itself in an organic polymer or
monomer [161].
The intercalated or the exfoliated morphology of clay mineral layers after
modification can be achieved by different methods [162]. Some of them need
the presence of the polymer in the molten state and, therefore, can affect its
stability; others are solvent-based, thus releasing large amounts of volatile
compounds. In-situ intercalative polymerization is also proposed [163]: this
process, which is often solvent - based, uses reactive monomers as guest species
Chapter 3 Ultra violet cured nano composite coatings
196
to be intercalated. The in-situ intercalative polymerization can be performed by
photopolymerizing solvent-free curable systems: the procedure, involving the
use of ultra violet light (UV-curing process), guarantees the building up of
polymeric thermoset matrices via a fast and environmental friendly process,
which exhibits low energy consumption and no emission of volatile organic
carbon (VOCs).
Epoxy resins are often used for different applications, such as coatings for
metals, because of their excellent properties (high modulus, low creep, stiffness,
chemical resistance and good performances at high temperature) and easy
manufacturing. However, because of the crosslinking character, epoxy resins
present undesirable inconvenients, such as poor resistance to crack initiation
and growth, weak heat and corrosion resistance.
The incorporation of layered silicate nanofillers into epoxy resins may represent
a good way in order to solve these problems including the improvement of the
thermal stability and corrosion resistance. Moreover, since the viscosity of the
prepolymers, curing agents and oligomers can be low, their diffusion in
between the clay lamellae is not too difficult and can therefore facilitate the
achievement of intercalated or exfoliated morphologies as described by many
authors [164,165]. Recently the same approach was used for epoxy systems
cured by UV light [166-168].
In this section, UV-cured nanostructured coatings were prepared starting from
a cycloaliphatic di-epoxy monomer, namely 3, 4 - epoxycyclohexylmethyl - 3’,
4’-cyclohexancarboxylate (CE), in which two different types of nanofillers, both
Chapter 3 Ultra violet cured nano composite coatings
197
commercial and modified on purpose, were previously dispersed at two
different concentrations (5 and 10w/w%) [169]. The nanofillers consist of
montmorillonite nanparticles tailored using γGPS molecules in order to
promote the chemical interaction between the inorganic nanoparticles and the
polymeric epoxy matrix.
First of all, the level of compatibility between the nanoclays and the epoxy
resin was investigated by performing X-ray diffraction analyses (XRD) on the
liquid dispersions The same analyses were previously performed on the
nanoclay powders, in order to evaluate their basal spacing and its possible
increase after their modification. Moreover XRD measurements were repeated
on the final UV-cured films in order to establish the intercalation/exfoliation
level achieved after the UV-curing process. High intercalated or a quasi
exfoliated morphologies were obtained. It was confirmed by Transmission
Electron Microscopy (TEM) observations.
The kinetics of photopolymerization of the epoxy system, also in the presence
of the nanofillers, was investigated by real time Fourier Transfer Infrared
Spectroscopy (FT-IR) and correlated to the kind of nanoclays, its modification
and its concentration in the epoxy resin.
The obtained UV-cured nanocomposite films were subjected to dynamic-
mechanical analysis (DMTA), in order to evaluate their glass transition
temperature (Tg); thermo gravimetric analysis (TGA) measurements in air were
performed in order to check the thermo-oxidative stability of the
nanocomposite coatings, with respect to the pure UV-cured epoxy resin.
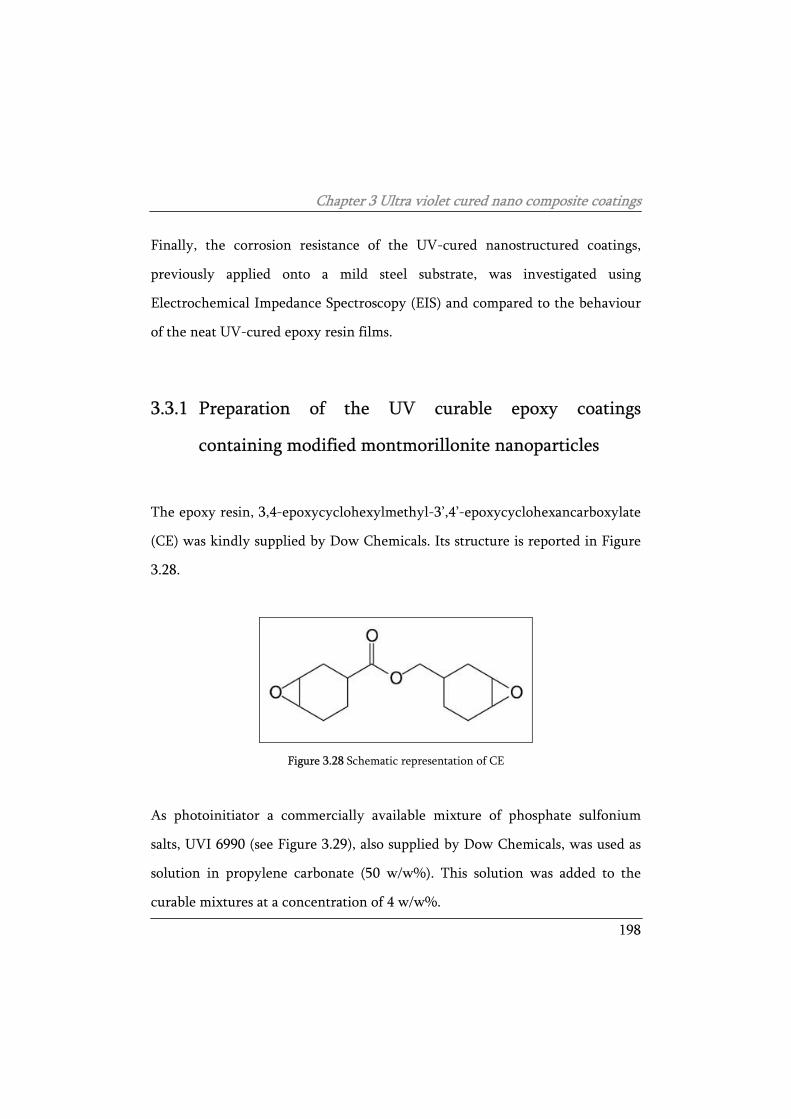
Chapter 3 Ultra violet cured nano composite coatings
198
Finally, the corrosion resistance of the UV-cured nanostructured coatings,
previously applied onto a mild steel substrate, was investigated using
Electrochemical Impedance Spectroscopy (EIS) and compared to the behaviour
of the neat UV-cured epoxy resin films.
3.3.1 Preparation of the UV curable epoxy coatings
containing modified montmorillonite nanoparticles
The epoxy resin, 3,4-epoxycyclohexylmethyl-3’,4’-epoxycyclohexancarboxylate
(CE) was kindly supplied by Dow Chemicals. Its structure is reported in Figure
3.28.
Figure 3.28 Schematic representation of CE
As photoinitiator a commercially available mixture of phosphate sulfonium
salts, UVI 6990 (see Figure 3.29), also supplied by Dow Chemicals, was used as
solution in propylene carbonate (50 w/w%). This solution was added to the
curable mixtures at a concentration of 4 w/w%.
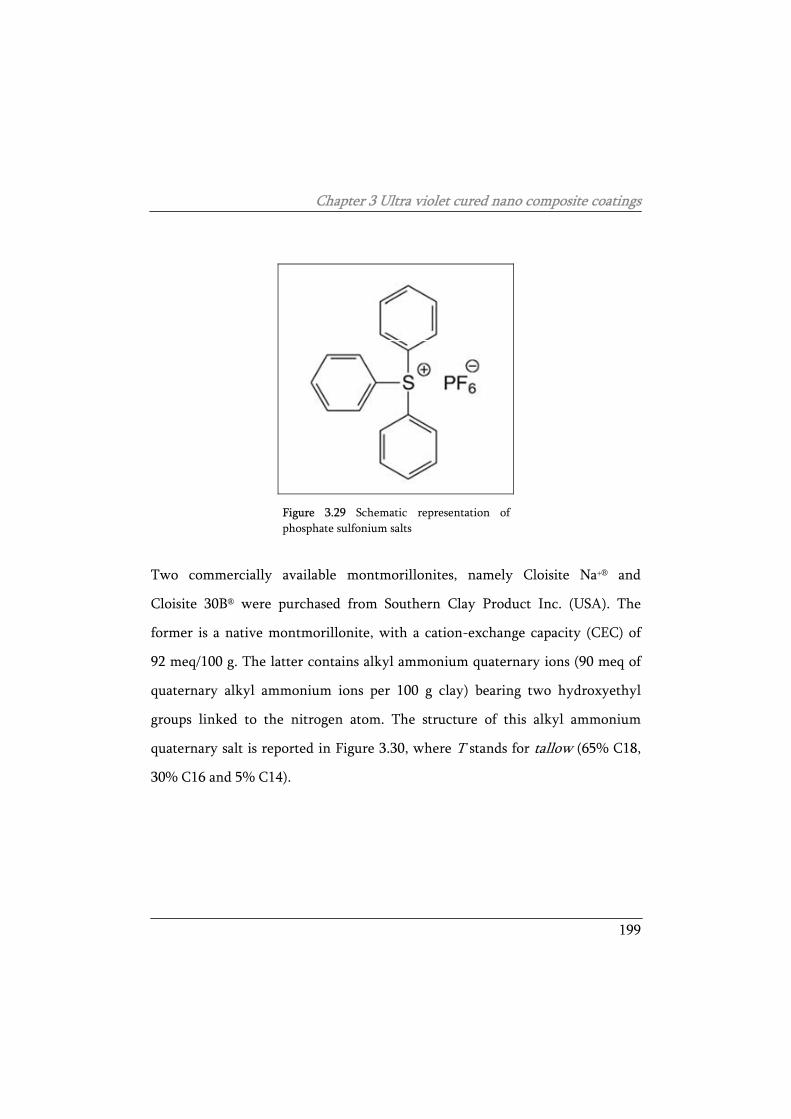
Chapter 3 Ultra violet cured nano composite coatings
199
Figure 3.29 Schematic representation of phosphate sulfonium salts
Two commercially available montmorillonites, namely Cloisite Na+® and
Cloisite 30B® were purchased from Southern Clay Product Inc. (USA). The
former is a native montmorillonite, with a cation-exchange capacity (CEC) of
92 meq/100 g. The latter contains alkyl ammonium quaternary ions (90 meq of
quaternary alkyl ammonium ions per 100 g clay) bearing two hydroxyethyl
groups linked to the nitrogen atom. The structure of this alkyl ammonium
quaternary salt is reported in Figure 3.30, where T stands for tallow (65% C18,
30% C16 and 5% C14).
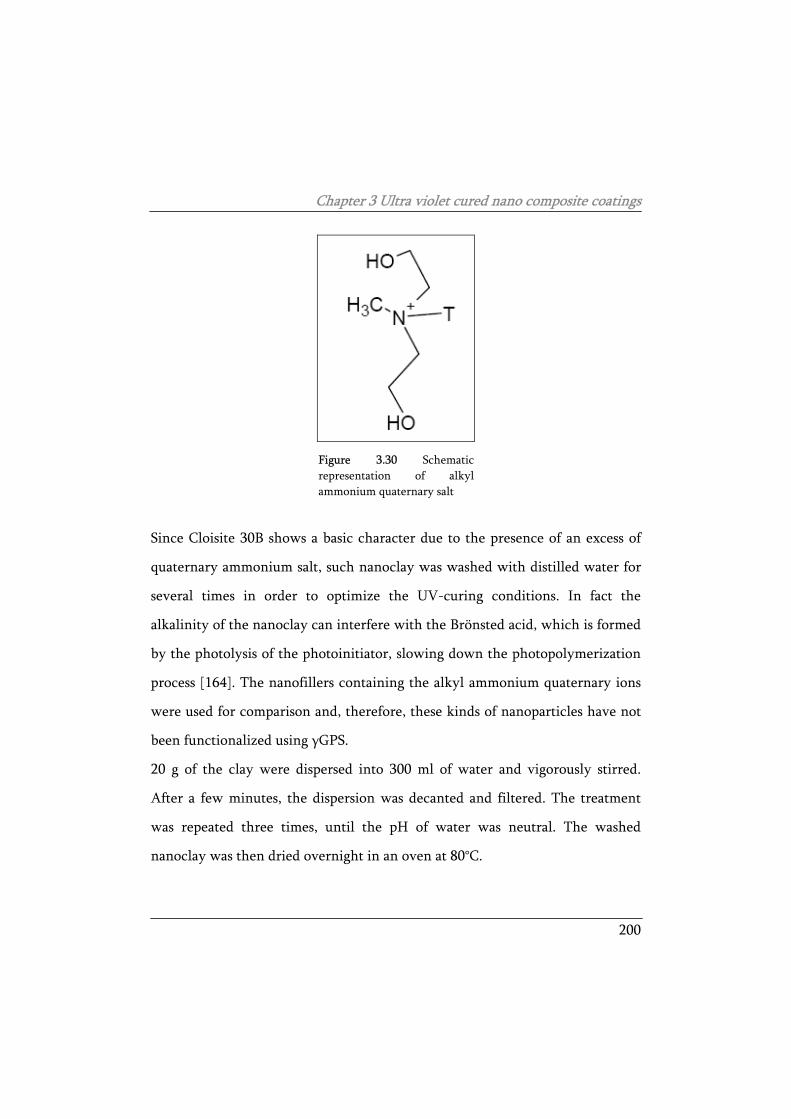
Chapter 3 Ultra violet cured nano composite coatings
200
Figure 3.30 Schematic representation of alkyl ammonium quaternary salt
Since Cloisite 30B shows a basic character due to the presence of an excess of
quaternary ammonium salt, such nanoclay was washed with distilled water for
several times in order to optimize the UV-curing conditions. In fact the
alkalinity of the nanoclay can interfere with the Brönsted acid, which is formed
by the photolysis of the photoinitiator, slowing down the photopolymerization
process [164]. The nanofillers containing the alkyl ammonium quaternary ions
were used for comparison and, therefore, these kinds of nanoparticles have not
been functionalized using γGPS.
20 g of the clay were dispersed into 300 ml of water and vigorously stirred.
After a few minutes, the dispersion was decanted and filtered. The treatment
was repeated three times, until the pH of water was neutral. The washed
nanoclay was then dried overnight in an oven at 80°C.
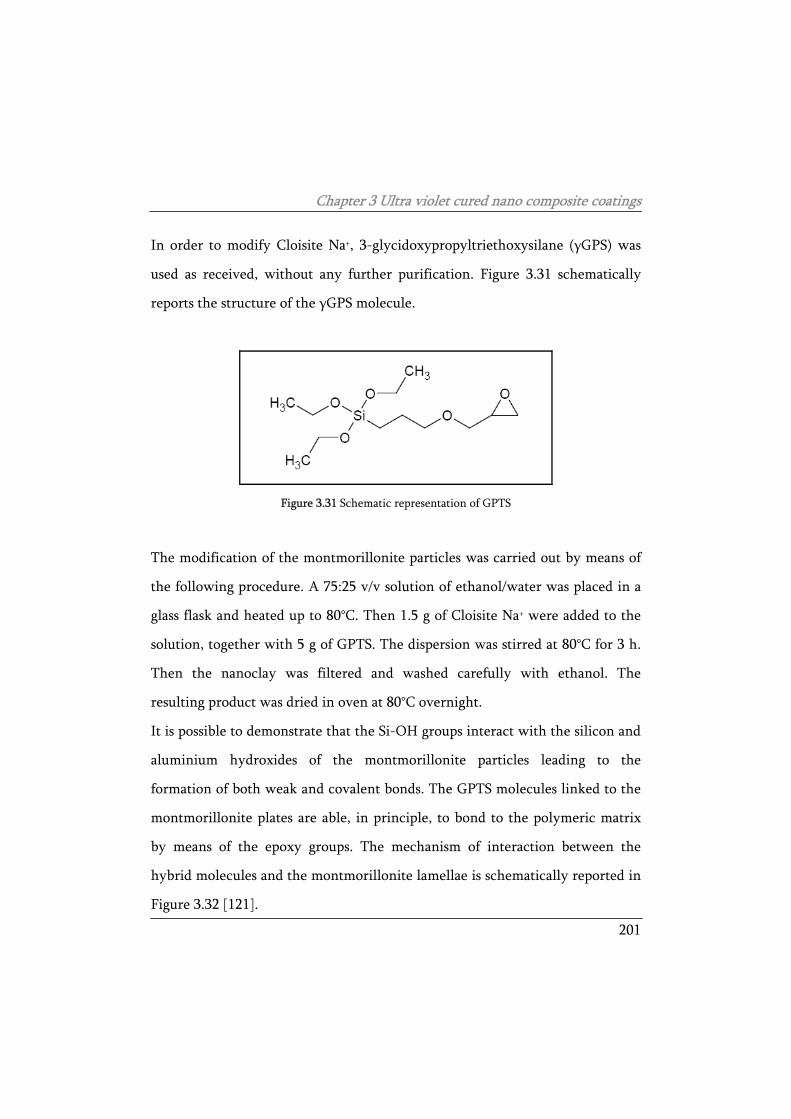
Chapter 3 Ultra violet cured nano composite coatings
201
In order to modify Cloisite Na+, 3-glycidoxypropyltriethoxysilane (γGPS) was
used as received, without any further purification. Figure 3.31 schematically
reports the structure of the γGPS molecule.
Figure 3.31 Schematic representation of GPTS
The modification of the montmorillonite particles was carried out by means of
the following procedure. A 75:25 v/v solution of ethanol/water was placed in a
glass flask and heated up to 80°C. Then 1.5 g of Cloisite Na+ were added to the
solution, together with 5 g of GPTS. The dispersion was stirred at 80°C for 3 h.
Then the nanoclay was filtered and washed carefully with ethanol. The
resulting product was dried in oven at 80°C overnight.
It is possible to demonstrate that the Si-OH groups interact with the silicon and
aluminium hydroxides of the montmorillonite particles leading to the
formation of both weak and covalent bonds. The GPTS molecules linked to the
montmorillonite plates are able, in principle, to bond to the polymeric matrix
by means of the epoxy groups. The mechanism of interaction between the
hybrid molecules and the montmorillonite lamellae is schematically reported in
Figure 3.32 [121].
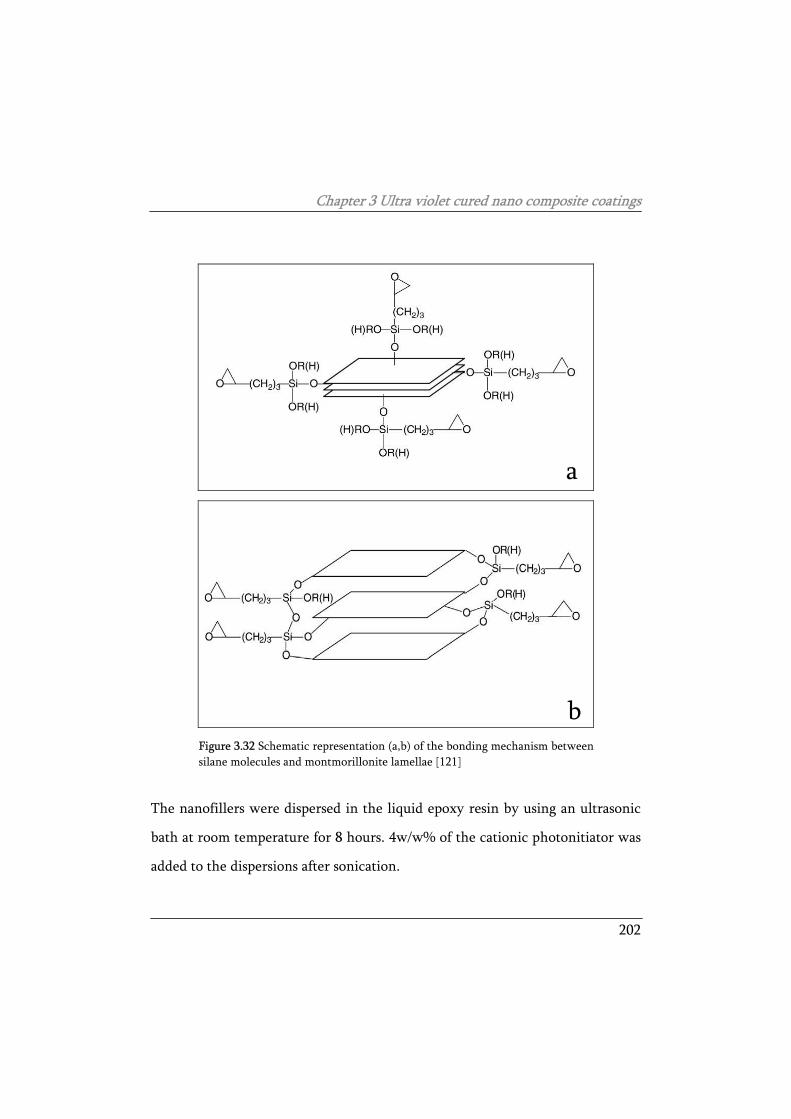
Chapter 3 Ultra violet cured nano composite coatings
202
Figure 3.32 Schematic representation (a,b) of the bonding mechanism between silane molecules and montmorillonite lamellae [121]
The nanofillers were dispersed in the liquid epoxy resin by using an ultrasonic
bath at room temperature for 8 hours. 4w/w% of the cationic photonitiator was
added to the dispersions after sonication.
a
b
Chapter 3 Ultra violet cured nano composite coatings
203
The mixtures were applied onto polypropylene sheets and on mild steel and
were irradiated by using a static UV-lamp.
The steel surface was cleaned and degreased before coating deposition with an
organic solvent and no specific surface pre-treatment or coupling agent was
applied. The intensity of the UV light on the surface of the sample was about 35
mW/cm2 and the samples were irradiated for 8 shots (30 s each shot). Finally,
the UV-cured films were placed in an oven at 60°C overnight.
3.3.2 Characterization of the UV curable epoxy coatings
containing modified montmorillonite nanoparticles
The UV-curable mixtures prepared are described in Table 3.8. The amounts of
nanoclays employed are either 5 or 10w/w%.
Table 3.8 Summary of the different samples under investigation
Sample Cloisite employed Cloisite content (w/w%) Cloisite modifier
CL1_5 Cloisite 30B 5% none
CL1_10 Cloisite 30B 10% none
CL2_5 Cloisite Na+ 5% GPTS
CL2_10 Cloisite Na+ 10% GPTS
The kinetics of photopolymerization was investigated by means of real-time FT-
IR (Thermo-Nicolet 5700) measurements performed on both the neat epoxy
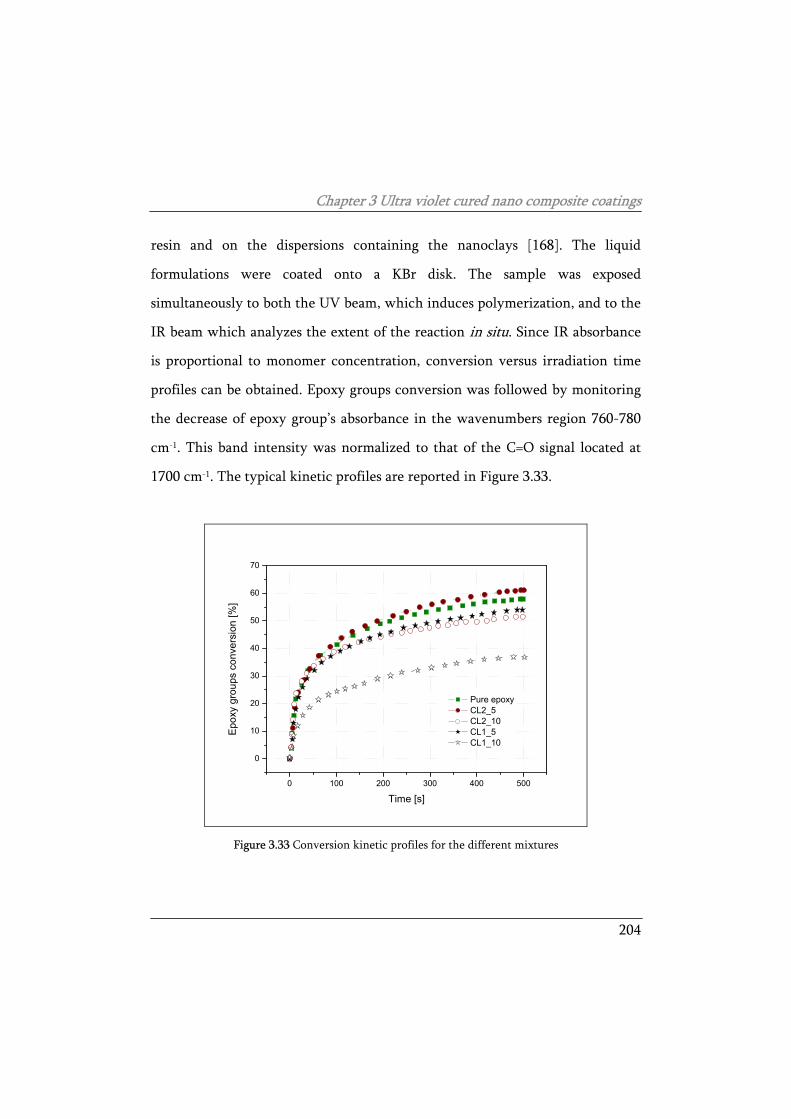
Chapter 3 Ultra violet cured nano composite coatings
204
resin and on the dispersions containing the nanoclays [168]. The liquid
formulations were coated onto a KBr disk. The sample was exposed
simultaneously to both the UV beam, which induces polymerization, and to the
IR beam which analyzes the extent of the reaction in situ. Since IR absorbance
is proportional to monomer concentration, conversion versus irradiation time
profiles can be obtained. Epoxy groups conversion was followed by monitoring
the decrease of epoxy group’s absorbance in the wavenumbers region 760-780
cm-1. This band intensity was normalized to that of the C=O signal located at
1700 cm-1. The typical kinetic profiles are reported in Figure 3.33.
0 100 200 300 400 500
0
10
20
30
40
50
60
70
Epo
xy g
roup
s co
nver
sion
[%]
Time [s]
Pure epoxy CL2_5 CL2_10 CL1_5 CL1_10
Figure 3.33 Conversion kinetic profiles for the different mixtures
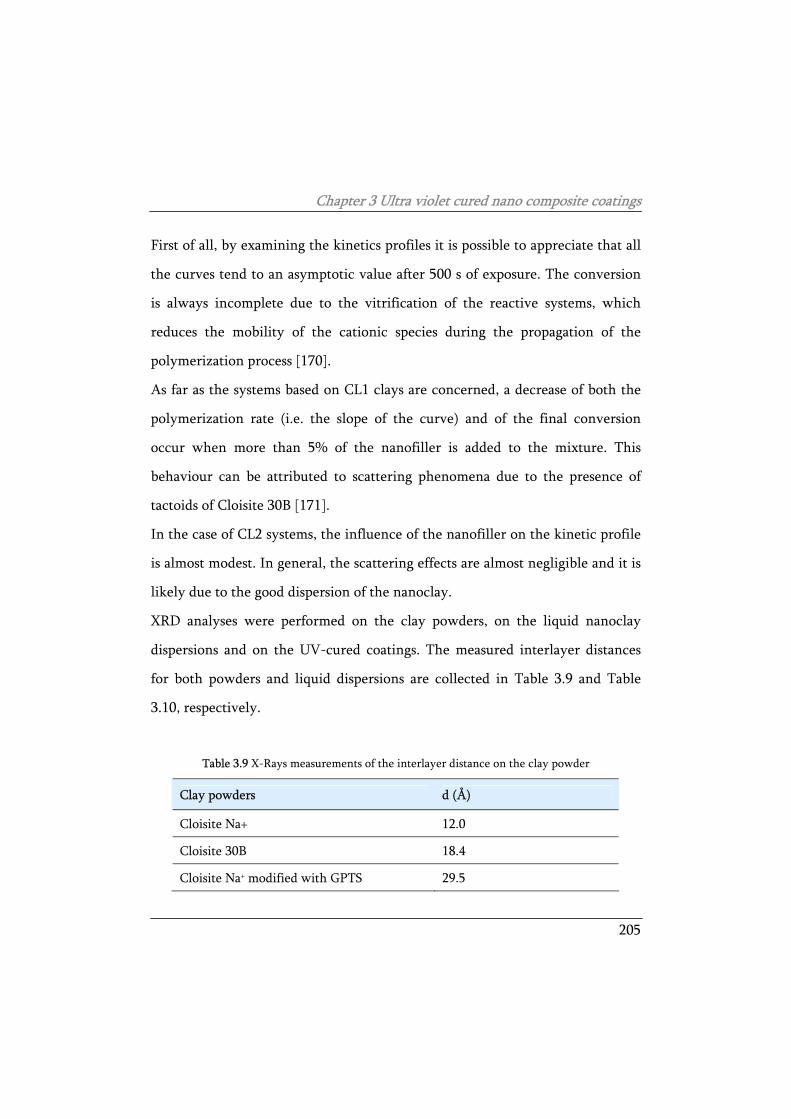
Chapter 3 Ultra violet cured nano composite coatings
205
First of all, by examining the kinetics profiles it is possible to appreciate that all
the curves tend to an asymptotic value after 500 s of exposure. The conversion
is always incomplete due to the vitrification of the reactive systems, which
reduces the mobility of the cationic species during the propagation of the
polymerization process [170].
As far as the systems based on CL1 clays are concerned, a decrease of both the
polymerization rate (i.e. the slope of the curve) and of the final conversion
occur when more than 5% of the nanofiller is added to the mixture. This
behaviour can be attributed to scattering phenomena due to the presence of
tactoids of Cloisite 30B [171].
In the case of CL2 systems, the influence of the nanofiller on the kinetic profile
is almost modest. In general, the scattering effects are almost negligible and it is
likely due to the good dispersion of the nanoclay.
XRD analyses were performed on the clay powders, on the liquid nanoclay
dispersions and on the UV-cured coatings. The measured interlayer distances
for both powders and liquid dispersions are collected in Table 3.9 and Table
3.10, respectively.
Table 3.9 X-Rays measurements of the interlayer distance on the clay powder
Clay powders d (Å)
Cloisite Na+ 12.0
Cloisite 30B 18.4
Cloisite Na+ modified with GPTS 29.5
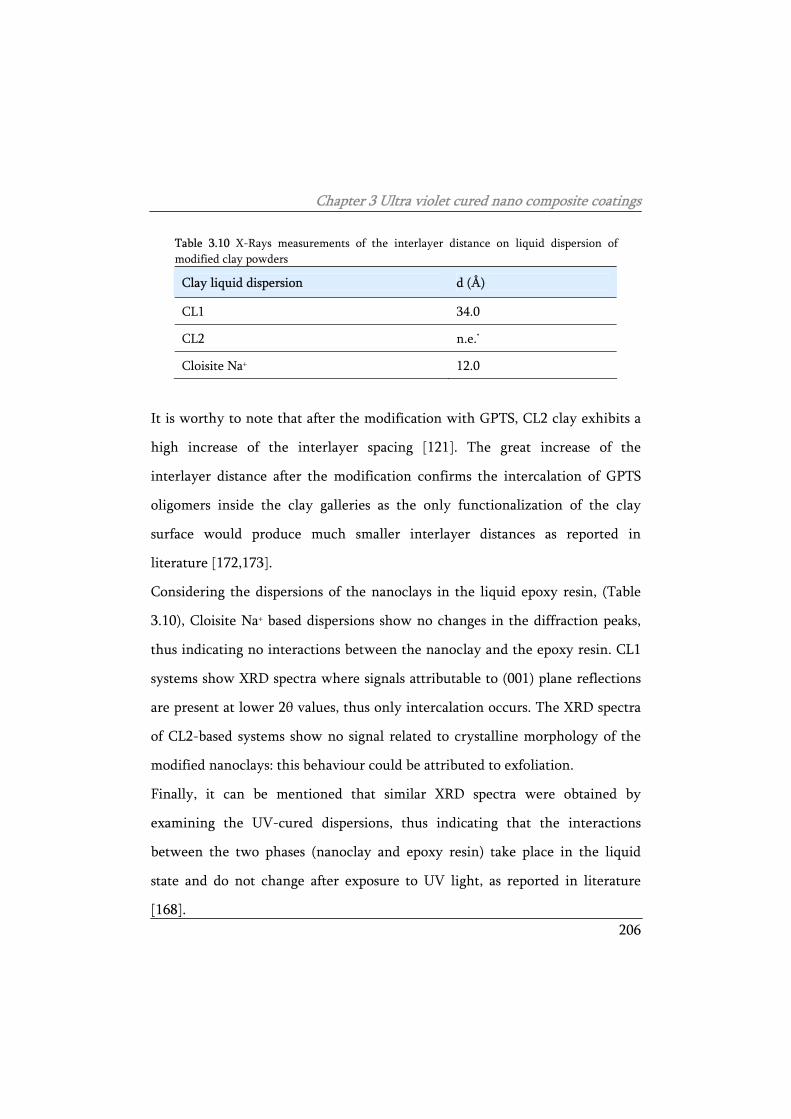
Chapter 3 Ultra violet cured nano composite coatings
206
Table 3.10 X-Rays measurements of the interlayer distance on liquid dispersion of modified clay powders
Clay liquid dispersion d (Å)
CL1 34.0
CL2 n.e.*
Cloisite Na+ 12.0
It is worthy to note that after the modification with GPTS, CL2 clay exhibits a
high increase of the interlayer spacing [121]. The great increase of the
interlayer distance after the modification confirms the intercalation of GPTS
oligomers inside the clay galleries as the only functionalization of the clay
surface would produce much smaller interlayer distances as reported in
literature [172,173].
Considering the dispersions of the nanoclays in the liquid epoxy resin, (Table
3.10), Cloisite Na+ based dispersions show no changes in the diffraction peaks,
thus indicating no interactions between the nanoclay and the epoxy resin. CL1
systems show XRD spectra where signals attributable to (001) plane reflections
are present at lower 2θ values, thus only intercalation occurs. The XRD spectra
of CL2-based systems show no signal related to crystalline morphology of the
modified nanoclays: this behaviour could be attributed to exfoliation.
Finally, it can be mentioned that similar XRD spectra were obtained by
examining the UV-cured dispersions, thus indicating that the interactions
between the two phases (nanoclay and epoxy resin) take place in the liquid
state and do not change after exposure to UV light, as reported in literature
[168].
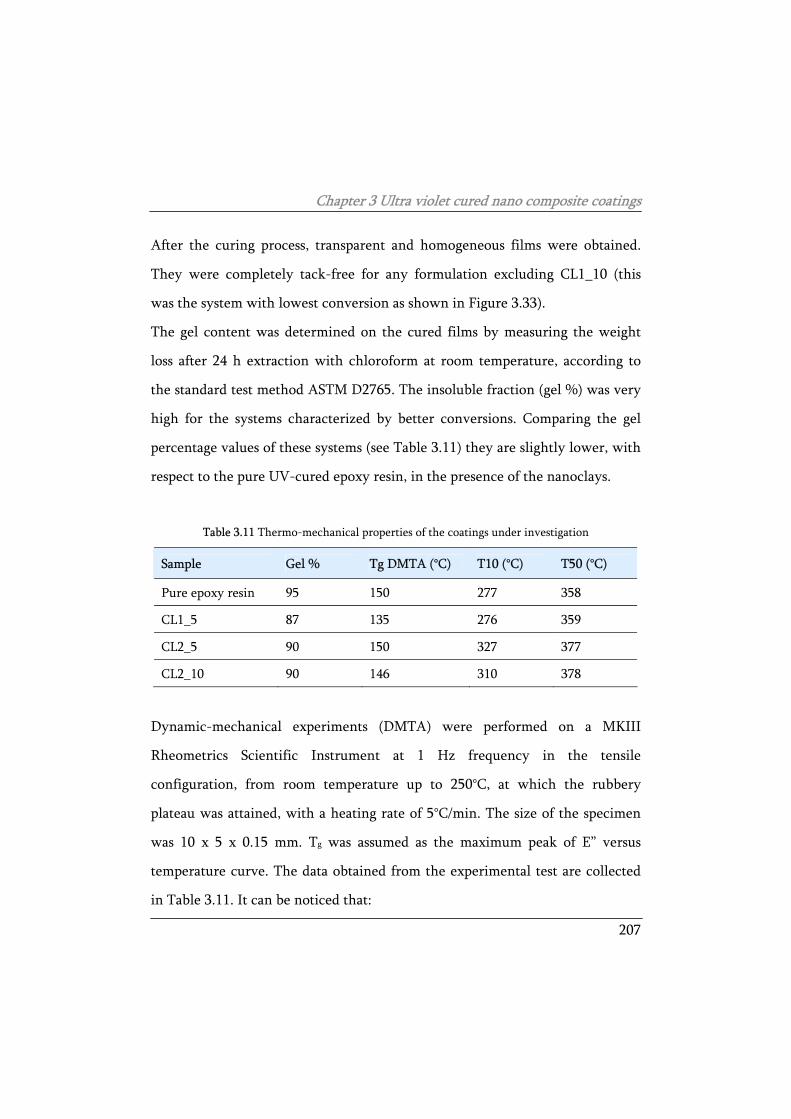
Chapter 3 Ultra violet cured nano composite coatings
207
After the curing process, transparent and homogeneous films were obtained.
They were completely tack-free for any formulation excluding CL1_10 (this
was the system with lowest conversion as shown in Figure 3.33).
The gel content was determined on the cured films by measuring the weight
loss after 24 h extraction with chloroform at room temperature, according to
the standard test method ASTM D2765. The insoluble fraction (gel %) was very
high for the systems characterized by better conversions. Comparing the gel
percentage values of these systems (see Table 3.11) they are slightly lower, with
respect to the pure UV-cured epoxy resin, in the presence of the nanoclays.
Table 3.11 Thermo-mechanical properties of the coatings under investigation
Sample Gel % Tg DMTA (°C) T10 (°C) T50 (°C)
Pure epoxy resin 95 150 277 358
CL1_5 87 135 276 359
CL2_5 90 150 327 377
CL2_10 90 146 310 378
Dynamic-mechanical experiments (DMTA) were performed on a MKIII
Rheometrics Scientific Instrument at 1 Hz frequency in the tensile
configuration, from room temperature up to 250°C, at which the rubbery
plateau was attained, with a heating rate of 5°C/min. The size of the specimen
was 10 x 5 x 0.15 mm. Tg was assumed as the maximum peak of E” versus
temperature curve. The data obtained from the experimental test are collected
in Table 3.11. It can be noticed that:
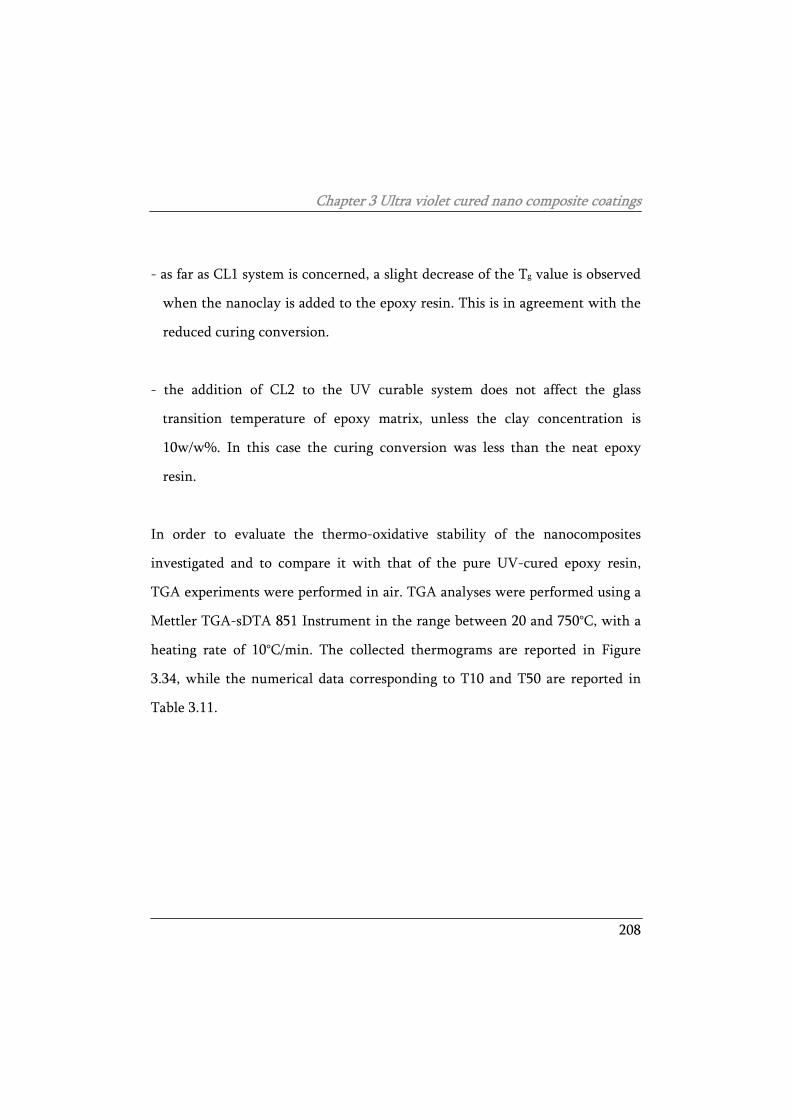
Chapter 3 Ultra violet cured nano composite coatings
208
- as far as CL1 system is concerned, a slight decrease of the Tg value is observed
when the nanoclay is added to the epoxy resin. This is in agreement with the
reduced curing conversion.
- the addition of CL2 to the UV curable system does not affect the glass
transition temperature of epoxy matrix, unless the clay concentration is
10w/w%. In this case the curing conversion was less than the neat epoxy
resin.
In order to evaluate the thermo-oxidative stability of the nanocomposites
investigated and to compare it with that of the pure UV-cured epoxy resin,
TGA experiments were performed in air. TGA analyses were performed using a
Mettler TGA-sDTA 851 Instrument in the range between 20 and 750°C, with a
heating rate of 10°C/min. The collected thermograms are reported in Figure
3.34, while the numerical data corresponding to T10 and T50 are reported in
Table 3.11.
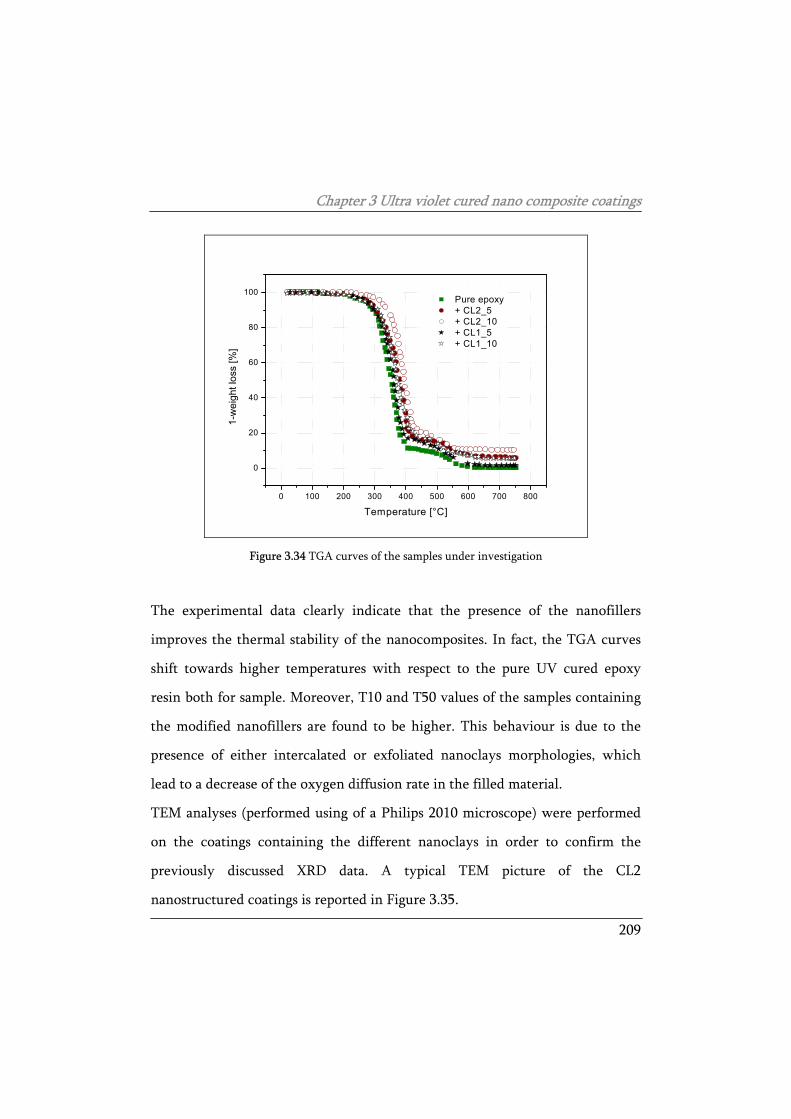
Chapter 3 Ultra violet cured nano composite coatings
209
0 100 200 300 400 500 600 700 800
0
20
40
60
80
100
Pure epoxy + CL2_5 + CL2_10 + CL1_5 + CL1_10
1-w
eigh
t los
s [%
]
Temperature [°C]
Figure 3.34 TGA curves of the samples under investigation
The experimental data clearly indicate that the presence of the nanofillers
improves the thermal stability of the nanocomposites. In fact, the TGA curves
shift towards higher temperatures with respect to the pure UV cured epoxy
resin both for sample. Moreover, T10 and T50 values of the samples containing
the modified nanofillers are found to be higher. This behaviour is due to the
presence of either intercalated or exfoliated nanoclays morphologies, which
lead to a decrease of the oxygen diffusion rate in the filled material.
TEM analyses (performed using of a Philips 2010 microscope) were performed
on the coatings containing the different nanoclays in order to confirm the
previously discussed XRD data. A typical TEM picture of the CL2
nanostructured coatings is reported in Figure 3.35.
Chapter 3 Ultra violet cured nano composite coatings
210
Figure 3.35 TEM images of the exfoliated structure of sample CL2_10
While CL1 based systems likely show an intercalated structure, where the clay
lamellae maintain their stacked morphology, the modification of Cloisite Na+
with GPTS determines a high intercalated morphology, although some single
(exfoliated) lamellae can be seen.
Prior the electrochemical characterization (carried out by means of
electrochemical impedance spectroscopy), the thickness of the nanocomposite
coatings applied on mild steel was measured. Table 3.12 collects the thickness of
the different coatings.
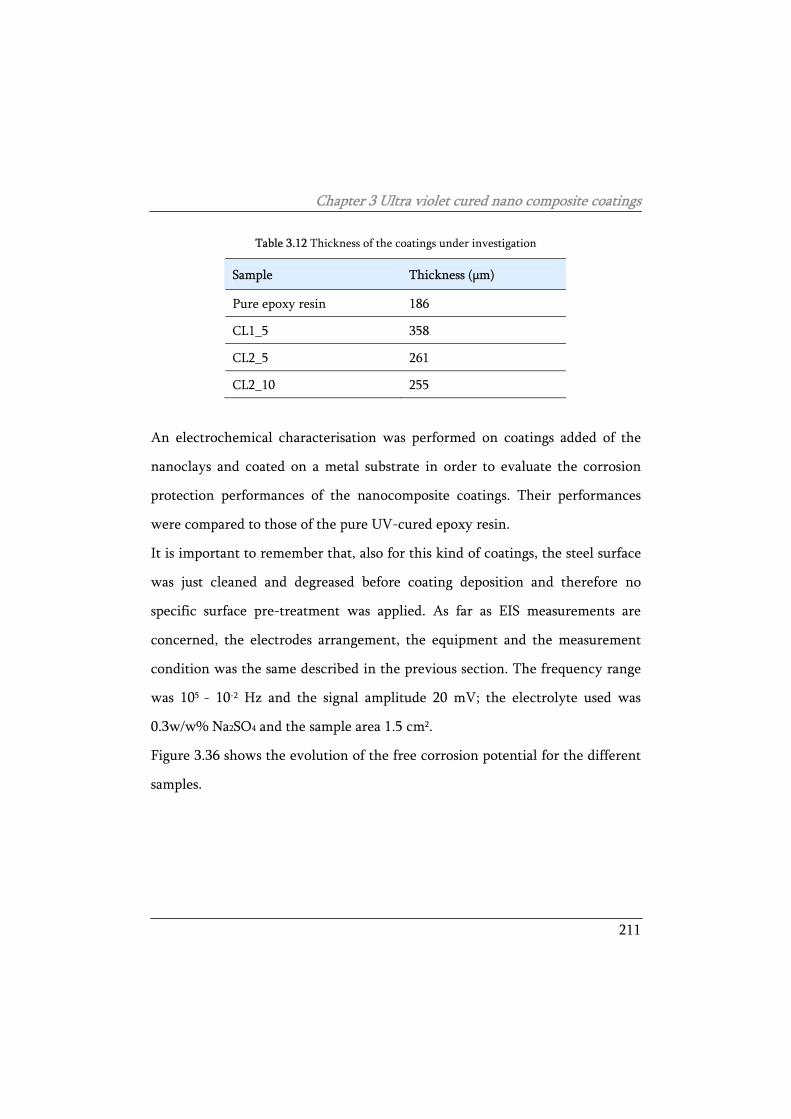
Chapter 3 Ultra violet cured nano composite coatings
211
Table 3.12 Thickness of the coatings under investigation
Sample Thickness (µm)
Pure epoxy resin 186
CL1_5 358
CL2_5 261
CL2_10 255
An electrochemical characterisation was performed on coatings added of the
nanoclays and coated on a metal substrate in order to evaluate the corrosion
protection performances of the nanocomposite coatings. Their performances
were compared to those of the pure UV-cured epoxy resin.
It is important to remember that, also for this kind of coatings, the steel surface
was just cleaned and degreased before coating deposition and therefore no
specific surface pre-treatment was applied. As far as EIS measurements are
concerned, the electrodes arrangement, the equipment and the measurement
condition was the same described in the previous section. The frequency range
was 105 - 10-2 Hz and the signal amplitude 20 mV; the electrolyte used was
0.3w/w% Na2SO4 and the sample area 1.5 cm2.
Figure 3.36 shows the evolution of the free corrosion potential for the different
samples.
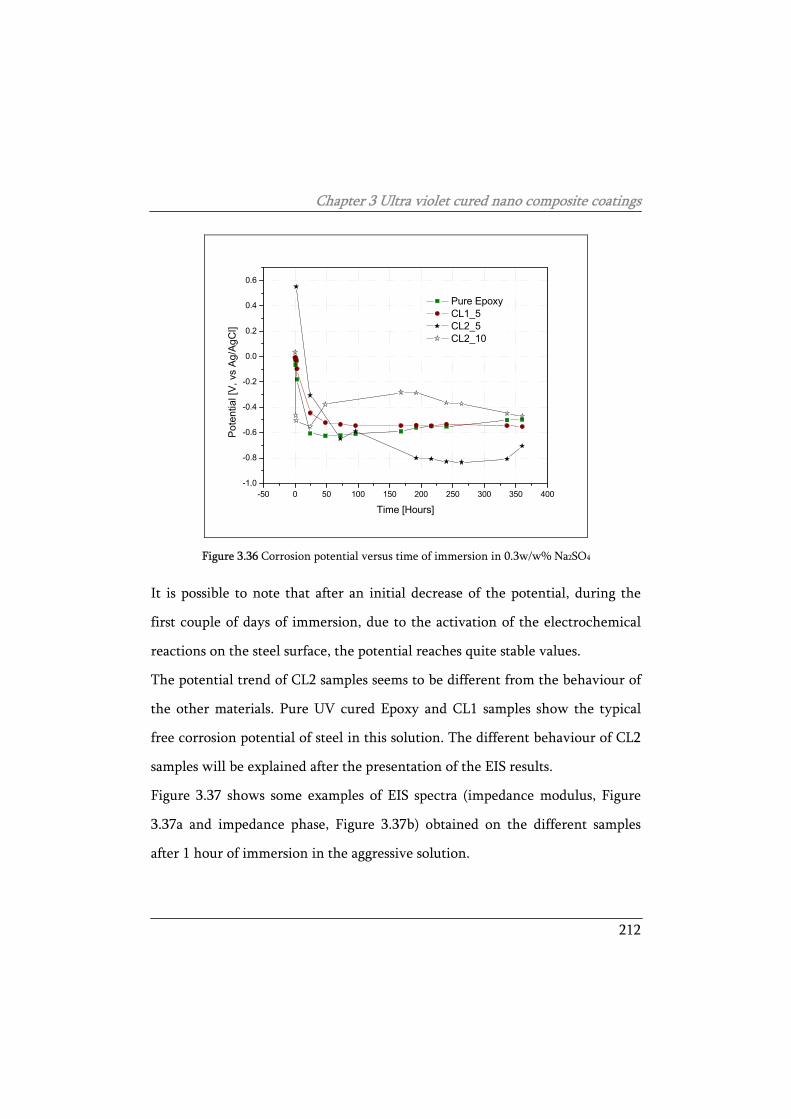
Chapter 3 Ultra violet cured nano composite coatings
212
-50 0 50 100 150 200 250 300 350 400-1.0
-0.8
-0.6
-0.4
-0.2
0.0
0.2
0.4
0.6
Pote
ntia
l [V,
vs
Ag/A
gCl]
Time [Hours]
Pure Epoxy CL1_5 CL2_5 CL2_10
Figure 3.36 Corrosion potential versus time of immersion in 0.3w/w% Na2SO4
It is possible to note that after an initial decrease of the potential, during the
first couple of days of immersion, due to the activation of the electrochemical
reactions on the steel surface, the potential reaches quite stable values.
The potential trend of CL2 samples seems to be different from the behaviour of
the other materials. Pure UV cured Epoxy and CL1 samples show the typical
free corrosion potential of steel in this solution. The different behaviour of CL2
samples will be explained after the presentation of the EIS results.
Figure 3.37 shows some examples of EIS spectra (impedance modulus, Figure
3.37a and impedance phase, Figure 3.37b) obtained on the different samples
after 1 hour of immersion in the aggressive solution.
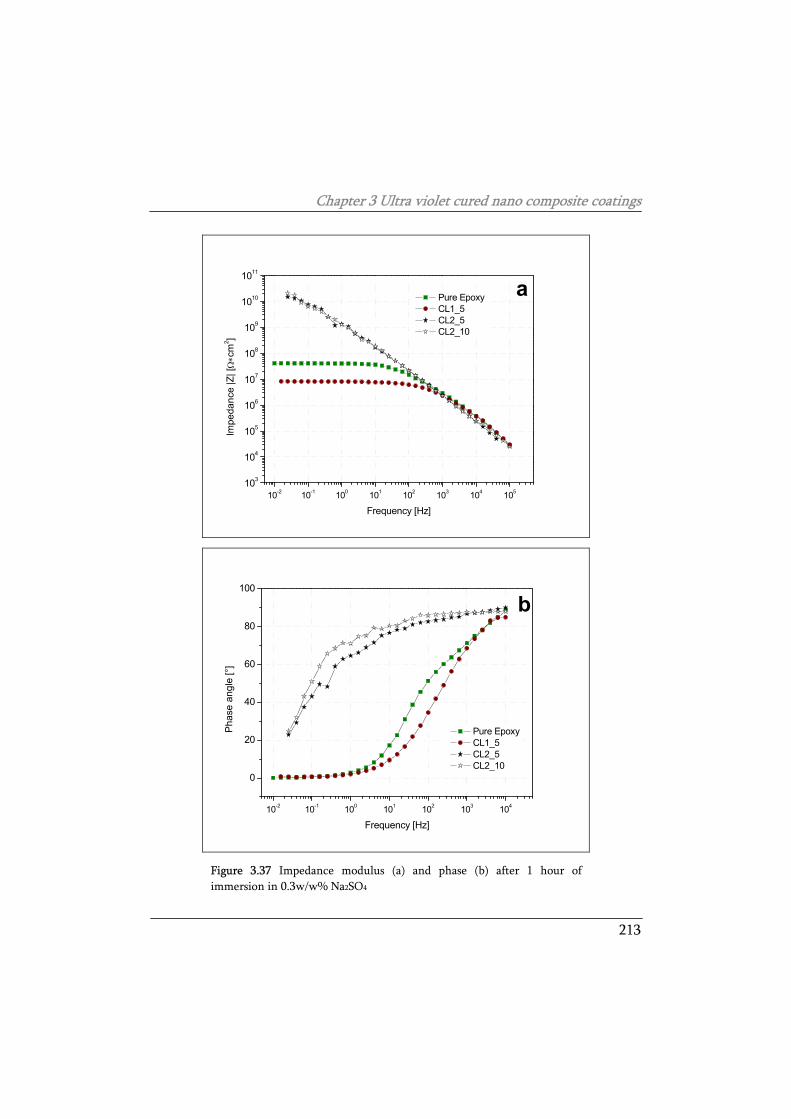
Chapter 3 Ultra violet cured nano composite coatings
213
10-2 10-1 100 101 102 103 104 105103
104
105
106
107
108
109
1010
1011
Impe
danc
e |Z
| [Ω∗c
m2 ]
Frequency [Hz]
Pure Epoxy CL1_5 CL2_5 CL2_10
a
10-2 10-1 100 101 102 103 104
0
20
40
60
80
100
b
Phas
e an
gle
[°]
Frequency [Hz]
Pure Epoxy CL1_5 CL2_5 CL2_10
Figure 3.37 Impedance modulus (a) and phase (b) after 1 hour of immersion in 0.3w/w% Na2SO4
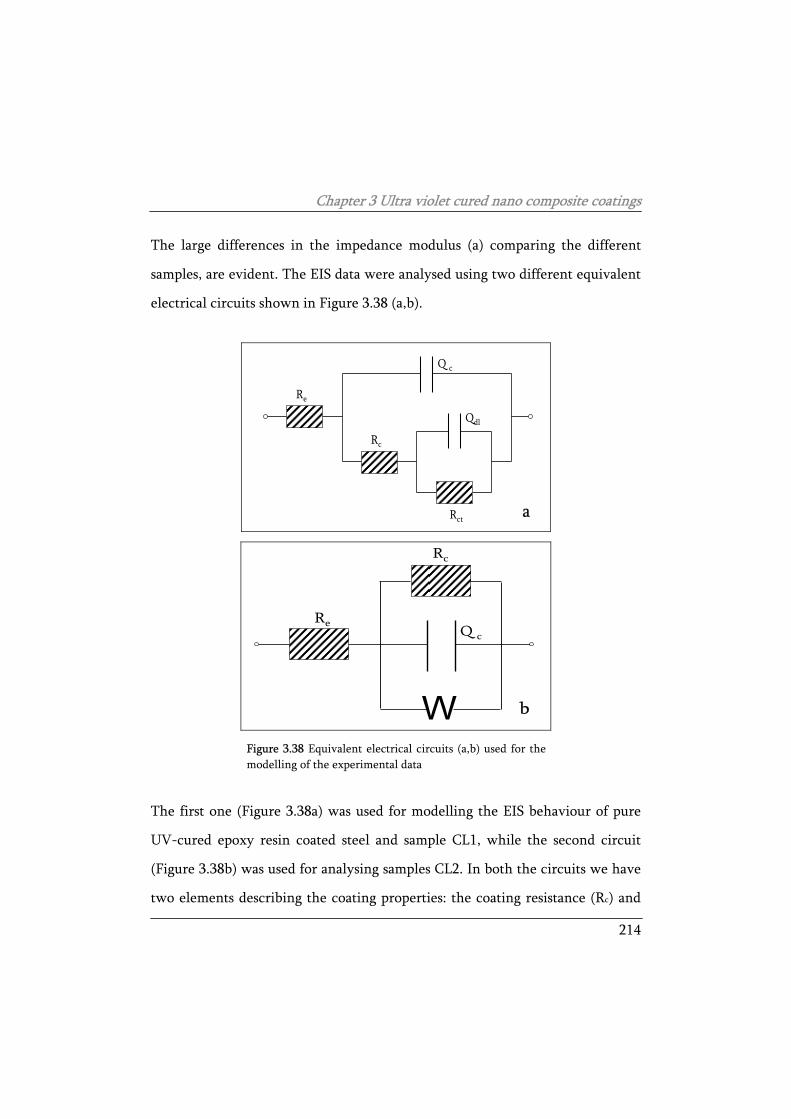
Chapter 3 Ultra violet cured nano composite coatings
214
The large differences in the impedance modulus (a) comparing the different
samples, are evident. The EIS data were analysed using two different equivalent
electrical circuits shown in Figure 3.38 (a,b).
Rc
Qdl
Rct
Q c
Re
a
bW
Re
Rc
Q c
Figure 3.38 Equivalent electrical circuits (a,b) used for the modelling of the experimental data
The first one (Figure 3.38a) was used for modelling the EIS behaviour of pure
UV-cured epoxy resin coated steel and sample CL1, while the second circuit
(Figure 3.38b) was used for analysing samples CL2. In both the circuits we have
two elements describing the coating properties: the coating resistance (Rc) and
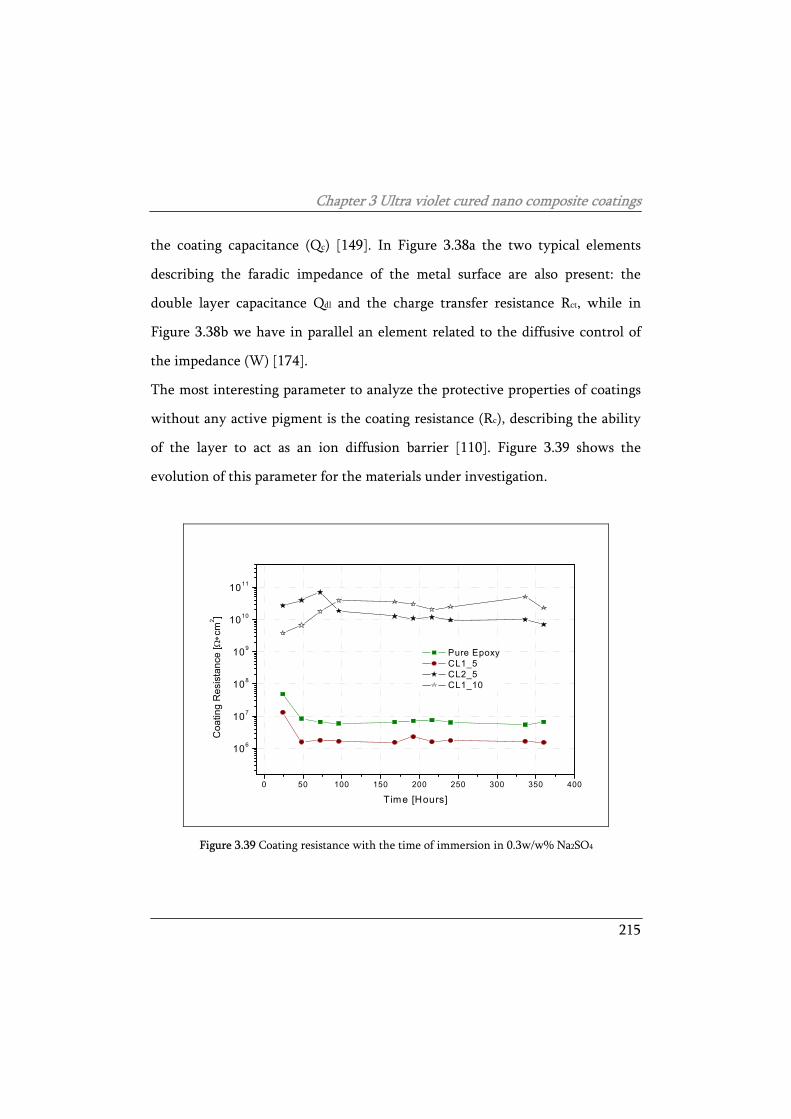
Chapter 3 Ultra violet cured nano composite coatings
215
the coating capacitance (Qc) [149]. In Figure 3.38a the two typical elements
describing the faradic impedance of the metal surface are also present: the
double layer capacitance Qdl and the charge transfer resistance Rct, while in
Figure 3.38b we have in parallel an element related to the diffusive control of
the impedance (W) [174].
The most interesting parameter to analyze the protective properties of coatings
without any active pigment is the coating resistance (Rc), describing the ability
of the layer to act as an ion diffusion barrier [110]. Figure 3.39 shows the
evolution of this parameter for the materials under investigation.
0 50 100 150 200 250 300 350 400
106
107
108
109
1010
1011
Coa
ting
Res
ista
nce
[Ω∗c
m2 ]
T ime [Hours]
Pure Epoxy CL1_5 CL2_5 CL1_10
Figure 3.39 Coating resistance with the time of immersion in 0.3w/w% Na2SO4
Chapter 3 Ultra violet cured nano composite coatings
216
The huge difference between sample CL2 and the couple sample CL1 and pure
UV-cured epoxy resin is evident. These last two samples show, from the
beginning of the test, resistances values which are two orders of magnitude
lower than the CL2 samples, reaching later values around 107 Ω·cm2, slightly
lower for CL1 samples in comparison with pure UV-cured epoxy coating. These
values are typical for unpigmented coatings with this thickness [175]. The lower
values of sample CL1 can be explained by considering that without a proper
interaction between nano-particles and polymeric matrix, the interface can act
as preferential pathway for ions diffusion, leading to the results that the
addition of nanoclays can reduce the barrier properties in comparison with pure
UV cured epoxy coatings.
As far as CL2 samples are concerned, the situation is completely different. The
impedance is, for both the coatings, around 1010 Ω·cm2, which is a value
exceptionally high, proving very good barrier properties. Moreover, increasing
the quantity of γGPS (from 5% to 10%) their performance increases (CL2_5 and
CL2_10 samples).
From these data it is evident that only with a suitable functionalization of the
nanoclay, inducing a chemical interaction between the nanofiller and the
polymeric matrix, it is possible to increase the barrier properties, having a
beneficial effect by the presence of the composite coating, avoiding any lack of
continuity at the polymer-nanoclay interface.
The trends of the relative dielectric permittivity at 25°C (εR) of the different
coating with immersion time are shown in Figure 3.40.
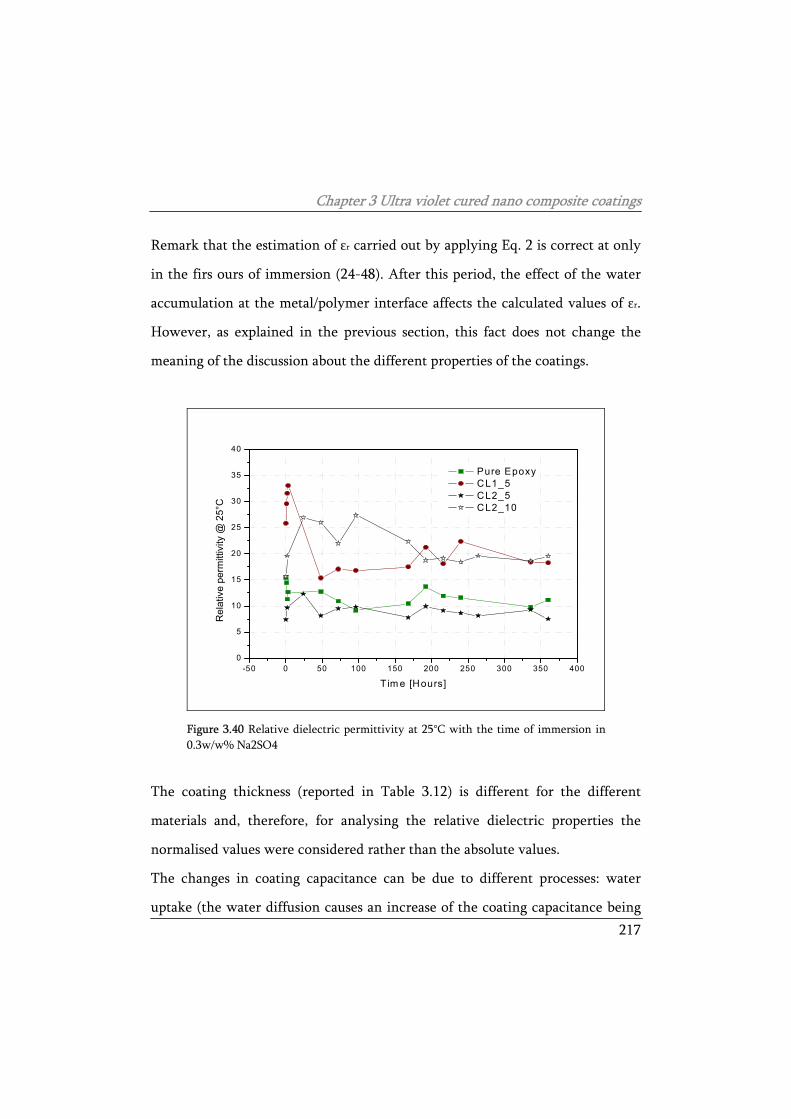
Chapter 3 Ultra violet cured nano composite coatings
217
Remark that the estimation of εr carried out by applying Eq. 2 is correct at only
in the firs ours of immersion (24-48). After this period, the effect of the water
accumulation at the metal/polymer interface affects the calculated values of εr.
However, as explained in the previous section, this fact does not change the
meaning of the discussion about the different properties of the coatings.
-50 0 50 100 150 200 250 300 350 4000
5
10
15
20
25
30
35
40
Rel
ativ
e pe
rmitt
ivity
@ 2
5°C
T im e [Hours]
Pure Epoxy CL1_5 CL2_5 CL2_10
Figure 3.40 Relative dielectric permittivity at 25°C with the time of immersion in 0.3w/w% Na2SO4
The coating thickness (reported in Table 3.12) is different for the different
materials and, therefore, for analysing the relative dielectric properties the
normalised values were considered rather than the absolute values.
The changes in coating capacitance can be due to different processes: water
uptake (the water diffusion causes an increase of the coating capacitance being
Chapter 3 Ultra violet cured nano composite coatings
218
the dielectric permittivity of water higher than the dielectric permittivity of the
polymeric matrix at room temperature), dissolution of polar components in the
coating (causing a decrease of the coating capacitance) and the swelling of the
coating due to water diffusion, which, increasing the coating thickness, causes
an apparent decrease of the coating capacitance [152]. It is possible that all this
processes occur at the same time.
Figure 3.40 shows two groups of samples: CL2_5 sample and pure UV-cured
epoxy, and, on the other side, CL1_5 sample and. CL2_10 sample. The first
couple of samples show low and quite stable values of εR after the first days of
immersion, in the order of 7-10. The water uptake, which is possible to quantify
using the Brasher-Kingsbury equation (Eq. 3.1) from the capacitance values
[153], is in the order of 4-5% in volume for CL2_5 samples, thus indicating good
water barrier properties. Concerning the other two samples, a different
behaviour is noticeable: the coating capacitance increase after the first days of
immersion and than decrease to the value of 20 during the remaining days of
immersion. These results can be due to the dissolution of polar components of
the coating or it can be associated to a swelling process in the coatings. In both
the cases, the samples CL1_5 and CL2_10 are less stable in the aqueous solution.
For all the samples, showing the lowest resistance properties (pure UV-cured
epoxy coating and sample CL1), it was possible to investigate the corrosion
process at the metal interface measuring the values of charge transfer resistance
Rct and double layer capacitance Qdl using the equivalent electrical circuits
depicted in Figure 3.38.
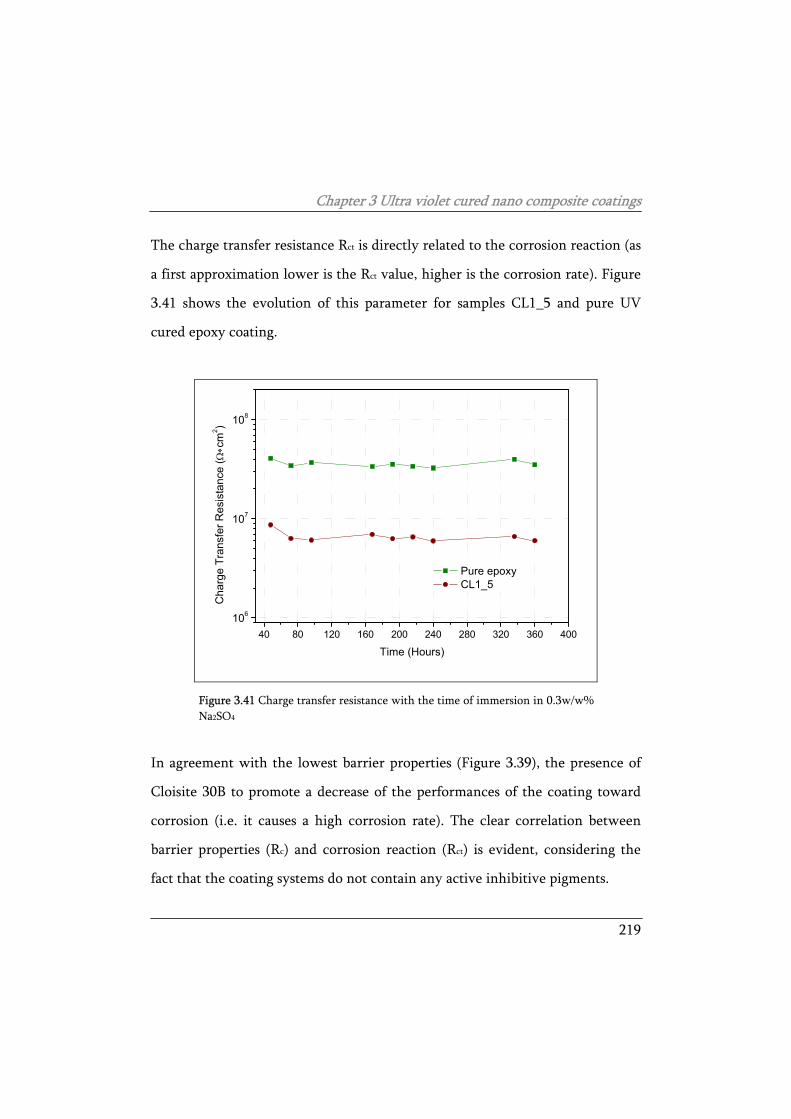
Chapter 3 Ultra violet cured nano composite coatings
219
The charge transfer resistance Rct is directly related to the corrosion reaction (as
a first approximation lower is the Rct value, higher is the corrosion rate). Figure
3.41 shows the evolution of this parameter for samples CL1_5 and pure UV
cured epoxy coating.
40 80 120 160 200 240 280 320 360 400106
107
108
Cha
rge
Tran
sfer
Res
ista
nce
( Ω∗c
m2 )
Time (Hours)
Pure epoxy CL1_5
Figure 3.41 Charge transfer resistance with the time of immersion in 0.3w/w% Na2SO4
In agreement with the lowest barrier properties (Figure 3.39), the presence of
Cloisite 30B to promote a decrease of the performances of the coating toward
corrosion (i.e. it causes a high corrosion rate). The clear correlation between
barrier properties (Rc) and corrosion reaction (Rct) is evident, considering the
fact that the coating systems do not contain any active inhibitive pigments.
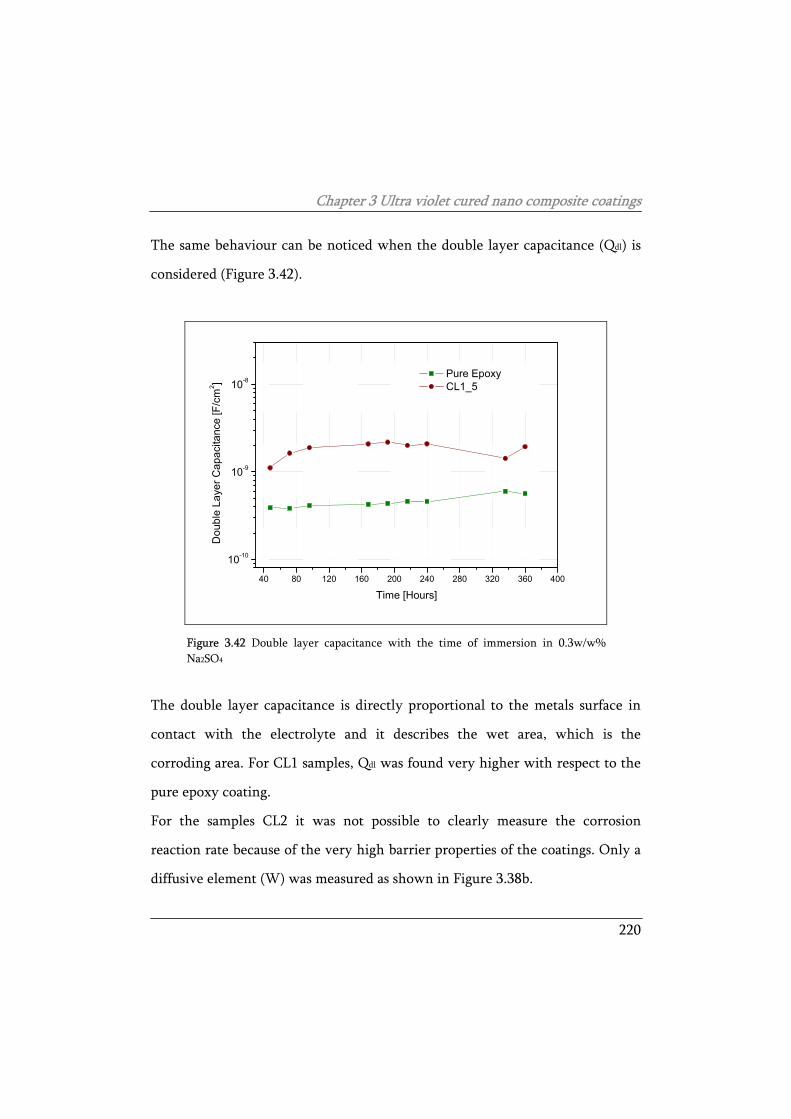
Chapter 3 Ultra violet cured nano composite coatings
220
The same behaviour can be noticed when the double layer capacitance (Qdl) is
considered (Figure 3.42).
40 80 120 160 200 240 280 320 360 400
10-10
10-9
10-8
Dou
ble
Laye
r Cap
acita
nce
[F/c
m2 ]
Time [Hours]
Pure Epoxy CL1_5
Figure 3.42 Double layer capacitance with the time of immersion in 0.3w/w% Na2SO4
The double layer capacitance is directly proportional to the metals surface in
contact with the electrolyte and it describes the wet area, which is the
corroding area. For CL1 samples, Qdl was found very higher with respect to the
pure epoxy coating.
For the samples CL2 it was not possible to clearly measure the corrosion
reaction rate because of the very high barrier properties of the coatings. Only a
diffusive element (W) was measured as shown in Figure 3.38b.
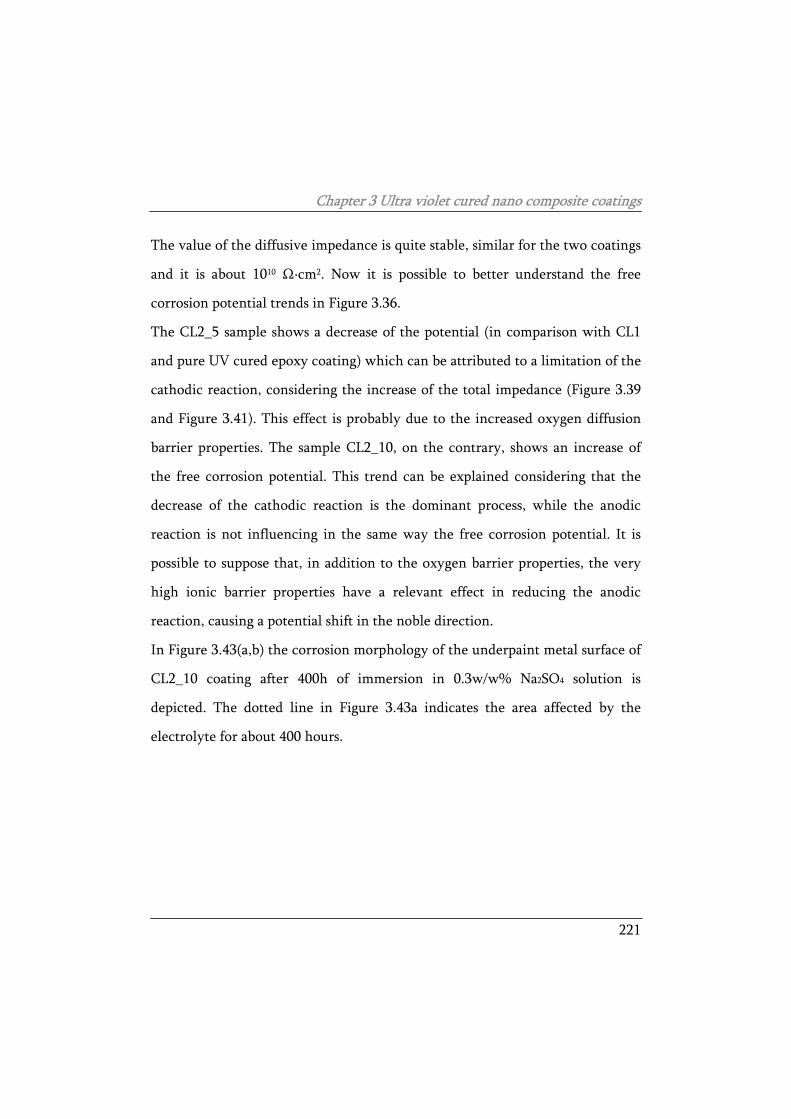
Chapter 3 Ultra violet cured nano composite coatings
221
The value of the diffusive impedance is quite stable, similar for the two coatings
and it is about 1010 Ω·cm2. Now it is possible to better understand the free
corrosion potential trends in Figure 3.36.
The CL2_5 sample shows a decrease of the potential (in comparison with CL1
and pure UV cured epoxy coating) which can be attributed to a limitation of the
cathodic reaction, considering the increase of the total impedance (Figure 3.39
and Figure 3.41). This effect is probably due to the increased oxygen diffusion
barrier properties. The sample CL2_10, on the contrary, shows an increase of
the free corrosion potential. This trend can be explained considering that the
decrease of the cathodic reaction is the dominant process, while the anodic
reaction is not influencing in the same way the free corrosion potential. It is
possible to suppose that, in addition to the oxygen barrier properties, the very
high ionic barrier properties have a relevant effect in reducing the anodic
reaction, causing a potential shift in the noble direction.
In Figure 3.43(a,b) the corrosion morphology of the underpaint metal surface of
CL2_10 coating after 400h of immersion in 0.3w/w% Na2SO4 solution is
depicted. The dotted line in Figure 3.43a indicates the area affected by the
electrolyte for about 400 hours.
Chapter 3 Ultra violet cured nano composite coatings
222
5 mm5 mm
a
0.5 mm0.5 mm
b
Figure 3.43 Appearance of the underpaint condition of samples CL2_10 after 360 hour of continuous immersion in 0.3w/w% Na2SO4: low (a) and high (b) magnification
At higher magnitudes (Figure 3.43b) some matting effects related to the
oxidation phenomena can be observed. The pure UV-cured epoxy resin (Figure
3.44) shows some areas, after the treatment, where corrosive attack clearly took
place. Also in this case, the dotted line in Figure 3.44 indicates the area affected
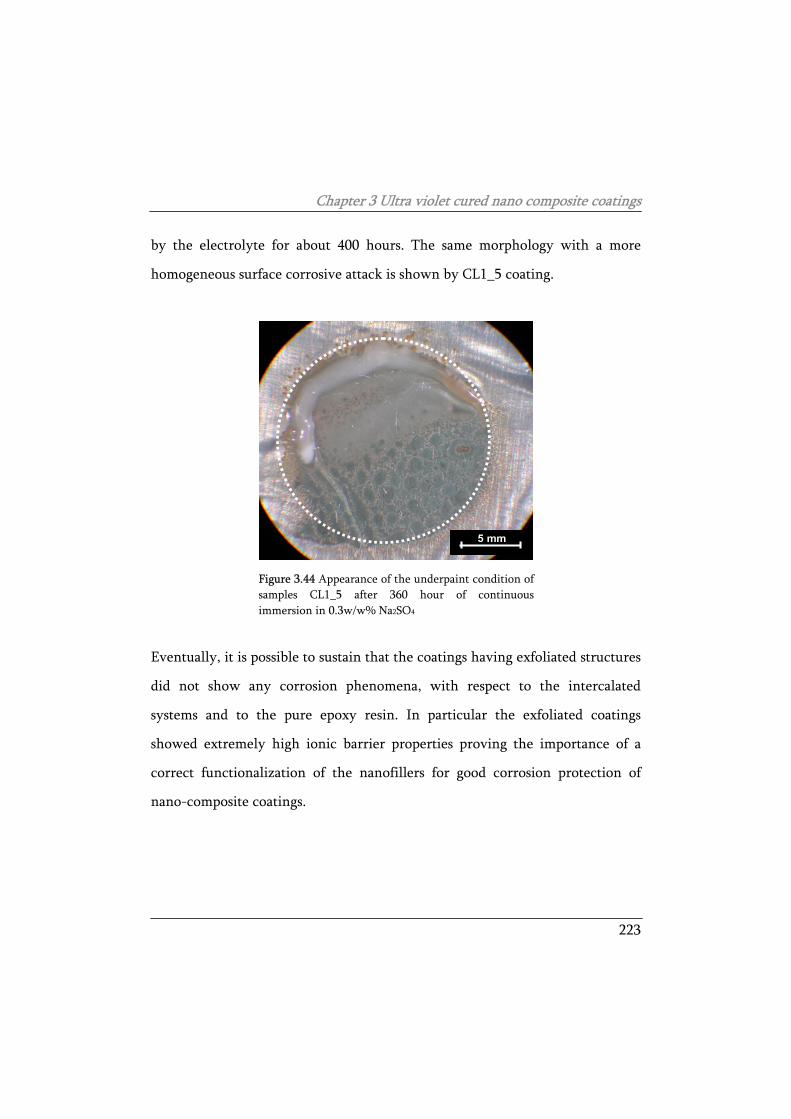
Chapter 3 Ultra violet cured nano composite coatings
223
by the electrolyte for about 400 hours. The same morphology with a more
homogeneous surface corrosive attack is shown by CL1_5 coating.
5 mm5 mm
Figure 3.44 Appearance of the underpaint condition of samples CL1_5 after 360 hour of continuous immersion in 0.3w/w% Na2SO4
Eventually, it is possible to sustain that the coatings having exfoliated structures
did not show any corrosion phenomena, with respect to the intercalated
systems and to the pure epoxy resin. In particular the exfoliated coatings
showed extremely high ionic barrier properties proving the importance of a
correct functionalization of the nanofillers for good corrosion protection of
nano-composite coatings.
Chapter 3 Ultra violet cured nano composite coatings
224
3.4 Final comments
UV-cured nanostructured coatings were prepared using organo-modified
nanoclays, added in different amounts to a waterborne cycloaliphatic epoxy
resin (CE), and inducing an in situ formation of nanostructured domains in a
waterborne urethane-acrylic polymeric matrix.
Depending on the modifier employed different morphologies were obtained
and different corrosion protection properties as well. To better understand the
effect of the modifiers on the corrosion protection properties on the UV cured
matrix, the resistances and the relative dielectric permittivity of the different
coatings object of investigation in this chapter were compared. This comparison
is reported in terms of coating resistance (Figure 3.45) and relative dielectric
permittivity of the coatings (Figure 3.46).
As far as the PUD samples are concerned, in Figures 3.45 and 3.46 only the
MEMO modified samples were considered, owing to the higher affinity of these
coatings with the organo-modified nanoclays enriched coatings. In fact, both
these two different kinds of coatings contain inorganic particles (in situ formed
silica domains and montmorillonite nanoparticles, respectively) and a coupling
agent between the organic and inorganic phases (MEMO and GPTS,
respectively). For this reasons, the above mentioned comparison can be
considered consistent.
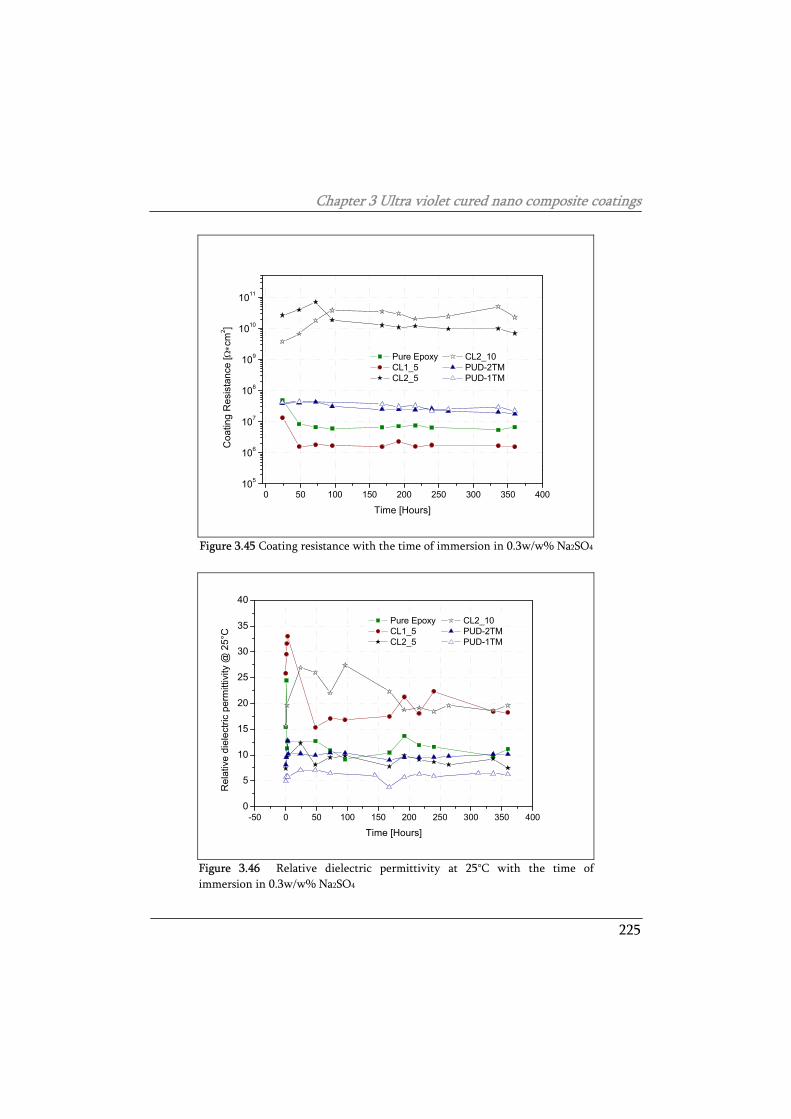
Chapter 3 Ultra violet cured nano composite coatings
225
0 50 100 150 200 250 300 350 400105
106
107
108
109
1010
1011
CL2_10 PUD-2TM PUD-1TM
Pure Epoxy CL1_5 CL2_5
Coa
ting
Res
ista
nce
[Ω∗c
m2 ]
Time [Hours]
Figure 3.45 Coating resistance with the time of immersion in 0.3w/w% Na2SO4
-50 0 50 100 150 200 250 300 350 4000
5
10
15
20
25
30
35
40
CL2_10 PUD-2TM PUD-1TM
Pure Epoxy CL1_5 CL2_5
Rel
ativ
e di
elec
tric
perm
ittiv
ity @
25°
C
Time [Hours]
Figure 3.46 Relative dielectric permittivity at 25°C with the time of immersion in 0.3w/w% Na2SO4
Chapter 3 Ultra violet cured nano composite coatings
226
Considering Figure 3.45 it is possible to appreciate that all the different coatings
show a good stability during the 360 hours of continuous immersion. In
particular, PUD samples show values of the coating resistance quite higher than
the pure epoxy coating and the CL1_5 coating. However, the resistance
properties of CL2 samples are noticeably higher. As far as the dielectric
properties are concerned (see Figure 3.46), the PUD samples show stable and
low values of the relative dielectric permittivity. CL2_5 sample and the pure
epoxy resin show εR values comparable with PUD samples with a quite
stationary trend. Instead, CL1_5 and CL2_10 samples are characterized by
higher values of the relative dielectric permittivity, but it has to be underlined
that the starting values of εR of these samples is quite high, compared to the
other. In addition, the trends of the relative permittivity of CL1_5 and CL2_10
show an initial increase, followed by a decrease after a few days of continuous
immersion.
Despite these differences among the differently modified waterborne coatings,
the electrochemical properties of are very promising, considering that the
coatings are unpigmented and with limited thickness. Moreover, the metal
surface was not specifically pre-treated in order to improve the adhesion of the
coating, and therefore a further increase of the protective properties could be
obtained increasing the interface stability by pre-treating the metal surface.
The corrosion tests showed that the presence of MEMO and TEOS improves the
properties of the coatings, reducing, in particular, the water absorption and
increasing the ionic barrier properties.
Chapter 3 Ultra violet cured nano composite coatings
227
In addition, the electrochemical test carried out on the waterborne resins
containing the organo-modified nanoclays highlighted that the coatings having
exfoliated structures did not show any corrosion phenomena, with respect to
the intercalated systems and to the pure epoxy resin. In particular, the
exfoliated coatings showed extremely high ionic barrier properties proving the
importance of a correct functionalization of the nanofillers for good corrosion
protection of nano-composite coatings.

Chapter 3 Ultra violet cured nano composite coatings
228
Chapter 4 Conclusions
229
4 Conclusions and Future Works
Nanotechnology approach for the production of effective environmentally
friendly metals pre-treatments and organic coatings for the corrosion protection
was investigated in this Ph.D. thesis. Multifunctional silane hybrid molecules
were used to design and modify the final properties of sol-gel pre-treatments
and organic coatings.
In particular, an experimental mixture of hybrid silicon alkoxides molecules
was used for the production of sol-gel coating to protect aluminium and
galvanized steel. These sol-gel pre-treatments were tested as adhesion
promoters in combination with both powder and cataphoretic coatings for the
development of ecological complete protection systems with high
performances.
The results on aluminium (see 2.2.3) proved that the silane treatment provides
the substrate with an effective barrier against corrosion and, in addition, it acts
as a coupling agent improving the adhesion with an organic coating and, in
general, the corrosion protection properties. The comparison with other surface
conversion treatments/coatings highlighted that the experimental silane sol-gel
pre-treatment ensures always the best performances among the tested pre-
treatments. Considering the application onto galvanized steel, an effective
combination of silicon alkoxides, deposition procedure and curing temperature
Chapter 4 Conclusions
230
has been carried out to optimize the corrosion protection properties of the sol-
gel film itself and the interaction with both powder coating and cataphoretic
paints. On the hot dip galvanized substrate the deposition conditions were
considered more critical but, in spite of this, good results have been achieved
(see 2.3.2).
Covered with an organic coating and cured at high temperatures, the produced
silanes sol-gel pre-treatments act both as an efficient barrier against moisture
and oxygen permeation (relatively to their thickness) and also as a coupling
agent improving the corrosion resistance of the complete protection system.
Concerning the cataphoretic coating the experimental sol-gel treatment can be
properly designed to inhibit the hydrogen release leading to the formation of a
continuous and defect-free electrodeposited coating strongly bonded to the
substrate. As a further result, the barrier properties of the sol-gel coating itself
were improved adding montmorillonite nanoparticles to the silane mixtures
(see 2.4.2). The preliminary analysis demonstrated that the nanoparticles
modify the film formation mechanism leading to the formation of sol-gel
coating with enhanced properties.
The same hybrid molecules used to perform the sol-gel films were used to
modify UV curable water-borne coatings aiming, also in this case, to develop
environmentally friendly protection systems against corrosion. Silane hybrid
molecules were used to form in situ hybrid silica domains which were
demonstrated to slightly improve the barrier properties of the water-borne
coating (see 3.2.2).
Chapter 4 Conclusions
231
In addition, it was demonstrated (see 3.3.2) that the presence of conveniently
modified (with silane hybrid molecules) montmorillonite nanoparticles
improves the electrochemical properties of the water-borne organic coating.
Finally, in the light of the above mentioned experimental results, it can be
stated that by using an experimental mixture of hybrid silane molecules and
montmorillonite nanoparticles it was possible to produce effective
environmentally friendly sol-gel pre-treatments and that, by conveniently
modifying the structure of UV curable water-borne coatings with the same
molecules and nanoparticles it is possible to improve their corrosion protection
performances.
Despite the proposed solution for processing techniques of hybrid silicon
alkoxides molecules led, as proved throughout the thesis, to several interesting
results, a further investigation of the potential and the properties of silane sol-
gel coating as well as silicon alkoxides modified organic coatings is needed. For
instance, a finer investigation of the inner structure of sol-gel coating itself and
modified with montmorillonite nanoparticles can be useful to better understand
effect of the nanofiller on the physical and thermal properties of the hybrid
coating. In this sense, an optimization of the granulometric distribution of the
nanoparticles and their morphology can remarkably increase the properties of
the sol-gel coating. As far as the sol-gel pre-treatments are concerned, the
addition of a convenient corrosion inhibitor in the hybrid matrix can further
increase the efficiency and the performances of these materials as effective
solution against corrosion.
Chapter 4 Conclusions
232
On the other hand, the need of effective solutions for the industrialization of
these kinds of materials for production on large scale of silane pre-treated
manufacts can lead to different evolutions of the work, concerning the
optimization and simplification of the deposition process instead of a
mechanicistic study of the phenomena involved in the formation of the sol-gel
film.
Considering the other main topic of the thesis, which is the modification of UV
curable waterborne coatings with silicon alkoxides and nanoparticles, also in
this case a lot of different developments are possible. In particular, it would be
very useful to study of the mechanism of interaction between the nanoparticles
and the organically modified silicon alkoxides molecules as well to investigate
the properties of the polymer/nanoparticles interface, which is likely to be the
critical point for the performances of the final coating. In addition, a further
development of the studied materials would be the utilization of the
montmorillonite nanoparticles as a cations exchange materials to dope the clay
with cationic inhibitors of the corrosion reactions.
In conclusion, a combination of the experimental hybrid silane sol-gel pre-
treatment with the nanoparticles or in situ modified UV cured water-borne
coating is expected to be a very effective nanostructured environmentally
friendly protection system completely designed a priori to ensure a high degree
of protection against corrosion. And, as one would expect, it is the natural
development for this work.
References
233
References
[1] F. Deflorian, S. Rossi, L. Fedrizzi, Electrochim. Acta 51 (2006) 6097 [2] O. Lunder, J.C. Walmsley, P. Mack, K. Nisancioglu, Corros. Sci. 47 (2005)
1604 [3] T. Bellezze, G. Roventi, R. Fratesi, Surf. Coat. Technol. 155 (2002) 221 [4] F. W. Eppensteiner, M. R. Jennkind, Metal Finishing, 105 (2007) 413 [5] C. M. Caruana, Metal Finishing, 104 (2006) 44 [6] “Toxicological profile for Chromium”, U.S. Department of Health and
Human Services, Public Health Service, Agency for Toxic Substances and Disease Registry (2008). On website: www.atsdr.cdc.gov
[7] Focus on Pigments, 2 (2008) 6. On website: www.osha.org [8] E. Almeida, L. Fedrizzi, T.C. Diamantinio, Surf. Coat. Technol., 105 (1998)
97 [9] E. Almeida, T. C. Diamantino, M. O. Figueiredo, C. Sà, Surf. Coat. Technol.,
106 (1998) 8. [10] L. Lingjie, L. Jingle, Y. Shenghai, T. Yujing, J. Qiquan, P. Fusheng, J. Rare
Earths, 26 (2008) 383 [11] F. H. Scholes, C. Soste, A. E. Hughes, S. G. Hardin, P. R. Curtis, App. Surf.
Sci., 253 (2006) 1770 [12] P. Campestrini, H. Terryn, A. Hovestad, J.H.W. de Wit, Surf. Coat.
Technol., 176 (2004) 365 [13] X. Zhang, C. van den Bos, W.G. Sloof, A. Hovestad, H. Terryn, J.H.W. de
Wit, Surf. Coat. Technol., 199 (2005) 92 [14] J.H. Nordliena J.C. Walmsley, H. Østerberg, K. Nisancioglu, Surf. Coat.
Technol., 153 (2002) 72 [15] Y. Song, D. Shan, R. Chen, F. Zhang, E.-H. Han, Surf. Coat. Technol., 203
(2009) 1107 [16] I. Van Roy, H. Terryn, G. Goeminne, Coll. Surf., 136 (1998) 89 [17] M. N. Sathyanarayana, M. Yaseen, Prog. Org. Coat., 26 ( 1995) 275
References
234
[18] R. L. Twite, G. P. Bierwagen, Prog. Org. Coat., 33 (1998) 91 [19] F. Deflorian, S. Rossi, L. Fedrizzi, M. Fedel, Prog. Org. Coat., 63 (2008) 338 [20] H. Neuder, C. Sizemore, M. Kolody, R. Chiang, C.-T. Lin, Prog. Org. Coat.,
47 (2003) 225 [21] V. K. Gupta, N. Verma, Chem. Eng. Sci., 57 (2002) 2679 [22] H. Liebscher, Prog. Org. Coat., 40 (2000) 75 [23] M. A. Parra, D. Elustondo, R. Bermejo, J. M. Santamaría, Sci. Tot. Env., 407
(2009) 999 [24] Focus on Powder Coatings, 8 (2008) 6. On website: www.coatings.org.uk [25] J. Lindeboom, Prog. Org. Coat., 34 (1998) 147 [26] J. A. P. Coutinho, T. Vilela, P. Pereira, P. Pessoa, M. M. M. Santos, G. M.
Kontogeorgis, Chem. Eng. Res. Des., 83 (2005) 352 [27] K. Mańczyk, P. Szewczyk, Prog. Org. Coat., 44 (2002) 99 [28] S. Haseebuddin, R. Parmar, G. Waghoo, S. K. Ghosh, Prog. Org. Coat., 64
(2009) 446 [29] E. G. Belder, H. J. J. Rutten, D. Y. Perera, Prog. Org. Coat., 42 (2001) 142 [30] A. C. Rouw, Prog. Org. Coat., 34 (1998) 181 [31] F. Galliano, D. Landolt, Prog. Org. Coat., 44 (2002) 217 [32] V. Duecoffre, W. Diener, C. Flosbach, W. Schubert, Prog. Org. Coat., 34
(1998) 200 [33] H. Miao, Z. Huang, L. Cheng,W. Shi, Prog. Org. Coat., 64 (2009) 365 [34] A. Forsgren, Corrosion control through organic coatings, Taylor&Francis,
Boca Raton (2006) [35] H. Wang, J. Liu, S. Xu,W. Shi, Prog. Org. Coat., 65 (2009) 263 [36] V. Landry, B. Riedl, P. Blanchet, Prog. Org. Coat., 62 (2008) 400 [37] J. Z. Y. Wang, R. H. Bogner, Int. J. Pharm., 113 (1995) 113 [38] D. R. Baer, P. E. Burrows, A. A. El-Azab, Prog. Org. Coat., 47 (2003) 342 [39] K. L. Mittal (Ed.), Silanes and Other Coupling Agents, VSP, Utrecht (1992) [40] K. L. Mittal (Ed.), Silanes and Other Coupling Agents, Vol. 2, VSP, Utrecht
(2000) [41] K. L. Mittal (Ed.), Silanes and Other Coupling Agents, Vol. 3, VSP, Brill
(2004) [42] K. L. Mittal (Ed.), Silanes and Other Coupling Agents, Vol. 4, VSP,
Brill/Leiden (2007)
References
235
[43] K. L. Mittal (Ed.), Silanes and Other Coupling Agents, Vol. 5, VSP, Brill/Leiden (2009)
[44] S. K. Jayseelan, W. J. van Ooij, J. Adhesion Sci. Technol., 15 (2001) 967 [45] F. Deflorian, S. Rossi, L. Fedrizzi, Electrochim. Acta, 51 (2006) 6097 [46] M. G. S. Ferreira, R. G. Duarte, M. F. Montemor, A. M. P. Simoes,
Electrochim. Acta, 49 (2004) 2927 [47] E. P. Pluddemann, Composites, 1 (1970) 321 [48] D. Zhu, W.J. van Ooij, Corros. Sci., 45 (2003) 2177 [49] W. J. van Ooij, D. Zhu, M. Stacy, A. Seth, T. Mugada, J. Gandhi, P. Puomi,
Tsinghua Science & Technology, 10(2005) 639 [50] D. Zhu, W. J. van Ooij, Prog. Org. Coat., 49 (2004) 42 [51] E. P. Pluddemann, Silane coupling agents, 2nd ed., Plenum Press, New York
(1990). [52] Z. Pu, W. J. van Ooij, J. E. Mark, J. Adhes. Sci. Technol., 11 (1997) 29 [53] M. F. Montemor, A. M. Simões, M. G. S. Ferreira, B. Williams, H. Edwards,
Prog. Org. Coat., 38 (2000) 17 [54] D. Wang, G. P. Bierwagen, Prog. Org. Coat., 64 (2009) 327 [55] M. L. Abel, R. Joannic, M. Fayos, E. Lafontaine, S. J. Shaw, J. F. Watts, Int.
J. Adhes., 26 (2006) 16 [56] A. Franquet, H. Terryn, J. Vereecken, Appl. Surf. Sci., 211 (2003) 259 [57] L. Cecchetto, A. Denoyelle, D. Delabouglise, J.-P. Petit, Appl. Surf. Sci., 254
(2008) 1736 [58] J. Kron, G. Schottner, K.-J. Deichmann, Thin Solid Films, 392 (2001) 236 [59] H.-J. Kim, J. Zhang, R.-H. Yoon, R. Gandour, Surf. Coat. Technol., 188-189
(2004) 762 [60] F. J. Boerio, J. Williams, Applications Surf. Sci., 7 (1981) 19 [61] G. Li, X. Wang, A. Li, W. Wang, L. Zheng, Surf. Coat. Technol., 201 (2007)
9571 [62] J . Song, W. J. van Ooij, J. Adhesion Sci. Technol., 17 (2003) 2191 [63] J. M. Chovelon, L. E. L. Aarch, M. Charbonnier, M. Romand, J. Adhes., 50
(1995) 43 [64] M. Sheffer, A. Groysman, D. Mandler, Corros. Sci., 45 (2003) 2893 [65] K. H. Wu, C. M. Chao, T. F. Yeh, T. C. Chang, Surf. Coat. Technol., 201
(2007) 5782
References
236
[66] M. S. Donley, R. A. Mantz, A. N. Khramov, V. N. Balbyshev, L. S. Kasten, D. J. Gaspar, Prog. Org. Coat., 47 (2003) 401
[67] M. Fedel, M. Olivier, M. Poelman, F. Deflorian, S. Rossi, M.-E. Druart, Prog. Org. Coat., 66 (2009) 118
[68] P. H. Suegama, H. G. de Melo, A. A. C. Recco, A. P. Tschiptschin, I. V. Aoki, Surf. Coat. Technol., 202 (2008) 2850
[69] A. M. Cabral, R. G. Duarte, M. F. Montemor, M. L. Zheludkevich, M. G. S. Ferreira, Corros. Sci., 47 (2005) 896
[70] H. Wang, R. Akid, Corros. Sci., 50 (2007) 4491 [71] H. Wang, R. Akid, Corros. Sci., 50 (2008) 1142 [72] M. F. Montemor, M. G. S. Ferreira, Prog. Org. Coat., 63 (2008) 330 [73] M. F. Montemor, M. G. S. Ferreira, Electrochim. Acta, 52 (2007) 6976 [74] L. M. Palomino, P. H. Suegama, I. V. Aoki, M. F. Montemor, H. G. De
Melo, Corros. Sci., 51 (2009) 1238 [75] N. C. Rosero-Navarro, S. A. Pellice, A. A. Durán, M. Aparicio, Corros. Sci.,
50 (2008) 1283-1291 [76] M. F. Montemor, W. Trabelsi, S. V. Lamaka, K. A. Yasakau, M. L.
Zheludkevich, A. C. Bastos, M. G. S. Ferreira, Electrochim. Acta, 53 (2008) 5913
[77] P. H. Suegama, H. G. De Melo, A. A. C. Recco, A. P. Tschiptschin, I. V. Aoki, Surf. Coat. Technol., 202 (2008) 2850
[78] Y. Castro, B. Ferrari, R. Moreno, A. Durán, Surf. Coat. Technol., 182 (2004) 199-203
[79] Y. Castro, B. Ferrari, R. Moreno, A. Durán, Surf. Coat. Technol., 191 (2005) 228-235
[80] M. F. Montemor, A. M. Cabral, M. L. Zheludkevich, M. G. S. Ferreira, Surf. Coat. Technol., 200 (2006) 2875
[81] Z. W. Wicks Jr, F. N. Jones, S. P. Pappas, “Organic Coatings Science and Technology”, Wiley Interscience, New York (1999)
[82] N. S. Allen, J. Photochem. Photobiol. A: Chem., 100 (1996) 101 [83] F. Masson, C. Decker, T. Jaworek, R. Schwalm, Prog. Org. Coat., 39 (2000)
115 [84] C. Decker, T. Nguyen Thi Viet, D. Decker, E. Weber-Koehl, Polymer, 42
(2001) 5531 [85] T. Scherzer, A. Tauber, R. Mehnert, Vibr. Spectr., 29 (2002) 125
References
237
[86] C. Decker, C. Bianchi, D. Decker, F. Morel, Carbohydrate Polymers, 59 (2005) 57
[87] O. H. Lin, R. N. Kumar, H. D. Rozman, M. A. M. Noor, Carb. Polym., 59 (2005) 57
[88] U. Schubert, N. Hüsing, “Synthesis of inorganic materials”, 2nd ed, Wiley – VCH, Weinheim (2005)
[89] U. Bexell, T. M. Grehk, Surf. Coat. Technol., 201 (2007) 4734 [90] C. J. Brinker, G. W. Scherer, “Sol-Gel Science: The Physics and Chemistry
of Sol-Gel Processing”, Academic Press Inc, New York, (1990) [91] R. Krechetnikov, G. M. Homsy, J. Fluid Mech., 559 (2006) 429 [92] W. J. van Ooij, Proceedings ICEPAM 2004, Oslo, Norway, 16-18/2004, on
website: http://www.sintef.no (2004) [93] C. J. Brinker, A. J. Hurd, K. J. Ward “Ultrastructure Processing of Advanced
Ceramics”, (Eds. J. D. Mackenzie, D. R. Ulrich), Wiley, New York (1988) [94] F. Deflorian, S. Rossi, M. Fedel, Corrosion Eng. Sci. Tech. (2009) In press. [95] P. Campestrini, E. P. M. van Westing, J. H. W. de Wit, Electrochim. Acta,
46 (2001) 2631 [96] L. Fedrizzi, F. Deflorian, G. Boni, P. L. Bonora, E. Pasini, Prog. Org. Coat.,
29 (1996) 89 [97] J. L. Luo, C. J. Lin, Q. Yang, S.W. Guan, Prog. Org. Coat., 31 (1997) 289 [98] F. Deflorian, S. Rossi, L. Fedrizzi, P.L. Bonora, Prog. Org. Coat., 52 (2005)
279 [99] P. Campestrini, E. P. M. van Westing, A. Hovestad, J.H.W. de Wit,
Electrochim. Acta, 47 (2002) 1097 [100] I. De Graeve, J. Vereecken, A. Franquet, T. Van Schaftinghen, H. Terryn,
Prog. Org. Coat., 59 (2007) 224 [101] V. Lavaert, M. De Cock, M. Moors, E. Wettink, Prog. Org. Coat., 38
(2000) 213 [102] J. H. W. de Wit, “Corrosion mechanisms in theory and practice”, (Eds. P.
Marcus and G. Oudar), Marcel Dekker, New York (1995) [103] A. Amirudin and D. Thierry: Progr. Org. Coat., 26 (1995) 1 [104] F. Deflorian and L. Fedrizzi: J. Adhes. Sci. Technol., 1999, 13, 629. [105] L. Fedrizzi, A. Bianchi, F. Deflorian, S. Rossi, P.L. Bonora, Electrochim.
Acta, 47 (2002) 2159
References
238
[106] H. Asgari, M. R. Toroghinejad, M. A. Golozar, Appl. Surf. Sci., 253 (2007) 6769
[107] P. Puomi, H. M. Fagerholm, J. Adhesion Sci. Technol., 15 (2001) 869 [108] D. K. Owens, R. C. Wendt, J. Appl. Polym. Sci., 13 (1969) 1741 [109] L. M. Palomino, P. H. Suegama, I. V. Aoki, M. F. Montemor, H. G. De
Melo, Corros. Sci., 50 (2008) 1258 [110] F. Deflorian, L.Fedrizzi, J. Adhesion. Sci Technol., 13 (1999) 629 [111] A. Amirudin, D. Thierry, Prog. Org. Coat., 28 (1996) 59 [112] M.-G. Olivier, A.-P. Romano, C. Vandermiers, X. Mathieu, M. Poelman,
Prog. Org. Coat., 63 (2008) 323 [113] S. J. Garcia, M. T. Rodrıguez, R. Izquierdo, J. Suay, Prog. Org. Coat., 60
(2007) 303 [114] A.-P. Romano, M.-G. Olivier, C. Vandermiers, M. Poelman, Prog. Org.
Coat., 57 (2006) 400 [115] M. Poelman, M.-G. Olivier, N. Gayarre, J.-P. Petitjean, Prog. Org. Coat.,
54 (2005) 55 [116] S. I. Seok, J. H. Kim, K. H. Choi, Y. Y. Hwang, Surf. Coat. Technol., 200
(2006) 3468 [117] S. J. Garcıa, J. Suay, Prog. Org. Coat., 59 (2007) 251 [118] M. Fedel, M.-E. Druart, M. Olivier, M. Poelman, F. Deflorian, S. Rossi,
Prog. Org. Coat., Submitted (2009) [119] A. M. Cabral, W. Trabelsi, R. Serra, M. F. Montemor, M. L. Zheludkevich,
M. G. S. Ferreira Corros. Sci., 48 (2006) 3740 [120] P. L. Bonora, F. Deflorian, L. Fedrizzi, Electrochim. Acta, 41 (1996) 1073 [121] A. Di Gianni, E. Amerio, O. Monticelli, R. Bongiovanni, App. Clay Sci., 42
(2008) 116 [122] X. Li, S. Deng, H. Fu, G. Mu, Corros. Sci., 50 (2008) 3599 [123] H. Ardelean, I. Frateur, P. Marcus, Corros. Sci., 50 (2008) 1907 [124] F. Deflorian, S. Rossi, M. Fedel, C. Motte, Prog. Org. Coat., Submitted
(2009) [125] J. L. Lábár, Microsc. Anal., 75 (2002) 9 [126] M. Bethencourt, F. J. Botana, J.J. Calvino, M. Marcos, M. A. Rodriguez-
Chacon, Corros. Sci., 40 (1998) 1803 [127] A. M. Cabral, W. Trabelsi, R. Serra, M. F. Montemor, M. L. Zheludkevich,
M. G. S. Ferreira, Corros. Sci., 48 (2006) 3740
References
239
[128] H. Wang, R. Akid, Corros. Sci., 50 (2008) 1142 [129] A. Di Gianni, E. Amerio, O. Monticelli, R. Bongiovanni, App. Clay Sci., 42
(2008) 116 [130] “Radiation Curing, Science And Technology”, (Ed. S. P. Pappas), Plenum
Press, New York (1992) [131] Z. Wang, D. Gao, J. Yang, Y. Chen, J. Appl. Polym. Sci., 73 (1999) 2869 [132] F. Masson, C.Decker, Macromol. Mat. Eng., 288 (2003) 17 [133] A. V. Rao, D. S. Kanitkar, A. K. Parab, Progr. Org.Coat., 25 (1995) 223 [134] F. Deflorian, M. Fedel, A. DiGianni, R. Bongiovanni, S. Turri, Corrosion
Eng., Sci. Tech., 43 (2008) 81 [135] M. Dahm, H. Ehlert, F. Muller, H. Toepsch, H. Traubel, W. Wieczorrek,
"Polyurethane Handbook", (Ed. G. Oertel) Hanser, Munich (1994) [136] M. Dieterich, Progr. Org. Coat., 9 (1981) 281 [137] J. W. Rosthauser, K. Natchkamp, “Waterborne polyurethanes“, in
“Advances in Urethane Science and Technology“, (Eds. K.C. Frisch, D. Klempner), Shrewsbury: Rapra technology, Shawbury (1987)
[138] B. K. Kim, J. C Lee, J. Polym. Sci., Part A: Polym. Chem., 34 (1996) 1095 [139] S. Ramesh, K. Tharanikkarasu, G. N. Mahesh, G. Radhakrishnan, J.
Macromol. Sci.; C: Reviews, 38 (1998) 481 [140] J. E.Yang, J. S. Kong, S. W. Park, D. J. Lee, H. D. Kim, J. Appl. Polym. Sci.,
86 (2002) 2375 [141] C. R. Hegedus, A. G. Gilicinski, R. J. Haney, J. Coat. Technol., 68 (1996)
51 [142] R. G. Coogan, Progr. Org. Coat., 32 (1997) 51 [143] M. Melchiors, M. Sonntag, K, Kobusch, J. Eberhardt, Progr. Org. Coat., 40
(2000) 99 [144] Z. W. Wicks, D. A. Wicks, J. W. Rosthauser, Prog. Org. Coat., 44 (2002)
161 [145] R. Canteri, G. Speranza, M. Anderle, S. Turri, S. Radice, Surf. Interface
Anal., 35 (2003) 318 [146] Vernici Materiali Tecnologie Proprietà, (Ed. S. Turri), CEA Edizioni,
Milan (2007) [147] J. N. Murray, Progr. Org. Coat., 31 (1997) 255 [148] P. L. Bonora, F.Deflorian, L.Fedrizzi, Mat. Sci. Forum, 192 (1995) 267 [149] F. Mansfeld, Corrosion, 44 (1988) 856
References
240
[150] E. P. M. van Westing, G. M. Ferrari, J. H. W. De Wit, Corros. Sci., 34 (1993) 1511
[151] E. P. M. van Westing, G. M. Ferrari, J. H. W. De Wit, Corros. Sci., 36 (1994) 957
[152] F. Deflorian, L. Fedrizzi, S. Rossi, P. L. Bonora, Electrochim. Acta, 44 (1999) 4243
[153] D. M. Brasher, A. H. Kingsbury, J. Appl. Chem., 4 (1954) 62 [154] O. Ali, R. Azam, Prog. Org. Coat., 62 (2008) 293 [155] G. Schottener, Chem. Mater., 13 (2001) 3422 [156] A. Di Gianni, R. Bongiovanni, S. Turri, F. Deflorian, G. Malucelli, G.
Rizza, J. Coat. Technol. Res., In press, 6 (2009) 177. [157] F. Bauer, R. Mehnert, J. Polymer. Res., 12 (2005) 483 [158] M. Kending, J. Scully, Corrosion, 46 (1990) 22 [159] G. Grundmeier, W. Schmidt, M. Stratmann, Electrochim. Acta, 45 (2000)
2415 [160] S. C. Tjong, Mat. Sci. Eng., 53 (2006) 73 [161] L. Betega de Paiva, A. R. Morales, F. R. Valenzuela Diaz, Appl. Clay Sci.,
42 (2008) 8 [162] M. Kato, A. Usuki, “Polymer-clay Nanocomposite”, (Eds T.J. Pinnavaia,
G.W. Beall), J. Wiley, Chichester (2000) [163] T .Lan, T.J.Pinnavaia, Chem. Mater., 6 (1994) 2216 [164] P. B. Messersmith, E. P. Giannelis, Chem. Mater., 5 (1994) 1719 [165] T. Lan, P. D. Kaviratna, T. J. Pinnavaia, Chem. Mater., 7 (1995) 2144 [166] Y. Y. Wang, T. E. Hsieh, J. Mater. Sci., 42 (2007) 4451 [167] R. Bongiovanni, E. A. Turcato, A. Di Gianni, S. Ronchetti, Prog. Org.
Coat., 62 (2008) 336 [168] S. Ceccia, E. A. Turcato, P. L. Maffettone, R. Bongiovanni, Prog. Org.
Coat., 63, (2008) 110 [169] G. Malucelli, A. Di Gianni, F. Deflorian, M. Fedel, R. Bongiovanni,
Corros. Sci., 51, (2009) 1762 [170] J. V. Crivello, U. Valermann, J.Polym. Sci. Part A: Polym. Chem., 33
(1995) 2463. [171] G. Malucelli, Y. Chen, A. Priola, R. Dongiovanni, M. Sangermano, Mater.
Eng., 13 (2002) 99
References
241
[172] H. He, J. Duchet, J. Galy, J. F. Gerard, J. Colloid Interface Sci., 288 (2005) 171.
[173] A. M. Schanmugharaj, K.Y. Rhee, S. H. Ryu, J. Colloid Interface Sci., 298 (2006) 854.
[174] S. Skale, V. Dolecek, M. Slemnik, Prog. Org. Coat., 62 (2008) 387 [175] S. J. Garcıa, J. Suay, Corros. Sci., 49 (2007) 3256.


“Whenever a theory appears to you as the only possible one, take this as a sign that you have neither understood the theory nor the problem which it was intended to solve” Karl Popper