Environmental Water Management Plan – Wimmera River System · 2016-10-04 · The Wimmera River...
202
Environmental Water Management Plan – Wimmera River System Report prepared for: Department of Environment, Land, Water and Planning Report prepared by: Wimmera CMA October 2015
Transcript of Environmental Water Management Plan – Wimmera River System · 2016-10-04 · The Wimmera River...

Environmental Water Management Plan – Wimmera River System Report prepared for: Department of Environment, Land, Water and Planning Report prepared by: Wimmera CMA October 2015
Wimmera CMA
2
Revision and Distribution Version No. Description Issued to Issue date 1 Draft for Wimmera River
System expert and initial VEWH/DELWP/Mallee CMA review
Andrew Barton (Federation University), Rhonda Butcher (WEC), Chloe Wiesenfeld (VEWH), Suzanne Witteveen, Susan Watson (DEWLP), Peter Kelly, Louise Chapman (MCMA)
21 Jan 2015
2 Draft for internal review Tony Baker, Clare Wilson 4 June 2015
3 Draft for EWMP expert scientific review
Susan Watson, Suzanne Witteveen (DELWP), Terry Hillman, Jane Roberts
19 June 2015
4 Draft for interrnal review Dave Brennan 19 June 2015
5 Draft for internal review and signoff
Dave Brennan, Tony Baker 25 September 2015
6 Draft for stakeholder review
David Straccione (CEWO), Tori Perrin (VEWH), Murray Burns (Fisheries Victoria), Andrew Barton, Kym Wilson (GWMWater), Mark Urquhart, Mark Mellington (Parks Victoria), Glenn Rudolph (DELWP Regional), Peter Kelly, Louise Chapman (MCMA)
25 September 2015
7 Final to DELWP/MDBA Suzanne Witteveen 19 October 2015
Publication details Environmental Water Management Plan – Wimmera River System Date of publication: 20 October 2015 Author: Greg Fletcher Wimmera CMA acknowledges the region’s traditional owners and respects their continued connection to water land and community.
Acknowledgements The following individuals or groups have assisted in the preparation of this report. Suzanne Witteveen (DELWP) Susan Watson (DELWP) Dr Andrew Barton (Federation University/GWMWater) Dr Rhonda Butcher (Water’s Edge Consulting) Dr Jane Roberts Dr Terry Hillman However, it is acknowledged that the contents and views expressed within this report are those of the Wimmera Catchment Management Authority and do not necessarily reflect the views of the parties acknowledged below. DELWP GWMWater VEWH CEWO Mallee CMA Parks Victoria
Wimmera Catchment Management Authority www.wcma.vic.gov.au 24 Darlot Street Horsham VIC 3400 Telephone 03 5382 1544 Facsimile 03 5382 6076 Copyright © Wimmera Catchment Management Authority 2015 Disclaimer Publications produced by the Wimmera Catchment Management Authority may be of assistance to you, but the Wimmera Catchment Management Authority and its employees do not guarantee that the publication is without flaw of any kind or is wholly appropriate for your particular purpose and therefore disclaims all liability for any error, loss or other consequence which may arise from you relying on any information in any Wimmera Catchment Management Authority publication.

3
Executive Summary The Wimmera River System Environmental Water Management Plan (EWMP) sets out long-term objectives for environmental values of the Wimmera River System – a series of rivers, creeks and terminal lakes downstream of regulating weirs and reservoirs that comprise the Wimmera Mallee Headworks System. The EWMP is an important part of the environmental planning framework in Victoria. Based on sufficient inflows, it provides an indicative plan for environmental watering actions for the next decade. It can therefore be used by the Wimmera and Mallee CMAs, Victorian Environmental Water Holder, Commonwealth Environmental Water Office and Department of Environment, Land, Water and Planning with respect to environmental water planning over a variety of timescales. The EWMP complements existing strategic plans (catchment and waterway strategies) but is focussed on environmental water management so that these waterways can continue to provide the many environmental, social, cultural and economic values for the community. The following components are the main sections covered in the Wimmera River System EWMP and are briefly summarised. Wimmera River System The Wimmera River System is a large and geographically diverse system which experiences great variability in climate, in particular rainfall, which in turn influences water regimes for creeks, rivers and wetlands. Much of the land where the Wimmera River System is located is classified as Crown land as stream frontage or set aside as a reserve for nature conservation or water supply. Hydrology and System Operations The variability in rainfall leads to substantial fluctuations in streamflows although in general the Mediterranean climate means that streamflows are much lower (or non-existent) during summer and autumn, ramping up during early winter and then reducing in late spring. The series of storages, weirs and channels that comprise the Wimmera Mallee Headworks System are very effective at harvesting and transferring streamflows. This historically has created impacts to waterways due to severely reducing streamflows although now provides a number of opportunities to direct environmental water to a number of different waterways in the system. Water Dependent Values Given the Wimmera River System flows from the Grampians through to the Mallee, it supports diverse and abundant ecosystems reliant on water in what can be a very dry landscape. This includes a number of threatened flora species such as the Wimmera Bottlebrush as well as substantial tracts of riparian and wetland vegetation including iconic species like River Red Gum and Black Box. Water dependent fauna values are very important, including platypuses which have severely diminished in numbers. Other notable water-dependent fauna include threatened Freshwater Catfish and the large numbers of wetland birds, including migratory species that take advantages of the terminal lakes when they contain water for habitat and breeding. Ecological Condition and Threats On the whole, the Wimmera River System is in comparatively poor condition although there are locations and aspects that are in a much better state. Systemic issues around over-extraction have been compounded by poor water quality and impacts from exotic species (e.g. carp mumbling). That being said, a body of evidence is developing to show the improvement in conditions brought about by

4
intregrated waterway improvement works such as environmental water management, erosion control and riparian fencing. Ecological Objectives A series of ecological objectives over various timescales have been developed to guide the planning within the EWMP. They align with other strategic plans as well as incorporating knowledge gained from environmental watering implementation for over twenty years. These ecological objectives have been developed by waterway managers and scientific experts and endorsed by community representatives. Managing Risks to Achieving Ecological Objectives Environmental water management presents a number of challenges in terms of achieving the desired ecological objectives due to threats such as exotic species, instream infrastructure and saline groundwater intrusions. The risks associated with these threats are outlined and mitigation actions are prescribed. Demonstrating Outcomes In order to enable adaptive management and highlight the outcomes of environmental watering to stakeholders and the community, a comprehensive monitoring regime needs to be implemented. The monitoring regime needs to encompass the broad range of ecological objectives and so involves a range of endpoints. Consultation A variety of mechanisms have been used to gather information from stakeholders and the community on ecological objectives and observations from previous environmental watering events. This in turn has been incorporated into the EWMP, furthermore processes for consultation around future environmental watering events have been flagged. Knowledge Gaps Whilst environmental watering actions have been undertaken in the Wimmera for almost 30 years and a lot of information has been gathered, there remains a number of important questions that need answering – particularly building confidence around ecological responses to flows.
Wimmera River at Dimboola Weir, September 2009

5
Table of contents Executive Summary ......................................................................... 3
Table of contents ............................................................................. 5
1. Introduction ............................................................................... 7
1.1. Purpose of the Wimmera River System EWMP ........ 8
1.2. Scope of the Wimmera River System EWMP ........... 8
1.2.1. Policy links: Victorian Waterway Management Strategy, Wimmera Waterway Strategy and Mallee Waterway Strategy . 10
1.3. Development Process ............................................. 11
2. Wimmera River system .......................................................... 12
2.1. Region and Site Location ........................................ 12
2.2. Catchment Setting ................................................... 20
2.2.1. Climate ............................................................................. 20
2.2.2. Physical Features ........................................................... 21
2.3. Land Status and Waterway Management ............... 32
2.3.1. Waterway land status ..................................................... 32
2.3.2. Roles and Responsibilities with Respect to Environmental Watering within the Wimmera River System .. 35
2.4. Environmental Water Sources................................. 35
2.5. Legislative and Policy Framework ........................... 35
3. Hydrology and System Operations ........................................ 38
3.1. Waterway Hydrology ............................................... 38
3.2. Water Quality ........................................................... 47
3.3. System Operations – History of Use ....................... 48
4. Water Dependent Values ....................................................... 64
4.1. Water Dependent Environmental Values ................ 65
4.2. Ecosystem Functions .............................................. 72
4.3. Cultural Values ........................................................ 77
4.4. Social Values ........................................................... 77
4.5. Economic Values ..................................................... 78
4.6. Conceptualisation of the Wimmera River System... 78
4.7. Significance ............................................................. 85
5. Ecological Condition and Threats .......................................... 86
5.1. Context .................................................................... 86
5.2. Current Condition .................................................... 86
5.3. Water-Related Threats ............................................ 98
5.4. Condition Trajectory – Do Nothing Option .............. 99
6. Management Objectives ...................................................... 100

6
6.1. Management Goal ................................................. 100
6.2. Ecological Objectives ............................................ 100
6.3. Wimmera River System flow recommendations ... 109
6.4. Long-term water regime and hydrological objectives 109
7. Managing Risks Associated with Environmental Watering.. 123
8. Environmental Water Delivery Infrastructure ....................... 127
8.1. Infrastructure and Operational Constraints ........... 127
8.2. Addressing Flow Delivery Constraints .................. 128
8.3. Complementary Management Activities................ 130
9. Demonstrating Outcomes .................................................... 131
10. Consultation ......................................................................... 141
10.1. Consultation on EWMP Development ................... 141
10.2. Consultation on EWMP Implementation ............... 144
11. Knowledge Gaps and Recommendations ........................... 149
12. References ........................................................................... 150
13. Abbreviations, Acronyms and Glossary ............................... 154
Appendix 1 – Environmental Water Sources – Wimmera River System ......................................................................................... 156
Appendix 2 – Roles and Responsibilities with respect to Environmental Watering in the Wimmera River System ............. 157
Appendix 3 - Wimmera River System EWMP Consultation ........ 158
Appendix 4 – Fauna and Flora Species List ............................... 158
Appendix 5 – Environmental Water Recommendations ............. 179
Appendix 6 – Wimmera and Glenelg Rivers Environmental Entitlement: Environmental Water Sharing Rules (VEWH, 2014) 186
Appendix 7 – Recommendations from Management of Environmental Flows in and through Weir Pools (Alluvium, 2014) 190
Appendix 8 – Water Quality in the Wimmera River System ....... 191
Appendix 9 – Risk/Consequence Table ...................................... 194
7
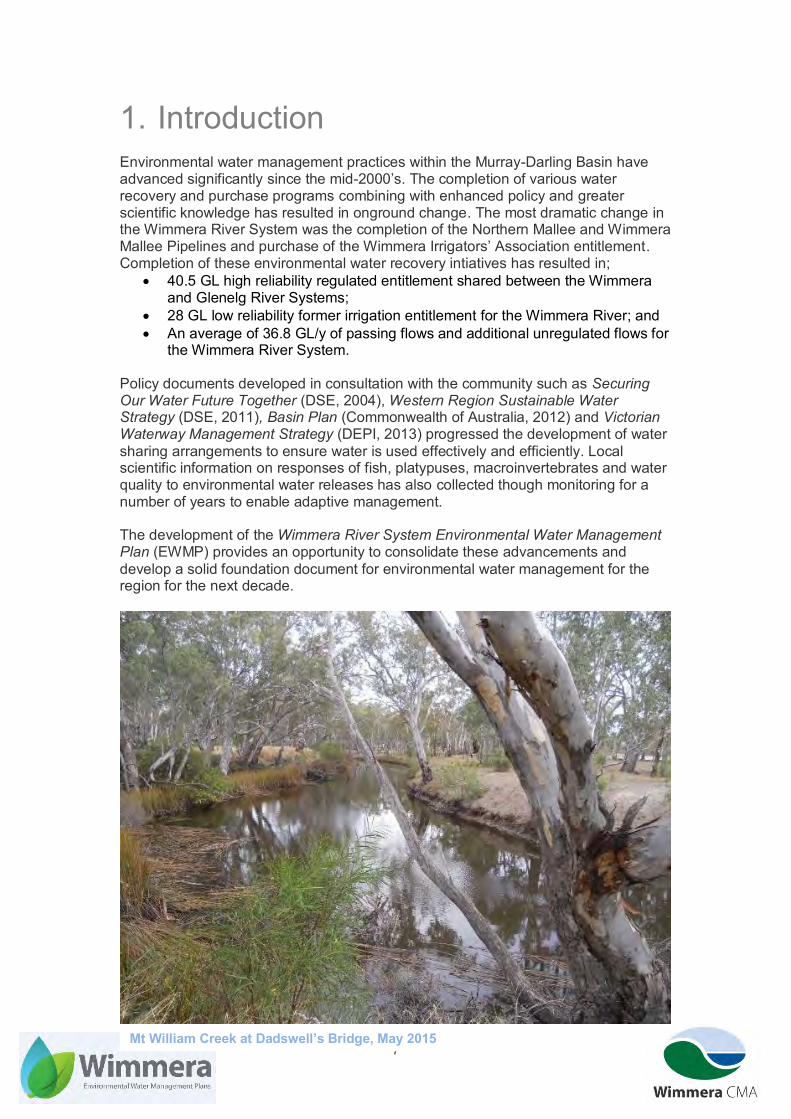
1. Introduction Environmental water management practices within the Murray-Darling Basin have advanced significantly since the mid-2000’s. The completion of various water recovery and purchase programs combining with enhanced policy and greater scientific knowledge has resulted in onground change. The most dramatic change in the Wimmera River System was the completion of the Northern Mallee and Wimmera Mallee Pipelines and purchase of the Wimmera Irrigators’ Association entitlement. Completion of these environmental water recovery intiatives has resulted in;
40.5 GL high reliability regulated entitlement shared between the Wimmera and Glenelg River Systems;
28 GL low reliability former irrigation entitlement for the Wimmera River; and An average of 36.8 GL/y of passing flows and additional unregulated flows for
the Wimmera River System. Policy documents developed in consultation with the community such as Securing Our Water Future Together (DSE, 2004), Western Region Sustainable Water Strategy (DSE, 2011), Basin Plan (Commonwealth of Australia, 2012) and Victorian Waterway Management Strategy (DEPI, 2013) progressed the development of water sharing arrangements to ensure water is used effectively and efficiently. Local scientific information on responses of fish, platypuses, macroinvertebrates and water quality to environmental water releases has also collected though monitoring for a number of years to enable adaptive management. The development of the Wimmera River System Environmental Water Management Plan (EWMP) provides an opportunity to consolidate these advancements and develop a solid foundation document for environmental water management for the region for the next decade.
Mt William Creek at Dadswell’s Bridge, May 2015

8
1.1.Purpose of the Wimmera River System EWMP The Wimmera River System EWMP is a 10 year management plan that:
describes the ecological values present; and sets long-term ecological goals for the river system, in particular ecological
objectives and the recommended flow regime required to attain them as well as being cognizant of the risks and influences involved in environmental watering.
The purpose of the Wimmera River System EWMP is to: synthesise technical information relating to environmental values, condition,
hydrology, threats and water resource infrastructure; identify the long-term ecological objectives and their water requirements for
regulated waterways within the Wimmera River System; provide a vehicle for community consultation, including setting of long-term
objectives and water requirements of these waterways; operationalise flow studies, including providing guidance on the
environmental watering targets appropriate under different seasonal conditions to inform the development of Seasonal Watering Proposals and Plans; and
inform the Long-term Watering Plan for the Wimmera-Mallee Water Resource Plan area, as required under the Basin Plan (Chapter 8).
Wimmera CMA has been funded through the Department of Environment, Land, Water and Planning (DELWP) ‘Victorian Basin Plan Environmental Water Management Plan (EWMP) Program’ to develop this EWMP for the Wimmera River System. Developing this EWMP is a management activity specified in the Wimmera Waterway Strategy (Wimmera CMA, 2014) and Mallee Waterway Strategy (Mallee CMA, 2014).
1.2. Scope of the Wimmera River System EWMP The Wimmera River System EWMP covers what is collectively defined as the regulated ‘Wimmera River System’ (see Figure 1-1). It includes the Wimmera River, MacKenzie River, Mt William Creek, Burnt Creek and Bungalally Creek where flows can be managed by weirs and regulators enabling the delivery of environmental water. Yarriambiack Creek, a distributary of the Wimmera River, is part of the system as it is directly affected by environmental water releases down the Wimmera River. Although floods are the main factor, regulation of upstream waterways also influences the water regimes of the terminal lakes of the Wimmera River and Yarriambiack Creek and so they are also included within this EWMP. The EWMP has been developed in consultation with the community as well as involving input from experts in waterway ecology and water resource management to provide a robust and thorough planning document for the next decade. It will form the basis for future Seasonal Watering Proposals for the Wimmera River System.

9
Figure 1-1 Wimmera River System covered in this EWMP

10
1.2.1.Policy links: Victorian Waterway Management Strategy, Wimmera Waterway Strategy and Mallee Waterway Strategy
The Victorian Waterway Management Strategy (VWMS) (DEPI, 2013) provides a single and updated framework for managing waterway health in Victoria. The focus of the VWMS is on improving the environmental condition of waterways so that they can support community needs and strengthen partnerships between government and the community.
One of the key discussion points in the VWMS is more efficient and effective use of environmental water to maximise outcomes. The development of a series of EWMPs for rivers and wetlands reflects policy in the VWMS to set ecological objectives and targets for priority sites for environmental water delivery. This includes providing information on recommended watering regimes as well as regarding management arrangements and delivery constraints.
Following the launch of the VWMS, the Wimmera Waterway Strategy (WWS) (Wimmera CMA, 2014) and Mallee Waterway Strategy (MWS) (Mallee CMA, 2014) were developed which included actions prescribing the development of an EWMP for regulated reaches of the Wimmera River System within their respective jursidictions. This EWMP reflects these decisions, and complements the regional target setting and management activities set out in the WWS and MWS to facilitiate the integrated planning regarding waterway management in the Wimmera and southern Mallee.
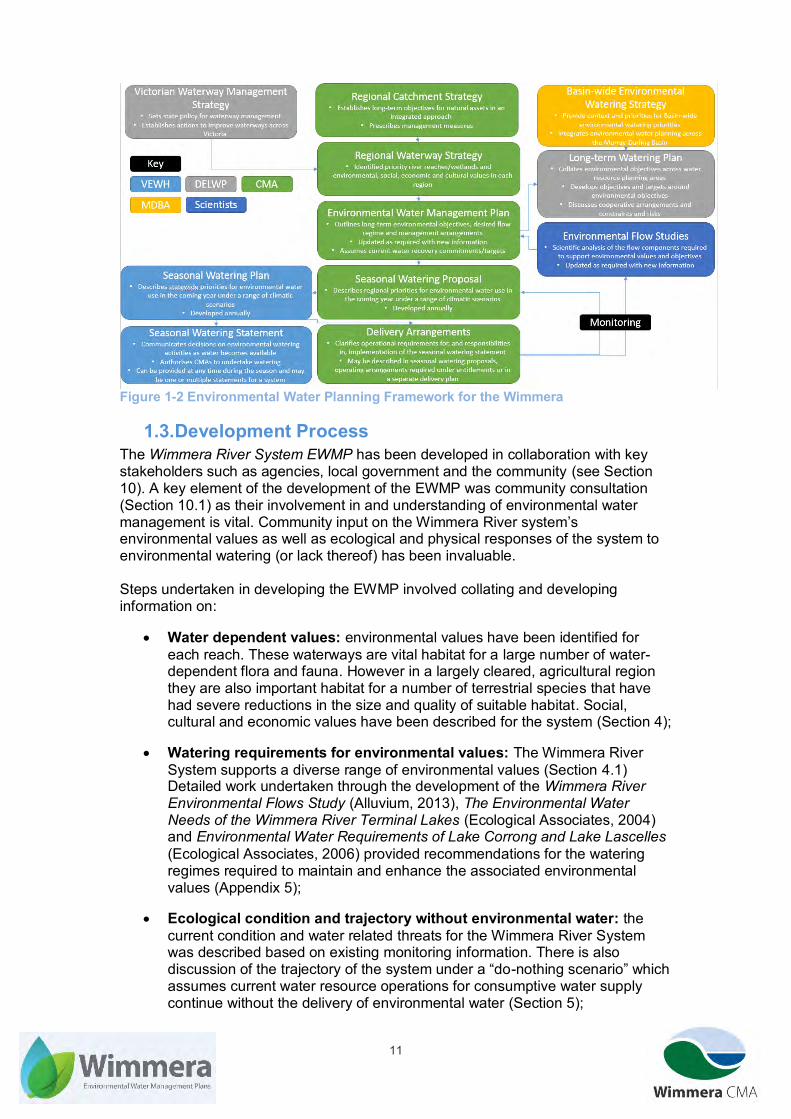
The context of EWMPs in the broader environmental water planning framework in Victoria is illustrated in Figure 1-2.
Wimmera River at Horseshoe Bend, June 2007
11
Figure 1-2 Environmental Water Planning Framework for the Wimmera
1.3.Development Process The Wimmera River System EWMP has been developed in collaboration with key stakeholders such as agencies, local government and the community (see Section 10). A key element of the development of the EWMP was community consultation (Section 10.1) as their involvement in and understanding of environmental water management is vital. Community input on the Wimmera River system’s environmental values as well as ecological and physical responses of the system to environmental watering (or lack thereof) has been invaluable. Steps undertaken in developing the EWMP involved collating and developing information on:
Water dependent values: environmental values have been identified for each reach. These waterways are vital habitat for a large number of water-dependent flora and fauna. However in a largely cleared, agricultural region they are also important habitat for a number of terrestrial species that have had severe reductions in the size and quality of suitable habitat. Social, cultural and economic values have been described for the system (Section 4);
Watering requirements for environmental values: The Wimmera River System supports a diverse range of environmental values (Section 4.1) Detailed work undertaken through the development of the Wimmera River Environmental Flows Study (Alluvium, 2013), The Environmental Water Needs of the Wimmera River Terminal Lakes (Ecological Associates, 2004) and Environmental Water Requirements of Lake Corrong and Lake Lascelles (Ecological Associates, 2006) provided recommendations for the watering regimes required to maintain and enhance the associated environmental values (Appendix 5);
Ecological condition and trajectory without environmental water: the current condition and water related threats for the Wimmera River System was described based on existing monitoring information. There is also discussion of the trajectory of the system under a “do-nothing scenario” which assumes current water resource operations for consumptive water supply continue without the delivery of environmental water (Section 5);

12
Management objectives: This EWMP outlines the long-term ecological goal and underpinning objectives for the Wimmera River system that have been developed based on ecological values, monitoring information, hydraulic and hydrologic modelling and community consultation (Section 6.1). The goal is aligned with goals and targets developed within other strategic documents such as the Wimmera Regional Catchment Strategy (RCS) 2013-19 (Wimmera CMA, 2013), WWS, MWS and long-term watering plans developed under the Basin Plan ;
Managing risks: long-term risks to achieving objectives have been identified and assessed. Management activities to mitigate these risks have been developed and included as complementary management activities (Section 7). Risks associated with delivering environmental water and actions to mitigate risks are prescribed in Seasonal Watering Proposals based on guidance from the VEWH;
Environmental water delivery infrastructure: details around the infrastructure used to deliver environmental water to the Wimmera River System (including constraints) have been described (Section 8);
Demonstrating outcomes: in order to show the worth of environmental watering activities it is necessary to demonstrate the outcomes it has achieved. Therefore this EWMP prescribes monitoring activities to enable the outcomes of environmental watering to be shown. Monitoring information is also critical in enabling adaptive management to occur which will enable environmental water to continute to be used as efficiently and effectively as possible (Section 9);
Knowledge gaps and recommendations: whilst significant work has been undertaken to improve the collective understanding of physical and ecological responses to environmental water there are still a number of key knowledge gaps that have been identified as needing to be filled to improve environmental water management (Section 11); and
Process and timelines for water planning and delivery: documenting a clear and transparent process and timeline for environmental water planing is critical to provide clarity for those involved in environmental water planning and the community (Appendix 6).
This EWMP has also undergone a series of external reviews by stakeholders and external experts.
2. Wimmera River system 2.1. Region and Site Location
The Wimmera CMA region covers approximately 23,500 km or 13% of Victoria and is largely cleared for agriculture although there are sizeable tracts of public land including the Grampians and Little Desert National Parks, the Black Range and Mt Arapiles-Tooan State Parks as well as the Pyrenees and Mt Cole State Forests. About 50,000 people live in the region with most of the region’s income derived from agriculture (dryland cropping and sheep grazing) (Wimmera CMA, 2013). The part of the Mallee CMA region that is included in this EWMP is typically flat broadacre cropping country in the southern Mallee.

13
The Wimmera River System is defined within this EWMP as the series of regulated waterways shown in Figure 1-1 and described following that are located in the Wimmera CMA region and the southern part of the Mallee CMA region. A number of these waterways are broken into separate ‘reaches’ for planning purposes based on a major hydrologic influence (e.g. confluence or water harvesting infrastructure). Section 3.3 discusses key hydrological features in more detail and includes schematics of sections of the Wimmera River System.
Wimmera River downstream of Huddleston’s Weir o Reaches 2/3 – Huddleston’s Weir to MacKenzie River o Reach 4 – MacKenzie River to Lake Hindmarsh o Terminal Lakes and Outlet Creek
The Wimmera River commences in the Pyrenees north-east of Ararat, flowing north-west out of state forest through undulating grazing and cropping country where a number of tributaries such as Concongella, Heifer Station and Mt Cole Creeks provide significant streamflows during wet conditions. Huddleston’s Weir near Dadwell’s Bridge marks the first major river regulation infrastructure (Section 3.2.1) (Figure 2-2). Several kilometres downstream it receives inflows from Mt William and Golton Creeks as well as regulated releases from the Taylor’s Lake Outlet Channel. The offtake to the Yarriambiack Creek is located about two hundred metres downstream of the Taylor’s Lake Outlet Channel which takes a portion of the Wimmera River’s flow north. Located close to Horsham, the Burnt Creek, MacKenzie River and Norton Creek are the most downstream significant tributaries. Then the river’s direction becomes more northerly, flowing past Dimboola and Jeparit to Lake Hindmarsh, Victoria’s largest freshwater lake. Several years of well above average rainfall are required to generate sufficient inflows to fill Lake Hindmarsh. When Lake Hindmarsh fills, it overflows into Outlet Creek which connects with Lake Albacutya, another large lake and Ramsar-listed wetland. In exceptionally wet conditions (several times a century) Lake Albacutya fills and overflows into another reach of Outlet Creek which in turn supplies a number of smaller wetlands (e.g. Lake Brambuk, Leg of Mutton Lake). Beyond this, the true terminal lake of the Wimmera River is the Wirrengren Plain in the southern Mallee (Figure 2-1). Much of the Wimmera River is characterised by deep pools in particular in Reach 4 from Quantong through Wail to Dimboola (Figure 2-3). Although there are anastomosing sections where larger flows (i.e. winter/spring freshes and greater) pass along multiple channels. One such location near Longerenong and Lubeck resulted from a several kilometre long section where reaches of the Mt William Creek and Wimmera River flow in parallel have avulsed (SKM, 2002) (Figure 2-2). Another, near Natimuk is due to the presence of a ridge of ferruginised sandstone which has resisted erosion (Earth Tech, 2005). Lake Hindmarsh and Lake Albacutya are deflation basins with a lunette on the prevailing downwind (eastern) side. Lake Hindmarsh and Albacutya are Victoria’s two largest (by area) natural freshwater lakes and so provide massive expanses of habitat when they contain water. When full, Lake Albacutya is up to 8m deep whereas Lake Hindmarsh is only up to about 3.4m deep (Ecological Associates, 2004).

14
Figure 2-1. Wimmera River Terminal Lakes System
Mt William Creek o Upper Mt William Creek – downstream of Mokepilly to Lake Lonsdale o Lower Mt William Creek - downstream of Lake Lonsdale to Wimmera
River

15
The Mt William Creek is the main tributary of the Wimmera in terms of streamflows, collecting runoff from the north-eastern Grampians and north-west Black Range (near Stawell). The upper Mt William Creek flows into Lake Lonsdale, between Stawell and Hall’s Gap. Whilst there are no major water harvesting points or environmental water delivery points along the upper Mt William Creek upstream of Lake Lonsdale, a refuge pool at Mokepilly has been watered via a tributary bisecting the Lake Fyans Outlet Channel. When Lake Lonsdale contains sufficient water, environmental water releases can take place into the lower Mt William Creek which flows north towards Dadwell’s Bridge (Figure 2-2). North of Dadswell’s Bridge, the creek bifurcates with the eastern channel taking all low-medium flows through to the Big Pipe outfall into the Wimmera River near Huddleston’s Weir. High flows (beyond regulated release volumes) engage both channels, with the western channel entering the Wimmera River near Lubeck. Several kilometres of the lower Mt William Creek closest to Lake Lonsdale has been channelised and straightened to enhance its ability to transfer water to other parts of the headworks system. This limits its habitat values. Further downstream and especially in the western branch, habitat values are better with a chain-of-ponds sequence remaining (Earth Tech, 2007).
Mt William Creek at Lake Lonsdale Tailgauge, October 2009

16
Figure 2-2. Mt William Creek and Reach 2/3 of the Wimmera River
Yarriambiack Creek Yarriambiack Creek is a distributary of the Wimmera River which flows over 120 km north to a series of terminal lakes in the southern Mallee near Hopetoun, most notably Lake Corrong and Lake Lascelles (Figure 2-3). Modifcations to the offtake from the Wimmera River means that it receives a varying proportion of flow depending on flows in the Wimmera River. Large flood flows are required to reach the end of the creek with low-medium flows over winter/spring rarely reaching Warracknabeal. The creek’s channel reflects this reduction of flow along its length, from becoming increasingly ill-defined and meandering on an alluvial floodplain within

17
a narrow channel further downstream. Sediment deposition from flood events is gradually filling the channel (KBR, 2004).
Figure 2-3. Wimmera River and Yarriambiack Creek

18
The terminal lakes of the Yarriambiack Creek are deflation basins with Lake Corrong having a pronounced double lunette and others (Lake Lascelles, Yarrack Swamp, Thistle Lake etc.) with more muted lunettes (Ecological Associates, 2006). Lake Corrong is just over 4m deep at its deepest point (Ecological Associates, 2006). Lake Lascelles has had an embankment constructed around parts of its perimeter to enhance its former role as a water storage and so can only be supplied by the Wimmera Mallee Pipeline rather than from the Yarriambiack Creek.
Burnt Creek o Upper Burnt Creek – downstream of Distribution Heads to Toolondo
Channel o Lower Burnt Creek – downstream of Toolondo Channel to Wimmera
River Burnt Creek is a tributary of the Wimmera River, its upper reach has been modified to act as a transfer channel commencing at Distribution Heads in Laharum where a regulator supplies flows from the upper MacKenzie River and Moora Channel (Figure 2-5). At Wonwondah, the Toolondo Channel intercepts flows from the upper Burnt Creek for supply to Taylor’s Lake. A regulator can release water into the lower Burnt Creek from the Toolondo Channel which flows north, entering the Wimmera River at Horsham. The geomorphic character of upper Burnt Creek has been modified by frequent water transfers between headworks storages leading to incision and loss of the chain of ponds, although there are still some sizable pools at its most downstream section (Figure 2-4). The lower Burnt Creek has a section about 15 km long that contains an intact chain-of-ponds morphology, however between the Western Highway and Wimmera River it has largely been channelised to improve drainage (Earth Tech, 2005).
Figure 2-4. Chain of ponds geomorphology at lower Burnt Creek
Bungalally Creek Bungalally Creek is a high-flow channel that flows north-west from the Burnt Creek at Wonwondah to the MacKenzie River at Haven, south-west of Horsham (Figure 2-5).

19
Whilst high-flows from the Burnt Creek can still enter the Bungalally Creek (above regulated release volumes), a regulator in the Toolondo Channel provides a mechanism to deliver regulated flows as the southern half of the creek was previously a stock and domestic distribution channel. In general the Bungalally Creek has a small channel which can be ill-defined in places, reflective of its historically episodic hydrology.
Figure 2-5. MacKenzie and Wimmera Rivers, Burnt Creek and Bungalally Creek

20
MacKenzie River o Reach 1 – Lake Wartook to Dad and Dave Weir o Reach 2 – Dad and Dave Weir to Distribution Heads o Reach 3 – Distribution Heads to Wimmera River
The MacKenzie River flows north-west from the northern Grampians though Wartook, Laharum and McKenzie Creek into the Wimmera River at Lower Norton, southwest of Horsham (Figure 2-5). Lake Wartook, Dad and Dave Weir and Distribution Heads regulate flows in the river for consumptive and environmental demands. A number of small tributaries enter the river as it flows through the Grampians. At Distribution Heads its flows can be directed to the Burnt Creek. Bungalally Creek enters the MacKenzie River at Haven, several kilometres upstream of its confluence with the Wimmera River. The Reach 1 and 2 of the MacKenzie River has rocky stretches, transitioning to pools and runs downstream. Reach 3 is characterised by an intact discontinuous anastomosing channel form noted as unique in Victoria, with the only other examples noted as occurring in the Mt Lofty Ranges in South Australia (Earth Tech, 2004).
2.2.Catchment Setting 2.2.1.Climate
The Wimmera’s climate is typically semi-arid with average annual rainfall ranging from approximately 713 mm/y in the south at Woohlpooer (near the Glenelg River catchment) to 392 mm/y in the north at Warracknabeal. However in elevated areas (Grampians and Pyrenees) average annual rainfall is higher (1150 mm/y for Mt William). However climate change is leading to a series of what would be drier than average years compared to historic averages (Timbal, et al., 2015). Rainfall is extremely variable from year to year, for example annual rainfall totals for the Longerenong (near Horsham) vary from 190.3 mm (1982) to 810.3 mm (1973) (Figure 2-6).
Figure 2-6 Annual rainfall totals for Longerenong (near Horsham) (Source: Bureau of Meteorology) Average daily maximum temperatures vary from 30ºC in January and February down to 13.2ºC in July at Longerenong. Maximum temperatures can often exceed 40ºC during summer and from November to late March maximum temperatures are frequently above 30ºC. From late autumn through winter and into early spring minimum temperatures average between 3ºC to 5ºC with mininmum termperatures regularly falling below 0ºC. Across the region average maximum temperatures are higher by approximately 1ºC in ther north of the Wimmera compared to the south although average minimum temperatures are relatively consistent.
21
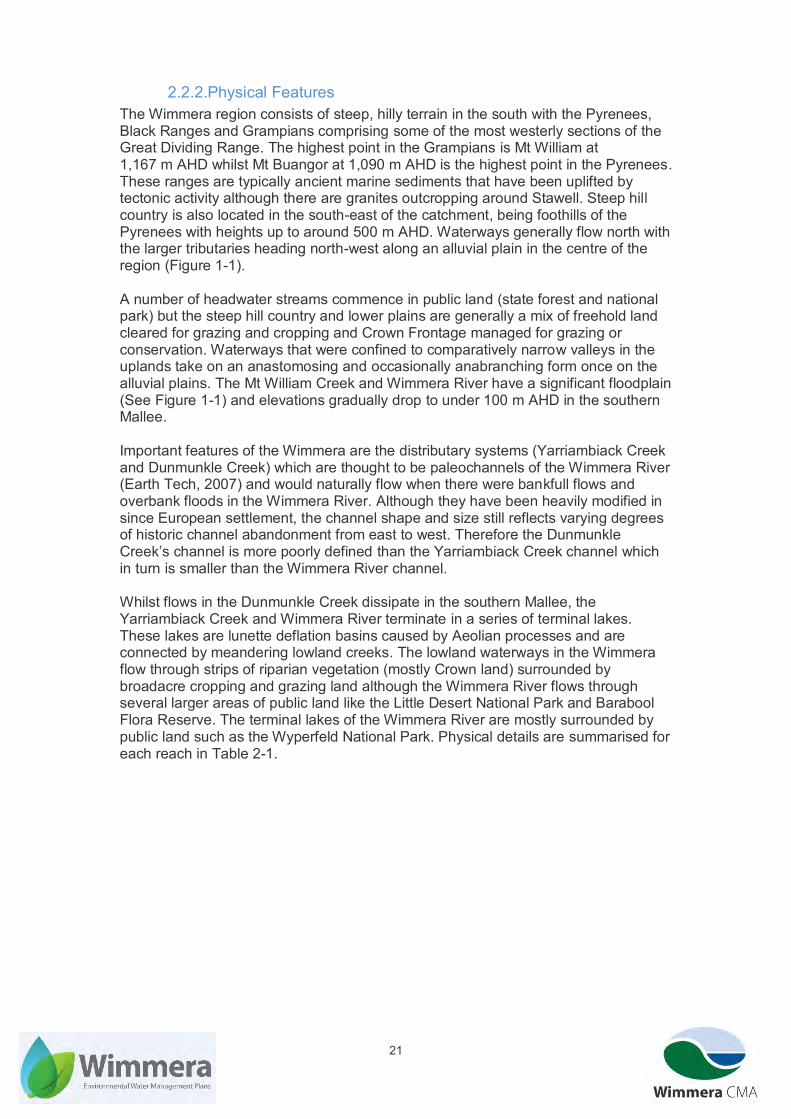
2.2.2.Physical Features The Wimmera region consists of steep, hilly terrain in the south with the Pyrenees, Black Ranges and Grampians comprising some of the most westerly sections of the Great Dividing Range. The highest point in the Grampians is Mt William at 1,167 m AHD whilst Mt Buangor at 1,090 m AHD is the highest point in the Pyrenees. These ranges are typically ancient marine sediments that have been uplifted by tectonic activity although there are granites outcropping around Stawell. Steep hill country is also located in the south-east of the catchment, being foothills of the Pyrenees with heights up to around 500 m AHD. Waterways generally flow north with the larger tributaries heading north-west along an alluvial plain in the centre of the region (Figure 1-1). A number of headwater streams commence in public land (state forest and national park) but the steep hill country and lower plains are generally a mix of freehold land cleared for grazing and cropping and Crown Frontage managed for grazing or conservation. Waterways that were confined to comparatively narrow valleys in the uplands take on an anastomosing and occasionally anabranching form once on the alluvial plains. The Mt William Creek and Wimmera River have a significant floodplain (See Figure 1-1) and elevations gradually drop to under 100 m AHD in the southern Mallee. Important features of the Wimmera are the distributary systems (Yarriambiack Creek and Dunmunkle Creek) which are thought to be paleochannels of the Wimmera River (Earth Tech, 2007) and would naturally flow when there were bankfull flows and overbank floods in the Wimmera River. Although they have been heavily modified in since European settlement, the channel shape and size still reflects varying degrees of historic channel abandonment from east to west. Therefore the Dunmunkle Creek’s channel is more poorly defined than the Yarriambiack Creek channel which in turn is smaller than the Wimmera River channel. Whilst flows in the Dunmunkle Creek dissipate in the southern Mallee, the Yarriambiack Creek and Wimmera River terminate in a series of terminal lakes. These lakes are lunette deflation basins caused by Aeolian processes and are connected by meandering lowland creeks. The lowland waterways in the Wimmera flow through strips of riparian vegetation (mostly Crown land) surrounded by broadacre cropping and grazing land although the Wimmera River flows through several larger areas of public land like the Little Desert National Park and Barabool Flora Reserve. The terminal lakes of the Wimmera River are mostly surrounded by public land such as the Wyperfeld National Park. Physical details are summarised for each reach in Table 2-1.

22
Table 2-1 Physical Characteristics of Reaches within the Wimmera River System Wimmera River – Reaches 2/3 – Huddleston’s Weir to MacKenzie River Reach Distance 60 km Notable Tributaries Mt William Creek, Golton Creek, Burnt Creek, MacKenzie River,
Yarriambiack Creek (distributary) Geomorphic Character Anabranching – fine grained Stream Order 8 Indicative channel size 30m wide, 5m deep Bioregion Wimmera Adjacent landuse Mostly Crown Frontage adjacent to broadacre agriculture land with some
areas within Flora Reserve (Barabool) and urban (Horsham) areas. Flow regime Seasonal-Intermittent Major modifications Huddleston’s Weir, Yarriambiack Creek Offtake, Horsham Weir
Wimmera River at Riverside – September 2015
Wimmera River at Old Longerenong Weir – August 2010

23
Wimmera River - Reach 4 – MacKenzie River to Lake Hindmarsh Reach Distance 126.8 km Notable Tributaries Norton Creek Geomorphic Character Alluvial continuous – meandering sand bed/moderate-low sinuosity,
Anabranching – fine grained Stream Order 8 Indicative channel size 30m wide, 5m deep Bioregion Wimmera and Murray Mallee Adjacent landuse Mostly Crown Frontage adjacent to broadacre agriculture land with some
areas within National Park/State Forest (Little Desert/Wail) and urban (Dimboola, Jeparit) areas.
Flow regime Seasonal-Intermittent Major modifications Dimboola Weir, Jeparit Weir
Wimmera River at Ellis’ Crossing – May 2015
Wimmera River at Ellis Crossing – September 2009
24
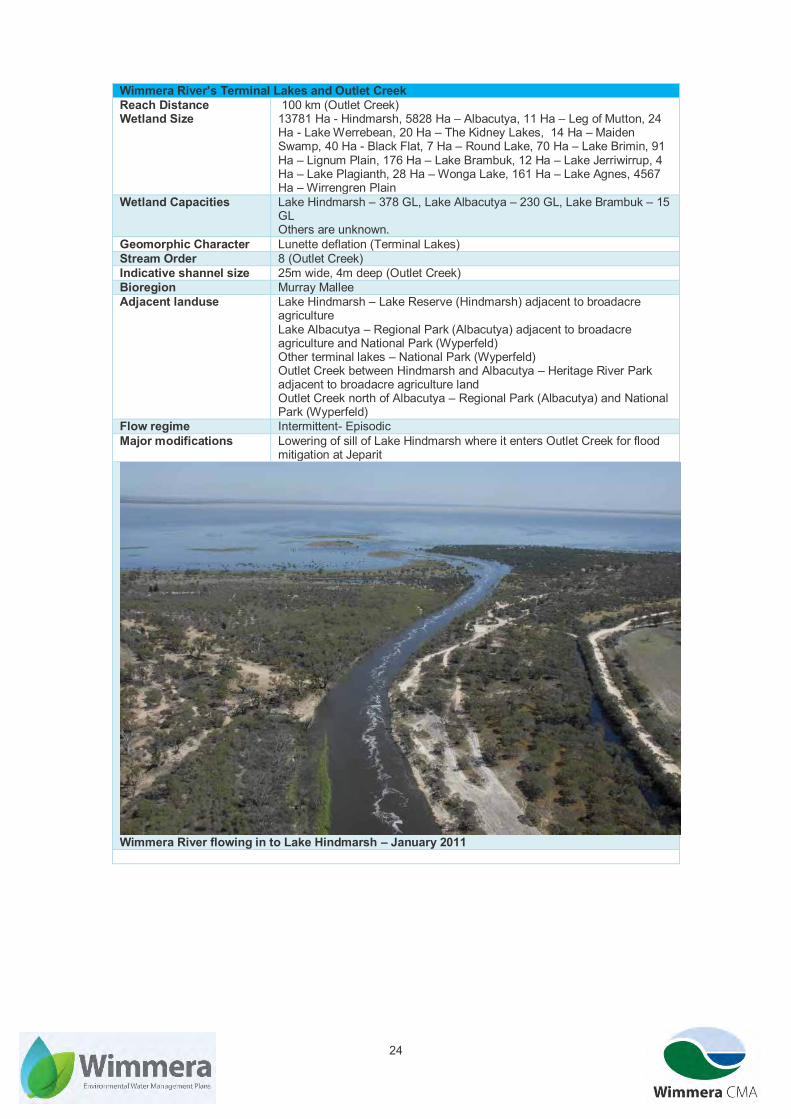
Wimmera River’s Terminal Lakes and Outlet Creek Reach Distance Wetland Size
100 km (Outlet Creek) 13781 Ha - Hindmarsh, 5828 Ha – Albacutya, 11 Ha – Leg of Mutton, 24 Ha - Lake Werrebean, 20 Ha – The Kidney Lakes, 14 Ha – Maiden Swamp, 40 Ha - Black Flat, 7 Ha – Round Lake, 70 Ha – Lake Brimin, 91 Ha – Lignum Plain, 176 Ha – Lake Brambuk, 12 Ha – Lake Jerriwirrup, 4 Ha – Lake Plagianth, 28 Ha – Wonga Lake, 161 Ha – Lake Agnes, 4567 Ha – Wirrengren Plain
Wetland Capacities Lake Hindmarsh – 378 GL, Lake Albacutya – 230 GL, Lake Brambuk – 15 GL Others are unknown.
Geomorphic Character Lunette deflation (Terminal Lakes) Stream Order 8 (Outlet Creek) Indicative shannel size 25m wide, 4m deep (Outlet Creek) Bioregion Murray Mallee Adjacent landuse Lake Hindmarsh – Lake Reserve (Hindmarsh) adjacent to broadacre
agriculture Lake Albacutya – Regional Park (Albacutya) adjacent to broadacre agriculture and National Park (Wyperfeld) Other terminal lakes – National Park (Wyperfeld) Outlet Creek between Hindmarsh and Albacutya – Heritage River Park adjacent to broadacre agriculture land Outlet Creek north of Albacutya – Regional Park (Albacutya) and National Park (Wyperfeld)
Flow regime Intermittent- Episodic Major modifications Lowering of sill of Lake Hindmarsh where it enters Outlet Creek for flood
mitigation at Jeparit
Wimmera River flowing in to Lake Hindmarsh – January 2011
25
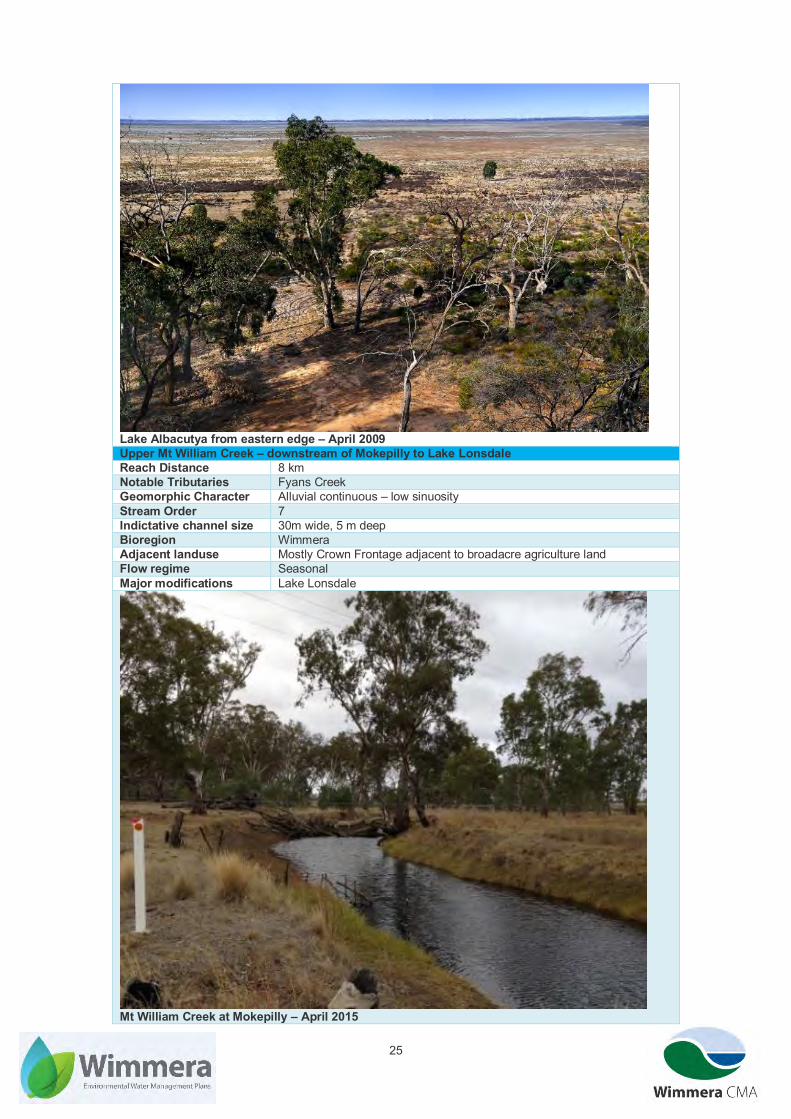
Lake Albacutya from eastern edge – April 2009 Upper Mt William Creek – downstream of Mokepilly to Lake Lonsdale Reach Distance 8 km Notable Tributaries Fyans Creek Geomorphic Character Alluvial continuous – low sinuosity Stream Order 7 Indictative channel size 30m wide, 5 m deep Bioregion Wimmera Adjacent landuse Mostly Crown Frontage adjacent to broadacre agriculture land Flow regime Seasonal Major modifications Lake Lonsdale
Mt William Creek at Mokepilly – April 2015

26
Lower Mt William Creek - downstream of Lake Lonsdale to Wimmera River Reach Distance 43 km Notable Tributaries Briggs Creek, Back Creek Geomorphic Character Alluvial continuous – low sinuosity Stream Order 7 Indicative channel size 30m wide, 5m deep Bioregion Wimmera Adjacent landuse Mostly Crown Frontage adjacent to broadacre agriculture land Flow regime Seasonal Major modifications Sheepwash Creek offtake, Bifurcation of east/west branches, Dadswell’s
Bridge Weir
Mt William Creek at Dadswell’s Bridge – May 2015
Mt William Creek at Roses Gap – September 2015

27
Yarriambiack Creek Reach Distance 143 km Notable Tributaries Nil Geomorphic Character Anabranching – Fine grained Stream Order 3 Indicative channel size South of Darlot Swamp – 35m-45m wide and 3.5m to 4.5m deep
North of Darlot Swamp - 30m-100m wide and 0.5m to 1m deep Bioregion Wimmera and Murray-Mallee Adjacent landuse Mostly Crown Frontage adjacent to broadacre agriculture land, urban area
at Warracknabeal Flow regime Intermittent- Episodic Major modifications Jung, Warracknabeal, Brim and Beulah Weirs, offtake structure
Yarriambiack Creek – Wardles Rd - September 2010
Yarriambiack Creek – Warracknabeal - December 2010
28
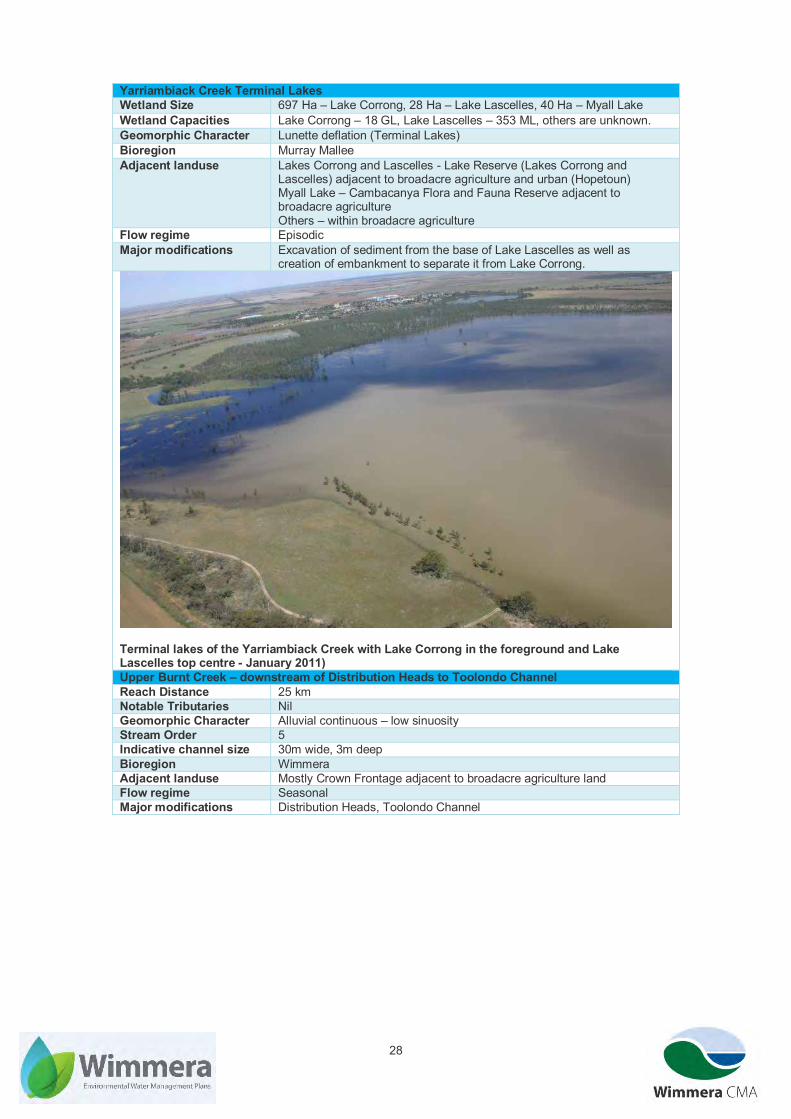
Yarriambiack Creek Terminal Lakes Wetland Size 697 Ha – Lake Corrong, 28 Ha – Lake Lascelles, 40 Ha – Myall Lake Wetland Capacities Lake Corrong – 18 GL, Lake Lascelles – 353 ML, others are unknown. Geomorphic Character Lunette deflation (Terminal Lakes) Bioregion Murray Mallee Adjacent landuse Lakes Corrong and Lascelles - Lake Reserve (Lakes Corrong and
Lascelles) adjacent to broadacre agriculture and urban (Hopetoun) Myall Lake – Cambacanya Flora and Fauna Reserve adjacent to broadacre agriculture Others – within broadacre agriculture
Flow regime Episodic Major modifications Excavation of sediment from the base of Lake Lascelles as well as
creation of embankment to separate it from Lake Corrong.
Terminal lakes of the Yarriambiack Creek with Lake Corrong in the foreground and Lake Lascelles top centre - January 2011) Upper Burnt Creek – downstream of Distribution Heads to Toolondo Channel Reach Distance 25 km Notable Tributaries Nil Geomorphic Character Alluvial continuous – low sinuosity Stream Order 5 Indicative channel size 30m wide, 3m deep Bioregion Wimmera Adjacent landuse Mostly Crown Frontage adjacent to broadacre agriculture land Flow regime Seasonal Major modifications Distribution Heads, Toolondo Channel

29
Burnt Creek at Graham’s Bridge Road - September 2015 Lower Burnt Creek – downstream of Toolondo Channel to Wimmera River Reach Distance 24 km Notable Tributaries Nil Geomorphic Character Alluvial continuous – low sinuosity Stream Order 5 Indicative channel size 20m wide, 3 m deep Bioregion Wimmera Adjacent landuse Mostly Crown Frontage adjacent to broadacre agriculture land, urban
(Horsham) Flow regime Seasonal Major modifications Toolondo Channel, former channel straightened and deepened from
Western Highway to confluence with the Wimmera River
Burnt Creek at Reynolds Road - October 2009

30
Bungalally Creek Reach Distance 25 km Notable Tributaries Nil Geomorphic Character Alluvial continuous – moderate to high sinuosity Stream Order 3 Channel size 20 m wide, 2m deep Bioregion Wimmera Adjacent landuse Mostly Crown Frontage adjacent to broadacre agriculture land Flow regime Intermittent-episodic Major modifications Toolondo Channel, former Bungalally South Channel outfall
Bungalally Creek at Graham’s Bridge Road - September 2012 MacKenzie River - Reach 1 – Lake Wartook to Dad and Dave Weir Reach Distance 10 km Notable Tributaries Nil Geomorphic Character Confined/Gorge/Partly confined - bedrock Stream Order 4 Indicative channel size 15 m wide, 4 m deep Bioregion Greater Grampians Adjacent landuse National Park (Grampians) Flow regime Perennial Major modifications Lake Wartook, Dad and Dave Weir

31
MacKenzie River at Zumsteins, July 2015 MacKenzie River - Reach 2 – Dad and Dave Weir to Distribution Heads Reach Distance 16 km Notable Tributaries Boggy Creek Geomorphic Character Partly confined, Alluviual continuous – low sinuosity Stream Order 5 Indicative channel size 20 m wide, 4 m deep Bioregion Dundas Tablelands Adjacent landuse Mostly Crown Frontage adjacent to broadacre agriculture land Flow regime Perennial - Seasonal Major modifications Dad and Dave Weir, Distribution Heads
MacKenzie River at Distribution Heads, October 2009

32
MacKenzie River - Reach 3 – Distribution Heads to Wimmera River Reach Distance 37 km Notable Tributaries Bungalally Creek Geomorphic Character Discontinuous Anabranching Chain of Ponds Stream Order 3 Indicative channel size 50m-100m wide, 3m-4m deep Bioregion Wimmera Adjacent landuse Mostly Crown Frontage adjacent to broadacre agriculture land Flow regime Seasonal Major modifications Distribution Heads, Toolondo Channel Escape
MacKenzie River downstream North-East Wonwondah Road, November 2007
2.3.Land Status and Waterway Management 2.3.1.Waterway land status
Waterway land ownership and management across Victoria is inherently complex, with combinations of freehold and Crown land, often depending on the history of settlement by pastoralists in the 1800’s. Therefore along the Wimmera River System there is a mosaic of land management (Figure 2-7). Statistics around the land tenure of reaches of the Wimmera River System is contained in Table 2-2. Much of the Wimmera River flows through Crown land, including reserves managed by DELWP such as the Wail State Forest or Parks Victoria such as the Barabool Flora Reserve and Little Desert National Park and with Crown stream frontage managed by the adjacent landholders under licence from DELWP. Much of the lower Wimmera River is part of the Wimmera River Heritage River Reserve, managed by Parks Victoria. There are a number of locations where landholders own land right to the top of the riverbank or even land where the river channel is located, especially around Horsham and Dimboola. Mt William Creek is similar in terms of land tenure arrangements, although with a high proportion of stream length contained within Crown land with some sections located in reserves,
33
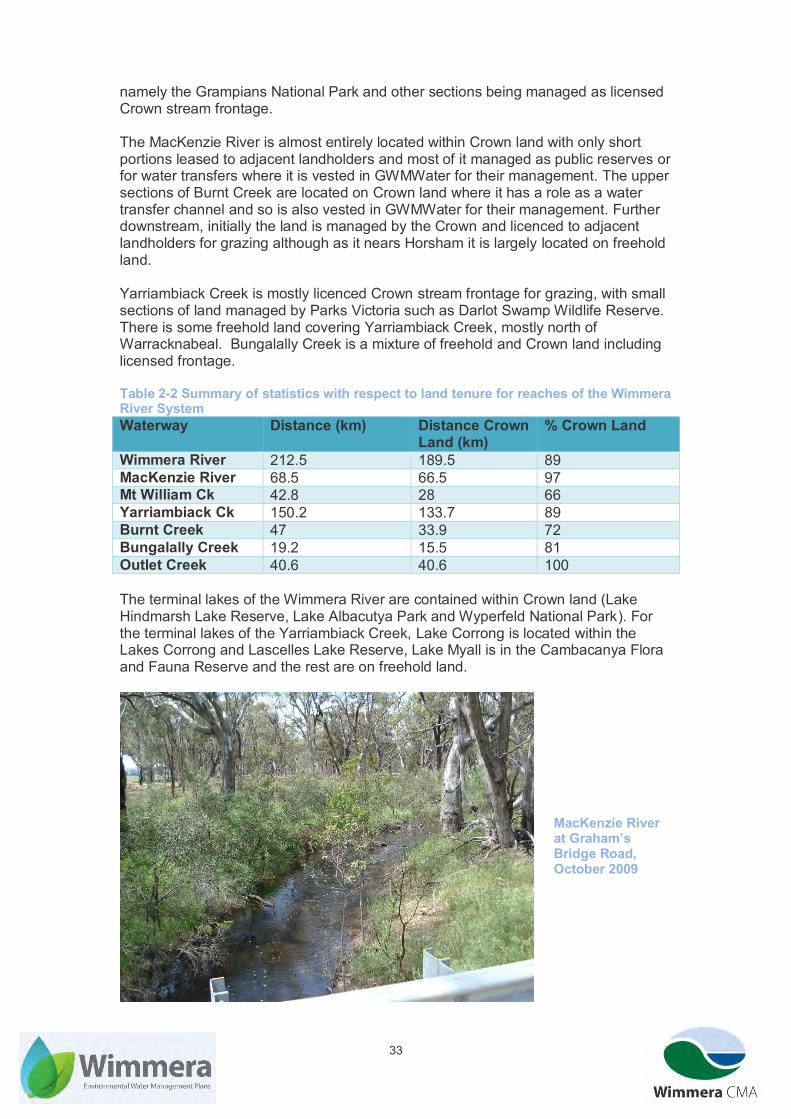
namely the Grampians National Park and other sections being managed as licensed Crown stream frontage. The MacKenzie River is almost entirely located within Crown land with only short portions leased to adjacent landholders and most of it managed as public reserves or for water transfers where it is vested in GWMWater for their management. The upper sections of Burnt Creek are located on Crown land where it has a role as a water transfer channel and so is also vested in GWMWater for their management. Further downstream, initially the land is managed by the Crown and licenced to adjacent landholders for grazing although as it nears Horsham it is largely located on freehold land. Yarriambiack Creek is mostly licenced Crown stream frontage for grazing, with small sections of land managed by Parks Victoria such as Darlot Swamp Wildlife Reserve. There is some freehold land covering Yarriambiack Creek, mostly north of Warracknabeal. Bungalally Creek is a mixture of freehold and Crown land including licensed frontage. Table 2-2 Summary of statistics with respect to land tenure for reaches of the Wimmera River System Waterway Distance (km) Distance Crown
Land (km) % Crown Land
Wimmera River 212.5 189.5 89 MacKenzie River 68.5 66.5 97 Mt William Ck 42.8 28 66 Yarriambiack Ck 150.2 133.7 89 Burnt Creek 47 33.9 72 Bungalally Creek 19.2 15.5 81 Outlet Creek 40.6 40.6 100 The terminal lakes of the Wimmera River are contained within Crown land (Lake Hindmarsh Lake Reserve, Lake Albacutya Park and Wyperfeld National Park). For the terminal lakes of the Yarriambiack Creek, Lake Corrong is located within the Lakes Corrong and Lascelles Lake Reserve, Lake Myall is in the Cambacanya Flora and Fauna Reserve and the rest are on freehold land.
MacKenzie River at Graham’s Bridge Road, October 2009

34
Figure 2-7 Land management arrangements for Wimmera waterways included in this EWMP

35
2.3.2.Roles and Responsibilities with Respect to Environmental Watering within the Wimmera River System
Roles and responsibilities of agencies, departments and individuals in relation to environmental watering in the Wimmera River system are outlined in Appendix 2.
2.4.Environmental Water Sources The Environmental Water Reserve (EWR) is the legally recognised amount of water set aside to meet environmental needs. The EWR can include minimum river flows (passing flows), unregulated flows and regulated environmental allocations specified within entitlements. Regulated environmental allocations are released from storage according to pre-determined environmental needs when needed and delivered to wetlands or streams to maintain their environmental values and condition.
The VEWH is responsible for holding and managing Victoria’s environmental water entitlements, and making decisions on their use. The Commonwealth Environmental Water Office also holds an entitlement to be used for environmental purposes, albeit at a lower reliability.
Environmental water for the Wimmera River system may be sourced from the water entitlements listed in Table 2-3. Table 2-3 Summary of managed environmental water sources for the Wimmera River system Water Entitlement Volume (ML) Responsible Agency Wimmera and Glenelg Rivers Environmental Entitlement
40,560 ML high reliability*
Victorian Environmental Water Holder
Passing flows at various locations
Commonwealth Environmental Water Holdings
28,000 ML low reliability
Commonwealth Environmental Water Office
*Note this entitlement is shared with the Glenelg River system The Wimmera and Glenelg Rivers Environmental Entitlement also states that it includes all surface water resources beyond those permitted to be extracted under the Water Act 1989 under licences and consumptive Bulk Entitlements. This would include flows provided by operational spills (when storages exceed the maximum operating levels) and physical spills (flows entering storages and channels exceeded outlet capacities). Transfers between storages (from Lakes Bellfield, Lonsdale and Wartook to Taylor’s Lake) use various regulated waterways (Fyans Creek, Mt William Creek, MacKenzie River and Burnt Creek) which can contribute to meeting ecological objectives in these reaches, depending on how flows are managed.
2.5.Legislative and Policy Framework
2.5.1.State The VWMS (DEPI, 2013) provides the framework for government, in partnership with the community, to manage rivers, estuaries and wetlands so they can support environmental, social, cultural and economic values now and into the future. The VWMS updates the Victorian River Health Strategy (DSE, 2002) (VRHS) which outlined clear principles for making regional decisions on river protection and restoration, identifying regional priorities for management activities and state-wide direction on important management issues affecting river health. Victoria’s water allocation framework provides the basis for the management of Victoria’s water resources. Under the Water Act 1989, the Victorian Government retains the overall right to the use and control of all surface water and groundwater on behalf of all Victorians. All water taken for consumptive purposes is done so under
36
entitlements set out in the Water Act 1989. Victoria’s water allocation framework takes a whole-of-system approach and considers all water resources (surface water and groundwater) for both consumptive and environmental purposes at all phases of the water cycle. Like surface water, groundwater is allocated for commercial and irrigation purposes under licensing arrangements specified within the Water Act 1989. The Water Act 1989 also defines the Environmental Water Reserve as the amount of water set aside to meet environmental needs. The Victorian Environmental Water Holder was established in 2011, under the Water Act 1989 as an independent statutory body responsible for making decisions on the most efficient and effective use of Victoria’s environmental entitlements. The key state-wide policy framework for water quality protection in Victoria is the State Environment Protection Policy (Waters of Victoria) 2003 (SEPP WoV). It provides a statutory framework for State and local government agencies, businesses and communities to protect and rehabilitate Victoria’s surface water environments. The SEPP WoV identifies beneficial uses of water and sets the environmental quality objectives and policy directions required to address higher risk impacts and activities. The Flora and Fauna Guarantee Act 1988 (FFG Act) is the key piece of Victorian legislation for the conservation of threatened species and communities and for the management of potentially threatening processes. The FFG Act lists threatened species and ecological communities as well as threatening processes such as the removal of woody debris from streams or alteration of flow regimes. The Heritage Rivers Act 1992 identifies and provides protection for Victorian heritage rivers by setting conditions on activities that may impact on their values (such as timber harvesting and water extraction) and requiring a management plan for each heritage river. Heritage rivers “have significant nature conservation, recreation, scenic or cultural heritage attributes” (State of Victoria, 1994). The Wimmera River, downstream of Polkemmet Bridge is classified as a Heritage River under the Heritage Rivers Act 1992. The WWS serves as a management plan for the Wimmera Heritage River. The Catchment and Land Protection Act 1994 (CaLP Act) establishes Regional Catchment Strategies (RCSs) as the primary framework for integrated management of land, water and biodiversity in each of the ten catchment regions of Victoria. The Wimmera CMA is responsible for preparing the various iterations of the Wimmera RCS and co-ordinating and monitoring its implementation. Regulations made under the CaLP Act set out obligations of land managers with respect to invasive plant and animal control.
2.5.2.Regional The Wimmera RCS (2013-2019) (Wimmera CMA, 2013) is the overarching strategy for natural resource management in the Wimmera region, under which sit a range of sub-strategies and action plans. It contains a long-term vision for the region, identifies regionally significant natural assets and sets 20-year condition objectives and six-year management measures. The Wimmera RCS involved extensive community consultation to ensure that the document reflects contemporary community values and aspirations. Regional planning processes for waterway management were established in 2002 under the VRHS and implemented through the ten regional River Health Strategies. In the case of the Wimmera CMA region, given the importance of wetlands in the region, it was called the Wimmera Waterway Health Strategy (Wimmera CMA, 2006)

37
which includes creeks, rivers and wetlands under the definition of ‘waterway’. Community input and participation in these regional planning processes ensured that regional planning reflected the community values of waterways in each region. The Wimmera Waterway Strategy (WWS) (Wimmera CMA, 2014) is the next iteration of regional waterway planning and was endorsed by the Ministers for Environment and Water in 2014. It has established a range of goals, targets and management activities to be undertaken for the next 8 years. The EWMP is a planning vehicle to enable the achievement of a number of these goals and targets. Water resource planning in Victoria is addressed through development of regional Sustainable Water Strategies (SWSs) that set out long-term regional plans to secure water for regional growth, while safeguarding the future of its rivers and other natural water sources. They investigate the range of potential changes to water availability under several climate change scenarios. The regional SWSs examine future consumptive demand and environmental needs and set out proposed options to balance and secure water for all users. In the Wimmera, the Western Region Sustainable Water Strategy (DSE, 2011) (Western Region SWS) provided a number of actions and policies with respect to waterway management in the region such as undertaking integrated waterway works programs and upgrading infrastructure to facilitiate improved environmental watering outcomes.
2.5.3.National At the federal level, water reform has been guided by the National Water Initiative (NWI) since 2004. Under this agreement, governments across Australia have committed to actions to achieve a more cohesive national approach to the way Australia manages, measures, plans for, prices, and trades water. The NWI recognises the need to build on the water reforms of the 1994 Council of Australian Government (COAG) agreement to ensure increased productivity and efficiency of Australia’s water use. It includes clear steps to return river and groundwater systems to environmentally sustainable levels of extraction and achieve integrated management of environmental water. There has also been significant legislative reform in water resource management at the federal level. The Water Act 2007 (Cth) established the Murray-Darling Basin Authority (MDBA) and required the MDBA to prepare the Basin Plan – a strategic plan for the integrated and sustainable management of water resources in the Murray-Darling Basin. The Act also established the Commonwealth Environmental Water Holder to manage the Commonwealth’s environmental water holdings. The Water Amendment Act 2008 (Cth) transferred the functions of the former Murray-Darling Basin Commission to the Murray-Darling Basin Authority (MDBA). The MDBA is now the single body responsible for overseeing water resource planning in the Murray-Darling Basin. The Basin Plan, a strategic plan for the integrated and sustainable management of water resources in the Murray-Darling Basin, was signed into law in November 2012. The Basin Plan sets legal limits on the amount of surface water and groundwater that can be taken from Victoria’s share of the Murray-Darling Basin from 1 July 2019 onwards. The Environment Protection and Biodiversity Conservation Act 1999 (Cth) (Australian Government, 1999) (EPBC Act) is the Australian Government’s central piece of environmental legislation. It provides a legal framework to protect matters of national environmental significance (NES) which include wetlands of international importance (Ramsar sites), nationally threated species and ecological communities, listed migratory species (those listed under international migratory bird agreements and the Bonn Convention) and listed heritage places. Waterway related matters of NES in the Wimmera region include Lake Albacutya Ramsar site, several nationally threatened and listed migratory species and a nationally threatened ecological community.

38
The Native Title Act 1993 (Cth) provides a framework for the protection and recognition of native title. The Native Title Act gives Indigenous Australians who hold native title rights and interests or who have made a native title claim the right to be consulted and, in some cases, to participate in decisions about activities proposed to be undertaken on the land where rights exist. Victoria’s first successful native title claim involved Wimmera River from the Yarriambiack Creek offtake through to beyond Lake Albacutya.
2.5.4.International The Australian Government has ratified several international human rights instruments that recognise and protect Indigenous peoples’ special connection to land and waters and provide for the right to practice, revitalise, teach and develop culture, customs and spiritual practices and to utilise natural resources (for example, the United Nations Declaration of Rights of Indigenous Peoples).
The Convention on Wetlands of International Importance (the Ramsar Convention) provides the framework for national action and international co-operation for the conservation and wise use of wetlands and their resources. The Convention encourages contracting parties such as Australia to nominate sites containing representative, rare or unique wetlands, or that are important for conserving biological diversity to the List of Wetlands of International Importance, for example Lake Albacutya Ramsar site.
International treaties have been made with the nations of Japan, China and the Republic of Korea for the protection of migratory birds that travel between these countries and Australia and their habitat. International migratory species are also protected under the Bonn Convention on Migratory Species. The terminal lakes provide important habitat for these bird species.
3. Hydrology and System Operations 3.1.Waterway Hydrology
The hydrology of the Wimmera River system is characterised by extreme fluctuations from season to season and year to year due to the variability in climate (Section 2.2.1). Over summer and autumn waterways typically do not flow for long periods of time, if at all. The exception is during summer storms which, when they provide intense rainfall results in short-lived streamflows although the dryness of the catchment may not lead to any flows. During winter and spring, once the catchments are wet, inflows will fill and connect pools generating streamflows reaching the lower parts of the system. Data from the streamflow gauge on the Wimmera River at Glynwylln (415206) is presented following (Figure 3-1) to highlight the variability in annual flow. Prior to the completion of the Wimmera Mallee Pipeline, this was the most downstream unregulated reach of the Wimmera River.

39
Figure 3-1 Flow data for the Wimmera River at Glynwylln The Wimmera River Environmental Flows Study (Alluvium, 2013) provides detailed information about the hydrological character of the system. The flow regime can be divided into four phases (See Table 3-1), as follows:
low flow phase: generally extended periods of low flows driven mostly by baseflow or periods of no flow, called cease-to-flow periods with infrequent shorter periods of high flow freshes caused by small localised heavy rainfall events;
transitional flow phase from low to high: higher flows becoming more common, due to more widespread and frequent storms combines with cooler temperaties, but low baseflows still relatively common;
high flow phase: higher baseflow with frequent, sometimes extended, periods of higher flows from larger, more frequent and more widespread storms; and
transitional flow phase from high to low: lower flows becoming more common as rainfall events become smaller, less frequent and more localised.
Table 3-1 Flow phases for the Wimmera River (from Alluvium (2013) Flow season Jan Feb Mar Apr May Jun Jul Aug Sep Oct Nov Dec
Low flow phase Transition phase (low to high)
High flow phase Transition phase (high to low)
There are stark differences in annual flows (Figure 3-1). For example, during the Millennium Drought some years (e.g. 2006 and 2008) were so dry there was insufficient flow to connect pools in the upper unregulated section of the Wimmera River. There was also little ability to harvest water for water supply purposes in these years (Figure 3-2 – note y-axis). Extremely wet spells such as those experienced during the 1970’s saw many waterways experiencing almost perennial flow. The early 1980’s witnessed an extreme example of the region’s variable hydrology with flood years in 1981 and 1983 punctuated by a very dry year in 1982 (Figure 3-3 –
Mean Daily Flow: 161 ML/d Standard Deviation: 708 ML/d

40
note y axis). Figure 3-4 shows the median monthly flows under four different climatic scenarios based on dividing historic flow records into quartiles (wet, average, dry and drought) which further empahsises the annual variability in hydrology.
Figure 3-2 Flow in the Wimmera River at Glenorchy from 2006-2008.
Figure 3-3. Flow in the Wimmera River at Glenorchy from 1981-1983.
0
500
1000
1500
2000
2500
3000
3500
4000
4500Ja
n-0
6
Mar
-06
May
-06
Jul-
06
Sep
-06
No
v-06
Jan
-07
Mar
-07
May
-07
Jul-
07
Sep
-07
No
v-07
Jan
-08
Mar
-08
May
-08
Jul-
08
Sep
-08
No
v-08
ML/
mo
nth
Month-Year
Monthly Flow - Wimmera River at Glenorchy
0
20000
40000
60000
80000
100000
120000
140000
Jan
-81
Mar
-81
May
-81
Jul-
81
Sep
-81
No
v-81
Jan
-82
Mar
-82
May
-82
Jul-
82
Sep
-82
No
v-82
Jan
-83
Mar
-83
May
-83
Jul-
83
Sep
-83
No
v-83
ML/
mo
nth
Month-Year
Monthly Flow - Wimmera River at Glenorchy

41
Figure 3-4. Median monthly flows (in ML) under different seasonal conditions (natural modelled daily data at Wimmera River at Glenorchy) (Alluvium, 2013) Apart from a very wet six months from July 2010 to January 2011, the region has experienced ongoing dry conditions since the late 1990’s. Therefore, streamflows present in the upper Wimmera River and its tributaries have been very limited for about 20 years. This has been especially the case during summer and autumn when declines in water quality (elevated salinity and nutrient levels as well as significant diurnal dissolved oxygen fluctuations) due to catchment scale impacts. As pools lower and dry out, there is a reduction in available habitat and this, combined with poor water quality mean that biota are under greatest stress. Impacts of Catchment Changes on Hydrology
There has been a long history of modifications to Wimmera River catchment which in turn has affected its hydrology. Since European settlement much of the catchment has been cleared and converted to broadacre cropping and grazing which in turn has lead to an increase in runoff and streamflows (Figure 3-5). Although there is a proliferation of stock and domestic dams in the upper catchment (See Section 3.2.1), their impact is insufficient to offset the increases in streamflows brought about by land clearing.
0
100
200
300
400
500
600
Jan Feb Mar Apr May Jun Jul Aug Sep Oct Nov Dec
Me
dia
n d
aily
flo
w
flow Ml/d@glenorchy median flow
Drought Dry Average Wet
42
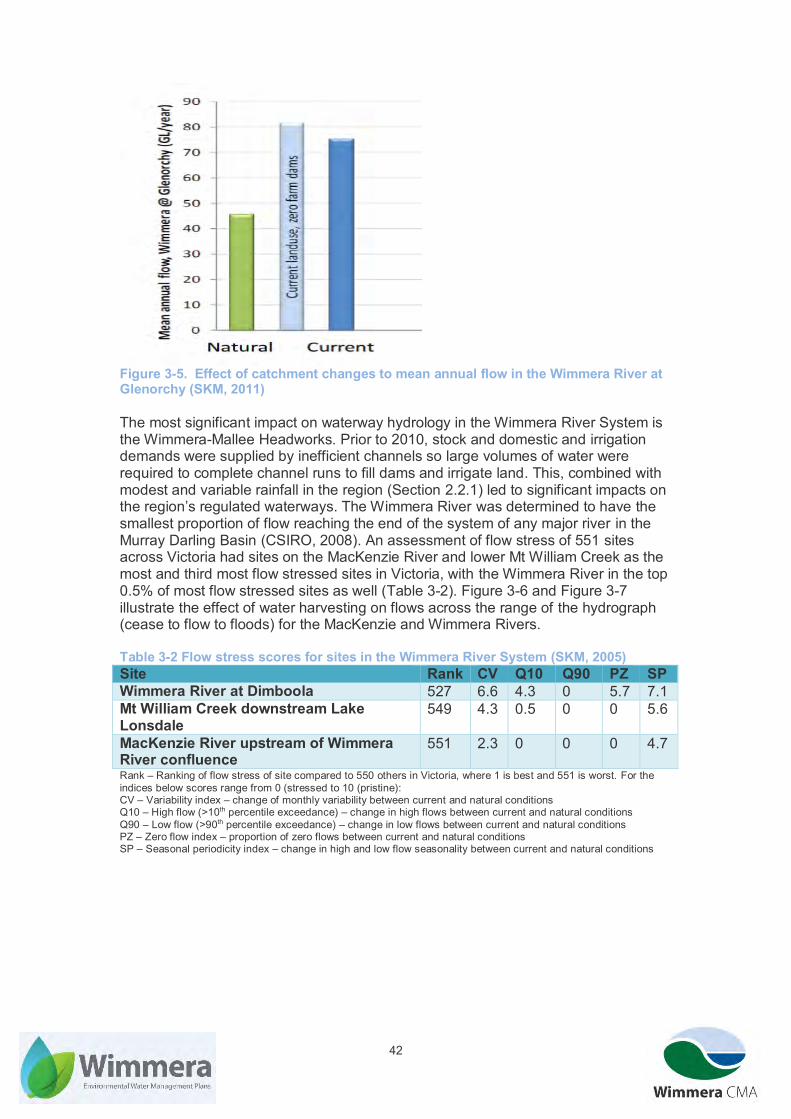
Figure 3-5. Effect of catchment changes to mean annual flow in the Wimmera River at Glenorchy (SKM, 2011) The most significant impact on waterway hydrology in the Wimmera River System is the Wimmera-Mallee Headworks. Prior to 2010, stock and domestic and irrigation demands were supplied by inefficient channels so large volumes of water were required to complete channel runs to fill dams and irrigate land. This, combined with modest and variable rainfall in the region (Section 2.2.1) led to significant impacts on the region’s regulated waterways. The Wimmera River was determined to have the smallest proportion of flow reaching the end of the system of any major river in the Murray Darling Basin (CSIRO, 2008). An assessment of flow stress of 551 sites across Victoria had sites on the MacKenzie River and lower Mt William Creek as the most and third most flow stressed sites in Victoria, with the Wimmera River in the top 0.5% of most flow stressed sites as well (Table 3-2). Figure 3-6 and Figure 3-7 illustrate the effect of water harvesting on flows across the range of the hydrograph (cease to flow to floods) for the MacKenzie and Wimmera Rivers. Table 3-2 Flow stress scores for sites in the Wimmera River System (SKM, 2005) Site Rank CV Q10 Q90 PZ SP Wimmera River at Dimboola 527 6.6 4.3 0 5.7 7.1 Mt William Creek downstream Lake Lonsdale
549 4.3 0.5 0 0 5.6
MacKenzie River upstream of Wimmera River confluence
551 2.3 0 0 0 4.7
Rank – Ranking of flow stress of site compared to 550 others in Victoria, where 1 is best and 551 is worst. For the indices below scores range from 0 (stressed to 10 (pristine): CV – Variability index – change of monthly variability between current and natural conditions Q10 – High flow (>10th percentile exceedance) – change in high flows between current and natural conditions Q90 – Low flow (>90th percentile exceedance) – change in low flows between current and natural conditions PZ – Zero flow index – proportion of zero flows between current and natural conditions SP – Seasonal periodicity index – change in high and low flow seasonality between current and natural conditions

43
Figure 3-6. Comparison of natural (thin) and current (thick) flows for the MacKenzie River upstream of the Wimmera River confluence (SKM, 2005)
Figure 3-7. Comparison of natural (thin) and current (thick) flows for the Wimmera River at Dimboola (SKM, 2005) The impact of the inefficient stock and domestic channel system on water security and supplies for consumptive users and the environment was unsustainable. Therefore a series of measures were undertaken to drastically increase environmental water availability, namely the construction of the Northern Mallee and Wimmera Mallee Pipelines and the purchase of the irrigation entitlement (see Text Box 1 for more details). The effectiveness of these measures in increasing water availability for the Wimmera River System can be seen in the increase in modelled average annual volumes for the Wimmera River and Yarriambiack Creek (Table 3-3).

44
Table 3-3 Average annual flows (ML/year) based on different environmentat water recovery scenarios (July 1903 - June 2000) Location Post Northern
Mallee Pipeine Post Wimmera Mallee Pipeline
Post irrigation entitlement purchase
Wimmera River downstream MacKenzie River Confluence
102,289 147,860 169,078
Yarriambiack Creek at offtake 4,940 5,772 5,586 Streamflow Gauging Network
A comprehensive network of streamflow gauging stations is required to understand the region’s hydrology and shifts brought about by changes in climate, land use and water resources management.The network of currently active gauging stations for the Wimmera River System is described in Table 3-4 and their locations are shown in Figure 1-1. Table 3-4 Stream gauges that relate to the Wimmera River system EWMP Gauging Station No.
Location (Year Established)
Notes
415201 Wimmera River at Glenorchy Weir Tail Gauge (1964)
Measures unregulated flow from upper catchment and used to determine passing flow volumes for Huddleston’s Weir and water harvesting arrangements into the Wimmera Inlet Channel to Taylors Lake. Also site of continuous turbidity monitoring.
415239 Wimmera River at Drung Drung (1978)
Water level only – mobile channel bed means accurate volume gauging is not feasible. Can be used as an indicator of flow peaks and their time of travel.
415200 Wimmera River at Horsham – Walmer (1881)
Long gauging history – over 100 years. An important site for water reporting to the MDBA and is also used to assist the passage of environmental flows through the Horsham weir. Compliance point for Reach 3 of Wimmera River. Also site of continuous dissolved oxygen, conductivity and temperature monitoring.
415261 Wimmera River at Quantong Bridge (1993)
Water level only – flood warning gauge used to assess flow peaks and time of travel.
415256 Wimmera River u/s Dimboola (1989)
Gauge used to assess flow volumes and time of travel. Also site of continuous dissolved oxygen, conductivity and temperature monitoring
415246 Wimmera River at Lochiel Railway Bridge (1987)
Gauge used to assess flow volumes and time of travel. Compliance point for Reach 4 of Wimmera River. Also site of continuous dissolved oxygen, conductivity and temperature monitoring.
415247 Wimmera River at Tarranyurk (1987)
Water level only - mobile channel bed mean volume gauging is not undertaken. Also site of continuous dissolved oxygen, conductivity and temperature monitoring.
415251 MacKenzie River at McKenzie Creek (1988)
Measures flow from upper catchment (both MacKenzie and also contributions from Moora). Compliance point for Reach 3 of MacKenzie River. Also site of monthly dissolved oxygen, conductivity and temperature monitoring.
415223 Burnt Creek at Wonwondah East (1965)
An important site for water supply operations, flood warning and also to meter environmental flows to the lower Burnt Creek and Bungalally Creek. Compliance point for upper Burnt Creek.

45
Gauging Station No.
Location (Year Established)
Notes
415203 Mt William Creek at Lake Lonsdale Tail Gauge (1899)
Measures flow from Lake Lonsdale for the provision of environmental passing flows as well as regulated releases. Also has some flood warning benefit. Compliance point for lower Mt William Creek. Also site of monthly dissolved oxygen, conductivity and temperature monitoring.
415241 Yarriambiack Creek at Murtoa - Wimmera Highway (1978)
Water level only – flood warning gauge. No regulated environmental releases can be made to the Yarriambiack Creek. Nominated compliance point for Yarriambiack Creek although flow measurement does not take place.
The current gauging network provides a useful picture in providing information from unregulated and passing flows which informs regulated environmental water delivery. The streamflow gauges at the downstream ends of reaches are also important compliance points to determine the extent to which volumes requested from delivery points are of sufficient volume and duration to attain ecological objectives. Gauges downstream of Horsham and Dimboola also assist in town weir management through providing information of rates of flow through the weirs. In the last decade improved telemetry has greatly increased the timeliness of information from the gauging network. Flood warning gauges provide continuous height data to the Bureau of Meterology website and continuous information around flow and water quality is available for other gauges via an online data hosting servce. Although the current stream gauge network is an important tool for effective environmental water management there are opportunities for it to be enhanced. The four gauging stations that currently only record water level need to be upgraded to measure flow rates. Bungalally Creek, Reach 2 MacKenzie River and lower Burnt Creek do not have streamflow gauges with which to determine compliance. Water levels need to be recorded for Lake Hindmarsh, Lake Albacutya, Lake Corrong when they contain water and a streamflow gauging station is needed on Outlet Creek in order to determine compliance of flow objectives as well as enhancing hydrologic modelling. Rating tables for Hindmarsh and Albacutya relate lake height to volume, however, they are several decades old and need to be updated to reflect recent changes in lakebed topography. At Lake Hindmarsh, Aeolian processes has led to substantial sand movement during the Millennium Drought.
3.1.1.Groundwater – Surface Water Interaction Within the Wimmera, groundwater – surface water interactions take place involving either regional or local groundwater flows systems. Examples of local groundwater flow systems are found adjacent to the Grampians, groundwater infiltrates colluvium deposited from weathered and eroded sediments and can discharge at the base of foot-slopes (Wimmera CMA, 2005) and is of reasonable quality. Given the MacKenzie River and Mt William Creek flow adjacent to the Grampians in places there is a potential for there to be groundwater – surface water interactions with these waterways. Whilst there is no information that indicates the MacKenzie River receives groundwater contributions (SKM, 2009), detailed investigation into groundwater-surface interactions in the lower Mt William Creek indicates that during wet conditions there have been groundwater contributions to retain water in a refuge pool (known as Clarke’s Pool). However as conditions have dried out since the late 1990’s groundwater levels have significantly dropped away and this pool is no longer supplied by groundwater (Alluvium, 2015).

46
Most of the Wimmera River System overlies the regional groundwater flow system within the Parilla Sands which is very saline, ranging from 5,000 mg/L in the south to more than 35,000 mg/L in the north of the Wimmera (Wimmera CMA, 2005). Typically the groundwater table is well below all waterway channels apart from the Wimmera River. Analysis of depths to water table and baseflow filtering for the Wimmera River Environmental Flows Study (Alluvium, 2013) confirmed that there are no significant groundwater contributions to surface water flow beyond the intrusion of hypersaline groundwater into the river channel when it intersects with water table in the lower Wimmera River. In the lower Wimmera River, groundwater enters pools typically at depths greater than 2m. During low flow conditions, the water quality can become extremely poor and unable to support fish and macroinvertebrates with salinity levels over 50,000 µS/cm. The density difference between the deeper hypersaline water and overlying surface water leads to stratification which reduces the rate of oxygen penetration. As a result, bacterial oxidation of organic matter is impacted by the lack of oxygen, consuming all of the oxygen in the hypersaline layer and leading to bacterial reduction of sulphate which creates toxic hydrogen sulphide as a byproduct. During dry times the lens of better quality water evaporates and there have been fish deaths recorded as the habitable area for fish is lost. In high flows the hypersaline water in these pools can be ‘scoured’ out temporarily (Figure 3-8) as there is mixing and movement of the hypersaline water downstream. Under intermediate flow regimes the hypersaline water is mobilised and can settle in pools further downstream which creates further loss of habitat for large bodied fish. Locations downstream of Lochiel, especially around Tarranyurk have been observed to have hypersaline groundwater intruding through the sides and base of the river channel which leads to very saline water (> 10,000 µS/cm) at these locations during periods of no flow of several weeks or more. A number of technical investigations have been undertaken to map out these pools and monitor responses to flows of differing magnitudes. AWE (2014) consolidated key findings from these investigations and a risk assessment was undertaken by EPA Victoria to provide information on how environmental water can be used to mitigate risks to water quality posed by these saline pools (EPA, 2008).
Burnt Creek at McInnes Road, October 2009

47
Figure 3-8. The size of saline pools was slightly reduced (left) during flows in 2004-2005 compared to prior to and after flows (right).
3.2. Water Quality Water quality is highly variable within the Wimmera River System depending on the water source and flow regime. Wimmera Waterway Monitoring Assessment Project 2007-2008 (Ecowise Environmental, 2008) involved a detailed analysis of the comprehensive physico-chemical water quality monitoring program that involved monthly sampling at a number of sites across the catchment from 2003-2008. The program included a number of sites within the Wimmera River System and recommendations for a more strategic monitoring program. The implementation of this monitoring since 2008 provides an ongoing valuable water quality dataset the complements water quality monitoring at a number of streamflow gauging stations (Table 3-4). Summaries below for various sections of the Wimmera River System as well as Appendix 8 provide a snapshot into the water quality throughout the system. Mt William Creek
Mt William Creek straddles agricultural land in the east and national park in the west and so its water quality is highly variable depending on the prevailing source of runoff. During dry to average conditions, the rocky escarpments of the Grampians is the source of most runoff entering the creek. Whilst streamflows under these conditions are generally insufficient to travel the entire length of the upper Mt William Creek into Lake Lonsdale, there can be flows along the lower Mt William Creek and water quality is comparatively good (low salinity and turbidity). During wet conditions, when Lake Lonsdale receives significant inflows from the entire upper Mt William Creek catchment (thousands of megalitres), it is subsequently used to provide environmental water releases. Water quality is poorer than when runoff was just from the Grampians (for example salinities up to 3000 µS/cm although more typically 500 µS/cm to 2000 µS/cm) although temperature is not an issue due to it being a very shallow storage. The Mt William Creek is also prone to long cease to flow periods which in turn leads to diminishing water quality, in particular elevated salinity levels. Lake Lonsdale is also predisposed to Blue Green Algae blooms with the lake regularly tested for algal blooms

48
(GWMWater, 2012) given its shallow water levels and lack of throughflow. The lower Mt William Creek has also been noted to experience elevated counts of Blue Green Algae when there has been blooms in Lake Lonsdale. MacKenzie River, Burnt Creek and Bungalally Creek
Water quality along these waterways is amongst the best in the region with streamflows from the Lake Wartook and downstream tributaries containing low levels of salinity, nutrients and turbidity (typically within SEPP (WoV) guidelines). Cold water pollution is not generally an issue as Lake Wartook is a shallow storage. Flows from the Moora Channel that can be delivered to Reach 3 of the MacKenzie River, Burnt Creek and Bungalally Creek. Whilst water supplied from the Moora Channel is of low salinity, observations indicate it has higher turbidity than water supplied from Lake Wartook. Likewise water can be delivered to the lower Burnt Creek and Bungalally Creek from the Toolondo Channel which is of lesser quality as well (salinity of approximately 1000 µS/cm and turbity of 10 NTU (GWMWater, 2014)). Wimmera River
Flows from the upper Wimmera River tend to be very poor quality water, rarely meeting SEPP (WoV) guidelines for all parameters except pH.There are pronounced salinity impacts in tributaries flowing into the upper Wimmera River with salinities of typically 2000 µS/cm - 8000 µS/cm during low or no flow conditions. Therefore like the Mt William Creek, when wet conditions occur the salinity impacts are spread further down the river. Environmental water releases from Lake Lonsdale via the Mt William Creek tend to also can be reasonably saline (refer Mt William Creek section previous). However environmental water releases from Taylor’s Lake are of higher quality with salinity levels under 1000 µS/cm. Therefore water quality levels are highest during periods when there are ongoing environmental water releases from Taylor’s Lake rather than during unregulated/passing flows. The impacts of saline groundwater intrusions on water quality are discussed in Section 3.1.1. The Wimmera River is also susceptible to Blue Green Algal blooms with blooms monitored in Taylors Lake, Horsham Weir Pool and Dimboola Weir Pool. Victorian Water Quality Trends 1991-2010 (DEPI, 2013) provides detailed results and analysis for water quality parameters including salinity, turbidity, pH, dissolved oxygen and nutrients several sites on the Wimmera River including at Horsham.
3.3.System Operations – History of Use
3.2.1.Water Management and Delivery Within the Wimmera River Catchment upstream of Reach 2, there are estimated to be 5,939 stock and domestic dams with a total volume of 12,950 ML which reduces average annual streamflows by approximately 11,000 ML/y (SKM, 2011). Based on current rates of development, the number of farm dams in the Upper Wimmera Catchment in 2030 will be 20% higher than 2005 levels (SKM, 2011). There are also a number of irrigation dams in the foothills of the Pyrenees, supplying a number of vineyards around Landsborough. These factors substantially affect the volumes reaching the regulated sections of the Wimmera River system, especially in summer/autumn and during dry years. Water harvesting and delivery in the Wimmera River System is very complex with numerous channels, pipelines and waterways used to harvest and transfer water to and from weirs and storages for towns, customers and waterways (Figure 3-9). The Wimmera Mallee headworks system harvests water from two major river systems – the Wimmera and the Glenelg Rivers - and delivers it to towns, stock and domestic customers and the environment over an area of more than 2.6 million hectares.

49
Figure 3-9 Storage and delivery system (source: GWMWater) – note irrigation demands are no longer present and Lakes Albacutya and Hindmarsh are not storages Wimmera-Mallee System Entitlements
For many years the headworks and channel system supplied about 20,000 dams via 16,000 km of open earthen channel (Wimmera Mallee Pipeline Project Planning Group, 2003) which caused significant issues for waterways and consumptive water users (Section 3.1 and Text Box 1). The completion of two major infrastructure projects – the Northern Mallee Pipeline and Wimmera Mallee Pipeline – improved reliability of supply for all users with the majority of water savings returned to the Wimmera and Glenelg Rivers. Full entitlement for all consumptive users is 52,690 ML, with Coliban and Wannon Water having the smallest entitlements (300 ML and 2,120 ML respectively) and the rest held by GWMWater. Within GMWWater’s entitlement, 2,590 ML is dedicated to recreation lakes, 2,960 ML is for distribution losses in the pipeline systems and a further 3,300 ML is for the Glenelg Compensation Flow. The Glenelg Compensation Flow is an entitlement for flows that

50
are provided to the lower Glenelg River from Rocklands Reservoir to benefit stock and domestic needs but also provided benefits for the environment. Beyond the environmental entitlements described in Table 2-3, there is a 1,000 ML environmental entitlement for off-stream wetlands supplied by the Wimmera Mallee Pipeline. This entitlement is held by the VEWH and is outlined in separate environmental water management plans. Prior to the completion of the Wimmera Mallee Pipeline consumptive entitlements totalled 174,050 ML, mostly to cover distribution losses within the channel system and the environment’s regulated entitlement was 32,240 ML. The historic reliability of entitlements prior to the Wimmera Mallee Pipeline is shown in Figure 3-10.
Figure 3-10 Modelled reliability profile of entitlements prior to the construction of the Wimmera Mallee Pipeline (1903-2003) (DSE, 2004) The impact of the completion of the Wimmera Mallee Pipeline on the reliability of supply is profound. Regulated entitlements apart from the CEWO’s environmental entitlement derived from the purchase of the irrigation entitlement have a modelled reliability of 92.6% of years with full allocation based on inflows from 1891-2012 (encompassing the Federation and Millenium Droughts). The CEWO’s entitlement has a modelled reliability of 90.1% of years with full allocation (SKM, 2013) although there has not been an allocation since the entitlement was purchased in 2012 through to 2015. Climate change modelling indicates that dry conditions will lead to substantial reductions in reliability of entitlements which will in turn severelyaffect environmental water availability, particularly for the terminal lakes. The complexity in system operation, as well as demands such as fixed location supply (towns, pipeline), variable location supply (environment), and managing water quality and system efficiency, necessitates flexibility in system operation and environmental water delivery. Given the scale and complexity of the water supply system, water management and system delivery arrangements are described in several sub-sections.

51
Text Box 1 - History of Water Resource Management and Environmental Water Recovery in the Wimmera The Wimmera Mallee headworks system is very old within the context of water resource management in Victoria with the location of Victoria’s first water resource infrastructure works when in 1850’s the Wilson brothers built a weir across the Wimmera River and lowered the bed level to increase flows into the Yarriambiack Creek for stock and domestic supply (Van Veldhuisen, 2001). Lake Wartook was the first storage, commissioned in 1887 to supply water to fledgling irrigation colonies and townships like Horsham and Natimuk. Various systems involving weirs, pumps, flumes and channels were designed to take water north to land that was being cleared and converted to cropping and grazing. From 1913 to 1966 the remaining headworks storages were constructured and channels supplied water from Clear Lake in the south to Ouyen and beyond in the north and Wedderburn in the east (Van Veldhuisen, 2001). This provided essential supplies to 35,000 people covering 10% of Victoria (Wimmera Mallee Pipeline Project Planning Group, 2003). Irrigation districts also were established around Quantong, Riverside/Drung and Murtoa. Despite the ever-increasing storage capacity to supply the stock and domestic and irrigation systems, water restrictions were historically common due to the massive volumes used in running channels and filling dams. Following the completion of the Northern Mallee Pipeline, the unrestricted demands could be met 77% of the time for stock and domestic and 74% for irrigation supplies under historical inflows (Wimmera Mallee Pipeline Project Planning Group, 2003). For decades there has been a widespread acknowledgement that the volume of water harvested to supply towns and farms using open earthen channels and farm dams were having a significant impact on the condition on the region’s waterways (Van Veldhuisen, 2001). Apart from wet years when storages were full and/or streamflows were too large to harvest, many of these waterways did not flow at all and their environmental, social and economic values were frequently under severe threat. Pioneering work in the late 1980‘s involved trial ‘environmental flows’ along the lower Wimmera River and monitoring their effectiveness to demonstrate the need for and value of additional environmental water (Anderson & Morison, 1989). There were also some other operational releases that took place outside of drought conditions that had environmental benefits (e.g. stock and domestic supplies for the lower Burnt Creek). However, the Wimmera system was heavily over-allocated (CSIRO, 2008) and so there simply was not the water available to regularly supply the region’s regulated waterways. It was not until the 1990’s that action began to take place to redress this with the progressive construction of several stages of the Northern Mallee Pipeline, meaning that a proportion of water savings created by replacing channels and dams with pipes and tanks became available for environmental flows. In the early-2000’s further sections of pipeline were completed, increasing the entitlements available for the environment although the record drought greatly restricted allocations. The severe water shortages brought about by the Millennium drought provided the trigger for the escalation of pipeline works with the Wimmera Mallee Pipeline completed in 2010. This in turn led to further increases to environmental water availability through the creation of passing flow rules and improving the reliability of the environment’s regulated entitlement.
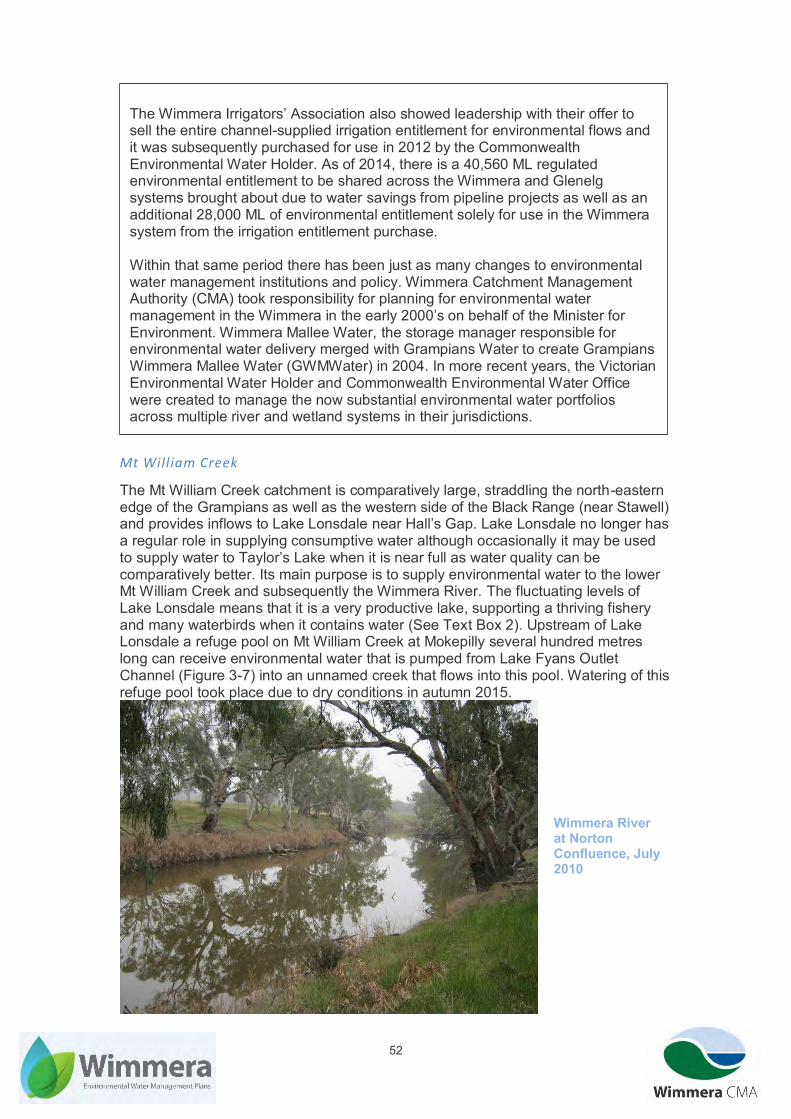
52
Mt William Creek
The Mt William Creek catchment is comparatively large, straddling the north-eastern edge of the Grampians as well as the western side of the Black Range (near Stawell) and provides inflows to Lake Lonsdale near Hall’s Gap. Lake Lonsdale no longer has a regular role in supplying consumptive water although occasionally it may be used to supply water to Taylor’s Lake when it is near full as water quality can be comparatively better. Its main purpose is to supply environmental water to the lower Mt William Creek and subsequently the Wimmera River. The fluctuating levels of Lake Lonsdale means that it is a very productive lake, supporting a thriving fishery and many waterbirds when it contains water (See Text Box 2). Upstream of Lake Lonsdale a refuge pool on Mt William Creek at Mokepilly several hundred metres long can receive environmental water that is pumped from Lake Fyans Outlet Channel (Figure 3-7) into an unnamed creek that flows into this pool. Watering of this refuge pool took place due to dry conditions in autumn 2015.
The Wimmera Irrigators’ Association also showed leadership with their offer to sell the entire channel-supplied irrigation entitlement for environmental flows and it was subsequently purchased for use in 2012 by the Commonwealth Environmental Water Holder. As of 2014, there is a 40,560 ML regulated environmental entitlement to be shared across the Wimmera and Glenelg systems brought about due to water savings from pipeline projects as well as an additional 28,000 ML of environmental entitlement solely for use in the Wimmera system from the irrigation entitlement purchase. Within that same period there has been just as many changes to environmental water management institutions and policy. Wimmera Catchment Management Authority (CMA) took responsibility for planning for environmental water management in the Wimmera in the early 2000’s on behalf of the Minister for Environment. Wimmera Mallee Water, the storage manager responsible for environmental water delivery merged with Grampians Water to create Grampians Wimmera Mallee Water (GWMWater) in 2004. In more recent years, the Victorian Environmental Water Holder and Commonwealth Environmental Water Office were created to manage the now substantial environmental water portfolios across multiple river and wetland systems in their jurisdictions.
Wimmera River at Norton Confluence, July 2010

53
Figure 3-11. Lake Fyans Outlet Channel at Lake Fyans (left) and pumping into upper Mt William Ck refuge pool (right). Lake Lonsdale was naturally a series of large wetlands and now is a shallow storage (up to 4 m deep) with a relatively large surface area (up to 26 km2) and therefore has very high rates of evaporation. This means that with a series of dry years, volumes diminish and the lake may contain little to no water. An outlet structure in Lake Lonsdale wall is used to release water into the lower Mt William Creek (Figure 3-12) including for the provision of regulated environmental water releases and passing flows (Table 2-3). The lower Mt William Creek has been modified in places to improve its utility as a water transfer channel, being deepened and straightened just downstream of Lake Lonsdale to Trudgeon’s Weir (Figure 3-12). Historically this weir was used to divert flow into Sheepwash Creek (an anabranch of the Mt William Creek). Sheepwash Weir on Sheepwash Creek was then used to divert flow along the Main Central Channel to Glenorchy (also known as the Lonsdale-Glenorchy channel) to the Wimmera River or allow flow to return to Mt William Creek. These weirs and the Main Central Channel were decommissioned in 2013 and removed, however the changes in channel depth and width remain and influence flows along the creek. A low-level dropboard weir is located on the offtake of the Sheepwash Creek from the Mt William Creek immediately upstream of the former site of Trudgeon’s Weir (Figure 3-12) which the adjacent landholder operates occasionally (i.e. during floods and to divert volumes for stock watering along Sheepwash Creek).
Figure 3-12. Lake Lonsdale Outlet (right) and the site of the former Trudgeon’s Weir (left) At Dadswell’s Bridge, a small weir is owned and managed by the community to retain water for aesthetic purposes and, to a lesser extent, for stock and domestic use (Alluvium, 2015). However, since 2010, the locality has been supplied with stock and domestic water by the Wimmera Mallee Pipeline. Further north, the creek becomes
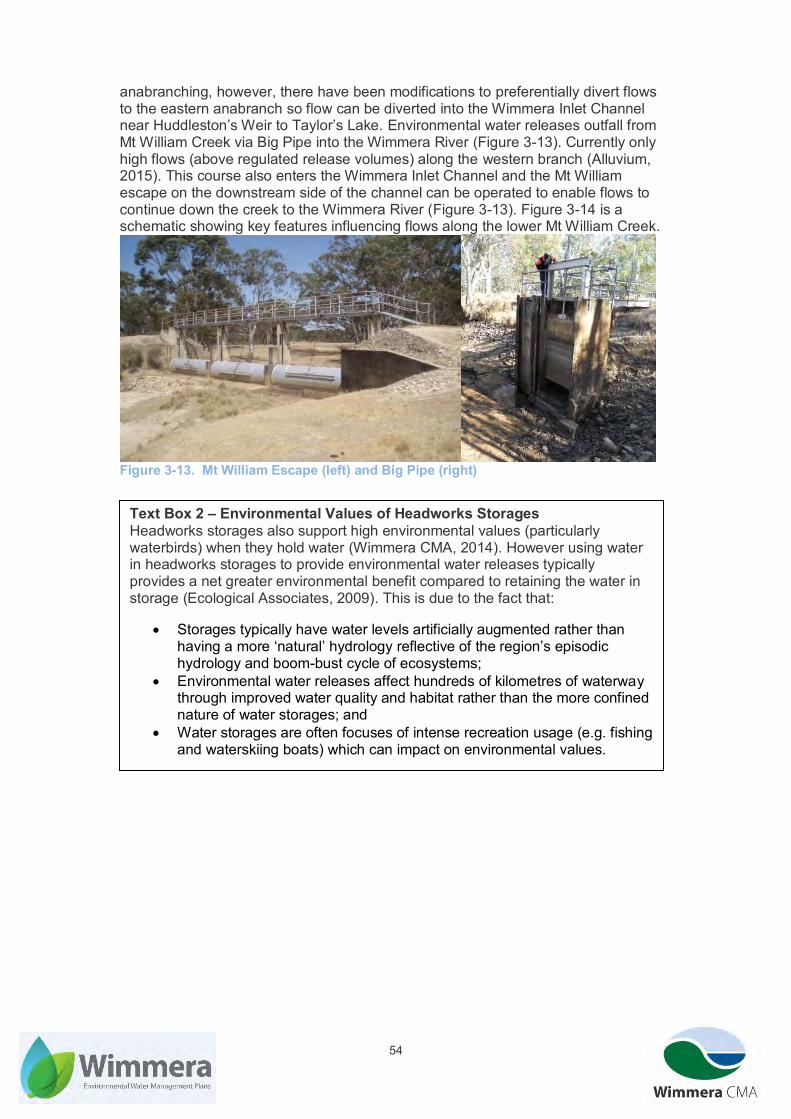
54
anabranching, however, there have been modifications to preferentially divert flows to the eastern anabranch so flow can be diverted into the Wimmera Inlet Channel near Huddleston’s Weir to Taylor’s Lake. Environmental water releases outfall from Mt William Creek via Big Pipe into the Wimmera River (Figure 3-13). Currently only high flows (above regulated release volumes) along the western branch (Alluvium, 2015). This course also enters the Wimmera Inlet Channel and the Mt William escape on the downstream side of the channel can be operated to enable flows to continue down the creek to the Wimmera River (Figure 3-13). Figure 3-14 is a schematic showing key features influencing flows along the lower Mt William Creek.
Figure 3-13. Mt William Escape (left) and Big Pipe (right)
Text Box 2 – Environmental Values of Headworks Storages Headworks storages also support high environmental values (particularly waterbirds) when they hold water (Wimmera CMA, 2014). However using water in headworks storages to provide environmental water releases typically provides a net greater environmental benefit compared to retaining the water in storage (Ecological Associates, 2009). This is due to the fact that:
Storages typically have water levels artificially augmented rather than having a more ‘natural’ hydrology reflective of the region’s episodic hydrology and boom-bust cycle of ecosystems;
Environmental water releases affect hundreds of kilometres of waterway through improved water quality and habitat rather than the more confined nature of water storages; and
Water storages are often focuses of intense recreation usage (e.g. fishing and waterskiing boats) which can impact on environmental values.

55
Figure 3-14. Schematic of key features on the lower Mt William Creek and part of the Wimmera River near Dadswell’s Bridge (Alluvium, 2015) Wimmera River
The Wimmera River’s initial diversion point is Huddleston’s Weir (Figure 3-15). Passing flow rules govern the extent to which Wimmera River flow can be diverted into the Wimmera Inlet Channel to supply Taylor’s Lake. The passing flow rules prescribed for Huddleston’s Weir within the Environmental Entitlement are quite complex and vary based on a proportion of upstream flows and are restricted based on the level of allocations. GWMWater only cautiously harvests water from the Wimmera River due to concerns around water quality impacts on Taylor’s Lake, particularly salinity and turbidity (See Section 3.2). Therefore, under a range of circumstances all flows may continue down the Wimmera River past Huddleston’s Weir. This provides a sharp contrast with arrangements prior to the construction of the Wimmera Mallee Pipeline, when Huddleston’s Weir was a very effective mechanism to harvest all low-medium flows (up to 1,600 ML/d). Now the Wimmera Mallee Pipeline is complete, it is usual during wet periods for the Storage Manager to

56
focus on maximising water quality rather than just water quantity. This means that if poorer quality water (high salinity, high turbidity) is flowing from the upper Wimmera River, GWMWater would typically choose to allow all of it to pass rather than harvest volumes allowed under passing flow provisions. Additionally flow can be provided to the Wimmera River from Lake Lonsdale via Mt William Creek or from Taylor’s Lake via the Taylor’s Lake Outlet Channel outfall (Figure 3-16).
Figure 3-15. Huddleston’s Weir (left) and the adjacent gates on the Wimmera Inlet Channel (right) There are three town weirs (Horsham, Dimboola, Jeparit) along the Wimmera River which have existed in various forms and locations for over century (Van Veldhuisen, 2001). Whilst they were originally built to offset the reduced flows due to the construction of Lake Lonsdale the water captured in these weir pools is used for stock and domestic supply as well as watering ovals and gardens. In 2006, flume gates were installed across sections of the weir by Wimmera CMA to improve the ability of councils to manage the passage of flows through weir pools based on advice from Wimmera CMA (Figure 3-16, Figure 3-17). Dimboola Weir was substantially upgraded to include a spillway following severe damage during the January 2011 floods. It should be noted that given the lack of endemic diadromous fish species and risks around Common Carp (Cyprinus carpio) movement, fish passage is not a requirement at these and other weirs on the Wimmera River System (SKM, 2006). The Wimmera and Glenelg Rivers Environmental Entitlement (Schedule 6) contains provisions regarding the supply of environmental water to other water bodies, namely the Horsham, Dimboola and Jeparit Weir pools. Recommended conditions for this have been developed as part of the EWMP development process (Appendix 7) although they have not been formally included in the environmental entitlement.
Figure 3-16. Taylor’s Lake Outlet Channel Outfall (left) and the Horsham Weir (right)
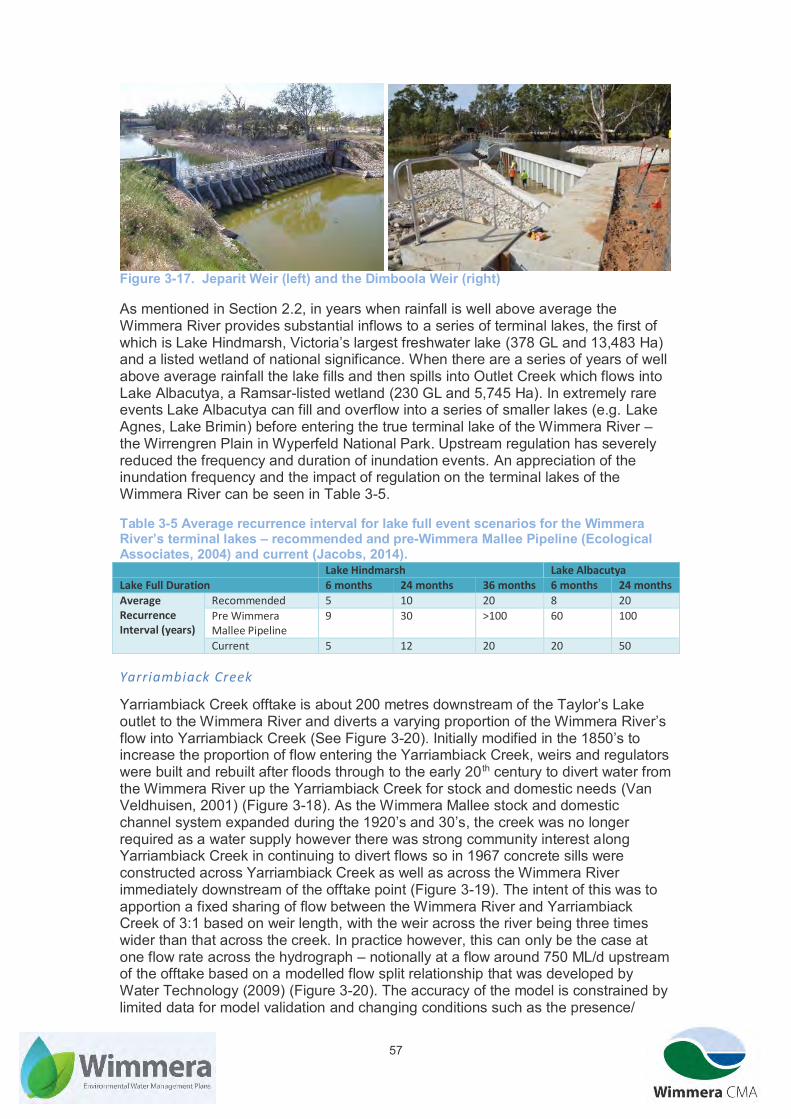
57
Figure 3-17. Jeparit Weir (left) and the Dimboola Weir (right) As mentioned in Section 2.2, in years when rainfall is well above average the Wimmera River provides substantial inflows to a series of terminal lakes, the first of which is Lake Hindmarsh, Victoria’s largest freshwater lake (378 GL and 13,483 Ha) and a listed wetland of national significance. When there are a series of years of well above average rainfall the lake fills and then spills into Outlet Creek which flows into Lake Albacutya, a Ramsar-listed wetland (230 GL and 5,745 Ha). In extremely rare events Lake Albacutya can fill and overflow into a series of smaller lakes (e.g. Lake Agnes, Lake Brimin) before entering the true terminal lake of the Wimmera River – the Wirrengren Plain in Wyperfeld National Park. Upstream regulation has severely reduced the frequency and duration of inundation events. An appreciation of the inundation frequency and the impact of regulation on the terminal lakes of the Wimmera River can be seen in Table 3-5. Table 3-5 Average recurrence interval for lake full event scenarios for the Wimmera River’s terminal lakes – recommended and pre-Wimmera Mallee Pipeline (Ecological Associates, 2004) and current (Jacobs, 2014). Lake Hindmarsh Lake Albacutya Lake Full Duration 6 months 24 months 36 months 6 months 24 months
Average Recurrence Interval (years)
Recommended 5 10 20 8 20
Pre Wimmera Mallee Pipeline
9 30 >100 60 100
Current 5 12 20 20 50 Yarriambiack Creek
Yarriambiack Creek offtake is about 200 metres downstream of the Taylor’s Lake outlet to the Wimmera River and diverts a varying proportion of the Wimmera River’s flow into Yarriambiack Creek (See Figure 3-20). Initially modified in the 1850’s to increase the proportion of flow entering the Yarriambiack Creek, weirs and regulators were built and rebuilt after floods through to the early 20 th century to divert water from the Wimmera River up the Yarriambiack Creek for stock and domestic needs (Van Veldhuisen, 2001) (Figure 3-18). As the Wimmera Mallee stock and domestic channel system expanded during the 1920’s and 30’s, the creek was no longer required as a water supply however there was strong community interest along Yarriambiack Creek in continuing to divert flows so in 1967 concrete sills were constructed across Yarriambiack Creek as well as across the Wimmera River immediately downstream of the offtake point (Figure 3-19). The intent of this was to apportion a fixed sharing of flow between the Wimmera River and Yarriambiack Creek of 3:1 based on weir length, with the weir across the river being three times wider than that across the creek. In practice however, this can only be the case at one flow rate across the hydrograph – notionally at a flow around 750 ML/d upstream of the offtake based on a modelled flow split relationship that was developed by Water Technology (2009) (Figure 3-20). The accuracy of the model is constrained by limited data for model validation and changing conditions such as the presence/
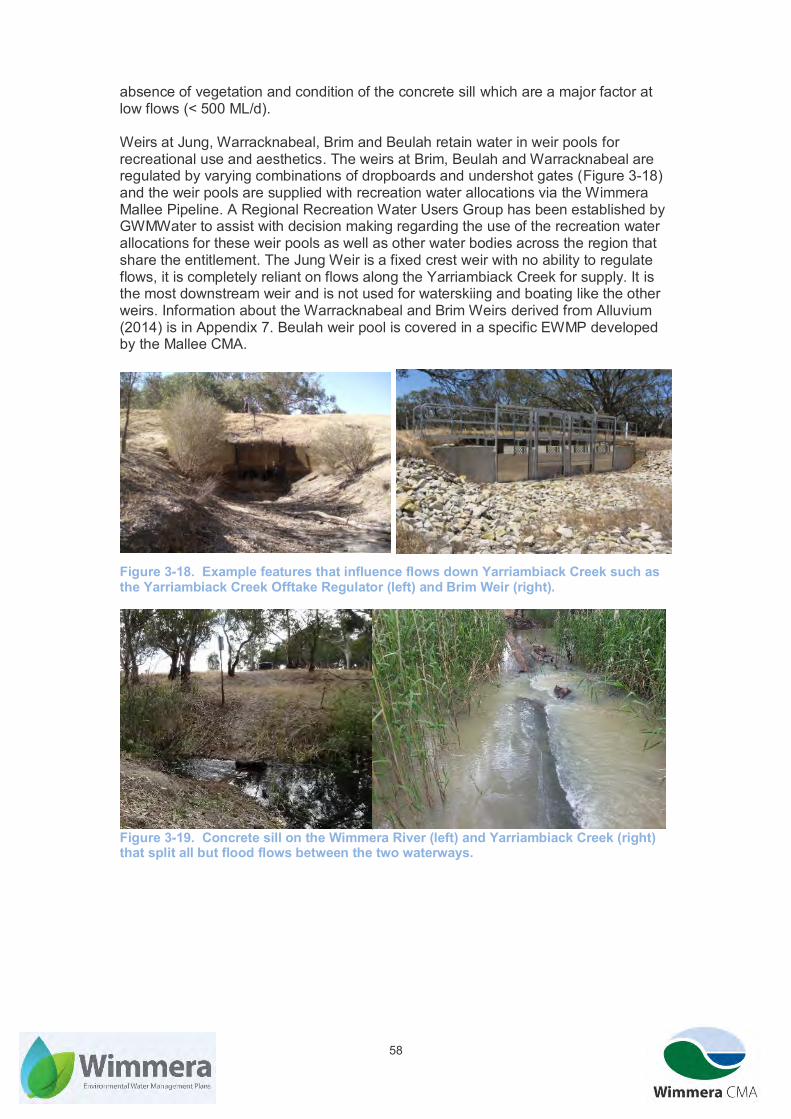
58
absence of vegetation and condition of the concrete sill which are a major factor at low flows (< 500 ML/d). Weirs at Jung, Warracknabeal, Brim and Beulah retain water in weir pools for recreational use and aesthetics. The weirs at Brim, Beulah and Warracknabeal are regulated by varying combinations of dropboards and undershot gates (Figure 3-18) and the weir pools are supplied with recreation water allocations via the Wimmera Mallee Pipeline. A Regional Recreation Water Users Group has been established by GWMWater to assist with decision making regarding the use of the recreation water allocations for these weir pools as well as other water bodies across the region that share the entitlement. The Jung Weir is a fixed crest weir with no ability to regulate flows, it is completely reliant on flows along the Yarriambiack Creek for supply. It is the most downstream weir and is not used for waterskiing and boating like the other weirs. Information about the Warracknabeal and Brim Weirs derived from Alluvium (2014) is in Appendix 7. Beulah weir pool is covered in a specific EWMP developed by the Mallee CMA.
Figure 3-18. Example features that influence flows down Yarriambiack Creek such as the Yarriambiack Creek Offtake Regulator (left) and Brim Weir (right).
Figure 3-19. Concrete sill on the Wimmera River (left) and Yarriambiack Creek (right) that split all but flood flows between the two waterways.

59
Figure 3-20. Modelled flow split between Yarriambiack Creek and the Wimmera River at low to bankfull flows (3000 ML/d) (Water Technology , 2009). Yarriambiack Creek, like the Wimmera River ends in a series of terminal lakes, in this case located near Hopetoun in the southern Mallee. Lake Corrong is the most notable terminal lake, being about 600 Ha in area (Ecological Associates, 2006). Lake Lascelles is much smaller (about 20 Ha) and has been modified in the late 19th century to act as a water storage through raising an embankment between Lake Corrong and Lake Lascelles, removing the ability for it to receive inflows from the Yarriambiack Creek (Ecological Associates, 2006). Therefore it is not considered within this EWMP. Lake Lascelles is a popular recreation lake and supplied from the Wimmera Mallee Pipeline by a recreational entitlement. When Lake Corrong fills, water flows further north to a series of lakes that have been largely cleared for agriculture; Cutche Swamp, Yarrack Swamp, Thistle Lake, Lake Quandong, The Locks and Lake Myall (Ecological Associates, 2006). Like the terminal lakes of the Wimmera River, the inundation regime of these lakes is episodic, with Lake Corrong filling once every ten years on average and flows beyond the lake only happening once in the last 50 years (Ecological Associates, 2006). River regulation prior to the completion of the Wimmera Mallee Pipeline was noted to only impact on one of the lakes’ environmental values – breeding of birds dependent on flooded vegetation (Ecological Associates, 2006). Burnt Creek
Figure 3-21 is a schematic diagram showing key features associated with the Burnt Creek, Bungalally Creek and MacKenzie River. Burnt Creek is a distributary of the MacKenzie River, commencing at Distribution Heads in Laharum which was a swampy area that was modified with walls and regulators to direct flows to downstream channels and waterways. Distribution Heads and in turn Burnt Creek also receives intervalley transfers as inflows from the Moora Channel which begins at Moora Moora Reservoir in the upper Glenelg River Catchment. Water is also extracted locally at Distribution Heads from a pump into a balancing storage for Supply System 6 of the Wimmera Mallee Pipeline.

60
Figure 3-21. Schematic diagram of key features relating to the MacKenzie River, Burnt Creek, Bungalally Creek and part of the Wimmera River Prior to regulation and development, Burnt Creek would have received flows from overbank flows in the MacKenzie River at Distribution Heads, as well as from its own catchment which is near the north-western edge of the Grampians. It has been heavily modified to act as a headworks distribution channel, with water regularly transferred through winter/spring from the MacKenzie River from Distribution Heads via Burnt Creek to the Toolondo Channel which supplies Taylors Lake (Figure 3-22). The reach that flows north from the Toolondo Channel used to regularly supply water for stock and domestic purposes during February/March prior to 2003 (Earth Tech, 2005) but now flows only in response to environmental water releases or during floods. Where Burnt Creek is used as a headworks channel it has lost some of its diversity in channel shape and form due to earthworks connecting the most upstream section with Distribution Heads and other parts have enlarged in response to increases in the duration and volume of flows (Earth Tech, 2005). Whereas downstream, between the Grampians Road and Western Highway, the creek has a more intact form with a number of deep pools (Figure 2-4). Downstream of the Western Highway the creek has been channelised to improve drainage for adjacent rural and residential land (Earth Tech, 2005).

61
Figure 3-22. Burnt Creek Regulator at Distribution Heads (left) and Toolondo Channel (right). Bungalally Creek
Bungalally Creek is a distributary of the Burnt Creek that commences in East Wonwondah, and flows into the MacKenzie River, about five kilometres upstream of its confluence with the Wimmera River (Figure 3-21). Prior to regulation and development, it would have naturally flowed episodically in response to bankfull and overbank flows in Burnt Creek (likely to be between 100 ML/d and 300 ML/d). Historically its most upstream reach was used as a distribution channel for the previous stock and domestic and irrigation channel system. It was supplied by a regulator on the Toolondo Channel (Figure 3-23). This function ceased with the completion of the Wimmera Mallee Pipeline. Currently it only flows in response to environmental water releases for the Bungalally Creek itself through the regulator and during high flows and floods. There are several low-level road crossings (Figure 3-23) which make it difficult to implement the recommended flow rates without impacting adjacent landholders and attenuating peak flow rates. Similar issues exist for the Burnt Creek.
Figure 3-23. Bungalally Creek Regulator at Toolondo Channel (left) and low level crossing on the Bungalally Creek (right). MacKenzie River
The MacKenzie River’s headwaters flow into Lake Wartook, the highest storage in the Grampians headworks system (Figure 3-21). From Lake Wartook, the MacKenzie River flows perennially through the Grampians National Park to Dad and Dave Weir

62
(Figure 3-24). This structure is used to divert water via a pipe into the Mt Zero Channel for Horsham’s water supply. Downstream of Dad and Dave Weir, the MacKenzie River flows down to Distribution Heads due to environmental water releases during drier months (typically summer/autumn) and during wetter months inflows from tributaries downstream of Lake Wartook as well as occasional transfers (e.g. to maintain airspace for flood mitigation) are diverted down the MacKenzie River through Distribution Heads to the Burnt Creek and Toolondo Channel to Taylor’s Lake. Flow can also be directed over a weir at Distribution Heads to the lower MacKenzie River (Figure 3-24). Only environmental water releases or spills are released into the lower MacKenzie River. Section 3.1 contains details around the severe impact regulation has historically had on streamflows in the lower MacKenzie River.
Figure 3-24. Dad and Dave Regulator on the MacKenzie River (left) and Distribution Heads (right).
3.2.2.Historic Environmental Watering The Wimmera River has one of the longest records of environmental watering in Victoria. In early 1988 water was released down the Wimmera River with the intent of improving the water quality in pools that had become hypersaline (Anderson & Morison, 1989). Since the 1990’s infrastructure projects, initially the Northern Mallee Pipeline and later the Wimmera Mallee Pipeline created water savings that led to environmental water being periodically released in the Wimmera River system to enhance water quality and provide habitat for fish and platypuses. Drought from 1997 to 2009 severely restricted the allocations available for environmental watering (Figure 3-25). In 2006 and 2009, the Minister for Water temporarily altered arrangements in the Environmental Entitlement to boost supplies for consumptive use, water quality in storages and firefighting which prevented planned environmental water releases (VAGO, 2010).
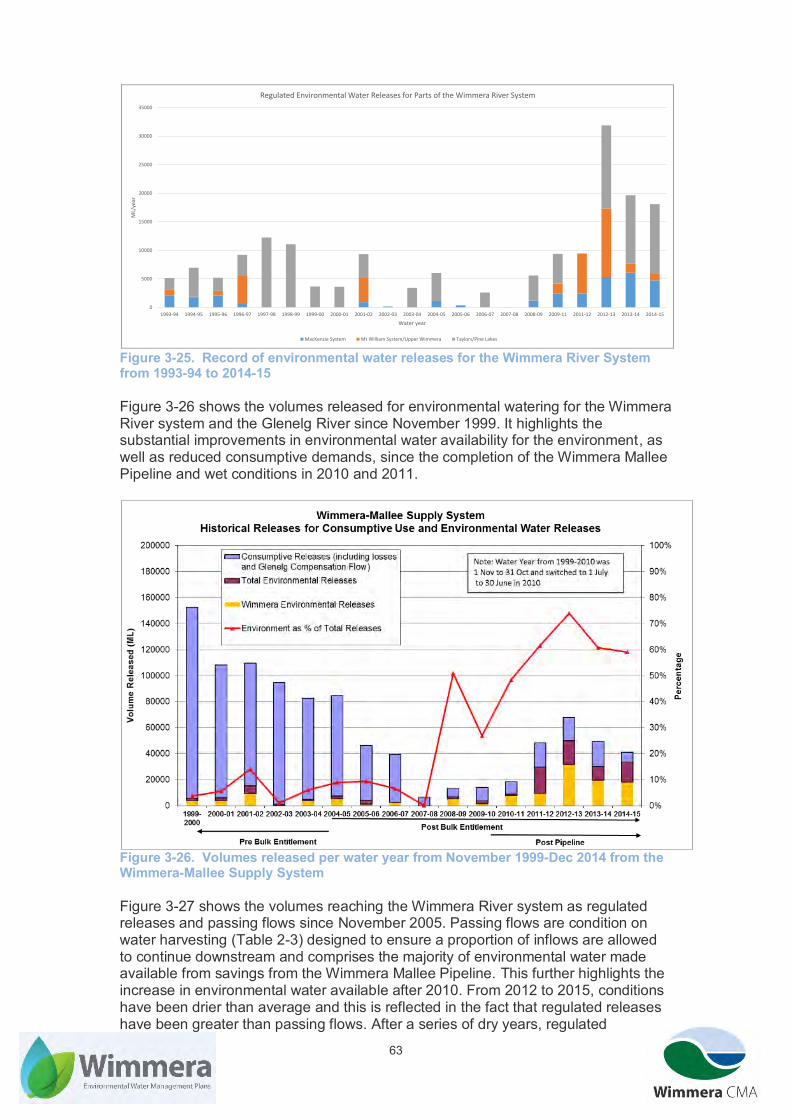
63
Figure 3-25. Record of environmental water releases for the Wimmera River System from 1993-94 to 2014-15 Figure 3-26 shows the volumes released for environmental watering for the Wimmera River system and the Glenelg River since November 1999. It highlights the substantial improvements in environmental water availability for the environment, as well as reduced consumptive demands, since the completion of the Wimmera Mallee Pipeline and wet conditions in 2010 and 2011.
Figure 3-26. Volumes released per water year from November 1999-Dec 2014 from the Wimmera-Mallee Supply System Figure 3-27 shows the volumes reaching the Wimmera River system as regulated releases and passing flows since November 2005. Passing flows are condition on water harvesting (Table 2-3) designed to ensure a proportion of inflows are allowed to continue downstream and comprises the majority of environmental water made available from savings from the Wimmera Mallee Pipeline. This further highlights the increase in environmental water available after 2010. From 2012 to 2015, conditions have been drier than average and this is reflected in the fact that regulated releases have been greater than passing flows. After a series of dry years, regulated
0
5000
10000
15000
20000
25000
30000
35000
1993-94 1994-95 1995-96 1996-97 1997-98 1998-99 1999-00 2000-01 2001-02 2002-03 2003-04 2004-05 2005-06 2006-07 2007-08 2008-09 2009-11 2011-12 2012-13 2013-14 2014-15
ML/
year
Water year
Regulated Environmental Water Releases for Parts of the Wimmera River System
MacKenzie System Mt William System/Upper Wimmera Taylors/Pine Lakes

64
allocations diminish, leading to substantially reduced volumes of all sources of environmental water. This was the case for the 2015-16 water year with only a 1% allocation available by September 2015 for high reliability entitlements. Although substantial water savings have been generated by the construction of the Northern Mallee and Wimmera Mallee Pipelines (Section 3.1) and through purchase of irrigation entitlements, dry conditions will still lead to impacts on the environmental values of these waterways (Section 6.4).
Figure 3-27. Volumes released/passed to the Wimmera River system under the Wimmera Glenelg Flora and Fauna Bulk Entitlement/Environmental Entitlement to maintain/improve environmental values from November 2005 to July 2014.
4. Water Dependent Values All of the waterways covered in this EWMP were noted as high value waterways in the WWS, meaning that they have at least one high environmental, social or economic value. The concept of high value waterways comes from the VWMS where certain characterisitics such as the presence of threatened species, a popular recreational fishing location or water storage would mean that a waterway possessed high environmental, social and economic values respectively. The Wimmera and MacKenzie Rivers, Yarriambiack Creek, Lake Hindmarsh and Lake Albacutya had such an abundance of high values for social and environmental attributes that they were deemed to be priority waterways for management activities in the WWS. Priority waterways are a subset of high value waterways where feasible and effective management activities (such as weed control or environmental water management) can be undertaken to improve or maintain their condition.
0
5000
10000
15000
20000
25000
30000
35000
2005-06 2006-07 2007-08 2008-09 2009-10 2010-11 2011-12 2012-13 2013-14
ML
Year
Environmental Water Releases for the Wimmera River System
Regulated releases Passing flows
Note: passing flows only available since 2008-09

65
4.1.Water Dependent Environmental Values
4.1.1.Listings and Significance
A number of waterways within the Wimmera River System have been listed under legislation and other formal instruments (Table 4-1). The Wimmera River from Polkemmet (near Horsham) to the Wirrengren Plain is a Heritage River under the Victorian Heritage Rivers Act (1992) due to its significant nature conservation, recreation, scenic or cultural heritage attributes and is also included in the Directory of Nationally Important Wetlands. Lake Albacutya is wetland of international significance listed under the Ramsar Convention. Lake Hindmarsh and the section of the Wimmera River that is classified as a Heritage River is also listed on the Directory of Nationally Important Wetlands. The environmental values for which Lake Hindmarsh was recognised as a nationally significant wetland (Department of Environment, 2015) are:
It is a good example of a wetland type occurring within a biogeographic region in Australia;
Plays an important ecological or hydrological role in the natural functioning of a major wetland complex;
Important as the habitat for animal taxa at a vulnerable stage in their life cycles, or provides a refuge when adverse conditions such as drought prevail; and
It is of outstanding historical or cultural significance.
For Lake Albacutya the environmental criteria for its listing as a nationally significant wetland are the same as the first three listed for Lake Hindmarsh above as well as fact that the lake supports 1% or more of the national populations of any native plant or animal taxa. The criteria for which Lake Albacutya is Ramsar-listed are similar and are listed following (Cibilic & White, 2010):
Contains a representative, rare, or unique example of a natural or near-natural wetland type found within the appropriate biogeographic region;
Supports vulnerable, endangered, or critically endangered species or threatened ecological communities;
Supports populations of plant and/or animal species important for maintaining the biological diversity of a particular biogeographic region;
Regularly supports 20,000 or more waterbirds; and Regularly supports 1% of the individuals in a population of one species or
sub-species of waterbird
The Wimmera River System supports 36 flora and fauna species that are listed as threatened at either the National or State level (Tables 4-2 to 4-8). Lake Hindmarsh and Lake Albacutya also support a number of migratory bird species included in International agreements (Table 4-5).
Table 4-1 Lists developed under legislation, agreements or conventions that apply to the Wimmera River System List Jurisdiction Rivers/
Creeks
Lakes
Japan Australia Migratory Birds Agreement (JAMBA) International X
China Australia Migratory Birds Agreement (CAMBA) International X
Republic of Korea Australia Migratory Birds Agreement International X

66
List Jurisdiction Rivers/
Creeks
Lakes
(ROKAMBA)
Convention on the Conservation of Migratory Species of Wild
Animals (Bonn Convention)
International X
Convention on Wetlands of International Importance, especially
as Waterfowl Habitat (Ramsar Convention)
International X
Environmental Protection and Biodiversity Conservation Act 1999
(EPBC Act)
National
Directory of Nationally Important Wetlands National
Flora and Fauna Guarantee Act 1988 (FFG Act) State
DELWP Advisory Lists State
Heritage Rivers Act 1992 State
4.1.2.Fauna The following section outlines the various flow dependent fauna species that have been observed in and around the Wimmera River system, in particular threatened species. A complete list of fauna species is in Appendix 4, whilst waterway dependent threatened species are listed in the following sections. The Wimmera River sustains three threatened fish species although they have all introduced to the region from elsewhere in Australia (SKM, 2006) (Table 4-2). Murray Cod (Maccullochella peelii) and Silver Perch (Bidyanus bidyanus) are stocked and are believed to not be self-sustaining. Murray Cod are now only stocked in Taylor’s Lake and so may occasionally enter the Wimmera River when water is released into the river. Freshwater Catfish (Tandanus tandanus) is found in the Wimmera River and Yarriambiack Creek and is self-sustaining. Golden Perch (Macquaria ambigua) is found in the Wimmera River also listed as ‘near threatened’ on the Advisory List of Threatened Vertebrate Fauna of Victoria (DSE, 2013). However this only applies to natural populations and Golden Perch is not endemic to the Wimmera River System and not self-sustaining. River Blackfish (Gadopsis marmoratus) found in the MacKenzie River are believed to be part of a genetically distinct subspecies confined to the Wimmera and Glenelg systems (Hammer, Unmack, Adams, Raadik, & Johnson, 2014) but has no formal status with regards to being threatened. Table 4-2 Threatened Fish Species in the Wimmera River System and associated status
Species name Common
name
EPBC Act
status
FFG Act Status Vic Advisory
List Status
Reaches
Applicable
Bidyanus bidyanus Silver Perch Threatened Vulnerable Wimmera 2-4
Maccullochella peelii
peelii
Murray Cod Vulnerable Threatened Vulnerable Wimmera 2-4
Tandanus tandanus Freshwater
Catfish
Threatened Endangered Wimmera 2-4
EPBC: Environment and Biodiversity Conservation Act, FFG: Flora and Fauna Guarantee Act The Wimmera River System can be broken into two separate fish communities, upland and lowland with transition zones between them located in the lower Mt William Creek and Reach 3 of the MacKenzie River. The upland fish community comprises endemic species such as River Blackfish, Southern Pygmy Perch
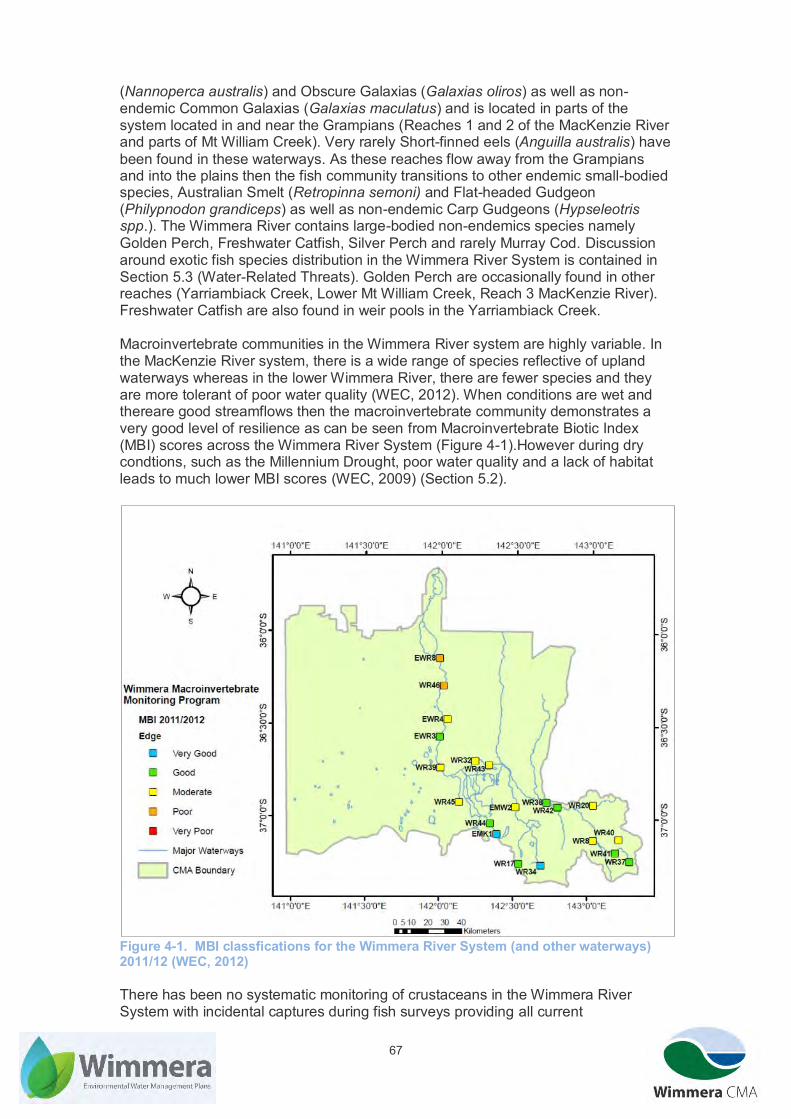
67
(Nannoperca australis) and Obscure Galaxias (Galaxias oliros) as well as non-endemic Common Galaxias (Galaxias maculatus) and is located in parts of the system located in and near the Grampians (Reaches 1 and 2 of the MacKenzie River and parts of Mt William Creek). Very rarely Short-finned eels (Anguilla australis) have been found in these waterways. As these reaches flow away from the Grampians and into the plains then the fish community transitions to other endemic small-bodied species, Australian Smelt (Retropinna semoni) and Flat-headed Gudgeon (Philypnodon grandiceps) as well as non-endemic Carp Gudgeons (Hypseleotris spp.). The Wimmera River contains large-bodied non-endemics species namely Golden Perch, Freshwater Catfish, Silver Perch and rarely Murray Cod. Discussion around exotic fish species distribution in the Wimmera River System is contained in Section 5.3 (Water-Related Threats). Golden Perch are occasionally found in other reaches (Yarriambiack Creek, Lower Mt William Creek, Reach 3 MacKenzie River). Freshwater Catfish are also found in weir pools in the Yarriambiack Creek. Macroinvertebrate communities in the Wimmera River system are highly variable. In the MacKenzie River system, there is a wide range of species reflective of upland waterways whereas in the lower Wimmera River, there are fewer species and they are more tolerant of poor water quality (WEC, 2012). When conditions are wet and thereare good streamflows then the macroinvertebrate community demonstrates a very good level of resilience as can be seen from Macroinvertebrate Biotic Index (MBI) scores across the Wimmera River System (Figure 4-1).However during dry condtions, such as the Millennium Drought, poor water quality and a lack of habitat leads to much lower MBI scores (WEC, 2009) (Section 5.2).
Figure 4-1. MBI classfications for the Wimmera River System (and other waterways) 2011/12 (WEC, 2012) There has been no systematic monitoring of crustaceans in the Wimmera River System with incidental captures during fish surveys providing all current

68
data.Threatened invertebrate (crustacean) species within the Wimmera River System include Western Swamp Crayfish (Gramastacus insolitus) in the upper Burnt Creek (Biosis, 2013), Western Crayfish (Geocharax falcata) in the Mt William Creek (Biosis, 2012) and Glenelg Spiny Crayfish (Euastacus bispinosis) in the upper MacKenzie River (M. Burns, DEDJTR, pers. comm.) (Table 4-3). Table 4-3 Threatened Invertebrate Species in the Wimmera River System and associated status
Species name Common name EPBC Act
status
FFG Act
Status
Vic Advisory
List Status
Reaches
Applicable
Gramastacus insolitus Western Swamp
Crayfish
Threatened Critically
Endangered
Upper Burnt
Ck
Euastacus bispinosis Glenelg Spiny
Crayfish
Threatened Endangered MacKenzie 1
Geocharax falcata Western Crayfish Endangered Lower Mt
William Ck
EPBC: Environment and Biodiversity Conservation Act, FFG: Flora and Fauna Guarantee Act Other water-dependent species of conservation significance occurring in the Wimmera River system include a number of frog species including Growling Grass Frog (Litoria raniformis) and Eastern Long-Necked Turtle (Chelodina longicollis). There are also a number of other frog species supported by the Wimmera River as well as Rakali (Hydromys chrysogaster) and Platypus (Ornithorhynchus anatinus). Apart from Platypus, there has been no systematic monitoring of these species so their distribution patterns and population trends are not well known. Although not listed a threatened species, Platypus is highly vulnerable in the Wimmera with the only confirmed population being in the MacKenzie River with a total of 14 individuals recorded from 2008 to 2015 (cesar, 2015). Isolated sightings indicate that platypuses are in the Wimmera River although they must be in extremely low numbers as recent surveys have failed to capture any (cesar, 2013). Amphibians and reptiles of conservation significance in the Wimmera River System are listed in Table 4-4. Table 4-4 Threatened amphibians and reptiles in the Wimmera River System and associated status
Species name Common name EPBC Act
status
FFG Act
Status
Vic Advisory
List Status
Reaches
Applicable
Litoria raniformis Growling Grass
Frog
Vulnerable Threatened Endangered Wimmera 2-4
Chelodina longicollis Eastern Long-
Necked Turtle
Data deficient All
EPBC: Environment and Biodiversity Conservation Act, FFG: Flora and Fauna Guarantee Act The Wimmera River system has an abundance of bird species, partly due to migratory waterbirds and waders in the terminal lakes when they are inundated. For example Lake Albacutya has supported over 20,000 waterbirds when flooded and 13 migratory species, many of which are listed under international treaties (Cibilic & White, 2010). Non-waterbirds take advantage of the conditions provided by environmental water releases with a greater diversity of bush birds observed where flows are taking place (Wimmera CMA, 2012). Waterbirds of conservation significance that occur in the Wimmera River system are listed in Table 4-5.
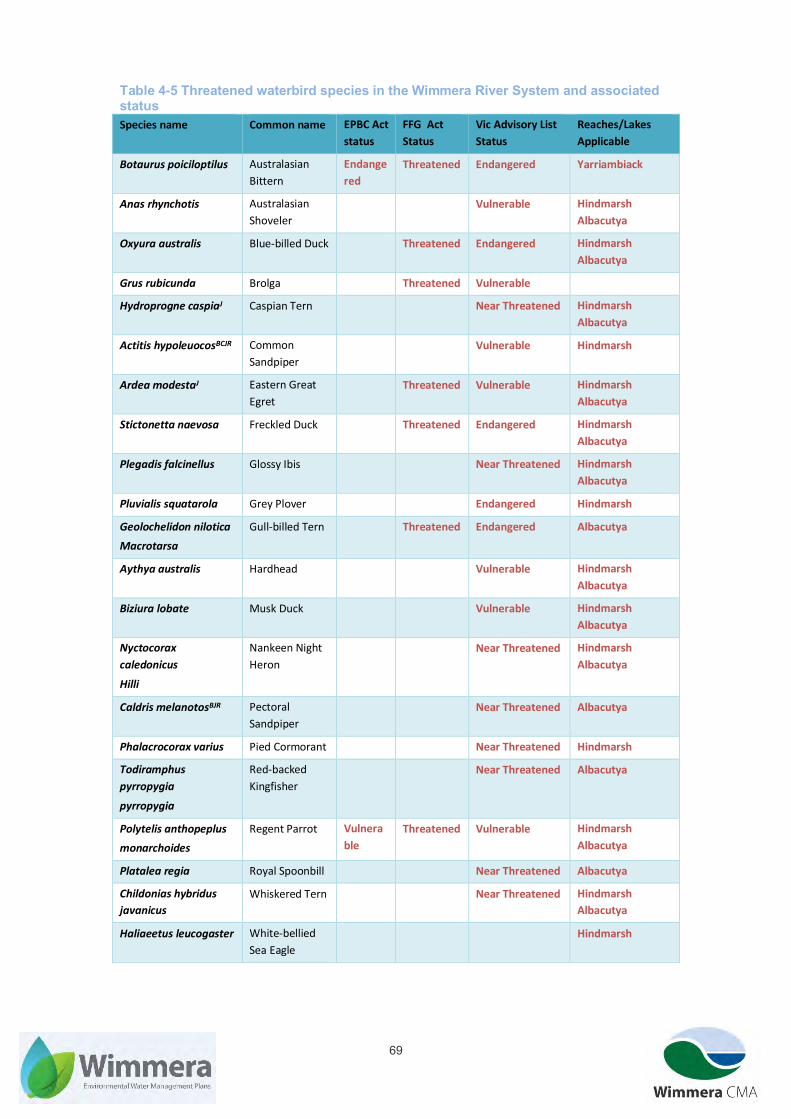
69
Table 4-5 Threatened waterbird species in the Wimmera River System and associated status
Species name Common name EPBC Act
status
FFG Act
Status
Vic Advisory List
Status
Reaches/Lakes
Applicable
Botaurus poiciloptilus Australasian
Bittern
Endange
red
Threatened Endangered Yarriambiack
Anas rhynchotis Australasian
Shoveler
Vulnerable Hindmarsh
Albacutya
Oxyura australis Blue-billed Duck Threatened Endangered Hindmarsh
Albacutya
Grus rubicunda Brolga Threatened Vulnerable
Hydroprogne caspiaJ Caspian Tern Near Threatened Hindmarsh
Albacutya
Actitis hypoleuocosBCJR Common
Sandpiper
Vulnerable Hindmarsh
Ardea modestaJ Eastern Great
Egret
Threatened Vulnerable Hindmarsh
Albacutya
Stictonetta naevosa Freckled Duck Threatened Endangered Hindmarsh
Albacutya
Plegadis falcinellus Glossy Ibis Near Threatened Hindmarsh
Albacutya
Pluvialis squatarola Grey Plover Endangered Hindmarsh
Geolochelidon nilotica
Macrotarsa
Gull-billed Tern Threatened Endangered Albacutya
Aythya australis Hardhead Vulnerable Hindmarsh
Albacutya
Biziura lobate Musk Duck Vulnerable Hindmarsh
Albacutya
Nyctocorax
caledonicus
Hilli
Nankeen Night
Heron
Near Threatened Hindmarsh
Albacutya
Caldris melanotosBJR Pectoral
Sandpiper
Near Threatened Albacutya
Phalacrocorax varius Pied Cormorant Near Threatened Hindmarsh
Todiramphus
pyrropygia
pyrropygia
Red-backed
Kingfisher
Near Threatened Albacutya
Polytelis anthopeplus
monarchoides
Regent Parrot Vulnera
ble
Threatened Vulnerable Hindmarsh
Albacutya
Platalea regia Royal Spoonbill Near Threatened Albacutya
Childonias hybridus
javanicus
Whiskered Tern Near Threatened Hindmarsh
Albacutya
Haliaeetus leucogaster White-bellied
Sea Eagle
Hindmarsh

70
EPBC: Environment and Biodiversity Conservation Act, FFG: Flora and Fauna Guarantee Act, J denotes species is listed under JAMBA treaty, C denotes species is listed under CAMBA treaty, R denotes species is listed under ROKAMBA treaty, B denotes species is listed under Bonn Convention
4.1.3.Flora and Vegetation Communities The Wimmera Bulk Entitlement Conversion Environmental Flows Study (SKM, 2003) noted that 135 threated flora species occur in the Wimmera River catchment, and of these 24 species were considered reliant on waterways for their survival. Dyer and Roberts (2006) reviewed these species and concluded only four were possibly flow-dependent, the others not being found in the Wimmera River system, rather associated with nearby salt lakes. A comprehensive list of flora species located in or adjacent to waterways considered in this EWMP is presented in Appendix 4. They have been recorded in riparian and wetland areas through the Victorian Biodiversity Atlas as well as vegetation monitoring undertaken for the Victorian Environmental Flows Monitoring and Assessment Program (VEFMAP). Because the Wimmera River System flows from the edge of the Grampians to the southern Mallee, it supports a wide variety of vegetation communities. Due to widespread clearing for agriculture, many of these vegetation communities are now spatially restricted compared to their pre-European settlement distribution and extent. Much of the Wimmera River System is dominated by an overstorey of River Red Gums (Eucalyptus camaldulensis). The Lake Albacutya provenance of River Red Gum is renowned globally for its salt-tolerance. However Black Box (Eucalyptus largiflorens) is the dominant overstorey species for the northern section of the Yarriambiack Creek (downstream of Warracknabeal) and part of the Wimmera River where salinity has killed the larger River Red Gums. Table 4-6 and Table 4-7 list the riparian and wetland Ecological Vegetation Classes (EVCs), their conservation status and the relevant reaches/lakes where they are found. Submerged vegetation (e.g. Triglochin, Vallisneria, Potamogeton) and emergent vegetation (e.g. Typha, Phragmites, Eleocharis) are also a notable feature of the Wimmera River System. They provide a nursery for small-bodied native fish like Southern Pygmy Perch (B. McInnes, Wimmera CMA pers. comm) and habitat for birds like Australian Reed-Warblers (Acrocephalus australis) (Wimmera CMA, 2012). They are also a valuable sink for nutrients (namely nitrogen and phosphorus) which in turn reduces their availability for blue-green algae blooms (Roberts, Grace, Sherwood, Lind, & Nash, 2006). Table 4-6 EVCs in the Wimmera River system dependent on flows/inundation and their Bioregional Conservation Status
EVC Name Bioregion(s) Bioregional
Conservatio
n Status
Wimm
era &
Outlet
MacKenzi
e 1/2 &
Burnt
Upper
MacKenzi
e 3 &
Burnt
Lower
Bungalal
ly &
Yarriam
biack
Mt
William
Creek
Riverine Chenopod
Woodland
Wimmera Endangered
Murray Mallee Depleted
Riparian Woodland Wimmera/
Lowan Mallee/
Murray Mallee
Vulnerable
Intermittent
Swampy Woodland
Murray Mallee Vulnerable
Intermittent
Swampy Woodland/
Riverine Grassy
Lowan Mallee/
Murray Mallee
Vulnerable

71
EVC Name Bioregion(s) Bioregional
Conservatio
n Status
Wimm
era &
Outlet
MacKenzi
e 1/2 &
Burnt
Upper
MacKenzi
e 3 &
Burnt
Lower
Bungalal
ly &
Yarriam
biack
Mt
William
Creek
Woodland
Lignum Swampy
Woodland
Wimmera/
Murray Mallee
Vulnerable
Shallow Freshwater
Marsh
Dundas
Tablelands
Vulnerable
Red Gum Swamp Wimmera Vulnerable
Damp Sands Herb-
rich Woodland
Dundas
Tablelands
Vulnerable
Shrubby
Woodland/Damp
Sands Herb-rich
Woodland Complex
Dundas
Tablelands
Least
Concern
Floodplain Riparian
Woodland
Wimmera Endangered
Riverine Grassy
Woodland/ Sedgy
Riverine Forest/
Aquatic Herbland
Mosaic
Wimmera Vulnerable
Plains Riparian
Shrubby Woodland
Wimmera Vulnerable
Damp Sands Herb-
rich Woodland/
Shrubby Woodland
Mosaic
Wimmera Vulnerable
Plains Woodland/
Plains Sedgy
Woodland/ Damp
Sands Herb-rich
Woodland Mosaic
Wimmera Endangered
Sand Ridge
Woodland/ Damp
Sands Herb-rich
Woodland Mosaic
Wimmera Endangered
Table 4-7 EVCs in the terminal lakes of the Wimmera River System and their Bioregional Conservation Status
EVC Name Bioregion(s) Bioregional
Conservatio
n Status
Hindmarsh Albacutya Others
Intermittent Swampy Woodland Murray Mallee Vulnerable
Intermittent Swampy Woodland/
Riverine Grassy Woodland Complex
Murray Mallee/
Lowan Mallee
Vulnerable
Lake Bed Herbland Murray Mallee Depleted
(Corrrong)
Lunette Woodland Wimmera Endangered
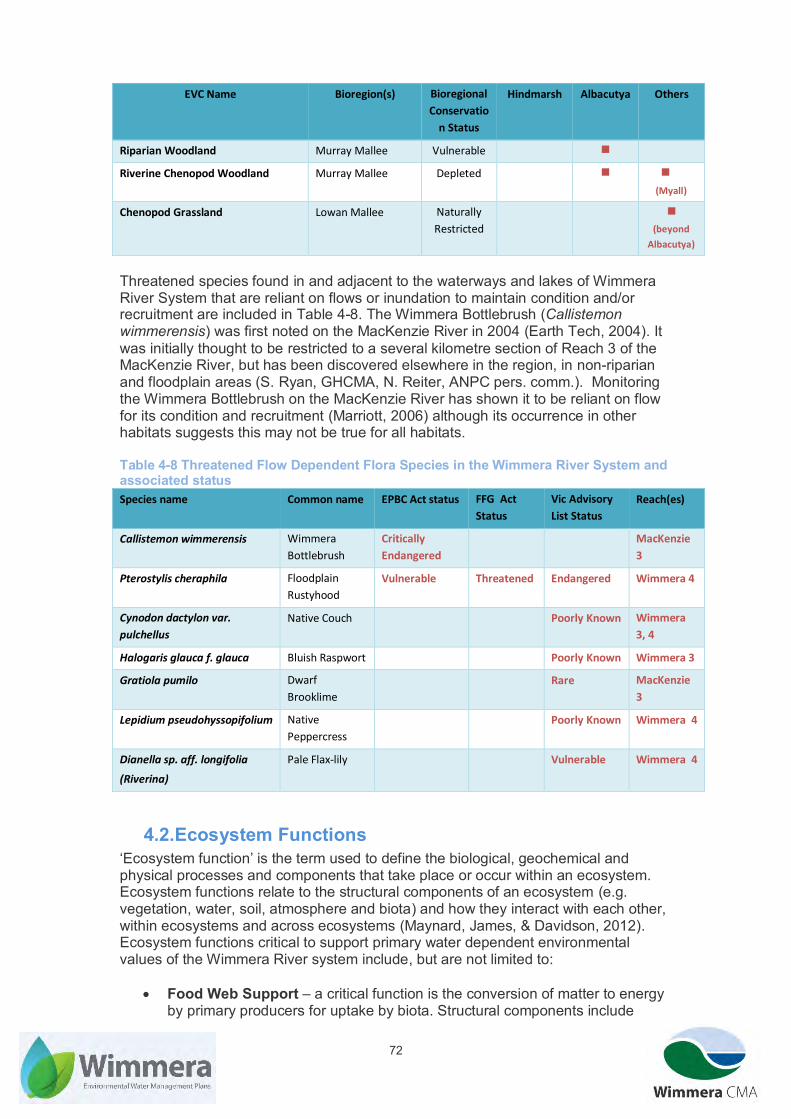
72
EVC Name Bioregion(s) Bioregional
Conservatio
n Status
Hindmarsh Albacutya Others
Riparian Woodland Murray Mallee Vulnerable
Riverine Chenopod Woodland Murray Mallee Depleted
(Myall)
Chenopod Grassland Lowan Mallee Naturally
Restricted
(beyond
Albacutya)
Threatened species found in and adjacent to the waterways and lakes of Wimmera River System that are reliant on flows or inundation to maintain condition and/or recruitment are included in Table 4-8. The Wimmera Bottlebrush (Callistemon wimmerensis) was first noted on the MacKenzie River in 2004 (Earth Tech, 2004). It was initially thought to be restricted to a several kilometre section of Reach 3 of the MacKenzie River, but has been discovered elsewhere in the region, in non-riparian and floodplain areas (S. Ryan, GHCMA, N. Reiter, ANPC pers. comm.). Monitoring the Wimmera Bottlebrush on the MacKenzie River has shown it to be reliant on flow for its condition and recruitment (Marriott, 2006) although its occurrence in other habitats suggests this may not be true for all habitats. Table 4-8 Threatened Flow Dependent Flora Species in the Wimmera River System and associated status
Species name Common name EPBC Act status FFG Act
Status
Vic Advisory
List Status
Reach(es)
Callistemon wimmerensis Wimmera
Bottlebrush
Critically
Endangered
MacKenzie
3
Pterostylis cheraphila Floodplain
Rustyhood
Vulnerable Threatened Endangered Wimmera 4
Cynodon dactylon var.
pulchellus
Native Couch Poorly Known Wimmera
3, 4
Halogaris glauca f. glauca Bluish Raspwort Poorly Known Wimmera 3
Gratiola pumilo Dwarf
Brooklime
Rare MacKenzie
3
Lepidium pseudohyssopifolium Native
Peppercress
Poorly Known Wimmera 4
Dianella sp. aff. longifolia
(Riverina)
Pale Flax-lily Vulnerable Wimmera 4
4.2.Ecosystem Functions ‘Ecosystem function’ is the term used to define the biological, geochemical and physical processes and components that take place or occur within an ecosystem. Ecosystem functions relate to the structural components of an ecosystem (e.g. vegetation, water, soil, atmosphere and biota) and how they interact with each other, within ecosystems and across ecosystems (Maynard, James, & Davidson, 2012). Ecosystem functions critical to support primary water dependent environmental values of the Wimmera River system include, but are not limited to:
Food Web Support – a critical function is the conversion of matter to energy by primary producers for uptake by biota. Structural components include

73
substrate surfaces (e.g. large woody habitat and rocks) for biofilms, and plant matter. Interactions between primary producers and consumers such as zooplankton and macroinvertebrates break down the carbon and nutrients required for higher order consumers.
Reproduction – recruitment of new individuals is important for all of the river system’s biota and the maintenance of local and regional populations. Flows and inundation can act as cues for fish to spawn through changing water temperatures and habitat availability (e.g. inundating fringing vegetation) (Lintermans, 2007). It also prompts the reproduction of vegetation, for example Wimmera Bottlebrush has shown a strong recruitment response to flows (Marriott, 2006).
Movement/Dispersal – movement of individuals throughout various waterway habitats to take advantage of different resources is linked to the food web support. By providing flows of differing volumes, different areas of the river are accessible for foraging by fish, waterbirds, other aquatic fauna and propagules. Variability in lake levels is also an important mechanism to disperse species and provide a range of habitats. Flow and connectivity also facilitate the dispersal of different species up and down the Wimmera River System which is especially important following dry spells to allow recolonisation.
Landscape Contribution – the waterways of the Wimmera River system are crucial to the overall biodiversity of the broader Murray Darling Basin and south-east Australia as a whole. The terminal lakes are crucial breeding sites for a variety of waterbirds, there is an abundance of freshwater crayfish species as well as species such as the Wimmera Bottlerbrush and River Blackfish (Northern Glenelg/Wimmera subspecies) that have a limited distribution. Physical features such as anastomosing streams and chain-of-ponds systems are also rare across south-eastern Australia and there are some notable examples in the Wimmera River system.
A summary of how this EWMP will address various ecosystem functions is given in Table 4-9. This table also shows which ecosystems functions are being specifically addressed in this EWMP by using the ecosystem functions structure suggested in the Basin Plan (Australian Government, 2012).
MacKenzie River at Zumsteins, December 2010

74
Table 4-9 Ecosystem Functions listed in Schedule 9 of the Basin Plan that are met in the Wimmera River system. Criteria Meets
criterion Explanation
1.
The ecosystem function supports the creation and maintenance of vital habitats and populations Assessment indicator: An ecosystem function requires environmental watering to sustain it if it provides vital habitat including:
(a) A refugium for native water-dependent biota during dry periods and drought; or
The Wimmera River has deep pools (including weir pools) which provide refuge for aquatic fauna (notably Freshwater Catfish, Golden and Silver Perch) during seasonal dry phases and extended droughts. Providing low flows during seasonally dry and very dry conditions will maintain this refuge habitat and ensure its water quality (salinity) remains within the tolerance range of the dependent fauna.
(b) Pathways for the dispersal, migration and movement of native water dependent biota; or
Flows enable some species (e.g. platypus) to disperse and genetic mixing of some species (e.g. Mountain Galaxias and Southern Pygmy Perch).
(c) A diversity of important feeding, breeding and nursery sites for native water-dependent biota; 0r
The Wimmera River System contains one of four self-sustaining Freshwater Catfish population in Victoria (DSE, 2005) with suitable habitat for nesting sites. Stretches of the Burnt and Mt William Creeks as well as the MacKenzie River are key locations for the breeding of Southern Pygmy Perch and Mountain Galaxias. There has been evidence of platypus breeding in the MacKenzie River (cesar, 2014).
(d) A diversity of aquatic environments including pools, riffle and run environments; or
The Wimmera River is characterised by the deep pools, particularly near Dimboola. These pools have runs in between to provide a diversity of habitat. This morphology is similar for the lower Burnt and Mt William Creeks as well as parts of the MacKenzie River. The reaches of the MacKenzie River and Mt William Creek located near the Grampians contain more of a rocky substrate and so have riffles as well.
(e) A vital habitat this is essential for preventing the decline of native water-dependent biota.
Experience during the drought has shown that without environmental water releases, native fish species are at a very high risk of being lost from the region, riparian vegetation rapidly declines, macroinvertebrate communities become depauperate and other species like platypus and ralaki are vulnerable to becoming regionally extinct.

75
Criteria Meets criterion
Explanation
Environmental watering has enabled these impacts to be minimised and facilitated recovery.
2
The ecosystem function supports the transportation and dilution of nutrients, organic matter and sediment Assessment indicator: An ecosystem function requires environmental watering to sustain it if it provides for the transportation and dilution of nutrients, organic matter and sediment, including:
(a) Pathways for the dispersal and movement of organic and inorganic sediment, delivery to downstream reaches and the ocean, and to and from the floodplain; or
The Wimmera River System flows into a series of terminal lakes, including ones of national and international importance. Inputs of organic and inorganic sediment are vital for the establishment and maintenance of food webs that support an abundance of birds, fish and other aquatic species when the lakes contain water.
(b) The dilution of carbon and nutrients from the floodplain to the river systems.
Experience from the floods of 2010 and 2011 showed that environmental water releases were critical for managing the issues of blackwater and eutrophication created by large quantities of carbon and nutrients washing off floodplains into waterways.
3
The ecosystem function provides connections along a watercourse (longitudinal connections) Assessment indicator: An ecosystem function requires environmental watering to sustain it if it provides connections along a watercourse or to the ocean, including longitudinal connections:
(a) For dispersal and re-colonisation of native water-dependent communities; or
Monitoring has shown the re-establishment of platypus, Mountain Galaxias and Southern Pygmy Perch in reaches of the MacKenzie River following the provision of environmental flows.
(b) For migration to fulfil requirements of life history stages; or No endemic species of fish require migration to complete life history stages.
(c) For in-stream primary production Freshening flows along all regulated waterways are required in order to try and mobilise sediment and biofilms on woody habitat and interstitial spaces (Alluvium, 2013).
4
The ecosystem function provides connections across floodplains, adjacent wetlands and billabongs (lateral connections) Assessment indicator: An ecosystem function required environmental watering to sustain it if it provides connections across floodplains, adjacent wetlands and billabongs, including:
(a) Lateral connections for foraging, migration and re-colonisation of native water dependent species and
The Wimmera River and MacKenzie Rivers as well as Mt William Creek have high-flow channels that are engaged by

76
Criteria Meets criterion
Explanation
communities; or large fresh and bankfull flows to provide additional habitat. Furthermore many of the biota that inhabit the Wimmera River and Yarriambiack Creek enter the terminal lakes when they contain water in order to establish food webs.
(b) Lateral connections for off-stream primary production Inputs from flows are critical for primary production in high-flow channels
From left to right – Burnt Creek at Rodda’s Road, MacKenzie River at Redfin Holes, Wimmera River at Dimboola Weir Pool
77
4.3.Cultural Values The significance of the Wimmera River System to the local indigenous community is substantial. There is an indigenous creation story about a fleeing kangaroo named Purra leaving waterholes in the Wimmera River where it jumped (Pouliot, 2012), and Lake Albacutya is where Purra ate some bitter quandongs. The name Albacutya is derived from the word ‘Nalbagadja’ which means ‘place of the bitter quandongs’. “We have a huge connection to the Wimmera River; it is a creation story path and has a very special place in our hearts. It is a major part of who we are as a people.” Aunty Nancy Harrison – Wotjobaluk Elder (Pouliot, 2012) In December 2005 the Federal Court recognised the Wotjobaluk, Jaadwa, Jadawajali, Wergaia and Jupagalk people’s non-exclusive title rights for much of the lower Wimmera River, downstream of the Yarriambiack Creek offtake. These native title rights provide the right to hunt, fish, gather and camp for personal, domestic and non-commercial purposes, under traditional rights and customs. Consultation with the Barengi Gadjin Land Council who represent the traditional owners with respect to cultural heritage indicates a strong emphasis should be placed on the fact that flows used to regularly travel much further than Lakes Hindmarsh and Albacutya, reaching lakes beyond. Abundant scar trees, shell middens, burial sites and artefact scatters along these waterways, especially the Wimmera River, bear testimony to the profound connection between local Aboriginal people and the Wimmera River system. Whilst some cultural sites have been catalogued on the Victorian Aboriginal Heritage Register, many more exist along the length of the Wimmera River System. European cultural heritage values associated with the Wimmera River system include old bridges, weirs and Ebenezer Mission near Antwerp which was established in 1859 by Moravian missionaries. Many local Aboriginal people lived at the mission where a school was established and they hunted and fished in and around the Wimmera River as well as working in a garden irrigated by water from the river. The WWS (Wimmera CMA, 2014) contains a number of priorities for actions to maintain and enhance cultural values including looking at opportunities around watering Ranch Billabong and Datchak Creek, anabranches of Reach 4 of the Wimmera River that have very strong cultural values. SKM (2008) determined that flows in excess of 3000 ML/d will enter Datchak Creek. Ranch Billabong is filled during overbank flows (in excess of 6000 ML/d).
4.4.Social Values It is also acknowledged that water in the landscape provides recreational values and many of these values (e.g. fishing) directly rely on environmental flow regimes. State policy encourages consideration of social and cultural values when undertaking environmental water planning (DEPI, 2013). Horsham, Dimboola and Jeparit have town weir pools on the Wimmera River and Jung, Warracknabeal, Brim and Beulah have weir pools on the Yarriambiack Creek. There are walking tracks, picnic and barbeque facilities as well as campground adjacent to most of these, and they are a magnet for locals and tourists alike. Water skiing takes place at all weir pools apart from Jung and Jeparit when water levels are sufficient. At Jeparit, water skiing takes place downstream of the weir, near Lake Hindmarsh.

78
Fishing is very popular pastime, especially at weir pools. Golden and Silver Perch is stocked throughout the Wimmera River and Golden Perch is stocked in the Brim, Beulah and Warracknabeal weir pools. Freshwater Catfish is also a popular angling species in the Wimmera River and Yarriambiack Creek, being the only location in Victoria that they can be legally kept. Fishing competitions are huge drawcards, bringing competitors from much of Western Victoria and generating substantial revenue for community groups and local businesses. The Dimboola Rowing Regatta is an annual highlight and crews come from as far away as Melbourne and Mildura to compete. Regattas have taken place at Horsham Weir Pool and water-skiing competitions take place at a number of weir pools. Fishing is also popular in the MacKenzie River, Mt William Creek and Burnt Creek. Lakes Albacutya and Hindmarsh are also valued by the community when they contain water for water skiing and excellent fishing in particular Redfin (Perca fluviatalis) and yabbies (Cherax destructor). They are also extremely popular tourist and camping venues, for example in 1982-83 there was a total of 1142 camper nights recorded for Lake Albacutya (Cibilic & White, 2010).
4.5.Economic Values A number of reaches in the Wimmera River System comprise a vital part of the Wimmera Mallee Headworks system as described previously in Section 3.2.1 which is underpins the economic prosperity of the region supplying water for domestic, industrial and agricultural use. There are a large number of stock and domestic licences along these waterways as well as a number of irrigation licences on the Wimmera River (Table 4-10). Stock and domestic water is now largely provided by the Wimmera Mallee Pipeline and irrigation is limited due to issues around water quality (high salinity) and reliability of supply. Table 4-10 Licensed diversion details for the Wimmera River System Waterway Number of Licences
(type) Total volume (ML)
Wimmera River Reach 2 1 (Domestic and Stock) 2.2 Wimmera River Reach 3
14 (Domestic and Stock) 30.8 5 (Irrigation) 314.9
Wimmera River Reach 4
7 (Domestic) 15.4 84 (Domestic and Stock) 189.2 31 (Irrigation) 895.9
Upper Burnt Creek 1 (Domestic and Stock) 2.2 Lower Burnt Creek 14 (Domestic) 30.8
12 (Domestic and Stock) 26.4 2 (Irrigation) 23.5
Lower Mt William Creek 12 (Domestic and Stock) 26.4 2 (Irrigation) 32.3
Yarriambiack Creek 7 (Domestic and Stock) 15.4
4.6.Conceptualisation of the Wimmera River System Flows are the critical driver of a number of different physical and ecological processes for the Wimmera River system, with the variability in waterways and flows resulting in the diverse and abundant ecosystems. Conceptual understanding of these processes for key waterways of the Wimmera River system and various flow components is from Butcher (2015) and outlined in Figures 4-2 to 4-6 with
79
explanatory keys. Given the number of reaches and flow components within the Wimmera River System, a selection of flow components and reaches have been selected for representation in these conceptual diagrams. Wimmera River Reaches 2 and 3 – Bankfull Flows The rationale for delivery of bank full environmental water allocations to Reach 2 and 3 of the Wimmera River is presented in Figure 4-2. This ‘conceptual model’ illustrates the pathway and processes associated with delivery of environmental water for provision of vital habitat to support native fish, in-stream and riparian vegetation, geomorphic processes and water quality outcomes. Controlling variables beyond the influence of environmental water delivery that may affect the outcomes of the watering intervention include the quality of the water source, local climate and antecedent conditions. The delivery of environmental water is expected to lead to the germination of seeds from different functional guilds of plants (emergent, amphibious and aquatic), in-stream, on the banks and the riparian zone. The bankfull watering regime is designed to promote gains in diversity and recruitment of riparian vegetation in particular. Delivery of water to improve River Red Gum and Black Box recruitment will increase woodland complexity and promote resilience in the populations. Submergent and emergent vegetation in-stream provides vital habitat for fish and macroinvertebrates and contribute to primary productivity. In the riparian zone a number of water dependent biota, included listed species such as the Regent Parrot (Polytelis anthopeplus), and terrestrial species such as bush birds, reptiles and mammals utilise the woodlands as roosting, nesting and feeding areas. Large riparian trees contribute significant amounts of large woody debris to the river which provides hydraulic diversity and influences geomorphic processes such as deposition and scouring; provides habitat for fish and invertebrates and a substrate for biofilms which contribute to primary productivity. Bankfull flows flush sediments from substrates and import nutrients and carbon further supporting productivity. As the water levels rise from base flow to bankfull, seeds germinate and invertebrates emerge from the sediments on benches as previously dry soils are wetted. Zooplankton and macroinvertebrates are known to respond to changing flow regimes, some drifting from upstream, and are an important part of the food chain that will in turn support fish and waterbirds. Bankfull flows entrain significant amounts of organic material into the channel, with the major food web pathway being detrital, involving the microbial loop as well as invertebrates in secondary production. Bankfull conditions can facilitate fish movement and dispersal in the system, both native and introduced species especially since they drown out barriers like weirs and road crossings. Hydraulic diversity creates habitat for fish and secondary productivity provides important food resources. Waterbirds are not a major feature of the Wimmera River but some do utilise the river, especially weir pools such as fish-eating Cormorants, Darters and Pelicans.

80
Figure 4-2. Wimmera River Reach 2 and 3: stylised cross section representing bank full flows.
1. Bankfull flows in the Wimmera River, Reaches 2 and 3 contribute to maintaining structural integrity of the channel and geomorphic features such as undercut banks provide habitat for aquatic biota and hydraulic diversity.
2. Bankfull flows sustain in-stream primary productivity which in turn supports secondary productivity, including zooplankton and macroinvertebrates. The food web is detrital based (based on macroinvertebrate assemblages – e.g. Wimmera Macroinvertebrate monitoring program 2005-2012) with organic matter present on exposed banks, derived from the riparian zone, entrained during bankfull flows.
3. The Wimmera River Reach 2 and 3 has a moderate load of large woody debris which, when submerged, provides habitat for fish and macroinvertebrates, increases hydraulic diversity and provides a substrate for biofilms which contribute to in-stream primary production. Medium to large fallen trees are a common feature in these reaches, often with several large logs being present within a 50m-100m reach (Macroinvertebrate Monitoring Program, unpublished data). The logs are often anchored on the banks and only fully inundated during bankfull events.
4. The Wimmera River contains a self-sustaining population of Freshwater Catfish. Medium to large bodied native fish that are stocked are Silver Perch and Golden Perch, for recreational fishing. Bankfull
flows are an opportunity for movement and dispersal. Invasive exotic species, notably Common Carp dominate the fish biomass, and there are occasions where they have recruited in large numbers following flows (SKM, 2010).
5. In-stream submergent and emergent macrophytes are supported by bankfull flows, with littoral zone productivity high along much of the Wimmera River (Roberts, Grace, Sherwood, Lind, & Nash, 2006). Bankfull flows flood emergent macrophytes which then are available as a habitat to fish,
macroinvertebrates and large wading waterbirds.
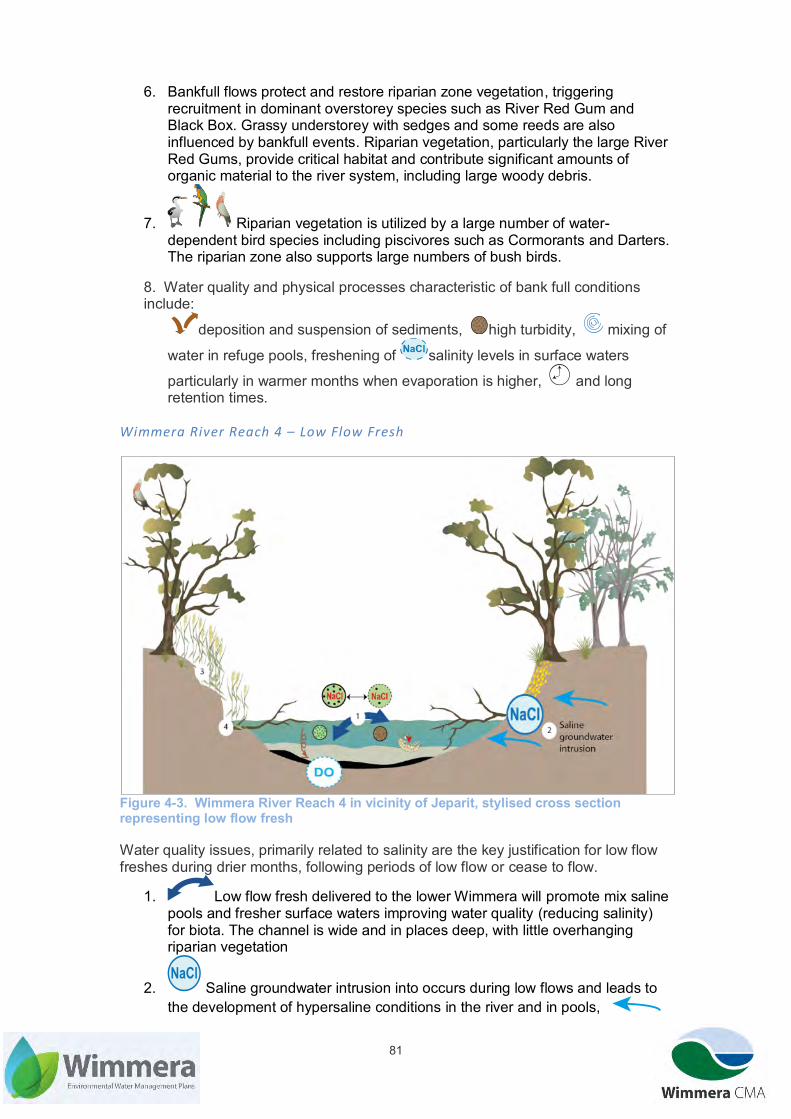
81
6. Bankfull flows protect and restore riparian zone vegetation, triggering recruitment in dominant overstorey species such as River Red Gum and Black Box. Grassy understorey with sedges and some reeds are also influenced by bankfull events. Riparian vegetation, particularly the large River Red Gums, provide critical habitat and contribute significant amounts of organic material to the river system, including large woody debris.
7. Riparian vegetation is utilized by a large number of water- dependent bird species including piscivores such as Cormorants and Darters. The riparian zone also supports large numbers of bush birds.
8. Water quality and physical processes characteristic of bank full conditions include:
deposition and suspension of sediments, high turbidity, mixing of
water in refuge pools, freshening of salinity levels in surface waters
particularly in warmer months when evaporation is higher, and long retention times.
Wimmera River Reach 4 – Low Flow Fresh
Figure 4-3. Wimmera River Reach 4 in vicinity of Jeparit, stylised cross section representing low flow fresh Water quality issues, primarily related to salinity are the key justification for low flow freshes during drier months, following periods of low flow or cease to flow.
1. Low flow fresh delivered to the lower Wimmera will promote mix saline pools and fresher surface waters improving water quality (reducing salinity) for biota. The channel is wide and in places deep, with little overhanging riparian vegetation
2. Saline groundwater intrusion into occurs during low flows and leads to the development of hypersaline conditions in the river and in pools,

82
and salt scalds on the banks. High salinity leads to reduced diversity,
notably among the invertebrates with only about a small number (7-15) of species able to tolerate the saline / hypersaline conditions (WEC, 2008).
3. Banks undergo slumping, with exposed banks become dominated by tolerant species such as Phragmites and/or Typha. Macrophyte density is reduced in the downstream reaches of Reach 4 (i.e. Jeparit) (Roberts, Grace, Sherwood, Lind, & Nash, 2006). Riparian vegetation is strongly impacted by salinity with many of the trees in the lower reaches being dead or with very limited canopy cover and poor habitat for most bush birds.
4. Low flow freshes inundate low benches which often include woody debris and small amounts of emergent vegetation, providing structural complexity lacking in the fine sediments of the main channel bottom, substrates for biofilm growth and structure for invertebrates to use to emerge from the water.
The effects of low flow freshes in Reach 4 of the Wimmera River on water quality and physical processes include:
reduction in surface water salinity, higher dissolved oxygen levels,
although this may be a short term response, instream primary productivity is phytoplankton driven and promoted with a flush of nutrients arriving with a low flow
fresh, turbidity levels typically will remain high, despite sedimentation occurring in this reach. Anoxic conditions can occur in the deeper pools with the development of black fine muds/sediments.
Figure 4-4. MacKenzie River, stylised cross section representing high flow fresh. Largely relevant for Mt William Creek as well, with the exception of Platypus. Whilst consistent baseflows are required to maintain habitat, high flow freshes are critical for triggering a range of ecological processes.

83
1. High flow freshes in the MacKenzie River are predominantly aimed at improving habitat for a range of biota, through provision of a riffle-run-pool
sequence. Platypus habitat and food resources are increased with this flow regime. The timing and volume of freshes also need to consider risks to inundating platypus breeding burrows before young platypuses are able to cope.
2. MacKenzie River has a high level of coarse woody debris and particulate organic matter with log jams a common feature in the upper reaches. The substrate is predominantly sand/cobble/boulder (Wimmera Macroinvertebrate Monitoring Program, unpublished data). Mt William Creek has finer sediments with less cobbles/boulders. High flow freshes entrain organic material into the
channel. The coarse substrate, woody debris and macrophytes provide habitat for small bodied native fish.
3. Riparian vegetation is dense, overhangs the channel and dominated by native species in the upper reaches. Further downstream, the streams run through landscapes dominated by agriculture and the density and width of the riparian zone is reduced. Macrophytes can range from sparse in the runs and riffle areas to dense in pool zones.
4. MacKenzie River supports the threatened Wimmera Bottlebrush which is influenced by bankfull and overbank flows.
Water quality and physical processes characteristic of high flow freshes in the MacKenzie River include:
high concentration of particulate organic carbon during high flow
freshes, high dissolved oxygen levels, very low salinity, very low turbidity with high water clarity in the upper reaches, low light availability in some upper reaches due to shading by the riparian zone.
Figure 4-5. Bungalally/Lower Burnt/Yarriambiack Creeks, stylised cross section representing an overbank flow. The episodic overbank watering of these waterways leads to a range of processes that are important for the maintenance and regeneration of riparian and instream vegetation.
1. Overbank flows in these small channels promote exchange of nutrients with the floodplain and also promote regeneration in riparian vegetation.

84
2. floodplain areas display a typical boom and bust cycle of seed germination and egg hatching, resulting in a plant and animal community typical of intermittent streams in semi-arid zones, and characterized by short term high productivity and temporary water specialists.
The dominant food web is detrital based on the floodplain.
3. Overbank flows promote transport and dilution of carbon both to and from the floodplain, which contribute to productivity both in-stream and off-stream.
Water quality and physical processes characteristic of overbank flows in Bungalally, lower Burnt and Yarriambiack Creeks include:
salinity is moderate and largely reflects f the source water, oxygen levels are typically good with the shallow depths of the creeks
ensuring good mixing whilst water is flowing, water retention time on the
floodplain is short, with small areas of ponding occurring. overbank flows promote transport of particulate organic carbon into the main channel system.
Figure 4-6. Lake Albacutya/Hindmarsh, stylised graphic representing lake full event. Based model developed from material in (Price & Gawne, 2009) When the terminal lakes contain water their habitat values are immense for waterbirds and fish. This is in part facilitated by the wetland vegetation which is able to regenerate and recruit during these occasions.
1. Inflows to Lake Albacutya are dependent on very wet conditions and a lake full event in Lake Hindmarsh.
2. Lake full events support significant numbers of waterbirds, in excess of 20,000 as well as a number of migratory species listed under international agreements. Exposed mudflats on the edges of the lake are primary wader and shorebird habitat, with species utilising the wetland on the rare occasions it fills.
3. Lake full events are required to sustain a resilient population demographic of the dominant tree species, River Red Gum; with a range of age classes characteristic of the long-term watering regime. The River Red Gums of Lake

85
Albacutya and Lake Hindmarsh supports the nationally threatened Regent Parrot, with one of the larger remaining breeding areas occurring at the site.
4. Once filled, Lake Albacutya and Lake Hindmarsh retains water for over a year and supports a highly productive and complex aquatic ecosystem, with features characteristic of large boom and bust ecosystems. Aquatic macrophytes establish from the seed bank and also arrive as propagules from inflows from upstream. Invertebrates hatch from the soils on wetting and establish both micro and macroinvertebrate communities which in turn support a range of fish.
5. In extremely wet conditions, Lake Albacutya overflows into the terminal wetlands of the system.
Climate change and reduced surface water availability within the catchment will likely lead to longer drier intervals. Combined these components,
processes and services are the ecological character of the Ramsar site. As well as ecological components and processes, the terminal lakes also support cultural values (both indigenous such as scar trees and European) during lake full events.
Water quality and physical processes characteristic of lake full events in the terminal lakes include:
salinity initially is low reflecting wet conditions in the catchment and
inflows from upstream, although over time as the lake dries and
evaporation increases the surface water becomes more saline. Turbidity reflect both the source water and local conditions where re-suspension of clay soils from bare ground may occur, however it is likely that
under lake full conditions the system is depositional in nature .
4.7.Significance The Wimmera River System provides a vital lifeline for the environment (and community) in a semi-arid and largely cleared environment. Its Heritage River status underlines its importance to not just the region but the entire state. The Wimmera River itself is the source of water to Lake Hindmarsh and Lake Albacutya, two of Victoria’s largest natural freshwater lakes and are nationally and internationally (Ramsar-listed) significant wetlands respectively. A large number threatened species such as Freshwater Catfish and Wimmera Bottlebrush rely on these waterways to survive and thrive. The largely intact riparian zone helps provide connectivity and a number of other ecosystem functions. The diversity and abundance of habitat from the rocky riffles in the MacKenzie River through to the deep pools filled with structural woody habitat in the Wimmera River supports hundreds of flora and fauna species (Appendix 4). Along with the variability in these waterways, variability in flow components promotes a wide range of ecosystem functions such as the cycling of nutrients and triggering of

86
recruitment. These flows also assist in mitigating threats associated with poor water quality and reductions in habitat.
5. Ecological Condition and Threats 5.1.Context
The Wimmera River System has been modified by a number of factors in the last 200 years which has affected its condition and led to ongoing threats that need addressing to prevent additional declines. Flows within the system are impacted by the presence of dams, weirs and channels. Water quality has declined due to increased nutrient and sediment inputs from eroding tributaries. Waterways intersecting with saline groundwater has also led to increased salinity issues. Exotic flora and fauna have also made their presence felt with annual grasses and pest fish species like Common Carp and Eastern Gambusia (Gambusia holbrooki) in particular becoming the dominant species in many parts of the system. However the foresight of legislators in terms of providing an element of protection to these waterways through retaining much of them as Crown land within parks, reserves or frontage has led to riparian and wetland areas retaining many of their environmental values. The condition of the Wimmera River System and the threats it faces vary depending on climatic circumstances with flood, drought and fire all having major impacts. The following sections provides an outline of the environmental values that these waterways and the threats that they currently face.
5.2.Current Condition A number of programs have assessed the condition of waterways in the Wimmera River System over the last 15 years as part of Murray Darling Basin or statewide programs or as part or more local catchment condition monitoring. Their results tell a consistent narrative about current values and trends. Sustainable River Audit (SRA) The SRA was undertaken by the Murray Darling Basin Authority at the Murray Darling Basin scale. It determined the condition of 23 river valleys based on fish, macroinvertebrates, vegetation, physical form and hydrology by comparing them to reference (pre-European) condition. The first SRA was for 2004-2007 and was based on only fish, macroinvertebrates and hydrology. The second SRA was for 2008-2010 and also included physical form and vegetation. According to the MDBA the results of the two iterations are not directly comparable (ISRAG, 2011). The Wimmera valley assessed for the SRA is larger than the area considered in this EWMP but it is generally reflective of conditions at the time. The SRA was primarily undertaken during drought conditions and before water savings from the Wimmera Mallee Pipeline were made available for the environment. These factors would have combined to affect some of the results although the metrics are referential and so would have had allowances for impacts brought about dry conditions. The results are summarised in Table 5-1 with more detail available in ISRAG (2008 and 2011). It should be noted that SRA results were stratified by elevation zones and only the results for the ‘lowland’ section of the Wimmera Valley are included here as the ‘upland’ section is not within the spatial scope of the Wimmera River System.

87
Table 5-1 Summary of SRA results for the Wimmera Valley with scores out of 100 in brackets (ISRAG, 2008) (ISRAG, 2011)
Index First SRA Second SRA Fish Lowland: Very Poor (23) Lowland: Very Poor (33) Macroinvertebrates Lowland: Poor (44) Lowland: Moderate (69) Vegetation NA Lowland: Poor (49) Physical Form NA Lowland: Good (91) Hydrology Lowland: Poor – Very Poor Lowland: Moderate SRA overall rating Very Poor Poor Index of Stream Condition (ISC) The ISC is an assessment of stream condition across Victoria. Scores and classifications are provided for reaches of several kilometres up to about 50 kiometres long for rivers and creeks based on five sub-indices (hydrology, physical form, water quality, streamside zone, aquatic life) (Figure 5-1). The ISC has been undertaken on three occasions (1999, 2004 and 2010) and the methods applied for collecting data have varied significantly each time and so the results are not directly applicable and so trends in condition cannot be inferred.
Wimmera River Reaches 2-4 The reaches of the Wimmera River covered in this EWMP have many of the attributes of a healthy waterway, problems associated with weeds and erosion are comparatively minor when compared to other waterways across the state. The riparian area is largely continuous with some especially high value sections in Crown reserves like the Little Desert National Park and Barabool State Forest. Unfortunately the lack of flows has been a major factor in the modest condition scores, affecting the hydrology, water quality and aquatic life scores (Table 5-2). Water quality is also affected by other impacts such as dryland salinity and sediment disturbance due to processes such as erosion and carp feeding (Wimmera CMA, 2002). Table 5-2 ISC Results for the Wimmera River reaches covered in this EWMP
ISC Reach
FLOWS
Reach
Physical Form
Streamside Zone
Hydrology Water Quality
Aquatic Life Total Condition
Year 99 04 10 99 04 10 99 04 10 99 04 10 99 04 10 99 04 10 99 04 10 2 4 4 5 9 4 6 6 2 0 7 - - 3 8 - 2 19 22 VP P P 3 4 5 5 9 7 5 7 2 0 7 6 6 4 9 8 4 25 18 27 P M M 4 4 4 4 9 4 7 7 2 1 7 - - 2 9 6 6 22 18 26 P M M 5 4 5 6 9 5 6 6 2 1 7 - - - - 6 5 18 20 31 VP M M 6 4 5 6 9 5 - 7 2 1 7 8 8 3 8 6 6 23 21 28 P M M 7 2,3 6 6 8 6 6 6 2 1 7 - - 5 9 9 5 23 22 28 P M M 8 2,3 5 6 7 8 6 7 5 4 7 - - - 9 8 6 30 27 33 M M M
VP: Very Poor, P: Poor, M: Moderate
MacKenzie River The MacKenzie River has a virtually intact zone of riparian vegetation and water flowing from upstream is typically of excellent quality. The lack of flow has been the main threat for this reach (Section 3.1) although increased water savings leading to additional environmental flows will reduce this threat (Table 5-3).

88
Figure 5-1. ISC Reaches within the Wimmera River system

89
Table 5-3 ISC Results for the MacKenzie River reaches covered in this EWMP
ISC Reach
FLOWS
Reach
Physical Form
Streamside Zone
Hydrology Water Quality
Aquatic Life Total Condition
Year 99 04 10 99 04 10 99 04 10 99 04 10 99 04 10 99 04 10 99 04 10 14 3 7 6 8 7 7 8 2 0 8 8 - - 9 - 3 28 16 30 M P M 15 1,2 6 5 8 6 3 9 2 0 8 - - 7 - 5 5 21 12 35 P VP G 16 1,2 8 9 8 8 9 9 2 0 8 - - 6 - 9 7 29 27 36 M M G
VP: Very Poor, P: Poor, M: Moderate, G: Good
Mt William Creek The lower Mt William Creek has historically been impacted by limited flows when the stock and domestic channel system was in operation, being the third most flow-stressed waterway in Victoria (SKM, 2005). This accounts for its low Hydrology scores (Table 5-4). Streamside zone scores (which focuses on riparian vegetation) are generally high, due to the fact that much of the creek is located on Crown land. Table 5-4 ISC Results for the Mt William Creek reaches covered in this EWMP
ISC Reach
FLOWS
Reach
Physical Form
Streamside Zone
Hydrology Water Quality
Aquatic Life Total Condition
Year 99 04 10 99 04 10 99 04 10 99 04 10 99 04 10 99 04 10 99 04 10 28 L 5 6 7 6 6 7 2 0 1 - - - 9 - 6 23 15 21 M P P 29 L 5 6 7 7 6 9 2 0 1 8 - 5 9 8 6 25 21 22 P M P 30 U 3 4 5 5 7 7 10 4 3 - - 4 8 - 5 27 23 21 P M P
P: Poor, M: Moderate
Burnt Creek The riparian vegetation is in good condition in the upper reach however the lower reach’s condition is comparatively poorer with limited understorey vegetation and this is reflected in ISC scores for Streamside Zone (Table 5-5). Again the impact of water resource management has led to very poor Hydrology scores. Table 5-5 ISC Results for the Burnt Creek
ISC Reach
FLOWS
Reach
Physical Form
Streamside Zone
Hydrology Water Quality
Aquatic Life Total Condition
Year 99 04 10 99 04 10 99 04 10 99 04 10 99 04 10 99 04 10 99 04 10 18 L - 4 8 - 4 7 - 1 0 - 7 - - 7 - 13 21 - P M 19 U - 4 8 - 6 7 - 1 0 - 8 - - 7 - 15 22 - P M
P: Poor, M: Moderate
Bungalally Creek Bungalally Creek is not assessed in the ISC. It is assumed that due to its location and characteristics (including flow regime) that ISC scores would be similar to the lower Burnt Creek.
Yarriambiack Creek Its riparian zone is largely intact although narrow and degraded in some places although there has been a lot of work undertaken by landholders to improve this through fencing and revegetation works. There are virtually no issues with erosion given the low gradient of the creek (Table 5-6). Hydrology scores are low due to the assessment indicating that the seasonality of flows have changed (e.g. higher flows in summer than would be the case) which could be attributed to modifications at the offtake. Table 5-6 ISC Results for the Yarriambiack Creek
ISC Reach
FLOWS
Reach
Physical Form
Streamside Zone
Hydrology Water Quality
Aquatic Life Total Condition

90
Year 99 04 10 99 04 10 99 04 10 99 04 10 99 04 10 99 04 10 99 04 10 21 6 6 8 5 5 7 10 4 3 - - 9 - - 34 24 26 M M M 22 5 6 7 7 5 7 10 4 3 - - 5 9 - - 35 24 24 G M M 23 4 6 7 7 6 7 10 - 3 - - - 8 - - 32 NA 19 M NA VP 24 5 6 3 7 6 6 10 - 3 - - - 8 - - 34 NA 18 M NA VP
VP: Very Poor, P: Poor, M: Moderate, G: Good, NA: Insufficient data
Outlet Creek Outlet Creek has not flowed since ISC assessments were initially undertaken in 1999 (the Aquatic Life and Hydrology scores have been extrapolated from an upstream reach). Outlet Creek is protected as part of the Wimmera River Heritage Area and its riparian areas remain in good condition giving moderate scores for Streamside Zone (Table 5-7). Table 5-7 ISC Results for Outlet Creek
ISC Reach
FLOWS
Reach
Physical Form
Streamside Zone
Hydrology Water Quality
Aquatic Life Total Condition
Year 99 04 10 99 04 10 99 04 10 99 04 10 99 04 10 99 04 10 99 04 10 1 NA 7 7 8 7 7 6 10 - - - - - 8 - - - - - M NA NA
M: Moderate, NA: Insufficient data Index of Wetland Condition (IWC) IWC assessments have taken place at a relatively small number of wetlands across the Wimmera in 2009/10. This included the terminal lakes of the Wimmera River, most notably Lake Hindmarsh and Lake Albacutya but also several smaller lakes beyond Lake Albacutya (Figure 2-1). Their condition rating was affected by the presence of upstream regulating structures affecting their Hydrology scores. All of the lakes apart from Lake Hindmarsh were dry and there was no evidence of increasing salinity and nutrients which led to good scores for the Water Properties sub-index. However this was not the case for Lake Hindmarsh and water quality was comparatively poor, affecting the sub-index score (Table 5-8). Table 5-8 IWC Results for Lake Hindmarsh and Lake Albacutya
Wetland Catchment Physical Form
Hydrology Water Properties
Soils Biota Overall Condition
Lake Hindmarsh
18 20 0 5 20 14 5 Moderate
Lake Albacutya
10 20 0 20 20 5 5 Moderate
Lake Brimin
18 20 0 17 20 10 6 Moderate
Lignum Plain
20 20 0 17 20 12 6 Moderate
Lake Agnes
20 20 0 20 20 11 7 Good
Note: All scores apart from the Overall score are out of 20. Hydrological Assessments In 2008, a report by CSIRO looked at water availability of major river basins across the Murray Darling Basin as well as the modelled impacts of future climate change. It highlighted that the the Wimmera Basin has the highest proportion of surface water use to availability in the Murray Darling Basin (CSIRO, 2008) (Figure 5-2). This in turn led to substantial reductions in streamflows reaching the end of the system.

91
Figure 5-2. Relative level of surface water use for major basins across the Murray Darling Basin under historic conditions and 2030 median climate change projections (with uncertainty range) (CSIRO, 2008) The Flow Stress Ranking Project also classified the impact of water resource management on several waterways in the Wimmera River System and compared them to others across Victoria. These results have been discussed in Section 3.1. Regional Fish Monitoring Regional fish monitoring has been taking place since 2006 when SKM developed a methodology that involved determining the condition of parts of the Wimmera CMA region using a sampling method similar to that used in SRA assessments (SKM, 2006). The Wimmera River catchment was broken up into a number of ‘Waterway Health Management Units’ (WHMUs) for strategic planning purposes. The intention was that each WHMU that experienced regular streamflows would be sampled every three years. However drought conditions meant the number of sites where monitoring could take place was limited, resulting in considerable variation in the frequency some WHMUs were sampled. Reductions in funding mean that regional fish monitoring is no longer undertaken annually and happens at a much reduced scale (i.e. and average of less than one WHMU rather than three sampled a year). There is value in continuing this program to assist with catchment condition reporting and monitoring the impacts of environmental water releases although WHMUs are no longer used for planning purposes. Figure 5-3 shows the locations of fish monitoring sites within the area covered by this EWMP and Table 5-9 shows a summary of data following analysis of results from 2005-2010 (SKM, 2010). The condition of the fish population in each WHMU is classified based on the proportion of native species compared to exotic in terms of abundance, diversity and biomass.
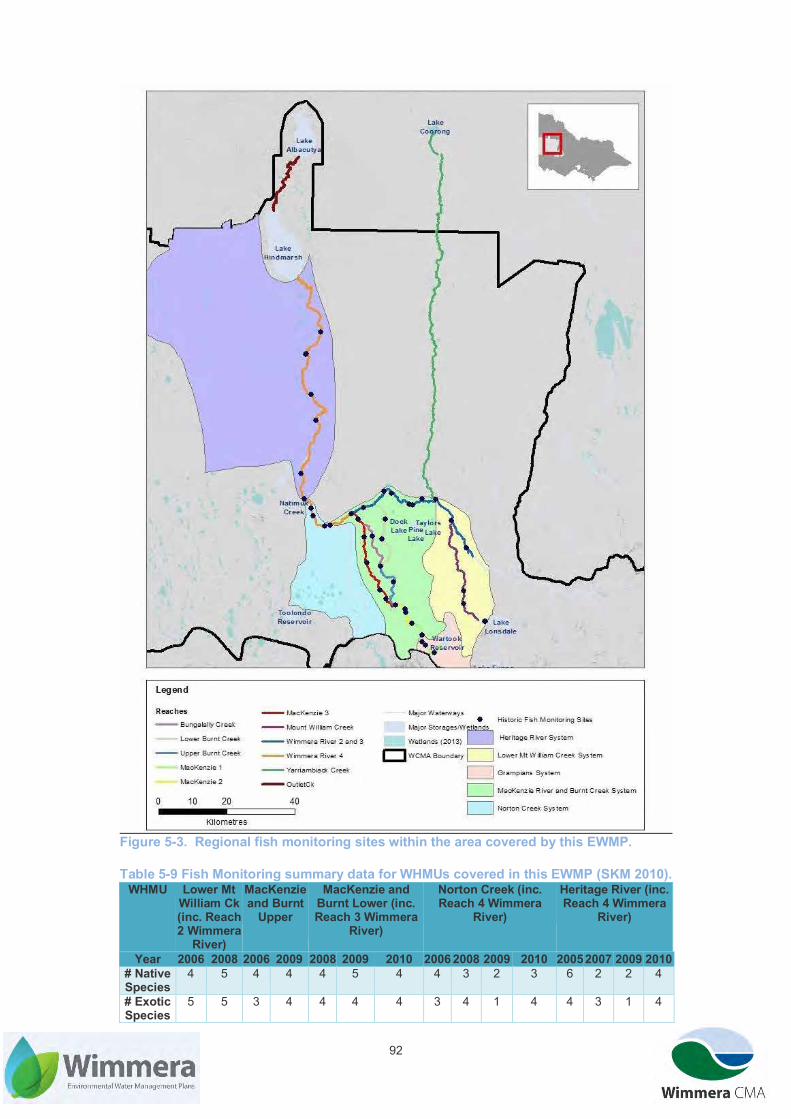
92
Figure 5-3. Regional fish monitoring sites within the area covered by this EWMP. Table 5-9 Fish Monitoring summary data for WHMUs covered in this EWMP (SKM 2010).
WHMU Lower Mt William Ck (inc. Reach 2 Wimmera
River)
MacKenzie and Burnt
Upper
MacKenzie and Burnt Lower (inc. Reach 3 Wimmera
River)
Norton Creek (inc. Reach 4 Wimmera
River)
Heritage River (inc. Reach 4 Wimmera
River)
Year 2006 2008 2006 2009 2008 2009 2010 2006 2008 2009 2010 2005 2007 2009 2010 # Native Species
4 5 4 4 4 5 4 4 3 2 3 6 2 2 4
# Exotic Species
5 5 3 4 4 4 4 3 4 1 4 4 3 1 4

93
WHMU Lower Mt William Ck (inc. Reach 2 Wimmera
River)
MacKenzie and Burnt
Upper
MacKenzie and Burnt Lower (inc. Reach 3 Wimmera
River)
Norton Creek (inc. Reach 4 Wimmera
River)
Heritage River (inc. Reach 4 Wimmera
River)
Year 2006 2008 2006 2009 2008 2009 2010 2006 2008 2009 2010 2005 2007 2009 2010 Total
Species 9 10 7 8 8 9 8 7 7 3 7 10 5 3 8
Condition Fair Fair Exc lnt
Good Poor Poor Poor Fair Poor Poor/ HD
Poor Fair Poor HD Poor
HD: Highly Degraded Since 2010, limited regional fish monitoring has taken place in the MacKenzie River, Bungalally Creek and Burnt Creek. A survey in 2012 led to the overall classification of fish population being in ‘good’ condition when collectively assessed according to the qualitative assessment criteria in SKM (2010) (Biosis, 2013). However sites closer to the Wimmera River had much poorer fish populations being dominated by exotic species Common Carp and Goldfish (Carassius auratus). A fish survey in the Lower Mt William Creek in 2015 showed no significant change in condition although with diminished numbers of native species. However the results for the refuge pool on the Upper Mt William Creek at Mokepilly was more positive with high numbers of Southern Pygmy Perch (Austral, 2015).
Fish monitoring in the lower Wimmera River at Big Bend Regional Macroinvertebrate Monitoring Macroinvertebrate monitoring was undertaken from 2005-2012 like the regional fish monitoring project, to detect trends in catchment condition. Although additional sites were included periodically to determine the impact of environmental water releases on macroinvertebrates. Like the regional fish monitoring program, it covered the shift on conditions from drought to floods. It used Rapid Biological Assessment (RBA) techniques and, in a number of years was able to complement RBA data collected by EPA as part of their statewide monitoring program. The extent and frequency of macroinvertebrate monitoring both locally and across the state has decreased significantly due to reduced funding, and there has been no macroinvertebrate monitoring since 2012. Figure 5-4 illustrates the distribution of macroinvertebrate monitoring sites in the area covered by this EWMP. The number of times a site was monitored depended on Wimmera CMA and EPA resourcing as well as whether or not the site held surface water.
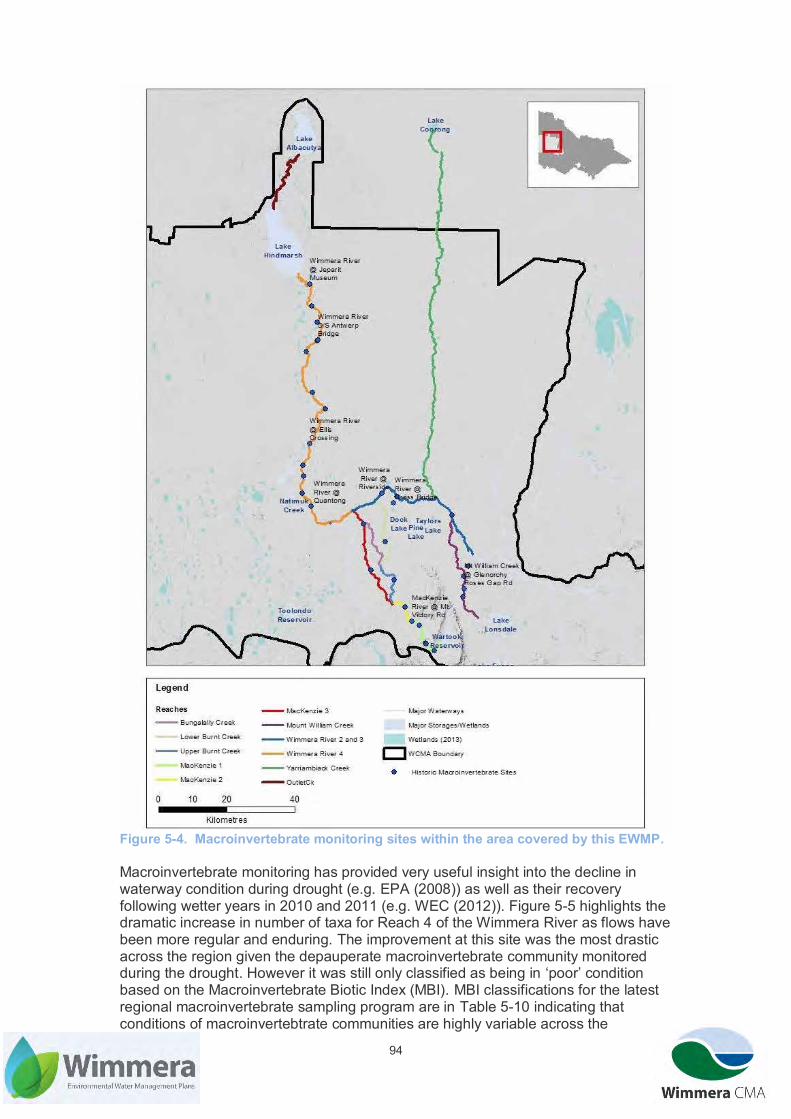
94
Figure 5-4. Macroinvertebrate monitoring sites within the area covered by this EWMP. Macroinvertebrate monitoring has provided very useful insight into the decline in waterway condition during drought (e.g. EPA (2008)) as well as their recovery following wetter years in 2010 and 2011 (e.g. WEC (2012)). Figure 5-5 highlights the dramatic increase in number of taxa for Reach 4 of the Wimmera River as flows have been more regular and enduring. The improvement at this site was the most drastic across the region given the depauperate macroinvertebrate community monitored during the drought. However it was still only classified as being in ‘poor’ condition based on the Macroinvertebrate Biotic Index (MBI). MBI classifications for the latest regional macroinvertebrate sampling program are in Table 5-10 indicating that conditions of macroinvertebtrate communities are highly variable across the

95
Wimmera River System although there was improvement due to increased flows following drought conditions.
Figure 5-5. Graph showing the positive response of macroinvertebrates to wetter conditions in 2010 and 2011 at the Wimmera River at Jeparit (source: WEC (2012)). Table 5-10 MBI scores and ratings 2011/12 and 2008/09 – locations shown in Figure 5-4 (Source: WEC (2012 & 2009)). Reach Site Name MBI Score and
Rating 2011/12 MBI Score and Rating 2008/09
Lower Mt William
Downstream Morgan’s Bridge (Roses Gap Road)
7 Moderate 5 Moderate
Reach 2 MacKenzie
Mt Victory Road 8 Good NA NA
Reach 3 Wimmera River
Riverside 7 Moderate 5 Moderate Gross’ Bridge 5 Moderate NA NA
Reach 4 Wimmera River
Ellis Crossing 8 Good 1 Very Poor Jepari t Museum 4 Poor 1 Very Poor Quantong 5 Moderate 5 Moderate Downstream Antwerp Bridge
4 Poor 1 Very Poor
Vegetation Monitoring Amidst concerns regarding the condition of riparian vegetation during the drought, Wimmera CMA commissioned monitoring work to document the condition of River Red Gums on the Wimmera River (Reaches, 2, 3 and 4) and Black Box on the Yarriambiack Creek. These studies (BL&A, 2007, 2008) quantified what was apparent, a progressive decline in tree condition of trees with distance further downstream and established a benchmark for future assessments. Another report noted similar longitudinal patterns on the Burnt and Bungalally Creeks as well as the lower MacKenzie River (SMEC, 2011). River Red Gum condition monitoring has been undertaken every two years at 10 sites on the Reach 3 and 4 of Wimmera River as part of VEFMAP. Results from monitoring in 2014 has shown that only 20% are in good health whilst 46.6% are dead. Furthermore the rate of tree death is exceeding the rate of recuitment which bodes poorly for the future of riparian habitat along the lower Wimmera River (Ecology Australia, 2015).
0
5
10
15
20
25
2005/06 2006/07 2007/08 2008/09 2009/10 2010/11 2011/12
Nu
mb
er
of
Taxa
Year
Wimmera R at Jeparit EWR8
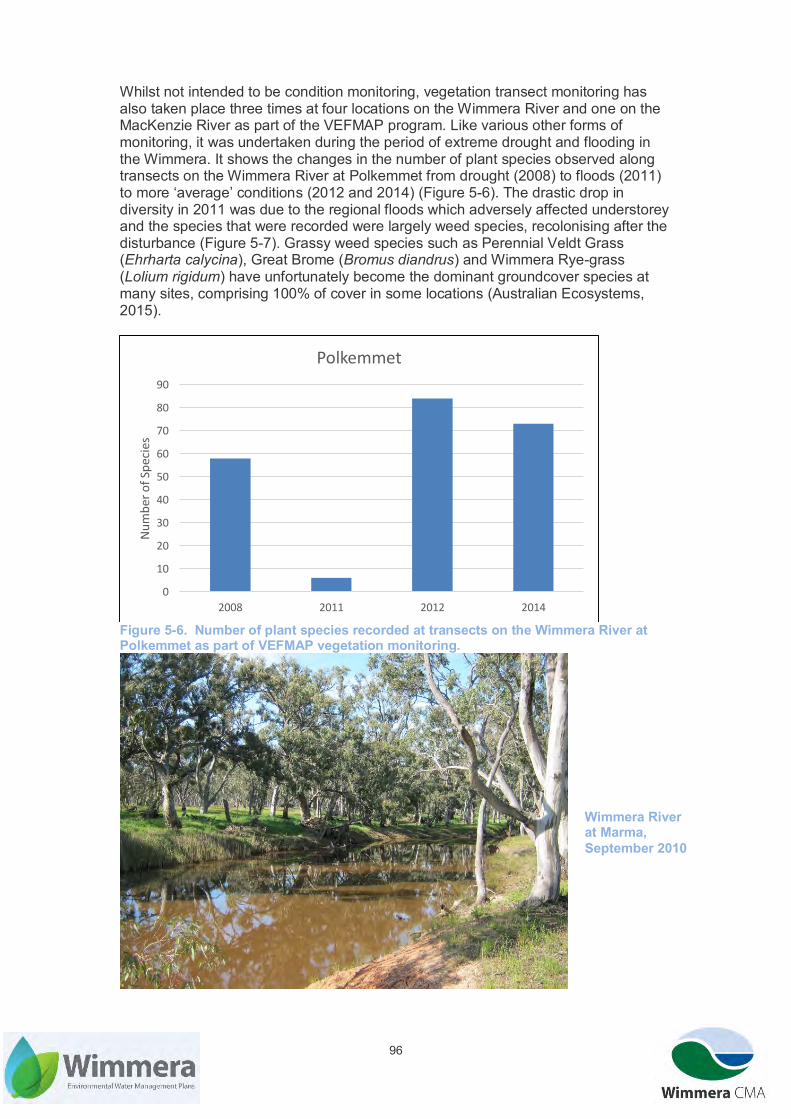
96
Whilst not intended to be condition monitoring, vegetation transect monitoring has also taken place three times at four locations on the Wimmera River and one on the MacKenzie River as part of the VEFMAP program. Like various other forms of monitoring, it was undertaken during the period of extreme drought and flooding in the Wimmera. It shows the changes in the number of plant species observed along transects on the Wimmera River at Polkemmet from drought (2008) to floods (2011) to more ‘average’ conditions (2012 and 2014) (Figure 5-6). The drastic drop in diversity in 2011 was due to the regional floods which adversely affected understorey and the species that were recorded were largely weed species, recolonising after the disturbance (Figure 5-7). Grassy weed species such as Perennial Veldt Grass (Ehrharta calycina), Great Brome (Bromus diandrus) and Wimmera Rye-grass (Lolium rigidum) have unfortunately become the dominant groundcover species at many sites, comprising 100% of cover in some locations (Australian Ecosystems, 2015).
Figure 5-6. Number of plant species recorded at transects on the Wimmera River at Polkemmet as part of VEFMAP vegetation monitoring.
0
10
20
30
40
50
60
70
80
90
2008 2011 2012 2014
Nu
mb
er o
f Sp
ecie
s
Polkemmet
Wimmera River at Marma, September 2010

97
Figure 5-7. Photo showing disturbance of the Wimmera River vegetation monitoring site at Wundersitz Crossing following the January 2011 floods (source: (SMEC, 2011)) Large Woody Debris
Much of the Wimmera River system contains good physical habitat values. Historically, desnagging took place on the reach of the Wimmera River upstream of Horsham to Longerenong. In town weir pools large woody debris was once removed as it posed a safety risk for various boating activities. However typically now it is moved to be close to and parallel with the bank to provide habitat values whilst also minimising risks to recreational users of these waterways. Whilst there has been some historic tree clearing in riparian areas in much of the Wimmera River system, they remain largely intact and over time fringing River Red Gums will fall into the waterway to provide additional habitat. This was particularly noticeable in 2009-10 when water returned to much of the Wimmera River system and streambanks were wetted up, which triggered the fall of a number of large trees into waterways. The 2010 Index of Stream Condition (ISC) assessment indicated that large woody habitat was depleted in the Wimmera River system with average scores of 1 out of 5 for the Wimmera River and Yarriambiack Creek and 2 out of 5 for the MacKenzie River, Burnt Creek and Mt William Creek. Bungalally Creek was not assessed as part of the ISC. However Wimmera CMA believes that the assumptions used in calculating reference large woody debris quantities to benchmark against in the Wimmera means the scores are lower than should be the case. Synthesis
The information presented around the current condition of the Wimmera River system illustrates the increasing impacts of threats like water extraction, poor water quality and exotic flora and fauna towards the end of the Wimmera River system.

98
Native fish and vegetation assemblages become increasingly dominated by exotic species moving from the MacKenzie River and Mt William Creeks towards the Wimmera River. Issues such as a lack of flow and poor water quality manifest themselves strongly in Reach 4 of the Wimmera River which in turn also affects macroinvertebrate diversity. However the terminal lakes remain remarkably resilient despite the severe impact upstream river regulation and ongoing dry conditions have had on their hydrological regime.
5.3.Water-Related Threats Water quality threats
Inflows from many of the tributaries of the Wimmera and Mt William Creek in cleared land upstream of the headworks system create water quality issues. Eroding channels cause sediment to be mobilised which in turn leads to high turbidity and nutrient levels. In places the stream channel also intersects the local groundwater table which is typically saline. Water quality from the Upper Mt William Creek and Wimmera River upstream of Huddleston’s weir is typically much poorer than flows coming from the northern Grampians to the lower Mt William Creek and MacKenzie River. This turbid, nutrient-rich and saline water limits the diversity of macroinvertebrate, fish and plant species to those who are tolerant of poor water quality. The intrusion of hypersaline groundwater (Section 3.1.1) also limits the availability of pool habitat for large-bodied fish as well as creating additional water quality issues when higher flows mobilise the hypersaline water, transporting it downstream. Blue-green algal blooms are an ongoing issue due to the combination of warm temperatures, high nutrient levels and a lack of throughflow leading to thermal stratification. This leads to health risks for humans and animals coming into contact with the toxins produced by the algae. Weir pools and water storages (in particular Lake Lonsdale, Lake Fyans and Taylor’s Lake) are frequently impacted by blue green algae blooms, with blooms taking place at at least one of these locations every year during summer/autumn. Exotic species
Exotic species are also a major threat to native flora and fauna in the Wimmera River System. Redfin are voracious predators of small-bodied native fish as well as frogs and tadpoles with monitoring showing that Southern Pygmy Perch were not found in remnant pools containing Redfin (SKM, 2007). They also carry the epizootic haematopoiestic necrosis virus (EHNV) which can be transferred to native species like Obscure Galaxias (SKM, 2007). Brown Trout (Salmo trutta) are found in the MacKenzie River although Rainbow Trout (Onchrynchus mykiss) have also been stocked in Lake Wartook and with Galaxiids and River Blackfish susceptible to predation and competition from these species (SKM, 2007). Eastern Gambusia (Gambusia holbrooki) are widespread throughout the Wimmera River System and have been noted to predate on macroinvertebrate and frog eggs as well as out-competing small-bodied native fish for habitat and resources. Their aggressive behaviour such as fin-nipping and biting means other species such as Southern Pygmy Perch and Australian Smelt cannot co-exist with Gambusia. Common Carp, along with Tench (Tinca tinca) and Goldfish are found throughout much of the Wimmera River System. However there are no records of carp in the upper Mt William Creek and these species are believed to be largely absent from Reaches 1 and 2 of the MacKenzie River and upper Burnt Creek with only small numbers of carp caught in the MacKenzie River. These species impact on the

99
Wimmera River System through their feeding behaviour of ingesting sediment and filtering out food which in turn prevents the growth of instream vegetation through disturbance and the increased turbidity reduces light penetration and nutrient mobilisation (SKM, 2007). Carp constitutes most of the biomass of fish in the Wimmera River (SKM, 2010) and fish kills and mass aggregations of carp have taken place during dry conditions. With respect to exotic aquatic and riparian vegetation, there are no species such as Willows (Salix spp.) or Azolla (Azolla spp.) currently along the Wimmera River System that would be advantaged by flows so as to be a threat to environmental values. The main risk is the scouring effects of floods favouring recolonization by exotic annual species who take advantage of the disturbance (SMEC, 2011). Recreation
Waterways within the Wimmera River System are very popular for recreational activities that can impact on environmental values, in particular fishing and water-skiing. Fishing is managed by Fisheries Victoria who undertake regulation and stocking to maintain and enhance fish populations as well as other activites specified in the Wimmera Fishery Management Plan (DPI, 2006) such as raising awareness of responsible conduct with respect to fishing. This is intended to reduce the threat around overfishing as well as damage to riparian areas by anglers. Water-skiing is only allowed in the terminal lakes and weir pools under conditions established by waterway managers declared by the Minister for Ports who are responsible for the safety of boating activity on waterways under their control. For the Wimmera River System this is typically local councils although DELWP is the waterway manager for Lake Albacutya. Wimmera CMA works with councils to ensure that waterskiing is regulated to minimise impacts on riverbanks and riparian vegetation.
5.4.Condition Trajectory – Do Nothing Option What was experienced during the past 20 years provides a valuable insight into what would happen should environmental water not be provided to the Wimmera River System into the future. The impacts described following would be commonplace under predicted climate change scenarios which indicates that winter/spring rainfall (and subsequent runoff into waterways) will be much reduced. Most reaches would only flow in years when rainfall was well above average which would lead to drastic declines in the condition of many of the values including the likely loss of fish communities from many of these waterways. Upland fish communities would be entirely confined to perennial systems located in the Grampians (e.g. MacKenzie River Reach 1). Lowland fish communities would be restricted to unregulated tributaries of the Wimmera River System as well as deep remnant pools that could retain sufficient water to endure a sequence of years with no flow. Species like Platypus and Rakali would be under significantly greater threat within the region. Macroinvertebrate populations and riparian vegetation condition would decline and channels would be colonised or even blocked by River Red Gum saplings and emergent macrophytes such as Typha and Phragmites. Cultural values would be impacted by the death and/or decline of scar trees in riparian areas. Townships would suffer from the loss of amenity and recreation opportunities and fish deaths and algal blooms would be more prevalent. During the drought, odours from the hypersaline water in the Wimmera River next to Jeparit

100
affected quality of life for the town’s residents. Without environmental watering that would more frequently. Occasionally floods would still make their way along these waterways, providing a brief period of respite for fish and other water-dependent vertebrate species and triggering various ecological processes (Section 4.2). However the lack of baseflows and freshes following these flood events would limit the success of recruitment events for fish and aquatic vegetation.
6. Management Objectives
6.1. Management Goal The WWS lists a number of long-term (20+ year) goals for the region’s waterways. They were developed with community, partner and stakeholder feedback to inform the preparation of the WWS and these provide context for this EWMP. They are:
Maintaining and improving the values and condition of waterways that have formally recognised significance;
Improve connectivity and condition along priority wetland systems and riparian corridors;
Improved water quality in priority areas for; water supply, environmental condition and recreation;
Waterways with high social, cultural and economic values are maintained in a state that continues to support those values in line with climatic conditions.
The management goal for the Wimmera River System EWMP aligns with these goals. Environmental water will maintain and enhance the condition of the Wimmera River System to support its formally recognised status, its role in providing connectivity for flora, fauna, carbon and nutrients as well as maintaining its strong environmental values. This includes diverse, abundant and resilient native fish and vegetation communities, geomorphic diversity, sustainable platypus population and mitigated impacts of poor water quality. Environmental watering of the regulated reaches of the Wimmera River System will be a critical plank in achieving this goal as well as being an important part of the the 50 year visions of the Wimmera RCS (2013-2019) and VWMS that are listed as follows: A healthy Wimmera catchment where a resilient landscape supports a sustainable and profitable community (Wimmera CMA, 2013). Victoria’s rivers, estuaries and wetlands are healthy and well-managed; supporting environmental, social, cultural and economic values that are able to be enjoyed by all communities (DEPI, 2013). Specific ecological objectives that underpin the achievement of these long-term goals and visions are outlined in Section 6.2.
6.2.Ecological Objectives Rivers and Streams
In 2002, ecological objectives were developed by an expert panel in consultation with Wimmera CMA staff for the Wimmera River in the Stressed Rivers Project –

101
Environmental Flow Study Wimmera River System (SKM, 2002). In 2003, this was expanded to other regulated reaches in the Wimmera Bulk Entitlement Conversion Environmental Flows Study (SKM, 2003). Following this the Mt William Creek above Lake Lonsdale was considered in the Environmental Flow Recommendations for Mt William Creek (SKM, 2005). The studies in 2002 and 2003 were some of the first FLOWS studies undertaken in Victoria. Since then there have been substantial advances in applying the FLOWS methodology and in building ecological understanding (eg through monitoring projects), and these warranted a comprehensive review and updating of these objectives and the required flow regimes. This was undertaken in the Wimmera River Environmental Flows Study (Alluvium, 2013). Instead of the ecological objectves being solely determined by scientists and waterway managers, FLOWS Edition 2 (DEPI, 2013) flags the involvement of a Project Advisory Group involving community and agency representatives in terms of providing a level of endorsement of the ecological objectives. In this case, instead of a new group being established, the objectives developed by Alluvium and Wimmera CMA staff were endorsed by the Wimmera CMA’s Rivers and Streams Advisory Group which comprises community and agency representatives (Section 10.1). The review investigated the available monitoring data (e.g. in terms of plant, fish and macroinvertebrate species and platypus distribution as well as geomorphology and water quality data) to determine where certain objectives are feasible. They have been refined to ensure that they are feasible and measurable and are listed in Table 6-1. The flow components required to achieve these objectives are also included, with volumes, duration and frequency listed in Appendix 5.
Lakes The ecological objectives for the Wimmera River System terminal lakes were developed as part of The Environmental Water Needs of the Wimmera Terminal Lakes (Ecological Associates, 2004) and Environmental Water Requirements of Lake Corrong and Lake Lascelles (Ecological Associates, 2006). The Ecological Character Description for Lake Albacutya (Cibilic & White, 2010) refined these objectives for Lake Albacutya, and enhanced the rationale behind them, details of which are also listed in Table 6-1.

102
Lake Albacutya, April 2009
Lake Hindmarsh at Four Mile Beach, August 2010

103
Table 6-1 Ecological objectives for the Wimmera River System (details of flow requirements are included in Appendix 5) Objective Justification Specific Flow Requirements Wimmera River Fish Maintain a self-sustaining Freshwater Catfish population in Reaches 2, 3 and 4
Threatened fish species that is one of a handful of self-sustaining populations in Victoria.
Baseflows/freshes for water quality, habitat maintenance and protection of nests
Restore indigenous fish community diversity and abundance (Reach 2 only)
Obscure Galaxias, Southern Pygmy Perch and River Blackfish have been lost from this reach due to a lack of flow and other pressures (exotic fish, poor water quality). Ongoing water quality issues in Reach 3 means that this objective is unfeasible there.
Baseflows/freshes for water quality and habitat maintenance
Maintain fish in refuges in dry conditions through the provision of adequate water quality/habitat
Drought and climate change impacts mean that in many years there is insufficient environmental water allocations to provide recommended flows. Therefore focus will be on filling refuge pools and temporarily improving water quality.
Baseflows/freshes especially in summer/autumn
Facilitate dispersal and establishment of endemic fish species
Dispersing and establishing endemic fish species throughout Reaches 2, 3 and 4 during wet/average conditions will lead to increased resilience during drought/dry conditions.
Baseflows/freshes especially in winter/spring
Maintain native recreational species through mitigating poor water quality
A healthy population of stocked native recreational species (Golden and Silver Perch) is a significant value for the local community
Baseflows/freshes (year round)
Vegetation Protect and restore riparian and floodplain EVCs
Healthy and diverse aquatic, riparian and floodplain vegetation is critical for supporting fauna and contributing to carbon and nutrient cycling. Important part of the river’s character leading to its Heritage River status. Also plays a role in flood mitigation.
Overbank and bankfull flows
Enable growth and reproduction of submerged aquatic macrophytes and emergent vegetation through mitigating salinity impacts
Aquatic and emergent vegetation is vital habitat for small-bodied native fish such as Southern Pygmy Perch as well as performing an important role in nutrient cycling. Emergent vegetation is important habitat for small birds such as the Clamorous Reed Warbler.
Baseflows/freshes especially in summer/autumn
Geomorphology (River flows and connectivity) Maintain structural integrity of stream bed and channel and prevent loss of channel capacity
Flows are important in maintaining channel capacity through scouring and preventing excessive sedimentation which in turns retains pool habitat and provides minor flood mitigation benefits.
Overbank and bankfull flows
Maintain habitat values through prevention of stream-bed colonisation by terrestrial species
During periods of no or severely reduced flow species like River Red Gum colonise the base of waterways which in turn affects channel shape and capacity as well as diminishing some recreational values.
Baseflows/freshes especially in winter/spring
Macroinvertebrates Maintain a ‘good’ diversity of macroinvertebrate species (based on MBI classifications)
Macroinvertebrates are a critical component of the food web, supporting a variety of aquatic fauna species
Baseflows/freshes
Platypus
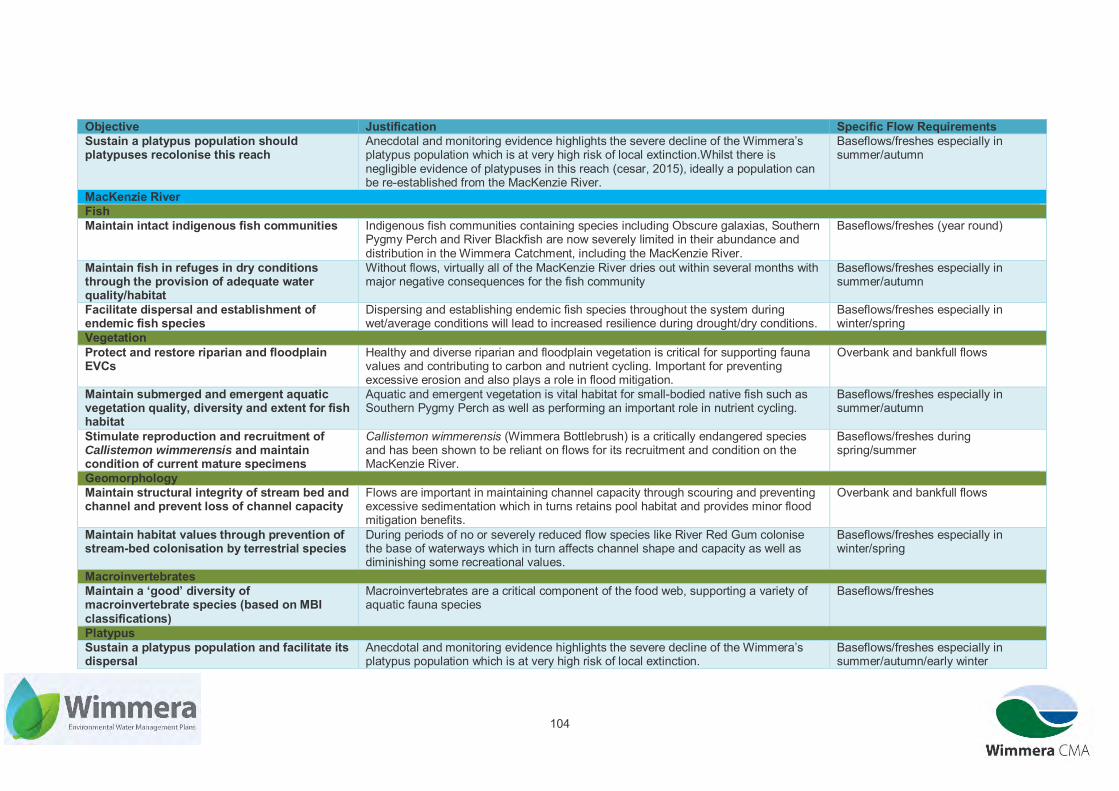
104
Objective Justification Specific Flow Requirements Sustain a platypus population should platypuses recolonise this reach
Anecdotal and monitoring evidence highlights the severe decline of the Wimmera’s platypus population which is at very high risk of local extinction.Whilst there is negligible evidence of platypuses in this reach (cesar, 2015), ideally a population can be re-established from the MacKenzie River.
Baseflows/freshes especially in summer/autumn
MacKenzie River Fish Maintain intact indigenous fish communities Indigenous fish communities containing species including Obscure galaxias, Southern
Pygmy Perch and River Blackfish are now severely limited in their abundance and distribution in the Wimmera Catchment, including the MacKenzie River.
Baseflows/freshes (year round)
Maintain fish in refuges in dry conditions through the provision of adequate water quality/habitat
Without flows, virtually all of the MacKenzie River dries out within several months with major negative consequences for the fish community
Baseflows/freshes especially in summer/autumn
Facilitate dispersal and establishment of endemic fish species
Dispersing and establishing endemic fish species throughout the system during wet/average conditions will lead to increased resilience during drought/dry conditions.
Baseflows/freshes especially in winter/spring
Vegetation Protect and restore riparian and floodplain EVCs
Healthy and diverse riparian and floodplain vegetation is critical for supporting fauna values and contributing to carbon and nutrient cycling. Important for preventing excessive erosion and also plays a role in flood mitigation.
Overbank and bankfull flows
Maintain submerged and emergent aquatic vegetation quality, diversity and extent for fish habitat
Aquatic and emergent vegetation is vital habitat for small-bodied native fish such as Southern Pygmy Perch as well as performing an important role in nutrient cycling.
Baseflows/freshes especially in summer/autumn
Stimulate reproduction and recruitment of Callistemon wimmerensis and maintain condition of current mature specimens
Callistemon wimmerensis (Wimmera Bottlebrush) is a critically endangered species and has been shown to be reliant on flows for its recruitment and condition on the MacKenzie River.
Baseflows/freshes during spring/summer
Geomorphology Maintain structural integrity of stream bed and channel and prevent loss of channel capacity
Flows are important in maintaining channel capacity through scouring and preventing excessive sedimentation which in turns retains pool habitat and provides minor flood mitigation benefits.
Overbank and bankfull flows
Maintain habitat values through prevention of stream-bed colonisation by terrestrial species
During periods of no or severely reduced flow species like River Red Gum colonise the base of waterways which in turn affects channel shape and capacity as well as diminishing some recreational values.
Baseflows/freshes especially in winter/spring
Macroinvertebrates Maintain a ‘good’ diversity of macroinvertebrate species (based on MBI classifications)
Macroinvertebrates are a critical component of the food web, supporting a variety of aquatic fauna species
Baseflows/freshes
Platypus Sustain a platypus population and facilitate its dispersal
Anecdotal and monitoring evidence highlights the severe decline of the Wimmera’s platypus population which is at very high risk of local extinction.
Baseflows/freshes especially in summer/autumn/early winter

105
Objective Justification Specific Flow Requirements Mt William Creek Fish Maintain intact indigenous fish communities Indigenous fish communities includingwith Obscure Galaxias, Southern Pygmy Perch
and River Blackfish are now severely limited in their abundance and distribution in the Wimmera, including the Mt Wiliam Creek.
Baseflows/freshes (year round)
Maintain fish in refuges in dry conditions through the provision of adequate water quality/habitat
Whilst there are several deep pools along the Mt William Creek, during prolonged cease to flow periods flows are important to restore habitat values and improve water quality.
Baseflows/freshes especially in summer/autumn
Facilitate dispersal and establishment of endemic fish species
Dispersing and establishing endemic fish species throughout the system during wet/average conditions will lead to increased resilience during drought/dry conditions.
Baseflows/freshes especially in winter/spring
Vegetation Protect and restore riparian and floodplain EVCs
Healthy and diverse riparian and floodplain vegetation is critical for supporting fauna values and contributing to carbon and nutrient cycling. Important for preventing excessive erosion and also plays a role in flood mitigation.
Overbank and bankfull flows
Maintain submerged and emergent aquatic vegetation quality, diversity and extent for fish habitat
Aquatic and emergent vegetation is vital habitat for small-bodied native fish such as Southern Pygmy Perch as well as performing an important role in nutrient cycling.
Baseflows/freshes especially in summer/autumn
Geomorphology Maintain structural integrity of stream bed and channel and prevent loss of channel capacity
Flows are important in maintaining channel capacity through scouring and preventing excessive sedimentation which in turns retains pool habitat and provides minor flood mitigation benefits.
Overbank and bankfull flows
Maintain habitat values through prevention of stream-bed colonisation by terrestrial species
During periods of no or severely reduced flow species like River Red Gum colonise the base of waterways which in turn affects channel shape and capacity as well as diminishing habitat values.
Baseflows/freshes especially in winter/spring
Improve channel diversity through increasing flow variability
Constant flow rates (e.g. for water transfers) pose a risk of increasing issues created by incision leading to loss of pool/run geomorphology
Freshes/bankfull / overbank flows/ cease to flow
Macroinvertebrates Maintain a ‘good’ diversity of macroinvertebrate species (based on MBI classifications)
Macroinvertebrates are a critical component of the food web, supporting a variety of aquatic fauna species
Baseflows/freshes
Burnt Creek Fish Facilitate dispersal and establishment of endemic fish species
Dispersing and establishing endemic fish species throughout the system during wet/average conditions will lead to increased resilience during drought/dry conditions.
Baseflows/freshes especially in winter/spring
Vegetation

106
Objective Justification Specific Flow Requirements Protect and restore riparian and floodplain EVCs
Healthy and diverse riparian and floodplain vegetation is critical for supporting fauna values and contributing to carbon and nutrient cycling. Important for preventing excessive erosion and also plays a role in flood mitigation.
Overbank and bankfull flows
Geomorphology Maintain structural integrity of stream bed and channel and prevent loss of channel capacity
Flows are important in maintaining channel capacity through scouring and preventing excessive sedimentation which in turns retains pool habitat and provides minor flood mitigation benefits.
Overbank and bankfull flows
Maintain habitat values through prevention of stream-bed colonisation by terrestrial species
During periods of no or severely reduced flow species like River Red Gum colonise the base of waterways which in turn affects channel shape and capacity as well as diminishing habitat values.
Baseflows/freshes especially in winter/spring
Improve channel diversity through increasing flow variability
Constant flow rates (e.g. for water transfers) pose a risk of increasing issues created by incision leading to loss of pool/run geomorphology
Freshes/bankfull / overbank flows/ cease to flow
Macroinvertebrates Maintain a ‘good’ diversity of macroinvertebrate species (based on MBI classifications)
Macroinvertebrates are a critical component of the food web, supporting a variety of aquatic fauna species
Baseflows/freshes
Yarriambiack Creek Vegetation Protect and restore riparian and floodplain EVCs
Healthy and diverse riparian and floodplain vegetation is critical for supporting fauna values and contributing to carbon and nutrient cycling. Important for preventing excessive erosion and also plays a role in flood mitigation.
Overbank and bankfull flows
Geomorphology Maintain habitat values through prevention of stream-bed colonisation by terrestrial species
During periods of no or severely reduced flow species like River Red Gum colonise the base of waterways which in turn affects channel shape and capacity as well as diminishing some recreational values.
Baseflows/freshes especially in winter/spring
Bungalally Creek Vegetation Protect and restore riparian and floodplain EVCs
Healthy and diverse riparian and floodplain vegetation is critical for supporting fauna values and contributing to carbon and nutrient cycling. Important for preventing excessive erosion and also plays a role in flood mitigation.
Overbank and bankfull flows
Geomorphology Maintain structural integrity of stream bed and channel and prevent loss of channel capacity
Flows are important in maintaining channel capacity through scouring and preventing excessive sedimentation which in turns retains pool habitat and provides minor flood mitigation benefits.
Overbank and bankfull flows
Prevent excessive stream-bed colonisation by terrestrial species
During periods of no or severely reduced flow species like River Red Gum colonise the base of waterways which in turn affects channel shape and capacity as well as diminishing some recreational values.
Baseflows/freshes especially in winter/spring

107
Objective Justification Specific Flow Requirements Terminal Lakes – Wimmera River – Lakes Hindmarsh, Albacutya and others Vegetation Drought and salinity stress in fringing River Red Gums is reduced.
Red Gums are a key component of the critical ecosystem services for the Lake Albacutya (Cibilic & White, 2010) (similar for Lake Hindmarsh). They provide valuable habitat for a number of bird species – including the threatened Regent Parrot.
Minimum of 6 month lake full event >57 GL/m for 2 months for Outlet Creek
River Red Gums regularly recruit to create a diverse age structure.
Red Gum recruitment and regeneration is a key process of the critical ecosystem services for the Lake Albacutya (Cibilic & White, 2010) (similar for Lake Hindmarsh). They provide valuable habitat for a number of bird species – including the threatened Regent Parrot.
Minimum of 6 month lake full event >57 GL/m for 2 months for Outlet Creek
Wetland Function Inundation is sufficiently frequent to contribute significantly to the viability of visiting aquatic fauna populations
When these lakes are full they can support high numbers of waterbirds, for example Lake Albacutya over 20,000 waterbirds (Cibilic & White, 2010) and Lake Hindmarsh has supported over 50 species. (NRE, 1995) This a critical ecosystem service for Lake Albacutya (Cibilic & White, 2010).
Minimum of 24 month lake full event
Lakes completely transition from a terrestrial ecosystem to a mature and diverse aquatic ecosystem during inundation
Extended periods of inundation are important in supporting the diversity of waterbirds in terms of providing diverse habitats (deep to shallow water) and a variety of ecosystem functions from the initial inundation which would provide a rich food source for dabbling ducks etc. from water covering the vegetation that grew during the dry phase through to having fish complete multiple breeding cycles which would also support piscivorous species.
Minimum of 24 month lake full event
Terminal Lakes – Yarriambiack Creek – Lake Corrong Vegetation Maintainence of complex woodland habitat at lake fringe
Trees at lake fringe provide nesting habitat for waterbirds and bush birds as well as being important for terrestrial fauna such as possums, snakes, bats and lizards. A mosaic of different aged trees will ensure this continues.
Lake perimeter inundated with a median interval of 10 years
Wetland Function Maintenance of initial lake productivity Terrestrial vegetation on the outer lake bed provides habitat complexity for
macroinvertebrates, fish etc. and initial productivity for microbes as it decays. Median interval between events that flood the outer lake bed exceed 3 years
Provision open water habitat Large fish, diving ducks and large waterbirds benefit from open expanses of water that would be provided should watering be of sufficient duration in the deepest points of the lake to kill trees that grow during dry spells.
Lake full events of more than 3 years should be provided every 50 years
Birds Breeding of birds dependent on flooded vegetation
Colonial nesting waterbirds will take advantage of canopies of trees growing on lake bed.
Lake perimeter is inundated with a median interval 10 years and maximum interval 20 years

108
Objective Justification Specific Flow Requirements Breeding of large numbers of waterbirds Habitat similarities between Lake Corrong and other wetlands in the region indicates
that during wet conditions large numbers of waterbirds could use the lake for breeding habitat.
Water level exceeds 77m AHD for more than 2 years are provided every 10 years
Geomorphology Maintain lake shape and depth Dry spells enable wind erosion to remove sediment which is deposited in the lake bed
during floods which will maintain the lake’s depth and shape which in turn provides aquatic habitat for fish and plants.
Dry periods of 10 years duration provided every 50 years
Left: Ross Lake, April 2009, Right: Outlet Creek, April 2009

109
6.3. Wimmera River System flow recommendations A water regime to achieve the ecological objectives in Section 6.2 was developed according to the FLOWS 2 method (DEPI, 2013) for all parts of the Wimmera River System upstream of the terminal lakes. This updated approach makes allowance for seasonal conditions (drought to wet conditions) rather than recommending the same flow regime every year regardless of the prevailing climate. For example during dry or drought conditons the recommended number and volume of freshes will be fewer than during average or wet conditions and cease to flow periods will be longer. Bankfull and overbank flows may only be recommended during average and/or wet periods. Ecological information (e.g. required frequency of recruitment events to maintain a species) still underpins the recommendations around the frequency of various flow components. Details of magnitude, timing, duration and frequency of each flow component for each reach are given in Appendix 5 and relevant ecological objectives documented. Recommended rates of rise and fall for flows greater than baseflows have also been developed to assist mitigating negative impacts such as river bank slumping and fish stranding that could occur should flow rates vary too quickly. Environmental watering recommendations for the terminal lakes were developed following the original FLOWS method tailored for wetlands (NRE, 2002). For more detail refer to the Wimmera River Environmental Flows Study (Alluvium, 2013), The Environmental Water Needs of the Wimmera Terminal Lakes (Ecological Associates, 2004) and Environmental Water Requirements of Lake Corrong and Lake Lascelles (Ecological Associates, 2006).
6.4. Long-term water regime and hydrological objectives Experience has shown that long-term planning for environmental water delivery in the Wimmera River system is an inherently challenging task and strongly influenced by prevailing climatic conditions. Droughts mean that even the minimum flow requirements are unable to be met in all reaches and the focus shifts to protecting key refuge sites. Floods mean that only limited regulated releases are required due to the large volumes provided by unregulated streamflows. During average-wet conditions the focus is on building resilience in waterway ecosystems to protect them from flood and drought conditions. Despite the substantial volumes of water recovered for the environment, shortfalls in envionrmental water will be quite frequent. The shortfall between supply and demand is likely to be biggest when successive dry seasons lead to drought as seen in Figure 6-1. Alluvium (2013) highlights that using historic flow data, there are comparatively frequent shortfalls in water availability at most sites. Maximising the volume available for environmental watering as well as its effective and efficient implementation will be critical in obtaining the greatest outcomes possible. This will be increasingly the case with climate change forecasts indicating substantially reduced rainfall, in particular in winter and spring (Timbal, et al., 2015). Robust and flexible planning processes are needed if the best ecological outcomes are to be achieved with the water available. This was initially achieved through the development of the Environmental Operating Strategy for the management of the Wimmera-Glenelg Environmental Water Reserve (EOS) (GHCMA & WCMA, 2004), which outlined the principles and processes to be followed when developing Annual Watering Plans for the Wimmera and Glenelg River systems. Since 2010, there have been substantial changes in environmental water reserve management given the creation of the Victorian and Commonwealth Environmental Water Holders, the completion of the Wimmera Mallee Pipeline and the purchase of the entitlement from the Wimmera Irrigators’ Association for the environment. However many of the core

110
elements of the EOS are still relevant, such as shared planning processes between the Wimmera and Glenelg catchments to optimise the best regional environmental outcomes. This has been enhanced through the development of the Wimmera and Glenelg Rivers Environmental Entitlement: Environmental water sharing rules (VEWH, 2014) which has been included in Appendix 6.
Figure 6-1. Shortfalls in environmental water to Reach 4 of the Wimmera River under different historic climatic conditions (Alluvium, 2013) Given the frequency and severity of shortfalls in environmental water, a risk-based approach has been developed to prioritise watering components within reaches. This was initially established specifically for macroinvertebrates through An Ecological Risk Assessment of the Lower Wimmera River (EPA, 2008), using a Bayesian network with streamflows, water quality and habitat data to predict the condition of the macroinvertebrate community (Figure 6-2).
Figure 6-2. Bayesian network structure for prediction of macroinvertebrate community diversity in the lower Wimmera River (source: (EPA, 2008)) Another tool to inform decision making around environmental water management is described in Prioritisation of Environmental Water Releases in the Wimmera, Glenelg and Avon-Richardson River Systems (SKM, 2010). This tool uses the flow components required for various ecological objectives (fish, vegetation, macroinvertebrates and geomorphology)
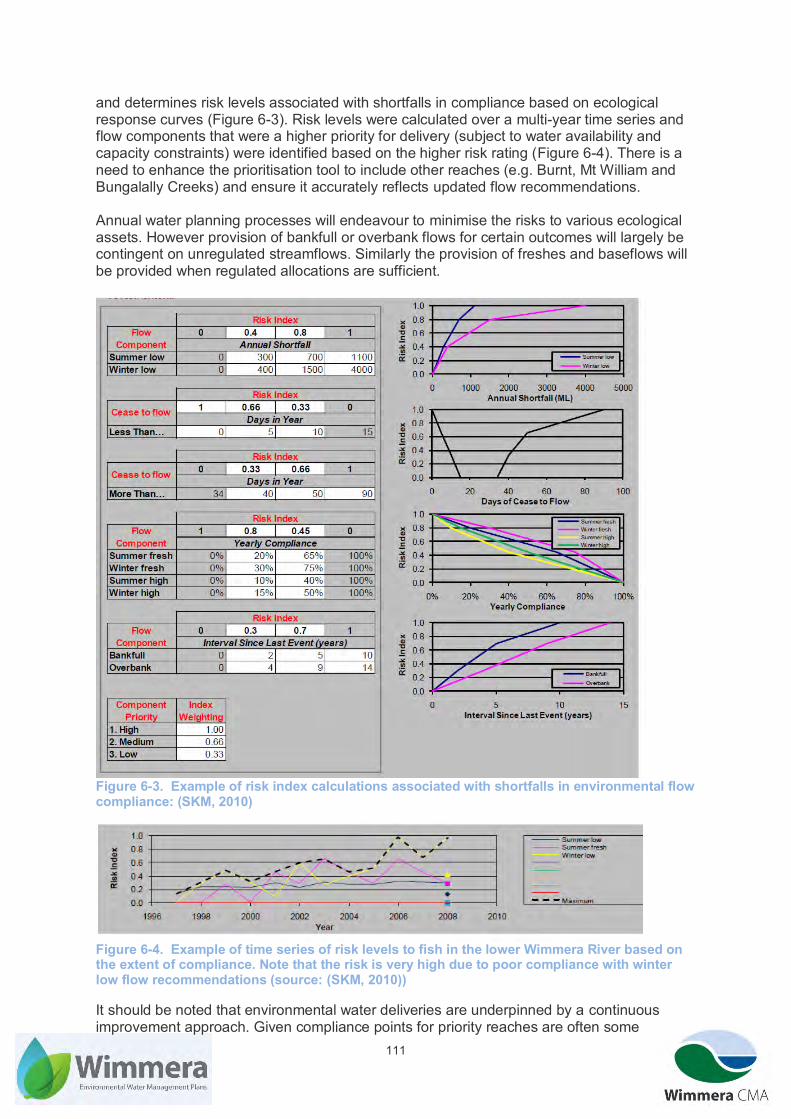
111
and determines risk levels associated with shortfalls in compliance based on ecological response curves (Figure 6-3). Risk levels were calculated over a multi-year time series and flow components that were a higher priority for delivery (subject to water availability and capacity constraints) were identified based on the higher risk rating (Figure 6-4). There is a need to enhance the prioritisation tool to include other reaches (e.g. Burnt, Mt William and Bungalally Creeks) and ensure it accurately reflects updated flow recommendations. Annual water planning processes will endeavour to minimise the risks to various ecological assets. However provision of bankfull or overbank flows for certain outcomes will largely be contingent on unregulated streamflows. Similarly the provision of freshes and baseflows will be provided when regulated allocations are sufficient.
Figure 6-3. Example of risk index calculations associated with shortfalls in environmental flow compliance: (SKM, 2010)
Figure 6-4. Example of time series of risk levels to fish in the lower Wimmera River based on the extent of compliance. Note that the risk is very high due to poor compliance with winter low flow recommendations (source: (SKM, 2010)) It should be noted that environmental water deliveries are underpinned by a continuous improvement approach. Given compliance points for priority reaches are often some

112
distance downstream, a higher flow rate is required to cover in-stream losses through seepage, evaporation and diversion experienced between the delivery point and the compliance point. Ongoing monitoring of flow rates at stream gauges enables environmental flows to be increased or decreased to efficiently meet compliance (Figure 6-5). In some cases it will be a matter of supplementing unregulated and/or passing flows or “piggy-backing” environmental water releases on top to meet recommended thresholds in terms of volumes and durations. In time the datasets will be increasingly refined to enable effective and efficient environmental water delivery through better understanding in-stream losses and timing of flows along various waterways under different conditions.
Figure 6-5. Process of implementing environmental watering activities based on various ecological objectives. Tables 6-2 to 6-7 provide the planned long-term water regime for the rivers and creeks of the Wimmera River system. Objectives for each waterway in Table 6-1 have been listed although abridged and condensed. For example it is assumed that maintenance of aquatic vegetation prevents establishment of terrestrial vegetation. These objectives are aligned with various flow components required to achieve them and as well as determining their recommended frequency (Figure 6-6). As stated in Section 6.3, the Wimmera River Environmental Flows Study (Alluvium, 2013) contains notes regarding the assumptions underpinning each flow recommendation which includes descriptions of frequencies when they are not required annually for example overbank flows to maintain floodplain vegetation. However these tables only provide an indicative plan – seasonal conditions will largely dictate the potential to undertake many watering actions, in particular bankfull and overbank flows.
Ecological objective (e.g. maintenance of fish community)
Flows required to achieve this at a certain stream gauge (volume, duration, frequency, rate of rise/fall)
Flow required to be released from the headworks to achieve this allowing for in-stream losses

113
Figure 6-6. Process of translating ecological objectives to a long-term watering regime
Ecological objective (e.g. maintenance of fish community)
Flow types required to achieve this (e.g. baseflow, overbank)
Frequency flow types required to achieve objectives (e.g. annually, 2 times a decade)
MacKenzie River at Three Bridges Road (left), Wimmera River at Yarriambiack Creek offtake (right).
Wimmera River at Wundersitz Crossing (left), Wimmera River at Longerenong Weir (right).

114
Year 1 2 3 4 5 6 7 8 9 10 Objectives Restore
indigenous fish diversity and abundance
Restore indigenous fish diversity and abundance
Restore indigenous fish diversity and abundance
Restore indigenous fish diversity and abundance
Restore indigenous fish diversity and abundance
Restore indigenous fish diversity and abundance
Restore indigenous fish diversity and abundance
Restore indigenous fish diversity and abundance
Restore indigenous fish diversity and abundance
Restore indigenous fish diversity and abundance
1^
2 Recruitment and dispersal of endemic fish and catfish
Recruitment and dispersal of endemic fish and catfish
Recruitment and dispersal of endemic fish and catfish
Recruitment and dispersal of endemic fish and catfish
Recruitment and dispersal of endemic fish and catfish
Recruitment and dispersal of endemic fish and catfish
Recruitment and dispersal of endemic fish and catfish
Recruitment and dispersal of endemic fish and catfish
Recruitment and dispersal of endemic fish and catfish
Recruitment and dispersal of endemic fish and catfish
3 Maintenance of native fish and platypus*
Maintenance of native fish and platypus*
Maintenance of native fish and platypus*
Maintenance of native fish and platypus*
Maintenance of native fish and platypus*
Maintenance of native fish and platypus*
Maintenance of native fish and platypus*
Maintenance of native fish and platypus*
Maintenance of native fish and platypus*
Maintenance of native fish and platypus*
4 Diversity of macroinvertebrates
Diversity of macroinvertebrates
Diversity of macroinvertebrates
Diversity of macroinvertebrates
Diversity of macroinvertebrates
Diversity of macroinvertebrates
Diversity of macroinvertebrates
Diversity of macroinvertebrates
Diversity of macroinvertebrates
Diversity of macroinvertebrates
5 Maintain aquatic vegetation
Maintain aquatic vegetation
Maintain aquatic vegetation
Maintain aquatic vegetation
Maintain aquatic vegetation
Maintain aquatic vegetation
Maintain aquatic vegetation
Maintain aquatic vegetation
Maintain aquatic vegetation
Maintain aquatic vegetation
6 Maintain channel capacity
Maintain channel capacity
7 Maintain riparian vegetation
Maintain riparian vegetation
Maintain riparian vegetation
Maintain riparian vegetation
Maintain riparian vegetation
8 Maintain floodplain vegetation
Maintain floodplain vegetation
Summer/ Autumn baseflows
(1,3,4,5) (1,3,4,5) (1,3,4,5) (1,3,4,5) (1,3,4,5) (1,3,4,5) (1,3,4,5) (1,3,4,5) (1,3,4,5) (1,3,4,5)
Winter/Spring baseflows
(1,3,4,5) (1,3,4,5) (1,3,4,5) (1,3,4,5) (1,3,4,5) (1,3,4,5) (1,3,4,5) (1,3,4,5) (1,3,4,5) (1,3,4,5)
Summer/Autumn freshes
(1,4) (1,4) (1,4) (1,4) (1,4) (1,4) (1,4) (1,4) (1,4) (1,4)
Winter/Spring freshes
(1, 2,4,5) (1, 2,4,5) (1, 2,4,5) (1, 2,4,5) (1, 2,4,5) (1, 2,4,5) (1, 2,4,5) (1, 2,4,5) (1, 2,4,5) (1, 2,4,5)
Winter/Spring High Flows
(4,5) (4,5) (4,5) (4,5) (4,5) (4,5) (4,5) (4,5) (4,5) (4,5)
Autumn/Spring Very High Flows
(4,6,7) (4,6,7) (4,6,7) (4,6,7) (4,6,7)
Bankfull (6,7) (6,7) Overbank (6,7,8) (6,7,8)
Table 6-2 Planned ten year water regime for Reaches 2 to 4 of the Wimmera River (assuming water availability) Numbers in brackets relate to the relevant focus objectives. Rows highlighted in grey are only able to be delivered by natural events (including augmented by ‘piggybacking’ on natural events. Rows highlighted in green would only be provided by natural (flood) events.^ indicates applicable to Reaches 2 and 3 only * indicates should platypuses re-establish in this reach

115
Table 6-3 Optimal ten year water regime for Reaches 1 to 3 of the MacKenzie River (assuming water availability) Numbers in brackets relate to the relevant focus objectives. Rows highlighted in grey are only able to be delivered by natural events (including augmented by ‘piggybacking’ on natural events. Rows highlighted in green would only be provided by natural (flood) events.
Year 1 2 3 4 5 6 7 8 9 10 Objectives Maintenance of
native fish Maintenance of native fish
Maintenance of native fish
Maintenance of native fish
Maintenance of native fish
Maintenance of native fish
Maintenance of native fish
Maintenance of native fish
Maintenance of native fish
Maintenance of native fish 1
2 Recruitment and dispersal of endemic fish
Recruitment and dispersal of endemic fish
Recruitment and dispersal of endemic fish
Recruitment and dispersal of endemic fish
Recruitment and dispersal of endemic fish
Recruitment and dispersal of endemic fish
Recruitment and dispersal of endemic fish
Recruitment and dispersal of endemic fish
Recruitment and dispersal of endemic fish
Recruitment and dispersal of endemic fish
3 Persistence/ dispersal of platypuses
Persistence/ dispersal of platypuses
Persistence/ dispersal of platypuses
Persistence/ dispersal of platypuses
Persistence/ dispersal of platypuses
Persistence/ dispersal of platypuses
Persistence/ dispersal of platypuses
Persistence/ dispersal of platypuses
Persistence/ dispersal of platypuses
Persistence/ dispersal of platypuses
4 Diversity of macroinvertebrates
Diversity of macroinvertebrates
Diversity of macroinvertebrates
Diversity of macroinvertebrates
Diversity of macroinvertebrates
Diversity of macroinvertebrates
Diversity of macroinvertebrates
Diversity of macroinvertebrates
Diversity of macroinvertebrates
Diversity of macroinvertebrates
5 Maintain aquatic vegetation
Maintain aquatic vegetation
Maintain aquatic vegetation
Maintain aquatic vegetation
Maintain aquatic vegetation
Maintain aquatic vegetation
Maintain aquatic vegetation
Maintain aquatic vegetation
Maintain aquatic vegetation
Maintain aquatic vegetation
6 Maintain channel capacity
Maintain channel capacity
Maintain channel capacity
Maintain channel capacity
Maintain channel capacity
7 Recruitment of Wimmera Bottlebrush
Recruitment of Wimmera Bottlebrush
Recruitment of Wimmera Bottlebrush
Recruitment of Wimmera Bottlebrush
Recruitment of Wimmera Bottlebrush
8 Maintain riparian vegetation
Maintain riparian vegetation
Maintain riparian vegetation
Maintain riparian vegetation
Maintain riparian vegetation
9 Maintain floodplain vegetation
Maintain floodplain vegetation
Summer/ Autumn baseflows
(1,3,4,5) (1,3,4,5) (1,3,4,5) (1,3,4,5) (1,3,4,5) (1,3,4,5) (1,3,4,5) (1,3,4,5) (1,3,4,5) (1,3,4,5)
Winter/Spring baseflows
(1,3,4,5) (1,3,4,5) (1,3,4,5) (1,3,4,5) (1,3,4,5) (1,3,4,5) (1,3,4,5) (1,3,4,5) (1,3,4,5) (1,3,4,5)
Summer/Autumn freshes
(2,3,4) (2,3,4) (2,3,4) (2,3,4) (2,3,4) (2,3,4) (2,3,4) (2,3,4) (2,3,4) (2,3,4)
Winter/Spring freshes
(2,3,4) (2,3,4) (2,3,4) (2,3,4) (2,3,4) (2,3,4) (2,3,4) (2,3,4) (2,3,4) (2,3,4)
Winter/Spring High Flows
(2,7) (2,7) (2,7) (2,7) (2,7)
Bankfull (6,7,8) (6,7,8) (6,7,8) (6,7,8) (6,7,8) Overbank (6,7,8,9) (6,7,8,9)

116
Table 6-4 Optimal ten year water regime for Lower Mt William Creek (assuming water availability) Numbers in brackets relate to the relevant focus objectives. Rows highlighted in grey are only able to be delivered by natural events (including augmented by ‘piggybacking’ on natural events. Rows highlighted in green would only be provided by natural (flood) events.
Year 1 2 3 4 5 6 7 8 9 10 Objectives Maintenance of
native fish Maintenance of native fish
Maintenance of native fish
Maintenance of native fish
Maintenance of native fish
Maintenance of native fish
Maintenance of native fish
Maintenance of native fish
Maintenance of native fish
Maintenance of native fish 1
2 Recruitment and dispersal of endemic fish
Recruitment and dispersal of endemic fish
Recruitment and dispersal of endemic fish
Recruitment and dispersal of endemic fish
Recruitment and dispersal of endemic fish
Recruitment and dispersal of endemic fish
Recruitment and dispersal of endemic fish
Recruitment and dispersal of endemic fish
Recruitment and dispersal of endemic fish
Recruitment and dispersal of endemic fish
3 Diversity of macroinvertebrates
Diversity of macroinvertebrates
Diversity of macroinvertebrates
Diversity of macroinvertebrates
Diversity of macroinvertebrates
Diversity of macroinvertebrates
Diversity of macroinvertebrates
Diversity of macroinvertebrates
Diversity of macroinvertebrates
Diversity of macroinvertebrates
4 Maintain aquatic vegetation
Maintain aquatic vegetation
Maintain aquatic vegetation
Maintain aquatic vegetation
Maintain aquatic vegetation
Maintain aquatic vegetation
Maintain aquatic vegetation
Maintain aquatic vegetation
Maintain aquatic vegetation
Maintain aquatic vegetation
5 Maintain channel capacity
Maintain channel capacity
Maintain channel capacity
Maintain channel capacity
Maintain channel capacity
6 Maintain riparian vegetation
Maintain riparian vegetation
Maintain riparian vegetation
Maintain riparian vegetation
Maintain riparian vegetation
7 Maintain floodplain vegetation
Maintain floodplain vegetation
Annual baseflows
(1,2,3,4) (1,2,3,4) (1,2,3,4) (1,2,3,4) (1,2,3,4) (1,2,3,4) (1,2,3,4) (1,2,3,4) (1,2,3,4) (1,2,3,4)
Summer/Autumn freshes
(12,3) (1,3,4) (1,3,4) (1,3,4) (1,3,4) (1,3,4) (1,3,4) (1,3,4) (1,3,4) (1,3,4)
Winter/Spring freshes
(2,4) (2,4) (2,4) (2,4) (2,4) (2,4) (2,4) (2,4) (2,4) (2,4)
Winter/Spring High Flows
(2,3,6) (2,3,6) (2,3,6) (2,3,6) (2,3,6)
Bankfull (3,5,6) (3,5,6) (3,5,6) (3,5,6) (3,5,6) Overbank (3,5,6,7) (3,5,6,7)
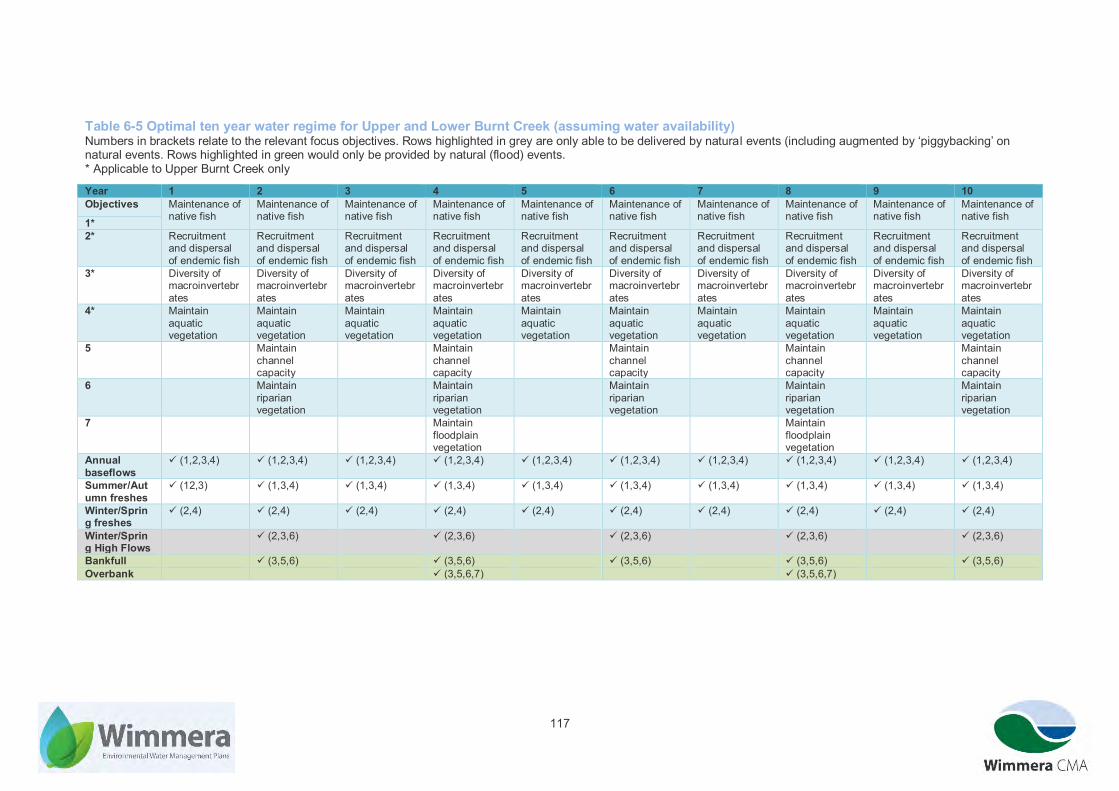
117
Table 6-5 Optimal ten year water regime for Upper and Lower Burnt Creek (assuming water availability) Numbers in brackets relate to the relevant focus objectives. Rows highlighted in grey are only able to be delivered by natural events (including augmented by ‘piggybacking’ on natural events. Rows highlighted in green would only be provided by natural (flood) events. * Applicable to Upper Burnt Creek only
Year 1 2 3 4 5 6 7 8 9 10 Objectives Maintenance of
native fish Maintenance of native fish
Maintenance of native fish
Maintenance of native fish
Maintenance of native fish
Maintenance of native fish
Maintenance of native fish
Maintenance of native fish
Maintenance of native fish
Maintenance of native fish 1*
2* Recruitment and dispersal of endemic fish
Recruitment and dispersal of endemic fish
Recruitment and dispersal of endemic fish
Recruitment and dispersal of endemic fish
Recruitment and dispersal of endemic fish
Recruitment and dispersal of endemic fish
Recruitment and dispersal of endemic fish
Recruitment and dispersal of endemic fish
Recruitment and dispersal of endemic fish
Recruitment and dispersal of endemic fish
3* Diversity of macroinvertebrates
Diversity of macroinvertebrates
Diversity of macroinvertebrates
Diversity of macroinvertebrates
Diversity of macroinvertebrates
Diversity of macroinvertebrates
Diversity of macroinvertebrates
Diversity of macroinvertebrates
Diversity of macroinvertebrates
Diversity of macroinvertebrates
4* Maintain aquatic vegetation
Maintain aquatic vegetation
Maintain aquatic vegetation
Maintain aquatic vegetation
Maintain aquatic vegetation
Maintain aquatic vegetation
Maintain aquatic vegetation
Maintain aquatic vegetation
Maintain aquatic vegetation
Maintain aquatic vegetation
5 Maintain channel capacity
Maintain channel capacity
Maintain channel capacity
Maintain channel capacity
Maintain channel capacity
6 Maintain riparian vegetation
Maintain riparian vegetation
Maintain riparian vegetation
Maintain riparian vegetation
Maintain riparian vegetation
7 Maintain floodplain vegetation
Maintain floodplain vegetation
Annual baseflows
(1,2,3,4) (1,2,3,4) (1,2,3,4) (1,2,3,4) (1,2,3,4) (1,2,3,4) (1,2,3,4) (1,2,3,4) (1,2,3,4) (1,2,3,4)
Summer/Autumn freshes
(12,3) (1,3,4) (1,3,4) (1,3,4) (1,3,4) (1,3,4) (1,3,4) (1,3,4) (1,3,4) (1,3,4)
Winter/Spring freshes
(2,4) (2,4) (2,4) (2,4) (2,4) (2,4) (2,4) (2,4) (2,4) (2,4)
Winter/Spring High Flows
(2,3,6) (2,3,6) (2,3,6) (2,3,6) (2,3,6)
Bankfull (3,5,6) (3,5,6) (3,5,6) (3,5,6) (3,5,6) Overbank (3,5,6,7) (3,5,6,7)
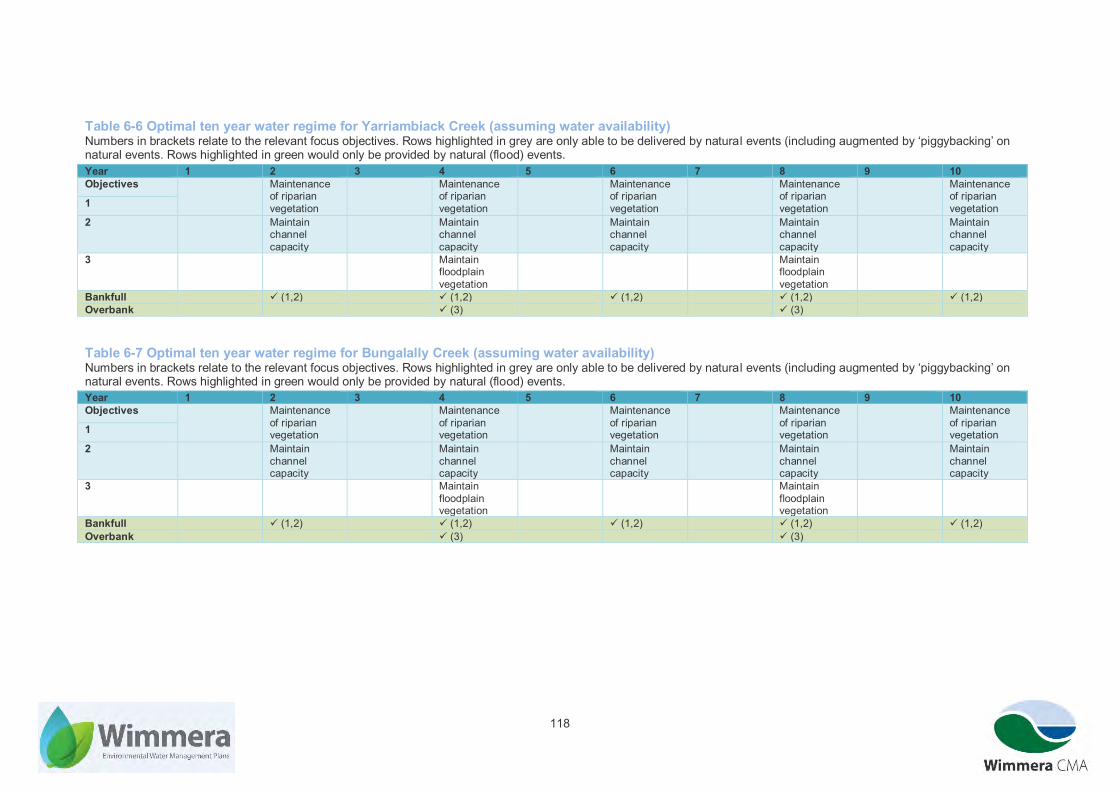
118
Table 6-6 Optimal ten year water regime for Yarriambiack Creek (assuming water availability) Numbers in brackets relate to the relevant focus objectives. Rows highlighted in grey are only able to be delivered by natural events (including augmented by ‘piggybacking’ on natural events. Rows highlighted in green would only be provided by natural (flood) events.
Table 6-7 Optimal ten year water regime for Bungalally Creek (assuming water availability) Numbers in brackets relate to the relevant focus objectives. Rows highlighted in grey are only able to be delivered by natural events (including augmented by ‘piggybacking’ on natural events. Rows highlighted in green would only be provided by natural (flood) events.
Year 1 2 3 4 5 6 7 8 9 10 Objectives Maintenance
of riparian vegetation
Maintenance of riparian vegetation
Maintenance of riparian vegetation
Maintenance of riparian vegetation
Maintenance of riparian vegetation 1
2 Maintain channel capacity
Maintain channel capacity
Maintain channel capacity
Maintain channel capacity
Maintain channel capacity
3 Maintain floodplain vegetation
Maintain floodplain vegetation
Bankfull (1,2) (1,2) (1,2) (1,2) (1,2) Overbank (3) (3)

119
6.4.1.Planning for the watering of the Wimmera River Terminal Lakes The total annual environmental entitlement for the Wimmera River system is proportionally very small relative to the capacity of the Wimmera River’s terminal lakes. Combined, the VEWH entitlement of 40,560 ML (shared with the Glenelg River) and CEWH entitlement of 28,000 ML are just over 10% of the estimated capacity of Lakes Hindmarsh and Albacutya (total of 608,000 ML (Ecological Associates, 2004)). However the construction of the Wimmera Mallee Pipeline and purchase of the Wimmera Irrigators’ Association entitlement have made a significant difference to the likelihood of Lake Hindmarsh being filled, as shown by hydrologic modelling done in support of the business cases for these projects (Table 6-8). Table 6-8 Modelling results showing compliance with recommended lake fill events due to environmental water recovery projects (GWMWater, 2011)
Although the increase in held environmental water combined with very wet spells will still not meet all the recommended requirements for the lakes as outlined in The Environmental Water Needs of the Wimmera River Terminal Lakes (Ecological Associates, 2004), judicious use of allocations during exceptionally wet conditions could increase the number of lake-full events than would otherwise be the case. Typically, these additional lake-full events would follow a sequence of very wet years when allocations and carryover volumes were high, the terminal lakes were already partly inundated, and ongoing contributions from unregulated streamflows are likely. A set of rules was developed which would increase the frequency of meeting lake-full recommendations, without compromising ecological objectives for the rest of the Wimmera River system (through drawing down allocations too much or by excessive flows for the summer/autumn period). Key findings in the study that developed these rules (Optimising Environmental Entitlement Use for the Wimmera River and Terminal Lakes (Jacobs, 2014)) are summarised below:
Targeting improved compliance for lake-full events for Lake Albacutya achieves similar outcomes for Lake Hindmarsh given that Lake Hindmarsh needs to fill for water to spill into Lake Albacutya;
Although the modelling period is comparatively extensive (1891-2012), the infrequent episodic nature of lake-full events, especially for Lake Albacutya, makes it inherently difficult to develop definitive rules for environmental water management. Therefore it can be applied as a ‘rule of thumb’ rather than an absolute. However the modelled data indicates that if the rules were applied
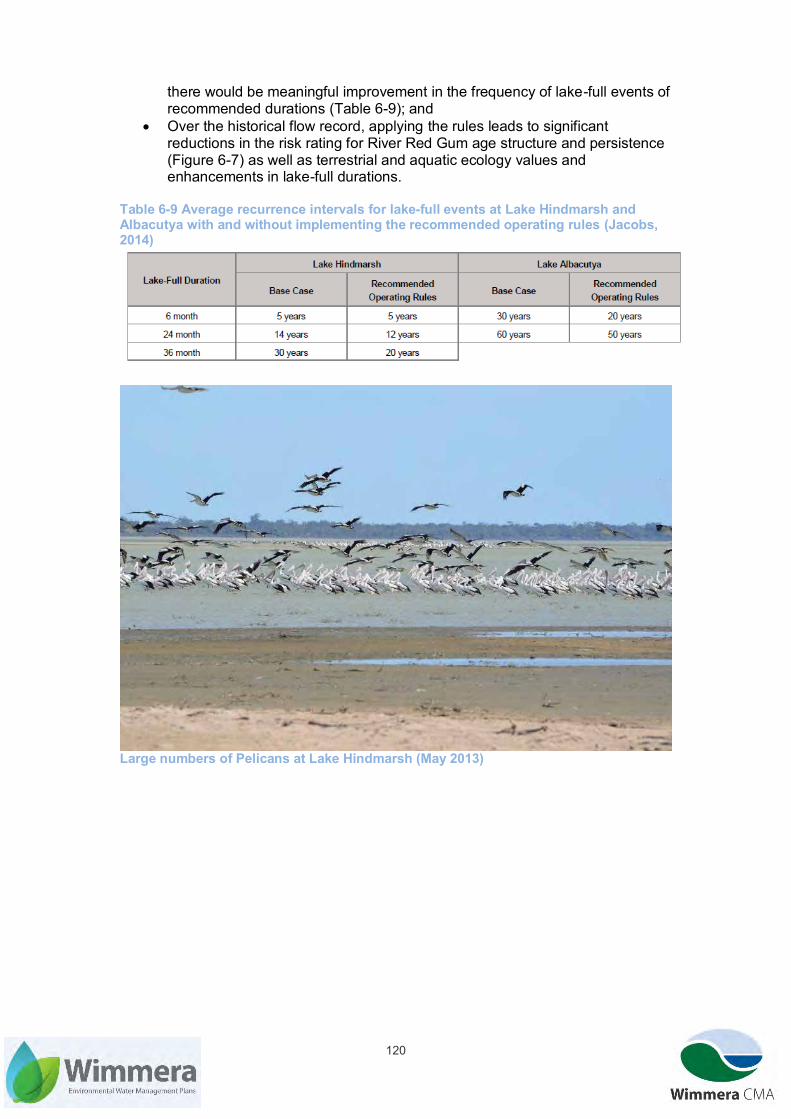
120
there would be meaningful improvement in the frequency of lake-full events of recommended durations (Table 6-9); and
Over the historical flow record, applying the rules leads to significant reductions in the risk rating for River Red Gum age structure and persistence (Figure 6-7) as well as terrestrial and aquatic ecology values and enhancements in lake-full durations.
Table 6-9 Average recurrence intervals for lake-full events at Lake Hindmarsh and Albacutya with and without implementing the recommended operating rules (Jacobs, 2014)
Large numbers of Pelicans at Lake Hindmarsh (May 2013)
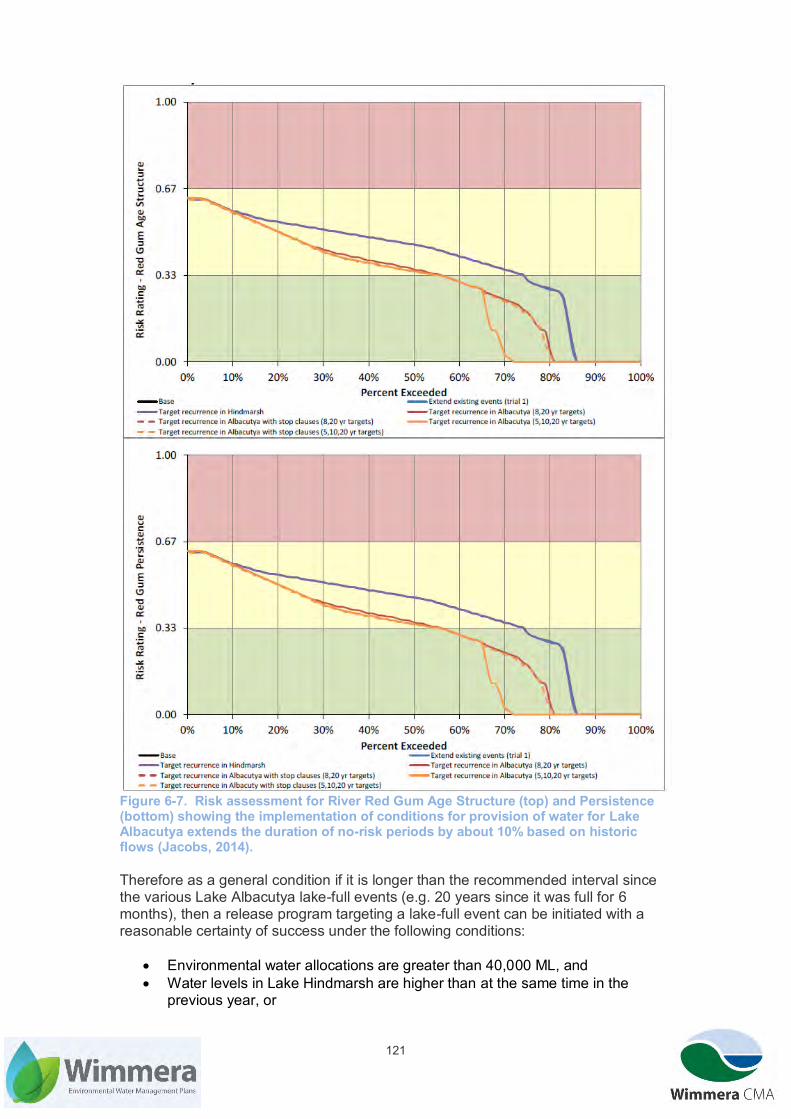
121
Figure 6-7. Risk assessment for River Red Gum Age Structure (top) and Persistence (bottom) showing the implementation of conditions for provision of water for Lake Albacutya extends the duration of no-risk periods by about 10% based on historic flows (Jacobs, 2014). Therefore as a general condition if it is longer than the recommended interval since the various Lake Albacutya lake-full events (e.g. 20 years since it was full for 6 months), then a release program targeting a lake-full event can be initiated with a reasonable certainty of success under the following conditions:
Environmental water allocations are greater than 40,000 ML, and Water levels in Lake Hindmarsh are higher than at the same time in the
previous year, or
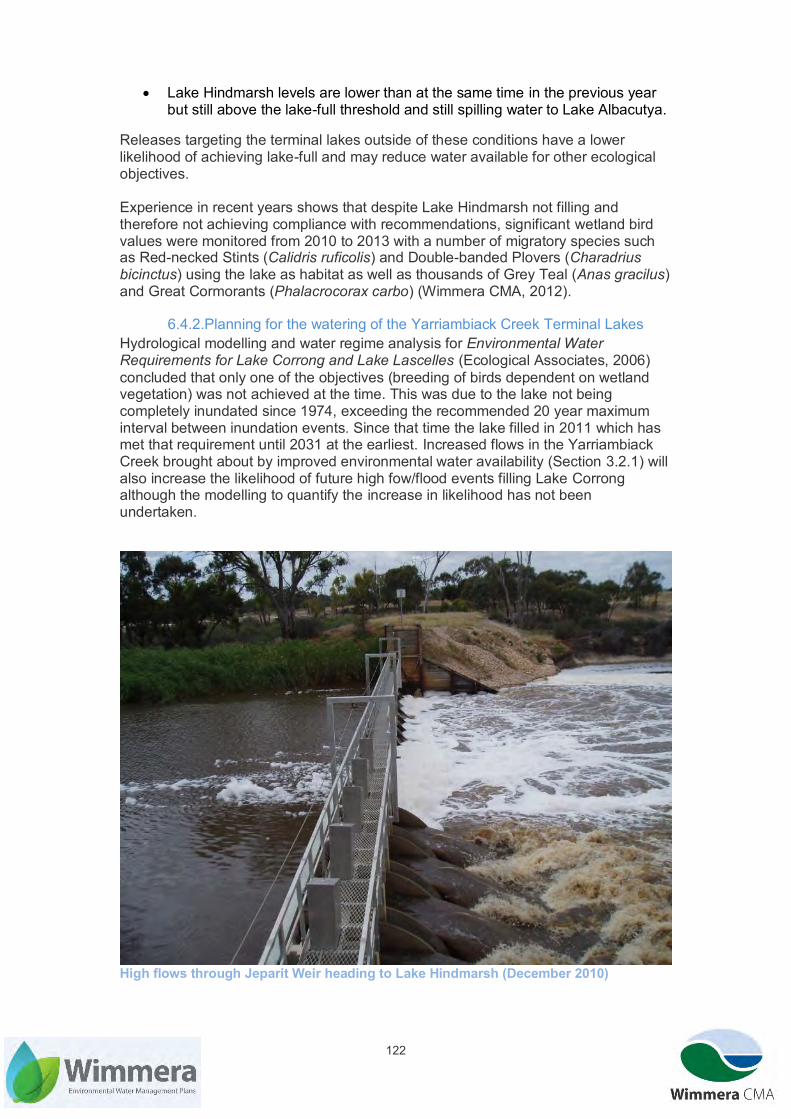
122
Lake Hindmarsh levels are lower than at the same time in the previous year but still above the lake-full threshold and still spilling water to Lake Albacutya.
Releases targeting the terminal lakes outside of these conditions have a lower likelihood of achieving lake-full and may reduce water available for other ecological objectives. Experience in recent years shows that despite Lake Hindmarsh not filling and therefore not achieving compliance with recommendations, significant wetland bird values were monitored from 2010 to 2013 with a number of migratory species such as Red-necked Stints (Calidris ruficolis) and Double-banded Plovers (Charadrius bicinctus) using the lake as habitat as well as thousands of Grey Teal (Anas gracilus) and Great Cormorants (Phalacrocorax carbo) (Wimmera CMA, 2012).
6.4.2.Planning for the watering of the Yarriambiack Creek Terminal Lakes Hydrological modelling and water regime analysis for Environmental Water Requirements for Lake Corrong and Lake Lascelles (Ecological Associates, 2006) concluded that only one of the objectives (breeding of birds dependent on wetland vegetation) was not achieved at the time. This was due to the lake not being completely inundated since 1974, exceeding the recommended 20 year maximum interval between inundation events. Since that time the lake filled in 2011 which has met that requirement until 2031 at the earliest. Increased flows in the Yarriambiack Creek brought about by improved environmental water availability (Section 3.2.1) will also increase the likelihood of future high fow/flood events filling Lake Corrong although the modelling to quantify the increase in likelihood has not been undertaken.
High flows through Jeparit Weir heading to Lake Hindmarsh (December 2010)

123
7. Managing Risks Associated with Environmental Watering A qualitative risk assessment has been undertaken to assign the level of long-term risk to achieving the ecological objectives for the Wimmera River system as well as risks related to the delivery of environmental water through the implementation of this EWMP. The relationship between likelihood (probability of occurrence) and the severity (severity of impact) provide the basis for evaluating the level of risk (Table 7-1). This risk matrix as well as definitions as to consequences are taken from Draft Victorian Environmental Watering Partnership Risk Management Framework (RMCG, 2014). The definitions of risk consequence are included in Appendix 9. Table 7-1 Risk matrix (derived from RMCG (2014))
Consequences Extreme Major Moderate Minor Negligible
Likelihood
Almost Certain Extreme Extreme High Moderate Low Likely Extreme Extreme High Moderate Low
Possible Extreme High Moderate Moderate Low Unlikely Extreme High Moderate Low Low
Rare High Moderate Low Low Low The results from the risk assessment are outlined in Table 7-2. Management measures are recommended and the residual risk, assuming the measures have been successfully completed, is recalculated using the same matrix. It should be noted that risk management is undertaken on an annual basis regarding the delivery of environmental water (such as flooding and social impacts) are outlined in Seasonal Watering Proposals developed by the Wimmera CMA in accordance with the guidance in Draft Victorian Environmental Watering Partnership Risk Management Framework (RMCG, 2014).
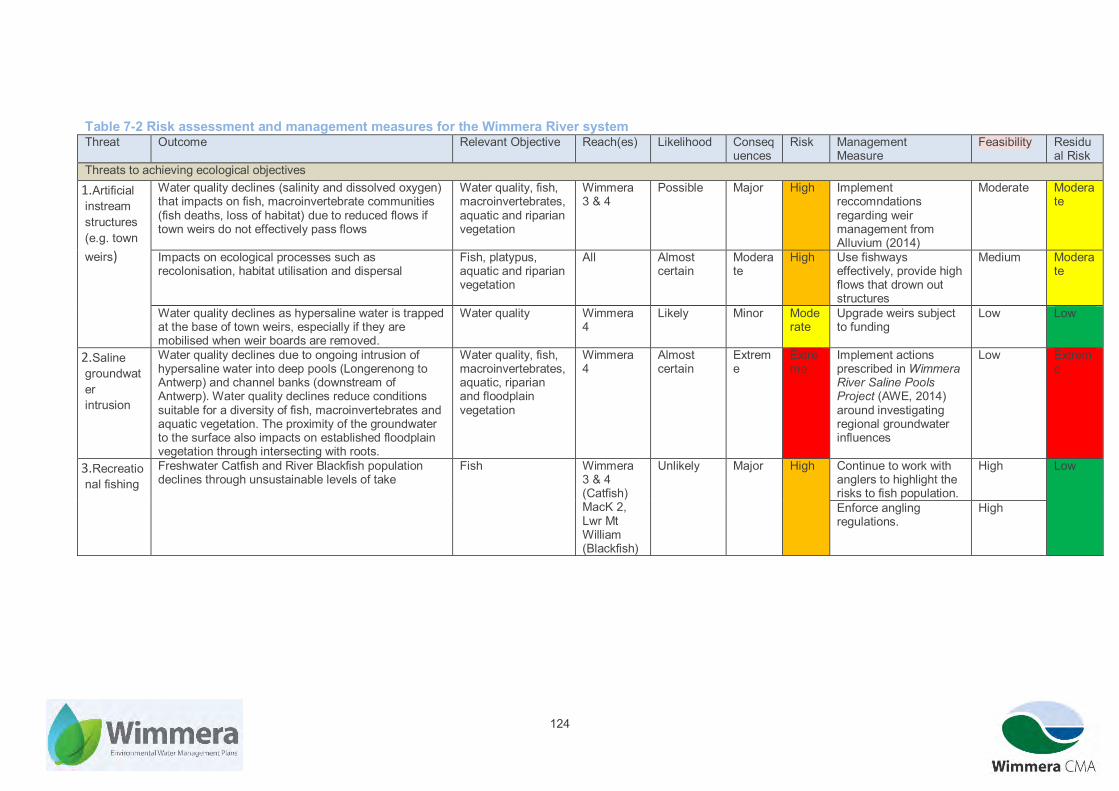
124
Table 7-2 Risk assessment and management measures for the Wimmera River system Threat Outcome Relevant Objective Reach(es) Likelihood Conseq
uences Risk Management
Measure Feasibility Residu
al Risk Threats to achieving ecological objectives
1.Artificial instream structures (e.g. town weirs)
Water quality declines (salinity and dissolved oxygen) that impacts on fish, macroinvertebrate communities (fish deaths, loss of habitat) due to reduced flows if town weirs do not effectively pass flows
Water quality, fish, macroinvertebrates, aquatic and riparian vegetation
Wimmera 3 & 4
Possible Major High Implement reccomndations regarding weir management from Alluvium (2014)
Moderate Moderate
Impacts on ecological processes such as recolonisation, habitat utilisation and dispersal
Fish, platypus, aquatic and riparian vegetation
All Almost certain
Moderate
High Use fishways effectively, provide high flows that drown out structures
Medium Moderate
Water quality declines as hypersaline water is trapped at the base of town weirs, especially if they are mobilised when weir boards are removed.
Water quality Wimmera 4
Likely Minor Moderate
Upgrade weirs subject to funding
Low Low
2.Saline groundwater intrusion
Water quality declines due to ongoing intrusion of hypersaline water into deep pools (Longerenong to Antwerp) and channel banks (downstream of Antwerp). Water quality declines reduce conditions suitable for a diversity of fish, macroinvertebrates and aquatic vegetation. The proximity of the groundwater to the surface also impacts on established floodplain vegetation through intersecting with roots.
Water quality, fish, macroinvertebrates, aquatic, riparian and floodplain vegetation
Wimmera 4
Almost certain
Extreme
Extreme
Implement actions prescribed in Wimmera River Saline Pools Project (AWE, 2014) around investigating regional groundwater influences
Low Extreme
3.Recreational fishing
Freshwater Catfish and River Blackfish population declines through unsustainable levels of take
Fish Wimmera 3 & 4 (Catfish) MacK 2, Lwr Mt William (Blackfish)
Unlikely Major
High Continue to work with anglers to highlight the risks to fish population.
High Low
Enforce angling regulations.
High

125
Threat Outcome Relevant Objective Reach(es) Likelihood Consequences
Risk Management Measure
Feasibility Residual Risk
4.Grazing pressures
Unrestricted grazing leads to impacts such as the consumption of aquatic, floodplain and riparian vegetation in particular grasses, herbs and juvenile woody vegetation. This in turn leads to reductions in habitat and water quality (increased erosion) affecting fish and macronvertebrate populations.
Water quality, fish, macroinvertebrates, aquatic, floodplain and riparian vegetation
All (in isolated sections)
Almost certain
Moderate
High Implement management activities in VWMS and WWS around improving management of riparian areas through such actions as ensuring licence conditions are being complied with.
High Moderate
5.Carp/Goldfish/ Tench
The ‘mumbling’ feeding behaviour of Carp impacts on vegetation through disturbance of seeds/seedlings as well increasing turbidity which limits light penetration for photosynthesis. Carp also dominate the biomass outcompeting native species for resources and creating direct impacts such as disturbing Freshwater Catfish nests. Goldfish and Tench also impact on native fish through competition for resources although to a lesser degree than Carp. Carp and Goldfish can also transmit diseases to native fish.
Water quality, fish, macro-invertebrates, aquatic vegetation
All although carp numbers are low in MacKenzie 2 and Upper Burnt
Almost certain
Extreme
Extreme
Implement management activities in WWS intended to prevent the dispersal of carp as well as increase understanding of their movement and behaviour in the Wimmera river. Support initiatives such as the Koi Herpes Virus and Daughterless Carp gene technology.
Low Extreme
6.Redfin/ Gambusia
Redfin impact on native fish communities through being voracious predators of small-bodied native fish as well as young large-bodied species. They also carry a disease that impacts on native species. Gambusia also impact on small-bodied native fish populations through aggressive behaviour (fin-nipping) and predating on fish and frog eggs.
Fish All Almost certain
Major Extreme
Encourage a catch and take approach from anglers with respect to Redfin. Little can be done to mitigate the threat of these species.
Low Extreme
7.Foxes Foxes impact on Platypus, Rakali and Eastern Long-Necked Turlte populations through predation.
Platypus MacKenzie 2 and potentially MacKenzie 3, Upper Burnt and Wimmera
Likely Minor Moderate
Implementing fox control actions as part of the Wimmera Invasive Plant and Animal Management Strategy (Wimmera CMA, 2010) (WIPAMS).
Moderate Moderate

126
Threat Outcome Relevant Objective Reach(es) Likelihood Consequences
Risk Management Measure
Feasibility Residual Risk
8.Weeds Riparian and floodplain vegetation outcomes are threatened by invasive plant species such as Bridal Creeper, Boneseed, Blackberry, Perennial Veldt Grass and Cape Tulip through outcompeting and smothering native species.
Riparian and floodplain vegetation
All Almost certain
Extreme
Extreme
Implement invasive plant management activities outlined in the WWS.
Low Extreme
9.Rabbits Rabbits impact on riparian and floodplain vegetation through consuming herbs, grasses and seedlings of woody species. They have been known to have prevented recruitment of species when at high densities including Cypress-Pine at Lake Albacutya.
Riparian and floodplain vegetation
All Almost certain
Moderate
High Implement invasive plant and animal management activities outlined in the WWS and WIPAMS.
High Moderate
Threat related to the delivery of environmental water 10.Mobilising hypersaline pools
Environmental water releases can mobilise hypersaline water and potentially without sufficient flows it will not be diluted and impact on downstream water quality and ecological values.
Water quality, fish, aquatic and riparian vegetation
Wimmera 4
Possible Moderate
Moderate
Implement actions prescribed in Wimmera River Saline Pools Project (AWE, 2014) as well as undertake further analysis of flow thresholds understood to mobilise saline pools.
Moderate Low
11.Releasing poor quality water
In a couple of cases (lower Mt William and MacKenzie Rivers) environmental water being released is poorer quality than tributary inflows or environmental water released from another location. This in turn impacts on water quality outcomes through increased salinity and turbidity which affects aquatic vegetation, fish and macroinvertebrate communities.
Water quality, fish, aquatic and riparian vegetation
Lwr Mt William
Possible Minor Moderate
Investigate the impact of releases on ecological objectives.
High Low
MacKenzie 3
Source water from Lake Wartook in preference to the Moora Channel for the lower MacKenzie River.
Moderate
12.Drowning infant platypuses
If flows are too high during late spring through to mid-autumn there is a risk of maternal burrows filling with water and drowning infant platypuses
Platypus MacKenzie 2
Unlikely Minor Low Do not conduct high flows during late spring through to mid-autumn
High Low

127
8. Environmental Water Delivery Infrastructure
The Wimmera – Mallee Headworks System was designed to harvest and deliver water to the stock and domestic and irrigation channel systems which typically involved outfalling modest volumes (35 ML/d - 400 ML/d) at constant rates for long periods (typically several months). Therefore the headworks infrastructure was not originally intended to deliver water to waterways (apart from when they are a conduit for water transfers). Therefore some sites have undergone upgrades to improve their effectiveness in delivering environmental water. However there remain a number sites where physical constraints on environmental water delivery remain.
8.1. Infrastructure and Operational Constraints
2.1.1.Wimmera River In 2007, Huddleston’s Weir was upgraded through the construction of a V-notch in the weir (and associated rock ramp fishway) as well as installing remote operation of gates that allow water to be harvested from the weir into Taylors Lake via the Wimmera Inlet Channel. There still needs to be manual intervention to ensure that the gates are operating effectively (i.e. not caught on debris).This was to enable it to effectively deliver passing flows created from water savings from the Wimmera Mallee Pipeline. In order to determine compliance with these passing flows, it has been identified that permanent streamflow gauging needs to be installed at the site. Town weirs at Horsham, Dimboola and Jeparit have also been modified with up to eight flume gates installed, replacing drop boards to improve the efficiency and accuracy of operation to pass flows through weir pools. A separate section (Appendix 7) has been developed to provide guidance around how Horsham Rural City Council and Hindmarsh Shire Council should operate the weirs to enable the transition of environmental flows through weir pools whilst providing opportunities for weir pools to capture unregulated and passing flows at appropriate times to in part reflect historic arrangements (prior to the completion of the Northern and Wimmera Mallee Pipelines). Consideration was also made around the impact of constant pool heights on the riverbank which has also been an issue raised during consulation for the EWMP. In 2007 an assessment of various features (low level crossings etc.) that could affect the passage of environmental water releases throughout the Wimmera River System was undertaken. The study identified and provided recommendations for a number of low level crossings in need of maintenance and/or upgrading to enable them to convey recommended environmental flows based on those made in the original Wimmera River system environmental flows study (SKM, 2008). In their current configuration they pass low flows although at comparatively modest volumes they overtop and cause social impacts (i.e. access issues) and localised erosion.
2.1.2.Mt William Creek For the lower Mt William Creek, flows above the 100 ML/d, such as recommended for winter-spring freshes, may have the potential to inundate rural land downstream of Lake Lonsdale. 200 ML/d was noted by Barlow (1987) to create inundation and access issues (Earth Tech, 2005). However, a transfer of approximately 200 ML/d from Lake Bellfield to Taylor’s Lake in 2013 did not cause any known issues. The Mt William Creek Streamflows Study (Alluvium, 2015) looked at the lower Mt William Creek’s hydrology and hydraulics involved limited modelling to improve understanding around channel capacities. In particular, when higher volumes are released (>100 ML/d) they enter high flow channels (e.g. Sheepwash Creek) attracting additional in-stream losses which affects the ability to meet recommended volumes at downstream compliance points (Alluvium, 2015). In 1910, landholders modified the creek’s course north of the Western Highway, changing its ‘main’ course from the westerly to the easterly course (Wimmera Mallee Water , 1998) (Section 3.2.1). Now only the easterly course flows during low-medium flows, entering the Wimmera Inlet Channel and flowing a short distance (about 1 km) before entering the Wimmera River via the “Big Pipe” regulator.

128
Automating the outlet valves at Lake Lonsdale would improve delivery of environmental water releases to Mt William Creek in terms of not requiring GWMWater staff to manually change flow rates on a daily basis (to easily ensure appropriate rates of flow rise and fall). Lake Bellfield’s distance from the lower Mt William Creek means that using it to supply the lower Mt William Creek is unlikely under most conditions. The minimum release rate from Lake Bellfield is around 50 ML/d (Earth Tech, 2005) to 30 ML/d (Kym Wilson, GWMWater, pers comm.) due to cavitation issues with the valve opening. So it would only feasibly be able to provide freshes rather than baseflows.
2.1.3.MacKenzie River Following recommendations from a report looking at capacity constraints of infrastructure (Earth Tech, 2005), regulating structures on the MacKenzie River were upgraded at Dad and Dave Weir and Distribution Heads. Previous drop board weirs were replaced by automated flume gates at both sites and a fishway was also installed at Dad and Dave Weir The flume gates can provide volumes up to and including all freshes, however, instream losses (a swampy area with low channel capacity in Wartook) potentially makes delivering the highest fresh (190 ML/d) unfeasible (Earth Tech, 2006). Whilst these flume gates have the ability to be operated remotely by SCADA (Supervisory Control and Data Acquisition), telecommunications will need to be established to these sites and so still require manual operation.
2.1.4.Burnt Creek The upgraded infrastructure at Distribution Heads included upgrading the regulator into Burnt Creek by replacing the drop boards with automated flume gates. Again, despite the ability for these gates to be automatically operated, a lack of telecommunications means that they are still manually operated. An upgrade also took place to the outlet from the Toolondo Channel into the lower Burnt Creek through the installation of a low flow pipe with magnetic flow meter. This can deliver up to 15 ML/d which is below the updated flow rates recommended for the reach although there are three large undershot gates that can deliver water to this reach however currently there is no way to meter flows through these gates. All infrastructure at this location has to be manually operated. An assessment on physical influences on environmental water releases (Earth Tech, 2006) highlighted that a number of low level road crossings would be impacted by recommended flows. It also flagged the negative effect the concentrated pumping diversions (near its confluence with the Wimmera River) would have on environmental water releases.
2.1.5.Bungalally Creek A small undershot gate controls flows into Bungalally Creek which needs to be operated manually. There is currently no way to monitor or meter flows on an ongoing basis. Several structures (informal weirs and road crossings) have been identified as being unable to pass recommended flows (Earth Tech, 2006) and so need to be upgraded.
2.1.6.Yarriambiack Creek As mentioned in Section 3.2.1, flows in Yarriambiack Creek are dictated by flows in the Wimmera River and there is no ability to directly release flow into the creek. However, a number of low level crossings have been identified as potential impediments to environmental water releases through slowing the passage of flows such as culverts that are partially blocked and/or of insufficient capacity, derelict bridges and water resource infrastructure (e.g. historic levees) (Earth Tech, 2007). Town weirs at Warracknabeal, Brim and Beulah need to be managed appropriately in order to pass environmental flows, guidance around this is included in Appendix 7.
8.2.Addressing Flow Delivery Constraints Recommendations addressing delivery constraints are listed in detail in the following reports;
Assessing the Physical Constraints on Environmental Flow Delivery in the Wimmera Catchment (Earth Tech, 2005); and

129
Wimmera and Glenelg Systems Environmental Metering Program (VEWH, 2014). Furthermore the following reports outline a comprehensive analysis of physical features (crossings, informal weirs, debris blockages etc.) that may prevent the effective delivery of environmental water releases;
Assessing Influences on Environmental Water Releases in the Wimmera, Phase 1, Stages 1 and 2 (Earth Tech, 2006);
Assessing Influences on Environmental Water Releases in the Wimmera, Phase 2, Stages 1 and 2 (Earth Tech, 2007);
Influences on Environmental Water Releases in the Wimmera River (SKM, 2008); and Wimmera Catchment Management Authority – Impediments to Environmental Water
Releases Site Review (Catchment Health Engineering, 2015).
2.2.1.Wimmera River Infrastructure constraints prevent the delivery of larger recommended flow components (400 ML/d to 6000 ML/d) from regulated releases alone, therefore unregulated and/or passing flows will be required to achieve this. The absence of major impoundments on the Wimmera River has meant that large flows cannot be released to meet recommended volumes at compliance points and if necessary, regulated releases from Lake Lonsdale and/or Taylor’s Lake can be used to supplement shortfalls in the hydrograph. This will be determined on a case by case basis given increasing risks around unintended inundation of land at higher flows. Wimmera CMA will also work with local government in terms of seeking the upgrading of low-level crossings impacted by environmental water releases in terms of ensuring sufficient hydraulic capacity.
2.2.2.Mt William Creek Further investigations are required to determine the most appropriate actions to address constraints in delivery. Larger recommended flows (500 ML/d to 1,500 ML/d) are unable to be delivered by outlets from Lake Lonsdale as well as potentially creating unacceptable impacts on rural land downstream so there are no current proposals to increase the outlet capacity at Lake Lonsdale. A 2015 study into the creek’s hydrology and hydraulics has provided provide further advice around managing releases in order to improve environmental outcomes (Alluvium, 2015). Weirs operated by community members next to the former Trudgeon’s Weir and Dadswell’s Bridge have a large bearing on the proportion of water entering anabranches or continuing along the main channel (Section 3.2.1). Ongoing management arrangements for these weirs will need to be developed that consider legal, environmental and safety issues. Investigations into upgrading infrastructure so as to enable passage of low to medium flows along the western branch of the Mt William Creek indicate that given the current configuration at the bifurcation between the two branches, a permanent upgrade is unfeasible and more investigations are required to better understand the environmental values and watering requirements of the western as opposed to the eastern branch (RPS, 2015). Given the western branch also enters the Wimmera Inlet Chanel upstream of its confluence with the Wimmera River, infrastructure upgrades to enable the effective continuation of flows downstream is required at the Mt William Creek Outfall (RPS, 2015) although the priority is lower than some other sites given the likely infrequent use with the current configuration at the upstream bifurcation.
2.2.3.MacKenzie River Whilst several infrastructure improvements have been made in recent years (Section 2.1.3), there is a need to ensure that they are being operated to their full capacity in terms of automation to improve their effectiveness in delivering flows. This entails having the regulators at Dad and Dave and Distribution Heads as well as the Lake Wartook outlet remotely operated by SCADA which has

130
been problematic due to telecommunication issues and damage to the sites due to floods and vandalism. Swampy sections of the river restrict the ability to deliver higher recommended flows to Reaches 2 and 3 (130 ML/d – 1000 ML/d) (Earth Tech, 2006). These flows also present unacceptable risks in terms of flooding freehold land and so will not be delivered or supplemented by regulated releases.
2.2.4.Burnt Creek Similar to the MacKenzie River, the Burnt Creek regulator at Distribution Heads needs to be upgraded to be operated remotely by SCADA. There is scope for upgrades to the regulators at the Toolondo Channel in terms of automation and accuracy. There are also a number of opportunities to improve the passage of environmental flows through upgrading and improving maintenance at a number of low level road crossings. In recent years Wimmera CMA has undergone a series of trials where progressively larger volumes were released and the impacts on low level crossings was assessed. Another action is reviewing and amending water licencing arrangements for the proliferation of extraction points for the lower Burnt Creek to ensure flows reach the end of the waterway, especially since all diverters have ready access to reticulated water supplies.
Pump on the lower Burnt Creek
2.2.5.Bungalally Creek The current undershot weir could be upgraded to include a magnetic flow meter to improve the accuracy of measurement as well as potential automation. Other required works would be to address the number of low level crossings and informal weir structures which hinder the effective passage of environmental flows.
8.3.Complementary Management Activities Waterway management strategies have been developed for the waterways within the Wimmera River System by the Wimmera and Mallee CMAs. They have documented a number of complementary management activities to try and ensure that the outcomes derived from environmental watering can be maximised. Program logic models were developed which prescribed a range of actions that would address waterway threats (such as modified flow regimes,

131
degraded water quality and riparian vegetation) (GHD, 2012). Typically this includes invasive plant and animal control (e.g. rabbit, bridal creeper, boneseed) as well the establishment of riparian management agreements to remove threats around livestock impacts on riparian areas. Other complementary management activities planned to take place over the life of the EWMP include community engagement activities as well as trial interventions to mitigate the threats of carp and saline groundwater intrusions. The WWS also contains the Lake Albacutya Ramsar Site Management Plan. Details around the types and quantities of complementary management activities are outlined in the Wimmera Waterway Strategy 2014-2022 (Wimmera CMA, 2014) and Mallee Waterway Strategy 2014-2022 (Mallee CMA, 2014).
9. Demonstrating Outcomes
Given the substantial expenditure of public funds that has been undertaken to recover water for environmental flows ($532 million for the Wimmera Mallee Pipeline alone (Department of Environment, 2015)) there is a need to demonstrate the outcomes this will achieve. There is a parallel need to ensure that held environmental water is delivered in the manner and at the times specified to target areas as precisely and as efficiently as possible. Monitoring is critical to achieving these outcomes. Intervention monitoring is needed to document ecological responses to flows, and also to contribute to adaptive management. Compliance monitoring is needed to show flows have been delivered in accordance with recommendations; and long-term monitoring, sometimes known as condition monitoring, is needed to document trends and provide context for intervention monitoring though answering key questions around flow-ecology relationships. Intervention monitoring in the 1990’s and 2000’s, when environmental water releases were of relatively short duration (several weeks to months), typically involved regular water quality and photo point monitoring. As time progressed, monitoring became more sophisticated in terms of trying to capture change in biological and physical endpoints such as macroinvertebrates, fish, geomorphology and vegetation at a longer (multi-year) timescale. Previous work, namely Monitoring Environmental Flows in the Wimmera and Glenelg Rivers (Sharpe & Quinn, 2004), Monitoring Vegetation Response to Environmental Flows in the Wimmera: A Strategic Approach (Dyer & Roberts, 2006) and Monitoring Environmental Water Releases in the Wimmera and MacKenzie Rivers (Wimmera CMA, 2007) have prescribed various monitoring endpoints linked to ecological objectives and techniques to try and quantify the changes brought about by environmental water releases. Efficiencies brought about by improved understanding of the most effective techniques for monitoring outcomes from environmental watering have been incorporated in the following priorities, however it should be noted that there are ongoing learnings brought about through implementing various monitoring programs. This is evidenced through the review of VEFMAP and the MDBA Environmental Water Knowledge and Research program, both of which commenced during the drafting of this EWMP. It is important that monitoring priorities are flexible and adapt to the latest ecological understanding relating to the effects of environmental water on waterways.
9.1.1.Compliance Monitoring Compliance monitoring is critical in determining short-term responses to environmental water releases with respect to the provision of habitat (wetted perimeters, connection of pools and anabranches). This can be undertaken through observations (e.g. photo point monitoring) and pressure sensors. The installation of telemetry at a number stream gauging stations means that information about flow rates and water quality is instantaneously accessible rather than requiring waits of several months before it becomes available (Figure 9-1). This significantly improves environmental water managers’ decision making through ensuring regulated releases are providing the recommended volumes at compliance points as well as quantifying the effect of various flow components on water quality.

132
Maintaining and where possible expanding the stream gauge telemetry network to other sites and including enhancements like additional water quality parameters and remote cameras will be invaluable going forward in improving environmental water implementation. Section 3.1 contains details on ways the current stream gauge network can be improved to assist environmental water management. Some gauging sites (e.g. Wimmera River at Drung Drung) have inherent challenges due to the mobility of sediment in the channel. In recent years there have also been discrepancies between flows measured in the Wimmera River at Lochiel Railway Bridge and Wimmera River upstream of Dimboola with the downstream site recording greater flows than the upstream one despite the absence of any tributary inflows in between the two sites. Therefore regular measurement of streamflows is required to ensure flow rating tables are accurate and equipment is well maintained. The use of pressure sensors combined with calibrated hydraulic models for locations where flow recommendations have been made can be used to verify if recommended flow rates at compliance points are in fact providing the desired hydraulic conditions (e.g. depth of water over a bench). Recommendations for compliance monitoring techniques are included in Table 9-1. Table 9-1 Recommended compliance monitoring for Wimmera River system
Monitoring How Objective Monitored Where Continuous Water quality and flow
Streamflow gauging stations
Water quality (salinity, temperature, dissolved oxygen) and compliance with recommended flow rates
At current gauging stations (some sites lack flow and/or water quality) plus expand network to include additional sites on Reach 2 MacKenzie River, lower Burnt Creek, Yarriambiack Creek and Terminal Lakes.
Water level Pressure sensors
Verify hydraulic model depths at certain flow rates, rates of evaporation/seepage to assist in refuge pool management
At hydraulic model sites and identified refuge pools (including weir pools).
Streamflow gauging station on the Wimmera River at Wail (upstream Dimboola)

133
Figure 9-1. Telemetry provides instantaneous measures of flow rates and various water quality parameters at key sites across the Wimmera River System.
9.1.2.Long-term Monitoring VEFMAP has been been contributing to the monitoring of various physical and ecological endpoints in the Wimmera since 2007. Over time this has been modified with the omission of some techniques such as measurement of different biotopes (areas of slackwater, runs, riffles etc.), structural woody habitat (snags) and substrate that have been too difficult to measure accurately and/or safely. The focus remains on water quality, fish, geomorphology and vegetation responses to flows. At the time of the drafting of the EWMP, the VEFMAP program was undergoing a review to refine and update it following a number of years of extensive data collection and analysis.
Fish Objectives that pertain to fish are listed in Section 6.2 and revolve around maintaining or re-establishing endemic fish through a number of reaches, maintaining a self-sustaining Freshwater Catfish population in the Wimmera River and ensuring sufficient water quality to maintain native species including stocked species like Golden and Silver Perch. Since 2009, VEFMAP fish monitoring has taken place at 12 sites along the Reach 3 and 4 of the Wimmera River and this annual snapshot has provided an insight into the dynamics of the fish population in the Wimmera River, going from extreme drought to flooding and subsequent increased environmental water releases since 2010-11. Results of the last four VEFMAP fish surveys have been summarised in Table 9-2 which is a sequence of years when water levels were much higher than during the drought when sampling results would have been skewed by the limited habitat (confined to refuge pools). It shows that after an initial increase in numbers of carp following wet conditions, native species are steadily increasing in their size and biomass following several years of regular environmental water releases. Other waterways have been monitored on a rotating multi-year basis as part of the Wimmera CMA’s regional fish monitoring program as well as the MDBA’s Sustainable Rivers Audit. Whilst it is anticipated that fish monitoring in the Wimmera River will be ongoing for the short-medium term as part of VEFMAP, funding constraints means that monitoring in other waterways is unlikely. It is a priority to ensure that periodic monitoring in all waterways with fish objectives occurs. Fish monitoring in the MacKenzie River has been provided information about the expanding distribution

134
of Common Carp and endemic fish species as well as flagging potential management options to try and limit favourable conditions for Gambusia (Ecology Australia (2014)). Ideally annual monitoring aligned with monitoring attainment of fish objectives takes place along all reaches with fish objectives as a number of species have very short life-cycles (1-2 years) (Table 9-3). Whilst undertaking the monitoring according to the method prescribed in Wimmera Fish Monitoring Program – Monitoring Program Design (SKM, 2006) it may be worth reviewing and updating based on more recent experience in monitoring and data analysis. Table 9-2 VEFMAP fish monitoring results for the Wimmera River from Ecology Australia (2014) and Austral (2015) Common name Species 2011 2012 2013 2014 2015
Australian Smelt Retropinna semoni 1 8 1
Carp Cyprinus carpio 641 479 135 110 113
Carp Gudgeon complex Hypseleotris sp. 4 2
Eastern Gambusia Gambusia holbrooki 40 16 12 141 38
Common Galaxias Galaxias maculatus 8 8
Flat-Headed Gudgeon Philypnodon grandiceps 9 48 49 375 95
Freshwater Catfish Tandanus tandanus 4 1 3 1
Golden Perch Macquaria ambigua 3 20 29 36 31
Goldfish Carassius auratus 79 46 6 48 20
Redfin Perch Perca fluviatilis 50 51 77 75 22
Silver Perch Bidyanus bidyanus 1 1 11 2
Murray Cod Maccullochella peelii peelii 1
Total abundance 827 670 324 806 324
Total biomass (weighed fish only) (kg) 155.2 175.6 70.9 115.2 170.2
Species richness 8 9 10 9 10
% endemic species abundance 1.2 7.2 15.1 47.5 29.6
% non-endemic species abundance 0.8 4.5 16.9 6.1 10.8
% exotic species abundance 97.9 88.4 71.0 46.4 59.6
% exotic species biomass (weighed fish only) 96.6 90.7 68.6 75.2 72.7
Table 9-3 Recommended fish monitoring for Wimmera River system
Monitoring How Objective Monitored
Reaches
Fish (juvenile and adult)
Electrofishing, bait traps, fyke nets (as per (SKM, 2006))
Recruitment, maintenance and dispersal of fish species
All except Bungalally Creek, Yarriambiack Creek and terminal lakes (at sites historically monitored as part of VEFMAP and Wimmera CMA fish monitoring program ideally on an annual basis.)
Vegetation Objectives for vegetation are listed in Section 6.2 and relate to protecting and restoring riparian and floodplain EVCs across all waterways. The MacKenzie River, Wimmera River and Mt William Creek have objectives for submerged aquatic and emergent vegetation, and there is a specific objective for the condition and recruitment of the Wimmera Bottlebrush in the lower MacKenzie River. Vegetation monitoring transects established at one site on the MacKenzie River and four sites on the Wimmera River as part of VEFMAP have been surveyed four times (every two years since 2008) over various flow conditions (drought to flood). This has enabled a reasonable picture to be established of trends in response to differing flow regimes. It would be very useful to increase the

135
number of transects along these reaches as well as establishing sites on reaches of Burnt, Yarriambiack, Bungalally and Mt William Creeks and the upper MacKenzie River given vegetation objectives apply for all these reaches. Ideally results from transect monitoring can be converted into some measure of condition, potentially using a similar approach to that used for the fish monitoring program (number of native/exotic species observed compared to expected and proportion of coverage). River Red Gum condition has been monitored along the Wimmera River, Burnt Creek, MacKenzie River, Yarriambiack Creek and Bungalally Creek and Black Box condition has been monitored on the Yarriambiack Creek. Monitoring frequency has been every two years on the Wimmera River but elsewhere monitoring has not taken place since at least 2010. Therefore it would be worth resurveying these trees to determine change in condition following the 2011 floods and subsequent years of environmental watering. Wimmera Bottlebrush condition was monitored several times during the mid-late 2000’s and this showed the difference in condition and recruitment due to environmental watering. However it would be worthwhile to undertake monitoring of Wimmera Bottlebrush stands (including establishing control sites) after several years to verify this and ensure that recruitment is continuing and succeeding. Dyer and Roberts (2006) reviewed the monitoring program recommended in Sharpe and Quinn (2004) and the vegetation objectives established in SKM (2003), based on site assessments and appraisal of the vegetation species likely to show a response to environmental watering. This led to monitoring options for five plant groups;
adjacent trees, riparian shrubs, understorey, forbs and herbs, in-channel macrophytes; and bank and channel edge macrophytes.
Specific recommendations regarding this and other vegetation monitoring actions are contained in Table 9-4. At the time of drafting of this EWMP, WetMAP, the Victorian Wetland Monitoring and Assessment Program, was being developed which potentially will have vegetation monitoring recommendations for the terminal lakes. The Ecological Character Description for Lake Albacutya (Cibilic & White, 2010) briefly considers the need for vegetation monitoring for Lake Albacutya although more comprehensive monitoring recommendations are required. Table 9-4 Recommended vegetation monitoring for Wimmera River System
Monitoring How Objective Monitored Where Canopy condition
River Red Gum and Black Box – tagged trees or remote sensing
Protect floodplain EVCs
Floodplain EVCs, in particular surveyed in BL&A (2007, 2008), Terminal Lakes
Recruitment Seedling survey at pre-designated points
Protect and restore riparian and floodplain EVCs
Sites in Dyer and Roberts (2006) plus additional sites (Bungalally, Yarriambiack Creek, Terminal Lakes)
Recruitment Growth rate at seedlings above/below areas watered by large freshes
Protect and restore riparian EVCs
Sites in Dyer and Roberts (2006) plus additional sites (Bungalally, Yarriambiack Creek)
Growth rate and reproduction in shrubs
% new growth and other reproduction stages on branches
Protect and restore riparian and floodplain EVCs
Sites in Dyer and Roberts (2006) plus additional sites (Bungalally, Yarriambiack Creek)
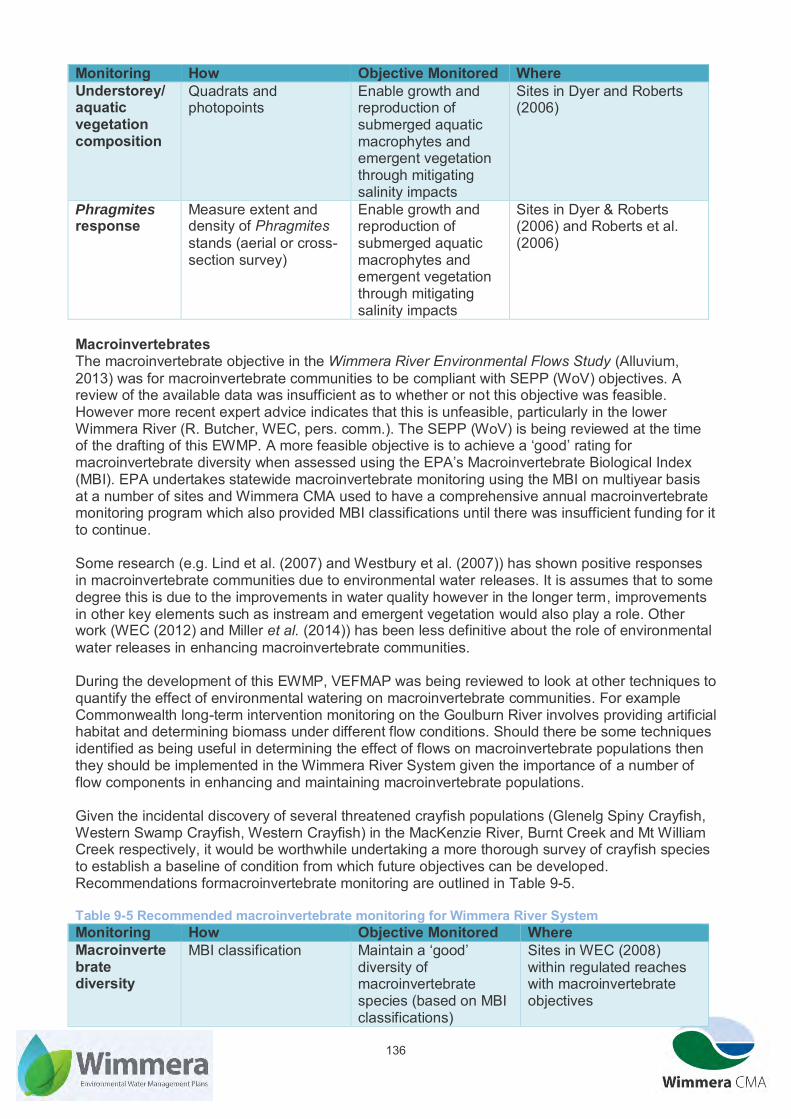
136
Monitoring How Objective Monitored Where Understorey/ aquatic vegetation composition
Quadrats and photopoints
Enable growth and reproduction of submerged aquatic macrophytes and emergent vegetation through mitigating salinity impacts
Sites in Dyer and Roberts (2006)
Phragmites response
Measure extent and density of Phragmites stands (aerial or cross-section survey)
Enable growth and reproduction of submerged aquatic macrophytes and emergent vegetation through mitigating salinity impacts
Sites in Dyer & Roberts (2006) and Roberts et al. (2006)
Macroinvertebrates The macroinvertebrate objective in the Wimmera River Environmental Flows Study (Alluvium, 2013) was for macroinvertebrate communities to be compliant with SEPP (WoV) objectives. A review of the available data was insufficient as to whether or not this objective was feasible. However more recent expert advice indicates that this is unfeasible, particularly in the lower Wimmera River (R. Butcher, WEC, pers. comm.). The SEPP (WoV) is being reviewed at the time of the drafting of this EWMP. A more feasible objective is to achieve a ‘good’ rating for macroinvertebrate diversity when assessed using the EPA’s Macroinvertebrate Biological Index (MBI). EPA undertakes statewide macroinvertebrate monitoring using the MBI on multiyear basis at a number of sites and Wimmera CMA used to have a comprehensive annual macroinvertebrate monitoring program which also provided MBI classifications until there was insufficient funding for it to continue. Some research (e.g. Lind et al. (2007) and Westbury et al. (2007)) has shown positive responses in macroinvertebrate communities due to environmental water releases. It is assumes that to some degree this is due to the improvements in water quality however in the longer term, improvements in other key elements such as instream and emergent vegetation would also play a role. Other work (WEC (2012) and Miller et al. (2014)) has been less definitive about the role of environmental water releases in enhancing macroinvertebrate communities. During the development of this EWMP, VEFMAP was being reviewed to look at other techniques to quantify the effect of environmental watering on macroinvertebrate communities. For example Commonwealth long-term intervention monitoring on the Goulburn River involves providing artificial habitat and determining biomass under different flow conditions. Should there be some techniques identified as being useful in determining the effect of flows on macroinvertebrate populations then they should be implemented in the Wimmera River System given the importance of a number of flow components in enhancing and maintaining macroinvertebrate populations. Given the incidental discovery of several threatened crayfish populations (Glenelg Spiny Crayfish, Western Swamp Crayfish, Western Crayfish) in the MacKenzie River, Burnt Creek and Mt William Creek respectively, it would be worthwhile undertaking a more thorough survey of crayfish species to establish a baseline of condition from which future objectives can be developed. Recommendations formacroinvertebrate monitoring are outlined in Table 9-5. Table 9-5 Recommended macroinvertebrate monitoring for Wimmera River System
Monitoring How Objective Monitored Where Macroinvertebrate diversity
MBI classification Maintain a ‘good’ diversity of macroinvertebrate species (based on MBI classifications)
Sites in WEC (2008) within regulated reaches with macroinvertebrate objectives

137
Monitoring How Objective Monitored Where Macroinvertebrate response to flows
TBD – successful techniques from CEWO long-term monitoring project
Maintain a ‘good’ diversity of macroinvertebrate species (based on MBI classifications)
TBD
Crayfish Trapping using hoop nets etc.
Need to establish an objective for crayfish
Mt William and Burnt Creeks, MacKenzie River
Platypus The objectives for Platypus are outlined in Section 6.2. Platypus have been monitored on the MacKenzie River on a near annual basis since 2001. Monitoring has shown the declines and increases in platypus numbers and their distribution from drought to flood years and subsequent regular environmental water releases. Platypus numbers remain very low (cesar, 2012, 2013) so it is hoped that the trend in increasing numbers continues. For the lower Wimmera River and other waterways where platypus may exist but trapping has not or cannot take place, other mechanisms are being applied like the platypusSPOT program run by cesar and supported by Wimmera CMA. This initiative involves information from community members who observe a platypus and include the details on the platypusSPOT website (Figure 9-2) (http://platypusspot.org/). Platypus monitoring using environmental DNA technology was successfully trialled in the lower MacKenzie River and Wimmera River in 2015, where water samples are tested for the presence of platypus DNA. Results showed a correlation between environmental DNA results and known platypus presence/absence. The next phase should involve rolling this out to other waterways as a cost-effective mechanism for reaches where platypuses are found. Recommended platypus monitoring is described in Table 9-6.
Figure 9-2. platypusSPOT is an initiative of cesar whereby community members can contribute information about platypus sightings. Table 9-6 Recommended Platypus monitoring for Wimmera River System
Monitoring How Objective Monitored Where Platypus population trends
Trapping Maintenance of platypus populations
Sites in cesar (2014)

138
Monitoring How Objective Monitored Where Platypus population extent
Environmental DNA Extent of platypus population in Wimmera River system
TBD – sites in MacKenzie River, Mt William Creek, Wimmera River, Burnt Creek
Geomorphology The geomorphic objectives for the Wimmera River system are listed in Section 6.2. Bankfull and overbank flows are the flow components required to achieve these objectives and therefore detecting change is contingent on high flows and flood events rather than regulated releases or passing flows. The objective for the prevention of salt scalding that was proposed in the Wimmera River Environmental Flows Study (Alluvium, 2013) is deemed to be not feasible given the volumes of water required to achieve it. Monitoring sites to detect geomorphic change were established in 2005 by surveying transects at three sites on the Wimmera River and one each on Burnt Creek and the MacKenzie River, with another site on the Wimmera River added in 2007 as part of VEFMAP. All sites apart from the one on Burnt Creek were resurveyed in 2014. Jacobs (2014) noted a number of changes brought about by the 2010 and 2011 floods and subsequent environmental flows such as reduced in-channel vegetation, establishment of fringing vegetation and increases in channel capacity through scour of channel beds (especially in pools) and retreat and accretion of channel banks (Figure 9-3, Figure 9-4). Monitoring is recommended to be event-driven, following large floods or during ongoing dry conditions with little to no flow (Jacobs, 2014). Another option maybe the use of LiDAR (Light Detection and Ranging) data collected by drones or light planes to create digital terrain models which can show where channel changes have occurred above the waterline. Details of recommended geomorphology monitoring are included in Table 9-7.
Figure 9-3. Photo point at the geomorphology monitoring site on the Wimmera River at Big Bend showing the reduction in Phragmites between 2008 (top) and 2014 (bottom) due to a combination of floods and regular environmental water releases (Source: (Jacobs, 2014))

139
Table 9-7 Recommended geomorphology monitoring for Wimmera River System
Monitoring How Objective Monitored Where Channel dimensions
Cross-sections Channel capacity/integrity
All reaches (currently only available for sites surveyed as part of SKM (2006) and Jacobs (2014) on the Wimmera an MacKenzie River and Burnt Creek as well as new sites on Mt William, Bungalally and Yarriambiack Creeks
Digital elevation models (from LiDAR)
Channel capacity/integrity (above waterline only)
All reaches
Figure 9-4. Surveyed cross-section on the Wimmera River at Big Bend showing the increase in channel capacity following increased flows including the 2011 floods (Source: (Jacobs, 2014))
Birds The monitoring of waterbirds is the key means by which the achievements of the ecological objectives for the terminal lakes of ther Wimmera River terminal lakes described in Section 6.2 can be determined. Quarterly bird monitoring at Lake Hindmarsh in 2012-2013 has been a useful indicator of the lake’s significant value when it contained water in terms of the diversity and abundance of species. Ideally when Lake Hindmarsh and Albacutya contain significant volumes of water seasonal bird surveys would take place. This monitoring can capture information which will enable an assessment as to whether the lakes are functioning effectively as a wetland through supporting a variety of different species during the various ecological cycles as the lakes fill and the dry. Given the significance of these lakes is derived from supporting vast numbers of waterbirds and significant proportions of threatened bird species, identifying and counting birds on these lakes can demonstrate if this remains the case. In the interim, given the woodland surrounding these lakes supports large numbers of Regent Parrots (Polytelis anthopeplus), there is merit in occasional bird surveys to track the trends of the Regent Parrot population. Bird monitoring recommendations are included in Table 9-8. Table 9-8 Recommended bird monitoring for Wimmera River system
Monitoring How Objective Monitored Where Waterbirds Quarterly surveys
during wet conditions Ecological function of wetlands, maintenance of significant attributes of wetlands
Lake Hindmarsh, Lake Albacutya
Regent Parrots
Annual surveys Maintenance of significant attributes of wetlands
Lake Hindmarsh, Lake Albacutya
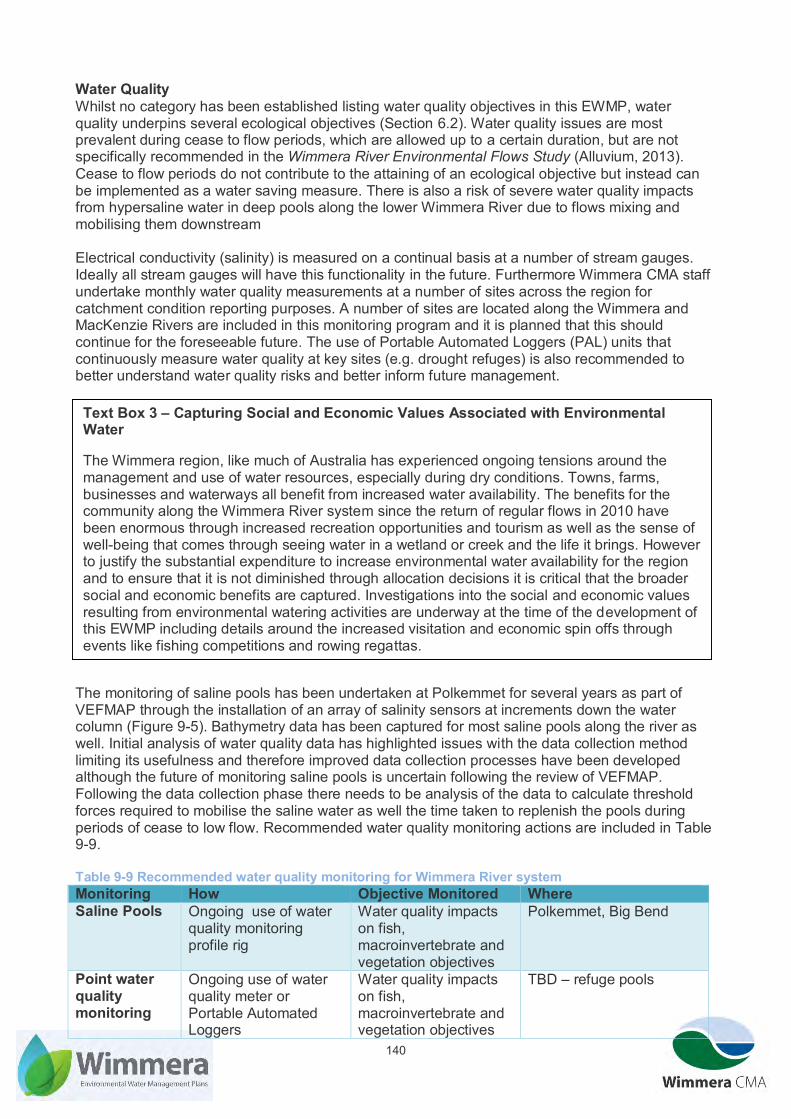
140
Water Quality Whilst no category has been established listing water quality objectives in this EWMP, water quality underpins several ecological objectives (Section 6.2). Water quality issues are most prevalent during cease to flow periods, which are allowed up to a certain duration, but are not specifically recommended in the Wimmera River Environmental Flows Study (Alluvium, 2013). Cease to flow periods do not contribute to the attaining of an ecological objective but instead can be implemented as a water saving measure. There is also a risk of severe water quality impacts from hypersaline water in deep pools along the lower Wimmera River due to flows mixing and mobilising them downstream Electrical conductivity (salinity) is measured on a continual basis at a number of stream gauges. Ideally all stream gauges will have this functionality in the future. Furthermore Wimmera CMA staff undertake monthly water quality measurements at a number of sites across the region for catchment condition reporting purposes. A number of sites are located along the Wimmera and MacKenzie Rivers are included in this monitoring program and it is planned that this should continue for the foreseeable future. The use of Portable Automated Loggers (PAL) units that continuously measure water quality at key sites (e.g. drought refuges) is also recommended to better understand water quality risks and better inform future management.
The monitoring of saline pools has been undertaken at Polkemmet for several years as part of VEFMAP through the installation of an array of salinity sensors at increments down the water column (Figure 9-5). Bathymetry data has been captured for most saline pools along the river as well. Initial analysis of water quality data has highlighted issues with the data collection method limiting its usefulness and therefore improved data collection processes have been developed although the future of monitoring saline pools is uncertain following the review of VEFMAP. Following the data collection phase there needs to be analysis of the data to calculate threshold forces required to mobilise the saline water as well the time taken to replenish the pools during periods of cease to low flow. Recommended water quality monitoring actions are included in Table 9-9. Table 9-9 Recommended water quality monitoring for Wimmera River system
Monitoring How Objective Monitored Where Saline Pools Ongoing use of water
quality monitoring profile rig
Water quality impacts on fish, macroinvertebrate and vegetation objectives
Polkemmet, Big Bend
Point water quality monitoring
Ongoing use of water quality meter or Portable Automated Loggers
Water quality impacts on fish, macroinvertebrate and vegetation objectives
TBD – refuge pools
Text Box 3 – Capturing Social and Economic Values Associated with Environmental Water The Wimmera region, like much of Australia has experienced ongoing tensions around the management and use of water resources, especially during dry conditions. Towns, farms, businesses and waterways all benefit from increased water availability. The benefits for the community along the Wimmera River system since the return of regular flows in 2010 have been enormous through increased recreation opportunities and tourism as well as the sense of well-being that comes through seeing water in a wetland or creek and the life it brings. However to justify the substantial expenditure to increase environmental water availability for the region and to ensure that it is not diminished through allocation decisions it is critical that the broader social and economic benefits are captured. Investigations into the social and economic values resulting from environmental watering activities are underway at the time of the development of this EWMP including details around the increased visitation and economic spin offs through events like fishing competitions and rowing regattas.
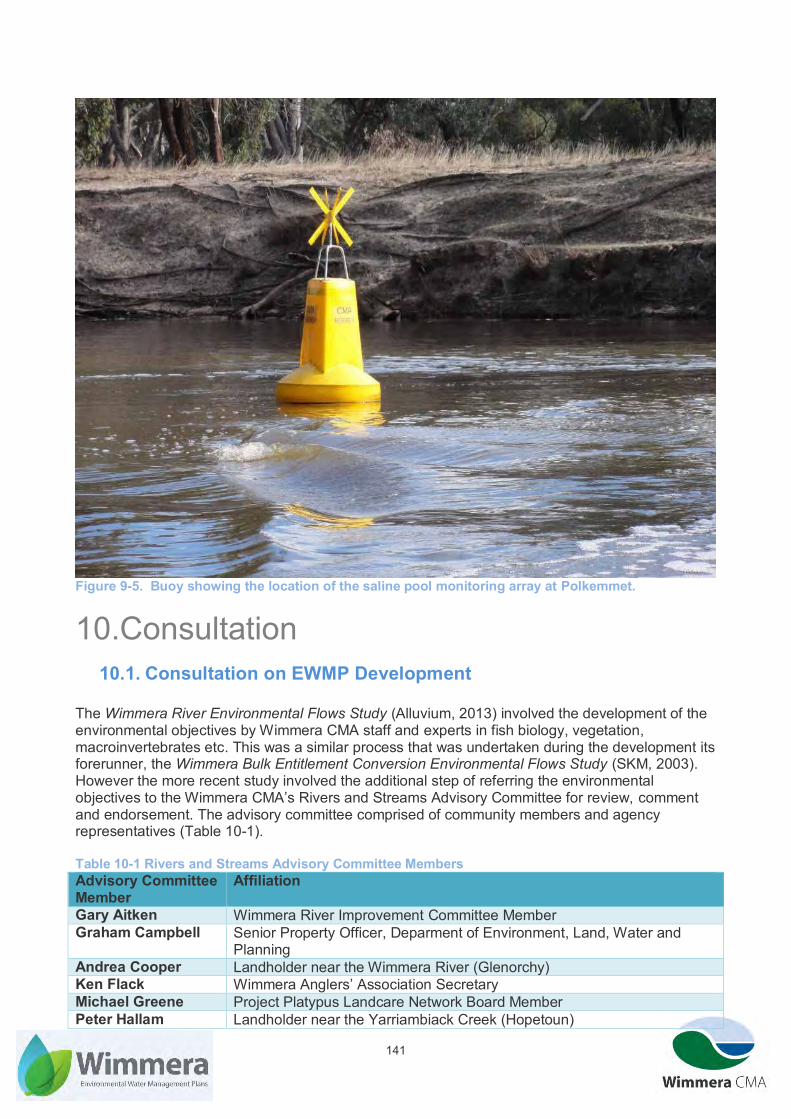
141
Figure 9-5. Buoy showing the location of the saline pool monitoring array at Polkemmet.
10.Consultation 10.1. Consultation on EWMP Development
The Wimmera River Environmental Flows Study (Alluvium, 2013) involved the development of the environmental objectives by Wimmera CMA staff and experts in fish biology, vegetation, macroinvertebrates etc. This was a similar process that was undertaken during the development its forerunner, the Wimmera Bulk Entitlement Conversion Environmental Flows Study (SKM, 2003). However the more recent study involved the additional step of referring the environmental objectives to the Wimmera CMA’s Rivers and Streams Advisory Committee for review, comment and endorsement. The advisory committee comprised of community members and agency representatives (Table 10-1). Table 10-1 Rivers and Streams Advisory Committee Members
Advisory Committee Member
Affiliation
Gary Aitken Wimmera River Improvement Committee Member Graham Campbell Senior Property Officer, Deparment of Environment, Land, Water and
Planning Andrea Cooper Landholder near the Wimmera River (Glenorchy) Ken Flack Wimmera Anglers’ Association Secretary Michael Greene Project Platypus Landcare Network Board Member Peter Hallam Landholder near the Yarriambiack Creek (Hopetoun)

142
Advisory Committee Member
Affiliation
James McFarlane Landholder near the Yarriambiack Creek (Brim) Jim McGuire Former Superintendent of Fisheries and Wildlife Division for the Wimmera
and Mallee – Department of Natural Resources and Environment Brad Mitchell Federation University - Head of School of Ecology and Environment Michael Stewart Barengi Gadjin Land Council - CEO The Environmental Water Needs of the Wimmera Terminal Lakes (Ecological Associates, 2004) also involved consulation with agencies (Wimmera CMA, Mallee CMA, Parks Victoria, GWMWater) and community representatives (Friends of Lake Albacutya and Friends of Lake Hindmarsh). The development of the WWS and MWS also involved wide consultation, involving a number of agencies and community groups. Furthermore the strategies were released as a public draft for comment. Through the development process there was widespread support for the goals, targets and management activities prescribed in the document including many that relate to environmental water management. Also information was gleaned on environmental values and threats associated with the Wimmera River System. Consultation for the EWMP involved a media campaign launched prior to and following the Wimmera Machinery Field Days in March 2015, it involved community members being asked to contribute information on a survey around what environmental responses have resulted from past environmental watering actions as well as how they wanted to be kept up to date around environmental watering (Figure 10-1 and Figure 10-2). There was also a map displayed at the Wimmera Machinery Field Days where people could attach information on the type and location of environmental values. Workshops have also been held with stakeholders (in particular local government in relation to weir operation) and community groups around environmental water management in 2015. Further details regarding consultation for the EWMP are available in Appendix 3.
Environmental Water Forum – Horsham Angling Club July 2015

143

144
Figure 10-1. Advertisement requesting community input into the EWMP.
Figure 10-2. Alana Davies, winner of the “What’s with the Wimmera’s Water?” competition with Wimmera CMA Chief Executive Dave Brennan.
10.2.Consultation on EWMP Implementation The development of the EWMP provides an opportunity to improve consultation with respect to the implementation of environmental watering.
Text Box 4 – Environmental Water Planning and Consultation Prior to the Eastablishment of the VEWH Prior to the establishment of the VEWH, the Minster for Environment was responsible for approving environmental watering actions. The Environmental Operating Strategy for the Management of the Wimmera-Glenelg Environmental Water Reserve (GHCMA & WCMA, 2004) outlined applicable principles and processes for annual environmental water planning. This involved consulting with a Technical Reference Group (TRG) consisting of officers from the Wimmera and Glenelg Hopkins CMAs as well as representatives from the then Department of Sustainability and Environment, GWMWater as well as Mallee and North Central CMAs (if required). This group provided technical information to the Inter-Catchment Advisory Group (ICAG), consisting of Board nominated representatives of the Wimmera and Glenelg Hopkins CMAs which was charged with making decisions around annual water planning in both catchments given the shared entitlement. ICAG was established by the then Minister for Natural Resources, Geoff Coleman in 1995 and Annual Watering Plans were sent to the Minister for Environment by ICAG for approval for subsequent implementation. This approach was applied successfully for a number of years until it was made obsolete by the establishment of the VEWH on 1 July 2011.

145
The VEWH replaced the Minister for Environment as the holder of the Environmental Entitlement in 2011. After initially providing shared Seasonal Watering Proposals, the Wimmera and Glenelg Hopkins CMA now provide separate Seasonal Watering Proposals to the VEWH. Following ongoing perceptions amongst community along the Glenelg River that there was a disproportionate sharing of flows between the Wimmera and Glenelg rivers, an action was included in the Western Region Sustainable Water Strategy (DSE, 2011) that involved the VEWH reviewing the management of the Environmental Entitlement to achieve the optimum environmental outcomes for both systems. This review considered a number of options including splitting of the Environmental Entitlement between the two systems however the flexibility offered by a shared entitlement was seen to be a significant benefit and the status quo remained. However the VEWH recommended developing water sharing rules which includes the establishment of principles and criteria for prioritisation which is implemented through the Western Rivers Advisory Group (WRAG) consisting of representatives of the VEWH and Wimmera and Glenelg Hopkins CMAs as well as other expertise as required such as technical experts, GWMWater and CEWH representatives. This is intended to ensure that the VEWH has sufficient information to inform the authorisation of environmental water use throughout the water year. A timeline for this process is outlined in Figure 10-3. In July 2015, Wimmera CMA held a series of forums with stakeholders and community groups who have a keen interest in environmental watering actions such as angling associations. The intent is to consult with these stakeholders and groups on an annual basis in order to flag intentions with respect to environmental water planning as well as to gain feedback on the effectiveness of previous watering actions.
Bungalally Creek at Graham’s Bridge Road, September 2012

146
Figure 10-3. Process for Seasonal Watering Proposal development for the Wimmera and Glenelg Hopkins CMAs (VEWH, 2014).
January - February
•WRAG agree on assumptions that will underpin the CMA seasonal watering proposals (eg. contribution of unregulated and passing flows to meeting priority watering actions etc).
March
•Forecast opening allocation from GWMWater and assessment of likely annual use and carryover.
April
•Final seasonal watering proposals received from each CMA, including CMA prioritisation of watering actions.
May
•WRAG workshop to collaboratively update the prioritisation of watering actions across both Wimmera and Glenelg systems, including technical expert input if required.
June
•VEWH will either reserve water for future priority demand or commit water for priority watering actions in each system as early as practical.
•Initial water commitments will be made to satisfy demands from July to September if possible, however will be dated through to the end of the water year to allow maximum devolution of management.
•If it is not possible to commit or reserve water, the VEWH will advise the CMAs and wait for the next allocation point (first Wednesday of each month).
July this year - June next year
•Assess conditions in each catchment, level of allocation and review prioritised watering actions.
•Commit more water if available and appropriate (ideally to meet full demands in both systems from October through to end of the year, if possible).
•Assess carryover priorities into the following year (from September onwards).
•Assessments to be carried out in September and December at a minimum, or more often if required due to changing priorities or low water availability. They would be carried out at a workshop or by teleconference, after the monthly water resource assessment expected on the first Wednesday of every month.
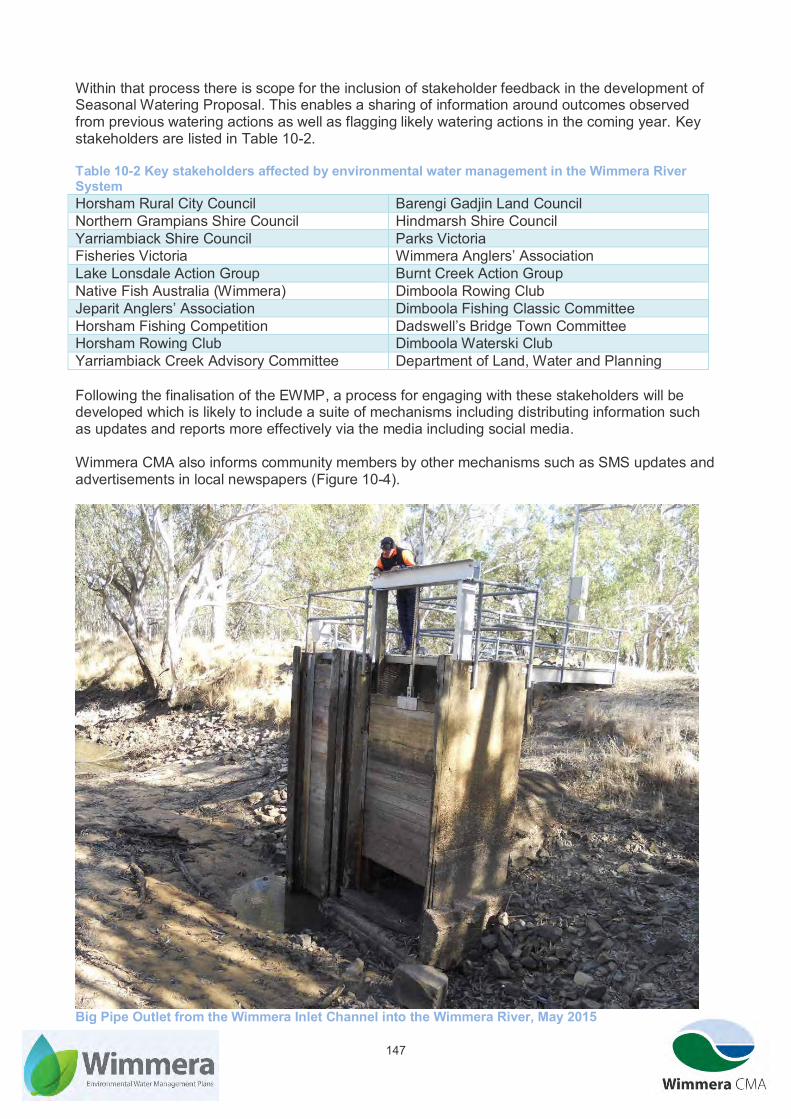
147
Within that process there is scope for the inclusion of stakeholder feedback in the development of Seasonal Watering Proposal. This enables a sharing of information around outcomes observed from previous watering actions as well as flagging likely watering actions in the coming year. Key stakeholders are listed in Table 10-2. Table 10-2 Key stakeholders affected by environmental water management in the Wimmera River System
Horsham Rural City Council Barengi Gadjin Land Council Northern Grampians Shire Council Hindmarsh Shire Council Yarriambiack Shire Council Parks Victoria Fisheries Victoria Wimmera Anglers’ Association Lake Lonsdale Action Group Burnt Creek Action Group Native Fish Australia (Wimmera) Dimboola Rowing Club Jeparit Anglers’ Association Dimboola Fishing Classic Committee Horsham Fishing Competition Dadswell’s Bridge Town Committee Horsham Rowing Club Dimboola Waterski Club Yarriambiack Creek Advisory Committee Department of Land, Water and Planning Following the finalisation of the EWMP, a process for engaging with these stakeholders will be developed which is likely to include a suite of mechanisms including distributing information such as updates and reports more effectively via the media including social media. Wimmera CMA also informs community members by other mechanisms such as SMS updates and advertisements in local newspapers (Figure 10-4).
Big Pipe Outlet from the Wimmera Inlet Channel into the Wimmera River, May 2015

148
Figure 10-4. Quarterly updates regarding environmental water releases are aimed at keeping the community informed around planned environmental watering actions and monitored outcomes.

149
11.Knowledge Gaps and Recommendations The EWMP has been developed using the best available information to hand. However despite the ongoing improvements in environmental water management through experience in implementation, there are still a number of knowledge gaps and recommendations that remain that can enhance environmental water management in the Wimmera River System. These knowledge gaps and recommendations to address them are listed in Table 11-1. Table 11-1 Knowledge gaps following the development of the EWMP and recommendations to address them
Knowledge Gap Recommendation Who Priority Effect of flows on saline pools
Undertake monitoring and modelling of pool behaviour in response to interventions
Wimmera CMA
High
Weir pool hydrology Undertake monitoring of contributions of stormwater and streamflows and losses from evaporation, extraction and seepage.
Wimmera CMA, local govt.
High
Flow rates and levels at some reaches/lakes
Install flow gauging equipment and update rating tables in particular for the terminal lakes (see Section 3.1)
Wimmera CMA, DELWP
Medium
Instream loss rates Continue to refine understanding of rates of loss at different times of year for the various regulated reaches using flow gauge data. Enhanced information regarding the flow split between the Wimmera River and Yarriambiack Creek would be very useful in determining loss rates as well.
Wimmera CMA
High
Limited hydraulic models
Improve hydraulic models for reaches of the Mt William and Burnt Creeks and upper MacKenzie River to enable refinement of flow recommendations.
Wimmera CMA
Medium
Limited hydrologic models
Improve the spatial extent and update modelled daily flow data to enable refinement of flow recommendations
Wimmera CMA, DELWP, GWMWater
Medium
Prioritisation of watering actions
Update and enhance the prioritisation tool developed in SKM (2010).
Wimmera CMA, VEWH
High
Dock Lake watering Dock Lake is the subject of a FLOWS study as this EWMP was being developed, therefore the EWMP should be updated to include it once it is finalised.
Wimmera CMA, DEWLP
Medium
Cultural values and watering
Investigate options to undertake watering actions to enhance cultural values
Wimmera CMA, BGLC
High
Social and economic values of waterways
Quantify benefits of waterways to demonstrate the full value of environmental water
Wimmera CMA
High
Community information on the effects of releases
Maintain regular contact with stakeholders, use Wimmera CMA communications tools (e.g. Facebook, website) to garner information.
Wimmera CMA
High
There is also a need to ensure that changes brought about through adaptive management and changes in policy, infrastructure etc. are reflected in this document. For example Dock Lake, a former headworks storage with strong waterbird values, was the subject of a FLOWS study in 2015. Given the same Environmental Entitlements can be supplied to it under the appropriate circumstances, ideally it should be included in this EWMP. Therefore it is proposed to review and update this document every five years, with the first review scheduled to take place in 2020.

150
12.References Alluvium. (2013). Wimmera River Environmental Flows Study. Melbourne: Alluvium. Alluvium. (2014). Management of Environmental Flows In and Through the Wimmera Weir Pools.
Melbourne: Alluvium. Alluvium. (2015). Mt William Streamflows Study. Melbourne: Alluvium Consulting. Anderson, J., & Morison, A. (1989). Environmental Flow studies for the Wimmera River, Victoria -
Part C Water quality and experimental releases, Technical Report Series No. 75. Melbourne: Arthur Rylah Institute for Environmental Research.
Austral. (2015). Adult Fish Monitoring of the Mt William Creek 2015. Kirkstall: Austral Research and Consulting.
Australian Ecosystems. (2015). Victorian Environmental Flows Monitoring and Assessment Program Vegetation Monitoring Wimmera 2014. Melbourne: Australian Ecosystems.
Australian Government. (1999). Environment Protection and Biodiversity Conservation Act. Canberra: Australian Government.
Australian Government. (2012). Basin Plan. Canberra: Australian Government. AWE. (2014). Wimmera River Saline Pools Stage 1. Adelaide: Australian Water Environments. Barlow, K. R. (1987). Wimmera/Mallee Headworks System Reference Manual. Murtoa: Rural
Water Commission of Victoria . Biosis. (2012). Fish Community Assessment of the Upper Mt William Creek Catchment.
Melbourne: Biosis Research . Biosis. (2013). Fish Community Assessment of the Burnt Creek and Lower MacKenzie River
catchment. Melbourne: Biosis. BL&A. (2007). Wimmera River Red Gum Monitoring Lower Wimmera River . Melbourne: Brett
Lane and Associates . BL&A. (2008). Wimmera River Red Gum Monitoring Yarriambiack Creek. Melbourne: Brett Lane
and Associates. Butcher, R. (2015). Review of Management Objectives and Development of Conceptual Models for
the Wimmera River System Environmental Water Management Plan. Melbourne: Water's Edge Consulting.
Catchment Health Engineering. (2015). Wimmera Catchment Management Authority - Impediments to Environmental Water Releases Site Review. Hamilton: Catchment Health Engineering.
cesar. (2012). Distribution and Relative Abundance of Platypuses in the MacKenzie River: survey results 2011/12. Melbourne : cesar.
cesar. (2013). Platypus Distribution and Abundance in the Upper Wimmera Region. Melbourne: cesar.
cesar. (2014). Platypus Distribution and Abundance in the MacKenzie River: impact of fire April 2014. Melbourne: cesar.
cesar. (2015). Platypus Distribution and Relative Abundance in the MacKenzie River 2015. Melbourne: cesar.
Cibilic, A., & White, L. (2010). Ecological Character Description for Lake Albacutya, a Wetland of International Importance. Ballina: WetlandCare Australia.
Commonwealth of Australia. (2012). Basin Plan. Canberra: Commonwealth of Australia. CSIRO. (2008). Water Availability in the Murray Darling Basin. Canberra: CSIRO. Department of Environment. (2015, June 3). Directory of Important Wetlands in Australia -
Information Sheet - Lake Hindmarhs VIC 012. Retrieved from Directory of Important Wetlands: http://www.environment.gov.au/cgi-bin/wetlands/report.pl
Department of Environment. (2015, September 23). Wimmera Mallee Pipeline. Retrieved from Department of Environment: https://www.environment.gov.au/node/24379
DEPI. (2013). FLOWS - a method for determining environmental water requirements in Victoria: Edition 2. Melbourne: Department of Environment and Primary Industries.
DEPI. (2013). Victorian Water Quality Trends 1991-2010. Melbourne: Department of Environment and Primary Industries.
DEPI. (2013). Victorian Waterway Management Strategy. Melbourne: Department of Environment and Primary Industries.

151
DPI. (2006). Wimmera Fishery Management Plan, Fisheries Victoria Management Report Series No. 68. Melbourne: Department of Primary Industries.
DSE. (2002). Victorian River Health Strategy. Melbourne: DSE. DSE. (2004). Explanatory Note to the Wimmera-Mallee Bulk Entitlement Orders. Melbourne:
Department of Sustainability and Environment. DSE. (2004). Securing Our Water Future Together: Victorian Government White Paper.
Melbourne: Department of Sustainability and Environment. DSE. (2005). Action Statement, Flora and Fauna Guarantee Act 1998 No. 201, Freshwater Catfish.
Melbourne: Department of Sustainability and Environment. DSE. (2010). Draft Western Region Sustainable Water Strategy. Melbourne: Department of
Sustainability and Environment. DSE. (2011). Western Region Sustainable Water Strategy. Melbourne: DSE. DSE. (2013). Advisory List of Threatened Vertebrate Fauna in Victoria. Melbourne: Department of
Department of Sustainability and Environment. Dyer, F. J., & Roberts, J. (2006). Monitoring Vegetation Response to Environmental Flows in the
Wimmera: A Strategic Approach. Canberra: In2fluve. Earth Tech. (2004). MacKenzie River Waterway Action Plan. Melbourne: Earth Tech. Earth Tech. (2005). Assessing the Physical Constraints to Environmental Flow Delivery in the
Wimmera Catchment. Melbourne: Earth Tech Engineering. Earth Tech. (2005). Burnt Creek Waterway Action Plan . Melbourne: Earth Tech. Earth Tech. (2005). Wimmera Heritage River Waterway Action Plan. Melbourne: Earth Tech
Engineering. Earth Tech. (2006). Assessing Influences on Environmental Water Releases in the Wimmera Final
Report: Phase 1, Stages 1 & 2. Melbourne: Earth Tech. Earth Tech. (2007). Assessing Influences on Environmental Water Releases in the Wimmera Final
Report : Phase 2, Stage 1 & 2. Canberra: Earth Tech Engineering. Earth Tech. (2007). Regulated Streams of the Wimmera Waterway Action Plan. Melbourne: Earth
Tech. Ecological Associates. (2004). The Environmental Water Needs of the Wimmera Terminal Lakes
BF001-A. Adelaide: Ecological Associates . Ecological Associates. (2006). Environmental Water Requirements of Lake Corrong and Lake
Lascelles. Adelaide: Ecological Associates. Ecological Associates. (2009). Conservation Significance of the Wimmera Storages BP007-1-C.
Adelaide: Ecological Associates . Ecology Australia. (2014). 2014 Fish Monitoring of Burnt Creek and the lower MacKenzie River.
Melbourne: Ecology Australia. Ecology Australia. (2014). Lower Wimmera River VEFMAP fish monitoring summary report 2014 .
Melbourne: Ecology Australia. Ecology Australia. (2015). Victorian Environmental Flows Monitoring and Assessment Program
Vegetation Monitoring 2014. Melbourne: Ecology Australia. Ecowise Environmental. (2008). Wimmera Waterway Monitoring Assessment Project 2007-2008.
Melbourne: Ecowise Environmental . EPA. (2008). An Ecological Risk Assessment of the Lower Wimmera River - Publication 1257.
Melbourne: EPA. EPA. (2008). The Health of Streams in the Wimmera Basin Publication 1233. Melbourne : EPA
Victoria . GHCMA & WCMA. (2004). Environmental Operating Strategy for the management of the
Wimmera-Glenelg Environmental Water Reserve. Hamilton & Horsham: Glenelg Hopkins CMA & Wimmera CMA.
GHD. (2012, October). River and Estuary Conceptual Models to Support Development of Regional Waterway Strategies. Melbourne: GHD.
GWMWater. (2011). Discussion Paper: Review of the Environmental Water Requirements for the Wimmera River Terminal Wetlands. Horsham : GWMWater.
GWMWater. (2012). Lake Lonsdale Management Plan. Horsham: GWMWater. GWMWater. (2014). Update - Rocklands Reservoir to Taylors Lake Transfer 7 November 2014.
Hosham: GWMWater. Hammer, M. P., Unmack, P. J., Adams, M., Raadik, T. A., & Johnson, J. B. (2014). A multigene
molecular assessment of cryptic biodiversity in the iconic freshwater blackfishes (Teleostei:

152
Percichthyidae: Gadopsis) of south-eastern Australia. Biological Journal of the Linnean Society, TBD.
ISRAG. (2008). SRA Report 1: A Report on the Ecological Health of Rivers in the Murray-Darling Basin, 2004-2007 . Canberra: Independent Sustainable Rivers Audit Group.
ISRAG. (2011). Sustainable Rivers Audit 2: the ecological health of rivers in the Murray-Darling Basin at the end of the Millenium Drought. Canberra: Independent Sustainable Rivers Audit Group.
Jacobs. (2014). Optimising Environmental Entitlement Use for the Wimmera River and Terminal Lakes. Melbourne: Jacobs.
Jacobs. (2014). VEFMAP Geomorphology Surveys Wimmera River System 2014. Bendigo: Jacobs .
KBR. (2004). Yarriambiack Creek Management Plan. Melbourne: Kellogg, Brown and Root. Lind, P. R., Robson, B. J., & Mitchell, B. D. (2007). Multiple Lines of Evidence for the Beneficial
Effects of Environmental Flows in Two Lowland Rivers in Victoria, Australia. River Research and Applications, 933-946.
Lintermans, M. (2007). Fishes of the Murray-Darling Basin, An Introductory Guide. Canberra: Murray-Darling Basin Commission.
Mallee CMA. (2014). Mallee Waterway Strategy 2014-2022. Mildura: Mallee Catchment Management Authority.
Marriott, N. R. (2006). Monitoring the reponse of vegetation to an environmental water release in the lower MacKenzie River. Stawell: Neil R Marriott.
Maynard, S., James, D., & Davidson, A. (2012). An Adaptive Particiatory Approach for Developing an Ecosystem Services Framework for South East Queensland, Australia. International Journal of Biodiversity Science, Ecosystem Services and Management, NA.
Miller, K. A., Webb, J. A., de Little, S. C., Stewardson, M. J., & Rutherfurd, I. D. (2014). How effective are environmental flows? Analyses of flow-ecology relationships in the Victorian Environmental Flow Monitoring and Assessment Program (VEFMAP) in 2011-2014. Melbourne: University of Melbourne.
NRE. (2002). FLOWS - A Method for Determinining Environmental Water Requirements in Victoria. Melbourne: Department of Natural Resources and Environment.
Pouliot, M. (2012). Yanga Track...Wanjab, Gadjiun and Murnong. Horsham: Wimmera Catchment Management Authority.
Price, A., & Gawne, B. (2009). The Development of Wetland Ecosystem Conceptual Ecological Models for the Semi-Arid Zone . Albury: Murray Darling Freshwater Research Centre.
RMCG. (2014). Draft Victorian Environmental Watering Partnership Risk Management Framework. Bendigo: RMCG.
Roberts, S., Grace, M., Sherwood, J., Lind, P., & Nash, D. (2006). Biomass and nutrient content of Phragmites australis in the Lower Wimmera River. Melbourne: Monash University, Deakin University and DPI.
RPS. (2015). Wimmera Environmental Water Delivery Infrastructure Technical Investigations: Scoping and Feeasibility Investigations. Echuca: RPS.
Sharpe, A., & Quinn, G. (2004). Monitoring Environmental Flows in the Wimmera and Glenelg Rivers . Melbourne: Sinclair Knight Merz and Cooperative Research Centre for Freshwater Ecology.
SKM. (2002). On the assessment of the natural effluent level of Yarriambiack Creek. Melbourne: Sinclair Knight Merz.
SKM. (2002). Stressed Rivers Project - Environmental Flow Study Wimmera River System. Melbourne : Sinclair Knight Merz.
SKM. (2003). Wimmera Bulk Entitlement Conversion Environmental Flows Study. Melbourne: Sinclair Knight Merz.
SKM. (2003). Wimmera Mallee Bulk Entitlement Conversion Project - Environmental Flows Study. Melbourne: Sinclair Knight Merz.
SKM. (2005). Environmental Flow Recommendations for Mt William Creek. Melbourne: Sinclair Knight Merz.
SKM. (2005). Flow Stress Ranking Project - Summary of Hydrologic Stress Index Results. Melbourne: Sinclair Knight Merz.
SKM. (2006). Fish Migration Within the Wimmera: the role of barriers in determining fish population health. Melbourne: Sinclair Knight Merz.

153
SKM. (2006). Wimmera Catchment Monitoring Sites. Melbourne: Sinclair Knight Merz. SKM. (2006). Wimmera Fish Monitoring Program - Monitoring Program Design. Melbourne:
Sinclair Knight Merz. SKM. (2007). Exotic Fish Management Options for the Wimmera River Catchment . Melbourne:
Sinclair Knight Merz. SKM. (2008). Influences on Environmental Water Releases in the Wimmera River . Melbourne :
Sinclair Knight Merz. SKM. (2009). West Wimmera Hydrogeological Study. Melbourne: Sinclair Knight Merz. SKM. (2010). Prioritisation of Environmental Water Releases in the Wimmera, Glenelg and Avon-
Richardson River Systems . Melbourne: Sinclair Knight Merz. SKM. (2010). Wimmera Fish Monitoring Project 2010. Melbourne: Sinclair Knight Merz. SKM. (2011). Upper Wimmera Catchment Environmental Water Needs. Melbourne: Sinclair Knight
Merz. SKM. (2011). Upper Wimmera River Environmental Water Needs. Melbourne : Sinclair Knight
Merz. SKM. (2013). Bulk and Environmental Entitlements Operations Review Project - Modelling
Assessment. Melbourne: Sinclair Knight Merz. SMEC. (2011). Condition Assessment of the River Red-gums of the lower MacKenzie River, lower
Burnt Creek and Bungalally Creek. Melbourne: SMEC. SMEC. (2011). VEFMAP - Physical Habitat and Vegetation Assessment. Melbourne: SMEC. State of Victoria. (2012). Bulk Entitlement (Willaura, Elmhurst and Buangor Systems - GWMWater)
Conversion Order 2012. Melbourne: Victorian Government Gazette, 3 May 2012, G 18. Timbal, B., Abbs, D., Bhend, J., Chiew, F., Church, J., Ekstrom, M., . . . Whetton, P. (2015). Murray
Basin Cluster Report, Climate Change in Australia Projections for Australia's Natural Resource Management Regions. Canberra: CSIRO and Bureau of Meteorology.
VAGO. (2010). Restricting Environmental Flows During Water Shortages. Melbourne: Victorian Auditor-General.
Van Veldhuisen, R. (2001). Pipe Dreams. Horsham: Wimmera Mallee Water. VEWH. (2014). Victorian Environmental Watering Partnership Risk Management Framework.
Melbourne: Victorian Environmental Water Holder. VEWH. (2014). Wimmera and Glenelg Environmental Metering Program. Melbourne: Victorian
Environmental Water Holder. VEWH. (2014). Wimmera and Glenelg Rivers Environmental Entitlement: Environmental water
sharing rules . Melbourne: Victorian Environmental Water Holder. Victorian Government. (1992). Heritage Rivers Act. Melbourne: Victorian Government. Water Technology . (2009). Wimmera River - Yarriambiack Creek Flow Modelling Study Report.
Melbourne: Water Technology. WEC. (2008). Wimmera River Catchment Macroinvertebrate Monitoring Program 2005-2008.
Melbourne: Water's Edge Consulting. WEC. (2009). Wimmera Macroinvertebrate Monitoring Program: 2008-2009. Melbourne: Water's
Edge Consulting. WEC. (2012). Wimmera Macroinvertebrate Monitoring 2011-12. Melbourne: Water's Edge
Consulting. Westbury, A.-M., Tiller, D., & Metzeling, L. (2007). Environmental Flows and the Ecological Health
of the Lower Wimmera River. 5th Australian Stream Management Conference (pp. 449-454). Albury: Charles Sturt University.
Wimmera CMA. (2002). Wimmera Water Quality Strategy. Horsham: Wimmera Catchment Management Authority.
Wimmera CMA. (2005). Wimmera Regional Salinity Action Plan 2005-2010. Horsham: Wimmera Catchment Management Authority.
Wimmera CMA. (2006). Wimmera Waterway Health Strategy 2006-2011. Horsham : Wimmera CMA.
Wimmera CMA. (2007). Monitoring Environmental Water Releases in the Wimmera and MacKenzie Rivers. Horsham: Wimmera CMA.
Wimmera CMA. (2010). Wimmera Invasive Plant and Animal Management Strategy. Horsham: Wimmera CMA.
Wimmera CMA. (2012). EWR Bird Monitoring. Horsham: Wimmera CMA.
154
Wimmera CMA. (2013). Wimmera Regional Catchment Strategy 2013-2019. Horsham: Wimmera CMA.
Wimmera CMA. (2014). Wimmera Waterway Strategy 2014-2022. Horsham: Wimmera Catchment Management Authority.
Wimmera Mallee Pipeline Project Planning Group. (2003). Wimmera Mallee Pipeline Project. Horsham: Wimmera Mallee Pipeline Project Planning Group.
Wimmera Mallee Water . (1998). Interaction of WMWSS with natural streams in the Wimmera Catchment Region. Horsham: Wimmera Mallee Water.
13.Abbreviations, Acronyms and Glossary AHD Australian Height Datum BGLC Barnegi Gadjin Land Council CEWO Commonwealth Environmental Water Office CMA Catchment Management Authority COAG Council of Australian Governments DELWP Department of Environment, Water and Planning EHNV Epizootic Haemotopoietic Necrosis Virus EPBC Environment Protection and Biodiversity Conservation Act EOS Environmental Operating Strategy EWMP Envionmental Water Management Plan EWR Environmental Water Reserve FFG Flora and Fauna Guarantee Act ICAG Inter Catchment Advisory Group ISC Index of Stream Condition IWC Index of Wetland Condition LiDAR Light Detection and Ranging GWMWater Grampians Wimmera Mallee Water Corporation MBI Macroinvertebrate Biotic Index MDBA Murray Darling Basin Authority MWS Mallee Waterway Strategy NES National Matters of Environmental Significance NTU Nephelometric Turbidity Units NWI National Water Initiative PAL Portable Automated Logger RBA Rapid Biological Assessment RCS Regional Catchment Strategy SCADA Supervisory Control and Data Acquisition SEPP State Environment Protection Policy SRA Sustainable Rivers Audit SWS Sustainable Water Strategy TRG Technical Reference Group VEFMAP Victorian Environmental Flows Monitoring and Assessment Program VEWH Victorian Environmental Water Holder VWMS Victorian Waterway Management Strategy VRHS Victorian River Health Strategy WetMAP Wetland Monitoring and Assessment Program WRAG Western Rivers Advisory Group WWS Wimmera Waterway Strategy

155
Aeolian Relating to the action of the wind Anastomosing Channels that separate and reconnect Bankfull Very high flow that fills but is contained within the river channel Cease to flow Period with no flow Channelised Removal of hydraulic diversity (runs,riffles, ponds) due to
excavation/erosion Chain-of-ponds Type of streamform with deep pools are separated by raised
areas Deflation basin Shallow depression created by wind blowing sediment Endemic Native to the local area Episodic Takes place after significant episodes (i.e. floods) Exotic Not native to Australia Ferruginised Sandstone containing high levels of iron which is more resistant
to erosion Fresh Higher flow than baseflow that would naturally take place
following a modest rainfall event. Important for improving water quality, inundating habitat and providing biological cues
Fresh water Salinity level below approximately 1,000 µS/cm High value waterway Waterway (river/creek/lake/wetland) with a value
(environmental/social/cultural/economic) that is deemed to be above a certain threshold defined within a regional waterway strategy
Hydraulic Related to the movement of water over a surface Hydrologic Related to the distribution of water in space and time Hypersaline water Salinity levels over approximately 40,000 µS/cm Intermittent Takes place temporarily typically less frequently than annually Lunette Crescent shaped high point created by wind movement of
sediment Overbank Very large flow that exceeds the capacity of the river channel
(flood) Passing flow Flows that must be passed at regulating infrastructure (Lake
Lonsdale, Huddleston’s Weir, Stawell Diversion Weir) under conditions specified within the Environmental Entitlement
Priority waterway Subset of high value waterways that have a range of feasible management activities that can be undertaken to maintain or improve their values.
Refuge Location (e.g. deep pool) that possesses many attributes that means that aquatic communities (fish, platypus) can resist stresses of drought, bushfire etc.
Regulated Water controlled by headworks infrastructure (weirs, channels, dams). Regulated environmental water is that allocated within the entitlement framework and can be called on to be released from headworks infrastructure subject to approval by the storage manager.
Reach Sub-section of a river or creek based on distance or common attribute (geomorphology/hydrology). Generally at least several kilometres in length.
Seasonal Takes place during particular seasons Translocated Species moved from one location to establish another one
elsewhere.

156
Appendix 1 – Environmental Water Sources – Wimmera River System
*Given the small volumes and inability to manage these flows – this environmental water source is not considered within this EWMP
Water source Flexibility of management Reach Conditions of availability Entitlement
Holder Delivery point Waterway Volume or rate of water delivery
All regulated waterways
40,560 ML maximum entitlement plus
available carryover shared between the Wimmera and Glenelg systems
Constrained by
storage level and outlet capacity
N/A
As per Table 1 Schedule 2 and dependent on
storage manager approval
VEWH
Various
Regulated
waterways of the Wimmera
Basin
28,000 ML maximum entitlement plus
available carryover
Constrained by
storage level and outlet capacity
Wimmera
Basin reaches
As per Table 1 Schedule 2 and dependent on
storage manager approval
CEWH
Various
Fyans Creek*
Passing flow rules for Fyans Creek:
1 ML/d
Fixed.
No ability to manage
Upstream Bellfield
Less if natural inflows are less and as per Table 2 of
Schedule 1 VEWH
Stawell
Diversion Weir
Wimmera River
Passing flow rules for the Wimmera River
are summarised below:
December to May All flow up to 10 ML/d then 25% of flow +
10ML/d up to 2010 ML/d
June to November All flow up to 60 ML/d then 25% of flow +
60ML/d up to 2010 ML/d
Fixed. No ability to manage
Below Huddleston’s
Weir
Less if natural inflows are less and as per Table 2 of
Schedule 1
VEWH
Huddleston’s Weir
Mt William Creek
Passing flow rules for Mt William Creek:
June to November – All flow up to 60 ML/d December to May 0ML
Can be varied if
storage manager and VEWH agree
Below Lake Lonsdale
Less if natural inflows are less and as per Table 2 of
Schedule 1
VEWH
Lake Lonsdale Outlet

157
Appendix 2 – Roles and Responsibilities with respect to Environmental Watering in the Wimmera River System
Partners Roles and responsibilities/links with waterways
Department of Environment, Land, Water and Planning (DELWP)
DELWP is the lead agency for waterway management. It is responsible for the development of waterway policy, co-ordination of regional delivery and prioritisation of Government investment in waterways. DELWP is also responsible for other aspects of natural resource management that are of relevance to environmental water management, including:
sustainable management of Victoria’s water resources through managing the water allocation and entitlements framework
developing state policy for water resource and waterway management DELWP also has a number of other responsibilities that relate to broader waterway management such as oversight of Crown Land, fisheries and integrated catchment management.
Victorian Environmental Water Holder (VEWH)
The Victorian Environmental Water Holder is appointed under the Water Act (1989) to manage Victoria’s environmental water entitlements. The Victorian Environmental Water Holder works with the waterway managers, Commonwealth Environmental Water Holder, Murray–Darling Basin Authority. Storage operators and land managers to ensure environmental water entitlements are used to achieve the best environmental outcomes in line with the Environmental Water Management Plan
Murray–Darling Basin Authority (MDBA)
The Murray–Darling Basin Authority was established under the federal Water Act (2007) as an independent, expertise based statutory agency. The primary roles of the Authority as outlined in the Water Act (2007) include:
preparing and reviewing the Basin Plan measuring, monitoring and recording the quality and quantity of the Basin's Water
resources supporting, encouraging and conducting research and investigations about the
Basin's Water Resources developing equitable and sustainable use of Basin water resources disseminating information about the Basin's water resources engaging and educating the Australian community about the Basin’s water
resources. Commonwealth Environmental Water Office (CEWO)
The Commonwealth Environmental Water Office manages an entitlement in the Wimmera CMA region to assist in its role to protect or restore the environmental assets of the Murray-Darling Basin. Water will be managed in accordance with the environmental watering plan that will be part of the Murray-Darling Basin Plan.
GWMWater Water corporations in Victoria are established under the Water Act (1989) and provide a range of water services to customers within their service areas. GWMWater provide a combination of irrigation services, domestic and stock services, bulk water supply services and urban water and wastewater services in most of the Wimmera CMA Region. Their link with environmental water management is in their role as resource and storage manager – responsible for determining and delivering allocations to holders of environmental water entitlements. They also conduct water transfers using waterways as conduits, presenting risks and opportunities around achieving ecological objectives for these waterways using transfers. Regionally they are also responsible for Blue Green Algae regional coordination and water licencing. They also manage land on which their infrastructure is located (e.g. weirs and storages).
Hindmarsh Shire, Horsham Rural City, and Yarriambiack Shire
A unique aspect of environmental water management in the Wimmera is the role of local government in managing town weirs which can affect the passage of flows down the Wimmera River and Yarriambiack Creek.
Barengi Gadjin Land Council Aboriginal Council (BGLC)
BGLC can provide advice on how environmental water management may improve or maintain cultural values.
Community members/ representatives
Community members who have a detailed understanding of these waterways can provide advice and feedback on the effect of environmental water management on local waterways. Often they are responsible for managing riparian land either as freehold landowner or licensee of Crown land.

158
Parks Victoria Parks Victoria is the responsible land manager for much of the lower sections of the Wimmera River system (including terminal lakes).
Appendix 3 - Wimmera River System EWMP Consultation Table 1: Wimmera System Weir Pools Project Consultation Goal Setting 13 May 2014 Name Organisation Expertise/Role Penny Clark Alluvium Project Manager Doug Gowans Hindmarsh Shire Council Director Infrastructure Services Wayne Schultz Hindmarsh Shire Council Contract Manager James Magee Yarriambiack Shire Council Director Infrastructure and Planning Rob Moir Horsham Rural City Council Sustainability, Environment and Emergency Manager Keith Emmerson
Horsham Rural City Council Infrastructure Support Superintendent
Prof Paul Boon Dodo Environmental Riparian and aquatic vegetation, water quality Dr Nick Bond Griffith University Fish ecology Michael Bain Alluvium Water management infrastructure Rob Catchlove Alluvium Social and Recreational values Dr Elisa Zavadil
Alluvium Geomorphology/ Project Manager
Clare Wilson Wimmera CMA Wimmera CMA Project Manager Greg Fletcher Wimmera CMA Wimmera EWMP Developer
Appendix 4 – Fauna and Flora Species List Table 1: Wimmera River System rivers and creeks fish species
Species name Common name Wimmera
McKenzie
1/2 & Burnt
Upper
McKenzie 3
& Burnt
Lower
Bungalally &
Yarriambiack
Mt
William
Creek
Ind
igen
ou
s
Gadopsis marmoratus River Blackfish
Galaxias olidus Obscure Galaxias
Nannoperca australis Southern Pygmy
Perch
Philypnodon grandiceps Flatheaded
Gudgeon
Retropinna semoni Australian Smelt
No
n-i
nd
ige
no
us
Bidyanus bidyanus Silver Perch
Galaxias maculatus Common Galaxias
Hypseleotris klunzingeri Carp Gudgeon
(Complex)
Maccullochella peelii peelii Murray Cod
Macquaria ambigua Golden Perch
Tandanus tandanus Freshwater
Catfish
Exo
tic
Carassius auratus Goldfish
Cyprinus carpio Carp
Gambusia holbrooki Gambusia
Perca fluviatilis Redfin
Salmo trutta Brown Trout

159
Tinca tinca Tench
Species highlighted in blue are threatened species. Table 2: Wimmera River System rivers and creeks waterway dependent reptile, mammal, invertebrate and amphibian species
Species name Common name Wimmera
McKenzie
1/2 & Burnt
Upper
McKenzie
3 & Burnt
Lower
Bungalally &
Yarriambiack
Mt
William
Creek
Rep
tile
s
Chelodina longicollis Eastern long-
necked turtle
Pogona barbata Bearded Dragon
Varanus varius Lace Goanna
Morethia boulengeri Boulenger’s Skink
Suta suta Curl Snake
Ctenotus robustus Large Striped
Skink
Christinus marmoratus Marbled Gecko
Delma inornata Olive Legless
Lizard
Delma impar Striped Legless
Lizard
Mam
mal
s
Hydromys chrysogaster Rakali
Ornithorhynchus anatinus Platypus
Willabia bicolor Black Wallaby
Oryctolagus cuniculus Rabbit
Mus musculus* House Mouse
Trichosurus vulpecula Brushtail Possum
Nyctophilius geoffroyi Lesser Long-
eared Bat
Tadarida australis White-striped
Freetail Bat
Canis vulpes* Red Fox
Tachyglossus aculeatus Short-beaked
Echidna
Petaurus breviceps Sugar Glider
Macropus giganteus Eastern Grey
Kangaroo
Macropus rufogriseus Red-necked
Wallaby

160
Species name Common name Wimmera
McKenzie
1/2 & Burnt
Upper
McKenzie
3 & Burnt
Lower
Bungalally &
Yarriambiack
Mt
William
Creek
Inve
rteb
rate
s
Cherax destructor Yabby
Gramastacus insolitus Western Swamp
Crayfish
Euastacus bispinosus Glenelg Spiny
Crayfish
Engaeus lyelli
Upland
Burrowing
Crayfish
Geocharax falcata Western Crayfish
Am
ph
ibia
ns
Crinia parinsignifera Plains Froglet
Limnodynastes dumerii
dumerii Pobblebonk Frog
Pseudophryne bibronii Brown Toadlet
Crinia signifera Common Froglet
Neobatrachus sudelli Common
Spadefoot Toad
Litoria raniformis Growling Grass
Frog
Litoria ewingii Southern Brown
Tree Frog
Geocrinia laevis Southern Smooth
Froglet
Limnodynastes
tasmaniensis
Spotted Marsh
Frog
Species highlighted in blue are threatened species. Table 3: Wimmera River System rivers and creeks bird species
Species name Common name Wimmera
McKenzie
1/2 & Burnt
Upper
McKenzie
3 & Burnt
Lower
Bungalally &
Yarriambiack
Mt
William
Creek
Botaurus poiciloptilus Australasian Bittern
Tachybaptus
Novaeholandiae^ Australasian Grebe
Anthus novaeseelandiae Australasian Pipit
Anas rhynchotis^ Australasian Shoveler
Gymnorhina tibicen Australian Magpie
Pelenaus conspicillatus^ Australian Pelican
Corvus coronoides Australian Raven
Tadorna tadornoides^ Australian Shelduck
Threskirnis molucca ^ Australian White Ibis
Chenonetta jubata^ Australian Wood Duck
Ninox connivens connivens Barking Owl
Coracina novaehollandiae Black-faced Cuckoo-
shrike

161
Species name Common name Wimmera
McKenzie
1/2 & Burnt
Upper
McKenzie
3 & Burnt
Lower
Bungalally &
Yarriambiack
Mt
William
Creek
Elseyornis melanops^ Black-fronted Dotterel
Milvus migrans Black Kite
Cygnus atratus^ Black Swan
Oxyura australis Blue-billed Duck
Neophema chrystoma Blue-winged Parrot
Grus rubicunda Brolga
Falco berigora Brown Falcon
Climacteris picumnus
victoriae Brown Treecreeper
Gallirallus phillippensis^ Buff-banded Rail
Burhinus grallarius Bush Stone-curlew
Acrocephalus stentoreus^ Clamorous Reed
Warbler
Turdus merula* Common Blackbird
Phaps chalcoptera Common Bronzewing
Sturnus vulgaris* Common Starling
Ocyphaps lophotes Crested Pigeon
Falcunulus frontatus Crested Shrike-tit
Geopelia cuneata Diamond Dove
Stagonopleura guttata Diamond Firetail
Gallinula tenebrosa^ Dusky Moorhen
Artamus cyanopterus Dusky Woodswallow
Ardea modesta^ Eastern Great Egret
Platycercus eximius Eastern Rosella
Eopsaltria australis Eastern Yellow Robin
Fulica atra^ Eurasian Coot
Petrochelidon ariel Fairy Martin
Stictonetta naevosa^ Freckled Duck
Eolophus roseicapilla Galah
Pomatostomus temporalis
temporalis Grey-crowned Babbler
Cracticus torquatus Grey Butcherbird
Rhipidura albicarpa Grey Fantail
Colluricincla harmonica Grey-shrike Thrush
Anas gracilis Grey Teal
Aythya australis^ Hardhead
Poliocephalus poliocephalus^ Hoary-headed Grebe
Passer domesticus* House Sparrow
Microeca fascinans Jacky Winter
Dacelo novaeguineae Laughing Kookaburra
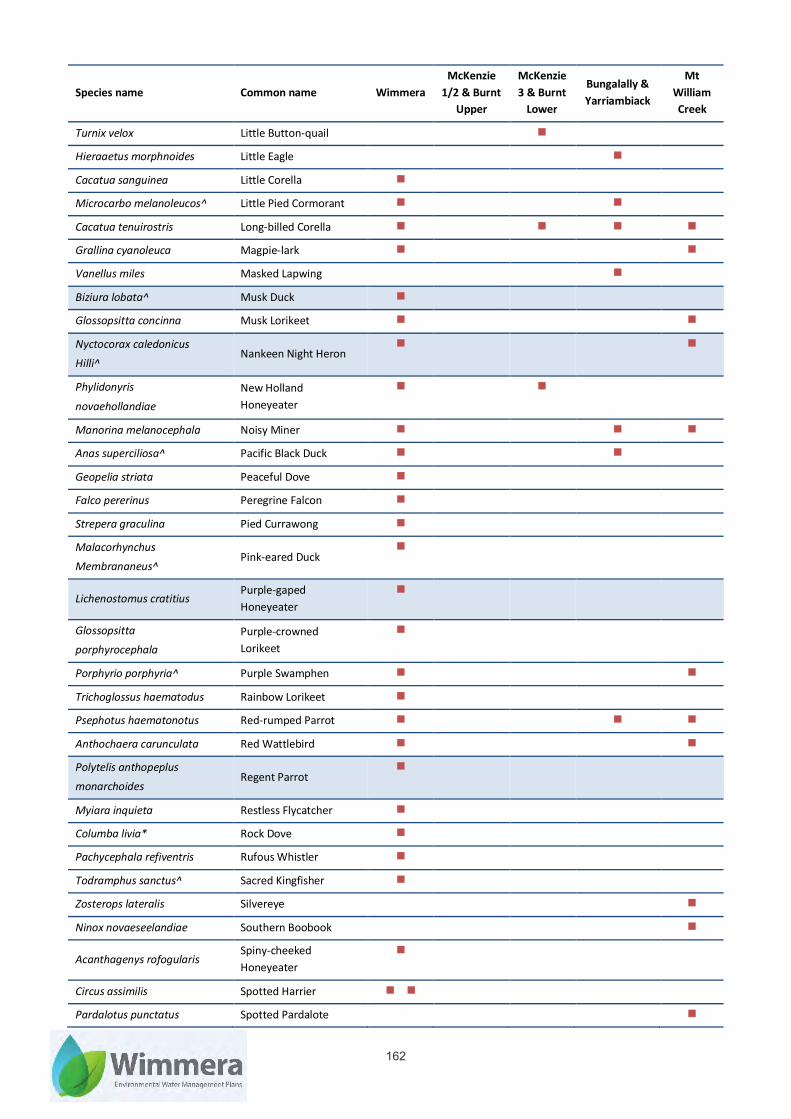
162
Species name Common name Wimmera
McKenzie
1/2 & Burnt
Upper
McKenzie
3 & Burnt
Lower
Bungalally &
Yarriambiack
Mt
William
Creek
Turnix velox Little Button-quail
Hieraaetus morphnoides Little Eagle
Cacatua sanguinea Little Corella
Microcarbo melanoleucos^ Little Pied Cormorant
Cacatua tenuirostris Long-billed Corella
Grallina cyanoleuca Magpie-lark
Vanellus miles Masked Lapwing
Biziura lobata^ Musk Duck
Glossopsitta concinna Musk Lorikeet
Nyctocorax caledonicus
Hilli^ Nankeen Night Heron
Phylidonyris
novaehollandiae
New Holland
Honeyeater
Manorina melanocephala Noisy Miner
Anas superciliosa^ Pacific Black Duck
Geopelia striata Peaceful Dove
Falco pererinus Peregrine Falcon
Strepera graculina Pied Currawong
Malacorhynchus
Membrananeus^ Pink-eared Duck
Lichenostomus cratitius Purple-gaped
Honeyeater
Glossopsitta
porphyrocephala
Purple-crowned
Lorikeet
Porphyrio porphyria^ Purple Swamphen
Trichoglossus haematodus Rainbow Lorikeet
Psephotus haematonotus Red-rumped Parrot
Anthochaera carunculata Red Wattlebird
Polytelis anthopeplus
monarchoides Regent Parrot
Myiara inquieta Restless Flycatcher
Columba livia* Rock Dove
Pachycephala refiventris Rufous Whistler
Todramphus sanctus^ Sacred Kingfisher
Zosterops lateralis Silvereye
Ninox novaeseelandiae Southern Boobook
Acanthagenys rofogularis Spiny-cheeked
Honeyeater
Circus assimilis Spotted Harrier
Pardalotus punctatus Spotted Pardalote
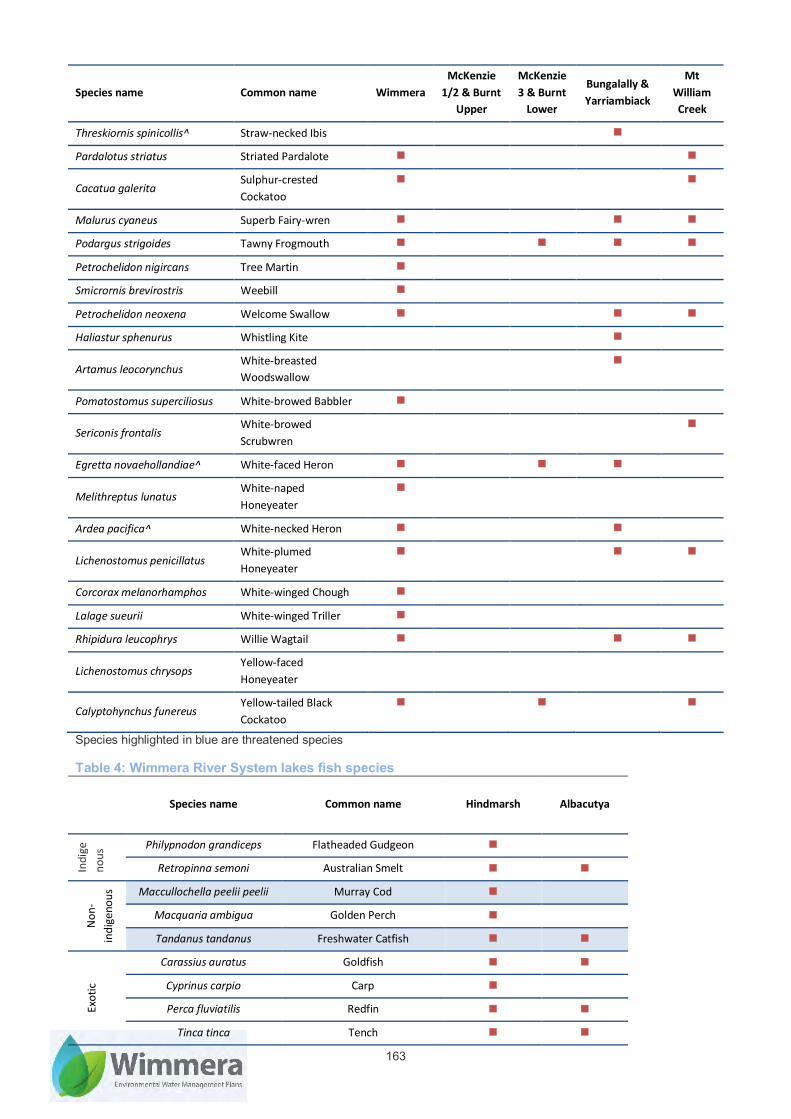
163
Species name Common name Wimmera
McKenzie
1/2 & Burnt
Upper
McKenzie
3 & Burnt
Lower
Bungalally &
Yarriambiack
Mt
William
Creek
Threskiornis spinicollis^ Straw-necked Ibis
Pardalotus striatus Striated Pardalote
Cacatua galerita Sulphur-crested
Cockatoo
Malurus cyaneus Superb Fairy-wren
Podargus strigoides Tawny Frogmouth
Petrochelidon nigircans Tree Martin
Smicrornis brevirostris Weebill
Petrochelidon neoxena Welcome Swallow
Haliastur sphenurus Whistling Kite
Artamus leocorynchus White-breasted
Woodswallow
Pomatostomus superciliosus White-browed Babbler
Sericonis frontalis White-browed
Scrubwren
Egretta novaehollandiae^ White-faced Heron
Melithreptus lunatus White-naped
Honeyeater
Ardea pacifica^ White-necked Heron
Lichenostomus penicillatus White-plumed
Honeyeater
Corcorax melanorhamphos White-winged Chough
Lalage sueurii White-winged Triller
Rhipidura leucophrys Willie Wagtail
Lichenostomus chrysops Yellow-faced
Honeyeater
Calyptohynchus funereus Yellow-tailed Black
Cockatoo
Species highlighted in blue are threatened species Table 4: Wimmera River System lakes fish species
Species name Common name Hindmarsh Albacutya
Ind
ige
no
us
Philypnodon grandiceps Flatheaded Gudgeon
Retropinna semoni Australian Smelt
No
n-
ind
ige
nou
s Maccullochella peelii peelii Murray Cod
Macquaria ambigua Golden Perch
Tandanus tandanus Freshwater Catfish
Exo
tic
Carassius auratus Goldfish
Cyprinus carpio Carp
Perca fluviatilis Redfin
Tinca tinca Tench
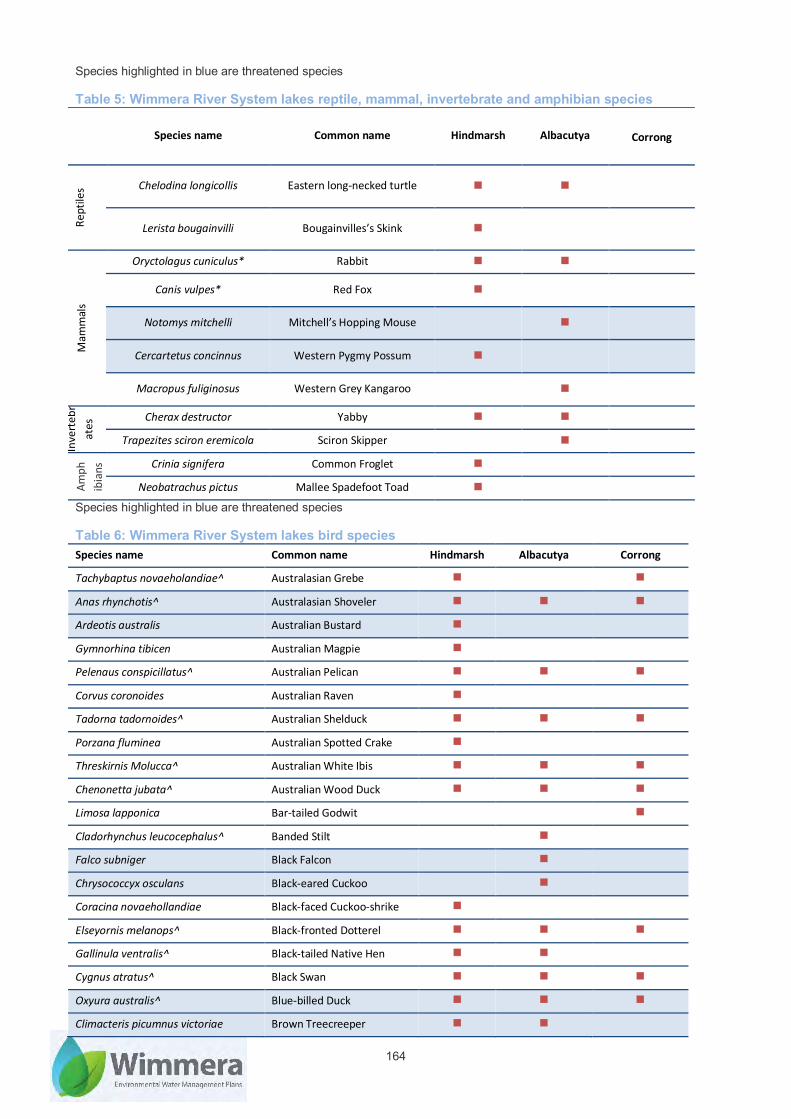
164
Species highlighted in blue are threatened species Table 5: Wimmera River System lakes reptile, mammal, invertebrate and amphibian species
Species name Common name Hindmarsh Albacutya
Corrong
Rep
tile
s
Chelodina longicollis Eastern long-necked turtle
Lerista bougainvilli Bougainvilles’s Skink
Mam
mal
s
Oryctolagus cuniculus* Rabbit
Canis vulpes* Red Fox
Notomys mitchelli Mitchell’s Hopping Mouse
Cercartetus concinnus Western Pygmy Possum
Macropus fuliginosus Western Grey Kangaroo
Inve
rteb
r
ates
Cherax destructor Yabby
Trapezites sciron eremicola Sciron Skipper
Am
ph
ibia
ns Crinia signifera Common Froglet
Neobatrachus pictus Mallee Spadefoot Toad
Species highlighted in blue are threatened species Table 6: Wimmera River System lakes bird species Species name Common name Hindmarsh Albacutya Corrong
Tachybaptus novaeholandiae^ Australasian Grebe
Anas rhynchotis^ Australasian Shoveler
Ardeotis australis Australian Bustard
Gymnorhina tibicen Australian Magpie
Pelenaus conspicillatus^ Australian Pelican
Corvus coronoides Australian Raven
Tadorna tadornoides^ Australian Shelduck
Porzana fluminea Australian Spotted Crake
Threskirnis Molucca^ Australian White Ibis
Chenonetta jubata^ Australian Wood Duck
Limosa lapponica Bar-tailed Godwit
Cladorhynchus leucocephalus^ Banded Stilt
Falco subniger Black Falcon
Chrysococcyx osculans Black-eared Cuckoo
Coracina novaehollandiae Black-faced Cuckoo-shrike
Elseyornis melanops^ Black-fronted Dotterel
Gallinula ventralis^ Black-tailed Native Hen
Cygnus atratus^ Black Swan
Oxyura australis^ Blue-billed Duck
Climacteris picumnus victoriae Brown Treecreeper

165
Species name Common name Hindmarsh Albacutya Corrong
Burhinus grallarius Bush Stone-curlew
Hydroprogne caspia^ Caspian Tern
Anas castanea^ Chestnut Teal
Acrocephalus stentoreus Clamorous Reed Warbler
Tringa nebularia^ Common Greenshank
Actitis hypoleuocos Common Sandpiper
Ocyphaps lophotes Crested Pigeon
Oreoica gutturalis Crested Bellbird
Calidris ferruginea^ Curlew Sandpiper
Anhinga novaehollandaie^ Darter
Anatidae anser* Domestic Goose
Charadrius bicinctus^ Double-banded Plover
Gallinula tenebrosa^ Dusky Moorhen
Artamus cyanopterus Dusky Woodswallow
Ardea modesta^ Eastern Great Egret
Platycercus eximius Eastern Rosella
Fulica atra^ Eurasian Coot
Stictonetta naevosa^ Freckled Duck
Eolophus roseicapilla Galah
Plegadis falcinellus^ Glossy Ibis
Phalacrocorax carbo^ Great Cormorant
Podiceps cristatus^ Great Crested Grebe
Ardea alba^ Great Egret
Pluvialis squatarola Grey Plover
Anas gracilis^ Grey Teal
Geolochelidon nilotica macrotarsa^ Gull-billed Tern
Aythya australis^ Hardhead
Poliocephalus poliocephalus^ Hoary-headed Grebe
Melanodryas cucullata Hooded Robin
Chrysococcyx basalis Horsfield’s Bronze Cuckoo
Dacelo novaeguineae Laughing Kookaburra
Phalacrocorax sulcirostris^ Little Black Cormorant
Hieraaetus morphnoides Little Eagle
Megalurus gramineus^ Little Grassbird
Microcarbo melanoleucos^ Little Pied Cormorant
Cacatua leadberteri Major Mitchell’s Cockatoo
Grallina cyanoleuca Magpie-lark
Stipiturus mallee Mallee Emu-Wren
Tringa stagnatilis^ Marsh Sandpiper
Vanellus miles Masked Lapwing

166
Species name Common name Hindmarsh Albacutya Corrong
Biziura lobata^ Musk Duck
Falco cenchriodes Nankeen Kestrel
Nycticorax caledonicus^ Nankeen Night Heron
Phylidonyris novaehollandiae New Holland Honeyeater
Manorina melanocephala Noisy Miner
Anas superciliosa^ Pacific Black Duck
Geopelia striata Peaceful Dove
Calidris melanotos Pectoral Sandpiper
Phalacrocorax varius^ Pied Cormorant
Malacorhynchus membrananeus^ Pink-eared Duck
Porphyrio porphyria^ Purple Swamphen
Merops ornatus Rainbow Bee-eater
Todiramphus pyrropygia pyrropygia^ Red-backed Kingfisher
Charadrius ruficapillus^ Red-capped Plover
Erythrogonys cinctus^ Red-kneed Dotterel
Recurvirostra novaehollandiae^ Red-necked Avocet
Calidris ruficollis^ Red-necked Stint
Psephotus haematonotus Red-rumped Parrot
Polytelis anthopeplus monarchoides Regent Parrot
Myiara inquieta Restless Flycatcher
Columba livia* Rock Dove
Platalea regia^ Royal Spoonbill
Todramphus sanctus^ Sacred Kingfisher
Calidris acuminate^ Sharp-tailed Sandpiper
Chroicocephalus novaehollandiae Silver Gull
Calidris himantopus^ Stilt Sandpiper
Threskiornis spinicollis^ Straw-necked Ibis
Cacatua galerita Sulphur-crested Cockatoo
Malurus cyaneus Superb Fairy-wren
Circus approximans Swamp Harrier
Petrochelidon nigircans Tree Martin
Petrochelidon neoxena Welcome Swallow
Childonias hybridus javanicus^ Whiskered Tern
Haliastur sphenurus Whistling Kite
Haliaeetus leucogaster^ White-bellied Sea Eagle
Epithianure albifrons White-fronted Chat
Egretta novaehollandiae^ White-faced Heron
Melithreptus lunatus White-naped Honeyeater
Ardea pacifica^ White-necked Heron
Rhipidura leucophrys Willie Wagtail

167
Species name Common name Hindmarsh Albacutya Corrong
Platalea flavipes^ Yellow-billed Spoonbill
Acanthiza chrysorrhoa Yellow-rumped Thornbill
Species highlighted in blue are threatened species Species marked with a ^ are wetland species Table 7: Wimmera River System rivers and streams plant species
Species name Common name Wimmera
Outlet
McKenzie
1/2 & Burnt
Upper
McKenzie
3 & Burnt
Lower
Bungalally &
Yarriambiack
Mt
William
Creek
Acacia acinacea s.l. Gold-dust Wattle
Acacia brachybotrya Grey Mulga
Acacia hakeoides Hakea Wattle
Acacia ligulata Small Cooba
Acacia montana Mallee Wattle
Acacia oswaldi Umbrella Wattle
Acacia provincialis Wirilda
Acacia pycnantha Golden Wattle
Acacia trineura Three-nerve Wattle
Acaena echinata Sheep‘s Burr
Acetosella vulgaris Sheep Sorrel
Actinobole ulginosum Flannel Cudweed
Aira caryophyllea Silvery Hair-grass*
Aira cupaniana Quicksilver Grass*
Allocasuarina luehmannii Buloke
Amphibromus nervosus Common Swamp
Wallaby Grass
Amyema miqueli Box Mistletoe
Anagallis arvensis Pimpernel*
Anthosachne scabra s.l. Common Wheat-grass
Apodasmia brownii Coarse Twine-rush
Arctotheca calendula Cape weed*
Aristida calycina var calycina Dark Wire-grass
Arthropodium fimbriatum Nodding Chocolate Lily
Arthropodium milleflorum s.l. Pale Vanilla-lily
Arthropodium spp. (s.s.) Vanilla Lily
Arthropodium strictum s.s. Chocolate Lily
Asparagus asparagoides Bridal Creeper*
Asparagus offcinalis Asparagus*
Asperula scoparia Prickly Woodruff
Aster subulatus Aster-weed
Astroloma conostephioides Flame Heath
Atriplex semibaccata Berry Saltbush
Atriplex spp. Saltbush
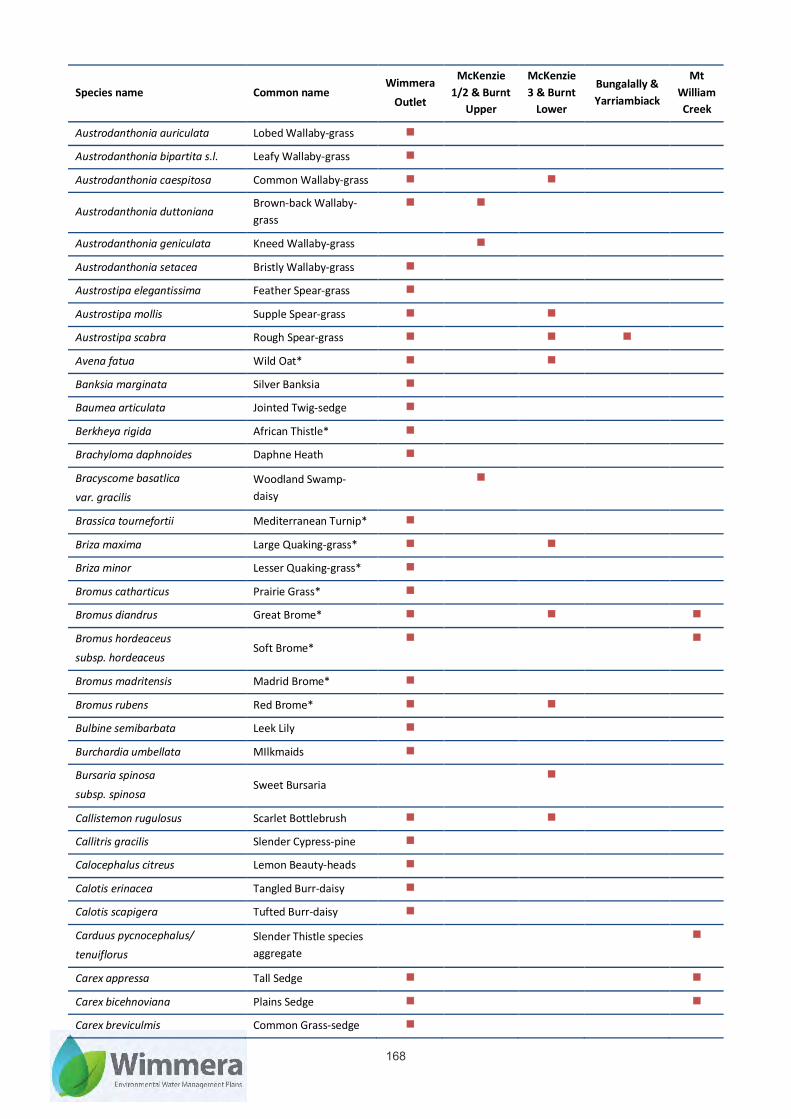
168
Species name Common name Wimmera
Outlet
McKenzie
1/2 & Burnt
Upper
McKenzie
3 & Burnt
Lower
Bungalally &
Yarriambiack
Mt
William
Creek
Austrodanthonia auriculata Lobed Wallaby-grass
Austrodanthonia bipartita s.l. Leafy Wallaby-grass
Austrodanthonia caespitosa Common Wallaby-grass
Austrodanthonia duttoniana Brown-back Wallaby-
grass
Austrodanthonia geniculata Kneed Wallaby-grass
Austrodanthonia setacea Bristly Wallaby-grass
Austrostipa elegantissima Feather Spear-grass
Austrostipa mollis Supple Spear-grass
Austrostipa scabra Rough Spear-grass
Avena fatua Wild Oat*
Banksia marginata Silver Banksia
Baumea articulata Jointed Twig-sedge
Berkheya rigida African Thistle*
Brachyloma daphnoides Daphne Heath
Bracyscome basatlica
var. gracilis
Woodland Swamp-
daisy
Brassica tournefortii Mediterranean Turnip*
Briza maxima Large Quaking-grass*
Briza minor Lesser Quaking-grass*
Bromus catharticus Prairie Grass*
Bromus diandrus Great Brome*
Bromus hordeaceus
subsp. hordeaceus Soft Brome*
Bromus madritensis Madrid Brome*
Bromus rubens Red Brome*
Bulbine semibarbata Leek Lily
Burchardia umbellata MIlkmaids
Bursaria spinosa
subsp. spinosa Sweet Bursaria
Callistemon rugulosus Scarlet Bottlebrush
Callitris gracilis Slender Cypress-pine
Calocephalus citreus Lemon Beauty-heads
Calotis erinacea Tangled Burr-daisy
Calotis scapigera Tufted Burr-daisy
Carduus pycnocephalus/
tenuiflorus
Slender Thistle species
aggregate
Carex appressa Tall Sedge
Carex bicehnoviana Plains Sedge
Carex breviculmis Common Grass-sedge

169
Species name Common name Wimmera
Outlet
McKenzie
1/2 & Burnt
Upper
McKenzie
3 & Burnt
Lower
Bungalally &
Yarriambiack
Mt
William
Creek
Carex inversa Knob Sedge
Carex gaudichaudiana Fen Sedge
Carex tereticaulis Poong’ort
Carthamus lanatus Saffron Thistle*
Cassytha melantha Coarse Dodder-laurel
Centaurium tenuiflorum Slender Centaury*
Centipeda cunninghamii Common Sneezeweed
Centrolepis aristata Pointed Centrolepis
Centrolepis strigosea
subsp. strigosa Hairy Centrolepis
Cerastium glomeratum s.l. Common Mouse-ear
Chickweed*
Chamaesyce drummondii Flat Spurge
Cheilanthes sieberi Narrow Rock-fern
Chloris truncata Windmill Grass
Chonopodium desertorum
Subsp. microphyllum Small-leaf Goosefoot
Chondrilla juncea Skeleton Weed*
Chorisandra enodis Black Bristle-sedge
Chrysosephalum apiculatum Common Everlasting
Cicendia filiformis Slender Cicendia*
Cirsium vulgare Spear Thistle*
Clematis microphyllia s.l. Small-leaved Clematis
Convolvulus erubescens
spp. agg. Pink Bindweed
Convolvulus remotus Grass Bindweed
Cotula australis Common Cotula
Cotula cornopifolia Water Buttons*
Crassula colorata Dense Crassula
Crassula helmsii Swamp Crassula
Crassula sieberiana s.l. Sieber Crassula
Crepis capillaris Smooth Hawksbeard*
Cynodon dactylon Couch*
Cyperus gunnii
subsp. gunnii Flecked Flat-sedge
Cyperus eragrostis Drain Flat-sedge*
Cyperus gymnocaulos Spiny Flat-sedge
Daviesia spp. Bitter-pea
Dianella revoluta
var. revoluta s.l. Black-anther Flax-lily

170
Species name Common name Wimmera
Outlet
McKenzie
1/2 & Burnt
Upper
McKenzie
3 & Burnt
Lower
Bungalally &
Yarriambiack
Mt
William
Creek
Dianella sp. aff. longifolia
(Riverina) Pale Flax-lily
Dianella sp. aff. revoluta
(North-west Victoria) Stiff Flax-lily
Dichondra repens Kidney-weed
Distichlis distichophylla Australian Salt-grass
Dittichia graveolens Stinkwort*
Dodonaea bursarifolia Small Hop-bush
Dodonaea viscosa subsp.
angustissima Slender Hop-bush
Dodonaea viscosa subsp.
cuneata Wedge-leaf Hop-bush
Drosera peltata Pale Sundew
Ehrarta calycina Perennial Veldt-grass*
Ehrarta longiflora Annual Veldt-grass*
Einadia nutans subsp.
nutans Nodding Saltbush
Eleocharis acuta Common Spike-salt
sedge
Elymus scaber var. scaber Common Wheat-grass
Enchylaena tomentose
var. tomentosa Ruby Saltbush
Enneapogon nigricans Blackheads
Enteropogon acicularis Spider Grass
Epilobium billardierianum Variable Willow-herb
Eragrostis brownii Common Love-grass
Eragrostis curvula African Love-grass*
Eragrostis infecunda Southern Cane-grass
Eryngium ovinum Blue Devil
Eucalyptus camaldulensis River Red-gum
Eucalyptus largiflorens Black Box
Eucalyptus melliodora Yellow Box
Eucalyptus microcarpa Grey Box
Euchiton sphaericus Annual Cudweed
Euphorbia drummondii Flat Spurge
Euryops abrotanifolius Euryops*
Eutaxia microphyllia var.
diffusa Spreading Eutaxia
Eutaxia microphyllia var.
microphylla Common Eutaxia
Exocarpos cupressiformis Cherry Ballart

171
Species name Common name Wimmera
Outlet
McKenzie
1/2 & Burnt
Upper
McKenzie
3 & Burnt
Lower
Bungalally &
Yarriambiack
Mt
William
Creek
Exocarpos strictus Pale-fruit Ballart
Ficinia nodosa Knobby Club-sedge
Geranium molle var. molle Dove’s Foot*
Gladiolus undulatus Wild Gladiolus*
Glyceria australis Australian Sweet-grass
Gonocarpus tetragynus Common Raspwort
Goodenia geniculata Bent Goodenia
Goodenia gracilis Slender Goodenia
Goodenia humilis Swamp Goodenia
Goodenia ovata Hop Goodenia
Gratiola pubescens Glandula Brooklime
Haloragis aspera Rough Raspwort
Helichrysum luteoalbum Jersey Cudweed
Helminthotheca echioides Ox-tongue*
Heliotropium europaeum Common Heliotrope*
Hibbertia riparia Erect Guinea-flower
Hibbertia virgata Twiggy Guinea-flower
Hordeoum glaucum Northern Barley-grass*
Hordeum leporinum Barley-grass*
Hydrocotyle hirta Hairy Pennywort
Hydrocotyle laxiflora Stinking Pennywort
Hypericum gramineum Small St John’s Wort
Hypericum perforatum
subsp. veronense St John’s Wort*
Hypochaeris glabra Smooth Cat’s-ear
Hypochaeris radicata Flatweed*
Hypolaena fastiagata Tassel Rope-rush
Isolepis cernua
var. platycarpa Broad-fruit Club-sedge
Isolepis fluitans Floating Club-Sedge
Isolepis hystrix Awned Club-sedge*
Isolepis levynsiana Tiny Flat-sedge*
Jasminum didymium
subsp. lineare Desert Jasmine
Juncus amabilis Hollow Rush
Juncus flavidus Gold Rush
Juncus gregiflorus Green Rush
Juncus holoschoenus Joint-leaf Rush
Juncus pallidus Pale Rush
Juncus subsecundus Finger Rush
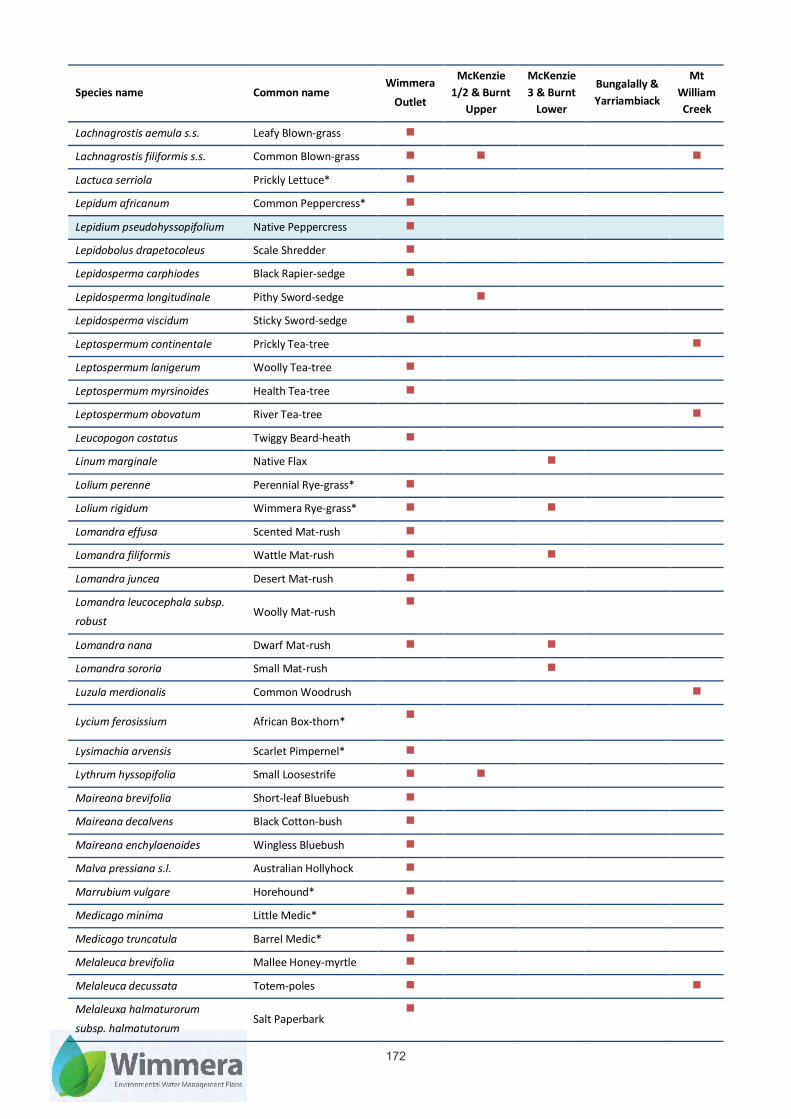
172
Species name Common name Wimmera
Outlet
McKenzie
1/2 & Burnt
Upper
McKenzie
3 & Burnt
Lower
Bungalally &
Yarriambiack
Mt
William
Creek
Lachnagrostis aemula s.s. Leafy Blown-grass
Lachnagrostis filiformis s.s. Common Blown-grass
Lactuca serriola Prickly Lettuce*
Lepidum africanum Common Peppercress*
Lepidium pseudohyssopifolium Native Peppercress
Lepidobolus drapetocoleus Scale Shredder
Lepidosperma carphiodes Black Rapier-sedge
Lepidosperma longitudinale Pithy Sword-sedge
Lepidosperma viscidum Sticky Sword-sedge
Leptospermum continentale Prickly Tea-tree
Leptospermum lanigerum Woolly Tea-tree
Leptospermum myrsinoides Health Tea-tree
Leptospermum obovatum River Tea-tree
Leucopogon costatus Twiggy Beard-heath
Linum marginale Native Flax
Lolium perenne Perennial Rye-grass*
Lolium rigidum Wimmera Rye-grass*
Lomandra effusa Scented Mat-rush
Lomandra filiformis Wattle Mat-rush
Lomandra juncea Desert Mat-rush
Lomandra leucocephala subsp.
robust Woolly Mat-rush
Lomandra nana Dwarf Mat-rush
Lomandra sororia Small Mat-rush
Luzula merdionalis Common Woodrush
Lycium ferosissium African Box-thorn*
Lysimachia arvensis Scarlet Pimpernel*
Lythrum hyssopifolia Small Loosestrife
Maireana brevifolia Short-leaf Bluebush
Maireana decalvens Black Cotton-bush
Maireana enchylaenoides Wingless Bluebush
Malva pressiana s.l. Australian Hollyhock
Marrubium vulgare Horehound*
Medicago minima Little Medic*
Medicago truncatula Barrel Medic*
Melaleuca brevifolia Mallee Honey-myrtle
Melaleuca decussata Totem-poles
Melaleuxa halmaturorum
subsp. halmatutorum Salt Paperbark
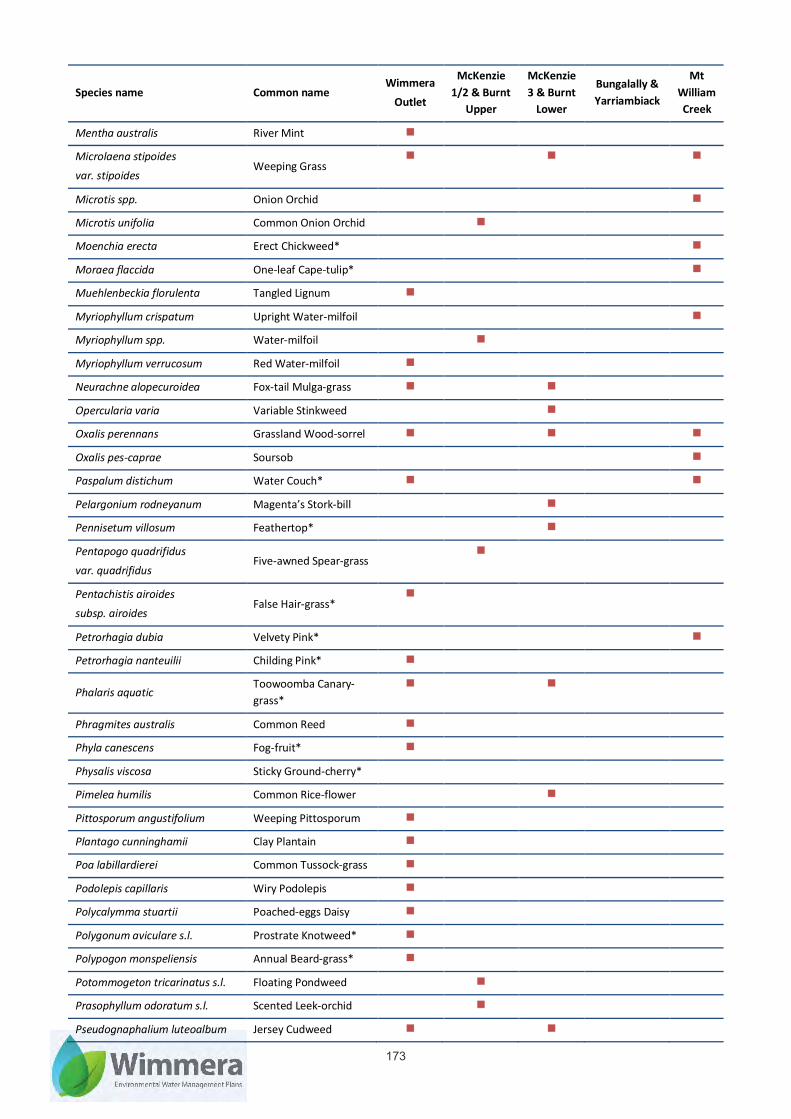
173
Species name Common name Wimmera
Outlet
McKenzie
1/2 & Burnt
Upper
McKenzie
3 & Burnt
Lower
Bungalally &
Yarriambiack
Mt
William
Creek
Mentha australis River Mint
Microlaena stipoides
var. stipoides Weeping Grass
Microtis spp. Onion Orchid
Microtis unifolia Common Onion Orchid
Moenchia erecta Erect Chickweed*
Moraea flaccida One-leaf Cape-tulip*
Muehlenbeckia florulenta Tangled Lignum
Myriophyllum crispatum Upright Water-milfoil
Myriophyllum spp. Water-milfoil
Myriophyllum verrucosum Red Water-milfoil
Neurachne alopecuroidea Fox-tail Mulga-grass
Opercularia varia Variable Stinkweed
Oxalis perennans Grassland Wood-sorrel
Oxalis pes-caprae Soursob
Paspalum distichum Water Couch*
Pelargonium rodneyanum Magenta’s Stork-bill
Pennisetum villosum Feathertop*
Pentapogo quadrifidus
var. quadrifidus Five-awned Spear-grass
Pentachistis airoides
subsp. airoides False Hair-grass*
Petrorhagia dubia Velvety Pink*
Petrorhagia nanteuilii Childing Pink*
Phalaris aquatic Toowoomba Canary-
grass*
Phragmites australis Common Reed
Phyla canescens Fog-fruit*
Physalis viscosa Sticky Ground-cherry*
Pimelea humilis Common Rice-flower
Pittosporum angustifolium Weeping Pittosporum
Plantago cunninghamii Clay Plantain
Poa labillardierei Common Tussock-grass
Podolepis capillaris Wiry Podolepis
Polycalymma stuartii Poached-eggs Daisy
Polygonum aviculare s.l. Prostrate Knotweed*
Polypogon monspeliensis Annual Beard-grass*
Potommogeton tricarinatus s.l. Floating Pondweed
Prasophyllum odoratum s.l. Scented Leek-orchid
Pseudognaphalium luteoalbum Jersey Cudweed

174
Species name Common name Wimmera
Outlet
McKenzie
1/2 & Burnt
Upper
McKenzie
3 & Burnt
Lower
Bungalally &
Yarriambiack
Mt
William
Creek
Pterostylis cheraphila Floodplain Rustyhood
Pterostylis curta Blunt Greenhood
Ptilotus macrocephalus Feather-heads
Pultenaea tenuifolia Slender Bush-pea
Ranunculus muricatus Sharp Buttercup
Romulea rosea Onion Grass*
Rosa rubiginosa Sweet Briar*
Rubus fruticosus
spp. agg. Blackberry*
Rumex brownii Slender Dock
Rumex crispus Curled Dock*
Salsola tragus
subsp. tragus Prickly Saltwort
Salvia verbenacca Wild Sage*
Sarcocornia quinqueflora Beaded Samphire
Samolus repens Water Pimpernel
Schimus barbatus Arabian Grass*
Schoenus breviculmis Matted Bog-sedge
Scleolaena diacantha Grey Copperburr
Sclerolaena muricata Black Roly-poly
Senecio quadridentatus Cotton Fireweed
Senna petiolaris Woody Cassia
Sherardia arvensis Field Madder*
Sida corrugata Variable Sida
Silene gallica var. gallica French Catchfly*
Silene nocturna Mediterranean
Catchfly*
Sisymbrium irio London Rocket*
Solanum aviculare Kangaroo Apple
Solanum nigrum Black Nightshade*
Solenogyne dominie Smooth Solenogyne
Sonchus asper s.l. Rough Sow-thistle*
Sonchus oleraceus Common Sow-thistle*
Spergularia media s.l. Coast Sand-spurrey
Spergularia rubra s.l. Red Sand-spurrey*
Spergularia sp. 3 Salt Sea-spurrey
Stackhousia monogyna Creamy Candles
Stellaria media Chickweed*
Stemodia florenta Blue Rod
Stylidium despectum Small Triggerplant

175
Species name Common name Wimmera
Outlet
McKenzie
1/2 & Burnt
Upper
McKenzie
3 & Burnt
Lower
Bungalally &
Yarriambiack
Mt
William
Creek
Stylidium graminifolium s.l. Grass Triggerplant
Teucrium racemosum s.l. Grey Germander
Themeda triandra Kangaroo Grass
Tribulus terrestris Caltrop
Tricoryne elatior Yellow Rush-lily
Tricoryne tenella Mallee Rush-lily
Trifolium angustifolium var.
angustifolium Narrow-leaf Clover*
Trifolium arvense var.
arvense Hare’s-foot Clover*
Trifolium campestre var.
campestre Hop Clover*
Trifolium glomeratum Cluster Clover*
Trifolium subterraneum Subterranean Clover*
Triglochin procera s.s. Common Water-
ribbons
Triglochin striata Streaked Arrowgrass
Typha domingensis Narrow-leaf Cumbungi
Utricularia dichotoma s.l. Fairies’ Aprons
Viminaria juncea Golden Spray
Viola hederacea Ivy-leaf Violet
Vittadinia cuneata Fuzzy New Holland
Daisy
Vulpia bromoides Squirrel-tail Fescue*
Vulpia muralis Wall Fescue*
Wahlenbergia gracilenta s.l. Annual Bluebell
Wahlenbergia luteola Bronze Bluebell
Species highlighted in blue are threatened species Species marked with an asterisk are introduced species Table 8: Wimmera River System terminal lakes plant species Species name Common name Hindmarsh Albacutya Corrong
Acacia brachybotrya Grey Mulga
Acacia ligulata Small Cooba
Acacia pycnantha Golden Wattle
Acacia trineura Three-nerve Wattle
Acetosella vulgaris Sheep Sorrel
Actinobole ulginosum Flannel Cudweed
Amsinkia intermedia Common Fiddle-neck*
Asparagus asparagoides Bridal Creeper*
Asphodelius fistulosis Onion Weed*

176
Species name Common name Hindmarsh Albacutya Corrong
Atriplex australasica Native Orache
Atriplex leptocarpa Slender-fruit Saltbush
Atriplex semibaccata Berry Saltbush
Austrodanthonia caespitosa Common Wallaby-grass
Austrodanthonia setacea Bristly Wallaby-grass
Austrostipa nitida Balcarra nitida
Austrostipa sp. Spear-grass
Avena fatua Wild Oat*
Avena barbata Bearded Out*
Brassica tournefortii Mediterranean Turnip*
Bromus diandrus Great Brome*
Bromus hordaceus Soft Brome
Bromus rubens Red Brome*
Calendrinia eremaea Small Purslane
Carex breviculmis Common Grass-sedge
Carpobrotus modestus Inland Pigface
Chamaeyce drummondii Flat Spurge
Chenopodium desertorium Frosted Goosefoot
Cirsium vulgare Spear Thistle*
Clematis microphyllia s.l. Small-leaved Clematis
Convolvulus erubescens
spp. agg. Pink Bindweed
Crassula helmsii Swamp Crassula
Cynodon dactylon Couch*
Cyperus gymnocaulos Spiny Flat-sedge
Daviesia ulicifolia Gorse Bitter-pea
Dianella brevicaulis Small-flower Flax-lily
Dianella revoluta
var. revoluta s.l. Black-anther Flax-lily
Dichondra repens Kidney-weed
Dittichia graveolens Stinkwort*
Dodonaea viscosa Sticky Hop-bush
Echium plantagineum Paterson’s Curse*
Ehrarta calycina Perennial Veldt-grass*
Einadia nutans subsp.
nutans Nodding Saltbush
Enchylaena tomentose
var. tomentosa Ruby Saltbush
Eragrostis dielsii Mallee Love-grass
Eragrostis infecunda Southern Cane-grass
Eucalyptus camaldulensis River Red-gum

177
Species name Common name Hindmarsh Albacutya Corrong
Eucalyptus largilforens
Eutaxia microphyllia var.
microphylla Common Eutaxia
Ficinia nodosa Knobby Club-sedge
Heliotropium europaeum Common Heliotrope*
Hordeoum marinum Sea Barley-grass*
Hypochaeris glabra Smooth Cat’s-ear
Hypochaeris radicata Flatweed*
Kennedia prostrata Running Postman
Lachnagrostis filiformis s.s. Common Blown-grass
Lamarckia aurea Golden-top*
Lawrencia glomerata Clustered Lawrencia
Lepilaena bilocularis Small-fruit Water-mat
Lolium perenne Perennial Rye-grass*
Lolium rigidum Wimmera Rye-grass*
Lotus cruentus Red Bird’s-foot Trefoil
Lycium ferosissium African Box-thorn*
Maireana brevifolia Short-leaf Bluebush
Maireana excavata Bottle Bluebush
Maireana pentagona Hairy Bluebush
Marrubium vulgare Horehound*
Medicago minima Little Medic*
Medicago polymoprha Burr Medic*
Medicago truncatula Barrel Medic*
Melilotus albus Bokhara Clover*
Mimulus albus Creeping Monkey
Flower
Muehlenbeckia florulenta Tangled Lignum
Myroprum parvifolium Creeping Myoporum
Najas spp. Water Nymph
Parapholis incurva Coast Barb-grass
Pelargonium australe Austral Stork’s-bill
Phragmites australis Common Reed
Poaceae tragus Burr-grass
Pogonolepis muelleriana Stiff Cup-flower
Polypogon monspeliensis Annual Beard-grass*
Pseudognaphalium luteoalbum Jersey Cudweed
Rhagodia spenescens Hedge Saltbush
Rhodanthe corymbiflora Paper Sunray
Rostraria pumila Tiny Bristle-grass*
Schoenoplectus pungens Sharp Club-sedge

178
Species name Common name Hindmarsh Albacutya Corrong
Sclerolaena diacantha Grey Copperburr
Sclerolaena muricata Black Roly-poly
Sclerolaena obliquicuspis Limestone Copperburr
Senecio spanomerus Mallee Groundsel
Sisymbrium irio London Rocket*
Solanum esuriale Quena
Sonchus asper s.l. Rough Sow-thistle*
Sonchus oleraceus Common Sow-thistle*
Spergularia spp. Sand-spurrey
Sporobolus mitchelii Rat-tail Couch
Stemodia florulenta Blue Rod
Suaeda spp. Seablite
Tecticornia pergranulata Blackseed Glasswort
Trifolium tomentosum var.
tomentosum Woolly Clover
Triglochin procera s.s. Common Water-
ribbons
Viminaria juncea Golden Spray
Vittadinia dissecta s.l. Dissected New Holland
Daisy
Vulpia fasciculata Dune Fescue*
Vulpia muralis Wall Fescue*
Vulpia myuros Rat’s-tail Fescue*
Wahlenbergia spp. Bluebell
Species highlighted in blue are threatened species Species marked with an asterisk are introduced species

179
Appendix 5 – Environmental Water Recommendations Tables 1 to 10 are derived from Wimmera River Environmental Flows Study (Alluvium, 2013), Tables 11 to 13 are from The Environmental Water Needs of the Wimmera Terminal Lakes (Ecological Associates, 2004), Table 14 is from the Environmental Water Requirements of Lake Corrong and Lake Lascelles (Ecological Associates, 2006). Table 1: Environmental flow recommendations and relationship with environmental objectives for Wimmera River Reaches 2 and 3. Compliance Point – Wimmera River @ Horsham (415200).
Flow component Period Magnitude Condition Frequency Duration Objectives achieved
Cease to Flow
Dec-May 0 ML/d
DROUGHT As
infrequently as possible
Less than 21 days in
total
Ensure stress on environmental values is not exacerbated beyond
natural. Cease to flow periods should be completed with fresh lasting at least 7 days duration.
DRY
AVERAGE
Less than 7 days in
total
Baseflow
Dec -May
10 ML/d or natural ALL Continuous Continuous
Maintain edge habitats in deeper pools and runs, and shallow water
habitat availability for macroinvertebrates and endemic
fish. Maintains near permanent
inundated stream channel for riparian vegetation and to prevent
excessive in stream terrestrial growth.
June- Nov 100 ML/d
ALL
Continuous
Continuous
Prevent terrestrialisaton of the lower banks from invasive
phragmites and provide increased flow and variability to support fish movement and diversity of habitat.
Freshes
Dec - May 35-40 ML/d
DROUGHT 2 per period
3 - 7 days
Periodically improving water quality by flushing pools during low flows. DRY
Dec -May 100 ML/d
AVERAGE
2 per period
2 - 7 days
Provide variable flow during low flow season for macroinvertebrates
(over wood debris to increase biofilm abundance as a food
source), fish movement and to maintain water quality and diversity
of habitat.
WET
3 per period
June - Nov 400 ML/d
DROUGHT 1 per period 1 day Provide variable flow during high flow season for fish movement and
to maintain water quality and diversity of habitat. Also flushes
surface sediments from hard substrates for macroinvertebrates.
DRY 3 per period 2 days
AVERAGE 5 per period 3 days
WET 5 per period 4 days
June - Nov 1,300 ML/d
DRY 1 per period 1 day Wets benches, entraining organic debris and promoting diversity of
habitat.
AVERAGE 2 per period 2 days WET 3 per period 3 days
June - Nov 2,600 ML/d
AVERAGE
1 per period 2 days
Disturbs algae/bacteria/organic biofilm present on rock or wood
debris for macroinvertebrates. Wets higher benches, entraining organic debris and promoting diversity of
habitat.
WET
2 per period 3 days
Bankfull Any 4,000 ML/d
AVERAGE
1 per period or natural
2 days
Inundate riparian vegetation to maintain condition and facilitate
recruitment. Entrain organic debris in the channel to support
macroinvertebrates. Maintain structural integrity of channel.
WET 1 per period

180
Flow component Period Magnitude Condition Frequency Duration Objectives achieved
Overbank Aug-Nov
8,000 ML/d
WET
1 per period 1 day
Inundate floodplain to maintain condition of adults and facilitate
recruitment. Entrain organic debris from the floodplain to support macroinvertebrates. Maintains floodplain geomorphic features.
Table 2: Environmental flow recommendations and relationship with environmental objectives for Wimmera River Reach 4. Compliance Point- Wimmera River @ Lochiel Railway Bridge (415246)
Flow component Period Magnitude Condition Frequency Duration Objectives achieved
Cease to flow
Dec-May 0 ML/d
DROUGHT As
infrequently as possible
Less than 21 days in
total Limits cease to flow to ensure
stress on environmental values is not exacerbated beyond the point
of return.
DRY
AVERAGE
Less than 7 days in
total
Baseflow
Dec-May
15 ML/d or natural
ALL
Continuous Continuous
Maintain edge habitats in deeper pools and runs, and shallow water
habitat availability for macroinvertebrates and endemic fish. Maintains near-permanent inundated stream channel for
riparian vegetation and to prevent excessive in stream terrestrial
species growth. Jun-Nov
30 ML/d
ALL
Continuous
Continuous
Provides flow variability to maintain diversity of habitats.
Freshes
Dec -May 70 ML/d
DROUGHT 1 per period
2-7days
Prevent water quality decline by flushing pools during low flows. Provide variable flow during low
flow season for macroinvertebrates (over wood debris to increase biofilm abundance as a food
source), fish movement and to maintain water quality and diversity
of habitat.
DRY 2 per period AVERAGE
WET 3 per period
June -Nov 70 ML/d
DROUGHT 1 per period 1 day Increase the baseflow water depth by to provide stimulus for fish
movement (not required in drought years, frequently required in wet years). Provide flow variability to
maintain water quality and diversity of fish habitats.
DRY 3 per period 2 days
AVERAGE 5 per period 3 days
WET 5 per period 4 days
June - Nov 200 ML/d
DRY 1 per period 1 day Wets lower benches, entraining organic debris and promoting
diversity of habitat. AVERAGE 2 per period 2 days
WET 3 per period 3 days
June - Nov 1300 ML/d
AVERAGE 1 per period 2 days Flush surface sediments from hard
substrates to support macroinvertebrates. Wets higher
benches, entraining organic debris and promoting diversity of habitat.
WET 2 per period 3 days
Bankfull Any 2,000 ML/d AVERAGE 1 per period,
or natural 2 days
Inundate riparian vegetation to maintain condition and facilitate
recruitment. Entrain organic debris in the channel to support
macroinvertebrates. Maintain structural integrity of channel. WET 1 per period
Overbank Aug-Nov 6,000 ML/d WET 1 per period
or natural 1day
Inundate floodplain vegetation to maintain condition and facilitate
recruitment. Entrain organic debris from the floodplain to support macroinvertebrates. Maintains floodplain geomorphic features.

181
Table 3: Environmental flow recommendations and relationship with environmental objectives for MacKenzie River Reach 1 and 2. Compliance Point: Not present
Flow component Period Magnitude Condition Frequency Duration Objectives achieved
Cease to Flow
Dec -May 0 ML/d
DROUGHT As
infrequently as possible
Less than 80 days in
total Ensure stress on environmental
values is not exacerbated beyond natural. Cease to flow periods
should be completed with fresh lasting at least 7 days duration.
DRY Less than 30 days in
total AVERAGE
Baseflow
Dec -May
2 ML/d or natural
ALL
Continuous Continuous
Maintain edge habitats in deeper pools and runs, and shallow water
habitat availability for macroinvertebrates and endemic fish. Maintains near-permanent
inundated stream channel to prevent excessive in stream terrestrial species growth.
June - Nov 27 ML/d ALL Continuous Continuous
Facilitate annual dispersal of juvenile platypus into the Wimmera River. Provides flow variability to
maintain diversity of habitat.
Freshes
Dec -May 5 ML/d DROUGHT 3 per period 4-7 days Prevent water quality decline by
flushing pools during low flows. DRY 4 per period 4-7 days
Dec -May 50 ML/d
AVERAGE 2 per period 2-7 days Provide variable flow during low
flow season for macroinvertebrates (over wood debris to increase biofilm abundance as a food
source), fish movement and to maintain water quality and diversity
of habitat. WET 3 per period 2-7 days
June- Nov 55 ML/d
DROUGHT 5 per period 2 days Flush surface sediments from hard substrates to support macroinvertebrates.
DRY 5 per period 4 days AVERAGE 5 per period 5 days
WET 5 per period 7 days
June-Nov 130 ML/d
DROUGHT 1 per period 1 days Increase the baseflow water depth
by to provide stimulus for fish movement (not required in drought years, frequently required in wet years). Provide flow variability to
maintain water quality and diversity of fish habitats.
DRY 3 per period 2 days AVERAGE 5 per period 3 days
WET 5 per period 4 days
Bankfull Any 500 ML/d
AVERAGE 1 per period 2 days
Inundate riparian vegetation to maintain condition and facilitate
recruitment. Entrain organic debris in the channel to support
macroinvertebrates. Maintain structural integrity of channel. WET 1 per period 2 days
Overbank Aug-Nov 900 ML/d WET 1 per period 1 day
Inundate floodplain vegetation to maintain condition and facilitate
recruitment. Entrain organic debris from the floodplain to support macroinvertebrates. Maintains floodplain geomorphic features.
Table 4: Environmental flow recommendations and relationship with environmental objectives for MacKenzie River Reach 3. Compliance Point: MacKenzie River @ McKenzie Creek Reserve (415251)
Flow component Period Magnitude Condition Frequency Duration Objectives achieved
Cease to Flow
Dec-May 0 ML/d
DROUGHT As infrequently as possible
Less than 80 days in total
Ensure stress on environmental values is not exacerbated beyond the point of no return. Cease to
flow periods should be completed with fresh lasting at least 7 days
duration. DRY Less than 30

182
Flow component Period Magnitude Condition Frequency Duration Objectives achieved
AVERAGE
days in total
Baseflow Any 10ML/d or natural ALL Continuous Continuous
Maintain edge habitats and shallow water habitat availability
for macroinvertebrates and endemic fish and near-permanent
inundated stream channel for riparian vegetation and prevents
excessive instream terrestrial species growth.
Freshes
Dec - May 35 ML/d
DROUGHT 3 per period 2-7 days Provide variable flow during low flow season for
macroinvertebrates (over wood debris to increase biofilm
abundance as a food source), fish movement and to maintain water quality and diversity of habitat.
DRY 3 per period 3-7 days
AVERAGE 4 per period 3-7 days
WET 4 per period 3-7 days
Jun-Nov 35ML/d
DROUGHT
5 per period
2 days Stimulate fish movement and
maintain water quality and diversity of habitat.
DRY 4 days AVERAGE 5 days
WET 7 days
Jun-Nov 190 ML/d
AVERAGE 1 per period
1 day Achieve shear stress to flush surface sediments from hard
substrates to support macroinvertebrates.
WET 2 days
Bankfull Any 500 ML/d WET 1 per period, or natural 1-day
Inundate riparian vegetation to maintain condition and facilitate
recruitment (including Callistemon Wimmerensis). Entrain organic debris in the channel to support macroinvertebrates. Maintain structural integrity of channel.
Overbank Aug-Nov 1000 ML/d WET 1 per period,
or natural 1 day
Inundate floodplain vegetation to maintain condition and facilitate
recruitment (including Callistemon Wimmerensis). Entrain organic debris in the channel to support macroinvertebrates. Maintains floodplain geomorphic features.
Table 5: Environmental flow recommendations and relationship with environmental objectives for Lower Mt William Creek (below Lake Lonsdale). Compliance Point: Mt William Creek at Lake Lonsdale Tailgauge (415203)
Flow component Period Magnitude Condition Frequency Duration Objectives achieved
Cease to Flow Dec -May 0 ML/d
DROUGHT As infrequently as possible
Less than 90 days in
total
Ensure stress on environmental values is not exacerbated beyond
the point of no return. Cease to flow periods should be concluded with
fresh lasting at least 7 days duration.
DRY Less than 30 days in
total AVERAGE
Baseflow Any 5 ML/d or natural All Continuous Continuous
Maintain edge habitats and shallow water habitat availability for
macroinvertebrates and endemic fish and near-permanent inundated
stream channel for riparian vegetation and prevents excessive instream terrestrial species growth.
Freshes
Dec-May 20 ML/d DROUGHT 3 per period 2-7 days Prevent water quality decline by
flushing pools during low flows. DRY 3 per period 4-7 days
Dec -May 30 ML/d AVERAGE 3 per period 2-7 days Provide variable flow during low
flow season for macroinvertebrates (over wood debris to increase biofilm abundance as a food

183
Flow component Period Magnitude Condition Frequency Duration Objectives achieved
WET 3 per period 3-7 days
source), fish movement and to maintain water quality and diversity
of habitat.
June-Nov 100 ML/d
DROUGHT
1 per period 3 days Wets benches, entraining organic
debris and promoting diversity of habitat. Flush surface sediments from hard substrates to support macroinvertebrates. Wets low
benches, entraining organic debris and promoting diversity of habitat.
DRY 3 per period 3 days
AVERAGE 3 per period 5 days
WET 5 per period 7 days
Jun-Nov 500 ML/d DRY 1 per period 1 days Wets highest benches, entraining
organic debris and promoting diversity of habitat
AVERAGE 2 per period 2 days WET 3 per period 2 days
Bankfull Any 750 ML/d AVERAGE 1 per year
or natural 2 days Inundate riparian vegetation to maintain condition and facilitate
recruitment. Entrain organic debris in the channel to support
macroinvertebrates. Maintain structural integrity of channel. WET 1 per year 4 days
Overbank Aug - Nov 1,500 ML/d WET 1 per year 1 day
Inundate floodplain vegetation to maintain condition and facilitate
recruitment. Entrain organic debris from the floodplain to support macroinvertebrates. Maintains floodplain geomorphic features.
Table 6: Environmental flow recommendations and relationship with environmental objectives for Upper Mt William Creek (above Lake Lonsdale). Compliance Point: Mt William Creek @ Mokepilly (415252)
Flow component Period Magnitude Frequency Duration Objectives achieved
Cease to Flow Dec-May 0 ML/d 1 per period 90 days
maximum
Provides a physical disturbance to the exposed river channel. Leads to an
increase in macroinvertebrate species diversity.
Baseflow June-Nov Minimum 24 ML/d Continuous Continuous
Improve water quality in pools, provides access to habitat for fish and
macroinvertebrates
Freshes
Dec –May > 1 ML/d 2 per year 5 days
Prevents sediment accumulation that can smother habitat. Assists in maintaining
and access to suitable habitat for macroinvertebrate and fish species.
Assists in maintenance of wetted channel during summer low flow period and
improves water quality in pools. Triggers spawning in many Western Carp
Gudgeon as well as a number of other key native fish species.
June-November >52 ML/d 4 per year 7 days
Provides disturbance to macroinvertebrate communities which increases abundance and diversity in
native fish species and triggers spawning in Western Carp Gudgeon. Improves
water quality in pools.
Winter- Spring >500 ML/d 2 per year 2 days
Transport the sediment downstream to prevent the smothering of key habitats.
Flushed fine sediment and organic material from pools. Reduces vegetation encroachment in to channel and disturbs
terrestrial vegetation on bank.

184
Table 7: Environmental flow recommendations and relationship with environmental objectives for Bungalally Creek. Compliance Point: Bungalally Creek at McKenzie Creek (inactive)
Flow component Period Magnitude Condition Frequency Duration Objectives achieved
Bankfull Any 60 ML/d AVERAGE 1 per
period or natural
2 days
Inundate riparian vegetation to maintain condition and facilitate recruitment. Maintain structural integrity of channel. WET
Overbank Aug-Nov 150 ML./d WET
1 per period or natural
1 days
Inundate floodplain vegetation to maintain condition and facilitate recruitment. Maintains floodplain geomorphic features.
Table 8: Environmental flow recommendations and relationship with environmental objectives for Burnt Creek Reach 1 (upper Burnt Creek). Compliance Point: Burnt Creek at Wonwondah East (415223)
Flow component Period Magnitude Condition Frequency Duration Objectives achieved
Cease to Flow
Dec-May 0 ML/d
DROUGHT As infrequently as possible
Less than 80 days in total
Ensure stress on environmental values is not exacerbated beyond the point of no return. Cease to flow periods should be concluded with fresh lasting at least 7 days duration.
DRY Less than 30 days in total
AVERAGE
Baseflow All year
1 ML/d or natural ALL Continuous Continuous
Maintain edge habitats and shallow water habitat availability for fish and macroinvertebrates and inundated stream channel for riparian vegetation and prevents excessive instream terrestrial growth.
Freshes
Dec - May 30 ML/d
DROUGHT 3 per period 2-7 days Prevent water quality decline by flushing pools during low flows.
DRY 3 per period 4-7 days AVERAGE 3 per period 2-7 days
WET 3 per period 3-7 days
Jun-Nov 55 ML/d
DROUGHT 1 per period 3 days Provide variable flow for fish movement and diversity of habitat. Also flushes surface sediments from hard substrates for macroinvertebrates.
DRY 3 per period 3 days AVERAGE 5 per period 5 days
WET 5 per period 7 days
May - Jun
160 ML/d
DRY 1 per period 1 day Disturb the algae/bacteria/organic biofilm present on rock or wood debris to support macroinvertebrate communities increase biomass and species diversity.
AVERAGE 2 per period 2 days
WET 3 per period 3 days
Bankfull Any 400 ML/d AVERAGE
1 per period, or natural 2 days
Inundate riparian vegetation to maintain condition and facilitate recruitment. Entrain organic debris in the channel to support macroinvertebrates. Maintain structural integrity of channel. WET
Overbank
Aug-Nov
1,000 ML/d
WET
1 per year
1 day
Inundate floodplain vegetation to maintain condition and facilitate recruitment. Entrain organic debris from the floodplain to support macroinvertebrates. Maintains floodplain geomorphic features.
Table 9: Environmental flow recommendations and relationship with environmental objectives for Burnt Creek Reach 2 (lower Burnt Creek). Compliance Point: Not Present
Flow component Period Magnitude Condition Frequency Duration Objectives achieved

185
Flow component Period Magnitude Condition Frequency Duration Objectives achieved
Bankfull Any 45 ML/d or natural
AVERAGE 1 per period, or natural
2 days
Inundate riparian vegetation to maintain condition and facilitate recruitment. Entrain organic debris in the channel to support macroinvertebrates. Maintain structural integrity of channel. WET
Overbank Aug - Nov 90 ML/d WET 1 per
period 1 day
Inundate floodplain vegetation to maintain condition and facilitate recruitment. Entrain organic debris from the floodplain to support macroinvertebrates. Maintains floodplain geomorphic features.
Table 10: Environmental flow recommendations and relationship with environmental objectives for Yarriambiack Creek. Compliance Point: Yarriambiack Creek at Murtoa (415241)
Flow component Period Magnitude Condition Frequency Duration Objectives achieved
Bankfull Any 40 ML/d
AVERAGE 1 per period, or natural
2 days
Inundate riparian vegetation to maintain condition and facilitate recruitment. Maintain structural integrity of channel. WET
Overbank Aug - Nov 200 ML/d WET 1 per
period 1 day
Inundate floodplain vegetation to maintain condition and facilitate recruitment. Maintains floodplain geomorphic features.
Table 11: Environmental flow recommendations for lake full events (378 GL) and relationship with environmental objectives for Lake Hindmarsh
Event Duration Recurrence
Interval (years)
Ecological Objectives
Red Gum age structure
Red Gum persistence
Viability of visiting fauna population
Aquatic ecosystem
maturity in full lake events
6 months 5 24 months 10 36 months 20
Table 12: Environmental flow recommendations and relationship with environmental objectives for Outlet Creek (from Lake Hindmarsh to Lake Albacutya)
Flow Event Duration
Recurrence Interval (years)
Ecological Objectives
Red Gum age structure
Red Gum persistence
Viability of visiting fauna
population
Aquatic ecosystem
maturity in full lake events
>10 GL/month 3 months 5
> 57 GL/month 2 months 10
Table 13: Environmental flow recommendations for lake full events (230 GL) and relationship with environmental objectives for Lake Albacutya
Event Duration Recurrence
Interval (years)
Ecological Objectives
Red Gum age structure
Red Gum persistence
Viability of visiting fauna population
Aquatic ecosystem
maturity in full lake events
6 months 8 24 months 20

186
Table 14: Environmental flow recommendations for lake full events (18 GL) and relationship with environmental objectives for Lake Corrong
Event Duration (years)
Recurrence Interval (years)
Ecological Objectives
Lake dry 10 50 Maintain lake shape and depth Lake dry N/A >3 (median) Promote initial lake productivity
Lake full N/A 10 (median) 20 (maximum) Breeding by birds dependent on flooded vegetation
Lake full 3 50 Provide open water habitat Lake full N/A 10 (median) Provide complex woodland habitat at lake fringe Lake full > 2 10 Large number of waterbirds breed
Appendix 6 – Wimmera and Glenelg Rivers Environmental Entitlement: Environmental Water Sharing Rules (VEWH, 2014)
OBJECTIVES 1. Optimise environmental outcomes and maintain appropriate flexibility in the management of
the shared entitlement. 2. Provide certainty and transparency to waterway managers and communities in the process,
timing, considerations and decisions made in prioritising watering actions and committing water each year.
3. Support continuous improvement in the process for water sharing and water use over time.
PRINCIPLES 1. Optimise environmental outcomes by informing decision making with best available
information, including community knowledge and robust science. 2. Maximise adaptive management opportunities, including refining management in response
to changing conditions and new knowledge. 3. Harness local knowledge and eliminate surprises in decision making by maximising
collaboration and partnership between the CMAs and the Victorian Environmental Water Holder (VEWH).
4. Minimise inter-annual risk by actively prioritising water for carryover as appropriate and continually seeking efficiencies in water delivery.
5. Maximise water use effectiveness and opportunities for the CMAs to capitalise on seasonal conditions by committing water as soon as possible.
6. Promote open communication with stakeholders and community.
WESTERN RIVERS ADVISORY GROUP A collaborative advisory group will be established to inform decisions made by the VEWH Commission. The authority to make decisions about the Wimmera and Glenelg Rivers Environmental Entitlement, including water commitments, remains with the VEWH. The Western Rivers Advisory Group (WRAG) will principally include representatives from the VEWH, and Wimmera and Glenelg Hopkins CMAs. As required, it will also refer to a Technical Advisory Panel, and may include other parties, for instance GWMWater or the Commonwealth Environmental Water Office (CEWO). Community input will occur primarily via CMA consultation, including on seasonal watering proposals developed by May each year. There will be a primary contact from the VEWH, Wimmera CMA and Glenelg Hopkins CMA, intended to be at the Environmental Water Reserve Officer (EWRO) level. At times, for example during periods of extreme water shortage, the primary contacts may think it appropriate to invite other people from their organisations, for example CEOs or Board members. Where this is the case, the primary contacts of the other organisations should be informed prior to the meeting. Overall coordination will be carried out by the primary contact from the VEWH, and includes calling and chairing meetings and workshops. Primary contacts from other organisations may also suggest that meetings be called. Meetings may be held in person or by teleconference. Meetings are expected to be held in May, September and December of each year at a minimum, and may be

187
held monthly, or more frequently, during water shortages. It is intended to avoid unnecessary meetings where possible. The WRAG will seek to maximise outcomes associated with the environmental entitlement across all forums members are involved in (eg. GWMWater’s Storage Manager Reference Group). Terms of reference for the WRAG will be developed and maintained collaboratively between the CMAs and the VEWH. They will include details about membership, the outputs to be generated by the WRAG, and any required communication mechanisms (eg. from the primary contacts to CEOs, Boards and GWMWater’s Executive Council). It will also set out expectations of the Technical Advisory Panel. PRIORITISATION APPROACH At the heart of the environmental water sharing rules is a collective prioritisation of watering actions across the Glenelg and Wimmera catchments, based on environmental outcomes, regardless of system. This prioritisation will be done collaboratively at a workshop with the WRAG each year in May. An initial workshop will be held in late 2014 to develop a preliminary list of prioritised watering actions. After the preliminary prioritisation in 2014, any new information or changed conditions will be considered in the formal prioritisation of watering actions in the May preceding the start of the water year (and each year thereafter). This will be reviewed throughout the year as required to inform water commitments. Reviews are intended to occur monthly during water shortages. The list will include the essential rationale used to prioritise watering actions and inform VEWH Commission decisions. The VEWH Commission will commit available water supplies to the highest priority watering actions, consistent with its Statewide responsibility. In dry or drought years, it will likely be necessary to adapt watering actions, for example by reducing the flow size, duration or frequency, to optimise the environmental outcomes achieved with the available water. Risk assessment will be an active part of this process, including the possible risks to third parties, risks that environmental objectives will not be achieved, and any adverse environmental risks potentially created by watering. A range of management options will be considered to manage the frequent demand shortfalls that are likely to occur in one or both systems. These management options could include water purchases, additional monitoring to identify key risks and drought refuge protection. PRIORITISATION CRITERIA Each priority watering action will be assessed against the criteria below. These criteria are set through Government water policy, including the Victorian Waterway Management Strategy, the Western Region Sustainable Water Strategy, and the rules set by the Minister for Environment and Climate Change under section 33DZA of the Water Act 1989.
1. Extent and significance of the environmental benefit expected from the watering action. 2. Level of certainty of achieving the environmental benefit from the watering action and ability
to manage other threats. 3. The ability to provide ongoing benefits at the site at which the watering action is to take
place. 4. The water requirements of the site at which the watering is to take place, taking into
account watering history at that site and the implications of not undertaking the proposed watering action at the site.
5. Feasibility of the watering action. 6. Overall cost effectiveness of the watering action.1
ENVIRONMENTAL WATER DEMAND COMPARED TO SUPPLY THROUGH THE YEAR Figure 5 illustrates conceptually how the prioritised list of watering actions may be considered through the year. Note that this diagram is purely conceptual and does not represent all priority watering actions, any real prioritisation undertaken, or real volumes required or expected in the system. The use of the diagram will be developed through practice.
1 This criteria currently has limited relevance in the Wimmera and Glenelg systems.

188
Figure 5 Example prioritisation and water commitment NB This diagram is purely conceptual and does not represent all priority watering actions, any real prioritisation undertaken, or real volumes required or expected in the system.
The actions will be in priority order with the highest priority actions at the bottom (to be committed with the first available water). The vertical scale indicates the water supply which will be needed to provide the watering actions. At the lower end of the scale, the actions are targeted more at mitigating the risks of not watering, for example to avoid low dissolved oxygen and widespread fish deaths during droughts. At the upper end, the actions are targeted at maximising outcomes of natural conditions when there is good water availability, for example by encouraging fish recruitment. The ‘partial’ actions represent watering actions that are slightly modified (in terms of reduced size, duration or frequency) in response to low water availability; these would still meet some of the environmental objectives. The ‘remaining’ actions represent the full volume required to target the complete environmental objectives. Depending on climate conditions, there may be more than one partial watering action (ie. multiple modifications can be made, for example freshes might be first reduced in number and then in size). The VEWH Commission is only able to commit the volume of water available under the entitlement at a given time. However, as allocations are received through the year, it follows that water can be committed to more actions. For example, in Figure 5, if 5 GL of water was available at the start of the year, the VEWH would consider committing water to the priority watering actions below the 5 GL line. If later in the season, more allocation was received, for instance another 10 GL (a total of 15 GL for the year) then the priority watering actions below the 15 GL line would be considered. The prioritised list will be reviewed as required by the WRAG to account for seasonal conditions. If sufficient water is not available to commit to all priority watering actions at the start of the year, it is intended that water will be committed for use in July-September initially (if there is sufficient water available). Then water will be committed for October through to the end of the water year (again, if there is sufficient water available). This allows for an assessment in September after the inflow period, when there is a good indication of what total water availability will be. If there is insufficient water available to make commitments for these whole periods, monthly assessments and commitments will be made. An assessment of carryover priorities will also be made after the inflow period, to ensure inter-annual planning is carried out. Carryover is a very important tool to manage inter-annual risk of low water allocations and to maximise long-term outcomes. By actively planning for carryover volumes, the opportunity costs of

189
regularly having low water availability early in the year to deliver for winter-spring actions can be minimised. In planning for carryover, the priority of the next year’s watering actions is weighed against the current year’s watering actions. Where appropriate, water will be carried over to provide priority watering actions in the following year. This requires some judgement to be made about how much water might be allocated early in the following season. Water, including carryover, will be committed in the following year in line with the process outlined in these sharing rules, including consideration of current seasonal conditions and new knowledge. ANNUAL PROCESS AND CRITICAL TIMELINES The following diagram outlines the process and critical timelines each year. This process may be reviewed annually as required. Figure 6 Annual process and critical timelines.
WIMMERA AND GLENELG RIVERS ENVIRONMENTAL ENTITLEMENT: ENVIRONMENTAL WATER SHARING RULES EXPLANATORY NOTE INTRODUCTION TO THE ENVIRONMENTAL WATER SHARING RULES The VEWH carried out a review of the management arrangements under the Wimmera and Glenelg Rivers Environmental Entitlement in 2013, as required by Action 6.8 of the Western Region Sustainable Water Strategy. The review found that splitting the entitlement was not desired as it would reduce flexibility and limit the ability to prioritise water between the two systems to achieve the greatest environmental outcomes, which will vary depending upon seasonal conditions. Instead, the review recommended that environmental water sharing rules be developed to guide environmental water management decisions. Codifying the process for sharing environmental water under the entitlement provides the best environmental benefit and also increases certainty for the Glenelg Hopkins Catchment Management Authority (GHCMA) and the Wimmera Catchment Management Authority (WCMA). The key challenge in developing environmental water sharing rules is balancing certainty for the catchment management authorities (CMAs) with the flexibility required by VEWH to achieve the best possible environmental outcomes across both systems, considering water availability variability. The key elements of the water sharing rules are clear and documented:
water sharing objectives and principles prioritisation criteria and method for assessment of watering actions decision making process, timing and decision points.
The rules will be embedded in ‘operating arrangements’, an operational document agreed by the VEWH, CMAs and Grampians Wimmera Mallee Water (GWMWater).
January - February
• WRAG agree on assumptions that will underpin the CMA seasonal watering proposals (eg. contribution of unregulated and passing flows to meeting priority watering actions etc).
March
• Forecast opening allocation from GWMWater considered and assessment of likely annual use and carryover undertaken.
April
• Final seasonal watering proposals received from each CMA, including CMA prioritisation of watering actions.
May
• WRAG workshop held to collaboratively update the prioritisation of watering actions across both Wimmera and Glenelg systems, including technical expert input if required.
June
• VEWH will either reserve water for future priority demand or commit water for priority watering actions in each system as early as practical.
• Initial water commitments will be made to satisfy demands from July to September if possible, however will be dated through to the end of the water year to allow maximum devolution of management.
• If it is not possible to commit or reserve water, the VEWH will advise the CMAs and wait for the next allocation point (first Wednesday of each month).
July this year - June next year
• Assess conditions in each catchment, level of allocation and review prioritised watering actions.
• Commit more water if available and appropriate (ideally to meet full demands in both systems from October through to end of the year, if possible).
• Assess carryover priorities into the following year (from September onwards).
• Assessments to be carried out in September and December at a minimum, or more often if required due to changing priorities or low water availability. They would be carried out at a workshop or by teleconference, after the monthly water resource assessment expected on the first Wednesday of every month.

190
KEY MESSAGES The rationale for not splitting the entitlement still stands, therefore the primary objective of the
environmental water sharing rules is to optimise environmental outcomes across the two systems.
While optimising environmental outcomes, the environmental water sharing rules aim to provide as much certainty as possible to waterway managers and communities in their planning.
There is a limit to how much certainty can be provided because there will always be extreme or unexpected conditions which need to be effectively managed.
A lot has been learnt from managed environmental watering in western Victoria, but there is still much to learn. Decision making needs to adapt to this new knowledge.
The environmental water sharing rules aim to provide certainty around the collaborative and adaptive process for decisions about water commitments in each system.
This process includes the establishment of an advisory group, consisting of the two CMAs and VEWH officers, to inform VEWH Commission decisions on water commitments. The process will also include a collaborative prioritisation of all watering actions across the two systems.
Community input will occur primarily via CMA consultation, including on seasonal watering proposals developed by May each year.
The environmental water sharing rules will not address any community concerns about broader system operations (eg. water security impacts of transfers from Rocklands Reservoir), which are beyond the remit of the VEWH or CMAs.
Appendix 7 – Recommendations from Management of Environmental Flows in and through Weir Pools (Alluvium, 2014)
To achieve the objective of passing environmental flows through the weir pool the following recommendations are made:
For passing low flows through Horsham and Dimboola weir pools: When the pool water levels are at or above the dead storage level, manage the weir so that all flow entering the pool is discharged from the pool via the weir. If the flows entering the pool are known the weir should be set to operate with the head differential corresponding to that flow. When pool levels are below the dead storage level, sufficient environmental water must be provided to fill the pool to dead storage level and then release the required flow over the (open) weir. The volume of environmental water delivered to fill the pool to dead storage level could be later released (subject to evaporation and seepage losses) if and when sufficient unregulated water reaches the pool and raises the water level about the dead storage level.
For delivery of freshes downstream of the Horsham and Dimboola weir pools: Wimmera CMA must provide council with sufficient warning about the timing, volume and duration of an upcoming fresh and provide instructions for what head differential requirements over the Horsham and Dimboola weirs are required to deliver the flows. If the weir pool is below dead storage level, sufficient environmental water should be provided to fill the dead storage (as per the low flow recommendation). If the pool level is above dead storage level, but below the maximum weir operating level, then releases should be passed through the pool using all six gates to limit discharge velocities immediately downstream of the weir. When the pool level is at the maximum operating level:
o a pre-release from the pool should be made on the day before the water is due to arrive and
o the end of the fresh should be retained in the pool to “pay back” the borrowed water from the start of the event.
At the completion of the fresh, the weir pool level should be at the starting level less the estimated seepage and evaporation losses (plus any increases if a stormwater event

191
occurred during the event). Alternatively, if the water level in the pool is below the maximum operating level, the pool can be used to intentionally capture the entire fresh and release it to restore the peak in the hydrograph.
When commencing flow after a cease to flow event: When the weir pool levels are below dead storage level, sufficient environmental water should be provided to fill the dead storage (as per the low flow recommendation). All flows entering the pool above the dead storage level should be passed through to the downstream reach to meet its cease to flow requirements.
To achieve the objective of minimising the risk of algal blooms: o An optimal flushing regime should be considered to remove phytoplankton from the
weir pools more quickly than they reproduce and to prevent the water column from undergoing prolonged thermal stratification.
o Deliver and release daily inflows to the weir pools equal to one-fifth of the pool volume i.e. if Horsham weir pool is holding 300 ML then daily inflows and discharges of 60 ML/d are required (The modelling analysis shows that this is unlikely to be feasible given the volumes of water available.)
With the following considerations: Maintain weir pool ecology by:
o Allowing water levels to fluctuate seasonally o Limiting water depth variations to approximately 50 cm over a 6 month period o Controlling rates of water level rise to at or below 1-2cm per day o Reducing current rates of drawdown to prevent further bank slumping (i.e. for
Horsham, the median drawdown rate should be less than 9mm/d) o Permitting episodic draw down of water levels and complete drying (if necessary)
Provide councils with timely and specific information about what flow is required to be passed in order to minimise operational complexity and ensure smooth implementation.
Limit bank slumping and erosion at the pools by: o Limiting seepage through the banks o Minimising bank disturbance (access) o Managing pool draw down rates o Stabilising vegetation establishment o Using additional structural protection where needed.
Limit upstream flooding impacts of the weirs by opening the weirs when high rainfall events occur the (i.e. removing all drop boards, and opening all gates) in accordance with recent flood management study recommendations. Close the weirs again at the very tail end of a flood event when flow velocities have subsided and backwatering impacts are negligible to retain some water in the pool.
Recognition of the social and recreational values of the weir pool and aim to minimise changes in weir pool levels and maintain levels as high as possible.
Appendix 8 – Water Quality in the Wimmera River System
Water quality in the Wimmera River System is highly variable over space and time which has a major effect on the aquatic and vegetation communities that can be sustained. There has been a long track record of water quality monitoring on the Wimmera River System with a number of sites having over a decade of monthly water quality monitoring data. Environmental water quality objectives for the Wimmera River System have been established in SEPP (WoV) with all reaches apart from Reach 1 and part of Reach 2 of the MacKenzie River located within the Murray Western Plains Segment. Reach 1 and part of Reach 2 of the MacKenzie River is located in the Forests A segment. These values are included in Table 1.

192
Table 1: Environmental Water Quality Objectives SEPP (WoV) – 75th percentile Segment Forests A Murray and Western Plains Salinity < 500 µS/cm < 1500 µS/cm Turbidity < 5 NTU < 10 NTU Figure 1 shows the location of the long term water quality monitoring sites for the Wimmera River System. Figures 2 to 9 shows the results for salinity, dissolved oxygen (mg/L rather than % saturation) and turbidity for these sites on various reaches in the Wimmera River System. Some key points are as follows:
Water quality readings have been affected by drought (2005-2009, especially 2006 and 2008) and floods (2010-2011);
Salinity levels rise steadily further downstream, particularly downstream of Dimboola although in dry conditions salinity impacts have been noted at several upstream sites (Gross’ Bridge, Ellis’ Crossing);
Environmental water releases have been important for managing water quality since 2011; and
Nutrient levels tend to mirror turbidity levels and consequently are typically well in exceedance of SEPP (WoV) objectives.

193
Figure 1 – Location of water quality monitoring sites and SEPP (WoV) regions for the Wimmera River System

194
Figure 2 – Water quality measurements (salinity and dissolved oxygen) for Reach 3 of the Wimmera River
0.00
2.00
4.00
6.00
8.00
10.00
12.00
14.00
16.00
0
2000
4000
6000
8000
10000
12000
14000
16000
20/09/2004 2/02/2006 17/06/2007 29/10/2008 13/03/2010 26/07/2011 7/12/2012 21/04/2014 3/09/2015
Dis
solv
ed O
xyge
n (m
g/L)
Salin
ity
(µS/
cm)
Water Quality Measurements for Reach 3 Wimmera River
Riverside Salinity Horsham Weir Pool Salinity Gross Bridge Salinity
Riverside Dissolved Oxygen Horsham Weir Pool Dissolved Oxygen Gross Bridge Dissolved Oxygen

195
Figure 3 – Water quality measurements (salinity and turbidity) for Reach 3 of the Wimmera River
0
100
200
300
400
500
600
0
2000
4000
6000
8000
10000
12000
14000
16000
20/09/2004 2/02/2006 17/06/2007 29/10/2008 13/03/2010 26/07/2011 7/12/2012 21/04/2014 3/09/2015
Turb
idit
y (N
TU)
Salin
ity
(µS/
cm)
Water Quality Measurements for Reach 3 Wimmera River
Riverside Salinity Horsham Weir Pool Salinity Gross Bridge Salinity Riverside Turbidity Horsham Turbidity Gross Bridge Turbidity

196
Figure 4 – Water quality measurements (salinity and dissolved oxygen) for Reach 4 of the Wimmera River
-50
0
50
100
150
200
250
300
350
0
20000
40000
60000
80000
100000
120000
140000
160000
6/10/2003 17/02/2005 2/07/2006 14/11/2007 28/03/2009 10/08/2010 23/12/2011 6/05/2013 18/09/2014
Turb
idit
y (N
TU)
Salin
ity
(µS/
cm)
Water Quality Measurements for Reach 4 of the Wimmera River
Ellis Crossing Salinity Dimboola Weir Pool Salinity Big Bend Salinity Quantong Salinity
Jeparit Museum Salinity Downstream Antwerp Bridge Salinity Jeparit Salinity Jeparit Museum Turbidity
Downstream Antwerp Bridge Turbidity Jeparit Dissolved Turbidity Ellis Crossing Turbidity Dimboola Weir Pool Turbidity
Big Bend Turbidity Quantong Turbidity
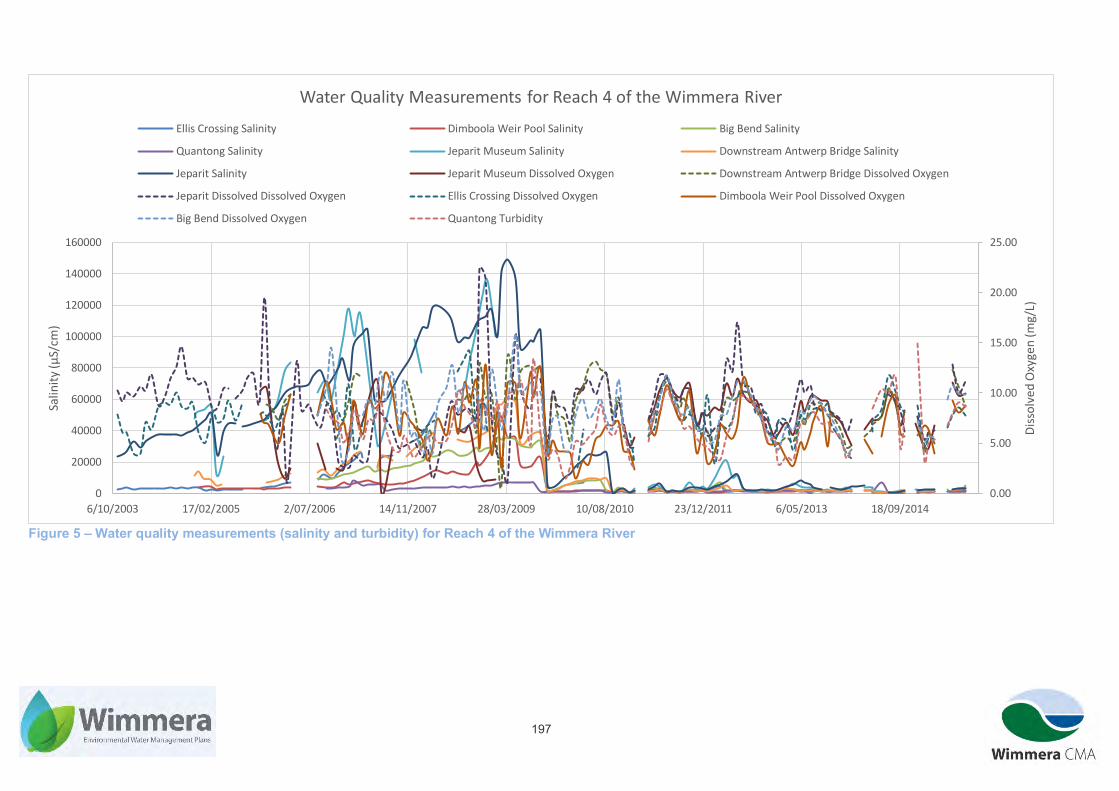
197
Figure 5 – Water quality measurements (salinity and turbidity) for Reach 4 of the Wimmera River
0.00
5.00
10.00
15.00
20.00
25.00
0
20000
40000
60000
80000
100000
120000
140000
160000
6/10/2003 17/02/2005 2/07/2006 14/11/2007 28/03/2009 10/08/2010 23/12/2011 6/05/2013 18/09/2014
Dis
solv
ed O
xyge
n (m
g/L)
Salin
ity
(µS/
cm)
Water Quality Measurements for Reach 4 of the Wimmera River
Ellis Crossing Salinity Dimboola Weir Pool Salinity Big Bend Salinity
Quantong Salinity Jeparit Museum Salinity Downstream Antwerp Bridge Salinity
Jeparit Salinity Jeparit Museum Dissolved Oxygen Downstream Antwerp Bridge Dissolved Oxygen
Jeparit Dissolved Dissolved Oxygen Ellis Crossing Dissolved Oxygen Dimboola Weir Pool Dissolved Oxygen
Big Bend Dissolved Oxygen Quantong Turbidity

198
Figure 6 – Water quality measurements (salinity and dissolved oxygen) for Lower Mt William Creek
0.00
2.00
4.00
6.00
8.00
10.00
12.00
0
500
1000
1500
2000
2500
3000
3500
4000
4500
18/11/2010 6/06/2011 23/12/2011 10/07/2012 26/01/2013 14/08/2013 2/03/2014 18/09/2014 6/04/2015 23/10/2015
Dis
solv
ed O
xyge
n (m
g/L)
Salin
ity
(µS/
cm)
Water Quality Measurements for Lower Mt William Creek
Morgan's Bridge Salinity Morgan's Bridge Dissolved Oxygen

199
Figure 7 – Water quality measurements (salinity and turbidity) for Lower Mt William Creek
0
20
40
60
80
100
120
0
500
1000
1500
2000
2500
3000
3500
4000
4500
18/11/2010 6/06/2011 23/12/2011 10/07/2012 26/01/2013 14/08/2013 2/03/2014 18/09/2014 6/04/2015 23/10/2015
Turb
idit
y (N
TU)
Salin
ity
(µS/
cm)
Water Quality Measurements for Lower Mt William Creek
Morgan's Bridge Salinity Morgan's Bridge Turbidity

200
Figure 8 – Water quality measurements (salinity and dissolved oxygen) for Reach 2 MacKenzie River
0.00
2.00
4.00
6.00
8.00
10.00
12.00
14.00
16.00
0
100
200
300
400
500
600
700
800
900
9/11/2004 24/03/2006 6/08/2007 18/12/2008 2/05/2010 14/09/2011 26/01/2013 10/06/2014 23/10/2015
Dis
solv
ed O
xyge
n (m
g/L)
Salin
ity
(µS/
cm)
Water Quality Measurements for Reach 2 MacKenzie River
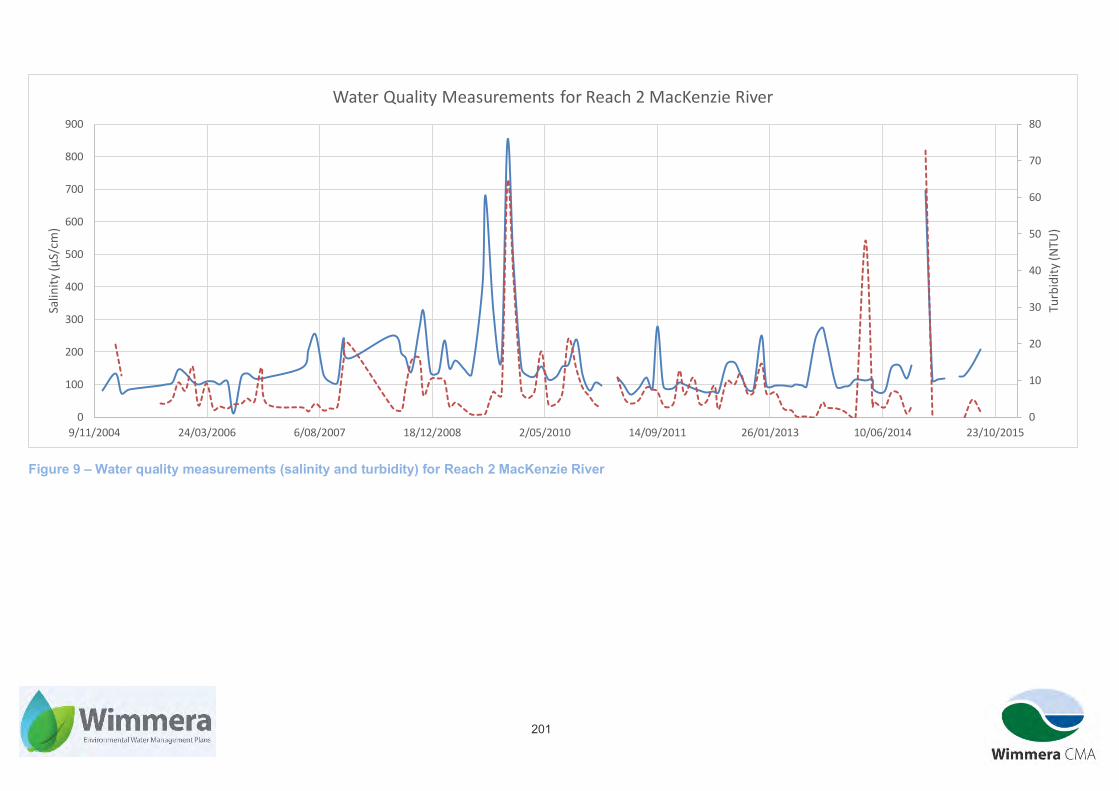
201
Figure 9 – Water quality measurements (salinity and turbidity) for Reach 2 MacKenzie River
0
10
20
30
40
50
60
70
80
0
100
200
300
400
500
600
700
800
900
9/11/2004 24/03/2006 6/08/2007 18/12/2008 2/05/2010 14/09/2011 26/01/2013 10/06/2014 23/10/2015
Turb
idit
y (N
TU)
Salin
ity
(µS/
cm)
Water Quality Measurements for Reach 2 MacKenzie River

202
Appendix 9 – Risk/Consequence Table