Environmental Tobacco Smoke - National Toxicology … · 4.2.2 Interactions of cigarette smoke with...
103
FINAL Report on Carcinogens Background Document for Environmental Tobacco Smoke December 2 - 3, 1998 Meeting of the NTP Board of Scientific Counselors Report on Carcinogens Subcommittee Prepared for the: U.S. Department of Health and Human Services Public Health Services National Toxicology Program Research Triangle Park, North Carolina 27709 Prepared by: Technology Planning and Management Corporation Canterbury Hall, Suite 310 4815 Emperor Boulevard Durham, NC 27703 Contract Number NOI-ES-85421
-
Upload
vuongtuong -
Category
Documents
-
view
214 -
download
0
Transcript of Environmental Tobacco Smoke - National Toxicology … · 4.2.2 Interactions of cigarette smoke with...

FINAL
Report on Carcinogens Background Document for
Environmental Tobacco Smoke
December 2 - 3, 1998
Meeting of the NTP Board of Scientific Counselors Report on Carcinogens Subcommittee
Prepared for the: U.S. Department of Health and Human Services Public Health Services National Toxicology Program Research Triangle Park, North Carolina 27709
Prepared by: Technology Planning and Management Corporation Canterbury Hall, Suite 310 4815 Emperor Boulevard Durham, NC 27703 Contract Number NOI-ES-85421

RoC Background Document for Environmental Tobacco Smoke
Table of Contents Summary Statement..................................................................................................................v
1 Physical and Chemical Properties ......................................................................................1
1.1 Chemical Identification...........................................................................................1 2 Human Exposure.................................................................................................................9
2.1 Biomarkers of Exposure..........................................................................................9 2.1.1 Nicotine and Cotinine...............................................................................9 2.1.2 Carbon Monoxide and Carboxyhemoglobin ...........................................10 2.1.3 Thioethers ..............................................................................................10 2.1.4 Thiocyanate............................................................................................10 2.1.5 Tobacco-Specific N-Nitrosamines..........................................................10
2.2 Environmental Exposure.......................................................................................11 2.3 Occupational Exposure .........................................................................................17
2.3.1 Restaurants.............................................................................................17 2.3.2 Bars .......................................................................................................17 2.3.3 Airplanes................................................................................................17
2.4 Regulations...........................................................................................................21 3 Human Studies ..................................................................................................................23
3.1 IARC report of 1986 (Appendix 3A).....................................................................23 3.2 U.S. EPA report of 1992 (Appendix 3B) ...............................................................24 3.3 California EPA report of 1997 (Appendix 3C) ......................................................24 3.4 Current Epidemiology Studies ..............................................................................25
3.4.1 Total Cancers: .............................................................................................25 3.4.2 Lung Cancer: ..............................................................................................25 3.4.3 Bladder Cancer: ..........................................................................................27 3.4.4 Breast Cancer:.............................................................................................27 3.4.5 Cervical Cancer:..........................................................................................27 3.4.6 Nasal Sinus Cancer: ....................................................................................27 3.4.7 Childhood Cancers:.....................................................................................28
3.4.7.1 All cancers combined: .................................................................................. 28 3.4.7.2 Childhood brain cancer: ............................................................................... 28 3.4.7.2 Childhood lymphomas/leukemias: .............................................................. 29
3.5 Discussion ............................................................................................................40 4 Studies of Cancer in Experimental Animals ....................................................................43
4.1 Summary of Earlier Experiments ..........................................................................43 4.1.1 Exposure of laboratory animals to tobacco smoke by inhalation .............43 4.1.2 Tobacco smoke condensate ....................................................................43
4.2 Experiments Conducted Since the Last Review.....................................................43 4.2.1 Exposure of laboratory animals to tobacco smoke by the inhalation route
...............................................................................................................43
i

RoC Background Document for Environmental Tobacco Smoke
4.2.2 Interactions of cigarette smoke with known carcinogens ........................49 5 Genotoxicity.......................................................................................................................52
5.1 Prokaryotic Systems .............................................................................................52 5.1.1 Induction of Mutation in Salmonella typhimurium .................................52
5.2 Mammalian Systems.............................................................................................53 5.2.1 Sister Chromatid Exchange ...................................................................53 5.2.2 DNA Adducts ........................................................................................53
6 Mechanistic and Relevant Studies ....................................................................................55
6.1 Administration of tobacco-smoke condensate .......................................................55 6.2 Carcinogenicity of tobacco-specific carcinogens...................................................57 6.3 Metabolism of tobacco-specific nitrosamines........................................................57
7 References..........................................................................................................................60
Appendix 3A - IARC (1986)…………………………………………………..bound separately
Appendix 3B - U.S. EPA (1992)..……………………………………………..bound separately Appendix 3C - California EPA (1997)………………………………………..bound separately
Appendix 1 ..............................................................................................................................76
Appendix 2 ..............................................................................................................................90
ii
RoC Background Document for Environmental Tobacco Smoke
List of Tables
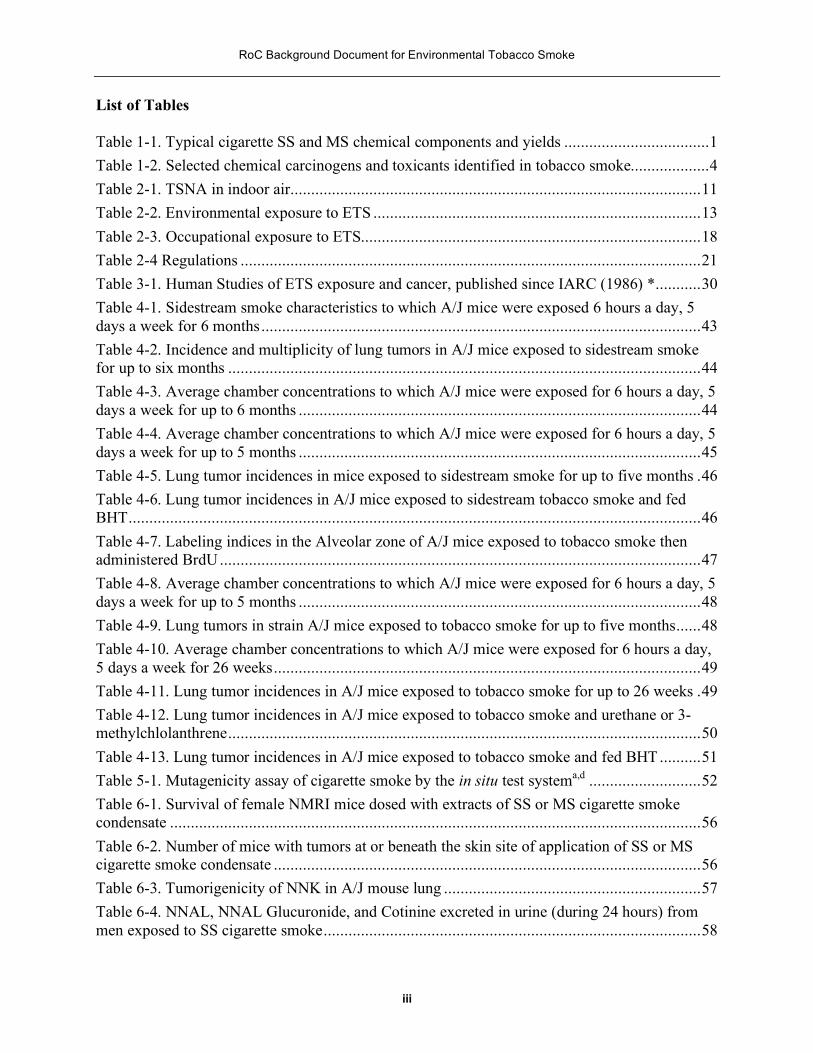
Table 1-1. Typical cigarette SS and MS chemical components and yields ...................................1
Table 1-2. Selected chemical carcinogens and toxicants identified in tobacco smoke...................4
Table 2-1. TSNA in indoor air...................................................................................................11
Table 2-2. Environmental exposure to ETS ...............................................................................13
Table 2-3. Occupational exposure to ETS..................................................................................18
Table 2-4 Regulations ...............................................................................................................21
Table 3-1. Human Studies of ETS exposure and cancer, published since IARC (1986) *...........30
Table 4-1. Sidestream smoke characteristics to which A/J mice were exposed 6 hours a day, 5 days a week for 6 months..........................................................................................................43
Table 4-2. Incidence and multiplicity of lung tumors in A/J mice exposed to sidestream smoke for up to six months ..................................................................................................................44
Table 4-3. Average chamber concentrations to which A/J mice were exposed for 6 hours a day, 5 days a week for up to 6 months .................................................................................................44
Table 4-4. Average chamber concentrations to which A/J mice were exposed for 6 hours a day, 5 days a week for up to 5 months .................................................................................................45
Table 4-5. Lung tumor incidences in mice exposed to sidestream smoke for up to five months .46
Table 4-6. Lung tumor incidences in A/J mice exposed to sidestream tobacco smoke and fed BHT..........................................................................................................................................46
Table 4-7. Labeling indices in the Alveolar zone of A/J mice exposed to tobacco smoke then administered BrdU....................................................................................................................47
Table 4-8. Average chamber concentrations to which A/J mice were exposed for 6 hours a day, 5 days a week for up to 5 months .................................................................................................48
Table 4-9. Lung tumors in strain A/J mice exposed to tobacco smoke for up to five months......48
Table 4-10. Average chamber concentrations to which A/J mice were exposed for 6 hours a day, 5 days a week for 26 weeks.......................................................................................................49
Table 4-11. Lung tumor incidences in A/J mice exposed to tobacco smoke for up to 26 weeks .Table 4-12. Lung tumor incidences in A/J mice exposed to tobacco smoke and urethane or 3-
49
methylchlolanthrene..................................................................................................................50
Table 4-13. Lung tumor incidences in A/J mice exposed to tobacco smoke and fed BHT ..........51
Table 5-1. Mutagenicity assay of cigarette smoke by the in situ test systema,d ...........................52
Table 6-1. Survival of female NMRI mice dosed with extracts of SS or MS cigarette smoke condensate ................................................................................................................................56
Table 6-2. Number of mice with tumors at or beneath the skin site of application of SS or MS cigarette smoke condensate .......................................................................................................56
Table 6-3. Tumorigenicity of NNK in A/J mouse lung ..............................................................57
Table 6-4. NNAL, NNAL Glucuronide, and Cotinine excreted in urine (during 24 hours) from men exposed to SS cigarette smoke...........................................................................................58
iii

RoC Background Document for Environmental Tobacco Smoke
iv
RoC Background Document for Environmental Tobacco Smoke
Summary Statement
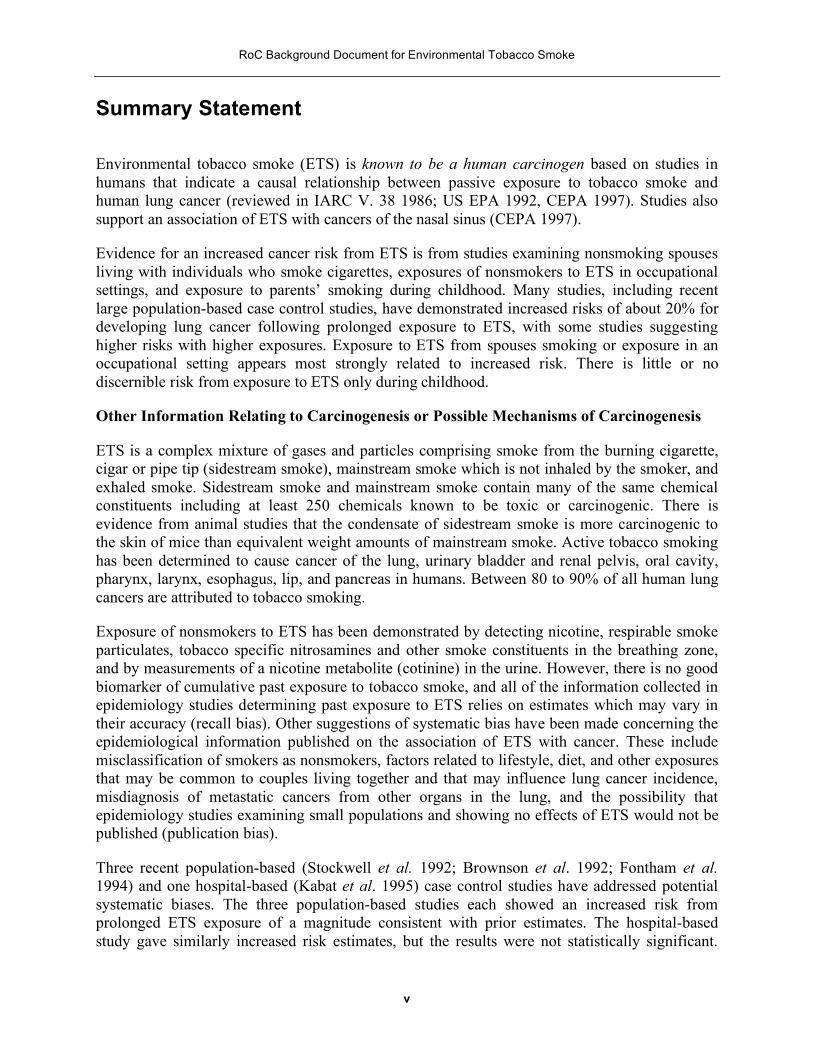
Environmental tobacco smoke (ETS) is known to be a human carcinogen based on studies in humans that indicate a causal relationship between passive exposure to tobacco smoke and human lung cancer (reviewed in IARC V. 38 1986; US EPA 1992, CEPA 1997). Studies also support an association of ETS with cancers of the nasal sinus (CEPA 1997).
Evidence for an increased cancer risk from ETS is from studies examining nonsmoking spouses living with individuals who smoke cigarettes, exposures of nonsmokers to ETS in occupational settings, and exposure to parents’ smoking during childhood. Many studies, including recent large population-based case control studies, have demonstrated increased risks of about 20% for developing lung cancer following prolonged exposure to ETS, with some studies suggesting higher risks with higher exposures. Exposure to ETS from spouses smoking or exposure in an occupational setting appears most strongly related to increased risk. There is little or no discernible risk from exposure to ETS only during childhood.
Other Information Relating to Carcinogenesis or Possible Mechanisms of Carcinogenesis
ETS is a complex mixture of gases and particles comprising smoke from the burning cigarette, cigar or pipe tip (sidestream smoke), mainstream smoke which is not inhaled by the smoker, and exhaled smoke. Sidestream smoke and mainstream smoke contain many of the same chemical constituents including at least 250 chemicals known to be toxic or carcinogenic. There is evidence from animal studies that the condensate of sidestream smoke is more carcinogenic to the skin of mice than equivalent weight amounts of mainstream smoke. Active tobacco smoking has been determined to cause cancer of the lung, urinary bladder and renal pelvis, oral cavity, pharynx, larynx, esophagus, lip, and pancreas in humans. Between 80 to 90% of all human lung cancers are attributed to tobacco smoking.
Exposure of nonsmokers to ETS has been demonstrated by detecting nicotine, respirable smoke particulates, tobacco specific nitrosamines and other smoke constituents in the breathing zone, and by measurements of a nicotine metabolite (cotinine) in the urine. However, there is no good biomarker of cumulative past exposure to tobacco smoke, and all of the information collected in epidemiology studies determining past exposure to ETS relies on estimates which may vary in their accuracy (recall bias). Other suggestions of systematic bias have been made concerning the epidemiological information published on the association of ETS with cancer. These include misclassification of smokers as nonsmokers, factors related to lifestyle, diet, and other exposures that may be common to couples living together and that may influence lung cancer incidence, misdiagnosis of metastatic cancers from other organs in the lung, and the possibility that epidemiology studies examining small populations and showing no effects of ETS would not be published (publication bias).
Three recent population-based (Stockwell et al. 1992; Brownson et al. 1992; Fontham et al. 1994) and one hospital-based (Kabat et al. 1995) case control studies have addressed potential systematic biases. The three population-based studies each showed an increased risk from prolonged ETS exposure of a magnitude consistent with prior estimates. The hospital-based study gave similarly increased risk estimates, but the results were not statistically significant.
v

RoC Background Document for Environmental Tobacco Smoke
The potential for publication bias has been examined and dismissed (CEPA 1997), and the reported absence of increased risk for lung cancer for nonsmokers exposed only in occupational settings has been found not to be the case when the analysis is restricted to higher quality studies (Wells 1998). Thus, factors related to chance, bias, and/or confounding have been adequately excluded, and exposure to ETS is established as causally related to human lung cancer.
vi

RoC Background Document for Environmental Tobacco Smoke
1 Physical and Chemical Properties 1.1 Chemical Identification Environmental Tobacco Smoke (ETS) is the sum of sidestream smoke (SS) (interval between puffs), mainstream smoke (MS) emitted at the cigarette mouthpiece during inhalation, compounds diffused through the wrapper, and MS that the smoker exhales (NRC 1986; U.S. EPA 1992; CEPA 1997). Tobacco pyrolysis products are formed both during smoke inhalation and during the interval between inhalations (NRC 1986). Tobacco smoke consists of a complex mixture of gases and particles. Appendix 1 lists the chemicals identified in MS and SS and their concentrations. Carcinogenic nitrosamines have also been quantified. The submicronic and exhaled particles from burning tobacco originate mainly from condensation of the vapors and are high in organic matter content. Upon emission into air, SS may undergo dilution; chemical reactions, including oxidation and reactions between components; deposition; and other chemical and physical changes (U.S. EPA 1992; NRC 1986; CEPA 1997).
One half, or more (by weight), of the smoke generated by a lit cigarette is SS emitted from the smoldering cigarette (U.S. EPA 1992). SS and MS contain many of the same chemical constituents because they originate from similar processes. ETS contains more than 4,000 chemicals. Among these, at least 200 are toxic and 43 were known carcinogens as identified in the 1992 EPA review. Approximately 400 compounds have been quantified in both MS and SS smoke. Although many constituents of MS and SS are the same, their emission rates vary as shown in Table 1-1 (U.S. EPA 1992).
Table 1-1. Typical cigarette SS and MS chemical components and yields
Component Sidestream Mainstream Reference
Tar 24.1 mg 11.4 mg Rickert et al. (1984)
Carbon monoxide 53.0 mg 12.0 mg Rickert et al. (1984)
Carbonyl sulfide 2-3 mg 23-66 mg CIB (1991) Hoffmann and Hecht (1989)
3-Vinylpyridine 300-450 µg 12.5-13.20 µg CIB (1991) Hoffmann and Hecht (1989)
Hydrogen Cyanide 14-110 µg 233-275 µg CIB (1991) Hoffmann and Hecht (1989)
Hydrazine 90 ng 30 ng CIB (1991) Hoffmann and Hecht (1989)
Nitrogen oxides 500-2000 µg 135-156 µg CIB (1991) Hoffmann and Hecht (1989)
Nicotine 4.1 mg 0.8 mg Rickert et al. (1984)
1

RoC Background Document for Environmental Tobacco Smoke
Component Sidestream Mainstream Reference
Nitric oxide 2-3 mg 0.2-0.5 mg Norman et al. (1983) Volatile hydrocarbons Ethene Propene 1,3-Butadiene Isoprene Formaldehyde
1.2 mg 1.3 mg 0.4 mg 3.1 mg 1500 µg
0.24 mg 0.18 mg 0.03 mg 0.70 mg 30 µg
Lofroth et al. (1987) Elmenhorst and Schultz (1968) CIB (1991) Hoffmann and Hecht (1989)
Aromatic Compounds Benzene Fluoranthene Benzo[a]pyrene o-Toluidine 2-Napthylamine Quinoline
400-500 µg
1.3 µg
0.2 µg
3.0 µg
0.06 µg
18 µg
50 µg
0.27 µg
0.04 µg
0.16 µg
0.002 µg
1.7 µg
Grimmer et al. (1977) Patrianakos and Hoffmann (1979) Dong et al. (1978) CIB (1991) Hoffmann and Hecht (1989)
N-Nitrosamines Nitrosodimethylamine Nitrosonornicotine N-nitrosopyrrolidine N-nitrosodiethanolamine
0.2-1 µg
0.15-1.7 µg 30-390 ng 43 ng
0.01-0.04 µg
0.1-1 µg 3.25-5 ng 35.8 ng
Hoffmann et al. (1984) CIB (1991) Hoffmann and Hecht (1989)
Phenol 70-250 µg 54-83 µg CIB (1991) Hoffmann and Hecht (1989)
Catechol 58-290 µg 22.6-86.5 µg CIB (1991) Hoffmann and Hecht (1989)
4-Aminobiphenyl 140 ng 4.5 ng CIB (1991) Hoffmann and Hecht (1989)
Benz[a] anthracene 40-200 ng 20-50 ng CIB (1991) Hoffmann and Hecht (1989)
NNK 0.2-1.4 µg 0.06-0.2 µg CIB (1991) Hoffmann and Hecht (1989)
Cadmium 0.72 µg 0.1 µg CIB (1991) Hoffmann and Hecht (1989)
2

RoC Background Document for Environmental Tobacco Smoke
Component Sidestream Mainstream Reference
Nickel 0.2-2.55 µg 0.015-0.085 µg CIB (1991) Hoffmann and Hecht (1989)
Radioactive isotopes Po-210
0.004 Bq 0.003 Bq Ferri and Baratta (1992)
Many polycyclic aromatic hydrocarbons (PAH) have been detected in tobacco smoke (Grimmer et al. 1977; IARC 1986). Unsubstituted PAH and alkyl derivatives of PAH have been detected. Several aromatic amines, including the carcinogens o-toluidine, 2-napthylamine, and 4-aminobiphenyl, have been identified in both SS and MS.
The concentration of chemicals in MS depends on various factors, including the cigarette design (e.g., presence of filter and filter ventilation), smoking patterns, and cigarette brands. In 1992, the U.S. EPA suggested that the SS chemical concentration is relatively constant across a number of products (U.S. EPA 1992). This is consistent with the finding that SS concentrations are primarily related to the weight of tobacco and paper consumed during smoldering, rather than to cigarette design (Guerin et al. 1987).
A number of chemicals present in ETS are known or suspected toxicants/irritants with various acute health effects. Prominent among them are the respiratory irritants: ammonia, formaldehyde, and sulfur dioxide. Acrolein, hydrogen cyanide, and formaldehyde affect mucociliary function and, at higher concentrations, can inhibit smoke clearance from the lungs (Battista 1976). Nicotine is addictive and has several pharmacological and toxicological actions, including acute poisoning. Nitrogen oxides and phenol are important toxicants present in ETS. Over 50 compounds in ETS have been identified as known, or reasonably anticipated to be, human carcinogens by various agencies (IARC 1986; CEPA 1997; NRC 1986; U.S.EPA 1992; RoC 1997: http://ehis.niehs.nih.gov/roc/). Most of these compounds are present in the particulate phase (IARC 1986). The following components of ETS, summarized in Table 1-2, have been characterized as toxic and/or carcinogenic.
3

RoC Background Document for Environmental Tobacco Smoke
Table 1-2. Selected chemical carcinogens and toxicants identified in tobacco smoke
Compound Sidestream conc.
Mainstream conc.
CASRN Mol. Wt. Structure Classification Reference
Acetaldehyde C2H4O np np 75-07-0 44.053 O
H
2B CEPA (1997)
Acetamide C2H5NO 86-156 µg/cig 70-111µg/cig 60-35-5 59.068
NH2
O 2B Sakuma et al. (1984)
Acrylonitrile C3H3N np Np 107-13-1 53.063
N
2A CEPA (1997)
4-Aminobiphenyl C12H11N
np Np 92-67-1 169.23 NH
2
1 CEPA (1997)
o-Anisidine C7H9NO np Np 94-04-0 123.15 NH2
O
2B CEPA (1997)
Benz[a]anthracene C18H12
201 ng/cig (P) 2.5 ng/cig (V)
13.3 ng/cig (P) 0.09 ng/cig (V)
56-55-3 228.29 2A Grimmer et al. (1987)
Benzene C6H6 400-500 µg/cig a 12-48 µg/cig b 71-43-2 78.113 1 a: CIB (1991) b: NRC (1986)
1,3 Butadiene C4H6 np Np 106-99-0 54.091 C CEPA (1997)
Benzo[a]pyrene C20H12 199 ng/cig 44 ng/cig 50-32-8 252.31 2A Grimmer et al. (1977)
4

RoC Background Document for Environmental Tobacco Smoke
Compound Sidestream conc.
Mainstream conc.
CASRN Mol. Wt. Structure Classification Reference
Benzo[b]fluoranthene C20H12
np np 205-99-2 252.31 2B CEPA (1997)
Benzo[j]fluoranthene C20H12
np np 205-82-3 252.31 2B CEPA (1997)
Benzo[k]fluoranthene C20H12
np np 207-08-9 252.31 2B CEPA (1997)
Chrysene C18H12 np np 218-01-9 228.29 C CEPA (1997)
Dibenz[a,h]acridine C21H13N
np np 226-36-8 279.34
N
2B CEPA (1997)
Dibenz[a,j]acridine C21H13N
np np 224-42-0 279.34
N
2B CEPA (1997)
Dibenz[a, j]anthracene C22H14
41 ng/cig 11 ng/cig 224-41-9 278.35 2A Grimmer et al. (1977)
7H-Dibenzo[c,g]carbazole
np np 194-59-2 267.33
NH
2B CEPA (1997)
Dibenzo[a,e]pyrene C24H14
np np 192-65-4 302.37 2B CEPA (1997)
5

RoC Background Document for Environmental Tobacco Smoke
Compound Sidestream conc.
Mainstream conc.
CASRN Mol. Wt. Structure Classification Reference
Dibenzo[a,h]pyrene C24H14
np np 189-64-0 302.37 2B CEPA (1997)
Dibenzo[a,i]pyrene C24H14
np np 191-30-0 302.37 2B CEPA (1997)
1,1-Dimethylhydrazine C2H8N2
np np 57-14-7 60.099 N
NH2
2B CEPA (1997)
Formaldehyde CH2O 80-110 ppm a 70-100 µg/cig b 50-00-0 30.026
H H
O 2A a: Ayer and Yeager (1982) b: NRC (1986)
Hydrazine H4N2 94.2 ng/cig 31.5 ng/cig 302-01-2 32.045 NH2
NH2 2B Liu et al. (1974)
Indeno[1, 2, 3-cd]pyrene C22H12
51 ng/cig (P) 0.36 ng/cig (V)
8.1 ng/cig (P) 0.17 ng/cig (V)
193-39-5 276.34 2B Grimmer et al. (1987)
4-(methylnitrosamino)-1-(3-pyridyl)-1-butanone (NNK) C10H13N3O2
201-540 ng/cig 46-240 ng/cig 64091-91-4 207.23 N
O
N
NO
2B Brunnemann et al. (1983)
2-Naphthylamine C10H9N
np np 91-59-8 143.19 NH2 1 CEPA (1997)
2-Nitropropane C3H7NO2
np np 79-46-9 89.094 N
O+
O 2B CEPA (1997)
6

RoC Background Document for Environmental Tobacco Smoke
Compound Sidestream conc.
Mainstream conc.
CASRN Mol. Wt. Structure Classification Reference
Nitrosodiethylamine, N’-C4H10N2O
8.2-73 ng/cig 1.8-4.8 ng/cig 55-18-5 102.14 N
N
O
2A Brunnemann and Hoffmann (1978)
Nitrosodimethylamine, N’- C2H6N2O
680-1040 ng/cig 1.7-97 ng/cig 65-75-9 74.082
N
N
O
2B Brunnemann and Hoffmann (1978)
N′-Nitrosonornicotine C9H11N3O
110-390 ng/cig 81-390 ng/cig 16543-55-8 177.21 N
N
N
O 2B Brunnemann et al. (1982)
Nitrosopyrrolidine C4H8N2O
204-612 ng/cig 28-143 ng/cig 80-500 ng/cig
1.5-29 ng/cig 2.6-52 ng/cig
930-55-2 100.12 NN
O 2B Brunnemann and Hoffmann (1978)
Styrene C8H8 np np 100-42-5 104.15 2B CEPA (1997)
2-Toluidine C7H9N 3 µg/ciga 160 ng/cig b 95-53-4 107.15 NH
2
2B a: CIB (1991) b: NRC (1986)
Urethane C3H7NO2 np np 51-79-6 89.094 O NH
2
O 2B CEPA (1997)
Vinyl Chloride C2H3Cl np np 75-01-4 62.499 Cl
1 CEPA (1997)
Arsenic As np np 7440-38-2 74.9216 As 1 CEPA (1997)
Cadmium Cd 0.72 µg/ciga 100 ng/cigb 7440-43-9 112.41 Cd 2A a: CIB (1991) b: NRC (1986)
7

RoC Background Document for Environmental Tobacco Smoke
Compound Sidestream conc.
Mainstream conc.
CASRN Mol. Wt. Structure Classification Reference
Chromium VI np np 18540-29-9 51.996 Cr+6 1 CEPA (1997)
Lead [Pb] np np 7439-92-1 207.2 Pb 2B CEPA (1997)
Nickel [Ni] 0.2-2.55 µg/ciga 20-80 ng/cigb 7440-02-0 58.6934 Ni 1 a: CIB (1991) b: NRC (1986)
conc.: concentration, cig: cigarette, np: not provided, P: Particulate phase, V: Volatile phase Classification: 1, Carcinogenic to humans; 2A, Probably carcinogenic to humans; 2B, possibly carcinogenic to humans (IARC Classification). C, probable human carcinogen (U.S. EPA Classification). D, Chemicals listed under proposition 65 known to cause cancer or reproductive toxicity (CEPA 1997).
8

RoC Background Document for Environmental Tobacco Smoke
2 Human Exposure The National Institute of Occupational Safety and Health (NIOSH) estimated approximately 29% of the U.S. adult population smoked cigarettes in 1990 (Millar 1991). The prevalence of smoking in the population affects potential exposures to Environmental Tobacco Smoke (ETS). Recent studies in California found that 62% of the total populace (including 46% of nonsmokers), aged 12 years or more, reported exposure to ETS on any given day (Jenkins et al. 1992; cited by Branoff et al. 1998). NIOSH estimated, based on urinary adduct concentration data, that nonsmokers are exposed to ETS equivalent to smoking 0.1 to 1.0 cigarettes a day (Millar 1991). Based on analyzing respirable suspended particles (RSP) (3.5 µm diameter), Jenkins et al. (1996) found that nonsmoking individuals working in smoking environments were more heavily exposed to ETS than those working in nonsmoking environments. They further found that exposure of nonsmokers to their spouses smoking resulted in exposures a factor of two to four times higher than those exposed to ETS in the workplace. Nicotine and RSP concentrations were calculated to determine a 24-hour time weighted average (TWA).
2.1 Biomarkers of Exposure Various biomarkers may be used to gauge ETS exposure in humans. Cotinine, a metabolite of nicotine, is among the most commonly used. Thiocyanate, carbon monoxide, and tobacco-specific N-nitrosamines are also used to estimate exposure to ETS. Some of these biomarkers have limited usefulness because they have short half-lives in the body. These measurements can provide inflated exposure estimates when environmental influences such as diet, diesel pollution, chemical plant waste, and natural burning (campfires, wood, etc.) contribute to biomarker concentrations.
2.1.1 Nicotine and Cotinine
Nicotine and its main metabolite, cotinine, are specific for tobacco and have been used to determine exposure to ETS. Cigarettes contain 1-7% nicotine by weight, and of this, 15-25% is in mainstream smoke (MS) while 40% is in sidestream smoke (SS). Nicotine is also found in exhaled smoke (approximately 50% of inhaled tobacco smoke is exhaled). The amount of nicotine in exhaled MS, however, is not considered to be significant (Curvall and Enzell 1986). Nicotine is found in common foods, including tomatoes, potatoes, eggplant, and certain teas, but the contribution of nicotine in foods appears small in relation to that from ETS (Pirkle et al. 1996). Assessments of serum samples collected as part of the NHANES III survey revealed that 91.7% of the US population over 4 years of age had detectable serum cotinine levels indicating exposure to tobacco smoke through active or passive smoking (Pirkle et al. 1996). Cotinine levels in body fluids are more typically measured than are those of nicotine because cotinine has a longer half-life (16-20 h vs. 1 h) in the body (Scherer and Richter 1997).
Hair nicotine has now become an effective and reliable marker of ETS exposure. Human hair has a high affinity for airborne nicotine and can be examined to determine exposure during a 1-2 month period. Chamber studies have revealed a linear relationship between the extent of airborne nicotine exposure and its adhesion to hair strands. This relationship has been found to hold up to four to six weeks after exposure. Levels of nicotine in the hair have been used to discriminate between smokers and nonsmokers, and between various levels of self-reported ETS exposure (Jaakkola and Jaakkola 1997).
9

RoC Background Document for Environmental Tobacco Smoke
Nicotine is primarily metabolized in the liver, but processing also takes place in the lungs and kidneys. Nicotine is transformed to cotinine by a two step process:
N
N
N
N
O H N
N
N
N
O +
Nicotine Cotinine
2.1.2 Carbon Monoxide and Carboxyhemoglobin
The presence of ETS can be estimated by measuring carboxyhemoglobin (CO-Hb) in the blood. Although CO-Hb levels can be used to estimate relative degrees of smoke inhalation, they cannot accurately measure ETS exposure. CO has many environmental sources. Humans exhale approximately 0.4 mL/h (0.5 mg/h) of CO. It also comes from the incomplete combustion of organic materials, including motor and heating fuels, and cooking oils. CO-Hb has a brief half-life (3 h) in the blood and sampling must be timed appropriately to be useful (Millar 1991).
2.1.3 Thioethers
Thioethers and mutagenic activity of urine were measured for smokers and nonsmokers. Scherer et al. (1996) discovered, in two field studies, that the amount of thioethers in urine (a proposed biomarker for exposure to electrophilic compounds) did not change significantly though a variety of conditions were observed. The study compared various factors including smoking environment, self-reported ETS exposure, cotinine presence in plasma, ETS exposure duration, nicotine on personal sampler, cotinine presence in saliva, and cotinine presence in urine. These results indicated that diet contributes significantly to thioether excretion in nonsmokers.
2.1.4 Thiocyanate
Thiocyanate (SCN) is formed when the hydrogen cyanide (HCN) from tobacco smoke is detoxified by the liver. The U.S. EPA (1992) cited the finding by Butts et al. (1974) that SCN could react with ferric ions to yield a product capable of measurement with an autoanalyzer. While SCN- has a relatively long half-life (10-14 days) and is easily measured in the body, diet can confuse attempts to estimate the levels of tobacco smoke exposure (Scherer and Richter 1997). HCN is found in almonds, beans, and maize, and can be synthesized by bacteria in the colon. Further confounding quantification, SCN is present in cabbage, turnips, mustard, and cow’s milk. The SCN levels in a nonsmoker’s serum are, ordinarily, low at about 95 µmol/L. However, with the factor of diet, this biomarker cannot always differentiate the SCN levels of a smoker or nonsmoker (Millar 1991).
2.1.5 Tobacco-Specific N-Nitrosamines
Tobacco-specific N-nitrosamines (TSNA) have been identified in ETS. Four nitrosamines (N′-nitrosonornicotine [NNN], N-nitrosoanatabine [NAT], N-nitrosoanabasine [NAB], and 4-(methylnitrosamino)-1-(3-pyridyl)-1-butanone [NNK]) have been associated with respiratory tract and pancreatic cancers. SS from domestic cigarettes has been found to contain TSNA
10
RoC Background Document for Environmental Tobacco Smoke
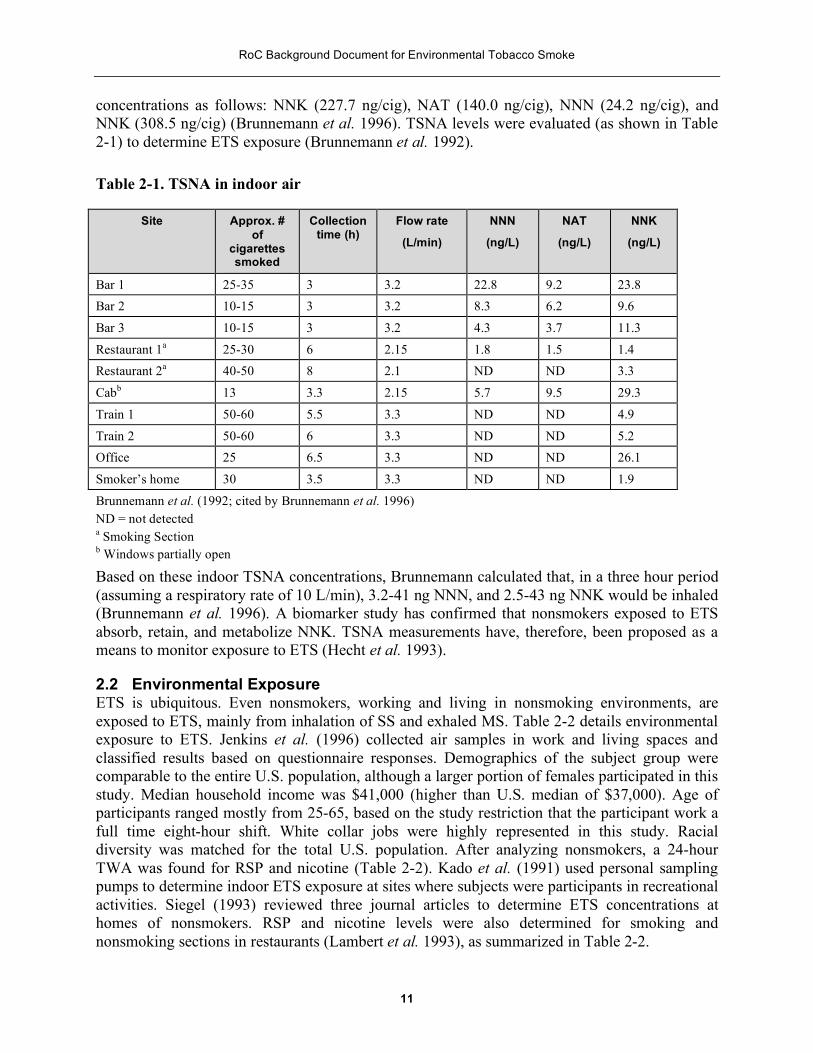
concentrations as follows: NNK (227.7 ng/cig), NAT (140.0 ng/cig), NNN (24.2 ng/cig), and NNK (308.5 ng/cig) (Brunnemann et al. 1996). TSNA levels were evaluated (as shown in Table 2-1) to determine ETS exposure (Brunnemann et al. 1992).
Table 2-1. TSNA in indoor air
Site Approx. # of
cigarettessmoked
Collection time (h)
Flow rate
(L/min)
NNN
(ng/L)
NAT
(ng/L)
NNK
(ng/L)
Bar 1 25-35 3 3.2 22.8 9.2 23.8 Bar 2 10-15 3 3.2 8.3 6.2 9.6
Bar 3 10-15 3 3.2 4.3 3.7 11.3
Restaurant 1a 25-30 6 2.15 1.8 1.5 1.4 Restaurant 2a 40-50 8 2.1 ND ND 3.3
Cabb 13 3.3 2.15 5.7 9.5 29.3
Train 1 50-60 5.5 3.3 ND ND 4.9
Train 2 50-60 6 3.3 ND ND 5.2 Office 25 6.5 3.3 ND ND 26.1
Smoker’s home 30 3.5 3.3 ND ND 1.9
Brunnemann et al. (1992; cited by Brunnemann et al. 1996) ND = not detected a Smoking Section b Windows partially open
Based on these indoor TSNA concentrations, Brunnemann calculated that, in a three hour period (assuming a respiratory rate of 10 L/min), 3.2-41 ng NNN, and 2.5-43 ng NNK would be inhaled (Brunnemann et al. 1996). A biomarker study has confirmed that nonsmokers exposed to ETS absorb, retain, and metabolize NNK. TSNA measurements have, therefore, been proposed as a means to monitor exposure to ETS (Hecht et al. 1993).
2.2 Environmental Exposure ETS is ubiquitous. Even nonsmokers, working and living in nonsmoking environments, are exposed to ETS, mainly from inhalation of SS and exhaled MS. Table 2-2 details environmental exposure to ETS. Jenkins et al. (1996) collected air samples in work and living spaces and classified results based on questionnaire responses. Demographics of the subject group were comparable to the entire U.S. population, although a larger portion of females participated in this study. Median household income was $41,000 (higher than U.S. median of $37,000). Age of participants ranged mostly from 25-65, based on the study restriction that the participant work a full time eight-hour shift. White collar jobs were highly represented in this study. Racial diversity was matched for the total U.S. population. After analyzing nonsmokers, a 24-hour TWA was found for RSP and nicotine (Table 2-2). Kado et al. (1991) used personal sampling pumps to determine indoor ETS exposure at sites where subjects were participants in recreational activities. Siegel (1993) reviewed three journal articles to determine ETS concentrations at homes of nonsmokers. RSP and nicotine levels were also determined for smoking and nonsmoking sections in restaurants (Lambert et al. 1993), as summarized in Table 2-2.
11

RoC Background Document for Environmental Tobacco Smoke
12

RoC Background Document for Environmental Tobacco Smoke
Table 2-2. Environmental exposure to ETS
Compound Tested
Area of Exposure
Exposure Levels Method of Measurement
Comment Reference
Nicotine Smoking work environment. Smoking away from work environment.
1.47 µg/m3 median; 2.98 µg/m3 mean n=157
Personal sampling pump (no flow rate given).
Demographics of the total population compared favorably to entire U.S. population. Two pumps, a workplace pump and an away-from-work pump, were used to sample atmospheric concentrations of ETS for 24 hours. 87% of participants reported smoking restrictions at work, ranging from a total ban to smoking only in a restricted area. Nicotine levels were measured using gas chromatography with temionic specific (nitrogen selective) detection.
Jenkins et al. (1996)
Nicotine Nonsmoking work environment. Smoking away from work environment.
0.473 µg/m3 median; 1.21 µg/m3 mean n=234
Personal sampling pump (no flow rate given).
Demographics of the total population compared favorably to entire U.S. population. Two pumps, a workplace pump and an away-from-work pump, were used to sample atmospheric concentrations of ETS for 24 hours. 87% of participants reported smoking restrictions at work, ranging from a total ban to smoking only in a restricted area. Nicotine levels were measured using gas chromatography with temionic specific (nitrogen selective) detection.
Jenkins et al. (1996)
Nicotine Smoking work environment. Nonsmoking away from work environment.
0.107 µg/m3 median; 0.543 µg/m3 mean n=281
Personal sampling pump (no flow rate given).
Demographics of the total population compared favorably to entire U.S. population. Two pumps, a workplace pump and an away-from-work pump, were used to sample atmospheric concentrations of ETS for 24 hours. 87% of participants reported smoking restrictions at work, ranging from a total ban to smoking only in a restricted area. Nicotine levels were measured using gas chromatography with temionic specific (nitrogen selective) detection.
Jenkins et al. (1996)
Nicotine Nonsmoking work environment. Nonsmoking away from work environment.
0.031 µg/m3 median; 0.120 µg/m3 mean
n=808
Personal sampling pump (no flow rate given).
Demographics of the total population compared favorably to entire U.S. population. Two pumps, a workplace pump and an away-from-work pump, were used to sample atmospheric concentrations of ETS for 24 hours. 87% of participants reported smoking restrictions at work, ranging from a total ban to smoking only in a restricted area. Nicotine levels were measured using gas chromatography with temionic specific (nitrogen selective) detection.
Jenkins et al. (1996)
Nicotine Casino Site 8.02 µg/m3 median Personal sampling Nonsmoking individuals were studied in two separate, Kado et al.
13

RoC Background Document for Environmental Tobacco Smoke
Compound Tested
Area of Exposure
Exposure Levels Method of Measurement
Comment Reference
(~100x100x12 feet).
Bingo Site (~100x150x16 feet).
(3.3-11-6 µg/m3 range) n=6
65.5 µg/m3 median (4.4-85.4 µg/m3 range) n=6
pumps (1.71 L/min flow rate).
indoor facilities containing smokers. Smoking policies for these two environments were not mentioned. Sampling times range from 40 minutes to 6 hours. The bingo site was classified as a “smoky environment.”
(1991)
Nicotine Smoking section restaurant.
Nonsmoking section restaurant.
3.2 µg/m3 median (1.5-3.8 µg/m3 range)
1.0 µg/m3 median (0.2-2.8 µg/m3 range)
Mass flow controlled pump (4 L/min flow rate).
Seven restaurants in Albuquerque, NM (seating capacity exceeded 100 in all restaurants) were sampled for two consecutive days for 12 hours (11:00 AM-11:00 PM). Pumps were placed within the usual breathing areas except in two restaurants. Nicotine levels in all of the restaurants were lower in nonsmoking sections than in smoking sections (P=0.02, Wilcox paired sample test) with a median difference of 2.2 µg/m3 .
Lambert et al. (1993)
Nicotine Residences. 4.3 µg/m3 mean (1.6-21 µg/m3 range) n=91
Compilation of data from three sources (Sterling et al. 1987; Guerin et al. 1992; Repace 1987).
Review of ambient air surveys on ETS from three sources. Weighted average of the individual study mean concentrations for all measurements taken. Weights used were the number of residences sampled.
Siegel (1993)
Nicotine Boeing 727-200 NS
S
2.6 µg/m3 mean (0.03-24.2 µg/m3 range) n=10
6.8 µg/m3 mean (0.4-42.2 µg/m3 range) n=8
Hidden briefcase pump (1 L/min flow rate).
Study shows that segregation of smoking and nonsmoking sections in airplanes was effective in keeping smoke away from nonsmokers. Questions, however, have come because of the author’s use of geometric mean, rather than arithmetic mean and results which show that airplane, nonsmoking sections have higher nicotine levels than smoking sections in restaurants (Repace and Lowrey 1988).
Oldaker and Conrad (1987)
Nicotine Boeing 737-200 NS 7.7 µg/m3 mean (0.04-
40.2 µg/m3 range) n=29
Hidden briefcase pump (1 L/min flow rate).
Study shows that segregation of smoking and nonsmoking sections in airplanes was effective in keeping smoke away from nonsmokers. Questions, however, have come because of the author’s use of geometric mean, rather than arithmetic mean and results which show that airplane,
Oldaker and Conrad (1987)
14

RoC Background Document for Environmental Tobacco Smoke
Compound Tested
Area of Exposure
Exposure Levels Method of Measurement
Comment Reference
nonsmoking sections have higher nicotine levels than
S 6.5 µg/m3 mean (0.08- smoking sections in restaurants (Repace and Lowrey 1988).
112.4 µg/m3 range) n=11
Nicotine Boeing 737-300 Hidden briefcase Study shows that segregation of smoking and nonsmoking Oldaker and NS 4.2 µg/m3 mean (0.4-
17.2 µg/m3 range) n=10
pump (1 L/min flow rate).
sections in airplanes was effective in keeping smoke away from nonsmokers. Questions, however, have come because of the author’s use of geometric mean, rather than arithmetic mean and results which show that airplane,
Conrad (1987)
nonsmoking sections have higher nicotine levels than
S 21.5 µg/m3 mean (0.7-76.7 µg/m3 range) n=7
smoking sections in restaurants (Repace and Lowrey 1988).
RSP Smoking work 33.6 µg/m3 median; Personal sampling Demographics of the total population compared favorably Jenkins et al. (3.5 µg diameter)
environment. Smoking away from work environment.
45.4 µg/m3 mean
n=157
pump (no flow rate given).
to entire U.S. population. Two pumps, a workplace pump and an away-from-work pump, were used to sample atmospheric concentrations of ETS for 24 hours. 87% of participants reported smoking restrictions at work, ranging from a total ban to smoking only in a restricted area. RSP concentrations were determined gravimetrically.
(1996)
RSP Smoking work 23.3 µg/m3 median; Personal sampling Demographics of the total population compared favorably Jenkins et al. (3.5 µg diameter)
environment. Smoking away from work environment.
31.0µg/m3 mean
n=234
pump (no flow rate given).
to entire U.S. population. Two pumps, a workplace pump and an away-from-work pump, were used to sample atmospheric concentrations of ETS for 24 hours. 87% of participants reported smoking restrictions at work, ranging from a total ban to smoking only in a restricted area. RSP concentrations were determined gravimetrically.
(1996)
RSP Smoking work 20.5 µg/m3 median; Personal sampling Demographics of the total population compared favorably Jenkins et al. (3.5 µg diameter)
environment. Smoking away from work environment.
27.8 µg/m3 mean n=281
pump (no flow rate given).
to entire U.S. population. Two pumps, a workplace pump and an away-from-work pump, were used to sample atmospheric concentrations of ETS for 24 hours. 87% of participants reported smoking restrictions at work, ranging from a total ban to smoking only in a restricted area. RSP concentrations were determined gravimetrically.
(1996)
RSP Smoking workenvironment.
15.2 µg/m3 median; Personal samplingpump (no flow rate
Demographics of the total population compared favorablyto entire U.S. population. Two pumps, a workplace pump
Jenkins et al.
15

RoC Background Document for Environmental Tobacco Smoke
Compound Tested
Area of Exposure
Exposure Levels Method of Measurement
Comment Reference
(3.5 µg diameter)
Smoking away from work environment.
18.5µg/m3 mean n=808
given). and an away-from-work pump, were used to sample atmospheric concentrations of ETS for 24 hours. 87% of participants reported smoking restrictions at work, ranging from a total ban to smoking only in a restricted area. RSP concentrations were determined gravimetrically.
(1996)
Particulate Casino Site 200 µg/m3 median Personal sampling Nonsmoking individuals were studied in two separate Kado et al. Matter (~100x100x 12
feet). (173-245µg/m3 range) pumps with filters from low volume (1.71 L/min flow rate).
indoor facilities containing smokers. Smoking policies for these two environments were not mentioned. Sampling times range from 40 minutes to 6 hours. Nicotine studieswere done in correlation to determine what portion of
(1991)
Bingo Site (~100x150x 16 482 µg/m3 median
particulate matter was based on ETS. Values presented here are total particulate matter and not corrected values.
feet). (348-526 µg/m3 range) Particulate Smoking 53.2 µg/m3 median Mass flow Seven restaurants in Albuquerque, NM (seating capacity Lambert et al. Matter section
restaurants.
Nonsmokingsection restaurants.
(21.7-131.0 µg/m3
range)
27.8 µg/m3 median (20.7 –69.0 µg/m3
range)
controlled pump (4 L/min flow rate).
exceeded 100 in all restaurants) were sampled for two consecutive days for 12 hours (11:00 AM-11:00 PM). Pumps were placed within the usual breathing areas except in two restaurants. In six of seven restaurants, particulate matter levels were lower in nonsmoking sections than in smoking sections (P=0.03, Wilcox paired sample test) with a median difference of 18.6 µg/m3 .
(1993)
Particulates Residences. 78 µg/m3 mean (32- Compilation of data Review of ambient air surveys on ETS from three sources. Siegel (1993) 700 µg/m3 range) from three sources Weighted average of the individual study mean n=624 (Sterling et al. 1987;
Guerin et al. 1992; Repace 1987).
concentrations for all measurements taken. Weights used were the number of residences sampled.
NS: Nonsmoking S: Smoking
16

RoC Background Document for Environmental Tobacco Smoke
2.3 Occupational Exposure The National Research Council (NRC) estimated that nonsmokers exposed to ETS averaged urinary concentrations of 25 ng/mL cotinine (active smokers had levels of 1,825 ng/mL). Studies have shown varying cotinine levels based on different occupations. It should be noted that concentrations of cotinine are higher for those occupations where workers are exposed to higher levels of tobacco smoke; such as in restaurants, bars, and bowling alleys (Millar 1991). It should also be noted that many people who reported no exposure to ETS do have low levels of systemic cotinine.
ETS exposure levels were also measured by RSP (<2.5 pm). Millar (1991) cited that Repace and Lowrey (1980, 1982) found concentrations in public access buildings that averaged 0.242 µg/m3. In later studies, they estimated a 62% probability of nonsmoker exposure in the workplace. Table 2-3 highlights all of the components tested to determine occupational exposure to ETS.
2.3.1 Restaurants
Levels of ETS in restaurants are approximately 1.6-2.0 times higher than other office workplaces and 1.5 times higher than residences of, at least, one smoker. Isolating smokers to a specific section of restaurants was found to afford some protection for nonsmokers, but the best protection resulted from seating arrangements that segregated smokers by a wall or partition. Nonsmokers are still exposed to nicotine and respirable particles. Food-servers, who spend more time in restaurants, are exposed even more to ETS, though they may work in nonsmoking sections (Lambert et al.1993).
2.3.2 Bars
Levels of ETS in bars are approximately 3.9-6.1 times higher than in office workplaces and 4.4-4.5 times higher than in residences. Bars are not always compelled to provide smoking and nonsmoking sections and this may account for the higher level of ETS exposure in bars versus restaurants (Siegel 1993).
2.3.3 Airplanes
Mattson et al. (1989) studied personal ETS exposure in airplanes. Levels of nicotine found in cabins seem to vary widely owing to unstandardized methods of collection and measurement. Oldaker and Conrad (1987) measured nicotine levels in the passenger cabins of commercial airliners. Using a hidden suitcase pump, they found that the average nicotine concentration in nonsmoking areas was 5.5 µg/m3 (0.03-40.2 µg/m3 [range, n=49]), while in the smoking sections it was 9.2 µg/m3 (0.08-112.4 µg/m3 [range, n=26]). Using these data, calculated “cigarette equivalents” for the smoking section ranged from 0.00008-0.15 cigarettes per 55 minute flight. Comparisons of the results, however, have shown some consistencies.
Studies have shown that nonsmoking seats near the smoking section have levels as high as those seats in smoking sections. The type of ventilation system a plane used seemed to be the most important factor in ETS exposure. Planes with 100% fresh air had lower levels of ETS compared to 50% fresh and 50% recirculating air. Recirculating air systems, however, have been used in more new planes because they improve fuel economy. Since attendants are not confined to the nonsmoking section, they had higher ETS exposures than passengers in nonsmoking sections (Mattson et al. 1989).
17

RoC Background Document for Environmental Tobacco Smoke
Table 2-3. Occupational exposure to ETS
Compound Tested
Area of Exposure
Exposure Levels Method of Measurement
Comment Reference
Nicotine Closed offices: Smoking allowed
Smoking restricted
Smoking banned
9.1 µg/m3 median (<0.1 – 22 µg/m3
range)
0.6 µg/m3 (only one site)
<0.1 µg/m3 (only one site)
Passive monitor with an effective sampling rate of 24 mL/m3 .
Closed office means relatively small rooms with one or two occupants. Samples were taken continuously for one week. Worksites were classified as (1) allowed smoking throughout the worksite except for safety restrictions; (2) smoking restricted to designated areas; or (3) smoking banned from the entire premises.
Hammond et al. (1995)
Nicotine Open offices: Smoking allowed
Smoking restricted
Smoking banned
8.6 µg/m3 median (14 µg/m3 mean)
1.3 µg/m3 median (3.4 µg/m3 mean)
0.3 µg/m3 median (0.7 µg/m3 mean)
Passive monitor with an effective sampling rate of 24 mL/m3 .
Open office means large rooms, with or without partitions, with many workers. Samples were taken continuously for one week. Worksites were classified as (1) allowed smoking throughout the worksite except for safety restrictions; (2) smoking restricted to designated areas; or (3) smoking banned from the entire premises.
Hammond et al. (1995)
Nicotine Shop: Smoking allowed
Smoking restricted
Smoking banned
2.3 µg/m3 median (4.4 µg/m3 mean)
0.7 µg/m3 median (2.2 µg/m3 mean)
0.2 µg/m3 median (0.2
Passive monitor with an effective sampling rate of 24 mL/m3 .
Shop offices indicate other types of work areas (besides open and closed offices) dealing with production, shipping, laboratories, and fire stations. Samples were taken continuously for one week. Worksites were classified as (1) allowed smoking throughout the worksite except for safety restrictions; (2) smoking restricted to designated areas; or (3) smoking banned from the entire premises.
Hammond et al. (1995)
18

RoC Background Document for Environmental Tobacco Smoke
Compound Tested
Area of Exposure
Exposure Levels Method of Measurement
Comment Reference
µg/m3 mean)
Nicotine Offices 4.1 µg/m3 mean (0.8- Compilation of data Review of ambient air surveys on ETS from three sources. Siegel (1993) 22.1 µg/m3 range) from three sources Weighted average of the individual study mean n=940 (Sterling et al. 1987; concentrations for all measurements taken. Weights used
Guerin et al. 1992; were the number of restaurants, bars, or offices sampled.
Restaurants 6.5 µg/m3 mean (1.6-21 µg/m3 range)
Repace 1987).
n=402
19.7 µg/m3 mean (7.4-Bars 65.5 µg/m3 range)
n=25 Nicotine Attendants Personal exposure In-flight nicotine levels were gathered from four attendants Mattson et al.
NS 4 µg/m3 mean (median = 3 µg/m3; range 0.1-71 µg/m3)
monitor with a pump (3 L/min flow rate).
and five passengers to determine nicotine levels of the airplane. Nicotine levels were variable, with some nonsmoking sections having comparable levels to smoking sections.
(1989)
S 5 µg/m3 mean (median = 5 µg/m3; range 0.7-11µg/m3)
Carbon Offices 3.0 ppm mean (1.0-3.3 Compilation of data Review of ambient air surveys on ETS from three sources. Siegel (1993) Monoxide ppm range) n=1161 from three sources Weighted average of the individual study mean
(Sterling et al. 1987; concentrations for all measurements taken. Weights used Guerin et al. 1992; were the number of restaurants, bars, or offices sampled.
Restaurants 5.1 ppm mean (0.5-9.9 ppm range) n=229
Repace 1987).
11.6 ppm mean (3.1-Bars 17 ppm range) n=32
19

RoC Background Document for Environmental Tobacco Smoke
Compound Tested
Area of Exposure
Exposure Levels Method of Measurement
Comment Reference
Particulates Offices
Restaurants
Bars
57 µg/m3 mean (6-256 µg/m3 range) n=912
117 µg/m3 mean (27-690µg/m3 range) n=211
248 µg/m3 mean (75-1320 µg/m3 range) n=16
Compilation of data from three sources (Sterling et al. 1987; Guerin et al. 1992; Repace 1987).
Review of ambient air surveys on ETS from three sources. Weighted average of the individual study mean concentrations for all measurements taken. Weights used were the number of restaurants, bars, or offices sampled.
Siegel (1993)
NS = Nonsmoking, S = Smoking
20

RoC Background Document for Environmental Tobacco Smoke
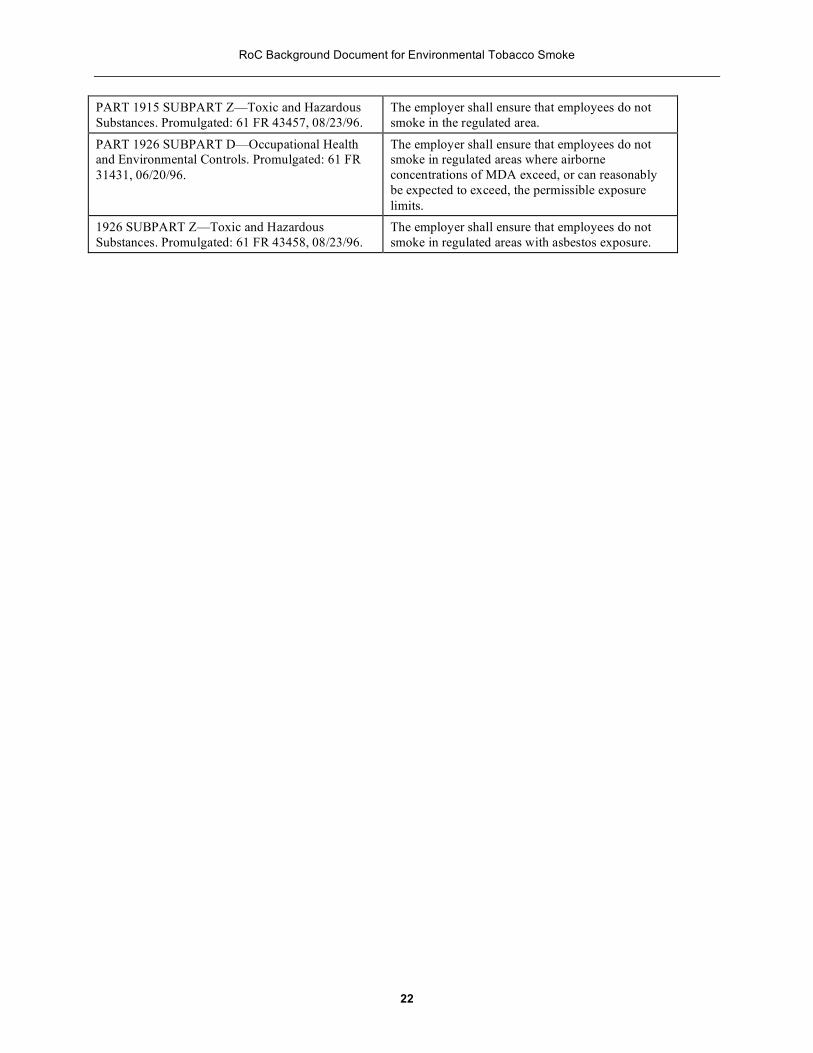
2.4 Regulations ETS-related regulations defined by Environmental Protection Agency (EPA), Food and Drug Administration (FDA), and Occupational Safety and Health Administration (OSHA) are shown below. Smoking restrictions promulgated by state and local governments are not included in Table 2-4.
Table 2-4 Regulations
EPA Regulations
PART 63 SUBPART JJJ—National Emission Because coke oven batteries have hazardous Standards for Hazardous Air Pollutant Emissions: environments, smoking and subsequent ETS Group IV Polymers and Resins. Promulgated: 61 exposure in the presence of coke oven batteries is FR 34200, 06/1/96. not permitted.
PART 175—Carriage by Aircraft—Subpart A— General Information and Regulations. Promulgated: 41 FR 16106, 04/15/76. U.S. Codes: 49 U.S.C. 5101-5127; 49 CFR 1.53.
Aircraft operators may not smoke within 3 meters (10 feet) of a transport incubator unit necessary to protect life, or an organ preservation unit necessary to protect human organs provided.
PART 763 SUBPART E—Asbestos-Containing Workers who identify friable and nonfriable Materials in Schools. Promulgated: 60 FR 31922, asbestos-containing material (ACM) in public and 06/19/95. Personal hygiene. private elementary and secondary schools by
visually inspecting school buildings for such materials may not smoke in the work area.
PART 763 SUBPART G—Asbestos Abatement Projects. Promulgated: 58 FR 34205, 06/23/93.
Workers may not smoke during asbestos abatement projects.
FDA Regulations
PART 310 SUBPART E—Requirements for Patient package inserts for oral contraceptives—a Specific New Drugs or Devices. Promulgated: 55 boxed warning concerning the increased risks FR 11578, 03/29/90. associated with combining cigarette smoking and
oral contraceptive use.
PART 897—Cigarettes and Smokeless Tobacco. This part sets out the restrictions under the Federal Promulgated: 61 FR 44615, 08/28/96. Food, Drug, and Cosmetic Act (the Act) on the sale,
distribution, and use of cigarettes and smokeless tobacco that contain nicotine.
OSHA Regulations
PART 1910 SUBPART Z—Toxic and Hazardous The employer shall ensure that employees do not Substances. Promulgated: 40 FR 23072, 05/28/75. smoke in work areas where they are occupationally U.S. Codes: 29 U.S.C. 653, 655, and 657; 29 U.S.C. exposed to asbestos, MDA, α-naphthylamine, and 655(a); Smoking in work areas. other hazardous substances because of activities in
that work area. PART 1915 SUBPART F—General Working The employer shall not permit employees to eat or Conditions. Promulgated: 52 FR 31886, 08/24/87. smoke in areas undergoing surface preparation or
preservation, or where shipbreaking operations produce atmospheric contaminants.
21
RoC Background Document for Environmental Tobacco Smoke
PART 1915 SUBPART Z—Toxic and Hazardous Substances. Promulgated: 61 FR 43457, 08/23/96.
The employer shall ensure that employees do not smoke in the regulated area.
PART 1926 SUBPART D—Occupational Health and Environmental Controls. Promulgated: 61 FR 31431, 06/20/96.
The employer shall ensure that employees do not smoke in regulated areas where airborne concentrations of MDA exceed, or can reasonably be expected to exceed, the permissible exposure limits.
1926 SUBPART Z—Toxic and Hazardous Substances. Promulgated: 61 FR 43458, 08/23/96.
The employer shall ensure that employees do not smoke in regulated areas with asbestos exposure.
22

RoC Background Document for Environmental Tobacco Smoke
3 Human Studies Human cancer studies of environmental tobacco smoke have been reviewed by a number of scientific organizations: IARC 1986; U.S. DHHS 1986; NRC 1986; U.S. EPA 1992; and CEPA 1997. Since the IARC report (1986), over 30 epidemiological studies investigating the association of environmental tobacco smoke (ETS) exposure with cancer have been published. This includes both cohort studies and case-control studies of lung, bladder, cervical, nasal sinus, and breast cancer. In addition 12 childhood cancer studies have been reported, where exposure from both ETS and maternal smoking during pregnancy are considered. These studies are summarized in Table 3-1. A number of reviews and meta-analyses have also been published along with studies examining the degree of systematic bias in studies that use spousal smoking as a measure of ETS exposure. These reviews and analyses include Pershagen 1986; Repace and Lowery 1990; Wu-Williams and Samet 1990; Fleiss and Gross 1991; Woodward and McMichael 1991; Wells 1991, 1993; Lee 1992a, 1992b, 1993a, 1993b, 1994a, 1994b, 1995; Tredaniel et al. 1993, 1994a, 1994b; LeVois and Layard 1994, 1995; Sterling et al. 1996; Kawachi and Colditz 1996; Lee and Forey 1996; Kabat 1990, 1996; Morris 1995; Layard 1993; and Nyberg et al. 1997, 1998; and Levois and Switzer 1998.
3.1 IARC report of 1986 (Appendix 3A) IARC (1986) reported that several studies found an increase in lung cancer in nonsmoking spouses of smokers with increased risk in relation to the extent of the spouse’s smoking. Other studies did not show an effect or showed an effect without a dose-reponse. Because of difficulties in determining ETS exposure in these studies, as well as potential confounding by other risk factors, the report concluded that each study was compatible either with an increased risk or with the absence of risk. Since the estimated relative risks were low, additional large scale studies with reliable measures of exposure were recommended. Finally, the report concluded that studies of childhood cancer did not provide clear evidence of an association with parental smoking.
With regard to lung cancer and ETS, IARC (1986) reviewed two major cohort studies: one involving 91,540 nonsmoking women in Japan (Hirayama 1981, 1983, 1984a, 1984b), and the American Cancer Society’s cohort of 375,000 nonsmoking women (Garfinkel 1981). The study of Japanese women showed an increasing mortality ratio of lung cancer with the husband’s smoking history. The standard mortality rate (SMR) values for lung cancer among nonsmoking women were 1.0, 1.36 (90% CI 0.85-2.18), 1.42 (90% CI 1.01-2.01), 1.58 (90% CI 0.98-2.38) and 1.91 (90% CI 1.34-2.71) when husbands were nonsmokers, ex-smokers, and daily smokers of 1-14, 15-19 and 20+ cigarettes per day. The ACS study, however, did not show a statistically significant increase in lung cancer risk with spousal smoking.
IARC (1986) considered five case-control studies of lung cancer and spousal smoking (Trichopoulos et al. 1981, 1983; Correa et al. 1983; Kabat and Wynder 1984; Chan and Fung 1982, and Koo et al. 1984) and noted that in all of the studies, misclassification of smokers as nonsmokers could have resulted in an inflated risk estimate. This hypothesis is based on the assumption that smoking habits of spouses are correlated. IARC concluded that, “As the estimated relative risks are low, the acquisition of further evidence bearing on the issue may require large-scale observational studies involving reliable measures of exposure both in childhood and in adult life.”
23

RoC Background Document for Environmental Tobacco Smoke
3.2 U.S. EPA report of 1992 (Appendix 3B) The US EPA report (EPA 1992) analyzed data from 27 case-control studies and four cohort studies which examined the relationship of lung cancer to ETS exposure. This included studies published through 1991; Brownson et al. 1992 and Stockwell et al. 1992 were presented as an addendum. The studies primarily examined lung cancer in nonsmoking women who were classified as exposed or unexposed depending on whether or not the women were married to smokers. This information was obtained by self-report or by proxy. In the studies considered by EPA (1992), there were more than 3,000 lung cancer cases among never-smokers in the case-control studies and 300,000 female never-smokers in the cohort studies. The report calculated a pooled relative risk through meta-analysis methods after adjusting for potential bias due to misclassification of smokers as nonsmokers.
The individual studies were carefully summarized and evaluated. The studies were graded using a specific evaluation form which considered eight general categories (smoking status, ETS exposure, lung cancer indication, interview type, proxy responders, follow-up, design, analysis) and then classified into four tiers based upon their scores (see Appendix A, Table 4 of the report, included in Appendix 3B here). Studies in the lowest tier (Tier 4) were not recommended for further analysis (Chan and Fung 1982; Inoue and Hirayama 1988; Geng et al. 1988; Liu et al. 1991; Wu-Williams and Samet 1990). The highest rated studies (Tier 1) were Kalandidi et al. 1990; Koo et al. 1987; Fontham et al. 1991; Hole et al. 1989; and Pershagen et al. 1987. The report estimated a pooled relative risk of lung cancer from ETS exposure of 1.19 (90% CI 1.04-1.35) using all 11 U.S. studies. Restricting consideration to Tier 1 and Tier 2 studies (eight of the 11 U.S. studies), the estimate was 1.22. Nonsmokers with workplace or social exposure but no spousal exposure had a relative risk of 1.34 compared to nonsmokers with no ETS exposure, while nonsmokers with spousal as well as other sources of exposure had a relative risk of 1.59 compared to nonsmokers with no ETS exposure. The report concluded “that ETS is a Group A human carcinogen” since “there is sufficient evidence from epidemiologic studies to support a causal association between exposure to the agents and cancer.”
3.3 California EPA report of 1997 (Appendix 3C) The California EPA report (CEPA 1997) evaluated the studies presented in Table 1, except for Ko et al. 1997. The report reviewed each of the studies and summarized the general findings for each cancer type. Regarding lung cancer, five reports published after the U.S. EPA report (EPA 1992) were given special consideration: three large population-based case-control studies (Stockwell et al. 1992; Brownson et al. 1992; Fontham et al. 1994); a smaller hospital-based case-control study (Kabat et al. 1995); and a cohort study (Cardenas et al. 1997). All were carefully reviewed. Collectively they addressed many of the criticisms of the previous studies such as small sample size, selection bias, misclassification of smokers as nonsmokers, etc. The results of all the studies were consistent with the U.S. EPA finding of a 20% increased risk of lung cancer among nonsmoking women. The report concluded that there is a causal association between ETS and lung cancer.
For nasal sinus cancers, the report concluded that there was strong evidence that exposure to ETS increases the risk of nasal sinus cancer in nonsmoking adults; further studies were recommended to characterize the magnitude of the risk and the dose-response relationship. Both epidemiologic and biochemical evidence suggested that ETS exposure may increase the risk of cervical cancer in nonsmokers. However, although ETS is a plausible bladder carcinogen in nonsmokers, the
24

RoC Background Document for Environmental Tobacco Smoke
limited epidemiologic evidence did not support an association. There was insufficient evidence to draw any conclusion regarding the relationship between ETS exposure and cancers of the breast, stomach, and brain.
For children the evidence was insufficient to determine whether either of the major childhood cancers—acute lymphoblastic leukemia (ALL) or brain cancer—was associated with ETS exposure. Further, the studies do not differentiate between ETS exposure during pregnancy or after delivery. The report considers the evidence to be inadequate for forming firm conclusions on childhood cancers.
3.4 Current Epidemiology Studies Table 3-1 gives the details of studies published since the IARC report (IARC 1986). For adults, there are ten cohort studies, 15 case-control studies of lung cancer, and ten case-control studies of bladder, breast, cervical, and nasal sinus cancer. For childhood cancers, there are one cohort study and 11 case-control studies of various cancers.
3.4.1 Total Cancers:
For total cancers, the Japanese cohort (Hirayama 1984, 1992) had a significant relative risk, RR=1.23 (90% CI 1.12-1.35) for spouses smoking 20 or more cigarettes per day. For ex-smokers or spousal smoking of 1-19 cigarettes per day the relative risk was smaller but still significant RR=1.12 (90% CI 1.03-1.21). The cancer increases were due primarily to cancers of the lung, nasal sinus, and brain. The other major cohort study (Sandler et al. 1989) showed no cancer increase among either male (RR=1.01) or female (RR=1.00) nonsmokers with household smoking exposure in the Washington County, Maryland cohort. When only smoking related cancers were considered, there was an insignificant increase in the females but no increase in the males with RR=1.45 (95% CI, 0.88-2.40) and RR=0.96 (95% CI 0.43-2.16), respectively.
3.4.2 Lung Cancer:
Since the IARC report, there have been 15 case-control studies of lung cancer and ETS exposure from spousal smoking. These studies are often limited in size and do not achieve statistical significance (Akiba et al. 1986; Brownson et al. 1987; Dalager et al. 1986; Koo et al. 1987; Kaladidi et al. 1990; Kabat et al. 1995; Wang et al. 1996; Ko et al. 1997). Recently, however, three large population-based case-control studies were conducted in the US (Brownson et al. 1992; Stockwell et al. 1992; Fontham et al. 1991; 1994).
Brownson et al. (1992) studied 432 lung cancer cases among lifetime nonsmoking white women aged 30-84 years, diagnosed between January 1986 and June 1991. Cases were identified using the Missouri Cancer Registry. Histological verification of primary lung cancer was completed for 76% of the cases. Controls were 1,402 lifetime nonsmoking women identified from driver’s license or Medicare files and matched to cases on age. Data on ETS exposure were collected using a structured telephone interview; 65% of case interviews were conducted with surrogates. The interview included detailed questions about each potential source of ETS exposure. Risk of lung cancer was associated with household ETS exposure in adulthood. After adjusting for age and history of lung disease, the OR for >40 pack-years of smoking by the spouse was 1.3 (95% CI, 1.0-1.7). There was a positive trend in risk with increasing pack-years (p=0.06). There was no risk associated with exposure to ETS in childhood.
25

RoC Background Document for Environmental Tobacco Smoke
Stockwell et al. (1992) studied 210 lung cancer cases among lifetime nonsmoking women, 93% white, diagnosed between April 1987 and February 1991. Cases in a 28 county area in central Florida were identified from tumor registries of area hospitals and the Florida Cancer Registry. Primary lung cancer was histologically confirmed for all cases. Controls were 301 lifetime nonsmoking women identified by random digit dialing. Smoking status was confirmed by interviews with patients’ physicians, at initial contact, and during the interview. Data on ETS exposure were collected using a structured interview administered in person, by telephone, or by mail; 67% of case interviews were conducted with surrogates. Risk of lung cancer was associated with household ETS exposure in both childhood and adulthood. After adjusting for age, race, and education, the OR for 22+ years exposure in childhood was 2.4 (95% CI, 1.1-5.4); the OR for 40+ years exposure in adulthood was 2.4 (1.1-5.3); and the OR for 40+ years lifetime exposure was 2.3 (95% CI, 1.1-4.6). There were positive trends in risk with increasing years of exposure in childhood (p=0.114), adulthood (p=0.025), and lifetime (p=0.004).
Fontham et al. (1991; 1994) studied 653 lung cancer cases among lifetime nonsmoking women aged 20 to 79, diagnosed between 1986 and 1990 in 5 major US metropolitan areas. Primary lung cancer was histologically confirmed for 85% of cases. Controls were 1,253 lifetime nonsmoking women identified by random digit dialing or Medicare files and frequency matched to cases on race and age. Lifetime smoking status was confirmed using patients’ medical records or interviews with physicians, at initial contact, and during the interview. At the interview, a urine sample was collected; subjects with cotinine levels higher than 100 ng/mg creatinine were excluded. Data on ETS exposure were collected using structured in-person interviews; 36% of the case interviews were conducted with surrogates. Detailed questions were asked about each potential source of ETS exposure. Risk of lung cancer was associated with spousal ETS exposure in adulthood. After adjusting for age, race, study area, education, diet, family history of lung cancer, and employment in high-risk occupations, the OR for 80+ pack-years of spousal exposure was 1.79 (95% CI, 0.99-3.25). There was a positive trend in risk with increasing pack-years (p=0.03). Risk of lung cancer was also associated with occupational exposure (adjusted OR for >30 years exposure = 1.86; 95% CI = 1.24-2.78; trend p = 0.001) and exposure in social settings (adjusted OR for > 30 years exposure = 1.54; 95% CI = 0.93-2.53; trend p = 0.002). There was no risk associated with exposure to ETS in childhood.
A recent prospective cohort study has also examined the relationship of ETS exposure to lung cancer mortality. Cardenas et al. (1997) compared 114,286 female and 19,549 male never smokers with smoking spouses to about 77,000 female and 77,000 male never smokers whose spouses did not smoke. All subjects were enrolled in the American Cancer Society’s Cancer Prevention Study II; they were friends, neighbors, and relatives of ACS volunteers across the US. At the time of enrollment, subjects completed a questionnaire which collected information on smoking history; data from the spouse’s enrollment questionnaire were used as a source of information on ETS exposure. Vital status was determined by personal enquiry by the volunteer who had enrolled the subject and by linkage with the National Death Index. Histological data were available for only 29 of 247 cases; 27 of these were verified as primary lung cancer. Exposure to spousal smoking was associated with lung cancer among women but not men. After adjusting for age, race, education, diet, asbestos exposure, blue collar employment, and history of chronic lung disease, the rate ratio for ever exposure in women was 1.2 (95% CI, 0.8-1.6).
26

RoC Background Document for Environmental Tobacco Smoke
There was a positive trend in risk with increasing number of cigarettes per day smoked by spouse (p=0.03) or pack-years of exposure (p=0.1) but not with increasing years of marriage (p=0.5).
3.4.3 Bladder Cancer:
Two case-control studies have reported findings on ETS and bladder cancer. The study by Kabat et al. (1986) had 152 bladder cancer cases, but with passive smoking information on only 40 cases and 72 hospital controls. The results for males and females, and for workplace and home exposures gave inconsistent results that were nonsignificant. A larger study with 826 bladder cancer cases and 792 controls had 142 nonsmoking cases with 217 nonsmoking controls (Burch et al. 1989). Passive smoking was not related to bladder cancer in this study although there was a weak association (OR=2.7) with active smoking.
3.4.4 Breast Cancer:
Sandler et al.’s (1986) case-control study found a significant association with spousal smoking and pre-menopausal breast cancer OR=7.0 (95% CI 1.4-67.2), but not with post-menopausal breast cancer OR=1.2 (95% CI 0.6-2.6). Only 12 cases of the 59 total were pre-menopausal breast cancers. In a study with 208 cases of breast cancer (94 cases were nonsmokers) a nonsignificant increase was observed for less than 200 cigarette-years RR=1.38 (95% CI 0.92-2.09), but no increase was observed in the high exposure, 200+ cigarette-year group RR=0.84 (95% CI 0.38-1.85) (Smith et al. 1994). However, only 13 cases were in the high exposure group. Also for active smoking the risk was not associated with breast cancer OR=1.01 (95% CI 0.81-1.26). Using population controls and 244 breast cancer cases (126 nonsmokers) in Geneva a significant increase was observed for those with spousal smoking OR=2.6 (95% CI 1.6-4.3) (Morabia et al. 1996). For those women with high exposures greater than 50 hour/day-years the risk was about the same OR=2.7 (95% CI 1.5-4.7). The risks estimated for ETS exposure were similar to those for active smoking.
3.4.5 Cervical Cancer:
A case-control study of 56 cervical cancer cases among nonsmokers reported an increased risk from spousal smoking OR=2.1 (95% CI 1.2-3.9) (Sandler et al. 1985). Adjustments for sexual activity were not made. In a second case-control study of cervical cancer there were 81 cases among nonsmokers and a dose response was reported with respect to the number of hours per day of exposure to ETS (Slattery et al. 1989). The incidence in the highest ETS exposure group of 3+ hours per day was significant OR= 3.4 (95% CI 1.2-9.5). In a third case-control study there were only 36 nonsmokers among the cases and no association between ETS and cervical cancer was reported (Coker et al. 1992).
3.4.6 Nasal Sinus Cancer:
In a case-control study in Japan, a dose response for nasal sinus cancer in nonsmokers was observed with respect to the number of smokers in the home (Fukuda and Shibata 1990; cited by CEPA 1997). The values were OR=1.4 (0.6-3.5), 2.0 (0.8-4.5) and 5.7 (1.7-19.4) for 1, 1+,and 2+ smokers in the home. There were 50 cases of nasal sinus cancer among nonsmokers in the study. In a second study which included 28 cases of nasal sinus cancers among never smoked men the OR=3.0 (1.0-8.9) among those exposed to spousal smoking (Zheng et al. 1993).
27
RoC Background Document for Environmental Tobacco Smoke
3.4.7 Childhood Cancers:
Childhood cancers have been studied in both cohort and case-control studies. Studies have examined the relationship of ETS exposure to total cancers, to brain cancer, and to the leukemias ALL (acute lymphoblastic leukaemia) or AML (acute myeloid leukaemia). There is little consistency in their results. Interpretation of many of these studies is complicated by the difficulty of distinguishing effects of paternal and maternal smoking, and of prenatal and postnatal exposure.
3.4.7.1 All cancers combined: Buckley et al. (1986) reported that in the U.S. and Canada maternal smoking was not associated with cancer in a group of 1,814 children [OR=1.31 (95% CI 0.9-1.9) for 1-9 cigarettes per day and OR=0.97 (95% CI 0.8-1.2) for 10+ cigarettes per day]. Stjernfeldt et al. (1986a, 1986b, 1992) compared 305 Swedish children age 16 or less with cancer to 340 insulin-dependent childrenand found an exposure-related risk associated with maternal smoking [RR=1.07 (95% CI 0.63-1.80) for 1-9 cigarettes per day and RR=1.56 (95% CI 1.05-2.33) for 10+ cigarettes per day]. McKinney et al. (1987) studied 555 children under the age of 15 with cancer in three regions of the United Kingdom; risk was not associated with maternal smoking [for 1-10 cigarettes per day the risk was OR=1.12 (95% CI 0.85-1.47), and for 11+ cigarettes per day the risk was OR=0.84 (95% CI 0.65-1.09)]. Golding et al. (1990) conducted a nested case-control study of 33 cancers among children age 10 or less in a cohort of 16,193 children born during one week in Great Britain. The risk associated with maternal preenatal smoking was OR=2.69 (95% CI 1.05-6.89). John et al. (1991) studied a group of 223 children younger than 15 in Denver; the risk associated with maternal smoking was OR=1.3 (95% CI 0.7-2.1), and the risk associated with paternal smoking was OR=1.2 (95% CI 0.8-2.1). Klebanoff et al. (1996) reported that maternal smoking during pregnancy was not associated with childhood cancer. Ji et al. (1997) compared 642 children in Shanghai to individually matched controls. Paternal preconception smoking of more than 5 pack-years was associated with all cancers combined [OR=1.7 (95% CI 1.2-2.5)]. Sorahan et al. (1997) compared 2,587 children included in the Oxford Survey of Childhood Cancers to 2,587 controls. There was no association with maternal cigarette smoking during pregnancy, but a positive trend in risk with paternal consumption of cigarettes (p<0.001) was found.
3.4.7.2 Childhood brain cancer: Howe et al. (1989) studied 74 cases and 138 controls in Ontario and found a small risk associated with maternal smoking [OR=1.42 (95% CI 0.7-3.0)] but not paternal smoking [OR=1.13 (0.65-2.09)]. Kuijten et al. (1990) studied 163 astrocytoma cases younger than 15 and found no association with maternal smoking [OR=1.0 (95% CI 0.6-1.7)]. Pershagen et al. (1992) studied a cohort of 497,051 Swedish children aged 5 years of less and found no association of maternal smoking with brain cancer [RR=0.96 (95% CI 0.59-1.56)]. Gold et al. (1993) used SEER (Surveillance Epidemiology and End Results) registries to identify 361 cases among children under the age of 18 and found no association with parental smoking. Comparing children with both parents smokers to children with neither parent a smoker, the risk was OR=0.95 (95% CI 0.66-1.36). McCredie et al. (1994) compared 82 children under the age of 15 with brain cancer to 164 controls. A significant increase was associated with father’s smoking [OR=2.2 (95% CI 1.2-3.8)], but not the mother’s smoking [OR=0.9 (95% CI 0.5-1.8)]. Norman
28

RoC Background Document for Environmental Tobacco Smoke
et al. (1996) compared 540 cases ascertained in 10 counties on the US west coast to 801 controls. No association was found with maternal or paternal smoking before pregnancy or maternal smoking during pregnancy. Small increases in risk were associated with paternal smoking during pregnancy in the absence of maternal smoking [OR=1.2 (95% CI 0.90-1.5)] and with maternal exposure to ETS from any source [OR=1.2 (95% CI = 0.95-1.6)]. Ji et al. (1997) compared 642 children in Shanghai to individually matched controls. Paternal preconception smoking of more than 5 pack-years was associated with brain tumors [OR=2.7 (95% CI 0.8-9.9)].
3.4.7.2 Childhood lymphomas/leukemias: Stjernfeldt et al. (1986) reported that smoking during pregnancy was associated with ALL; the risk for 1-9 cigarettes per day was OR=1.34 (95% CI 0.7-2.6), and for 10+ cigarettes per day was OR=2.07 (95% CI 1.3-3.3). McKinney and Stiller (1986) and McKinney et al. (1987) found no association for maternal smoking [OR=1.0 (95% CI 0.6-1.7) for 1-10 cigarettes per day and OR=0.6 (95% CI 0.4-1.0) for 11+ cigarettes per day]. Buckley et al. (1986) studied 742 ALL cases, and found no association with maternal smoking [OR=1.0 (95% CI 0.6-1.5) and OR=0.9 (95% CI 0.7-1.1) for 1-9 and 10+ cigarettes per day, respectively]. Magnani et al. (1990) studied 142 Italian children, and found no association of ALL with either maternal or paternal smoking. John et al. (1991) studied 73 ALL cases and found an association with smoking [OR=1.9 for maternal and OR=1.4 for paternal smoking]. Pershagen et al. (1992) studied a cohort of 497,051 Swedish children aged 5 years of less; the study included 198 solid tumors and 129 lymphatic leukemia cancers. No association with maternal smoking was found for solid tumors (OR =0.96, 95% CI = 0.70-1.32) or lymphatic/leukemia cancers (OR = 1.04, 95% CI = 0.71-1.52). Severson et al. (1993) considered AML in 187 children in Minnesota. Parental smoking was not associated with the AML cases [OR=1.2 (95% CI 0.77-1.86)]. Ji et al. (1997) compared 642 children in Shanghai to individually matched controls. Paternal preconception smoking of more than 5 pack-years was associated with ALL [OR=3.8 (95% CI 1.3-12.3)] and lymphoma [OR=4.5 (95% CI 1.2-16.8)].
29

RoC Background Document for Environmental Tobacco Smoke
Table 3-1. Human Studies of ETS exposure and cancer, published since IARC (1986) *
Study Type Population Group Exposure Effects Potential Confounders/
Effects
Comments References
ADULT CANCERS COHORT STUDIES Cohort 16 years of Smoking rates of 2705 cancer deaths. np The increase in total Hirayama
mortality follow-up of 91,540 nonsmoking wives in Japan.
husbands reported by mail surveys. .
Nonsmoking women whose husbands were ex-smokers or smoked 1-19 cigs/day had a RR=1.12 (90% CI 1.03-1.21) based on 1341 cancer cases. For 20+ cigs/day RR=1.23 (90% CI 1.12-1.35) for 730 cases.
cancers was due primarily to lung, nasal sinus, and brain. No increases were seen for stomach cancer. Breast cancer was increased at the highest exposure group with RR=1.7
(1984,1992)
RRs for nasal sinus cancers (n=28) were 1.69 (90% CI 0.67-4.20), 2.02 (90% CI 0.64-6.33) and 2.55 (90% CI 1.04-6.27). RRs for brain cancers (n=34) were 3.03 (90% CI 1.07-8.58), 6.25 (90% CI 2.01-19.43), and 4.23 (90%CI 1.53-12.19) both for 1-14, 15-19, and 20+ cigs/day, respectively.
(1.1-2.7).
Cohort 4,162 nonsmoking men and 14,873 nonsmoking women in Washington County, MD established in 1963 and mortality evaluated in 1975.
A scoring system of household smoking was used. Smoking information was obtained by a private census taken in 1963.
Among nonsmokers 1,248 men and 9,551 women were considered to be passive smokers from their household exposures. Total cancers were not increased, but for smoking related tumors there was a small increase among women RR=1.45 (95% CI 0.88-2.40) and not in men RR=0.96 (95% CI 0.43-2.16).
np Smoking status was taken in 1963 and mortality was assessed in 1975. Among ETS exposed individuals only 8 cancer deaths among men and 49 among women were observed.
Sandler et al. (1989)
Cohort A cohort of 2413 married women in Alameda, CA of
Husband smoking. Smoking history was independently
Comparing nonsmoking women with smoking husbands with those whose husbands did not smoke had
np Based on only 147 cancers. Cancer incidence was assessed
Reynolds et al. (1987, cited by CEPA 1997)
30

RoC Background Document for Environmental Tobacco Smoke
Study Type Population Group Exposure Effects Potential Confounders/
Effects
Comments References
which 1111 were nonsmokers and followed for 17 years.
ascertained for each spouse.
a RR=1.68 for all cancer sites. For smoking related sites the RR=7.0 (1.05-47)(p=0.09).
via automated record linkage to the population-based cancer registry.
Cohort 1,538 never smoked (243 males, 1295 females), age 45-64 years in West Scotland.
Spousal smoking obtained from a self administered questionaire.
RR=2.41 (95% CI 0.45-12.83) for lung cancer, p=0.3.
Only 9 lung cancer deaths in both groups. The 1538 individuals who were exposed to passive smoking and the group of 917 controls without passive smoking.
np Hole et al. (1989)
Cohort 27,409 nonsmoking females in Sweden.
Spousal smoking, based on questionaire mailed to subjects.
67 lung cancer deaths. RR=3.3 (95% CI 1.1-11.4) for squamous cell and small cell carcinomas of women married to a smoker. Statistically significant (p<0.05) increase in small cell carcinomas and squamous cell.
np Dose response is observed.
Pershagen et al. (1987)
Cohort 114,286 female and 19,549 male never smokers compared with about 77,000 female and 77,000 male never smokers. Subjects enrolled in the American Cancer Society’s Cancer Prevention Study II.
Spousal smoking obtained from a questionnaire. Vital status obtained by personal inquiry by volunteer or from the National Death Index.
RR=1.2 (95% CI, 0.8-1.6) for ever exposure in women. Positive trend in risk with increasing cigarettes per day smoked by spouse (p=0.03) and pack years of exposure (p=0.1) but not in increasing years of marriage (p=0.5).
Adjusted for age, race, education, diet, asbestos exposure, blue collar employment, and history of chronic lung disease.
There is overall evidence that ETS exposure from smoking spouses may adversely affect lung cancer risk in never-smoking women.
Cardenas et al. (1997)
CASE-CONTROL STUDIES Lung Cancer
31

RoC Background Document for Environmental Tobacco Smoke
Study Type Population Group Exposure Effects Potential Confounders/
Effects
Comments References
Case- 432 nonsmoking ETS from parents, OR=1.0 (95% CI 0.8-1.2) and for np No increased risk was Brownson et al. Control female lung cancer spouse, and work 40+ pack-years OR=1.3 (95% CI observed from (1992)
cases and 1402 nonsmoking population-based controls in MO (1986-91).
based on interviews. 1.0-1.7) for lifetime nonsmokers. workplace ETS or from ETS exposures from parents.
Case- 210 lung cancer Smoking spouse OR=1.6 (95% CI 0.8-3.0) and for np Risk was strongest for Stockwell et al. Control cases among
nonsmoking females and 301 population-based nonsmoking controls in FL (1987-91).
based on interviews. those with 40+ years of exposure from husband and others the OR=2.4 (95% CI 1.1-5.3).
cell types other than adenocarcinomas. No association was observed between ETS exposure in the workplace and lung cancer risk.
(1992)
Case- 653 lung cancer Spousal smoking Adjusted OR=1.29 (95% CI 1.04- np OR=1.39 (1.11-1.74) Fontham et al. Control cases among
lifetime nonsmoking women age 65 and older with 1253 controls in 5 areas of the U.S. (New Orleans, Atlanta, Houston, Los Angeles, San Francisco) 1985-91.
information obtained from questionaire completed by subject or next-of-kin.
1.60) for any tobacco, Adj. OR=1.18 (95% CI 0.96-1.46) for cigarette exposure, and Adj. OR=1.79 (95% CI 0.99-3.25) for 80+ pack-years exposure from spousal smoking (p=0.03).
for ETS workplace exposure with OR=1.86 (1.24-2.78) for 30+ years of workplace exposure (p<0.01). ETS exposure during childhood was not associated with lung cancer (OR=0.89 [0.72-1.10]). Women who were exposed as children had higher RRs associated with adult ETS exposure.
(1991, 1994)
Case- 41 male and 69 Spousal smoking No significant increases: male np No effects of ETS in Kabat et al. Control female lung cancer obtained by OR=1.6 (95% CI 0.67-3.82) female the workplace. (1995) (Hospital- cases and 117 male interview. OR=1.08 (95% CI 0.6-1.94). Relatively small study based) and 187 female
controls all never which the authors interpret as
32

RoC Background Document for Environmental Tobacco Smoke
Study Type Population Group Exposure Effects Potential Confounders/
Effects
Comments References
smokers. Study was conducted at 6 hospitals in four U.S. cities (New York, Chicago, Detroit and Philadelphia) 1983-90.
unsupportive of an association between ETS and lung cancer.
Case-control 102 cases of adenocarcinoma of the lung (50 males and 52 females) and 131 controls (cancers of the colon 80 and bone marrow 51).
Passive smoking hours/day (0-3, 4-7, 8+) and pack-years (0, 1-39, 40+) of smoking obtained by interview.
Increased risk among smokers with ORs = 2.62 (95% CI 1.82-3.41) for 1-39 pack years and 5.81 (95% CI 5.01-6.61) for 40+ pack years. For passive smoking OR=1.24 (95% CI 0.53-1.95) for 4-7 hours/day and 1.37 (95% CI 0.54-2.20) for 8+ hours per day. Among nonsmoking females (66 females) OR= 1.68 (95% CI 0.39-2.97) for 4+ hours per day.
Analysis based on logistic regression adjusted for age, income, and occupation.
Increases in risk but limited study size.
Brownson et al. (1987)
Case-control 965 lung cancer cases and 959 controls among female nonsmokers in north-east China (Shenyang and Harbin).
Smoking spouse in the home, information obtained by structured pre-coded questionnaire and trained interviewers.
OR=0.7 (95% CI 0.6-0.9) for nonsmokers who lived with a spouse who smoked. A slight increase was seen from workplace exposures OR=1.1.
Heavy exposures to pollutants from coal-burning Kangs in the home.
np Wu-Williams et al. (1990)
Case-control 191 lung cancer cases and 191 controls. Both groups had never smoked.
Exposures in terms of smoker years (number of smokers in the home multiplied by years). Information provided by face to face interviews
The OR for lung cancer among persons who never smoked more that 100 cig and exposure to ≥ 75 smoker-years had an OR=1.11 (95% CI 0.56-2.20). Childhood and adolescence exposure to 25+ smoker years had OR=2.07 (95% CI 1.16-3.68).
Recall bias. Authors estimate that 17% of lung cancer among nonsmokers is due to childhood and adolescence exposures to ETS.
Janerich et al. (1990)
Case-control 144 nonsmoking Household smoking OR=1.50 (95% CI 1.01-2.22) for np A large proportion of Sobue (1990)
33

RoC Background Document for Environmental Tobacco Smoke
Study Type Population Group Exposure Effects Potential Confounders/
Effects
Comments References
female lung cancer cases and 731 nonsmoking female controls in Osaka, Japan.
information provided by self-administered questionnaire.
other household members smoking in adulthood. For only husband smoking the OR=1.13 (95% CI 0.78-1.63).
controls were cancer patients.
Case-control 91 cases of life-long nonsmokers and 120 controls.
Spousal smoking information provided in interview.
For contrasting women married to smokers with those married to nonsmokers the RR=1.92 (95% CI 1.02-3.59)
np Np Kalandidi et al. (1990)
Case-control Female A-bomb survivors: 94 lung cancer cases and 270 controls.
Spousal smoking information provided by structured questionnaire.
OR=1.5 (90% CI 1.0-2.5) Surrogate response on smoking.
Akiba et al. (1986)
Case-control 135 lung cancer cases among female nonsmokers and 135 controls in Shengyang, China.
Spousal smoking information provided in hospital interviews.
OR=1.11 (95% CI 0.65-1.88) np No relationship with spousal smoking rate or smoking duration.
Wang et al. (1996)
Case-control 105 nonsmoking female lung cancer cases and 105 controls in Kaohsiung, Taiwan during 1992-3.
Spousal smoking information provided by personal interviews.
OR=1.3 (95% CI 0.7-2.5) for females with smoking spouse.
np np Ko et al. (1997)
Case-control 200 cases and 200 controls of which 88 never smoked female lung cancer cases and 137 never smoked controls in Hong Kong, China.
Spousal smoking information provided by life-history interviews.
RR=1.64 (95% CI 0.87-3.09) for husbands who have ever smoked.
np No dose-response by smoking rate or duration.
Koo et al. (1987)
Case-control 672 cases and 735 controls of which
Spousal smoking information provided
OR=1.1 (95% CI 0.7-1.8), 1.3 (95% CI 0.8-2.1) and 1.7 (95% CI 1.0-
np np Gao et al. (1987)
34

RoC Background Document for Environmental Tobacco Smoke
Study Type Population Group Exposure Effects Potential Confounders/
Effects
Comments References
246 lung cancer cases of nonsmoking females and 375 controls in Shanghai, China.
by personal interview.
2.9) for 20-29, 30-39 and 40+ years of spousal smoking, respectively.
Case-control 99 lung cancer cases and 736 controls with no tobacco exposure.
Spousal smoking information provided by pooled data from 3 large incident case control studies.
OR=0.8 (95% CI 0.5-1.3) for spousal smoking and OR=1.24 (95% CI 0.62-2.51) for >40 years exposure.
np np Dalager et al. (1986)
Bladder Cancer Case-control 152 bladder cancer
cases (76 males, 76 females) and 492 controls (238 males, 254 females). All reported having never smoked.
Smoking spouse information provided by structured questionnaire.
Inconsistant results that were nonsignificant.
np Only 40 cases and 72 controls had passive smoking information. The passive smoking history was crude.
Kabat et al. (1986)
Case-control 826 bladder cancer cases and 792 controls all from Alberta, Toronto and parts of Ontario.
Home and work exposures to passive smoking among smokers and nonsmokers.
ORs were slightly lower among nonsmokers passively exposed at home or at work. This was true for both males and females.
np Only 142 cases and 217 controls were nonsmokers. Also the effects on bladder cancer for active smoking were only OR = 2.72. Cases were identified from hospital and medical records, where as the controls were chosed at random from province with listings and matched on basis of age, sex, and area of residence.
Burch et al. (1989)
35

RoC Background Document for Environmental Tobacco Smoke
Study Type Population Group Exposure Effects Potential Confounders/
Effects
Comments References
Breast Cancer Case-control 59 breast cancer Spousal smoking. For premenopausal women OR=7.0 np Only 12 cases among Sandler et al.
cases and 324 (95% CI 1.4-67.2) and post- pre-menopausal (1986) controls. menopausal women OR=1.2 (95% women.
CI 0.6-2.6).
Case-control 244 breast cancer cases and 1032 controls in Geneva, Switzerland.
Spousal smoking as well as occupational exposures. Information obtained in face to face interviews
OR for breast cancer related to passive smoking at home OR=2.6 (95% CI 1.6-4.3) for spousal smoking. And for high exposure (>50 hour/day-years) the OR = 2.7 (95% CI 1.5-4.7).
np No dose-response was observed. ETS effects were similar to the risks of active smoking.
Morabia et al. (1996)
Case-control 208 cases of breast Spousal smoking RR=1.38 (95% CI 0.92-2.09) for 1- np Unmatched analysis. Smith et al. cancer and 201 information obtained 200 cigarette-years and RR=0.84 Only 13 cases in the (1994) controls in the U.K. (47% were nonsmokers).
in interviews by trained personnel.
(95% CI 0.38-1.85) for 200+. 200+ group. Occupational exposures were also considered. No dose response effects were seen for any of the exposure variables. For active smoking the OR = 1.01 (95% CI 0.81-1.26) for breast cancer.
Cervical Cancer Case-control 103 Cervical
Cancer (CIN II and III) cases and 268 controls.
Passive smoking in home and at work. Information provided by telephone or personal interviews.
Among smokers (66 cases) no trend was observed with passive smoking. Among nonsmokers (37 cases) there was no association with passive smoking.
Age, race, education, number of pap smears, number of sexual partners, and history of genital warts.
Small study. A positive association OR=1.5 (95% CI 0.3-6.2) with husbands smoking after adjusting for the the confounders.
Coker et al. (1992)
Case-control 518 cancer cases and 518 controls. Included were 56
Spousal smoking. Information provided by mailed
Cervical cancer OR from passive exposure to cigarett smoke among nonsmokers OR=2.1 (95% CI 1.2-
Effects only observed in those under age 50
Adjustments for sexual activity were not made.
Sandler et al. (1985)
36

RoC Background Document for Environmental Tobacco Smoke
Study Type Population Group Exposure Effects Potential Confounders/
Effects
Comments References
cervical cancer. questionnaire. 3.9). (OR= 2.9 for < 50 yrs and OR= 0.9 for > 50 yrs).
Case-control 266 cases of cervical cancer and 408 controls. 81 cases and 305 controls were never smokers.
Hours of passive smoking both in and outside the home. Information provided by personal interviews.
ORs were 1.14 (95% CI 0.5-2.9), 1.57 (95% CI 0.5-4.7) and 3.43 (95% CI 1.2-9.5) for 0.1-0.9, 1.0-2.9 and 3.0+ hours per day exposure, respectively.
np Among active smokers the effect was the greatest among those with the fewest sexual partners.
Slattery et al. (1989)
Nasal Sinus Cancer Case-control 169 cases of nasal
sinus cancers and 338 controls in Hokkaido, Japan.
Number of smokers in the household provided by mailed questionnaire.
ORs were 1.4 (0.6-3.5), 2.0 (0.8-4.5) and 5.7 (1.7-19.4) for 1, 1+ and 2+ smokers in the home, respectively.
np np Fukuda and Shibata (1990; cited in CEPA 1997)
Case-control 147 nasal sinus cancers and 449 controls of never smoked U.S. white men.
Spousal smoking. Data collected as part of 1986 National Mortality follow-back Survey conducted by NCHS (National Center for Health Statistics).
OR of ever exposed to spousal passive smoking was 3.0 (95% CI 1.0-8.9).
np The effect (RR=3.0) was stronger than that of direct heavy smoking OR=2.0 (95% CI 1.0-4.0) in this study.
Zheng et al. (1993)
CHILDHOOD CANCERS COHORT STUDIES Cohort 497,051 children
born in Sweden 1982-7. Cancer cases were for those 5 years old and younger.
Maternal smoking. Information obtained from birth data on registry and telephone interviews.
Among 198 solid tumors RR=0.96 (95% CI 0.70-1.32) and 129 lymphatic/hematopoietic tumors RR=1.04 (95% CI 0.71-1.52). For 81 brain tumors RR=0.96 (95% 0.59-1.56).
np No relationship among cancer sites or amount smoked per day.
Pershagen et al. (1992)
CASE-CONTROL STUDIES Case-control 163 cases of
childhood Mothers smoking. Information provided
OR=1.0 (95% CI 0.6-1.7) for gestational and child risk ratios
np np Kuijten et al.
37

RoC Background Document for Environmental Tobacco Smoke
Study Type Population Group Exposure Effects Potential Confounders/
Effects
Comments References
astrocytoma and 163 controls.
in telephone interviews
related to mother's smoking. (1990)
Case-control 82 childhood (0-14) brain cancer cases and 164 controls in New South Wales 1988-90.
Parent smoking. Interviewed at home by trained personnel.
Fathers smoking OR = 2.2 (95% CI 1.2-3.8) and mother who continued smoking during pregnancy OR = 0.9 (95% CI 0.5-1.8).
Control women were of a higher social class.
No observed dose-response. Father’s smoking reported by mother and may involve recall bias.
McCredie et al. (1994)
Case-control 223 childhood cancer cases and 196 controls aged 0-14 years in Denver, CO.
Parents smoking. Information provided by structured interviews in the home.
For all cancers the OR=1.3 (95% CI 0.7-2.1) for mothers smoking and OR=1.2 (95% CI 0.8-2.1) for fathers smoking.
np Greater effects were seen for acute lymphocytic leukemia, OR=1.9 and 1.4, respectively.
John et al. (1991)
Case-control 74 brain cancer cases among children and 138 controls in Ontario.
Parent smoking. Information obtained in home interviews.
OR=1.42 (95% CI 0.7-3.0) for maternal smoking and OR=1.13 (95% CI 0.61-2.09) for paternal smoking during index pregnancy.
np np Howe et al. (1989)
Case-control Among the 16,193 children born one week in April, 1970 in Great Britain. 33 cancers observed during the first 10 years of life and were matched with 99 controls.
Parent smoking information collected by midwives and followed by child health and educaiton study.
Maternal smoking OR=2.69 (95% CI 1.05-6.89) for antenatal smoking.
np np Golding et al. (1990)
Case-control 305 childhood (0-16 years) cancer cases with 340 insulin-dependent diabetic controls in Sweden.
Maternal smoking. Information provided by structured questionnaire for self-assessment.
For total cancers, RR=1.07 (95% CI 0.63-1.80) and 1.56 (95% CI 1.05-2.33) for 1-9 and 10+ cigarettes per day, respectively. For ALL the RR values are =1.34 (95% CI 0.7-2.6) and 2.07 (95% CI 1.3-3.3).
np np Stjernfeldt et al. (1986)
Case-control 187 cases of Parental smoking OR=1.2 (95% CI 0.77-1.86) for np np Severson et al.
38

RoC Background Document for Environmental Tobacco Smoke
Study Type Population Group Exposure Effects Potential Confounders/
Effects
Comments References
childhood AML and 187 matched controls in MN.
information provided by telephone interviews.
maternal smoking during pregnancy.
(1993)
Case-control 555 children age 15 or less with cancer and 1,110 matched controls in 3 regions of the United Kingdom.
Maternal smoking information provided by standard questionnaire.
OR=1.12 (95% CI 0.85-1.47) and OR=0.84 (95% CI 0.65-1.09) for 1-10 and 11+ cigarettes per day, respectively for all childhood cancers. For 171 leukemias the OR=1.0 (95% CI 0.6-1.7) and OR=0.6 (95% CI 0.4-1.0) for the same smoking rates.
np np McKinney et al. (1987); McKinney and Stiller (1986); both cited by CEPA (1997)
Case-control 1,814 chilhood cancers cases in the US Children’s Cancer Study Group and 720 population controls.
Maternal smoking. OR=1.31 (95% CI 0.9-1.9) and OR=0.97 (95% CI 0.8-1.2) for 1-9 and 10+ cigarettes per day. For the subset of 742 ALL cases the values are OR=1.0 (95% CI 0.6-1.5) and OR=0.9 (95% CI 0.7-1.1), respectively.
np No association with maternal smoking was seen.
Buckley et al. (1986; cited by CEPA 1997)
Case-control 361 cases of brain cancer in 18 and younger children with 1083 controls.
Parental smoking. Information provided by structured interviews at home.
Comparing both parents smoking to neither parent smoking OR=0.95 (95% CI 0.66-1.36) and OR=1.06 (95% CI 0.82-1.37) for mother alone and OR=0.94 (95% CI 0.66-1.33) for father alone.
np No association was reported with parental smoking.
Gold et al. (1993)
Case-control 142 children with ALL, 22 with non-ALL and 19 with NHL in the pediatric hospital of Turin, Italy. 307 hospital controls.
Parental smoking. For ALL, OR=0.7 (95% CI 0.5-1.1) for maternal smoking and OR=0.9 (95% CI 0.6-1.5) for paternal. For non-ALL the values are 2.0 (95% CI 0.8-4.8) and 0.9 (95% CI 0.3-2.1) respectively.
np No association was reported with parental smoking.
Magnani et al. (1990; cited by CEPA 1997)
np: not provided * For further detail on these studies, see EPA (1992) and CEPA (1997), both in Appendix 3
39

RoC Background Document for Environmental Tobacco Smoke
3.5 Discussion The carcinogenicity of ETS has been evaluated in a series of comprehensive reviews. IARC (1986) found that the available evidence was insufficient to draw a conclusion, but all subsequent reports have concluded that ETS exposure is causally related to lung cancer in nonsmokers (NRC 1986; US DHHS 1986; EPA 1992; CEPA 1997). EPA (1992) conducted a formal meta-analysis including a total of 3,728 lung cancer cases, 80% of which were reported after the IARC review (1986), and found an overall increase in risk due to spousal ETS exposure of about 20%. This risk was derived by comparing nonsmokers with spousal exposure to nonsmokers without spousal exposure, regardless of other sources of exposure. Since workplace and social sources can make a significant contribution to ETS exposure (Pirkle et al. 1996), this calculation most likely underestimates the risk. In fact, when nonsmokers with spousal and other sources of exposure were compared to nonsmokers with no ETS exposure, the increase in risk was about 60%. CEPA (1997) reviewed four case-control studies and one cohort study published after the EPA report (Stockwell et al. 1992; Brownson et al. 1992; Fontham et al. 1991; 1994; Kabat et al. 1995; Cardenas et al. 1997), which collectively addressed many of the problems of earlier studies, and concluded that the results were consistent with the EPA (1992) estimate of a 20% increase in risk due specifically to spousal smoking.
Although it is unlikely that these findings are due to chance, a number of systematic biases have been proposed to account for this small increase in risk. Concerns have been raised regarding the possibilities of selection bias in hospital-based studies; of misclassification of non-lung cancers as lung cancer; of misclassification of former or current smokers as nonsmokers; of misclassification of the extent of ETS exposure in studies using surrogate respondants; and of confounding by dietary factors or occupational exposures. All of these issues are addressed by three recent large population-based studies (Stockwell et al. 1992; Brownson et al. 1992; Fontham et al. 1991; 1994). The possibility of selection bias is essentially eliminated in these studies by the identification of all lung cancer cases in a specified study area together with high response rates (83-90% for cases). The presence of primary lung cancer was confirmed histologically in 75-85% of cases in two of the studies (Brownson et al. 1992; Fontham et al. 1991; 1994) and all cases in the third (Stockwell et al. 1992). Multiple sources of information were used to confirm nonsmoking status; for example, medical records, physicians’ reports, screening interviews, structured interviews, and cotinine measurements were used by Fontham et al. (1991; 1994). A high proportion (64%) of the interviews in Fontham et al. (1991; 1994) were conducted with the cases themselves, rather than surrogates, suggesting that the information on ETS exposure is likely to be accurate. Finally, no confounding by dietary factors or vitamin supplements was observed by Fontham et al. (1991; 1994). This study observed an association of lung cancer with ETS after adjusting for age, race, study area, education, diet, family history of lung cancer, and employment in high-risk occupations.
Results from these case-controls studies are supported by the findings of a recent prospective cohort study, in which risk of lung cancer was associated with spousal exposure to ETS (Cardenas et al. 1997). The failure of this study’s results to achieve statistical significance may be due to the low power of the study (only 96 exposed women with lung cancer were studied) and/or the inadequate measure of exposure, both of which would likely reduce the ability of the study to observe an effect. Nevertheless, the reported risk of 1.2 is consistent with other studies and meta-analyses.
40

RoC Background Document for Environmental Tobacco Smoke
A major concern in studies of ETS exposure and lung cancer has been the possibility that nonsmokers are in fact current or former smokers, particularly since smokers tend to marry smokers. Wald et al. (1986) estimated that about 7% of ever smokers would be misclassified as nonsmokers. Two recent studies (Riboli et al. 1995; Nyberg et al. 1997), using different methodologies, conclude that the misclassification rate is low and unlikely to explain the lung cancer risk from ETS exposure. Riboli et al. (1995) conducted a large cross-sectional study to validate self-reported ETS exposure by analysis of urinary cotinine levels. Questionnaire data and urine samples were collected from 1,369 nonsmoking women. Twenty-seven women had cotinine levels between 50 and 150 ng/mg, and 16 of these reported high ETS exposure. Only 20 women (1.5% of 1,369) had cotinine levels above 150 ng/mg, and were probably covert smokers. Nyberg et al. (1997) calculated misclassification rates in two large Swedish cohorts who had been questioned regarding smoking habits on two occasions 6 to 10 years apart. Rates were calculated two ways. The first rate was the number of misclassified nonsmokers divided by the total number of ever smokers; the rates in the two cohorts were 4.9-5.0% for men and 4.5-7.3% for women. The second rate was the number of misclassified never smokers divided by the total number of never smokers; the rates in the two cohorts were 11.1-11.5% for men and 1.3-2.2% for women. The authors pointed out that the first rate is similar in many studies, but the second rate is quite variable and depends on the number of nonsmokers in a particular study. As in other studies, most of the misclassified nonsmokers studied by Nyberg et al. (1997) had stopped smoking years before and had smoked less than the average smoker. A recent analysis based on urinary cotinine measurements, which combined data from over 8,000 majority women reported in 10 studies, found that the proportion of regular smokers misclassified as nonsmokers was 0.8%; for occasional smokers the proportion was 6.0% (Wells et al. 1998). In general, the misclassification rate appears to be quite low in women, who are the subjects of most studies of lung cancer and ETS exposure. Thus it appears unlikely that misclassification of former or current smokers as nonsmokers can explain the association of lung cancer with ETS exposure.
Although much discussion has focused on the possibility that misclassification of smokers as nonsmokers could inflate the risk estimates, there are also sources of exposure misclassification which could reduce the risk estimates. Spousal smoking is considered to be the best single surrogate of ETS exposure, for several reasons. Measurements of cotinine in nonsmokers indicate that that spousal smoking contributes more exposure than workplace smoking (Pirkle et al. 1996). Databases on spousal smoking are generally larger and more likely to be accurate, since the data are often collected by interviewing proxies who may have relatively little knowledge of workplace exposures. Exposure in the home is likely to be more uniform than exposure in the workplace, since work environments change frequently. Nevertheless, workplace and social exposures do make a substantial contribution to overall exposure (Pirkle et al. 1996), so that categorizing as unexposed women whose husbands do not smoke but who are exposed to ETS in other environments can underestimate the true risk due to ETS exposure. Failure to consider the amount of exposure can also lead to underestimation of the true risk. In most studies, including those with marginal risks associated with ever exposure, risks at the highest level of exposure are more pronounced.
Another concern has been that, while ETS exposure from spousal smoking was associated with lung cancer in many studies, workplace exposure frequently was not. A meta-analysis of 12 studies by LeVois and Layard (1994) found an overall relative risk of 1.01 (95% CI, 0.92-1.11) associated with workplace exposure. A more recent meta-analysis (Wells 1998) established criteria for evaluating the 14 available studies; these criteria were: at least 10 years of exposure
41

RoC Background Document for Environmental Tobacco Smoke
history, no more than 50% surrogate responses for cases, greater than minimal exposure, no active smoking, and availability of raw data. Only 5 studies met these criteria; the combined relative risk was 1.39 (1.15-1.68). The author also reviewed previous meta-analyses, including that by LeVois and Layard (1994), and found that their negative conclusions depended on inclusion of seriously flawed studies and incorrect heavy weights assigned to relative risks less than unity (Wells 1998).
In summary, it appears unlikely that either confounding or other types of bias can account for the risk ascribed to ETS exposure. The consistency of risks observed across individual studies conducted with various populations and methodologies, the presence of an exposure-response relationship in many studies, and the biological plausibility of the relationship all argue strongly that the association of ETS exposure with lung cancer is causal.
Regarding other cancer sites, there is good evidence that ETS exposure is associated with nasal sinus cancer, and suggestive evidence for cervical cancer; available data do not support an association with bladder cancer; and the evidence is inconclusive regarding other sites and childhood cancer.
42

RoC Background Document for Environmental Tobacco Smoke
4 Studies of Cancer in Experimental Animals 4.1 Summary of Earlier Experiments The International Agency for Research on Cancer (IARC) Working Group reviewed the experimental evidence regarding the induction of pulmonary tumors in experimental animals by tobacco smoke and tobacco smoke condensate (IARC 1986). Pertinent points of this review are summarized below.
4.1.1 Exposure of laboratory animals to tobacco smoke by inhalation
Prior to 1986, attempts to produce lung cancer in experimental animals by exposing them to tobacco smoke were largely unsuccessful. Tobacco smoke-associated tumors in the respiratory tracts of rats (nasal adenocarcinoma and squamous cell carcinoma) and hamsters (laryngeal tumors) have been reviewed (IARC 1986). However, increased incidences of lung tumors per se in these species or in mice, rabbits, and dogs had not been reported. A variety of factors may contribute to these findings. For example, rodents are obligatory nose breathers and their complex nasal turbinates may afford protection. Also, experimental animals forced to inhale smoke respond with shallow and hesitant respiratory activity thereby reducing the amount of smoke that gains access to the lower reaches of the lung.
4.1.2 Tobacco smoke condensate
The topical application of cigarette smoke condensate, containing numerous chemicals known to be carcinogenic to laboratory animals and humans, has repeatedly been shown to induce both benign and malignant tumors. Cigarette smoke condensate, applied to the skin, is recognized as a tumor-initiator, tumor-promoter, and co-carcinogen. Instillation of tobacco smoke condensate into the lungs of experimental animals has caused squamous cell carcinoma. Topical application of the condensate to the oral mucosa of mice resulted in the induction of lung tumors in mice (reviewed by IARC 1986). Thus, the carcinogenic potential of tobacco smoke condensate is unequivocal.
4.2 Experiments Conducted Since the Last Review 4.2.1 Exposure of laboratory animals to tobacco smoke by the inhalation route
Witschi et al. (1995) conducted a six-month inhalation exposure study of male strain A/J mice to sidestream smoke (SS). Animals were exposed to SS for 6 hours a day, 5 days a week. The characteristics of the SS used in these experiments are summarized in Table 4-1. In addition to assessing effects of tobacco smoke on tumor incidence and tumor multiplicity, these workers determined the effects of exposure to smoke on the replication of epithelial cells in the respiratory tract by measuring the incorporation of BrdU into cells. All experimental and control animals survived for the entire experimental period and there was no treatment-related effect on body weight gain.
Table 4-1. Sidestream smoke characteristics to which A/J mice were exposed 6 hours a day, 5 days a week for 6 months
Measure Parameter Concentration
Total particulate matter (TPM) 4.1-4.5 ± 0.4-0.6 mg/m3
Carbon monoxide 17±2 ppm
43

RoC Background Document for Environmental Tobacco Smoke
Witschi et al. (1995)
Exposure to SS was associated with occasional, but inconsistent, changes in the incorporation of BrdU into respiratory epithelial cells in the large intrapulmonary airways and maxillar turbinates. Values in smoke-exposed mice were indistinguishable from those in controls between exposure weeks 4 and 16. BrdU incorporation experiments were terminated at 16 weeks. Labeling indices in tracheal epithelium, and in the alveolar zone, were unaffected by exposure to SS for up to 16 weeks.
Lung tumor incidences and tumor multiplicity, in control and smoke-exposed animals, are summarized below. Exposure to tobacco smoke had no effect on pulmonary tumor incidence or tumor multiplicity. The data are summarized in Table 4-2.
Table 4-2. Incidence and multiplicity of lung tumors in A/J mice exposed to sidestream smoke for up to six months
Parameter Smoke exposed Air control
Animals with lung tumors 12/36(33%) 12/36(33%) Animals with 1 lung tumor 9 10 Animals with 2 lung tumors 3 2
Tumors per animal (all animals) 0.42±0.65 0.39±0.60
Tumors per tumor bearing animal 1.250.45 1.07±0.39
Witschi et al. (1995)
Finch et al. (1996) conducted a six-month bioassay of cigarette smoke in female A/J strain mice. Animals were exposed to cigarette smoke or filtered air for 6 hours a day, 5 days a week for 26 weeks. The cigarette smoke exposure atmosphere used is characterized in Table 4-3.
Table 4-3. Average chamber concentrations to which A/J mice were exposed for 6 hours a day, 5 days a week for up to 6 months
Measure Parameter Concentration
Total particulate matter (TPM) 248±33 mg/m3
Carbon monoxide` 231 ppm Smoke particulate size 0.52±0.05 µm
Finch et al. (1996) Animals exposed to cigarette smoke lost approximately 17% of their beginning body weight during the first week of exposure. After the initial weight loss, smoke-exposed animals gained weight at a similar rate as the controls. The smoke-exposed animals, however, never fully regained their body weight.
At necropsy, the mean lung weight of smoke-exposed mice was significantly higher than that of controls (controls, 188±17 mg vs smoke exposed, 236±22 mg; p< 0.05). Tumor incidences in control and smoke-exposed mice were 5/19 and 0/19, respectively. The tumor multiplicity in all animals of control and smoke-exposed mice were 0.32 ± 0.58 and 0 ± 0 (P < 0.05), respectively.
44

RoC Background Document for Environmental Tobacco Smoke
Witschi et al. (1997a) exposed male A/J strain mice to tobacco smoke 6 hours a day, 5 days a week for 5 months, then afforded some of the animals a 4-month recovery period. Chamber parameters for these experiments are summarized below in Table 4-4.
Table 4-4. Average chamber concentrations to which A/J mice were exposed for 6 hours a day, 5 days a week for up to 5 months
Measure Parameter Concentration
Total particulate matter (TPM) 87.3±21
Mean mass diameter 0.41±0.02 µ
Geometric Standard Deviation. 1.87±0.12
Nicotine 16.1±6.3 mg/m3
Carbon monoxide` 244±40 ppm
Smoke particulate size 0.52±0.05 µm
Witschi et al. (1997a)
All smoke-exposed animals survived to the termination of the experimental period and there was no effect of exposure on body weight. Smoke-exposed and control animals were indistinguishable with respect to tumor incidence or tumor multiplicity when sacrificed at five months (after cessation of smoke exposure). When animals were given a four-month recovery period, however, both tumor incidence and multiplicity were significantly increased by prior exposure to tobacco smoke. Tumor incidences in mice used in these experiments are summarized in Table 4-5.
45

RoC Background Document for Environmental Tobacco Smoke
Table 4-5. Lung tumor incidences in mice exposed to sidestream smoke for up to five months
Experimental conditions
Parameter Air controls Smoke exposed
Tumor incidence 2/24 (8%) 6/24 (25%)
5 month’s exposure
Tumors/animal 0.1±0.1 0.3±0.1
Tumors/tumor bearing animal
1.0±0.0 1.2±0.2
5 month’s Tumor incidence
9/24 (38%) 20/24 (83%)
exposure and
4 month’s recovery
Tumors/animal 0.5±0.2 1.4±0.2
Tumors/tumor bearing animal
1.3±0.2 1.7±0.2
Witschi et al. (1997a)
In a parallel experiment, these researchers attempted to modify the incidence of lung tumors with an agent known to enhance lung tumors in A/J mice, the antioxidant butylated hydroxytoluene (BHT). A/J mice were exposed to tobacco smoke (with Total Suspended Particulate = 53 mg/m3) for 2.5 months. Concomitantly, they received a diet containing 0.5% of BHT. After the 2.5-month exposure period, animals were given a 6.5-month recovery period before sacrifice.
BHT administration did not influence tumor incidence or multiplicity (see also Section 4.2.2). However, the authors combined the data from this parallel experiment to demonstrate a higher incidence of tumors (and tumor multiplicity) in tobacco smoke-exposed animals (and mice exposed to ETS and BHT) compared with animals exposed to filtered air and exposed to BHT in the diet or given a diet without BHT. The pooled data are summarized in Table 4-6.
Table 4-6. Lung tumor incidences in A/J mice exposed to sidestream tobacco smoke and fed BHT
Experimental conditions Parameter Air controls Smoke exposed
46

RoC Background Document for Environmental Tobacco Smoke
2.5 months in smoke (53 mg TSP/m3) and 6.5 months
recovery
Tumor incidence 23/41 (56%) 28/38 (78%)a
Tumors/animal 0.8±0.1 1.3±0.2a
Tumors/ tumor bearing animal 1.4±0.1 1.8±0.2a
Witschi et al. (1997a) a Significantly greater than control, P<0.05.
The incidence of tumor bearing animals, tumors per animal, and tumors per tumor bearing animal were all elevated significantly in the tobacco smoke-exposed animals.
The effects of tobacco smoke (containing 83.4 mg/m3 suspended particles) on the incorporation of BrdU into alveolar epithelial cells was also studied. In these experiments, mice were exposed to smoke for one to ten weeks, and given zero to ten weeks of recovery time before the incorporation of BrdU into respiratory epithelium was assessed. While the incorporation indices for BrdU into alveolar cells in smoke-exposed animals tended to be numerically higher than in the control animals, differences were only occasionally statistically significant. The data are summarized in Table 4-7.
Table 4-7. Labeling indices in the Alveolar zone of A/J mice exposed to tobacco smoke then administered BrdU
Exposure groups
Labeling Indices in Alveolar Zone
Week Number Control Sidestream smoke
1 week exposure 6.9±0.6 10.4±1.0a
2 weeks exposure 8.2±0.5 9.8±0.4a
4 weeks exposure 6.5±1.0 8.7±1.3
6 weeks exposure 7.4±0.9 8.5±0.8
10 weeks exposure 5.1±0.6 6.0±0.2
10 weeks exposure 1 week recovery 3.7±0.5 6.8±1.4
10 weeks exposure 2 weeks recovery 3.0±0.4 3.2±0.6
10 weeks exposure 4 weeks recovery 3.7±0.7 6.7±0.9a
10 weeks exposure 10 weeks recovery 3.2±0.6 5.4±2.1
Witschi et al. (1997a) a Significantly different from controls (P<0.05)
The carcinogenic properties of the vapor component of SS have also been studied by exposing female A/J mice to filtered and unfiltered tobacco smoke (Witschi et al. 1997b). In these experiments, mice were exposed to filtered or unfiltered tobacco smoke for five months (6 h/d, 5 d/wk). Characterization of the inhaled tobacco smokes is shown in Table 4-8.
47

RoC Background Document for Environmental Tobacco Smoke
Table 4-8. Average chamber concentrations to which A/J mice were exposed for 6 hours a day, 5 days a week for up to 5 months
Parameter Whole smoke Filtered smoke
Carbon monoxide 23 ±2 ppm 23±2 ppm
Nicotine 13.4±3.3 mg/m3 3.1±2.0 mg/m3
Total suspended particulates 78.5±12.4 mg/m3 0.1±0.2 mg/m3
Witschi et al. (1997b) Some mice were sacrificed upon cessation of smoke exposure (after five months), while others were given a four-month recovery period.
Animals exposed to unfiltered smoke lost body weight during the first month of the experiment, but they began gaining weight between the first and second months of exposure. The weight gain occurred at a slower rate than that of animals breathing the filtered smoke. The results of this experiment, with respect to tumor incidence and tumor multiplicity, are presented in Table 4-9.
Table 4-9. Lung tumors in strain A/J mice exposed to tobacco smoke for up to five months
Experimental conditions Parameter Air controls Smoke exposed
Tumor incidence 4/20 (20%) 12/24 (50%)
5 months filtered smoke Tumors/animal 0.3±0.1 (n=20)
0.7±0.2 (n=24)
Tumors/tumor bearing animal
1.3±0.3 (n=4)
1.4±0.1 (n=24)
Tumor incidence 9/24 (38%) 16/24 (67%)
5 months filtered smoke plus 4 months recovery
Tumors/animal 0.5±0.3 (n=24)
1.2±0.3a
(n=24)
Tumors/tumor bearing animal
1.2±0.1 (n=9)
1.8±0.4 (n=16)
Tumor incidence 10/24 (42%) 15/26 (58%)
5 months unfiltered smoke plus 4 months recovery
Tumors/tumor bearing animal
0.5±0.3 (n=24)
1.2±0.3 a
(n=24)
Tumors/animal 1.2±0.1 (n=10)
2.3±0.3a
(n=15)
Witschi et al. (1997b) aSignificantly different from controls, P<0.05
Among animals sacrificed after five months of exposure, lung tumor incidence and tumor multiplicity in animals exposed to filtered smoke were numerically (but not statistically) greater than were those in animals exposed to filtered air.
48

RoC Background Document for Environmental Tobacco Smoke
After the four-month recovery period, lung tumor multiplicity, in the group exposed to filtered smoke, was significantly greater than in animals exposed to air. In addition, tumor multiplicity was significantly greater in unfiltered smoke-exposed animals, given a four-month recovery period, than in air-exposed controls with the same recovery period.
4.2.2 Interactions of cigarette smoke with known carcinogens
Finch et al. (1996) pretreated female A/J mice with 100 mg/kg of nitrosamine, 4-(methylnitrosamino)-1-(3-pyridyl)-1-butanone (NNK), then exposed them to cigarette smoke, characterized below in Table 4-10.
Table 4-10. Average chamber concentrations to which A/J mice were exposed for 6 hours a day, 5 days a week for 26 weeks
Measure Parameter Concentration
Total particulate matter (TPM) 248±33 mg/m3
Carbon monoxide 231 ppm Smoke particulate size 0.52±0.05 µm
Finch et al. (1996)
Exposures were 6 hours a day, 5 days a week for 26 weeks. At necropsy, the lung weights of animals exposed to NNK plus smoke were significantly greater than those from animals exposed to NNK alone (228 ± 13 mg vs 190 ± 23 mg, respectively; p<0.05). Tumor incidences in the experimental groups are summarized in Table 4-11.
Table 4-11. Lung tumor incidences in A/J mice exposed to tobacco smoke for up to 26 weeks
Parameter Filtered air Cigarette smoke
Filtered air + NNK Cigarette smoke + NNK
Mice with nodules (tumors)
5/19 (26%) 0/19 (0%) 19/20 (95%) 13/16 (81%)
Tumors per animal (all animals)
0.32±0.58 0±0 2.50±1.67 2.50±1.97
Tumors per tumor bearing animal
1.20±0.44 N/A 2.63±1.61 3.09±1.71
Finch et al. (1996)
Mice exposed to NNK had a higher incidence of lung tumors than did filtered air controls. Exposure of NNK dosed mice to cigarette smoke affected neither lung tumor incidence, nor the extent of tumor multiplicity.
Witschi et al. (1997a) studied the interactions of SS with other chemicals known to influence the incidence of lungs tumors. A/J mice were dosed intraperitoneally with either 500 mg/kg of urethane or 20 mg/kg of 3-methylcholanthrene. The animals were then exposed to tobacco smoke (with Total Suspended Particulates = 53 mg/m3; 6 h/d, 5 d/wk for 5 mos.) or air.
49

RoC Background Document for Environmental Tobacco Smoke
Half the animals were sacrificed when exposure to tobacco smoke was terminated and the others were given a four-month recovery period. The results are summarized in Table 4-12.
Table 4-12. Lung tumor incidences in A/J mice exposed to tobacco smoke and urethane or 3-methylchlolanthrene
Experimental group
Tumors per lung
Treated with urethane Treated with 3-methylcholanthrene
Air exposed Smoke exposed Air exposed Smoke exposed
5 months exposure 11.3±1.2 (n=12)
5.3±0.9a
(n=12) 6.9±1.6 (n=10)
2.3±0.8a
(n=9)
5 months exposure, 4 months recovery
16.7±0.9 (n=11)
16.3±1.4 (n=12)
11.9±3.1 (n=11)
8.3±1.2 (n=11)
Witschi et al. (1997a) aSignificantly less than control (P<0.05)
Urethane and 3-methylcholanthrene-induced tumor multiplicity, when measured immediately after cessation of exposure, was significantly reduced by exposure to tobacco smoke. However, after the recovery period, tumor multiplicity was similar in air-exposed and smoke-exposed groups.
The researchers also attempted to modify the incidence of lung tumors, and/or tumor multiplicity, by concomitantly administering an agent known to enhance lung tumor development, the antioxidant butylated hydroxytoluene (BHT). A/J mice were exposed to tobacco smoke (and a diet containing 0.5% of BHT for 2.5 months) and then afforded a 6.5-month recovery period before sacrifice. The results of this experiment are summarized in Table 4-13.
50

RoC Background Document for Environmental Tobacco Smoke
Table 4-13. Lung tumor incidences in A/J mice exposed to tobacco smoke and fed BHT
Parameter Smoke + BHT Smoke + control diet Air + BHT Air + control diet
Tumor incidence 13/17 (76%) 15/21 (71%) 10/18 (56%) 13/23 (57%)
Tumors/animal 1.5±0.3 (n=17) 1.1±0.2 (n=21) 0.8±0.2 (n=18) 0.7±0.2 (n=23)
Tumors/tumor bearing animal 2.0±0.3 (n=13) 1.5±0.2 (n=15) 1.5±0.2 (n=10) 1.2±0.1 (n=13)
Witschi et al. (1997a)
Dietary administration of BHT had no influence on either tumor incidence or tumor multiplicity in A/J mice that had been exposed to tobacco smoke.
51

RoC Background Document for Environmental Tobacco Smoke
5 Genotoxicity 5.1 Prokaryotic Systems 5.1.1 Induction of Mutation in Salmonella typhimurium
Lofroth et al. (1983) tested incoming and exhaust air in two large office buildings for mutagenicity to Salmonella typhimurium strains TA98 and TA100 under three conditions: days of no activity (Sunday), days of forbidden smoking, and days with smoking permitted. Their results indicated an increase of mutagenicity of both incoming and exhaust air on both days of activity, with the greatest increase on the days when smoking was permitted. The results imply that cigarette sidestream particulate matter can be a substantial source of airborne mutagenicity.
Ong et al. (1984) used an in situ microbial assay system that permitted entrapment of mutagenic airborne particles from cigarette smoke by infusing unfiltered air into a trapping medium containing bacterial cells. New S. typhimurium strains (TA98W, TA100W, and SV50W) were utilized. A three- to five-fold increase in reversion frequency could be seen after 30 minutes of exposure. The rates continued to increase with length of exposure time. The increases were statistically significant compared to controls (Table 5-1). In comparisons with the same test materials in the standard plate incorporation assay, the in situ assay system appears to be more effective in detection of cigarette smoke mutagenicity.
Table 5-1. Mutagenicity assay of cigarette smoke by the in situ test systema,d
Cigarette brandb
Treatment time (h)
Control set Experimental set
Survival (%) Revertant/108
survivorsc Survival (%) Revertant/108
survivorsc
A 0.5 100 10.9 (7) 99.0 40.4 (29)
1 100 10.1 (9) 100.0 46.6 (42) 2 100 6.7 (7) 100.0 52.7 (52)
4 100 8.2 (7) 86.1 88.9 (78)
B 0.5 100 5.7 (9) 100.0 18.9 (32)
1 100 6.0 (9) 100.0 32.4 (50)
2 100 8.1 (8) 100.0 57.0 (59)
4 100 10.3 (12) 70.8 86.9 (73)
C 0.5 100 5.4 (8) 76.2 31.6 (31)
1 100 7.1 (8) 81.0 34.6 (34) 2 100 4.5 (6) 83.3 58.8 (60)
4 100 4.9 (5) 80.6 107.0 (97)
52
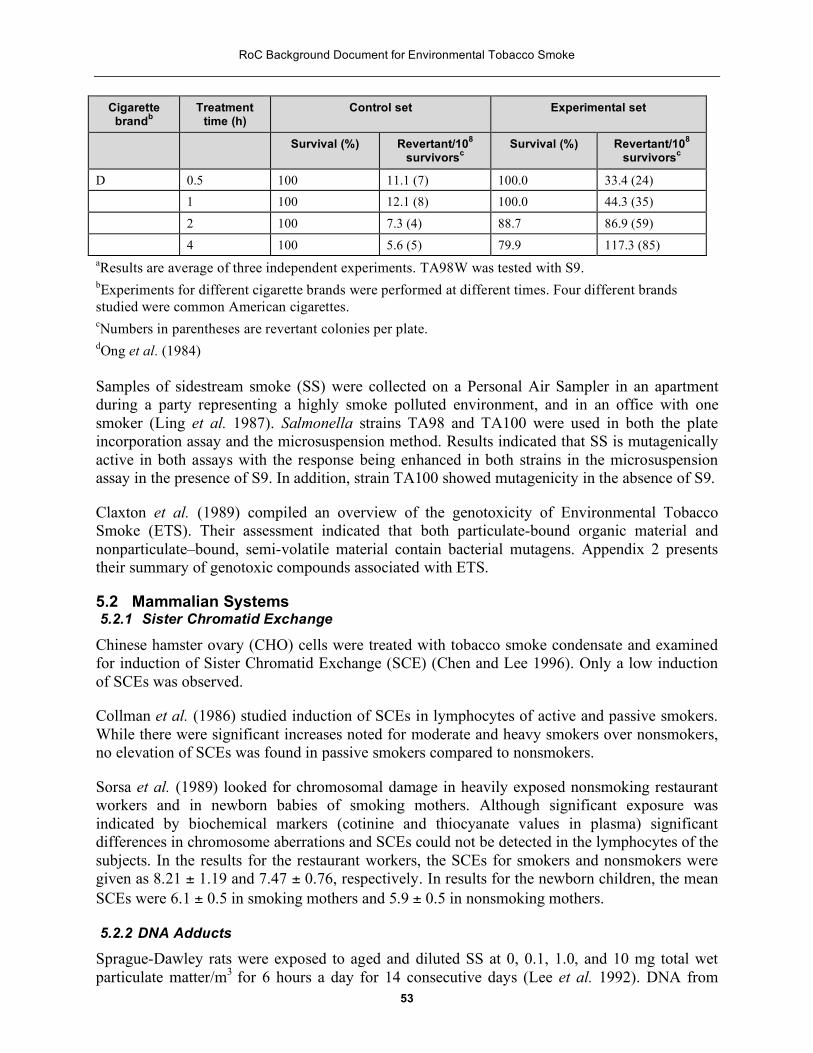
RoC Background Document for Environmental Tobacco Smoke
Cigarette brandb
Treatment time (h)
Control set Experimental set
Survival (%) Revertant/108
survivorsc Survival (%) Revertant/108
survivorsc
D 0.5 100 11.1 (7) 100.0 33.4 (24) 1 100 12.1 (8) 100.0 44.3 (35)
2 100 7.3 (4) 88.7 86.9 (59)
4 100 5.6 (5) 79.9 117.3 (85) aResults are average of three independent experiments. TA98W was tested with S9. bExperiments for different cigarette brands were performed at different times. Four different brands studied were common American cigarettes. cNumbers in parentheses are revertant colonies per plate. dOng et al. (1984)
Samples of sidestream smoke (SS) were collected on a Personal Air Sampler in an apartment during a party representing a highly smoke polluted environment, and in an office with one smoker (Ling et al. 1987). Salmonella strains TA98 and TA100 were used in both the plate incorporation assay and the microsuspension method. Results indicated that SS is mutagenically active in both assays with the response being enhanced in both strains in the microsuspension assay in the presence of S9. In addition, strain TA100 showed mutagenicity in the absence of S9.
Claxton et al. (1989) compiled an overview of the genotoxicity of Environmental Tobacco Smoke (ETS). Their assessment indicated that both particulate-bound organic material and nonparticulate–bound, semi-volatile material contain bacterial mutagens. Appendix 2 presents their summary of genotoxic compounds associated with ETS.
5.2 Mammalian Systems 5.2.1 Sister Chromatid Exchange
Chinese hamster ovary (CHO) cells were treated with tobacco smoke condensate and examined for induction of Sister Chromatid Exchange (SCE) (Chen and Lee 1996). Only a low induction of SCEs was observed.
Collman et al. (1986) studied induction of SCEs in lymphocytes of active and passive smokers. While there were significant increases noted for moderate and heavy smokers over nonsmokers, no elevation of SCEs was found in passive smokers compared to nonsmokers.
Sorsa et al. (1989) looked for chromosomal damage in heavily exposed nonsmoking restaurant workers and in newborn babies of smoking mothers. Although significant exposure was indicated by biochemical markers (cotinine and thiocyanate values in plasma) significant differences in chromosome aberrations and SCEs could not be detected in the lymphocytes of the subjects. In the results for the restaurant workers, the SCEs for smokers and nonsmokers were given as 8.21 ± 1.19 and 7.47 ± 0.76, respectively. In results for the newborn children, the mean SCEs were 6.1 ± 0.5 in smoking mothers and 5.9 ± 0.5 in nonsmoking mothers.
5.2.2 DNA Adducts
Sprague-Dawley rats were exposed to aged and diluted SS at 0, 0.1, 1.0, and 10 mg total wet particulate matter/m3 for 6 hours a day for 14 consecutive days (Lee et al. 1992). DNA from
53

RoC Background Document for Environmental Tobacco Smoke
lung, heart, larynx, and liver were tested for adduct formation after 7 and 14 days of exposure, and 14 days of recovery. Slight diagonal radioactive zones were observed, but only in lung and heart DNA of animals exposed to the highest concentration. There was no elevation of chromosomal aberrations in alveolar macrophages.
Holz et al. (1990) subjected male volunteers to different smoking and passive smoking conditions. Nonsmokers were exposed to the gas phases of ETS in one study, and complete ETS in another. Smoking-related adducts were visible in the peripheral blood monocytes of active smokers only. Effects were not observed in heavily exposed passive smokers.
Daube et al. (1997) examined placental DNA for the presence of the 8-hydroxy-2'-deoxyguanosine (8-OHdG) adduct in nonsmokers, nonsmoking women exposed to ETS, and smokers. Levels of 8-OhdG were 0.84 +/-0.11, 0.90 +/- 0.21, and 0.83 +/-0.20/105 for the three exposure groups, respectively. The differences between the groups were not significant.
54

RoC Background Document for Environmental Tobacco Smoke
6 Mechanistic and Relevant Studies 6.1 Administration of tobacco-smoke condensate The International Agency for Research on Cancer (IARC) Working Group reviewed studies in which cigarette smoke condensate extracts were applied to the shaved skin of rodents (IARC 1986). Such treatment was shown to produce a high incidence of papillomas and carcinomas at the sites of application. Numerous technical factors, such as species of test animals, solvents for the condensate, and source of cigarettes affect the quantitative outcome of experiments.
Application of cigarette smoke condensate to mouse skin produces both benign and malignant tumors. The tumors induced are usually epidermal in origin, but may also include an incidence of mastocytomas (Ohmori et al. 1981), cited in IARC (1986). Rat skin appears less responsive than mouse skin. McGregor (1976) and McGregor and Myers (1982), cited in IARC (1986), reported only low incidences of benign tumors when cigarette smoke condensate extract was painted on dekeratinized rat skin. The IARC Working Group noted that the results were equivocal. Bernfeld and Homburger (1983), cited in IARC (1986), reported that hamster skin was not responsive to cigarette smoke condensate extract, but their dosed animals were observed for only 46-47 weeks.
It has been reported that sidestream smoke (SS) contains up to ten-fold higher concentrations of known tobacco smoke carcinogens and 50 times more tumorigenic nitrosamines than mainstream smoke (MS) (IARC 1986; Hoffmann et al. 1987). Consequently, experiments comparing the relative carcinogenic potencies of SS and MS cigarette smoke condensate are of interest.
SS and MS cigarette smoke condensates were collected and their carcinogenic potencies compared on the skin of female MNRI mice (Mohtashamipur et al. 1990). SS condensates were dissolved in acetone, then applied to the shaved backs of mice at concentrations sufficient to deliver weekly doses of 1.7, 3.3, or 5 µg of benzo[a]pyrene/kg body weight (i.e., 5, 10, or 15 mg of condensate, respectively). For these experiments, the quantity of MS smoke condensate applied was the same, regardless of benzo[a]pyrene content (Benzo[a]pyrene content in MS was not reported). Animals were dosed for three months, then observed until natural death.
Application of SS reduced survival of mice as compared to both negative controls (P=0.003) and the MS condensate exposed group (P=0.01). Survival of animals dosed with MS condensate was not different from that of controls. The survival of experimental mice is summarized in Table 6-1.
55

RoC Background Document for Environmental Tobacco Smoke
Table 6-1. Survival of female NMRI mice dosed with extracts of SS or MS cigarette smoke condensate
Experimental Group n
Mean Life Span
(months) P
Negative control 210 17.9±5.2 -----
Mainstream 210 17.8±4.3 0.43 (relative to control)
Sidestream 210 16.7±4.7 0.003 (relative to control)
0.01 (relative to main-stream)
Mohtashamipur et al. (1990)
The incidences of tumors (skin tumors plus mammary tumors beneath the application site) in experimental animals are shown in Table 6-2.
Table 6-2. Number of mice with tumors at or beneath the skin site of application of SS or MS cigarette smoke condensate
Experimental Group Initial
animals Final animals Animals with tumors
Animals with precancerous skin
lesions
Negative control Shaved + acetone 70 42 0 2
Shaved only 70 44 0 1 Untreated 70 43 0 0
Positive control 5 µg benzo[a]pyrene 70 43 6 13 10 µg benzo[a]pyrene 70 42 23 18
MS smoke 5 mg 70 58 4 10
10 mg 70 61 0 15 15 mg 70 58 3 10
SS smoke 5 mg 70 60 5 12
10 mg 70 61 5 21 15 mg 70 61 20 23
Mohtashamipur et al. (1990)
The incidences of skin tumors, although generally greater in condensate or benzo[a]pyrene dosed animals, did not necessarily increase in dose-related fashions. Also, the authors noted, tumor
56

RoC Background Document for Environmental Tobacco Smoke
incidence in mice dosed with 15 mg of SS condensate (equivalent to 5 µg/kg of benzo[a]pyrene) was three-fold higher than in animals dosed with 5 µg/kg of benzo[a]pyrene per se.
These researchers concluded that their results support the hypothesis that SS poses a greater carcinogenic risk than MS.
6.2 Carcinogenicity of tobacco-specific carcinogens Approximately 40 carcinogenic substances have been identified in cigarette smoke, and some of these materials are tobacco-specific since they are derived only from tobacco alkaloids. Two of these tobacco-specific nitrosamines, 4-(methylnitrosamino)-1-(3-pyridyl)-1-butanone (NNK) and N’-nitrosonornicotine (NNN), have been reported to cause respiratory tract cancers in animals regardless of the administration route. NNK causes pulmonary tumors in rats, mice, and hamsters. NNN also causes pulmonary tumors in mice. In rats, however, it causes esophogeal and nasal tumors and, in hamsters, tumors of the trachea (Hoffmann and Hecht 1985; Hecht and Hoffman 1988; Rivenson et al. 1988; all cited in Hecht et al. 1993).
Administration of NNK to A/J mice has been described as a rapid, single-dose model of tumorigenesis (Hecht et al. 1991). Single intraperitoneal doses of 0, 5, or 10 µmol of NNK were administered to female A/J mice, then the animals were observed for 3.5 months. The results of this experiment are summarized in Table 6-3.
Table 6-3. Tumorigenicity of NNK in A/J mouse lung
Dose level of NNK
(µmol/mouse1) Animals with tumor
Lung adenomas/mouse
± standard deviation
0 2/30 (7%) 0.1±0.3
5 27/30 (90%) 2.5±1.7
10 30/30 (100%) 7.3±3.5
Hecht et al. (1991) Groups of 30 mice received single ip injections of NNK
The injection of single doses of NNK produced maximal tumor responses in A/J mice within 3.5 months. In terms of percent of animals with tumors, the response to 5 µmol was similar to that elicited by 10 µmol (90-100%). Under this circumstance, it is not possible to demonstrate dose-response relationships. The dose-response relationship was unequivocal, however, when tumor multiplicity was considered (lung adenomas/mouse).
6.3 Metabolism of tobacco-specific nitrosamines The metabolism of NNN and NNK in rodents and primates was reviewed (Hecht et al. 1994) and two metabolites specific to NNK (4-[methylnitrosamino]-1-[3-pyridyl]-1-butanol and its glucuronide) were reported to appear in human urine. 4-(Methylnitrosamino)-1-(3-pyridyl)-1-butanol-glucuronide is considered a detoxification product of NNK, while 4-(methylnitrosamino)-1-(3-pyridyl)-1-butanol, per se, is known to form pyridyloxobutyl adducts with lung and liver DNA (Peterson et al. 1991). Metabolically activated NNK and NNN are reported to form hemoglobin and DNA adducts in humans and the DNA adduct concentrations in smokers’ lung tissue are higher than in nonsmokers lungs (Hecht et al. 1994).
57

RoC Background Document for Environmental Tobacco Smoke
Both NNN and NNK have been demonstrated to undergo oxidative metabolism in human hepatic microsomes and this metabolism results in the formation of highly electrophilic derivatives (Staretz et al. 1997a). These researchers also reported that, in rats, NNK metabolism proceeds through intermediates that methylate and pyridyloxobutylate DNA (Staretz et al. 1997b). NNK-induced lung tumor incidence in rats was dose-related and there was a correlation between the formation of pyridyloxobutyl DNA adducts and lung tumor incidence.
Inasmuch as the only source of NNK can be tobacco (smoking, chewing, or exposure by ETS), quantitation of the metabolites may be useful in assessing the systemic exposure to tobacco smoke carcinogens associated with inhaling both MS and SS tobacco smoke. In addition, data concerning excretion of NNK metabolites may be useful in quantitating relative carcinogenic risks between active and passive inhalation of tobacco smoke (also discussed in Section 2).
Nonsmokers were exposed to machine-generated SS and then NNK metabolites were measured in their urine (Hecht et al. 1993). The controlled environment to which nonsmokers were exposed was considered to be comparable to a heavily smoke-polluted bar. Nicotine concentrations in the experimentally produced environments ranged from 62 to 230 µg/m3.
Subjects were exposed for two, 2.5 hour sessions during the experimental day. Urine samples taken every 24 hours were analyzed for 4-(methylnitrosamino)-1-(3-pyridyl)-1-butanol (NNAL), its glucuronide (NNAL-glucuronide), and cotinine. The experiment was replicated (with the same subjects) six months later.
The results from two experiments conducted at approximately six-month intervals are shown in Table 6-4.
Table 6-4. NNAL, NNAL Glucuronide, and Cotinine excreted in urine (during 24 hours) from men exposed to SS cigarette smoke
SubjectNo.
NNAL
ng/24 h
NNAL Glucuronide
ng/24 h
Cotinine
µg/24 h
Study 1 Pre-exposure Post exposure Pre-exposure Post exposure Pre-exposure Post exposure
1 <0.6 3.6 - - <2 62
2 <0.6 6.0 - - <2 66 3 <0.6 15 <1.0 44.2 3.7 123
4 2.7 6.7 25.8 55.3 18 146
5 1.4 4.1 - - <2 18 Study 2
1 <0.6 2.7 <1.0 15.1 <2 92
2 1.3 4.4 5.3 13.1 2.8 57 3 <0.6 4.0 1.4 12.3 4.8 65
58
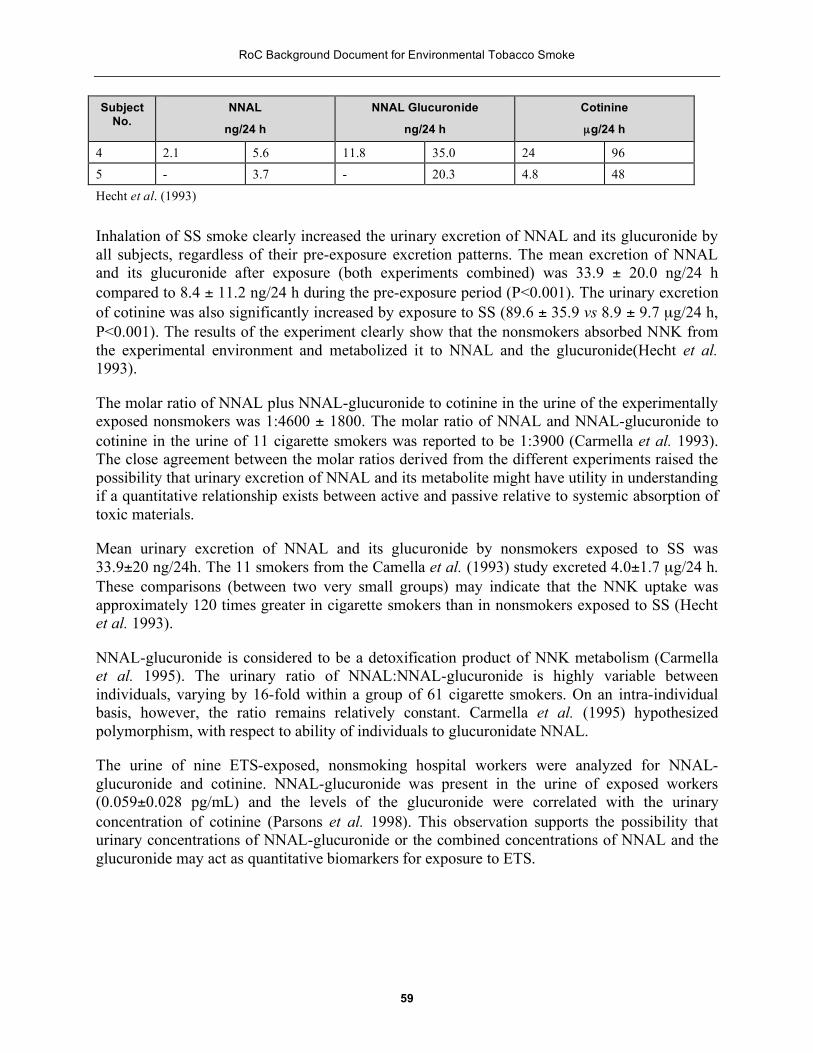
RoC Background Document for Environmental Tobacco Smoke
Subject No.
NNAL
ng/24 h
NNAL Glucuronide
ng/24 h
Cotinine
µg/24 h
4 2.1 5.6 11.8 35.0 24 96 5 - 3.7 - 20.3 4.8 48
Hecht et al. (1993)
Inhalation of SS smoke clearly increased the urinary excretion of NNAL and its glucuronide by all subjects, regardless of their pre-exposure excretion patterns. The mean excretion of NNAL and its glucuronide after exposure (both experiments combined) was 33.9 ± 20.0 ng/24 h compared to 8.4 ± 11.2 ng/24 h during the pre-exposure period (P<0.001). The urinary excretion of cotinine was also significantly increased by exposure to SS (89.6 ± 35.9 vs 8.9 ± 9.7 µg/24 h, P<0.001). The results of the experiment clearly show that the nonsmokers absorbed NNK from the experimental environment and metabolized it to NNAL and the glucuronide(Hecht et al. 1993).
The molar ratio of NNAL plus NNAL-glucuronide to cotinine in the urine of the experimentally exposed nonsmokers was 1:4600 ± 1800. The molar ratio of NNAL and NNAL-glucuronide to cotinine in the urine of 11 cigarette smokers was reported to be 1:3900 (Carmella et al. 1993). The close agreement between the molar ratios derived from the different experiments raised the possibility that urinary excretion of NNAL and its metabolite might have utility in understanding if a quantitative relationship exists between active and passive relative to systemic absorption of toxic materials.
Mean urinary excretion of NNAL and its glucuronide by nonsmokers exposed to SS was 33.9±20 ng/24h. The 11 smokers from the Camella et al. (1993) study excreted 4.0±1.7 µg/24 h. These comparisons (between two very small groups) may indicate that the NNK uptake was approximately 120 times greater in cigarette smokers than in nonsmokers exposed to SS (Hecht et al. 1993).
NNAL-glucuronide is considered to be a detoxification product of NNK metabolism (Carmella et al. 1995). The urinary ratio of NNAL:NNAL-glucuronide is highly variable between individuals, varying by 16-fold within a group of 61 cigarette smokers. On an intra-individual basis, however, the ratio remains relatively constant. Carmella et al. (1995) hypothesized polymorphism, with respect to ability of individuals to glucuronidate NNAL.
The urine of nine ETS-exposed, nonsmoking hospital workers were analyzed for NNAL-glucuronide and cotinine. NNAL-glucuronide was present in the urine of exposed workers (0.059±0.028 pg/mL) and the levels of the glucuronide were correlated with the urinary concentration of cotinine (Parsons et al. 1998). This observation supports the possibility that urinary concentrations of NNAL-glucuronide or the combined concentrations of NNAL and the glucuronide may act as quantitative biomarkers for exposure to ETS.
59

RoC Background Document for Environmental Tobacco Smoke
7 References 1. Adlkofer, F. and W.D. Heller. 1995. Exposure to environmental tobacco smoke and risk of
lung cancer: the epidemiological evidence [letter; comment]. Eur. Respir. J. 8:1240-1241.
2. Akiba, S., H. Kato, and W.J. Blot. 1986. Passive smoking and lung cancer among Japanese women. Cancer Res. 46:4804-4807.
3. Ayer, H.E. and D.W. Yeager. 1982. Irritants in cigarette smoke plumes. Am. J. Public Health 72:1283-1285.
4. Battista, S. P. Ciliatoxic components of cigarette smoke. Smoking and health.I.Measurement in the analysis and treatment of smoking behavior. NIDA Research Monographs. In: Wynder, EL, Hoffmann, D, and Gori, GB. DHEW Publ.No.(NIH) 76-1221.U.S.Government printing office U.S, Department of Health Education and Welfare, Washington, D.C.. 48, 517-534. 1976.
5. Bernfeld, P. and F. Homburger. 1983. Skin painting studies in Syrian hamsters. Prog. Exp. Tumor Res. 26:128-153.
6. Bero, L.A., S.A. Glantz, and D. Rennie. 1994. Publication bias and public health policy on environmental tobacco smoke. JAMA 272:133-136.
7. Branoff, S, Miller, S. L., Van Loy, M., and Nazaroff, W. W. Assessing Exposure to Air Toxicants From Environmental Tobacco Smoke: A Monte-Carlo-Based Assessment of Californian Exposures. Progress Report - Phase II . 4-27-1998.
8. Brownson, R.C., M.C. Alavanja, E.T. Hock, and T.S. Loy. 1992. Passive smoking and lung cancer in nonsmoking women. Am. J. Public Health 82:1525-1530.
9. Brownson, R.C., J.S. Reif, T.J. Keefe, S.W. Ferguson, and J.A. Pritzl. 1987. Risk factors for adenocarcinoma of the lung [published erratum appears in Am J Epidemiol 1987 Aug;126(2):363]. Am. J. Epidemiol. 125:25-34.
10. Brunnemann, K.D., S.S. Hecht, and D. Hoffmann. 1982. N-nitrosamines: environmental occurrence, in vivo formation and metabolism. J. Toxicol. Clin. Toxicol. 19:661-688.
11. Brunnemann, K.D., J. Masaryk, and D. Hoffmann. 1983. Role of tobacco stems in the formation of N-nitrosammines in tobacco and cigarette mainstream and sidestream smoke. J. Agric. Food chem., 31:1221-1224.
12. Brunnemann, K. D. and Hoffmann, D. Analysis of volatile nitrosamine in tobacco smoke and polluted indoor environments. IARC. Sci. Publ. 19, 343-356. 1978.
13. Brunnemann, K.D., B. Prokopczyk, M.V. Djordjevic, and D. Hoffmann. 1996. Formation and analysis of tobacco-specific N-nitrosamines. Crit. Rev. Toxicol. 26:121-137.
14. Brunnemann, K.D., A. Rivenson, S.C. Cheng, V. Saa, and D. Hoffmann. 1992. A study of tobacco carcinogenesis. XLVII. Bioassays of vinylpyridines for genotoxicity and for tumorigenicity in A/J mice. Cancer Lett. 65:107-113.
60

RoC Background Document for Environmental Tobacco Smoke
15. Buckley, J.D., W.L. Hobbie, K. Ruccione, H.N. Sather, W.G. Wood, and G.D. Hammond. 1986. Maternal smoking during pregnancy and the risk of childhood cancer. Lancet 1:519-520.
16. Burch, J.D., T.E. Rohan, G.R. Howe, H.A. Risch, G.B. Hill, R. Steele, and A.B. Miller. 1989. Risk of bladder cancer by source and type of tobacco exposure: a case-control study. Int.J.Cancer 44:622-628.
17. Butts, W.C., M. Kueheman, and G.M. Widdowson. 1974. Automated method for determining serum thiocyanate, to distinguish smokers from nonsmokers. Clin. Chem. 20:1344-1348.
18. Cardenas, V.M., M.J. Thun, H. Austin, C.A. Lally, W.S. Clark, R.S. Greenberg, and C.W.J. Heath. 1997. Environmental tobacco smoke and lung cancer mortality in the American Cancer Society's Cancer Prevention Study. II [published erratum appears in Cancer Causes Control 1997 Jul;8(4):675]. Cancer Causes Control. 8:57-64.
19. Carmella, S.G., S. Akerkar, and S.S. Hecht. 1993. Metabolites of the tobacco-specific nitrosamine 4-(methylnitrosamino)-1- (3-pyridyl)-1-butanone in smokers' urine. Cancer Res. 53:721-724.
20. Carmella, S.G., S.A. Akerkar, J.P.J. Richie, and S.S. Hecht. 1995. Intraindividual and interindividual differences in metabolites of the tobacco-specific lung carcinogen 4-(methylnitrosamino)-1-(3-pyridyl)-1- butanone (NNK) in smokers' urine. Cancer Epidemiol. Biomarkers Prev. 4:635-642.
21. CEPA. Health Effects of Exposure to Environmental Tobacco Smoke. California Environmental protection agency. Office of environmental health hazard assessment. 1997.
22. Chan, WC and Fung, SC. Lung Cancer in non-smokers in Hong Kong. In: E.Grundmann (ed.), Cancer Campaign, Cancer Epidemiology 6, 199-202. 1982. New York, G. Fischer, Stuttgart.
23. Chen, C.C. and H. Lee. 1996. Genotoxicity and DNA adduct formation of incense smoke condensates: comparison with environmental tobacco smoke condensates. Mutat. Res. 367:105-114.
24. CIB. Current Intelligence Bulletin 54: Environmental tobacco smoke in the workplace-lung cancer and other health effects. NIOSH Publication No.91-408, June, 1991.
25. Claxton, L.D., R.S. Morin, T.J. Hughes, and J. Lewtas. 1989. A genotoxic assessment of environmental tobacco smoke using bacterial bioassays. Mutat. Res. 222:81-99.
26. Coker, A.L., A.J. Rosenberg, M.F. McCann, and B.S. Hulka. 1992. Active and passive cigarette smoke exposure and cervical intraepithelial neoplasia. Cancer Epidemiol. Biomarkers Prev. 1:349-356.
27. Collman, G.W., K. Lundgren, D. Shore, C.L. Thompson, and G.W. Lucier. 1986. Effects of alpha-naphthoflavone on levels of sister chromatid exchanges in lymphocytes from active and passive cigarette smokers: dose-response relationships. Cancer Res. 46:6452-6455.
61

RoC Background Document for Environmental Tobacco Smoke
28. Correa, P., L.W. Pickle, E. Fontham, Y. Lin, and W. Haenszel. 1983. Passive smoking and lung cancer. Lancet 2:595-597.
29. Curvall, M. and C.R. Enzell. 1986. Monitoring absorption by means of determination of nicotine and cotinine. Arch. Toxicol. Suppl. 9:88-102.
30. Dalager, N.A., L.W. Pickle, T.J. Mason, P. Correa, E. Fontham, A. Stemhagen, P.A. Buffler, R.G. Ziegler, and J.F.J. Fraumeni. 1986. The relation of passive smoking to lung cancer. Cancer Res. 46:4808-4811.
31. Daube, H., G. Scherer, K. Riedel, T. Ruppert, A.R. Tricker, P. Rosenbaum, and F. Adlkofer. 1997. DNA adducts in human placenta in relation to tobacco smoke exposure and plasma antioxidant status. J. Cancer Res. Clin.Oncol. 123:141-151.
32. Dong, M., I. Schmeltz, E. Jacobs, and D. Hoffamnn. 1978. Aza-arenes in tobacco smoke. J. Anal. Toxicol 2:81-99.
33. Elmenhorst, H. and C. Schultz. 1968. Fluchtige Inhaltstoffe des tabakrauches. Beitr.Tabakforsch. 4:90-125.
34. Faccini, J.M. 1989. The role of histopathology in the evaluation of risk of lung cancer from environmental tobacco smoke. Exp. Pathol. 37:177-180.
35. Ferri, E.S. and E.J. Baratta. 1992. Polonium-210 in tobacco products and human tissues. Radiol. Health Data Rep. 1966. 9:485-8..
36. Finch, G.L., K.J. Nikula, S.A. Belinsky, E.B. Barr, G.D. Stoner, and J.F. Lechner. 1996. Failure of cigarette smoke to induce or promote lung cancer in the A/J mouse. Cancer Lett. 99:161-167.
37. Fleiss, J.L. and A.J. Gross. 1991. Meta-analysis in epidemiology, with special reference to studies of the association between exposure to environmental tobacco smoke and lung cancer: a critique [see comments]. J. Clin. Epidemiol. 44:127-139.
38. Fontham, E.T., P. Correa, P. Reynolds, A. Wu-Williams, P.A. Buffler, R.S. Greenberg, V.W. Chen, T. Alterman, P. Boyd, and D.F. Austin. 1994. Environmental tobacco smoke and lung cancer in nonsmoking women. A multicenter study [published erratum appears in JAMA 1994 Nov 23- 30;272(20):1578] [see comments]. JAMA 271:1752-1759.
39. Fontham, E.T., P. Correa, A. WuWilliams, P. Reynolds, R.S. Greenberg, P.A. Buffler, V.W. Chen, P. Boyd, T. Alterman, and D.F. Austin. 1991. Lung cancer in nonsmoking women: a multicenter case-control study [see comments]. Cancer Epidemiol. Biomarkers. Prev. 1:35-43.
40. Fukuda, K. and A. Shibata. 1990. Exposure-response relationships between woodworking, smoking or passive smoking, and squamous cell neoplasms of the maxillary sinus. Cancer Causes Control. 1:165-168.
41. Gao, Y.T., W.J. Blot, W. Zheng, A.G. Ershow, C.W. Hsu, L.I. Levin, R. Zhang, and J.F.J. Fraumeni. 1987. Lung cancer among Chinese women. Int.J.Cancer 40:604-609.
62

RoC Background Document for Environmental Tobacco Smoke
42. Garfinkel, L. 1981. Time trends in lung cancer mortality among nonsmokers and a note on passive smoking. J. Natl. Cancer Inst. 6:1061-1066.
43. Garfinkel, L. 1984. Passive smoking and cancer--American experience. Prev.Med. 13:691-697.
44. Geng, G., Z.H. liang, and G.L. Zhang. 1988. On the relationship between smoking and female lung cancer. In: Smoking and Health 1987. Elsiever Science Publishers, BV., Amsterdam. 483-486.
45. Gold, E.B., A. Leviton, R. Lopez, F.H. Gilles, E.T. Hedley-Whyte, L.N. Kolonel, J.L. Lyon, G.M. Swanson, N.S. Weiss, and D. West. 1993. Parental smoking and risk of childhood brain tumors. Am.J.Epidemiol. 137:620-628.
46. Golding, J., M. Paterson, and L.J. Kinlen. 1990. Factors associated with childhood cancer in a national cohort study. Br. J. Cancer . 62:304-308.
47. Grimmer, G., H. Bohnke, and H.P. Harke. 1977. [Passive smoking: measuring of concentrations of polycylic aromatic hydorcarbons in rooms after machine smoking of cigarettes (author's transl)]. Int. Arch. Occup. Environ. Health .;40(2):83.-92.
48. Grimmer, G., K.W. Naujack, and G. Dettbarn. 1987. Gaschromatographic determination of polycyclic aromatic hydrocarbons, aza-arenes, aromatic amines in the particle and vapor phase of mainstream and sidestream smoke of cigarettes. Toxicol. Lett. 35(1):117-24.
49. Guerin, M.R., C.E. Higgins, and W.H. Griest. 1987. The analysis of the particulate and vapour phases of tobacco smoke. IARC. Sci. Publ. 115-139.
50. Guerin, M.R., R.A. Jenkins, and B.A. Tomkins. 1992. The Chemistry of Environmental Tobacco smoke: Composition and Measurement.
51. Hammond, S.K., G. Sorensen, R. Youngstrom, and J.K. Ockene. 1995. Occupational exposure to environmental tobacco smoke [see comments]. JAMA 274:956-960.
52. Hecht, S.S., S.G. Carmella, P.G. Foiles, and S.E. Murphy. 1994. Biomarkers for human uptake and metabolic activation of tobacco- specific nitrosamines. Cancer Res. 54:1912s-1917s.
53. Hecht, S.S., S.G. Carmella, S.E. Murphy, S. Akerkar, K.D. Brunnemann, and D. Hoffmann. 1993. A tobacco-specific lung carcinogen in the urine of men exposed to cigarette smoke [see comments]. N. Engl. J. Med. 329:1543-1546.
54. Hecht, S.S., S.G. Carmella, S.E. Murphy, P.G. Foiles, and F.L. Chung. 1993. Carcinogen biomarkers related to smoking and upper aerodigestive tract cancer. J.Cell Biochem.Suppl. 17F:27-35.
55. Hecht, S.S. and D. Hoffmann. 1988. Tobacco-specific nitrosamines, an important group of carcinogens in tobacco and tobacco smoke. Carcinogenesis 9:875-884.
63

RoC Background Document for Environmental Tobacco Smoke
56. Hecht, S.S., M.A. Morse, K.I. Eklind, F.L. Chung, G.L. Finch, K.J. Nikula, S.A. Belinsky, E.B. Barr, G.D. Stoner, and J.F. Lechner. 1991. A/J mouse lung tumorigenesis by the tobacco-specific nitrosamine 4-(methylnitrosamino)-1-(3-pyridyl)-1-butanone and its inhibition by arylalkyl isothiocyanates. Failure of cigarette smoke to induce or promote lung cancer in the A/J mouse. Exp. Lung Res. 17:501-511.
57. Hirayama, T. 1984. Lung cancer in Japan: Effects of nutrition and passive smoking. In Lung Cancer: Causes and Prevention. M. Mizell and P. Correa, editors. Verlag Chemie International, New York. 175-195.
58. Hirayama, T. Lung cancer and other diseases related to passive smoking: a large-scale cohort study. In: Proceedings from International Symposium on Control of Tobacco Related Cancers and Other Diseases. 129-137. 1992. Bombay, India, Oxford University Press.
59. Hirayama, T. 1981. Non-smoking wives of heavy smokers have a higher risk of lung cancer: a study from Japan. Br. Med. J.(Clin. Res. Ed.).;282(6259):183.-5.
60. Hirayama, T. 1983. Passive smoking and lung cancer: consistency of association [letter]. Lancet 1983. 2:1425-1426.
61. Hirayama, T. 1984. Cancer mortality in nonsmoking women with smoking husbands based on a large-scale cohort study in Japan. Prev.Med.Nov.; 13:680-690.
62. Hoffmann, D., J.D. Adams, and K.D. Brunnemann. 1987. A critical look at N-nitrosamines in environmental tobacco smoke. Toxicol Lett. 35:1-8.
63. Hoffmann, D., K.D. Brunnemann, J.D. Adams, and S.S. Hecht. 1984. Formation and analysis of N-nitrosamines in tobacco products and their endogenous formation in consumers. IARC. Sci. Publ. 743-762.
64. Hoffmann, D. and S.S. Hecht. 1985. Nicotine-derived N-nitrosamines and tobacco-related cancer: current status and future directions. Cancer Res. 45:935-944.
65. Hoffmann, D. and Hecht, S. S. Advances in tobacco carcinogenesis. Handbook of Experimental Pharmacology 1988, New York, NY: Springer Verlag . 1989.
66. Hole, D.J., C.R. Gillis, C. Chopra, and V.M. Hawthorne. 1989. Passive smoking and cardiorespiratory health in a general population in the west of Scotland [see comments]. BMJ. 299:423-427.
67. Holz, O., T. Krause, G. Scherer, U. Schmidt-Preuss, and H.W. Rudiger. 1990. 32P-postlabelling analysis of DNA adducts in monocytes of smokers and passive smokers. Int. Arch. Occup. Environ. Health. 62:299-303.
68. Howe, G.R., J.D. Burch, A.M. Chiarelli, H.A. Risch, and B.C. Choi. 1989. An exploratory case-control study of brain tumors in children. Cancer Res. 49:4349-4352.
69. IARC. International Agency for Research on Cancer. Evaluation of the carcinogenic risk of chemicals to humans-Tobacco smoking. IARC Monographs 38. 1986.
64

RoC Background Document for Environmental Tobacco Smoke
70. Inoue, R. and T. Hirayama. 1988. Passive smoking and lung cancer in women. In: Smoking and health 1987. M. Aoki, S. Hisamichi, and S. Tominaga, editors. Elsevier Science Publishers BV., Amsterdam. 283-285.
71. Jaakkola, M.S. and J.J. Jaakkola. 1997. Assessment of exposure to environmental tobacco smoke. Eur. Respir. J. 10:2384-2397.
72. Janerich, D.T., W.D. Thompson, L.R. Varela, P. Greenwald, S. Chorost, C. Tucci, M.B. Zaman, M.R. Melamed, M. Kiely, and M.F. McKneally. 1990. Lung cancer and exposure to tobacco smoke in the household [see comments]. N. Engl. J. Med. 323:632-636.
73. Jenkins, P.L., T.J. Phillips, E.J. Mulberg, and S.P. Hui. 1992. Activity Patterns of Californians: Use and Proximity to Indoor Pollutant Sources. Atmospheric Environment 26A:2141-2148.
74. Jenkins, R.A., A. Palausky, R.W. Counts, C.K. Bayne, A.B. Dindal, and M.R. Guerin. 1996. Exposure to environmental tobacco smoke in sixteen cities in the United States as determined by personal breathing zone air sampling. J. Expo. Anal. Environ. Epidemiol. 6:473-502.
75. Ji, B.T., X.O. Shu, M.S. Linet, M.S. Linet, W. Zheng, S. Wacholder, Y.T. Gao, D.M. Ying, and F. Jin. 1997. Paternal cigarette smoking and the risk of childhood cancer among offspring of nonsmoking mothers. J. Natl. Cancer Inst. 89:238-244.
76. John, E.M., D.A. Savitz, and D.P. Sandler. 1991. Prenatal exposure to parents' smoking and childhood cancer [see comments]. Am.J.Epidemiol. 133:123-132.
77. Kabat, G. C. Epidemiologic studies of the relationship between passive smoking and lung cancer. 1990. Presented at the 1990 annual winter meeting of the toxicology forum in Washington, D.C.
78. Kabat, G.C. 1996. Aspects of the epidemiology of lung cancer in smokers and nonsmokers in the United States. Lung Cancer 15:1-20.
79. Kabat, G.C., G.S. Dieck, and E.L. Wynder. 1986. Bladder cancer in nonsmokers. Cancer. 57:362-367.
80. Kabat, G.C., S.D. Stellman, and E.L. Wynder. 1995. Relation between exposure to environmental tobacco smoke and lung cancer in lifetime nonsmokers [published erratum appears in Am J Epidemiol 1996 Mar 1;143(5):527]. Am. J. Epidemiol. 142:141-148.
81. Kabat, G.C. and E.L. Wynder. 1984. Lung cancer in nonsmokers. Cancer 53:1214-1221.
82. Kado, N.Y., S.A. McCurdy, S.J. Tesluk, S.K. Hammond, D.P. Hsieh, J. Jones, and M.B. Schenker. 1991. Measuring personal exposure to airborne mutagens and nicotine in environmental tobacco smoke. Mutat. Res. 261:75-82.
83. Kalandidi, A., K. Katsouyanni, N. Voropoulou, G. Bastas, R. Saracci, and D. Trichopoulos. 1990. Passive smoking and diet in the etiology of lung cancer among non- smokers. Cancer Causes Control. 1:15-24.
65
RoC Background Document for Environmental Tobacco Smoke
84. Kawachi, I. and G.A. Colditz. 1996. Invited commentary: confounding, measurement error, and publication bias in studies of passive smoking. Am. J. Epidemiol. 144:909-915.
85. Klebanoff, M.A., J.D. Clemens, and J.S. Read. 1996. Maternal smoking during pregnancy and childhood cancer. Am. J. Epidemiol. 144:1028-1033.
86. Ko, Y.C., C.H. Lee, M.J. Chen, C.C. Huang, W.Y. Chang, H.J. Lin, H.Z. Wang, and P.Y. Chang. 1997. Risk factors for primary lung cancer among non-smoking women in Taiwan. Int. J. Epidemiol. 26:24-31.
87. Koo, L.C., C.Y. Ho, and D. Saw. 1984. Is passive smoking an added risk factor for lung cancer in Chinese women? J. Exp. Clin. Cancer Res. 3:277-283.
88. Koo, L.C., J.H. Ho, D. Saw, and C.Y. Ho. 1987. Measurements of passive smoking and estimates of lung cancer risk among non-smoking Chinese females. Int. J. Cancer . 39:162-169.
89. Kuijten, R.R., G.R. Bunin, C.C. Nass, and A.T. Meadows. 1990. Gestational and familial risk factors for childhood astrocytoma: results of a case-control study. Cancer Res. 50:2608-2612.
90. Lambert, W.E., J.M. Samet, and J.D. Spengler. 1993. Environmental tobacco smoke concentrations in no-smoking and smoking sections of restaurants. Am. J. Public Health 83:1339-1341.
91. Layard, M.W. 1993. Re: Environmental tobacco smoke and lung cancer risk in nonsmoking women [letter; comment]. J. Natl. Cancer Inst. 85:748-749.
66

RoC Background Document for Environmental Tobacco Smoke
92. Lee, C.K., B.G. Brown, B.A. Reed, C.A. Rahn, C.R. Coggins, D.J. Doolittle, and A.W. Hayes. 1992. Fourteen-day inhalation study in rats, using aged and diluted sidestream smoke from a reference cigarette. II. DNA adducts and alveolar macrophage cytogenetics. Fundam. Appl. Toxicol 19:141-146.
93. Lee, P.N. 1986. Misclassification as a factor in passive smoking risk [letter]. Lancet 2:867
94. Lee, P.N. 1992. Correspondence re: E.T.H. Fontham et al., lung cancer in nonsmoking women: a multicenter case-control study. Cancer epidemiol., biomarkers and prev., 1: 35-43, 1991 [letter; comment]. Cancer Epidemiol. Biomarkers Prev. 1:332-333.
95. Lee, P.N. 1992. Re: "Prenatal exposure to parents' smoking and childhood cancer" [letter; comment]. Am. J. Epidemiol. 135:713-714.
96. Lee, P.N. 1993. Effects of passive smoking [letter]. J. Clin. Epidemiol. 46:409-410.
97. Lee, P.N. 1993. Re: Environmental tobacco smoke and lung cancer risk in nonsmoking women [letter; comment]. J. Natl. Cancer Inst. 85:748-1.
98. Lee, P.N. 1994. Environmental tobacco smoke and heart disease [letter]. J. Clin. Epidemiol. 47:303-304.
99. Lee, P.N. 1994. Smoke and letters [letter; comment]. JAMA 272:1479-1480.
100.Lee, P.N. 1995. "Marriage to a smoker" may not be a valid marker of exposure in studies relating environmental tobacco smoke to risk of lung cancer in Japanese non-smoking women. Int. Arch. Occup. Environ. Health 67:287-294.
101.Lee, P.N. and B.A. Forey. 1996. Misclassification of smoking habits as a source of bias in the study of environmental tobacco smoke and lung cancer. Stat. Med. 15:581-605.
102.Levois, M. and P. Switzer. 1998. Differential exposure misclassification in case-control studies of environmental tobacco smoke and lung cancer. J. Clin. Epidemiol. 51:37-54.
103.LeVois, M.E. and M.W. Layard. 1994. Inconsistency between workplace and spousal studies of environmental tobacco smoke and lung cancer. Regul. Toxicol. Pharmacol. 19:309-316.
104.LeVois, M.E. and M.W. Layard. 1995. Publication bias in the environmental tobacco smoke/coronary heart disease epidemiologic literature. Regul. Toxicol. Pharmacol. 21:184-191.
105.Ling, P.I., G. Lofroth, and J. Lewtas. 1987. Mutagenic determination of passive smoking. Toxicol Lett. 35:147-151.
106.Liu, Y.Y., I. Schmeltz, and D. Hoffmann. 1974. Chemical studies on tobacco smoke. Quantitative analysis of hydrazine in tobacco and cigarette smoke. Anal. Chem. 46:885-889.
107.Liu, Z.Y., X.Z. He, and R.S. Chapman. 1991. Smoking and other risk factors for lung cancer in Xuanwei, China. Int .J. Epidemiol. 20:26-31.
67
RoC Background Document for Environmental Tobacco Smoke
108.Lofroth, G., R. Burton, G. Goldstein, L. Forehand, K. Hammond, J. Mumford, R. Seila, and J. Lewtas. 1987. Genotoxic emission factors for sidestream cigarette smoke components. Environ. Mutagen. 9, Suppl. 8:61
109.Lofroth, G., L. Nilsson, and L. Alfeim. 1983. Passive smoking and urban air pollution: Salmonella/microsome mutagenecity assay of simulataneously collected indoor and outdoor particulate matter. In Short-term bioassays in the analysis of complex environmental mixtures. Vol 111. M.D. Waters, S.S. Sandhu, J. Lewtas, L.D. Claxton, N. Cherrnoff, and S. Nesnow, editors. Plenum Press, New York. 515-525.
110.Magnani, C., G. Pastore, L. Luzzatto, and B. Terracini. 1990. Parental occupation and other environmental factors in the etiology of leukemias and non-Hodgkin's lymphomas in childhood: a case-control study. Tumori. 76:413-419.
111.Matanoski, G., S. Kanchanaraksa, D. Lantry, and Y. Chang. 1995. Characteristics of nonsmoking women in NHANES I and NHANES I epidemiologic follow-up study with exposure to spouses who smoke. Am. J. Epidemiol. 142:149-157.
112.Mattson, M.E., G. Boyd, D. Byar, C. Brown, J.F. Callahan, D. Corle, J.W. Cullen, J. Greenblatt, N.J. Haley, and K. Hammond. 1989. Passive smoking on commercial airline flights [see comments]. JAMA 261:867-872.
113.McCredie, M., P. Maisonneuve, and P. Boyle. 1994. Antenatal risk factors for malignant brain tumours in New South Wales children. Int.J.Cancer. 56:6-10.
114.McGregor, J.F. 1976. Tumor-promoting activity of cigarette tar in rat skin exposed to irradiation. J. Natl. Cancer Inst. 56:429-430.
115.McGregor, J.F. and D.K. Myers. 1982. Enhancement of skin tumorigenesis by cigarette smoke condensate following beta-irradiation in rats. J. Natl. Cancer Inst. 68:605-611.
116.McKinney, P.A., R.A. Cartwright, J.M. Saiu, J.R. Mann, C.A. Stiller, G.J. Draper, A.L. Hartley, P.A. Hopton, J.M. Birch, and J.A. Waterhouse. 1987. The inter-regional epidemiological study of childhood cancer (IRESCC): a case control study of aetiological factors in leukaemia and lymphoma [published erratum appears in Arch Dis Child 1987 Jun;62(6):644]. Arch. Dis. Child. 62:279-287.
117.McKinney, P.A. and C.A. Stiller. 1986. Maternal smoking during pregnancy and the risk of childhood cancer. [letter]. Lancet 1:519
118.Millar, J. D. Current Intelligence Bulletin 54: Environmental Tobacco Smoke in the Workplace - Lung Cancer and Other Health Effects. Publication Number 91-108. 1991. Washington, D.C., NIOSH.
119.Mohtashamipur, E., A. Mohtashamipur, P.G. Germann, H. Ernst, K. Norpoth, and U. Mohr. 1990. Comparative carcinogenicity of cigarette mainstream and sidestream smoke condensates on the mouse skin. J. Cancer Res.Clin. Oncol. 116:604-608.
68

RoC Background Document for Environmental Tobacco Smoke
120.Morabia, A., M. Bernstein, S. Heritier, and N. Khatchatrian. 1996. Relation of breast cancer with passive and active exposure to tobacco smoke [see comments]. Am. J. Epidemiol. 143:918-928.
121.Morris, P.D. 1995. Lifetime excess risk of death from lung cancer for a U.S. female never-smoker exposed to environmental tobacco smoke. Environ. Res. 68:3-9.
122.Norman, V., A.M. Ihrig, T.M. Larson, and B.L. Moss. 1983. The effect of some nitrogeneous blend components on NO/NOx and HCN levels in mainstream and sidestream smoke. Beitr. Tabakforsch. 12:55-62.
123.Norman, M.A., Holly, E.A., Ahn, D.K., Preston-Martin, S., Mueller, B.A. and P.M. Bracci. Prenatal exposure to tobacco smoke and childhood brain tumors: results from the United States West Coast childhood brain tumor study.1996. Cancer Epidemiol. Biomarkers Prev. 5(2):127-33.
124.NRC. 1986. Environmental Tobacco Smoke. Measuring Exposures and assessing health effects. National Research Council, Board on Environmental Studies and Toxicology, Committee on Passive Smoking.Washington, D.C.National Academy Press .
125.Nyberg, F., A. Agudo, P. Boffetta, C. Fortes, C.A. Gonzalez, and G. Pershagen. 1998. A European validation study of smoking and environmental tobacco smoke exposure in nonsmoking lung cancer cases and controls. Cancer Causes Control. 9:173-182.
126.Nyberg, F., I. Isaksson, J.R. Harris, and G. Pershagen. 1997. Misclassification of smoking status and lung cancer risk from environmental tobacco smoke in never-smokers. Epidemiology. 8:304-309.
127.Ohmori, T., H. Mori, and A. Rivenson. 1981. A study of tobacco carcinogenesis XX: mastocytoma induction in mice by cigarette smoke particulates ("cigarette tar"). Am. J. Pathol. 102:381-387.
128.Oldaker, G. B. and F. C. Conrad. 1987. Estimation of Effect of Environmental Tobacco Smoke on Air Quality within Passenger Cabins of Commercial Aircraft. Environmental Science and Technology 21, 994-999.
129.Ong, T., J. Stewart, and W.Z. Whong. 1984. A simple in situ mutagenecity test system for detection of mutagenic air pollutants. Mutat. Res. 139:177-181.
130.Parsons, W.D., S.G. Carmella, S. Akerkar, L.E. Bonilla, and S.S. Hecht. 1998. A metabolite of the tobacco-specific lung carcinogen 4- (methylnitrosamino)-1-(3-pyridyl)-1-butanone in the urine of hospital workers exposed to environmental tobacco smoke. Cancer Epidemiol. Biomarkers. Prev. 7:257-260.
131.Patrianakos, C. and D. Hoffmann. 1979. Chemical Studies on tobacco smoke. LXIV. On the analysis of aromatic amines in cigarette smoke. J. Anal. Toxicol 3:150-154.
132.Pershagen, G. 1986. Review of epidemiology in relation to passive smoking. Arch. Toxicol. Suppl. 9:63-73.
69

RoC Background Document for Environmental Tobacco Smoke
133.Pershagen, G., A. Ericson, and P. Otterblad-Olausson. 1992. Maternal smoking in pregnancy: does it increase the risk of childhood cancer? Int. J. Epidemiol. 21:1-5.
134.Pershagen, G., Z. Hrubec, and C. Svensson. 1987. Passive smoking and lung cancer in Swedish women. Am. J. Epidemiol. 125:17-24.
135.Peterson, L.A., R. Mathew, S.E. Murphy, N. Trushin, and S.S. Hecht. 1991. In vivo and in vitro persistence of pyridyloxobutyl DNA adducts from 4- (methylnitrosamino)-1-(3-pyridyl)-1-butanone. Carcinogenesis 12:2069-2072.
136.Pirkle, J,L., K.M. Flegal, J.T., Bernert; D.J., Brody, R.A., Etzel, and K.R., Maurer. 1996. Exposure of the US population to environmental tobacco smoke: the Third National Health and Nutrition Examination Survey, 1988 to 1991 [see comments]. JAMA. 275(16):1233-40.
137.Repace, J.L. 1987. Indoor concentrations of environmental tobacco smoke: field surveys. IARC. Sci. Publ. 141-162.
138.Repace, J.L. and A.H. Lowrey. 1980. Indoor air pollution, tobacco smoke, and public health. Science 208:464-472.
139.Repace, J.L. and A.H. Lowrey. 1982. Tobacco Smoke, Ventilation and Indoor Air Quality. ASHRAE Trans. 88:894-914.
140.Repace, J. L. and Lowrey, A. H. 1988. Comment on "Estimation of Effect of Environmental Tobacco Smoke on Air Quality within Passenger cabins of Commercial Aircraft". Environmental Science and Technology 22(10), 1238-1240.
141.Repace, J.L. and A.H. Lowrey. 1990. Risk assessment methodologies for passive smoking-induced lung cancer. Risk. Anal. 10:27-37.
142.Reynolds, P., G.A. Kaplan, and R.D. Cohen. 1987. Passive smoking and cancer incidence: prospective evidence from the Alameda County study [Abstract]. Am. J. Epidemiol. 126:767
143.Riboli, E., N.J. Haley, J. Tredaniel, R. Saracci, S. Preston-Martin, and D. Trichopoulos. 1995. Misclassification of smoking status among women in relation to exposure to environmental tobacco smoke. Eur. Respir. J. 8:285-290.
144.Rickert, W.S., J.C. Robinson, and N. Collishaw. 1984. Yields of tar, nicotine, and carbon monoxide in the sidestream smoke from 15 brands of Canadian cigarettes. Am. J. Public Health.74(3):228-231.
145.Rivenson, A., D. Hoffmann, B. Prokopczyk, S. Amin, and S.S. Hecht. 1988. Induction of lung and exocrine pancreas tumors in F344 rats by tobacco- specific and Areca-derived N-nitrosamines. Cancer Res. 48:6912-6917.
146.RoC. http;//ehis.niehs.nih.gov/roc/ . 1997.
147.Sakuma, H., M. Kusama, K. Yamaguchi, and S. Sugawara. 1984. The distribution of cigarette smoke components between mainstream and sidestream smoke. II Bases. Beitr. Tabakforsch. Int 22:199-209.
70

RoC Background Document for Environmental Tobacco Smoke
148.Sandler, D.P., G.W. Comstock, K.J. Helsing, and D.L. Shore. 1989. Deaths from all causes in non-smokers who lived with smokers. Am. J. Public Health. 79:163-167.
149.Sandler, D.P., R.B. Everson, and A.J. Wilcox. 1985. Passive smoking in adulthood and cancer risk. Am. J. Epidemiol. 121:37-48.
150.Sandler, D.P., R.B. Everson, and A.J. Wilcox. 1986. Cigarette smoking and breast cancer [letter]. Am. J. Epidemiol. 123:370-371.
151.Sandler, D.P., A.J. Wilcox, and R.B. Everson. 1985. Cumulative effects of lifetime passive smoking on cancer risk. Lancet 1:312-315.
152.Scherer, G., D.J. Doolittle, T. Ruppert, I. Meger-Kossien, K. Riedel, A.R. Tricker, and F. Adlkofer. 1996. Urinary mutagenicity and thioethers in nonsmokers: role of environmental tobacco smoke (ETS) and diet. Mutat. Res. 368:195-204.
153.Scherer, G. and E. Richter. 1997. Biomonitoring exposure to environmental tobacco smoke (ETS): a critical reappraisal. Hum. Exp. Toxicol. 16:449-459.
154.Severson, R.K., J.D. Buckley, W.G. Woods, D. Benjamin, and L.L. Robison. 1993. Cigarette smoking and alcohol consumption by parents of children with acute myeloid leukemia: an analysis within morphological subgroups--a report from the Childrens Cancer Group. Cancer Epidemiol. Biomarkers Prev. 2:433-439.
155.Siegel, M. 1993. Involuntary smoking in the restaurant workplace. A review of employee exposure and health effects [see comments]. JAMA 270:490-493.
156.Slattery, M.L., L.M. Robison, K.L. Schuman, T.K. French, T.M. Abbott, J.C.J. Overall, and J.W. Gardner. 1989. Cigarette smoking and exposure to passive smoke are risk factors for cervical cancer [see comments]. JAMA 261:1593-1598.
157.Smith, S.J., J.M. Deacon, and C.E. Chilvers. 1994. Alcohol, smoking, passive smoking and caffeine in relation to breast cancer risk in young women. UK National Case-Control Study Group. Br. J. Cancer. 70:112-119.
158.Sobue, T. 1990. Association of indoor air pollution and lifestyle with lung cancer in Osaka, Japan. Int. J. Epidemiol.19.Suppl.1.:S62.-6.
159.Sorahan, T., P. Prior, R.J. Lancashire, S.P. Faux, M.A. Hulten, I.M. Peck, and A.M. Stewart.1997. Childhood cancer and parental use of tobacco: deaths from 1971 to 1976. Br. J. Cancer 76:1525-1531.
160.Sorsa, M., K. Husgafvel-Pursiainen, H. Jarventaous, K. Koskimies, H. Salo, and H. Vainio. 1989. Cytogenetic effects of tobacco smoke exposure among involuntary smokers. Mutat. Res. 222:111-116.
161.Staretz, M.E., P.G. Foiles, L.M. Miglietta, and S.S. Hecht. 1997. Evidence for an important role of DNA pyridyloxobutylation in rat lung carcinogenesis by 4-(methylnitrosamino)-1-(3-pyridyl)-1-butanone: effects of dose and phenethyl isothiocyanate. Cancer Res. 57:259-266.
71

RoC Background Document for Environmental Tobacco Smoke
162.Staretz, M.E., S.E. Murphy, C.J. Patten, M.G. Nunes, W. Koehl, S. Amin, L.A. Koenig, F.P. Guengerich, and S.S. Hecht. 1997. Comparative metabolism of the tobacco-related carcinogens benzo[a]pyrene, 4-(methylnitrosamino)-1-(3-pyridyl)-1-butanone, 4-(methylnitrosamino)-1-(3-pyridyl)-1-butanol, and N'- nitrosonornicotine in human hepatic microsomes. Drug Metab.Dispos. 25:154-162.
163.Sterling, T.D., C.W. Collett, and E.M. Sterling. 1987. Environmental tobacco smoke and indoor air quality in modern office work environments. J. Occup. Med. 29:57-62.
164.Sterling, T.D., A. Glicksman, H. Perry, D.A. Sterling, W.L. Rosenbaum, and J.J. Weinkam. 1996. An alternative explanation for the apparent elevated relative mortality and morbidity risks associated with exposure to environmental tobacco smoke. J. Clin. Epidemiol. 49:803-808.
165.Stjernfeldt, M., K. Berglund, J. Lindsten, and J. Ludvigsson. 1986. Maternal smoking during pregnancy and risk of childhood cancer. Lancet 14.1.(8494):1350.-2.
166.Stjernfeldt, M., K. Berglund, J. Lindsten, and J. Ludvigsson. 1992. Maternal smoking and irradiation during pregnancy as risk factors for child leukemia. Cancer Detect. Prev. 16:129-135.
167.Stjernfeldt, M., J. Ludvigsson, K. Berglund, and J. Lindsten. 1986. Maternal smoking during pregnancy and the risk of childhood cancer [letter]. Lancet 2:687-688.
168.Stockwell, H.G., A.L. Goldman, G.H. Lyman, C.I. Noss, A.W. Armstrong, P.A. Pinkham, E.C. Candelora, and M.R. Brusa. 1992. Environmental tobacco smoke and lung cancer risk in nonsmoking women [see comments]. J. Natl. Cancer Inst. 84:1417-1422.
169.Thornton, A., P. Lee, and J. Fry. 1994. Differences between smokers, ex-smokers, passive smokers and non- smokers. J. Clin. Epidemiol. 47:1143-1162.
170.Tredaniel, J., P. Boffetta, J. Little, R. Saracci, and A. Hirsch. 1994. Exposure to passive smoking during pregnancy and childhood, and cancer risk: the epidemiological evidence. Paediatr. Perinat. Epidemiol. 8:233-255.
171.Tredaniel, J., P. Boffetta, R. Saracci, and A. Hirsch. 1993. Environmental tobacco smoke and the risk of cancer in adults. Eur. J. Cancer 29A:2058-2068.
172.Tredaniel, J., P. Boffetta, R. Saracci, and A. Hirsch. 1994. Exposure to environmental tobacco smoke and risk of lung cancer: the epidemiological evidence [see comments]. Eur. Respir. J. 7:1877-1888.
173.Trichopoulos, D., A. Kalandidi, and L. Sparros. 1983. Lung cancer and passive smoking: conclusion of Greek study [letter]. Lancet 2:677-678.
174.Trichopoulos, D., A. Kalandidi, L. Sparros, and B. MacMahon. 1981. Lung cancer and passive smoking. Int. J. Cancer 27:1-4.
72

RoC Background Document for Environmental Tobacco Smoke
175.U.S. DHHS. Report of the surgeon general: The health consequences on involuntary smoking. 1986. Washington D.C., U. S. Department of Health and Human Services. DHHS Pub No (PHS) 87-8398.
176.U.S. EPA. U.S. Environmental Protection Agency. Respiratory health effects of passive smoking: lung cancer and other disorders. EPA office of research and development, Washington, D.C. EPA/600/6-90/006F. 1992.
177.Vandenbroucke, J.P. 1988. Passive smoking and lung cancer: a publication bias? Br. Med. J.(Clin. Res. Ed.) 296:391-392.
178.Wald, N.J., K. Nanchahal, S.G. Thompson, and H.S. Cuckle. 1986. Does breathing other people's tobacco smoke cause lung cancer? Br.Med.J.(Clin.Res.Ed.) 293:1217-1222.
179.Wang, T.J., B.S. Zhou, and J.P. Shi. 1996. Lung cancer in nonsmoking Chinese women: a case-control study. Lung Cancer 14 Suppl 1:S93-S98.
180.Wells, A.J. 1991. Breast cancer, cigarette smoking, and passive smoking [letter] [see comments]. Am. J. Epidemiol. 133:208-210.
181.Wells, A.J. 1993. An estimate of adult mortality in the United States from passive smoking: A further reply. Environ. Int. 19:97-100.
182.Wells, A.J. 1998. Lung Cancer From Passive Smoking at Work. Am. J. Public Health. 88: 1025-1029.
183.Witschi, H., I. Espiritu, R.R. Maronpot, K.E. Pinkerton, and A.D. Jones. 1997. The carcinogenic potential of the gas phase of environmental tobacco smoke. Carcinogenesis 18:2035-2042.
184.Witschi, H., I. Espiritu, J.L. Peake, K. Wu, R.R. Maronpot, and K.E. Pinkerton. 1997.The carcinogenicity of environmental tobacco smoke. Carcinogenesis 18:575-586.
185.Witschi, H., V.I. Oreffo, and K.E. Pinkerton. 1995. Six-month exposure of strain A/J mice to cigarette sidestream smoke: cell kinetics and lung tumor data. Fundam. Appl. Toxicol. 26:32-40.
186.Woodward, A. and A.J. McMichael. 1991. Passive smoking and cancer risk: the nature and uses of epidemiological evidence. Eur. J. Cancer 27:1472-1479.
187.Wu-Williams, A.H., X.D. Dai, W. Blot, Z.Y. Xu, X.W. Sun, H.P. Xiao, B.J. Stone, S.F. Yu, Y.P. Feng, and A.G. Ershow. 1990. Lung cancer among women in north-east China. Br. J. Cancer 62:982-987.
188.Wu-Williams, A.H. and J.M. Samet. 1990. Environmental tobacco smoke: exposure-response relationships in epidemiologic studies. Risk. Anal. 10:39-48.
189.Zheng, W., J.K. McLaughlin, W.H. Chow, H.T. Chien, and W.J. Blot. 1993. Risk factors for cancers of the nasal cavity and paranasal sinuses among white men in the United States. Am. J. Epidemiol. 138:965-972.
73

RoC Background Document for Environmental Tobacco Smoke
74

RoC Background Document for Environmental Tobacco Smoke
75
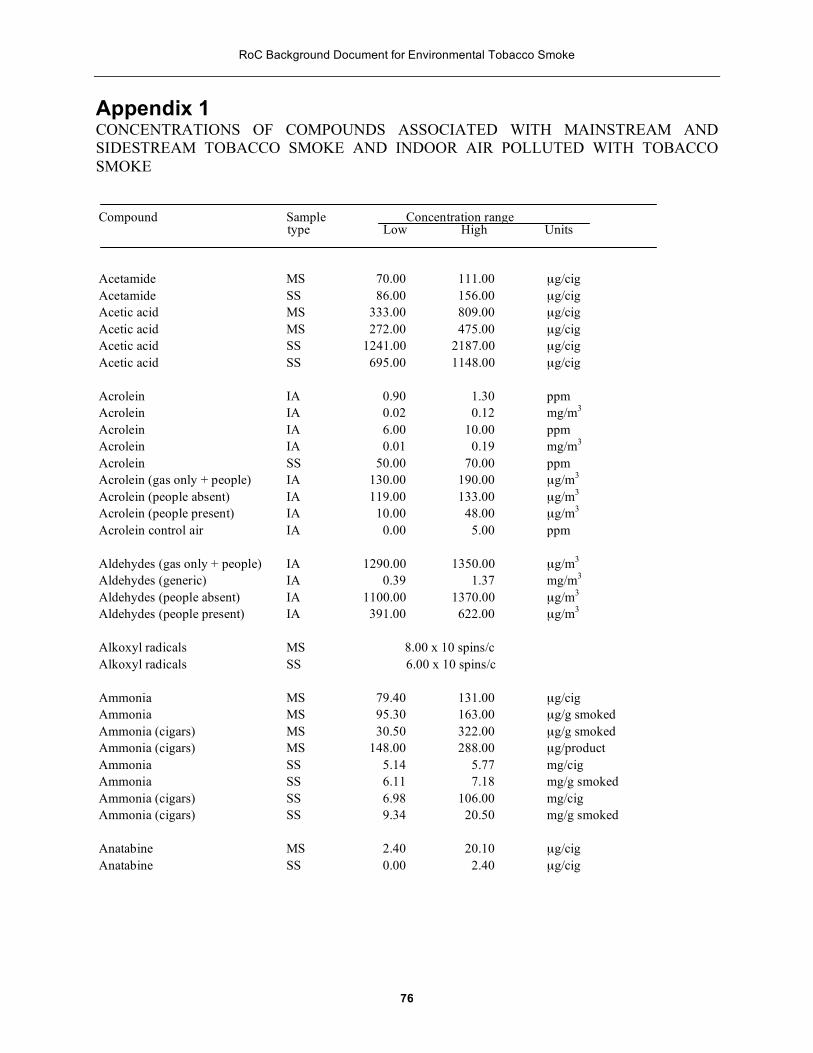
RoC Background Document for Environmental Tobacco Smoke
Appendix 1CONCENTRATIONS OF COMPOUNDS ASSOCIATED WITH MAINSTREAM AND SIDESTREAM TOBACCO SMOKE AND INDOOR AIR POLLUTED WITH TOBACCO SMOKE
Compound Sample type
Concentration range Low High Units
Acetamide MS 70.00 111.00 µg/cig Acetamide SS 86.00 156.00 µg/cig Acetic acid MS 333.00 809.00 µg/cig Acetic acid MS 272.00 475.00 µg/cig Acetic acid SS 1241.00 2187.00 µg/cig Acetic acid SS 695.00 1148.00 µg/cig
Acrolein Acrolein
IA IA
0.90 0.02
1.30 0.12
ppm mg/m3
Acrolein Acrolein
IA IA
6.00 0.01
10.00 0.19
ppm mg/m3
Acrolein Acrolein (gas only + people) Acrolein (people absent) Acrolein (people present)
SS IA IA IA
50.00 130.00 119.00
10.00
70.00 190.00 133.00
48.00
ppm µg/m3
µg/m3
µg/m3
Acrolein control air IA 0.00 5.00 ppm
Aldehydes (gas only + people) Aldehydes (generic) Aldehydes (people absent) Aldehydes (people present)
IA IA IA IA
1290.00 0.39
1100.00 391.00
1350.00 1.37
1370.00 622.00
µg/m3
mg/m3
µg/m3
µg/m3
Alkoxyl radicals MS 8.00 x 10 spins/c Alkoxyl radicals SS 6.00 x 10 spins/c
Ammonia MS 79.40 131.00 µg/cig Ammonia MS 95.30 163.00 µg/g smoked Ammonia (cigars) MS 30.50 322.00 µg/g smoked Ammonia (cigars) MS 148.00 288.00 µg/product Ammonia SS 5.14 5.77 mg/cig Ammonia SS 6.11 7.18 mg/g smoked Ammonia (cigars) SS 6.98 106.00 mg/cig Ammonia (cigars) SS 9.34 20.50 mg/g smoked
Anatabine MS 2.40 20.10 µg/cig Anatabine SS 0.00 2.40 µg/cig
76

RoC Background Document for Environmental Tobacco Smoke
Compound Sample Concentration range type Low High Units
Anthanthrene Anthanthrene
IA IA 3.00
Qual (ng/m3) ng/m3
Anthanthrene MS 22.00 ng/cig Anthanthrene SS 39.00 ng/cig
Anthracene IA Qual (ng/m3) Anthracene MS, P 23.60 ng/cig Anthracene MS, V 0.10 ng/cig
Anthracene SS, P 670.00 ng/cig Anthracene SS, V 40.00 ng/cig
Benz[a]anthracene IA Qual(ng/m3) Benz[a]anthracene MS, P 13.30 ng/cig Benz[a]anthracene MS, V 0.09 ng/cig Benz[a]anthracene SS, P 201.00 ng/cig Benz[a]anthracene SS, V 2.50 ng/cig
Benz[e]acenaphthylene IA Qual (ng/m3)
Benzene Benzene (breath, nonsmokers) Benzene (breath, smokers) Benzene (homes, nonsmokers) Benzene (homes, smokers)
IA IA IA IA IA
0.05 2.50
16.00 4.40 4.80
0.15
9.20 16.00
mg/m3
µg/m3
µg/m3
µg/cm3
µg/m3
Benzo[a]fluorene Benzo[a]fluorene
IA IA 39.00
Qual (ng/m3) ng/m3
Benzo[a]fluorene MS 184.00 ng/cig Benzo[a]fluorene SS 751.00 ng/cig
Benzo[a]pyrene Benzo[a]pyrene Benzo[a]pyrene Benzo[a]pyrene
IA IA IA IA
7.10 6.20
22.00
21.70 144.00
Qual (ng/m3) ng/m3
ng/m3
ng/m3
Benzo[a]pyrene MS 44.00 ng/cig Benzo[a]pyrene MS, P 10.90 ng/cig Benzo[a]pyrene MS, V 0.08 ng/cig Benzo[a]pyrene SS 199.00 ng/cig Benzo[a]pyrene SS, P 103.00 ng/cig Benzo[a]pyrene Benzo[a]pyrene control
SS, V IA
0.48 0.00 0.69
ng/cig ng/m3
77

RoC Background Document for Environmental Tobacco Smoke
Compound Sample type
Concentration range Low High Units
Benzo[a]naphtho[2,1-d]thiophene MS, P Benzo[a]naphtho[2,1-d]thiophene MS, V Benzo[a]naphtho[2,1-d]thiophene SS, P Benzo[a]naphtho[2,1-d]thiophene SS, V
2.80 0.21
50.00 1.10
ng/cig ng/cig ng/cig ng/cig
Benzo[b/c]fluorene Benzo[b/c]fluorene
MS SS
69.00 251.00
ng/cig ng/cig
Benzo[b/j/k]fluoranthene Benzo[b/j/k]fluoranthene Benzo[b/j/k]fluoranthene
IA MS SS
35.00 49.00
260.00
ng/m3
ng/cig ng/cig
Benzo[e]fluorene IA Qual (ng/m3)
Benzo[e]pyrene Benzo[e]pyrene Benzo[e]pyrene Benzo[e]pyrene Benzo[e]pyrene Benzo[e]pyrene Benzo[e]pyrene Benzo[e]pyrene Benzo[e]pyrene Benzo[e]pyrene control
IA IA IA MS MS, P MS, V SS SS, P SS, V IA
18.00 3.30
25.00 6.70 0.13
135.00 75.00
0.74 3.00
23.40
5.10
Qual (ng/m3) ng/m3
ng/m3
ng/cig ng/cig ng/cig ng/cig ng/cig ng/cig ng/m3
Benzo[ghi]fluoranthene IA Qual (ngL/m3)
Benzo[ghi]perylene Benzo[ghi]perylene Benzo[ghi]perylene Benzo[ghi]perylene Benzo[ghi]perylene Benzo[ghi]perylene Benzo[ghi]perylene Benzo[ghi]perylene
IA IA MS MS, P MS, V SS SS, P SS, V
17.00 39.00
7.10 0.09
98.00 41.00
0.62
Qual (ng/rn3) ng/m3
ng/cig ng/cig ng/cig ng/cig ng/cig nit/cig
Benzofluoranthenes (b+j+k) Benzofluoranthenes (b+j+k) Benzofluoranthenes (b+j+k) Benzofluoranthenes (b+j+k)
MS, P MS, V SS, P SS, V
20.50 0.22
196.00 1.38
ng/cig ng/cig ng/cig ng/cig
78

RoC Background Document for Environmental Tobacco Smoke
Compound Sample type
Concentration range Low High Units
Benzoic acid Benzoic acid
MS SS
14.00 12.00
28.00 23.00
µg/cig µg/cig
Benzoic acid, m-hydroxy-Benzoic acid, m-hydroxy-
MS SS
8.00 3.00
64.00 15.00
µg/cig µg/cig
Benzonitrile Benzonitrile
MS SS
5.00 33.00
6.00 57.00
µg/cig µg/cig
Bipyridyl, 2,3'-Bipyridyl, 2,3'-
MS SS
9.90 20.00
27.40 73.00
µg/cig µg/cig
Bipyridyl, 5-methyl-2,3'-Bipyridyl, 5-methyl-2,3'-
MS SS
6.60 6.00
14.70 14.00
µg/cig µg/cig
Butylrolactone, gamma-Butylrolactone, gamma-
SS MS
40.00 11.00
103.00 22.00
µg/cig µg/cig
Carbon monoxide IA Carbon monoxide IA Carbon monoxide
(gas only + people) IA Carbon monoxide (people absent) IA Carbon monoxide (people present) IA Carbon monoxide (people present) IA Carbon monoxide control IA Carbon monoxide control IA Carbon monoxide (artificial cond.) IA Carbon monoxide (natural cond.) IA
2.00 0.00
23.00 21.00 18.00
3.70 0.00 0.00 8.00 9.00
23.00 1.20
26.00 25.00 22.00
4.20 15.00
0.50 16.00
ppm ppm
ppm ppm ppm ppm ppm ppm ppm ppm
Carbon, total Carbon, elemental Carbon, organic
IA IA IA
207.00 11.90
195.00
µg/m3
µg/m3
µg/m3
Carboxyhemoglobin (blood, passive)
Carboxyhemoglobin (blood, smoker)
Carboxyhemoglobin (blood, no smoking)
IA
IA
IA
0.55
3.38
0.57
%
%
%
79

RoC Background Document for Environmental Tobacco Smoke
Compound Sample Concentration range type Low High Units
Catechol MS 148.00 362.00 µg/cig Catechol SS 138.00 292.00 µg/cig Catechol, 2-methyl- MS 6.00 13.00 µg/cig Catechol, 2-methyl- SS 8.00 21.00 µg/cig Catechol, 3-methyl- MS 31.00 62.00 µg/cig Catechol, 3-methyl- SS 24.00 47.00 µg/cig Catechol, 4-ethyl- NIS 27.00 102.00 µg/cig Catechol, 4-ethyl- SS 19.00 68.00 µg/cig Catechol, 4-methyl- SS 25.00 55.00 µg/cig Catechol, 4-methyl- MS 29.00 80.00 µg/cig Catechol, 4-vinyl- MS 23.00 113.00 µg/cig Catechol, 4-vinyl- SS 7.00 40.00 µg/cig Catechols (all catechols) MS 25.00 328.00 µg/cig Catechols (all catechols) SS 88.00 212.00 µg/cig
Coronene Coronene control
IA IA
0.50 1.00
1.20 2.80
ng/m3
ng/m3
Cotinine (plasma, nonsmoker) IA 1.40 ng/mL Cotinine (plasma, passive smoker) IA 2.10 ng/mL Cotinine (plasma, smoker) IA 52.40 ng/mL
Cresol, m- MS 11.00 18.00 µg/cig Cresol, m- MS 17.00 26.00 µg/cig Cresol, m- SS 13.00 24.00 µg/cig Cresol, m- SS 18.00 34.00 µg/cig Cresol, o- MS 13.00 19.00 µg/cig Cresol, o- SS 14.00 24.00 µg/cig Cresol, p- MS 30.00 37.00 µg/cig Cresol, p- MS 32.00 47.00 µg/cig Cresol, p- SS 30.00 46.00 µg/cig Cresol, p- SS 45.00 62.00 µg/cig
Cyclopentenone, 2,3-dimethyl-2- MS 9.00 23.00 µg/cig Cyclopentenone, 2,3-dimethyl-2- SS 21.00 39.00 µg/cig Cyclopentenone, 2- MS 21.00 27.00 µg/cig Cyclopentenone, 2- SS 70.00 103.00 µg/cig Cyclopentenone,
2-OH-3-methyl-2- MS 3.00 5.00 µg/cig Cyclopentenone,
2-OH-3-methyl-2- SS 24.00 30.00 µg/cig Cyclopentenone, 2-methyl-2- MS 17.00 22.00 µg/cig Cyclopentenone, 2-methyl-2- SS 49.00 95.00 µg/cig
80

RoC Background Document for Environmental Tobacco Smoke
Compound Sample Concentration range type Low High Units
Dibenz[a, j]anthracene IA 6.00 ng/m3
Dibenz[a, j]anthracene MS 11.00 ng/cig Dibenz[a, j]anthracene SS 41.00 ng/cig
Ethylbenzene (breath, nonsmokers)
Ethylbenzene (breath. smokers) IA IA
0.80 2.60
µg/m3
µg/m3
Ethylbenzene (homes, nonsmokers)
Ethylbenzene (homes, smokers) IA IA
3.50 3.50
5.10 8.30
µg/m3
µg/m3
Ethylmethylenephenanthrene IA Qual (ng/m3)
Fluoranthene Fluoranthene
IA IA 99.00
Qual (ng/m3) ng/m3
Fluoranthene MS 272.00 ng/cig Fluoranthene MS, P 61.30 ng/cig Fluoranthene SS 1255.00 ng/cig Fluoranthene SS, P 669.00 ng/cig Fluoranthene SS, V 16.90 ng/cig
Formaldehyde IA 1.50 2.10 ppm Formaldehyde IA 0.10 0.16 ppm Formaldehyde SS 80.00 110.00 ppm
Formic acid MS 210.00 478.00 µg/cig Formic acid SS 341.00 665.00 µg/cig
Furaldehyde, 2- MS 15.00 43.00 µg/cig Furaldehyde, 2- SS 113.00 290.00 µg/cig Furaldehyde, 5-methyl- MS 6.00 29.00 µg/cig Furaldehyde, 5-methyl- SS 20.00 127.00 µg/cig
Furfuryl alcohol MS 18.00 65.00 µg/cig Furfuryl alcohol SS 73.00 283.00 µg/cig
Furoic acid, 2- MS 44.00 107.00 µg/cig Furoic acid, 2- SS 25.00 60.00 µg/cig
Glutaric acid MS 10.00 58.00 µg/cig Glutaric acid SS 6.00 18.00 µg/cig
81

RoC Background Document for Environmental Tobacco Smoke
Compound Sample Concentration range type Low High Units
Glycolic acid MS 37.00 126.00 µg/cig Glycolic acid SS 35.00 77.00 µg/cig
Guaiacol, 4-vinyl- SS 24.00 32.00 µg/cig Guaiacol, 4-vinvl- MS 23.00 36.00 µg/cig Guaiacol, 4-vinyl- MS 16.00 30.00 µg/cig Guaiacol, 4-vinyl- SS 15.00 37.00 µg/cig
HCN HCN (gas only + people) HCN (people absent) HCN (people present)
IA IA IA IA
0.01 82.00 50.00 10.00
0.08 86.00
14.00
mg/m3
µg/m3
µg/m3
µg/m3
Hydrazine MS 31.50 ng/cig Hydrazine SS 94.20 ng/cig
Hydroquinone MS 114.00 300.00 µg/cig Hydroquinione SS 91.00 285.00 µg/cig Hydroquinone, methyl- MS 23.00 39.00 µg/cig Hydroquinone, methyl- SS 21.00 41.00 µg/cig
Hydroxypropionic acid, 3- M S 2.00 31.00 µg/cig Hydroxypropionic acid, 3- SS 1.00 29.00 µg/cig
Indeno[1,2,3-cd]pyrene IA Qual (ng/m3) Indeno[1,2,3-cd]pyrene MS, V 0.17 ng/I cig Indeno[1,2,3-cd]pyrene SS, P 51.00 ng/cig Indeno[1,2,3-cd]pyrene SS, V 0.36 ng/cig Indeno[1,2,3-cd]pyrene MS, P 8.10 ng/cig
Isoquinoline MS 1.60 2.00 µg/cig Isoquinoline SS 5.00 9.00 µg/cig
Lactic acid MS 63.00 174.00 µg/cig Lactic acid SS 45.00 123.00 µg/cig
Levulinic acid MS 29.00 56.00 µg/cig Levulinic acid SS 25.00 49.00 µg/cig
Limonene MS 15.00 49.00 µg/cig Limonene SS 63.00 397.00 µg/cig
82

RoC Background Document for Environmental Tobacco Smoke
Compound Sample type
Concentration range Low High Units
Lutidine, 2, 4-Lutidine, 2, 6-Lutidine, 2, 6-Lutidine, 3, 5-Lutidine, 3, 5-
SS MS SS MS SS
35.00 1.40 1.40 0.00
22.00
315.00 33.00 33.00 17.00
251.00
µg/cig µg/cig µg/cig µg/cig µg/cig
Methylenephenanthrene, 4, 5- IA Qual (ng/m3) 1
Methylnaphthalene, 1-Methylnaphthalene, 1-Methylnaphthalene, 2-Methylnaphthalene, 2-
SS MS MS SS
30.00 1.02 1.21
31.60
µg/cig µg/cig µg/cig µg/cig
Methylnitrosoamino-pyridyl-butanone Methylnitrosoamino-pyridyl-butanone
MS
SS
46.00
201.00
240.00
540.00
ng/cig
ng/cig
Methylphenanthrene, 1-Methylphenanthrene, 2-Methylphenanthrene, 3-Methylphenanthrene, 4/9-
IA IA IA IA
Qual (ng/m3) Qual (ng/m3) Qual (ng/m3) Qual (ng/m3)
Myosmine Myosmine
MS SS
13.10 73.00
33.00 224.00
µg/cig µg/cig
Naphthalene Naphthalene
MS SS
2.76 45.50
µg/cig µg/cig
Neophytadiene Neophytadiene
MS SS
66.00 70.00
232.00 421.00
µg/cig µg/cig
Nicotine Nicotine Nicotine Nicotine Nicotine Nicotine Nicotine Nicotine
IA IA IA IA MS MS SS SS
25.00 0.70 1.00 1.70
1720.00 1483.00 3210.00 2987.00
1010.00 3.10
10.30 180.00
3330.00 3149.00 5830.00 6588.00
µg/m3
µg/m3
µg/m3
pg/m2 min µg/cig µg/cig µg/cig µg/cig
83

RoC Background Document for Environmental Tobacco Smoke
Compound Sample type
Concentration range Low High Units
Nicotine (gas only + people) Nicotine (people absent) Nicotine (people present) Nicotine, office buildings
IA IA IA IA
130.00 102.00
1.70 180.00
Traces only µg/m3
µg/m3
pg/m2 min
Nicotyrine Nicotyrine Nicotyrine Nicotyrine
MS MS SS SS
4.20 17.00 49.00 93.00
20.20 41.00
211.00 263.00
µg/cig µg/cig µg/cig µg/cig
Nitrogen dioxide IA Nitrogen dioxide IA Nitrogen dioxide
(gas only + people) IA Nitrogen dioxide (people absent) IA Nitrogen dioxide (people present) IA Nitrogen dioxide control IA
0.00 58.00
0.01 0.00 0.00
27.00
0.03
0.03
ppm ppb
ppm ppm ppm ppb
Nitrogen oxide IA Nitrogen oxide IA Nitrogen oxide (gas only + people) IA Nitrogen oxide (people absent) IA Nitrogen oxide (people present) IA Nitrogen oxide control IA Nitrogen oxides (combined) IA
0.30 0.00 0.31 0.48 0.30 5.00
59.00
0.60 9.00 0.40 0.59 0.60
218.00
ppm ppb ppm ppm ppm ppb ppb
Nitrosoamine, methylethyl-Nitrosoamine, methylethyl-Nitrosoamine, methylethyl-Nitrosoamine, methylethyl-
MS MS SS SS
0.10 0.00 9.00 0.00
9.10 1.80
75.00 27.00
ng/cig ng/cig ng/cig ng/cig
Nitrosoanabasine. N'-Nitrosoanatidine, N'-Nitrosoanatidine, N'-
SS MS SS
15.00 82.00 61.00
40.00 167.00 220.00
ng/cig ng/cig ng/cig
Nitrosodiethylamine Nitrosodiethylamine Nitrosodiethylamine, N-Nitrosodiethylamine, N-Nitrosodiethylamine (artificial) Nitrosodiethylamine
(natural conditions)
MS SS MS SS IA
IA
0.00 8.00 1.80 8.20 0.00
0.00
4.80 73.00
4.80 73.00
0.01
0.20
ng/cig ng/cig ng/cig ng/cig ng/L
ng/L
84

RoC Background Document for Environmental Tobacco Smoke
Compound Sample Concentration range type Low High Units
Nitrosodimethylamine MS 1.70 97.00 ng/cig Nitrosodimethylamine MS 0.00 27.00 ng/cig Nitrosodimethylamine SS 680.00 1770.00 ng/cig Nitrosodimethylamine SS 143.00 415.00 ng/cig Nitrosodimethylamine SS 460.00 1880.00 ng/cig Nitrosodimethylamine, N- MS 1.70 97.00 ng/cig Nitrosodimethylamine, N- SS 680.00 1040.00 ng/cig Nitrosodimethylamine (artificial) IA 0.02 0.15 ng/L Nitrosodimethylamine
(natural conditions) IA 0.00 0.70 ng/L
Nitrosoethylmethylamine, N- MS 81.00 390.00 ng/cig Nitrosoethylmethylamine, N- SS 9.40 30.00 ng/cig
Nitrosonornicotine MS 81.00 390.00 ng/cig Nitrosonornicotine SS 110.00 390-00 ng/cig
Nitrosopyrrolidine MS 2.60 52.00 ng/cig Nitrosopyrrolidine MS 1.50 29.00 ng/cig Nitrosopyrrolidine SS 204.00 612.00 ng/cig Nitrosopyrrolidine SS 28.00 143.00 ng/cig Nitrosopyrrolidine SS 80.00 500.00 ng/cig Nitrosopyrrolidine, N- MS 2.60 51.70 ng/cig Nitrosopyrrolidine, N- SS 204.00 387.00 ng/cig
Octane (breath smokers) Octane (breath, nonsmokers) Octane (homes, nonsmokers) Octane (homes, smokers)
IA IA IA IA
1.10 0.10 1.70 1.50
3.10 4.70
µg/m3
µg/m3
µg/m3
µg/m3
Parvoline MS 0.00 4.30 µg/cig Parvoline SS 10.00 145.00 µg/cig
Pentadien-4-olide, 2,4- MS 8.00 41.00 µg/cig Pentadien-4-olide, 2,4- SS 71.00 256.00 µg/cig
Perylene Perylene Perylene
IA IA IA
11.00 0.70 1.30
Qual (ng/m3) ng/m3
ng/m3
Perylene MS 9.00 ng/cig Perylene Perylene control
SS IA
39.00 2.80 1.70
ng/cig ng/m3
85

RoC Background Document for Environmental Tobacco Smoke
Compound Sample Concentration range type Low High Units
Phenanthrene IA Qual (ng/m3) Phenanthrene MS, P 74.80 ng/cig Phenanthrene MS, V 2.10 ng/cig Phenanthrene SS, P 2149.00 ng/cig Phenanthrene SS, V 248.00 ng/cig
Phenol MS 79.00 136.00 µg/cig Phenol MS 77.00 139.00 µg/cig Phenol SS 69.00 241.00 µg/cig Phenol SS 157.00 289.00 µg/cig
Phenol, 4-vinyl- MS 18.00 45.00 µg/cig Phenol, 4-vinyl-Phenols
SS IA
25.00 7.40
57.00 11.50
µg/cig µg/m3
Phenylacetic acid MS 18.00 38.00 µg/cig Phenylacetic acid Ss 11.(0 30.00 µg/cig
Picoline, 3- MS 12.00 22.00 µg/cig Picoline, 3- SS 90.00 166.00 µg/cig Picoline, alpha- MS 12.30 189.00 µg/cig Picoline, alpha- SS 128.00 1090.00 µg/cig
Pyran-4-one, 5,6-diOH-3, 5-diOH-2-ME MS 13.00 153.00 µg/cig Pyran-4-one, 5,6-diOH-3, 5-diOH-2-ME SS 0.00 143.00 µg/cig
Pyrazine, 2,3-dimethyl- SS 0.00 50.00 µg/cig Pyrazine, 2-methyl- MS 0.00 8.60 µg/cig Pyrazine, 2-methyl- SS 0.00 8.60 µg/cig
Pyrene Pyrene Pyrene
IA IA IA
66.00 4.10 9.40
Qual (ng/m3) ng/m3
ng/m3
Pyrene MS 270.00 ng/cig Pyrene MS, P 43.00 ng/cig Pyrene MS, V 1.90 ng/cig Pyrene SS 1011.00 ng/cig Pyrene SS, P 466.00 ng/cig Pyrene Pyrene control
SS, V IA
10.30 2.80 7.00
ng/cig ng/m3
86

RoC Background Document for Environmental Tobacco Smoke
Compound Sample Concentration range type Low High Units
Pyrene, 1-methyl-Pyrene, 2-methyl-Pyrene, 4-methyl-
IA IA IA
Qual (ng/m3) Qual (ng/m3) Qual (ng/rn3)
Pyridine MS 32.40 648.00 µg/cig Pyridine MS 16.00 20.00 µg/cig Pyridine SS 336.00 3420.00 µg/cig Pyridine SS 187.00 262.00 µg/cig Pyridine, 2-(3-pentyl)- MS 0.00 1.50 µg/cig Pyridine, 2-(3-pentyl)- SS 0.00 143.00 µg/cig Pyridine, 2-ethyl- MS 2.60 35.00 µg/cig Pyridine, 2-ethyl- SS 2.60 35.00 µg/cig Pyridine, 3-acetyl- MS 3.80 6.40 µg/cig Pyridine, 3-acetyl- SS 9.00 11.00 µg/cig Pyridine, 3-cyano- SS 24.00 64.00 µg/cig Pyridine, 3-cyano- MS 2.40 4.20 µg/cig Pyridine, 3-ethyl- MS 4.00 6.00 µg/cig
Pyridine, 3-ethyl- SS 71.00 960.00 µg/cig Pyridine, 3-ethyl- SS 21.00 36.00 µg/cig Pyridine, 3-ethyl-4-methyl- SS 6.40 34.00 µg/cig Pyridine, 3-ethyl-4-methyl- MS 0.00 1.50 µg/cig Pyridine, 3-hydroxy- MS 125.10 211.40 µg/cig Pyridine, 3-hydroxy- MS 90.00 119.00 µg/cig Pyridine, 3-hydroxy- SS 152.00 167.00 µg/cig Pyridine, 3-hvdroxv- SS 157.00 191.00 µg/cig Pyridine, 4-ethyl SS 27.00 379.00 µg/cig
Pyridine, 4-i-butvi MS 0.00 4.50 µg/cig Pyridine, 4-i-butvi SS 17.00 287.00 µg/cig Pyridine, methylvinyl- MS 2.20 4.10 µg/cig Pyridine, methylvinyl- SS 12.00 19.00 µg/cig
Pyrrole MS 16.00 23.00 µg/cig Pyrrole SS 140.00 272.00 µg/cig
Styrene (breath, nonsmokers) Styrene (breath, smokers) Styrene (homes, nonsmokers) Styrene (homes, smokers)
IA IA IA IA
0.30 1.10 0.80 1.10
1.10 2.20
µg/m3
µg/m3
µg/m3
µg/m3
87

RoC Background Document for Environmental Tobacco Smoke
Compound Sample type
Concentration range Low High Units
Succinic acid Succinic acid Succinic acid, methyl-Succinic acid, methyl-
MS SS MS SS
112.00 65.00
4.00 1.00
163.00 70.00 31.00 13.00
µg/cig µg/cig µg/cig µg/cig
Tar radical sol in t-butylbenzene Tar radical sol in t-butylbenzene
MS SS
Qualitative Qualitative
Thiocyanate (plasma, nonsmoker) IA Thiocyanate
(plasma, passive smoker) IA Thiocyanate (plasma, smoker) IA
70.80
71.80 70.70
µmol/L
µmol/L µmol/L
Thioethers (urine, nonsmoker) IA Thioethers (urine, passive smoker) IA Thioethers (urine, smoker) IA
6.00 6.40 6.30
mmol/mL mmol/mL mmol/mL
Toluene IA 0.04 1.04 mg/m3
Valeric acid, 3-methyl-Valeric acid, 3-methyl-
MS SS
20.00 20.00
261.00 384.00
µg/cig µg/cig
Vinylphenol, p-Vinylphenol, p-
MS SS
21.00 21.00
51.00 45.00
µg/cig µg/cig
Xylene, m- + p-(breath, nonsmokers) IA
Xylene, m- + p- (breath, smokers) IA Xylene, o- (breath, nonsmokers) IA Xylene, m- + p-
(homes, nonsmokers) IA Xylene, m- + p- (homes, smokers) IA Xylene, o- (breath, smokers) IA Xylene, o- (homes, nonsmokers) IA Xylene, o- (homes, smokers) IA
2.10 5.50 0.80
10.00 10.00
1.60 4.00 3.20
13.00 20.00
5.20 7.10
µg/m3
µg/m3
µg/m3
µg/m3
µg/m3
µg/m3
µg/m3
µg/m3
Xylenol, 2,6-Xylenol, 2,6-
MS SS
8.00 8.00
16.00 20.00
µg/cig µg/cig
a Listings are given in alphabetical order by compound and special conditions are noted in parentheses within the column labeled 'Compound'. The sample type is categorized in the second column as IA, indoor air; SS,sidestream smoke; MS, mainstream smoke; P, associated with particulate matter; and V, associated with volatile compounds.
(Claxton et al. 1989)
88

RoC Background Document for Environmental Tobacco Smoke
89

RoC Background Document for Environmental Tobacco Smoke
Appendix 2THE GENOTOXICITY OF COMPOUNDS ASSOCIATED WITH ENVIRONMENTAL TOBACCO SMOKE
Compound CAS Number Bioassay
Results a
Acetamide 60-35-5 CCC +
CT + ST -
Acetic acid 64-19-7 ST -
Acrolein 107-02-8 ST +
Anthracene 120-12-7 CCC I CT -
CYC -
MNT -ST -
Benz[a]anthracene 56-55-3 CCC +
CT + REC -
ST +
V79 +
Benzene 71-43-2 CCC + CYI +
MNT +
SCE -TRM +
Benzo[a]pyrene 50-32-8 CCC +
CT +
CYC -MDR +
MNT +
MST + SCE +
SRL +
ST + V79 +
Benzo[b]fluoranthene 205-99-2 CCC +
Benzo[e]pyrene 192-97-2 CCC I
CT -REC -
Benzo[ghi]perylene 191-24-2 ST +
90

RoC Background Document for Environmental Tobacco Smoke
Compound CAS Number Bioassay
Results a
Benzoic acid 65-85-0 ST -
Butyrolactone, gamma 96-48-0 ST -
Cresol, m-, o-, and p- 9548-7 ST -Dibenz[a, j]anthracene 224-41-9 ST +
Formaldehyde 50-00-0 ASPD +
CCC +
MDR + NEU +
REC +
SRL + ST +
Hydrazine 302-01-2 CCC +
ST +
Hydroquinone 123-31-9 ALC + ST -
Indeno[1, 2, 3-cd]pyrene 193-39-5 CCC +
Isoquinoline 119-65-3 ST -Limonene 5989-27-5 ST -
Naphthalene 91-20-3 ST -
Nicotine 54-11-5 NEU -ST -
Nitrosodiethylamme, N'- 55-18-5 CCC +
CT +
CYC + L5 +
MDR +
MST -REC +
SCE +
ST + V79 +
Nitrosodimethylamine, N'-
62-75-9 ARA +
CCC +
CT + CYG +
CYG -
L5 + MNT +/-
91

RoC Background Document for Environmental Tobacco Smoke
Compound CAS Number Bioassay
Results a
MST -
NEU +
SCE + SRL +
ST +
V79 +
YEA + Nitrosonornicotine 16543-55-8 CCC +
Nitrosopyrrolidine 930-55-2 CCC +
Perylene 198-55-0 SCE -Phenanthrene 85-01-8 ALC +
CCC I
CT -
CYC -ST -
Phenol 108-95-2 NEU -
Pyrene 129-00-0 CCC I CT -
CYC -
ST -V79 -
Pyridine 110-86-1 SCE +
ST -
Toluene 108-88-3 SCE -ST -
a Bioassay information is extracted from Graedel et al. (1986) as cited by Claxton et al. (1989). Abbreviations used for bioassay results are as follows: ALC, Allium cytogenetics assays; ARA, Arabidopsis mutagen assay; ASPH, Aspergillus mutagen assay; CCC, whole animal carcinogen assays; CT, cell transformation bioassays; CY, mammalian cytogenetic bioassays; L5, L5178Y mouse lymphoma assay; MDR, manunalian cell DNA repair assays; NINT, micronucleus assays; MST, mouse spot test; NEU, Neurospora assays; REC, DNA repair-deficient bacterial assays; SCE, sister-chromatid exchange assays; SRL, sex-linked recessive lethal assays in Drosophila; ST, Salmonella assays; TRM, Tradescantia mutagen assays; V79, V79 Chinese hamster mutation assays; and YEA, Yeast mutation tests. Results are recorded as +, positive; -, negative; and I, Indefinite.
92

FINAL
Report on CarcinogensBackground Document for
Environmental Tobacco Smoke Appendix 3A – IARC (1986) Vol. 38. Evaluation of the carcinogenic risk of chemicals to humans – Tobacco Smoking Epidemiology Studies of Cancer in Humans pp. 199-375
Appendix 3B – U.S.EPA (1992) Respiratory health effects of passive smoking: lung cancer and other disorders. EPA/600/6-90/006F Chapter 5: Hazard Identification II: Interpretation of Epidemiologic Studies on Environmental Tobacco Smoke and Lung Cancer
Appendix A Table 4-10 Study scores for tier assignments
Appendix 3C – California EPA (1997) Health Effects of Exposure of Environmental Tobacco Smoke. Chapter 7: Carcinogenic Effects
December 2 - 3, 1998
Meeting of the NTP Board of Scientific Counselors Report on Carcinogens Subcommittee Prepared for the: U.S. Department of Health and Human Services Public Health Services National Toxicology Program Research Triangle Park, North Carolina 27709
Prepared by: Technology Planning and Management Corporation Canterbury Hall, Suite 310 4815 Emperor Boulevard Durham, NC 27703 Contract Number NOI-ES-85421

Appendix 3A - IARC ( 1 986) Vol. 38. Evaluation of the carcinogenic risk of chemicals to humans-Tobacco Smoking Epidemiology Studies of Cancer in Humans pp. 199-375

Appendix 3B- U.S.EPA (1992) Respiratory health effects of passive smoking: lung cancer and other disorders. EPA/600/6-90/006F Chapter 5: Hazard Identification II: Interpretation of Epidemiologic Studies on Environmental Tobacco Smoke and Lung Cancer Report Appendix A Table 4-10. Study scores for tier assignments

Appendix 3C- California EPA (1997) Health Effects of Exposure of Environmental Tobacco Smoke. Chapter 7: Carcinogenic Effects