
Environmental Technology Verification Report · PDF filecarbon (TOC), ultraviolet absorbance...
79
December 2001 NSF 01/15/EPADW395 Environmental Technology Verification Report Inactivation of Cryptosporidium Parvum by Infectivity Studies and Determination of CT Values as a Surrogate for Giardia Lamblia and Virus Inactivation in Drinking Water Osmonics, Inc. Model PS 150 Ozone Disinfection System Prepared by NSF International Under a Cooperative Agreement with U.S. Environmental Protection Agency
Transcript of Environmental Technology Verification Report · PDF filecarbon (TOC), ultraviolet absorbance...

December 2001 NSF 01/15/EPADW395
Environmental Technology Verification Report
Inactivation of Cryptosporidium Parvum by Infectivity Studies and Determination of CT Values as a Surrogate for Giardia Lamblia and Virus Inactivation in Drinking Water Osmonics, Inc. Model PS 150 Ozone Disinfection System
Prepared by
NSF International
Under a Cooperative Agreement with
U.S. Environmental Protection Agency
01/15/EPADW395 The accompanying notice is an integral part of this verification statement. December 2001 VS-i
ETV Joint Verification Statement
THE ENVIRONMENTAL TECHNOLOGY VERIFICATION PROGRAM
TECHNOLOGY TYPE: OZONE DISINFECTION SYSTEM USED IN DRINKING WATER TREATMENT SYSTEMS
APPLICATION: INACTIVATION OF CRYPTOSPORIDIUM OOCYSTS AND CALCULATION OF CT IN DRINKING WATER
TECHNOLOGY NAME: MODEL PS 150 OZONE DISINFECTION SYSTEM
COMPANY: OSMONICS, INC.
ADDRESS: 5951 CLEARWATER DRIVE PHONE: (952) 933-2277 MINNETONKA, MN 55343 FAX: (952) 933-0141
WEB SITE: www.osmonics.com
EMAIL: [email protected]
The U.S. Environmental Protection Agency (EPA) has created the Environmental Technology Verification (ETV) Program to facilitate the deployment of innovative or improved environmental technologies through performance verification and dissemination of information. The goal of the ETV program is to further environmental protection by substantially accelerating the acceptance and use of improved and more cost-effective technologies. ETV seeks to achieve this goal by providing high quality, peer reviewed data on technology performance to those involved in the design, distribution, permitting, purchase, and use of environmental technologies. ETV works in partnership with recognized standards and testing organizations; stakeholders groups which consist of buyers, vendor organizations, and permitters; and with the full participation of individual technology developers. The program evaluates the performance of innovative technologies by developing test plans that are responsive to the needs of stakeholders, conducting field or laboratory tests (as appropriate), collecting and analyzing data, and preparing peer reviewed reports. All evaluations are conducted in accordance with rigorous quality assurance protocols to ensure that data of known and adequate quality are generated and that the results are defensible. NSF International (NSF) in cooperation with the EPA operates the Drinking Water Treatment Systems (DWTS) Pilot, one of 12 technology areas under ETV. The DWTS Pilot recently evaluated the performance of an ozone disinfection system used in drinking water treatment system applications. This verification statement provides a summary of the test results for the Osmonics Model PS 150 Ozone Disinfection System. Cartwright, Olsen and Associates, an NSF-qualified field testing organization (FTO), performed the verification testing.
U.S. Environmental Protection Agency NSF International
01/15/EPADW395 The accompanying notice is an integral part of this verification statement. December 2001 VS-ii
ABSTRACT
Verification testing of the Osmonics Model PS 150 Ozone Disinfection System was conducted for 216 hours of continuous operation between December 5, 1999 and December 14, 1999, and Cryptosporidium parvum (C. parvum) challenges were performed on December 5 through December 7, 1999. Between December 5 and December 14, 1999, raw water characteristics were: average pH 7.7, temperature 5.5°C, turbidity 0.14 Nephlometric Turbidity Units (NTU), total alkalinity 35 mg/L, and total hardness 64 mg/L. Average flow rate over the test period was 164.4 gpm. During the C. parvum challenges the raw water characteristics were: pH 7.74-8.12, temperature 5.4-6.2°C, flow rate 164.4-165.5 gpm and inlet water pressure 12-16 psig. The system demonstrated –0.01 to 0.62 log10 inactivation of C. parvum oocysts and CT values between 6.78 and 19.35 based on the log integration method and between 4.34 and 11.45 based on the conservative method (see Chapter 4 for details).
TECHNOLOGY DESCRIPTION
All components of the system (with the exception of the contact tank) are assembled as a package in a skid and frame configuration. The system is equipped with a control panel and process logic controller, power supply, transformer, and fail-safe monitoring controls. The Model PS 150 includes a high efficiency ozone generator, a stainless steel side stream booster pump, a Venturi injector, a small stainless steel dissolution chamber, a cyclonic degas stripper, a stainless steel ozone contact tank, and an ozone off-gas destruct unit. Physical dimensions of skid/frame are 10’ wide × 5’ deep × 6’ high, and weighs 4,000 pounds. The contact tank measures 60” diameter × 144” height, and weighs 1,000 pounds. Total combined shipping weight is 5,000 pounds and is suitable for easy transportation.
The ozone generator is a model HC-2, high efficiency, cabinet style unit with a maximum rated output of 20 pounds/day at 6% weight concentration. It is a high frequency generator, operating at 7 kHz. The power supply is 230 VAC, 60 Hz, 3 phase, with 30 amps per phase circuit protection. Ozone is produced when oxygen gas enters the generator and passes through an electric field. This electric field excites the oxygen into ozone. This ozone and oxygen mixture then flows out of the generator to be mixed with the water at the injector.
The Model PS 150 allows the operator to select the CT value applied to influent water via a control screen located on the front of the unit. The control screen is driven by a programmable logic controller (PLC), electronically connected to a water flow rate meter and on-line dissolved ozone sensors located at the inlet and outlet of the Model PS 150’s ozone contacting system. The controller achieves and maintains CT values desired by the operator by taking the average of the inlet and outlet dissolved ozone readings and multiplying this number by the systems’ hydraulic retention time (minutes) and value (T10/Ttheory). The Model PS 150 system provided for this ETV study had been programmed with a total retention volume of 1,200 gallons and a hydraulic value (T10/TTheory) of 0.5.
The PLC automatically increased power to the ozone gas generator if the PLC calculated CT value started to fall below the set point thus increasing ozone gas concentration produced. This increase elevated the amount of ozone dissolved into solution, thus maintaining the CT value at its original set point. The reverse would occur if a CT value started to increase above the original set point.
The Model PS 150 is designed to be a final barrier for microbiological contaminants, including G. lamblia and C. parvum. Accordingly it is intended the Model PS 150 be installed to treat water that has been filtered to a level � 1 NTU turbidity.
01/15/EPADW395 The accompanying notice is an integral part of this verification statement. December 2001 VS-iii
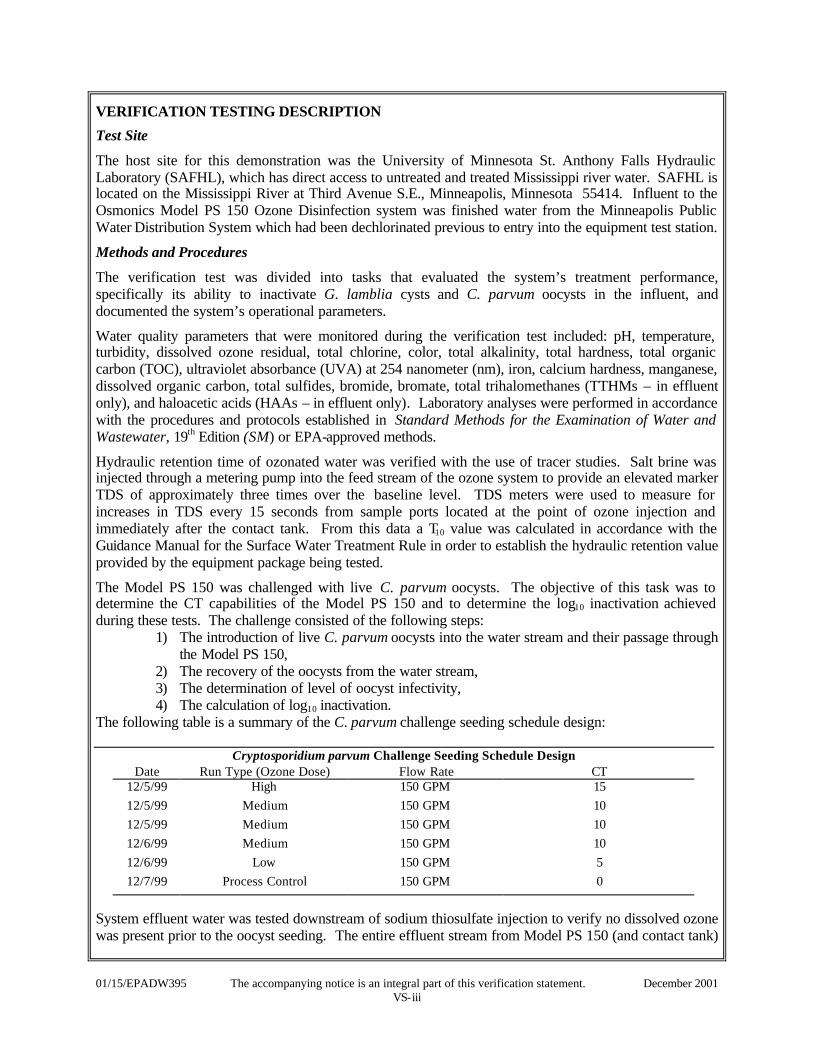
VERIFICATION TESTING DESCRIPTION
Test Site
The host site for this demonstration was the University of Minnesota St. Anthony Falls Hydraulic Laboratory (SAFHL), which has direct access to untreated and treated Mississippi river water. SAFHL is located on the Mississippi River at Third Avenue S.E., Minneapolis, Minnesota 55414. Influent to the Osmonics Model PS 150 Ozone Disinfection system was finished water from the Minneapolis Public Water Distribution System which had been dechlorinated previous to entry into the equipment test station.
Methods and Procedures
The verification test was divided into tasks that evaluated the system’s treatment performance, specifically its ability to inactivate G. lamblia cysts and C. parvum oocysts in the influent, and documented the system’s operational parameters.
Water quality parameters that were monitored during the verification test included: pH, temperature, turbidity, dissolved ozone residual, total chlorine, color, total alkalinity, total hardness, total organic carbon (TOC), ultraviolet absorbance (UVA) at 254 nanometer (nm), iron, calcium hardness, manganese, dissolved organic carbon, total sulfides, bromide, bromate, total trihalomethanes (TTHMs – in effluent only), and haloacetic acids (HAAs – in effluent only). Laboratory analyses were performed in accordance with the procedures and protocols established in Standard Methods for the Examination of Water and Wastewater, 19th Edition (SM) or EPA-approved methods.
Hydraulic retention time of ozonated water was verified with the use of tracer studies. Salt brine was injected through a metering pump into the feed stream of the ozone system to provide an elevated marker TDS of approximately three times over the baseline level. TDS meters were used to measure for increases in TDS every 15 seconds from sample ports located at the point of ozone injection and immediately after the contact tank. From this data a T10 value was calculated in accordance with the Guidance Manual for the Surface Water Treatment Rule in order to establish the hydraulic retention value provided by the equipment package being tested.
The Model PS 150 was challenged with live C. parvum oocysts. The objective of this task was to determine the CT capabilities of the Model PS 150 and to determine the log10 inactivation achieved during these tests. The challenge consisted of the following steps: 1) The introduction of live C. parvum oocysts into the water stream and their passage through
the Model PS 150, 2) The recovery of the oocysts from the water stream, 3) The determination of level of oocyst infectivity,
4) The calculation of log10 inactivation. The following table is a summary of the C. parvum challenge seeding schedule design:
Cryptosporidium parvum Challenge Seeding Schedule Design Date Run Type (Ozone Dose) Flow Rate CT
12/5/99 High 150 GPM 15 12/5/99 Medium 150 GPM 10 12/5/99 Medium 150 GPM 10 12/6/99 Medium 150 GPM 10 12/6/99 Low 150 GPM 5 12/7/99 Process Control 150 GPM 0
System effluent water was tested downstream of sodium thiosulfate injection to verify no dissolved ozone was present prior to the oocyst seeding. The entire effluent stream from Model PS 150 (and contact tank)

01/15/EPADW395 The accompanying notice is an integral part of this verification statement. December 2001 VS-iv
was diverted through a stainless steel housing containing four 3" diameter by 20" long 1.0 µm absolute track-etch polycarbonate membrane filter cartridges (Nucleopore, Inc.). The surface area of each filter was 2.8 m2 (30.14 ft2) for a total filter area of 120.5 ft2. At 150 gpm the approach flowrate was 1.24 gpm/ft2. Protozoan oocyst injection utilized a 100 mL graduated cylinder into which a suspension of approximately 2.0 x 10⁸ to 4 x 10⁸ oocysts was placed. A 44 gpd Pulsatron Model LPKSA PTC2 metering pump equipped with PTFE tubing injected the organisms into the feed stream at a rate of 50 mL/min. A neonatal mouse model was used to evaluate infectivity of C. parvum oocysts. The number of oocysts in each experimental sample was determined using immunofluorescence (IF) straining. Logistic analysis, as proposed by Finch, et al. (1993), was used for analyzing oocyst dose-response data. This method applies a logarithmic transformation that converts the normal dose-response data into a form that can be readily analyzed by linear regression. CT values were calculated during C. parvum challenge seedings. The measured CT values were compared to the CT values for log10 inactivation for G. lamblia and virus accepted by the USEPA.
VERIFICATION OF PERFORMANCE
Source Water
Between December 5 and December 14, 1999, raw water characteristics were: average pH 7.7, temperature 5.5°C, turbidity 0.14 Nephlometric Turbidity Units (NTU), total alkalinity 35 mg/L, and total hardness 64 mg/L. Average verified flow rate over the test period was 164.4 gpm. During the C. parvum challenges the raw water characteristics were: pH 7.74-8.12, temperature 5.4-6.2°C, flow rate 164.4-165.5 gpm and inlet water pressure 12-16 psig.
Hydraulic Retention Time
Total retention volume of the PS 150 was verified at 1,610.4 gallons (as compared to 1,200 gallons estimated by Osmonics) and challenge flow rate was verified at 164.4 gpm. Hydraulic tracer tests provided an estimated T10 value of 4.0 minutes. Given a Ttheory value 9.8 minutes (1,610.4 gallons/164.4 gpm) the hydrodynamic value of the contactor is represented as 0.41 (T10/Ttheory). The T10 value represents the minimum length of time for which 90 percent of the water will be exposed to the disinfectant within the contactor while Ttheory represents the theoretical hydraulic detention time of the contactor assuming plug flow (calculated by dividing the total volume of the contractor by the water flow rate).
Operation and Maintenance
A recurring issue that was problematic to the operation of the Osmonics Model PS 150 involved the operators’ ability to set (or change) the CT value achieved by the system via the controller’s menu screen. The O&M manual described the ability for an operator to change an applied CT value (ozone dose) delivered by the equipment package by keying in the desired value on a menu screen. This feature did not function during the course of the testing period. Accordingly, CT values were changed by adjusting power supplied to the ozone generator until the CT value displayed on the controller’s output screen reached the desired level.
Another issue that proved to be problematic to the operator involved resetting the normally open solenoid valve located on the ozone gas delivery line between the venturi and the ozone generator. This valve automatically closes upon the detection of water droplets within the gas delivery line, thus preventing the passage of water in the event of a check valve failure. Unfortunately, once the solenoid valve closed, it did not reopen once the water droplets had been removed. It was discovered with manipulation of the PLC, the valve would open, but not without significant manual intervention. The O&M manual provided by the manufacturer primarily defined installation, operation and maintenance requirements for Osmonics Model PS 150. The manual provided information pertaining to basic installation, start-up, and operational process. A process schematic, trouble shooting guide, and associated O&M manuals for

01/15/EPADW395 The accompanying notice is an integral part of this verification statement. December 2001 VS-v
components used within the system were also provided. The O&M manual was reviewed for completeness and used during equipment installation, start-up, system operation, and trouble -shooting. It was found the manual provides adequate instruction for tasks required to perform these functions over the period of operation of the ETV test period.
Protozoan Contaminant Removal
The system demonstrated –0.01 to 0.62 log10 inactivation of C. parvum oocysts and CT values between 6.78 and 19.35 based on the log integration method and between 4.34 and 11.45 based on the conservative method. These results were obtained at an average flow rate of 164.4 gpm. These CT values are a surrogate for the disinfection effectiveness of the Model PS 150 treating water at a pH of 7.74-8.12 and a temperature range of 5.4-6.2°C for G. lamblia and virus inactivation.
Finished Water Quality
A summary of the effluent water quality information for the verification period of December 5, 1999 through December 14, 1999 is presented in the following table.
Effluent Water Quality (December 5 - 14, 1999) Parameter # of
samples Average Minimum Maximum Standard
Deviation 95% Conf.
Interval PQL
Bromide (mg/L) 6 <1.0 <1.0 <1.0 NA NA 1.0 mg/L Bromate (mg/L) 6 <2.0 <2.0 <2.0 NA NA 2.0 mg/L Dissolved Manganese (mg/L) 6 <0.01 <0.01 <0.01 NA NA 0.01 mg/L Total Manganese 6 <0.01 <0.01 <0.01 NA NA 0.01 mg/L Total Trihalomethanes (ìg/L) 6 0.5 <0.5 0.6 NA NA 0.5 µg/L Ion Chromatography
*(Dichlorobromacetate) (mg/L)
6 1.3 1.2 1.5 NA NA 0.5 mg/L
UV254 (cm-l) 9 0.027 0.021 0.037 0.005 0.024, 0.040 - *When Ion Chromatography detected a positive result, further speciation concluded Dichlorobromacetate.
Power Consumption
Power consumption during the verification period totaled 699 kW hours and represented the total cost of operation. During the 216 hours of continuous operation the Model PS 150 system treated 1.944 million gallons of water resulting in an average power requirement of 359.57 kW hours per 1 million gallons treated.
Original Signed by E. Timothy Oppelt 01/04/02
Original Signed by Gordon Bellen 01/0802
E. Timothy Oppelt Date Director National Risk Management Research Laboratory Office of Research and Development United States Environmental Protection Agency
Gordon Bellen Date Vice President Federal Programs NSF International

01/15/EPADW395 The accompanying notice is an integral part of this verification statement. December 2001 VS-vi
NOTICE: Verifications are based on an evaluation of technology performance under specific, predetermined criteria and the appropriate quality assurance procedures. EPA and NSF make no expressed or implied warranties as to the performance of the technology and do not certify that a technology will always operate as verified. The end user is solely responsible for complying with any and all applicable federal, state, and local requirements. Mention of corporate names, trade names, or commercial products does not constitute endorsement or recommendation for use of specific products. This report is not a NSF Certification of the specific product mentioned herein.
Availability of Supporting Docume nts Copies of the ETV Protocol for Equipment Verification Testing for Inactivation of Microbiological Contaminants dated August 9, 1999, the Verification Statement, and the Verification Report (NSF Report # 01/15/EPADW395) are available from the following sources: (NOTE: Appendices are not included in the Verification Report. Appendices are available from NSF upon request.) 1. Drinking Water Treatment Systems ETV Pilot Manager (order hard copy) NSF International P.O. Box 130140 Ann Arbor, Michigan 48113-0140
2. NSF web site: http://www.nsf.org/etv (electronic copy)
3. EPA web site: http://www.epa.gov/etv (electronic copy)

December 2001
Environmental Technology Verification Report
Inactivation of Cryptosporidium parvum by Infectivity Studies
and Determination of CT Values as a Surrogate for Giardia
lamblia and Virus Inactivation in Drinking Water
Osmonics, Inc. Model PS 150 Ozone Disinfection System
Prepared for: NSF International
Ann Arbor, Michigan 48105
Prepared by Cartwright, Olsen and Associates, LLC
19406 East Bethel Blvd. Cedar, Minnesota 55011
(612) 434-1300
Under a cooperative agreement with the U.S. Environmental Protection Agency
Jeffrey Q. Adams, Project Officer National Risk Management Research Laboratory
U.S. Environmental Protection Agency Cincinnati, Ohio 45268

ii
Notice The U.S. Environmental Protection Agency (EPA) through its Office of Research and Development has financially supported and collaborated with NSF International (NSF) under Cooperative Agreement No. CR 824815. This verification effort was supported by Drinking Water Treatment Systems Pilot operating under the Environmental Technology Verification (ETV) Program. This document has been peer reviewed and reviewed by NSF and EPA and recommended for public release.

iii
Foreword The following is the final report on an Environmental Technology Verification (ETV) test performed for NSF International (NSF) and the United States Environmental Protection Agency (EPA) by Cartwright, Olsen & Associates, LLC (COA) in cooperation with Osmonics, Inc. The test was conducted during December of 1999 at the University of Minnesota St. Anthony Falls Hydraulic Laboratory, in Minneapolis, Minnesota. Throughout its history, the EPA has evaluated the effectiveness of innovative technologies to protect human health and the environment. A new EPA program, the Environmental Technology Verification Program (ETV) has been instituted to verify the performance of innovative technical solutions to environmental pollution or human health threats. ETV was created to substantially accelerate the entrance of new environmental technologies into the domestic and international marketplace. Verifiable, high quality data on the performance of new technologies is made available to regulators, developers, consulting engineers, and those in the public health and environmental protection industries. This encourages more rapid availability of approaches to better protect the environment. The EPA has partnered with NSF, an independent, not-for-profit testing and certification organization dedicated to public health, safety and protection of the environment, to verify performance of small package drinking water systems that serve small communities under the Drinking Water Treatment Systems (DWTS) ETV Pilot Project. A goal of verification testing is to enhance and facilitate the acceptance of small package drinking water treatment equipment by state drinking water regulatory officials and consulting engineers while reducing the need for testing of equipment at each location where the equipment’s use is contemplated. NSF will meet this goal by working with manufacturers and NSF-qualified Field Testing Organizations (FTO) to conduct verification testing under the approved protocols. The ETV DWTS is being conducted by NSF with participation of manufacturers, under the sponsorship of the EPA Office of Research and Development, National Risk Management Research Laboratory, Water Supply and Water Resources Division, Cincinnati, Ohio. It is important to note that verification of the equipment does not mean that the equipment is “certified” by NSF or “accepted” by EPA. Rather, it recognizes that the performance of the equipment has been determined and verified by these organizations for those conditions tested by the FTO.
iv
Table of Contents
Section Page Verification Statement .................................................................................................................. VS-i Title Page............................................................................................................................................i Notice ............................................................................................................................................... ii Foreword ......................................................................................................................................... iii Table of Contents.............................................................................................................................. iv Abbreviations and Acronyms............................................................................................................viii Acknowledgments..............................................................................................................................x Chapter 1: Introduction..................................................................................................................1 1.1 ETV Purpose and Program Operation....................................................................................1 1.2 Testing Participants and Responsibilities..................................................................................1
1.2.1 NSF International...........................................................................................................2 1.2.2 Field Testing Organization..............................................................................................2 1.2.3 Manufacturer .................................................................................................................3 1.2.4 Analytical Laboratories...................................................................................................3 1.2.5 University of Minnesota St. Anthony Falls Hydraulic Laboratory.....................................4 1.2.6 U.S. Environmental Protection Agency...........................................................................5
1.3 Verification Testing Site..........................................................................................................5 1.3.1 Source Water ................................................................................................................5 1.3.2 Pilot Effluent Discharge...................................................................................................7
Chapter 2: Equipment Description and Operating Processes .....................................................8 2.1 Historical Background Of Ozone............................................................................................8 2.2 Equipment Capabilities and Description................................................................................10
2.2.1 Equipment Description.................................................................................................10 2.2.2 Equipment Installation...................................................................................................14 2.2.3 Instrumentation And Control System.............................................................................15 2.2.4 Chemical Consumption/Waste......................................................................................15 2.2.5 Optimal Flow Range of Equipment ...............................................................................15
2.3 Operator Licensing Requirements.........................................................................................15 Chapter 3: Methods and Procedures ..........................................................................................17 3.1 Experimental Design.............................................................................................................17
3.1.1 Objectives ...................................................................................................................17 3.1.1.1 Evaluation of Stated Equipment Capabilities..............................................................17 3.1.1.2 Evaluation of Equipment Performance Relative To Water Quality Regulations ............17 3.1.1.3 Evaluation of Operational and Maintenance Requirements.........................................18 3.1.1.4 Evaluation of Equipment Characteristics....................................................................18
3.2 Verification Testing Schedule................................................................................................18 3.3 Initial Operations..................................................................................................................18
3.3.1 Characterization of Influent Water.................................................................................19

v
Table of Contents, continued
Section Page 3.3.2 Ozonated Effluent Water..............................................................................................20 3.3.3 Flow Rate....................................................................................................................20 3.3.4 Hydraulic Retention Time .............................................................................................20 3.3.5 Ozone Dosage .............................................................................................................20
3.4 Verification Task Procedures................................................................................................21 3.4.1 Task 1 - Verification Testing Runs and Routine Equipment Operation............................21 3.4.2 Task 2 - Influent and Effluent Water Quality Characterization........................................21 3.4.3 Task 3 - Documentation of Operating Conditions and Treatment Equipment
Performance ...............................................................................................................23 3.4.4 Task 4: Documentation of Equipment Performance: Calculation of CT and Inactivation
of C. parvum .............................................................................................................24 3.4.4.1 Description of Cryptosporidium parvum.................................................................24 3.4.4.2 Enumeration of oocyst Suspensions ..........................................................................25 3.4.4.3 Challenge Seeding Schedule .....................................................................................25 3.4.4.4 Neonatal Mouse Infectivity Assays ...........................................................................27 3.4.4.5 Calculation of Ozone Dose.......................................................................................29
3.5 Recording Data....................................................................................................................30 3.5.1 Objectives ...................................................................................................................30 3.5.2 Procedures ..................................................................................................................30
3.5.2.1 Logbooks ................................................................................................................30 3.5.2.2 Chain of Custody.....................................................................................................31 3.5.2.3 Spreadsheets ...........................................................................................................31
3.6 Calculation of Data Quality Indicators...................................................................................31 3.6.1 Representativeness.......................................................................................................31 3.6.2 Statistical Uncertainty...................................................................................................32 3.6.3 Accuracy.....................................................................................................................32 3.6.4 Precision......................................................................................................................33
3.7 Equipment............................................................................................................................33 3.8 Health and Safety Measures.................................................................................................34 3.9 QA/QC Procedures.............................................................................................................34
3.9.1 QA/QC Verifications ...................................................................................................35 3.9.2 On-Site Analytical Methods .........................................................................................35
3.9.2.1 pH...........................................................................................................................35 3.9.2.2 Temperature ............................................................................................................36 3.9.2.3 Turbidity..................................................................................................................36 3.9.2.4 Dissolved Ozone......................................................................................................36 3.9.2.5 Flow Meter..............................................................................................................37 3.9.2.6 Ozone Gas Monitor .................................................................................................37 3.9.2.7 Free Chlorine...........................................................................................................37
3.9.3 Off-Site Analysis For Chemical and Biological Samples ................................................37 3.9.3.1 Organic Parameters, Total Organic Carbon and UV254 Absorbance ..........................37 3.9.3.2 Inorganic Samples....................................................................................................38
vi
Table of Contents, continued
Section Page
3.9.3.3 True Color...............................................................................................................38 Chapter 4: Results and Discussion.............................................................................................39 4.1 Introduction.........................................................................................................................39 4.2 Initial Operations Period Results ...........................................................................................39
4.2.1 Characterization of Influent Water.................................................................................39 4.2.2 Ozonated Effluent Water..............................................................................................40 4.2.3 Flow Rate....................................................................................................................40 4.2.4 Hydraulic Retention Time .............................................................................................40
4.3 Verification Testing Results and Discussions..........................................................................42 4.3.1 Task 1 - Verification Testing Runs and Routine Equipment Operation............................42 4.3.2 Task 2 - Influent and Effluent Water Quality Characterization........................................42 4.3.3 Task 3 - Documentation Of Operating Conditions and Treatment Equipment
Performance.................................................................................................................44 4.3.4 Task 4: Documentation of Equipment Performance: Calculation of CT and Inactivation
of Cryptosporidium parvum .......................................................................................46 4.3.4.1 Influent Water Characteristics...................................................................................46 4.3.4.2 Operational and Analytical Data Tables ....................................................................46 4.3.4.3 Discussion of Results................................................................................................48
4.4 Equipment Characteristics Results.........................................................................................49 4.4.1 Qualitative Factors .......................................................................................................49
4.4.1.1 Susceptibility to Changes in Environmental Conditions...............................................49 4.4.1.2 Operational Reliability..............................................................................................50 4.4.1.3 Evaluation of O&M Manual.....................................................................................51 4.4.1.4 Equipment Safety.....................................................................................................51
4.4.1.4.1 Electrical..........................................................................................................51 4.4.1.4.2 Ozone Gas.......................................................................................................51 4.4.1.4.3 Pressurized Water Lines...................................................................................51 4.4.1.4.4 Pressurized Contact Tank.................................................................................51
4.4.2 Quantative Factors.......................................................................................................51 4.5 QA/QC Results ...................................................................................................................52
4.5.1 Data Correctness .........................................................................................................52 4.5.1.1 Representativeness...................................................................................................52 4.5.1.2 Statistical Uncertainty...............................................................................................52 4.5.1.3 Accuracy.................................................................................................................52 4.5.1.4 Precision..................................................................................................................53
4.5.2 Daily QA/QC Results...................................................................................................53 4.5.3 One-Time QA/QC Verification Results.........................................................................53 4.5.4 Results Of QA/QC Verifications At The Start Of Testing Period...................................54 4.5.5 Analytical Laboratory QA/QC .....................................................................................57

vii
Table of Contents, continued
Section Page Chapter 5: References.................................................................................................................59 Tables Table 1-1. Influent Water Quality (December 5 – December 14, 1999) .............................................7 Table 3-1. Analytical Data Collection Schedule ...............................................................................22 Table 3-2. Operational Data............................................................................................................23 Table 3-3. Cryptosporidium parvum Challenge Seeding Schedule Design......................................26 Table 3-4. CT Values For Inactivation Of Giardia Cysts By Ozone At Ph 6 To 9 ...........................29 Table 3-5. CT Values For Inactivation Of Viruses By Ozone ...........................................................29 Table 4-1. Influent Water Sample Characteristics (December 5 - December 14, 1999) ....................43 Table 4-2. Effluent Water Sample Characteristics (December 5 – December 14, 1999)) ..................43 Table 4-3. On-Site Water Quality Characteristics (December 5 – December 14, 1999) ...................44 Table 4-4. Operating Parameters (December 5 – December 14, 1999)............................................45 Table 4-5. Influent Water Characteristics During Challenge Testing .................................................46 Table 4-6. Operating Conditions During Each Challenge ..................................................................47 Table 4-7. Calculation of CT & Log10 Results for Inactivation of C. parvum....................................47 Table 4-8. Summary of Inactivation Ratios of Oocysts (University of Alberta) ..................................48 Table 4-9. Indigo/Spectrophotometer versus Orbisphere Readings...................................................55 Table 4-10. Summary Table of the Wet Tests (36-44) with Osmonics Model 150 PS......................57 Figures Page Figure 2-1. Illustration of the Osmonics Model PS 150 Unit .............................................................11 Figure 4-1. Dimensionless Curve from Tracer Test #5.....................................................................41 Figure 4-2. Comparative CT vs. Inactivation Values ........................................................................49 Photographs Page Photograph 1. Front view of Osmonics Model PS 150 Ozone System on location at the University of
Minnesota St. Anthony Falls Hydraulic Laboratory. ........................................................14 Photograph 2. Back view of Osmonics Model PS 150 Ozone System on location at the University of
Minnesota St. Anthony Falls Hydraulic Laboratory. ........................................................14 Appendices A. Manufacturer’s Operation and Maintenance Manual B. Data Spreadsheets C. Laboratory Chain of Custody Forms D. Data Log Book E. Laboratory Reports, Challenge Testing Reports and Bench Sheets F. Pilot Plant Photos G. Tracer Study Data H. Testing & Calibration I. QA/QC Documentation
viii
Abbreviations and Acronyms AOC Assimilable Organic Carbon APHA American Public Health Association ASTM American Society for Testing and Materials AWWA American Water Works Association AWWARF American Water Works Association Research Foundation ºC Degrees Celsius Co Concentration at time zero C Concentration at time zero plus retention time cfh Cubic feet per hour cfm Cubic feet per minute COA Cartwright, Olsen and Associates, LLC CT Concentration-Time, mg/L x minutes DBP Disinfection by-product DOC Dissolved organic carbon DWTS Drinking Water Treatment Systems EPA U.S. Environmental Protection Agency ESWTR Enhanced Surface Water Treatment Rule ETV Environmental Technology Verification ºF Degrees Fahrenheit FITC Fluorescein Isothiocyanate FOD Field Operations Document FTO Field Testing Organization g Unit of force equal to the gravity exerted on a body at rest. gallons Gallons are expressed as US gallons, 1 gal = 3.785 liters gpm Gallons per minute HAA Haloacetic acid (disinfection by-product) hp Horsepower ICR Information Collection Rule Log Logarithm to the base 10 Ln Logarithm to the base e (natural/Naperian) µm Micron mgd Million gallons per day mg/L Milligram per liter MPA Microbial Particulate Analysis MWW Minneapolis Water Works NIST National Institute of Standards and Technology NSF NSF International, formerly known as National Sanitation Foundation (oo)cyst A term used conventionally to refer to either or both cysts and oocysts O&M Operations and Maintenance OSHA Occupational, Safety and Health Administration PBS Phosphate Buffered Saline PFW Particle Free Water ppm parts per million, equivalent to mg/L

ix
PQL Practical Quantification Limit psi Pounds per square inch psig Pounds per square inch gauge PVC Polyvinyl chloride QA/QC Quality Assurance/Quality Control RPZ Reduced Pressure Zone SAFHL St. Anthony Falls Hydraulic Laboratory, University of Minnesota SCFM Standard Cubic Feet per Minute SM Standard Methods for the Examination of Water and Wastewater SWTR Surface Water Treatment Rule TCU Total Color Unit THM (trihalomethanes) A group of organic chemicals which are formed in
water when chlorine being used as a disinfectant reacts with natural organic matter such as humic acids from decayed vegetation. Humic acids are present in all natural water used as sources of drinking water supplies. Chloroform is one of the most common THMs formed in this type of reaction. One of a number of disinfection by-products.
TOC Total Organic Carbon TSS Total Suspended Solids Ten State's Standards Great Lakes-Upper Mississippi River Board of State Public Health and
Environmental Managers, Recommended Standards for Water Works WEF Water Environment Federation

x
Acknowledgments The Field Testing Organization, Cartwright, Olsen & Associates (COA), was responsible for all elements in the testing sequence, including collection of samples, calibration and verification of instruments, data collection and analysis, data management, data interpretation and the preparation of this report.
Cartwright, Olsen & Associates, LLC 19406 East Bethel Blvd. Cedar, Minnesota 55011 Phone: (763) 434-1300 Fax: (763) 434-8450 Contact Person: Philip C. Olsen E-mail: [email protected]
The laboratories selected for microbiological analysis of this validation are: Challenge seeding and elution of filter cartridges for concentration of Cryptosporidium parvum (C. parvum) oocysts:
Debra Huffman Env. Consulting 6762 Millstone Dr. New Port Richey, Fl. 34655 Phone: (727) 553-3946 Fax: (727) 893-1189 Contact: Debra Huffman, Ph.D. E-mail: [email protected]
Animal infectivity studies were performed by: Midodrag Belosevic, Ph.D. University of Alberta
Biosciences Animal Service CW-401 Biological Sciences Building Edmonton, Alberta T6G 2E9 Phone: (780) 492-1266
Fax: (780) 492-9234 E-mail: [email protected]
The laboratory that conducted the analytical work for this study was:
Spectrum Labs Inc. 301 West County Road E2 St. Paul, MN 55112 Phone: (651) 633-0101

xi
Fax: (651) 633-1402 Contact Person: Gerard Herro, Laboratory Manager E-mail: gherro@spectrum-labs.
The Manufacturer of the Equipment was: Osmonics, Inc. 5951 Clearwater Drive Minnetonka, MN 55343
Phone: (612) 933-2277 Fax: (612) 933-0141 Contact: Gary Davis, Technology Development Engineer
COA wishes to thank NSF International, especially Mr. Bruce Bartley, Project Manger, and Carol Becker and Kristie Wilhelm, Environmental Engineers for providing guidance and program management. Gary Davis, Technology Development Engineer, Rudolf Owens, Applications Engineer, and Dale Mork, Sales Engineer. Osmonics Incorporated are to be commended for providing the treatment system and the excellent technical and product expertise. The University of Minnesota St. Anthony Falls Hydraulic Laboratory staffs including Scott Morgan, M.S., P.E. Research Fellow, Jeff Marr, Research Fellow, Julie A. Tank, Jr. Engineer, and Jason McDonald, Jr. Engineer, are to be recognized for their assistance during the pilot setup, and tear down as well as assistance during the pilot operation. Gordon Finch Ph.D. (deceased), Norman Newman Ph.D. and Midodrag Belosevic Ph.D. of the University of Alberta are commended for their dedication to outstanding QA/QC and documentation in performing the animal infectivity work and analyses required in this study. Finally, COA wishes to thank the Minnesota Department of Health, Drinking Water Protection for their invaluable analytical and operational assistance, especially Gerald Smith, P.E., Public Health Engineer, and Anita C. Anderson, Public Health Engineer.

1
Chapter 1 Introduction
1.1 ETV Purpose and Program Operation The U.S. Environmental Protection Agency (EPA) has created the Environmental Technology Verification (ETV) Program to facilitate the deployment of innovative or improved environmental technologies through performance verification and dissemination of information. The goal of the ETV program is to further environmental protection by substantially accelerating the acceptance and use of improved and more cost-effective technologies. ETV seeks to achieve this goal by providing high quality, peer reviewed data on technology performance to those involved in the design, distribution, permitting, purchase, and use of environmental technologies. ETV works in partnership with recognized standards and testing organizations; stakeholders groups which consist of buyers, vendor organizations, and permitters; and with the full participation of individual technology developers. The program evaluates the performance of innovative technologies by developing test plans that are responsive to the needs of stakeholders, conducting field or laboratory (as appropriate) testing, collecting and analyzing data, and preparing peer reviewed reports. All evaluations are conducted in accordance with rigorous quality assurance protocols to ensure that data of known and adequate quality are generated and that the results are defensible. NSF International (NSF) in cooperation with the EPA operates the Drinking Water Treatment Systems (DWTS) program, one of 12 technology areas under ETV. The DWTS program evaluated the performance Osmonics, Inc. Model PS 150 Ozone Disinfection System (Model PS 150), which is an ozone disinfection system intended to offer small water utilities the benefits of using ozone as a disinfectant and the convenience of a pre-engineered, packaged system. The Model PS 150 ozone disinfection system was evaluated during field testing for its capability of inactivating Cryptosporidium parvum (C. parvum) and production of ozone and contact time (CT) within defined feed water quality specifications at a flow rate of 150 gpm. This was the benchmark against which the system was tested and served as the ETV performance claim for verification testing. 1.2 Testing Participants and Responsibilities The ETV testing of the Osmonics, Inc. Model PS 150 Ozone Disinfection System was a cooperative effort between the following participants: NSF International Cartwright, Olsen & Associates, LLC Osmonics, Incorporated University of Alberta
Debra Huffman Env. Consulting Spectrum Laboratories, Inc. University of Minnesota St. Anthony Falls Hydraulic Laboratory U.S. Environmental Protection Agency

2
The following is a brief description of each ETV participant and their roles and responsibilities. 1.2.1 NSF International NSF is a not-for-profit standards and certification organization dedicated to public health safety and the protection of the environment. Founded in 1946 and located in Ann Arbor, Michigan, NSF has been instrumental in the development of consensus standards for the protection of public health and the environment. NSF also provides testing and certification services to ensure that products bearing the NSF Name, Logo and/or Mark meet those standards. The EPA partnered with the NSF to verify the performance of drinking water treatment systems through the EPA’s ETV Program. NSF provided technical oversight of the verification testing. An audit of the field analytical and data gathering and recording procedures as well as an audit of the microbiological seeding procedures was conducted by NSF. NSF also reviewed the Field Operations Document (FOD) to assure its conformance with ETV generic protocol and test plan. NSF also conducted a review of this report and coordinated the EPA and technical reviews of this report. Contact Information: NSF International 789 N. Dixboro Rd. Ann Arbor, MI 48105 Phone: (734) 769-8010 Fax: (734) 769-0109 Contact: Bruce Bartley, Project Manager E-mail: [email protected] 1.2.2 Field Testing Organization Cartwright, Olsen & Associates (COA), a Limited Liability Company, conducted the verification testing of Osmonics, Inc. Model PS 150 Ozone Disinfection System. COA is a NSF-qualified Field Testing Organization (FTO) for the DWTS ETV pilot project. The FTO was responsible for conducting the verification testing for the equipment that was run continuously and monitored 24 hours a day until a minimum of 200 hours of continuous ozone production was observed. The FTO provided all needed logistical support, established a communications network, and scheduled and coordinated activities of all participants. The FTO was responsible for ensuring that the testing location and feed water conditions were such that the verification testing could meet its stated objectives. The FTO prepared the FOD, oversaw the pilot testing, managed, evaluated, interpreted and reported on the data generated by the testing, as well as serving as the principal author of this report. FTO associates conducted the onsite analyses and data recording during the testing. The FTO's Project Manager provided oversight of the daily tests. Contact Information: Cartwright, Olsen & Associates, LLC

3
19406 East Bethel Blvd. Cedar, MN 55011 Phone: (763) 434-1300 Fax: (763) 434-8450 Contact: Philip C. Olsen, Project Manager E-mail: [email protected] 1.2.3 Manufacturer The treatment system is manufactured by Osmonics, Inc. Osmonics is a manufacturer and worldwide marketer of high-technology water purification and fluid filtration, fluid separation and fluid handling equipment, as well as the replaceable components used in purification, filtration, and separation equipment. Osmonics is one of the world’s largest integrated manufacturers of water treatment equipment and components for the industrial, commercial and institutional markets. Osmonics, in cooperation with COA, was responsible for the installation, operation and maintenance of the equipment under test. COA, as the FTO, supervised any and all repair and maintenance procedures. Osmonics was responsible for providing logistical and technical support as needed as well as providing technical assistance to the FTO during operation and monitoring of the equipment undergoing field verification testing. Contact Information: Osmonics, Inc. 5951 Clearwater Drive Minnetonka, MN 55343
Phone: (952) 933-2277 Fax: (952) 933-0141 Contact: Gary Davis, Technology Development Engineer e-mail: [email protected]
1.2.4 Analytical Laboratories Challenge seeding and elution of filter cartridges for concentration of Cryptosporidium parvum (C. parvum) oocysts were conducted by Debra Huffman, Ph.D. Contact Information: Debra Huffman Env. Consulting 6762 Millstone Drive New Port Richey, Fl 34655
Phone: (727) 553-3946 Fax: (727) 893-1189 Contact: Debra Huffman, Ph.D. E-mail: [email protected]
4
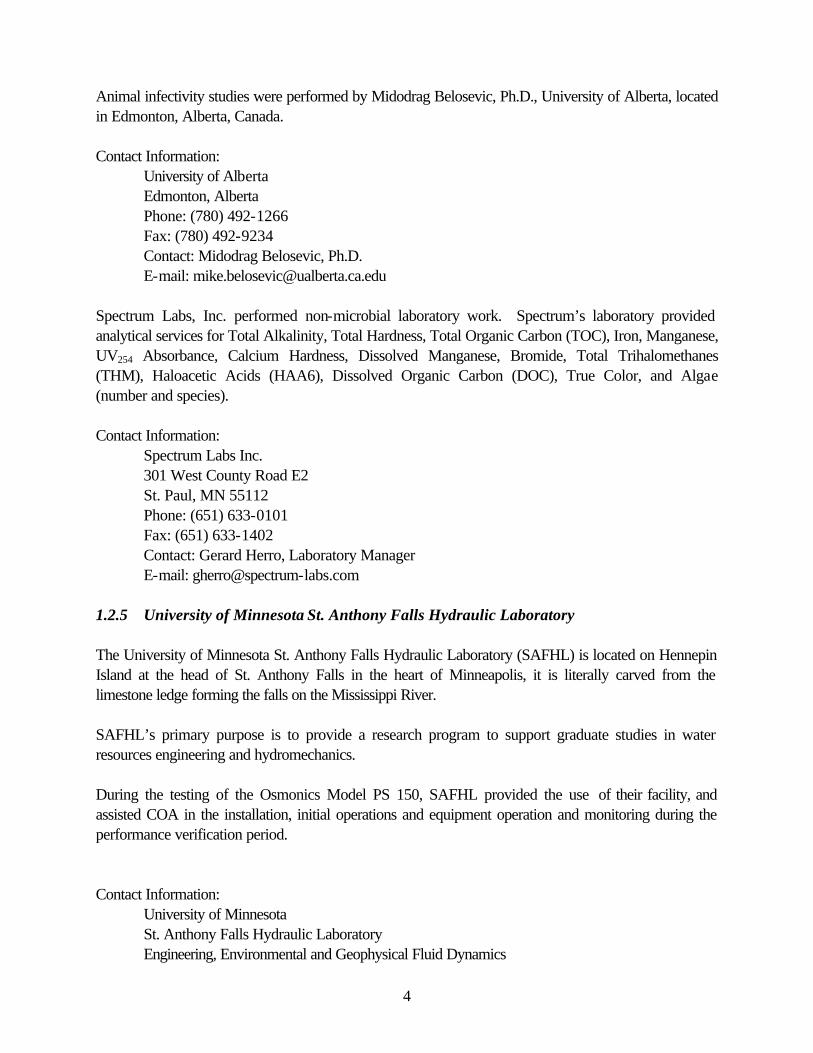
Animal infectivity studies were performed by Midodrag Belosevic, Ph.D., University of Alberta, located in Edmonton, Alberta, Canada. Contact Information: University of Alberta Edmonton, Alberta Phone: (780) 492-1266
Fax: (780) 492-9234 Contact: Midodrag Belosevic, Ph.D. E-mail: [email protected]
Spectrum Labs, Inc. performed non-microbial laboratory work. Spectrum’s laboratory provided analytical services for Total Alkalinity, Total Hardness, Total Organic Carbon (TOC), Iron, Manganese, UV254 Absorbance, Calcium Hardness, Dissolved Manganese, Bromide, Total Trihalomethanes (THM), Haloacetic Acids (HAA6), Dissolved Organic Carbon (DOC), True Color, and Algae (number and species). Contact Information:
Spectrum Labs Inc. 301 West County Road E2 St. Paul, MN 55112 Phone: (651) 633-0101 Fax: (651) 633-1402 Contact: Gerard Herro, Laboratory Manager E-mail: [email protected]
1.2.5 University of Minnesota St. Anthony Falls Hydraulic Laboratory The University of Minnesota St. Anthony Falls Hydraulic Laboratory (SAFHL) is located on Hennepin Island at the head of St. Anthony Falls in the heart of Minneapolis, it is literally carved from the limestone ledge forming the falls on the Mississippi River. SAFHL’s primary purpose is to provide a research program to support graduate studies in water resources engineering and hydromechanics. During the testing of the Osmonics Model PS 150, SAFHL provided the use of their facility, and assisted COA in the installation, initial operations and equipment operation and monitoring during the performance verification period. Contact Information: University of Minnesota St. Anthony Falls Hydraulic Laboratory
Engineering, Environmental and Geophysical Fluid Dynamics

5
Department of Civil and Mineral Engineering Mississippi River at Third Avenue S.E. Minneapolis, Minnesota 55414-2196 Phone (612) 627-4010 Fax: (612) 627-4609 Contact: Scott Morgan, M.S., P.E. Research Fellow E-mail: [email protected]
1.2.6 U.S. Environmental Protection Agency The EPA through its Office of Research and Development has financially supported and collaborated with NSF under Cooperative Agreement No. CR 824815. This verification effort was supported by Package Drinking Water Treatment Systems Pilot operating under the ETV Program. This document has been reviewed for technical and quality content the EPA. 1.3 Verification Testing Site In December of 1999, the ability of the Osmonics, Inc. Model PS 150 Ozone Disinfection System was challenged with live C. parvum oocysts and seeded into finished water from the Minneapolis Public Water Distribution System at the University of Minnesota St. Anthony Falls Hydraulic Laboratory. 1.3.1 Source Water The SAFHL has direct access to untreated and treated Mississippi River water. River water treated by the Minneapolis Water Works (MWW) treatment plant and supplied to the Hydraulic Laboratory through the Minneapolis potable water distribution system was used during initial operations and verification testing. The Mississippi River, at SAFHL's location, is considered part of the Upper Mississippi River Basin area. The U.S. Geological Survey (USGS), U.S. Department of Interior, National Water-Quality Assessment (NAWQA) program provides the following description of this area: Geology, geomorphology, climate, hydrology and land covering this area control the occurrence and flow of water, and the distribution of water-quality constituents. Landforms within this Upper Mississippi River Basin are primarily results of Pleistocene glaciation. Soils developed on glacial deposits range from heavy, poorly-drained clay soils developed on ground moraine to light, well-drained sands on outwash plains. Agriculture is the dominant land use in the southern and western parts of the study area: forests cover much of the northern and eastern parts of the basin area, and the Twin Cities (location of the MWW) dominates the east-central part of the basin area. The Upper Mississippi River’s Basin is underlain by glacial sediments and by a thick sequence of limestone, shale, shaley sandstone and sandstone of Precambrian and Paleozoic age. The climate of the Minneapolis, Minnesota area is sub-humid continental. The average monthly temperature ranges from -12 ° (°C, or 11 degrees Fahrenheit (ºF)) in January to 23°C (74 ºF) in July.

6
Average precipitation at the MWW is 30 inches. About three-quarters of the annual precipitation falls from April to September. Mississippi River water is treated at the Minneapolis Water Works. The treatment plant is the largest water utility in the upper Midwest, producing an average of 70 million gallons per day (mgd). Peak rate during the summer may be as high as 180 mgd. At the MWW, water is withdrawn from the river and piped to the pumping station. From the pumping station, the water is delivered to a softening plant. At the softening plant, lime is used for softening, and alum is used for removal of color and turbidity. Dilute lime and alum slurry precipitates and settles out during the softening process. Powdered activated carbon is added to remove taste and order. The water is then treated with carbon dioxide to lower the pH and stabilize the remaining hardness prior to being pumped to one of two filtration plants. At the filtration plant, chloramine (chlorine and ammonia) is added for initial disinfection, fluoride is added for tooth decay prevention and ferric chlorine is added as a coagulant to remove remaining color and turbidity. The water then enters a series of coagulation/sedimentation basins after which the water is filtered with single, dual or mixed media filters. Blended poly/ortho phosphate is later added as a corrosion control/inhibitor. The water is post chlorinated for final adjustment of the disinfectant residual before being fed into the reservoirs and pumped into the distribution system. The quality of the water is assured and controlled through the various stages of treatment by plant and laboratory tests. An average of 500 chemical, physical and bacteriological examinations are done each and every day (182,500 tests per year). Because chlorinated drinking water was used during the ETV test period, activated carbon was used to remove chlorine. In the eventuality that carbon fines would be introduced into the test system, 5 micron (µm) filters were installed to reduce their potential impact on the study. Finished feed water provided to the Model PS 150 exhibited the following characteristics during the verification testing: feed water turbidity in the range of 0.1 to 0.3 Nephlometric Turbidity Units (NTU), temperature range of 4.7°C to 6.5°C. pH was within the range of 7.4 to 8.1 with an average of 7.7. Color ranged from less than the Practical Quantification Limit (PQL) of 1 Total Color Unit (TCU) to 4 TCU. The total alkalinity as CaCO3 ranged from 31 to 39 Milligrams per liter (mg/L) with an average of 35 mg/L. Bromide was not detected or was below the PQL of 1.0 mg/L. Bromate was not detected or was below the PQL of 2.01 mg/L. Calcium averaged 20 mg/L, with a minimum of 18 mg/L and a maximum of 20 mg/L. Total hardness, as CaCO3 was 52 mg/L to 71 mg/L with an average of 64 mg/L. Sulfide was not detected or was below the PQL of 0.1 mg/L. TOC ranged from 3.4 to 4.4, with an average of 3.6 mg/L. Iron was not detected or was below the PQL of 0.1 mg/L. Manganese was not detected or below the PQL of 0.01 mg/L throughout the testing period. UV254 absorbance was in the range of 0.026 to 0.043. A summary of the influent water quality information is presented in Table 1-1 below.

7
Table 1-1. Influent Water Quality (December 5 – December 14, 1999)
Parameter # of
samples Average Minimum Maximum
Standard Deviation
95% Confidence
Interval PQL
Turbidity (NTU) 25 0.14 0.08 0.31 0.06 0.12, 0.17 - Temperature (ºC) 27 5.5 4.7 6.5 0.51 5.3, 5.7 - pH 27 7.69 7.38 8.1 0.18 7.62, 7.76 - Color (unit) 27 0.9 <1 4 1 0, 1 1 TCU Alkalinity (mg/L) 9 35 31 39 2.6 33, 36 10 mg/L Bromide (mg/L) 6 <1.0 <1.0 <1.0 NA NA 1.0 mg/L Bromate (mg/L) 6 <2.0 <2.0 <2.0 NA NA 2.0 mg/L Calcium (mg/L) 6 20 18 20 NA NA 1 mg/L Total Hardness (mg/L)
6 64 52 71 NA NA 10 mg/L
Sulfide (mg/L) 9 <0.1 <0.1 <0.1 NA NA 0.1 mg/L TOC (mg/L) 9 3.6 3.4 4.4 0.3 3.4, 3.8 0.05 mg/L Dissolved Organic Carbon (mg/L)
9 3.4 3.1 3.7 0.2 3.2, 3.5 0.05 mg/L
Iron (mg/L) 6 <0.1 <0.1 <0.1 NA NA 0.1 mg/L Dissolved Manganese (mg/L)
6 <0.01 <0.01 <0.01 NA NA 0.01 mg/L
Total Manganese (mg/L)
6 <0.01 <0.01 <0.01 NA NA 0.01 mg/L
UV254 Absorbance (cm-l)
9 0.036 0.026 0.043 0.007 0.032, 0.041
-
NA = Not Applicable because standard deviation = 0, or due to a small number of samples (less than 8). *All calculations involving results with below PQL values were performed using the PQL. 1.3.2 Pilot Effluent Discharge The effluent of the pilot treatment unit was discharged to Minneapolis Metropolitan sanitary sewer. The Metropolitan Environmental Authority, which encompasses the Minneapolis Metro Area, maintains a primary sewage treatment plant that discharges to the Mississippi River downstream of the Hydraulic Laboratory. No discharge permits were required.
8
Chapter 2 Equipment Description and Operating Processes
2.1 Historical Background Of Ozone Conventional methods of water treatment, including gravity filtration and chlorination, have not been as effective against protozoan (oo)cysts, especially C. parvum, in part, because of their size and resistance to chemicals. Treatment plants that are otherwise in compliance with public health treatment standards are thus vulnerable to outbreaks of disease (Kiminski 1994, LeChevallier 1991, Korich 1990). In recent years, protozoan parasites have been determined to be the cause of widespread gastrointestinal illness due to the consumption of contaminated drinking water. These organisms are more resistant to traditional disinfection practices, and because of their small size and pliability, can often pass through granulated bed filters. Two such microorganisms are the protozoan (oo)cysts Giardia lamblia and Cryptosporidium parvum. These pathogenic microorganisms can cause significant gastrointestinal distress, and even fatalities in the cases of immunocompromised individuals and are thus of considerable interest to the water treatment community. Assurances will be required before small public water systems throughout the country dependent on surface water sources that are potentially contaminated with these organisms can be confident in employing ozone disinfection as a part of their treatment regimen. (Kiminski 1994, LeChevallier 1991, Korich 1990). Ozone is a compound in which three atoms of oxygen are combined to form the molecule O3. It is a strong, naturally occurring oxidizing and disinfecting agent. Elemental oxygen naturally exists as two atoms of oxygen that are combined for the O2 molecule. Ozone (O3) is an unstable allotropic form of gaseous oxygen that occurs naturally when the energy imparted by ultraviolet rays from the sun strike oxygen (O2) molecules in the upper atmosphere. Energy from ultraviolet rays disrupt or break the O2 bonds, thereby forming single oxygen atoms (O1). Some of these O1 atoms recombine with other O2 molecules to form ozone (O3). This action creates the protective ozone layer around the earth shielding us from harmful UV radiation (Water Quality Association (WQA) 1997). Energy released by lightning also produces ozone naturally. Ozone’s scent is easily noticed after a thunderstorm. Ozone also is created inadvertently by some electrical equipment, photocopying machines, and photochemical smog reactions. Inhalation of air containing over one-tenth part per million (ppm) by volume of ozone may cause headaches and irritation of the eyes, upper respiratory system and lungs. The unstable ozone (O3) compound is also generated by the exposure of oxygen molecules (O2) to ultraviolet radiation or a high-energy electrical discharge in manufactured mechanical ozone generators. The weak bond holding ozone’s third oxygen atom is what causes the molecule to be unstable. Because of this instability, an oxidation reaction occurs upon any collision between an ozone molecule and a molecule of an oxidizable substance such as certain forms of inorganic materials like iron and

9
manganese or many organic materials, including plastics and rubbers and microorganisms (viruses, and parasitic cysts) (Water Quality Association 1997). In an oxidation reaction, energy usually is transferred from the ozone molecule leaving a stable oxygen molecule (O2) and a highly unstable oxygen atom (O1). The molecule being oxidized then bonds with the loose O1 atom creating an oxidized product or derivative of the substance. When dissolved metals oxidize in water, they often hydrolyze and become insoluble. The structure of an organic molecule is changed by oxidation that often causes the whole molecule to come apart (with some help from other ozone reactions). Bacterial cells and viruses are literally split apart (lysed) or are inactivated through destruction of their DNA and RNA chains by ozone in water and wastewater treatment applications. The use of ozone in municipal water systems is well documented. Initially used as a disinfectant by the city of Nice, France, in 1906, ozone is now used extensively in European counties. In the 1940s, ozone was first used in the United States to oxidize and disinfect municipal drinking water in Whiting, Indiana. Treatment, especially by disinfection, of municipal water with ozone gained further recognition in the United States in the 1950s and is now gaining wider acceptance. Recently, the cities of Los Angles, California; Dallas, Texas; and Las Vegas, Nevada have built the largest ozone plants in the world for purification of these cities’ drinking water supplies. Ozone is the most powerful oxidizer that can be safely used in water treatment (WQA 1997). In addition to its use for treating drinking water, ozone is frequently used to treat wastewater and as a disinfectant and oxidant for bottled water, ultrapure waters, swimming pools, spas, breweries, aquariums, soft drinks, cooling towers, and many other applications. This ETV performance verification report will discuses how the use of ozonation technology is appropriate and effective for small surface water treatment system applications, which include community and non-community public water systems as well as small commercial, industrial, and other private water supply installations. The advantages of ozone disinfection of surface water in drinking water treatment applications are primarily related to its ability to inactivate microorganisms with relatively low CT values.
• Disinfection - Bacterial disinfection, viral and cyst inactivation, biofouling control; • Oxidation of Inorganics - Iron, manganese, organically-bound heavy metals, cyanides, sulfides,
nitrates, arsenic; • Oxidation of Organics - color, tastes & odors, detergents (some), pesticides (some), phenols,
algae control, turbidity controls, microflocculation (of soluble organics) pretreatment of organics for biological oxidation, THMs, precursor control.
The disadvantages inherent in the ozone technology include:
• Ozone is an unstable oxidizing gas with limited half-life: - in very clean water, on the order of only a few hours; - in polluted surface waters, on the order of only a few seconds to minutes,
depending on the degree of pollution;
10
• Because ozone gas is very unstable and decomposes to oxygen, it must be generated and used on site.
With increased awareness of pathogens resistant to traditional disinfection techniques, and with implementation of the Enhanced Surface Water Treatment Rule (ESWTR) and the Groundwater Rule in the near future, it is expected that the search for alternative disinfection technologies will grow significantly. This verification study specifically addresses C. parvum and production of CT values associated with inactivation of G. lamblia and virus. The purpose of the verification testing was to verify the performance claims of the manufacturer through a carefully designed study involving rigorous QA/QC controls. Osmonics anticipated that the Model PS 150 ozone disinfection system will provide a 3-log10 or greater inactivation of C. parvum, G. lamblia and virus within defined feed water quality specifications at a flow rate of 150 gpm. 2.2 Equipment Capabilities and Description The specific equipment tested was the Osmonics Model PS 150, an ozone disinfection system intended to offer small water utilities the convenience of a pre-engineered, packaged system. An illustration of the Osmonics Model PS 150 is shown in Figure 2-1. 2.2.1 Equipment Description All components of the system (with the exception of the contact tank) are assembled as a package in a skid and frame configuration. The system is equipped with a control panel and process logic controller, power supply, transformer, and fail-safe monitoring controls. The Model PS 150 includes a high efficiency ozone generator, a stainless steel side stream booster pump, a Venturi injector, a small stainless steel dissolution chamber, a cyclonic degas stripper, a stainless steel ozone contact tank, and an ozone off-gas destruct unit. Physical dimensions of skid/frame are 10’ wide × 5’ deep × 6’ high, and weighs 4,000 pounds. The contact tank measures 60” diameter × 144” height, and weighs 1,000 pounds. Total combined shipping weight is 5,000 pounds and is suitable for easy transportation. The Model PS 150 allows the operator to select the CT value applied to influent water via a control screen located on the front of the unit. The control screen is driven by a programmable logic controller (PLC), electronically connected to a water flow rate meter and on-line dissolved ozone sensors located at the inlet and outlet of the Model PS 150’s ozone contacting system. The controller achieves and maintains CT values desired by the operator by taking the average of the inlet and outlet dissolved ozone readings and multiplying this number by the systems’ hydraulic retention time (minutes) and value (T10/Ttheory). The Model PS 150 system provided for this ETV study had been programmed with a total retention volume of 1,200 gallons and a hydraulic value (T10/TTheory) of 0.5. The PLC automatically increased power to the ozone gas generator if the PLC calculated CT value started to fall below the set point thus increasing ozone gas concentration produced. This increase

11
elevated the amount of ozone dissolved into solution, thus maintaining the CT value at its original set point. The reverse would occur if a CT value started to increase above the original set point.
Figure 2-1 Illustration of the Osmonics Model PS 150 Unit
12
The Model PS 150 is designed to be a final barrier for microbiological contaminants, including G. lamblia and C. parvum. Accordingly it is intended the Model PS 150 be installed to treat water that has been filtered to a level # 1 NTU turbidity. The following are component descriptions of the Osmonics Model PS 150 tested under this verification test: Ozone Generator The ozone generator is a model HC-2, high efficiency, cabinet style unit with a maximum rated output of 20 pounds/day at 6% weight concentration. It is a high frequency generator, operating at 7 kHz. The power supply is 230 VAC, 60 Hz, 3 phase, with 30 amps per phase circuit protection. Ozone is produced when oxygen gas enters the generator and passes through an electric field. This electric field excites the oxygen into ozone. This ozone and oxygen mixture then flows out of the generator to be mixed with the water at the injector. The ozone generator has a feed gas flow rate requirement of one standard cubic foot per minute (SCFM). The Model PS 150 equipment package did not include air preparation equipment such as an air dryer or oxygen concentrator. An oxygen concentrator was installed separately at the hydraulics laboratory to supply feed gas to the Model PS 150 during the performance verification period. As ozone production generates heat, cooling is required. The Model PS 150 system is cooled by the water that flows through it and requires approximately 3 gpm water flow at < 15°C. Booster Pump The skid has a booster pump, which takes a side stream of water from the main flow and boosts the pressure to force it through the venturi injector. The pump manufacturer is ALFA-LAVAL Model GHH-10 with a 3Hp 230V 2 phase motor. The booster pump and injector are designed to satisfy the specified process flowrate range from 100 gpm to 150 gpm. Injector To mix the ozone gas with the water, a Venturi injector (Mazzi Model Number 1584-Kynar) is used. The Venturi draws the ozone gas into the water stream under vacuum. The influent water pressure forces water through a narrowing orifice. As water velocity increases, a decrease in pressure is caused at the point the narrowing orifice abruptly becomes wider. This creates a partial vacuum. This area of the Venturi is connected the ozone gas supply which is drawn into the water stream. As the water/ozone gas mixture flows back to a larger diameter pipe, pressure increases, causing an implosion of ozone gas bubbles. This implosion forces the dissolution of ozone gas into the water. Dissolution Tank To facilitate ozone dissolution, the PS-150 incorporates a stainless steel tank located in the process stream immediately after the venturi. Degas Stripper To remove excess ozone gas the water flows through a cyclonic degas stripper. The water enters into this vessel tangentially at the top, flows downward in a spiral, and exits at the bottom. This process forces the water to the outside, and the gas to the inside, where it is collected and directed to a vent
13
valve (Armstrong) located on top of the tank. Once a sufficient volume of gas has accumulated, the vent valve directs this off-gas to an ozone gas destruct unit. Ozone Destruct Unit An ozone off-gas destruct unit eliminates any residual ozone before it is vented to the atmosphere. The model number of the off-gas destruct was CDM-10. It is a 115 VAC/1 phase/60 Hz unit, loaded with a catalyst media, capable of destroying ozone gas at a rate of 10 cubic feet per minute (cfm). The destruct unit is mounted on the skid, and piped to the off-gas vent of the degas stripper. The gas flow is through the top and down over the catalyst media. A small coil heater is located within the catalyst to speed ozone destruction and prevent condensation of moisture. Ozone Contact Tank The ozone contact tank is a 5’ 6” diameter × approximately 9’ 3”-high vessel constructed of 316 stainless steel. The total volume is 1,558.2 gallons. Tank inlet and outlet pipes are 6”-diameter and 4”-diameter respectively. A perforated (.37” holes, 5” on center) stainless steel diffuser plate is located 8” above the bottom sidewall weld. Maximum pressure rating is 25 pounds per square inch gauge (psig). The contact tank’s purpose is to provide enough residence time with dissolved ozone gas for inactivation of microorganisms and protozoan (oo)cysts such as G. lamblia, C. parvum. Dissolved ozone gas sensors/monitors Dissolved ozone gas in-line sensors are located immediately after ozone injection/gas dissolution and the outlet of the contact tank. Sensors and monitors are manufactured by Orbisphere. Model numbers are 313 (sensor) and 26506 (monitor). Flowmeter The Model PS 150 was supplied with a Rosemount Series 8700 flow meter for measurement of process water flow through system. Programmable Logic Controller All process inputs/outputs required to support the functionality of the Model PS 150 were fed into an Allen-Bradley MicroLogixTM 1000 series analog programmable controller. The controller was coupled with Allen-Bradley Panel View 550 terminals for output/menu display and to provide for operator input. The following two photographs were taken of the equipment while it was on-site at the University of Minnesota Hydraulic Laboratory for the verification testing.

14
Photograph 1. Front view of Osmonics Model PS 150 Ozone System on location at the University
of Minnesota St. Anthony Falls Hydraulic Laboratory.
Photograph 2. Back view of Osmonics Model PS 150 Ozone System on location at the University of Minnesota St. Anthony Falls Hydraulic Laboratory.
2.2.2 Equipment Installation The Osmonics system was connected to the Minneapolis public drinking water distribution system within the Hydraulics Laboratory through a reduced pressure zone (RPZ) backflow prevention device that had been inspected by an inspector licensed by the Minnesota Department of Health for this task. A shut off valve and flow regulating valve were installed in the water supply line to control flow to the test equipment. Following the RPZ backflow prevention device, water was directed to a dechlorination system consisting of two parallel 36 × 72” granulated activated carbon columns and then on to four parallel 3M™ model 524 (five micron) bag filters in 3M™ housings for removal of carbon fines. This equipment was installed in the hydraulics lab specifically to perform this performance verification test and is not considered part of the Model PS 150 equipment package.

15
Located at several points along the supply line were sample ports to allow site testing and to verify feed water quality parameters. 2.2.3 Instrumentation And Control System The Model PS 150 included sensors/monitors for in-line measurement of water temperature, process flow rate, and dissolved ozone. The control system is designed to measure these operating parameters and automatically control the system output to maintain desired Concentration-Time (CT) values. To accomplish this, the following variables are taken into consideration: 1. The ozone contact tank volume (known) 2. The ozone generator output (known) 3. Mainline flowrate (measured constant) 4. Influent/Effluent dissolved ozone concentrations (measured) With the known and measured values of these variables, the Model PS 150 control system adjusts the ozone output to maintain a preset CT value entered by the equipment operator. 2.2.4 Chemical Consumption/Waste Consumables are limited to oxygen at a rate of 1 cfm. Waste is limited to ozone gas that is not transferred into solution. The waste is converted to oxygen through the destruct system described above. 2.2.5 Optimal Flow Range of Equipment The Model PS 150 is optimally rated at water treatment process flow rates of 100 gpm to 150 gpm with prefiltered influent. 2.3 Operator Licensing Requirements While limited operator experience is required, most states will require a licensed water treatment plant operator to operate and maintain the system on a regular (daily) schedule. Operator training for operation of small systems is limited and offered by the manufacturer on delivery of a system. The manufacturer requires no special license beyond that required by the state of local public health authorities. Operators of community water supplies have requirements that vary from state to state. In Minnesota, there are four levels of community water plant operator qualification: A, B, C and D, depending on the size of the community. At this time there is no requirement for licensing for operators of non-community, non-transient public supplies; however the state is considering enacting such a requirement. There is also no requirement for licensing for operators of transient, non-community public water supplies, and there is little likelihood of such a requirement due to the nature of the owner/operator status of most such facilities. Other states may have requirements beyond those noted here, although it is expected that designers of public health water treatment installations will be familiar with any requirements specific to their state or municipality. There may be possible Federal

16
requirements concurrent with the enactment of the Enhanced Surface Water Treatment Rule (ESWTR), but those are not yet in effect.

17
Chapter 3 Methods and Procedures
3.1 Experimental Design The experimental design of this verification study was developed to provide accurate information regarding the performance of the treatment system. The impact of the field operations as they relate to data validity was minimized, as much as possible, through the use of standard sampling and analytical methodology. Due to the unpredictability of environmental conditions and mechanical equipment performance, this document should not be viewed in the same light as scientific research conducted in a controlled laboratory setting. 3.1.1 Objectives The verification testing was undertaken to evaluate the performance of the Osmonics Model PS 150. Specifically evaluated were Osmonics’ stated equipment capabilities and equipment performance relative to water quality regulations. Also evaluated were the operational requirements and maintenance requirements of the system. The details of each of these evaluations are discussed below. 3.1.1.1 Evaluation of Stated Equipment Capabilities The Osmonics Model PS 150 Ozone Disinfection System treatment system was challenged with live C. parvum oocysts seeded into finished water from the Minneapolis Public Water Distribution System to determine level of inactivation caused by the Ozone disinfection system under test. The purpose of this ETV test was to verify the degree of C. parvum inactivation and production of CT values associated with inactivation of virus and G. lamblia by Osmonics’ Model PS 150 incorporating ozone technology. This ETV study was undertaken to demonstrate the Model PS 150 ozone disinfection system’s capability of inactivating C. parvum and production of CT values within defined feed water quality specifications at a flow rate of 150 gpm. 3.1.1.2 Evaluation of Equipment Performance Relative To Water Quality Regulations Water quality data against which the equipment was tested are included so that state regulators can make informed decisions concerning applications about the product to specific field applications. A surrogate for inactivation of virus and G. lamblia can be determined by verifying field-measured CT values that correspond to CT values for G. lamblia and virus log10 inactivation published by Malcolm Pirnie, Inc. and CWC-HDR, Inc. (1989). With increased awareness of pathogens resistant to traditional disinfection and removal techniques, and with implementation of the Enhanced Surface Water Treatment Rule (ESWTR) and the Groundwater Rule in the near future, it is expected that the search for alternative disinfection and removal technologies will grow significantly. The current ESWTR requires a 2-log10 removal of C. parvum.
18
3.1.1.3 Evaluation of Operational and Maintenance Requirements An overall evaluation of the operational requirements for the treatment system was undertaken as part of this verification. This evaluation was qualitative in nature. The manufacturer’s Operations and Maintenance (O&M) manual and experiences during the daily operation were used to develop a subjective judgment of the operational requirements of this system. The O&M manual is attached to this report as Appendix A. Verification testing also evaluated the maintenance requirements of the treatment system. Not all of the system’s maintenance requirements were necessary due to the short duration of the testing cycle. The O&M manual details various maintenance activities and their frequencies. This information, as well as experience with common pieces of equipment (i.e., pumps, valves, etc.), were used to evaluate the maintenance requirements of the treatment system. 3.1.1.4 Evaluation of Equipment Characteristics The qualitative, quantitative and cost factors of the tested equipment were identified, in so far as possible, during the verification testing. The relatively short duration of the testing cycle creates difficulty in reliability identifying some of the qualitative, quantitative and cost factors. The qualitative factors examined during the verification were operational aspects of the Model PS 150, for example, pressure loss, ozone gas leakage, materials compatibility, safety, as well as other factors that might impact performance. The quantitative factors examined during the verification testing process are costs associated with the system. The operating conditions were recorded to allow reasonable prediction of performance under other, similar conditions. Also to be noted and reported were any occasional, anomalous conditions that might require operator response such as variations in levels of dissolved ozone and or process flow rate. It is important to note that the figures discussed here are for the Osmonics Model PS 150. This treatment system was set to operate at 150 gpm with water temperatures ranging between 4.7 – 6.5°C. 3.2 Verification Testing Schedule The verification testing started on December 5, 1999, and continued for 216 hours of continuous operation and data recording. Daily testing concluded on December 14, 1999. Data was logged for a total of 216 hours of treatment system operation. C. parvum challenge testing was performed on December 5 through December 7, 1999. 3.3 Initial Operations An initial operations period was performed to allow the equipment manufacturer to refine the unit’s operating procedures and to make operational adjustments as needed to successfully treat the source water. Information gathered during system start-up and optimization was used to refine the FOD. Adjustments that were made to the FOD included:

19
• It was not necessary to sample for algal enumeration and speciation since finished municipal drinking water was used as the source for this verification test.
The major operating parameters examined during initial operations were characterization of influent water, flow rates, hydraulic retention time (via tracer tests) and ozone dosage. Performance characteristics of the selected source water were also reviewed during this period. 3.3.1 Characterization of Influent Water The objective of this Initial Operations task was to determine the suitability of the influent water to the application of the technology. The suitability of the influent water to the application of this technology was reviewed before testing. Mississippi River data from past years from local and regional sources was compiled and analyzed with respect to the biological, physical and chemical characteristics of the water. Parameters studied at the verification testing site include (but were not limited to) the following: Turbidity, Temperature and temperature variations within a season, pH, Total Alkalinity, Hardness, TOC, UV254 Absorbance, True Color, Total Coliform, Algae (number and species), Iron, Manganese, and Free Chlorine. Review of this data indicated that the technology should be suitable for this site. The parameters which were analyzed as part of this testing and the sampling frequency are presented in Table 3-1, Section 3.4.2. Intermittent factors that might influence water chemistry, such as weather, boat traffic, in and out-flows, and bottom composition were noted in the logbook where appropriate. The Mississippi River has, by the time it reaches this location, been exposed to municipal, industrial and agricultural use. The flow past this point varies with the season, however typically exceeds 3,000,000 gallons per minute, and has been augmented by other rivers, somewhat less stressed by industry. The effects of most upstream activity have been diluted accordingly. Finished Minneapolis drinking water was used as the source water for this test. Because water delivered throughout the Minneapolis drinking water distribution system contains a minimum of 0.5 mg/L free chlorine, it was necessary to remove it previous to entry into the ozone equipment under test. This was accomplished by running the source water through two parallel 36” diameter by 72” high pressurized tanks each holding 33 cubic feet of Calgon Carbon Centuar granulated activated carbon. A HACH 2120 spectrophotometer with HACH AccuVac reagent ampules was used to verify free chlorine reduction to less than 0.05 mg/L at a feed water flow rate of 150 gpm. Efforts were also extended to minimize contamination of the microbial capture filters with particles indigenous in the source water in addition to those introduced from the activated carbon. Accordingly, four 3M™ bag filter housings were installed in parallel with five-µm filter elements after the activated carbon columns. A test run was conducted with heat-inactivated oocysts with the system set at 150 gpm over 40 minutes to verify background particulates were not contaminating the microbial capture filters. Over this period, pressure differential across the capture filters increased by only two psi. This
20
suggests background particulate contamination was minimal. In addition, the oocysts were eluted from capture filters at a microbial laboratory, centrifuged and enumerated with a hemocytometer. While a significant amount of background particulates were detected as a result of this process, Dr. Huffman concluded the concentrations of particulates were low enough to proceed with the seeding challenges. 3.3.2 Ozonated Effluent Water Because microorganisms entrapped within the capture filters would be subjected to continued exposure to ozonated water throughout the microbial seeding study, residual ozone was removed from the ozone system’s effluent stream immediately after the CT tank. Sodium thiosulphate was injected with a metering pump into the effluent stream previous to a static mixer. Performance of this ozone reduction system was verified during initial operations with the use of a HACH 2120 spectrophotometer and US EPA-approved HACH AccuVac ozone residual reagents. 3.3.3 Flow Rate The manufacturer desired the equipment under test be provided a source water flow rate of 150 gpm. The University of Minnesota Hydraulics Laboratory is supplied with a 3” connection to the Minneapolis drinking water distribution system. With a minimum distribution system pressure of 60 psi it was calculated that 150 gpm would be available to the test equipment. The Hydraulics Laboratory personnel measured this flow rate during initial operation volumetrically against time. 3.3.4 Hydraulic Retention Time Hydraulic retention time of ozonated water was verified with the use of tracer studies. Salt brine was injected through a metering pump into the feed stream of the ozone system to provide an elevated marker TDS of approximately three times over the baseline level. TDS meters were used to measure for increases in TDS every 15 seconds from sample ports located at the point of ozone injection and immediately after the contact tank. From this data a T10 value was calculated in accordance with the Guidance Manual for the Surface Water Treatment Rule in order to establish the hydraulic retention value of the Model PS 150. 3.3.5 Ozone Dosage Ozone dosage was measured with the use of on-line Orbisphere dissolved ozone sensors installed on the inlet and outlet of the equipment package. The PS 150’s controller calculated the average dissolved ozone concentration (in mg/L) from these values. The controller multiplied this average by the systems hydraulic retention time (minutes) and adjusted ozone generator output to maintain a preset CT value. The CT value is used as an US EPA-accepted method of measurement of ozone dosage.
21
3.4 Verification Task Procedures The procedures for each task of verification testing were developed in accordance with the requirements of the EPA/NSF ETV Protocol for Inactivation of Microbiological Contaminants (EPA/NSF, 1999). The Verification Tasks were as follows:
• Task 1 - Verification Testing Runs and Routine Equipment Operation • Task 2 - Influent and Effluent Water Quality Characterization • Task 3 - Documentation of Operating Conditions and Treatment Equipment Performance • Task 4 - Documentation of Equipment Performance: Calculation of CT and Inactivation of C.
parvum A detailed description of each task is provided in the following sections. 3.4.1 Task 1 - Verification Testing Runs and Routine Equipment Operation The objectives of this task were to operate the equipment provided by Osmonics for 200 hours and assess its operational characteristics and ability to inactivate C. parvum. Task 1 verification testing consisted of continuous evaluation of the treatment system, using the most successful treatment parameters defined in Initial Operations. One verification test period was conducted. The schedule required the equipment to be run continuously for at least 200 hours of ozone production. Standard operating parameters for the Model PS 150 were established through the use of the manufacturer’s performance claims, O&M Manual, and results of initial operations. After establishment of these parameters, the unit was operated under those conditions. 3.4.2 Task 2 - Influent and Effluent Water Quality Characterization Characterization of the influent water quality of the system was an important consideration in the development of the experimental design of the ETV Test Plan. The water quality and microbial analyses were selected to demonstrate the effectiveness of the manufacturer’s equipment. The collection of water quality parameters was performed as in Table 3-1. Samples of both influent and effluent water were analyzed.

22
Table 3-1. Analytical Data Collection Schedule Parameter Frequency Influent Effluent
On-Site Analyses Temperature 3xdaily x x pH 3xdaily x Turbidity daily x x Dissolved Ozone Residual 3xdaily x Total Chlorine 3xdaily x Color daily x x
Laboratory Analyses Total Alkalinity daily x Total Hardness 1/50 hrs x Total Organic Carbon daily x Iron 1/50 hrs x UV Absorbance (254) daily x x Calcium Hardness 1/50 x Total Manganese 1/50 hrs x x Dissolved Manganese 1/50 hrs x x Bromide (mg/L) 1/50 hrs x x Bromate (mg/L) 1/50 hrs x TTHMs 1/50 hrs x HAA5 1/50 hrs x Dissolved Organic Carbon daily x Total Sulfides daily x Algae 1 per test period x
Notes: “3xdaily” means that the water quality parameters were measured 3 times per day of ozone production over the continuous 200 hours of Verification Testing. “1/50 hrs” refers to the water quality parameters were measured once per each 50 hours of ozone production.
All testing was performed in accordance with the procedures and protocols established as in Standard Methods for the Examination of Water and Wastewater 19th Edition (SM) or EPA-approved methods. All on-site testing instrumentation or procedures were calibrated and/or standardized by FTO staff. Evaluation of water quality in this task was related with respect to manufacturer’s claims of performance in addition to the SWTR. The Model PS 150 is designed to be a final barrier for microbiological contaminants, namely G. lamblia and C. parvum. Accordingly it is intended the Model PS 150 be installed to treat water that has been filtered to a level #1 NTU turbidity. Factors that could influence water chemistry, such as weather, recreational or commercial boat traffic, in and out-flows, and river bottom composition were recorded during testing where appropriate. Also included in Chapter 4, Results and Discussions is an assessment of human impact upon source water supply; for example, whether the source was used as a source for other activities, or whether it accepted wastewater of any description.
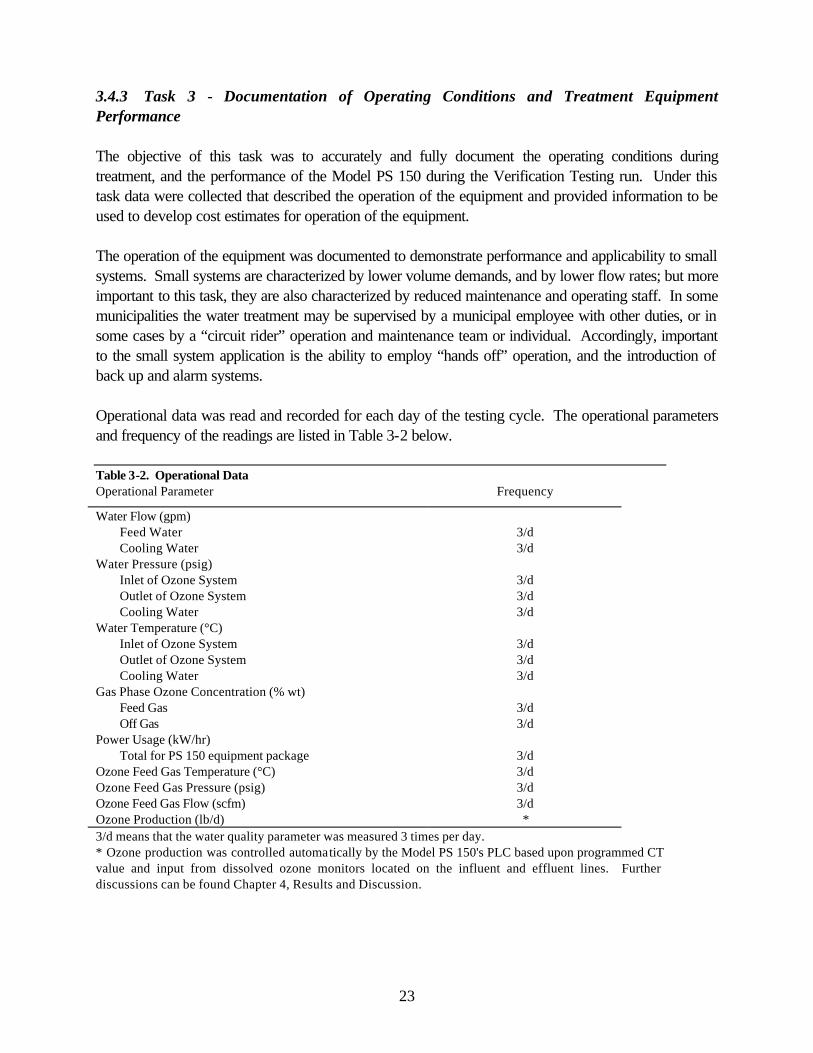
23
3.4.3 Task 3 - Documentation of Operating Conditions and Treatment Equipment Performance The objective of this task was to accurately and fully document the operating conditions during treatment, and the performance of the Model PS 150 during the Verification Testing run. Under this task data were collected that described the operation of the equipment and provided information to be used to develop cost estimates for operation of the equipment. The operation of the equipment was documented to demonstrate performance and applicability to small systems. Small systems are characterized by lower volume demands, and by lower flow rates; but more important to this task, they are also characterized by reduced maintenance and operating staff. In some municipalities the water treatment may be supervised by a municipal employee with other duties, or in some cases by a “circuit rider” operation and maintenance team or individual. Accordingly, important to the small system application is the ability to employ “hands off” operation, and the introduction of back up and alarm systems. Operational data was read and recorded for each day of the testing cycle. The operational parameters and frequency of the readings are listed in Table 3-2 below. Table 3-2. Operational Data Operational Parameter Frequency
Water Flow (gpm) Feed Water 3/d Cooling Water 3/d
Water Pressure (psig) Inlet of Ozone System 3/d Outlet of Ozone System 3/d Cooling Water 3/d
Water Temperature (°C) Inlet of Ozone System 3/d Outlet of Ozone System 3/d Cooling Water 3/d
Gas Phase Ozone Concentration (% wt) Feed Gas 3/d Off Gas 3/d
Power Usage (kW/hr) Total for PS 150 equipment package 3/d
Ozone Feed Gas Temperature (°C) 3/d Ozone Feed Gas Pressure (psig) 3/d Ozone Feed Gas Flow (scfm) 3/d Ozone Production (lb/d) * 3/d means that the water quality parameter was measured 3 times per day. * Ozone production was controlled automatically by the Model PS 150's PLC based upon programmed CT value and input from dissolved ozone monitors located on the influent and effluent lines. Further discussions can be found Chapter 4, Results and Discussion.
24
3.4.4 Task 4 - Documentation of Equipment Performance: Calculation of CT and Inactivation of C. parvum Inactivation of microorganisms is one of the primary purposes of ozone in drinking treatment. The ability of ozone equipment to inactivate microorganisms can be assessed by determining the CT capabilities of the equipment and/or by measuring the inactivation of microorganisms by conducting challenge testing. The ability of ozone to inactivate virus and G. lamblia is well documented in scientific literature (Finch et al. 1994) and the US EPA has adopted a CT approach for estimating inactivation by a disinfectant. The US EPA has not yet adopted CT valves for C. parvum, because researchers are just beginning to quantify the inactivation of C. parvum by ozone. The objective of this task was to determine the CT capabilities of the Model PS 150 and to determine the log10 inactivation of C. parvum achieved during these tests. The Model PS 150 was challenged with live C. parvum oocysts. The challenge consisted of the following steps: 1) The introduction of live C. parvum oocysts into the water stream and their passage
through the Model PS 150, 2) The recovery of the oocysts from the water stream, 3) The determination of level of oocyst infectivity, 4) The calculation of log10 inactivation. 3.4.4.1 Description of Cryptosporidium parvum The Iowa strain of C. parvum was used in this study (originally isolated by Dr. Harley Moon). Oocysts were produced in 2-3 day old male neonatal Holstein calves (Bos tauris). Calves were given up to 2 L of colostrum from a bottle after birth, and fed milk replacer for 2-3 days prior to infection with C. parvum. Twelve hours prior to infection, milk replacer was withheld from the animals, and the calves inoculated with 1.0 x 10⁸ C. parvum oocysts suspended in 2 L of distilled water. The calves were maintained on milk replacer for the following three days and then on electrolyte solution during fecal collection (starting 4 days post exposure and until termination). At the onset of sourcing, the feces were collected in tap water and sequentially passed through 10, 20, 60, 100, 200 and 400 mesh sieves (Fisher) by agitating and washing the sieves with 0.01% Tween 20 (v /v). Concentration of the particulates from the sieved feces was done by centrifugation at 1,100 x g for one minute. The purification of oocysts from pelleted fecal material was done using cesium chloride (CsCl) gradient ultra-centrifugation. A CsCl gradient was prepared in a 40 mL Beckman polyallomer ultracentrifuge tube, and consisted of a bottom layer (7 mL of 1.4 g/mL CsCl), middle layer (11 mL of 1.1 g/mL CsCl) and a top layer (9 mL of 1.05 g/mL CsCl). Approximately 5 mL of the parasite material was gently
25
layered on top of the CsCl gradient and centrifuged at 16,000 x g for 60 minutes using a swinging-bucket rotor (SW-28) at the slow brake setting (Beckman L7-55 ultracentrifuge). After centrifugation, the bank containing the purified oocysts was removed using a pipette and placed in 50 mL polypropylene tubes. The tubes were filled with deionized water and the oocysts washed twice by centrifugation at 14,500 x g for 10 minutes using a fixed-angle SS-34 rotor of a high speed centrifuge (Sorval, RC5-B centrifuge). After the final washing step the oocysts were suspended in deionized water containing 100 units/mL penicillin, 100 µg/mL streptomycin, 100 µg/mL gentamicin, 0.01% Tween 20, and stored at 4°C prior to use in the experiments. In cases where low number of parasites were found in fecal samples, oocysts were concentrated in fecal material using sucrose floatation before CsCl gradient centrifugation. A 50 mL conical centrifuge tube was filled with 30 mL of sucrose solution (1,320 g per liter of water) onto which 5-9 mL of emulsified feces was layered. The tubes were mixed by inversion and centrifuged at 800 x g for 10 minutes at 4°C. The oocysts found at the feces-sucrose interface were removed using a pipette and diluted five times using deionized water containing 0.01% Tween-20. The oocysts were then washed three times in deionized water containing 0.01% Tween-20 at 2,800 x g for 20 minutes at 4°C. This enriched oocysts fecal sample was subsequently layered into CsCl gradients as described above. The oocyst concentration in the suspension was determined by quadruplicate counts using a hemocytometer. C. parvum oocysts are never exposed to 2.5 % potassium dichromate or sodium hypochlorite, as is commonly done, in order to minimize oxidative damage incurred on the oocysts by this treatment. 3.4.4.2 Enumeration of oocyst Suspensions A known number of oocysts were purchased and their numbers were confirmed by using a hemocytometer, according to the procedures detailed in USEPA Method 1622 (1998). The demonstration phase consisted of trip controls, a process control, three replicates at a medium ozone dose, one replicate at a high ozone dose and one replicate at a low ozone dose. Two (2) ampules containing 4.0 x10⁸ oocysts were used for seeding challenges and the process control. 3.4.4.3 Challenge Seeding Schedule The organisms were introduced upstream of a static mixer ahead of the Model PS 150 and collected on one-µm filters after the contact chamber according to the schedule presented below in Table 3-3. Filters contained within this housing typically capture greater than 7-log10 oocysts. Because microorganisms entrapped within the one-µm filters would be subjected to continued exposure to ozonated water throughout the microbial seeding study, residual ozone was removed from the ozone system’s effluent stream immediately after the CT tank. This was accomplished by injecting one pound of sodium thiosulfate per gallon of water with a metering pump prior to a static mixer (see Appendix E for injection rates). Ozone reduction was verified to less than 0.05 mg/L during the Initial Operations and before each oocyst seeding with a HACH 2120 spectrophotometer and USEPA approved HACH AccuVac dissolved ozone reagent ampules.

26
Filter effluent was directed to the Minneapolis Sanitary Sewer System. Table 3-3 is a summary of the C. parvum challenge seeding schedule design. Table 3-3. Cryptosporidium parvum Challenge Seeding Schedule Design Date Run Type (Ozone Dose) Flow Rate CT 12/5/99 High 150 GPM 15 12/5/99 Medium 150 GPM 10 12/5/99 Medium 150 GPM 10 12/6/99 Medium 150 GPM 10 12/6/99 Low 150 GPM 5 12/7/99 Process Control 150 GPM 0
The sizes of the process control doses were chosen to detect up to a 2-log10 decrease in oocyst viability caused by the process alone without ozone treatment. The seeding protocol followed that indicated in the EPA/NSF ETV Protocol (EPA/NSF, 1999). The oocyst seeding protocol consisted of the following steps:
• The flow rate through the Model PS 150 was adjusted to 150 gpm on the system monitor screen.
• System effluent water was tested downstream of sodium thiosulfate injection to verify no dissolved ozone was present prior to the oocyst seeding.
• The entire effluent stream from Model PS 150 (and contact tank) was diverted through a stainless steel housing containing four 3" diameter by 20" long 1.0 µm absolute track-etch polycarbonate membrane filter cartridges (Nucleopore, Inc.). The surface area of each filter was 2.8 m2 (30.14 ft2) for a total filter area of 120.5 ft2. At 150 gpm, the approach flowrate was 1.24 gpm/ft2.
• Protozoan oocyst injection utilized a 100 mL graduated cylinder into which a 1 mL suspension of approximately 2.0 x 10⁸ to 4.0 x 10⁸ oocysts was diluted into 100 mL. A 44 gpd Pulsatron Model LPKSA PTC2 metering pump equipped with PTFE tubing injected the organisms into the feed stream at a rate of 50 mL/min. The microorganisms were injected through a 1/4-inch compression fitting at the inlet end of the static mixer through a probe inserted to the approximate center of the mixing chamber.
• When the cylinder was approximately 95% empty, it was refilled twice with incoming feed water to ensure that all organisms were fed into the Model PS 150 and to flush the injection system.
Upon completion of the seeding, and following a sufficient delay time to ensure a significant number of oocysts had emerged, the flow of water was diverted around the capture filter cartridge housing. After the capture filter cartridge housing was isolated, depressurized and drained the filters were removed, double bagged in polyvinyl bags (greater than 1 mil poly) and sealed in a cooler with packaged “blue ice” for shipment to the laboratory.
27
The trip controls were held at 4°C throughout the study, including all travel to and from the University of Alberta and the field site. The experimental and process control oocysts remained at 4°C until they were vortexed for 30 minutes (still chilled), then mixed in system water (approximately 10°C). The oocysts were then seeded into the test system and held on capture filters for the duration of the test, for a total time of 25 minutes at the temperature of the water. After collection on the filters, they were immediately chilled to 4°C, placed on ice packs and delivered to Spectrum Labs where the oocysts were eluted from the capture filters. The ice packs were still frozen upon arrival, maintaining the temperature at 4°C. The total time the oocysts were at temperatures higher than 4°C in the field was about one hour. Once they arrived at Spectrum Labs, each filter was individually eluted, which took approximately two hours per filter. Accordingly, the total time the oocysts were exposed to room temperature was approximately three hours. Once the oocysts were eluted and concentrated, they were shipped (overnight) to the University of Alberta for animal infectivity analyses. 3.4.4.4 Neonatal Mouse Infectivity Assays A neonatal mouse model was used to evaluate infectivity of C. parvum oocysts. Breeding pairs of outbred CD-1 mice were obtained from Charles River Breeding Laboratories (St. Constant, Quebec, Canada). The animals were given food and water ad libitum and were housed in cages with covers fitted with 0.22 µm filter in specific pathogen-free (P-2 level) animal facility. Upon receipt of the samples in the laboratory of the University of Alberta, sample identification codes and colors were recorded. The minimum and current temperatures were recorded. The number of oocysts in each experimental sample was determined using immunofluorescence (IF) straining. Experimental samples were vigorously vortexed and subsequently passed through a 35 µm-mesh strainer (Becton-Dickinson) in order to remove large debris from the samples. Samples were centrifuged (10,000 x g, 10 min.), the supernatant removed, and pellets from multiple tubes of the same samples were re-suspended and pooled together. The total volume in each sample was brought up to 1 ml with deionized water. Three serial dilutions in 1 ml of Phosphate Buffered Saline (PBS) containing 5% calf serum (1:50, 1:100, and 1:200) were made for each sample. Diluted samples were incubated at room temperature for 15 minutes before adding antibody, in order to block non-specific absorption of antibody. Two-hundred and fifty µl of a 1:400 dilution of FITC (Fluorescein Isothiocyanate) labeled anti-C. parvum monoclonal antibody (Immucell, Portland, Maine) was added to each sample (final antibody straining dilution = 1:2000). Samples were incubated for 15 minutes at 37°C and oocysts subsequently enumerated with a hemocytometer using fluorescence microscopy. Optimal counts of C. parvum oocysts were obtained using 1:100 to 1:200 dilutions for each of the samples. Quadruplicate hemocytometer counts were made for each sample and tested for a normal Poisson distribution. Oocyst doses were prepared from the experimental or stock suspensions by serial dilution. Five day old neonatal mice were inoculated intragastrically with 50 µl of deionized water containing the specified number of oocysts. Intragastic inoculations were done using a 24 gauge ball-point feed needle (Popper and Sons, Inc.). One hour prior to infection, the neonatal mice (five days old) were taken away from mothers to ensure that their stomachs were empty and ready to receive the intragastric inoclum C. parvum. In addition, neonates from multiple litters were pooled and randomly selected for infection, in

28
order to minimize variability introduced by inherent resistance or susceptibility of neonatal littermates to infection with C. parvum. The infectivity of the oocysts was determined seven days after infection. C. parvum infections in mice were assessed by staining mouse intestinal homogenates with a fluorescent labeled anti-C. parvum monoclonal antibody (Immucel) and using flow cytometry to detect the presence of fluorescent oocysts (FASCalibur, Becton-Dickinson). Mice were killed by cervical dislocation and the lower half of the small intestine, caecum, and colon removed and placed in 10 mL of deionized water. The intestines were homogenized for 45-60 seconds in a Sorvall® Omni-Mixer and washed once with deionized water containing 0.1 % Tween-20 at 2,000 x g for 15 minutes. The supernatant was discharged and the cell pellet disrupted by vigorous vortexing. Twenty µl of the viscous pellet was pipetted into a 35 µm sieve fitted onto a 6 ml flow cytometer polystyrene tube (Becton Dickinson), and the sieve flushed with 400 µl of 1% BSA (bovine serum albumin-faction V. Boehringer Mannheim) in PBS. The strained suspension was incubated for 15 minutes at room temperature in order to block non-specific adsorption of monoclonal antibodies to intestinal contents. One hundred µl of 1:400 dilution of a fluorescent labeled anti-C. parvum monoclonal antibody (mAb) was added to each of the tubes and incubated at 37°C for 30 minutes (final antibody straining dilution = 1:2000). For each infection day, intestines from five mice never exposed to C. parvum were also processed along with experimental animals. This group of ‘negative control’ was used to ensure the absence of false positives. Detection of C. parvum oocysts was done using a FACSCalibur flow cytometer programmed under the following settings: 1) forward light scatter photodiode setting = 00 and amp gain = 4.00; 2) side scatter photomultiplier setting = 402, amp gain = 4.00; and 3) FL1 photomultiplier setting = 470. Fifty thousand events were collected for each intestinal homogenate. A stock oocyst suspension was used to define a region based on size (i.e., forward light scatter) and internal complexity (i.e., side scatter) of C. parvum oocysts. This defined region was subsequently used to discriminate potential oocysts in mouse intestinal homogenates. An additional criteria (i.e., gate) within this region was defined based on the fluorescent staining intensity (i.e., FL1) of particles within this region. Thus, oocysts were discriminated from other intestinal particulates having the same size and internal complexity based on the acquisition of fluorescent mAbs on their surface. Log10 Inactivation Calculation Logistic analysis, as proposed by Finch, et al. (1993), was used for analyzing oocyst dose-response data. This method applies a logarithmic transformation that converts the normal dose-response data into a form that can be readily analyzed by linear regression. Linear regression analysis yields an equation for the straight line of the type y = b + mx where b and m are the intercept and slope of the line, respectively. The transformation was accomplished by first defining the term response LOGIT for a given oocyst dose as the natural logarithm (ln) of the proportion of mice infected divided by one minus the proportion of mice.
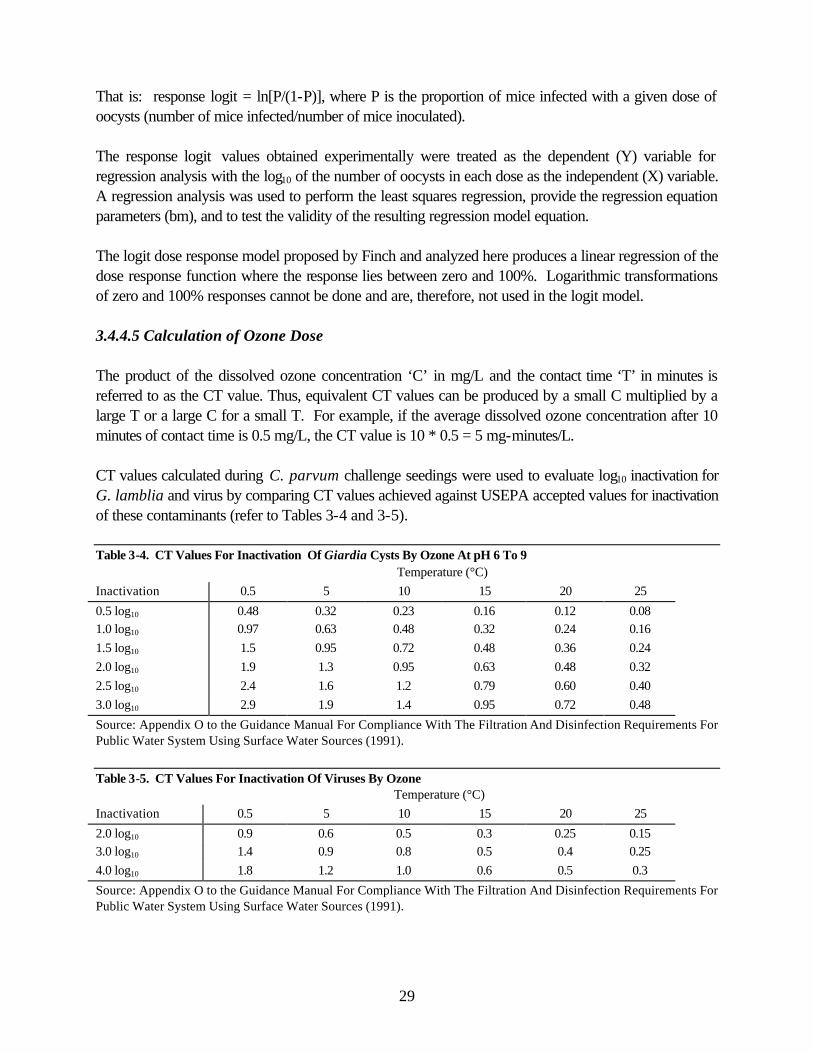
29
That is: response logit = ln[P/(1-P)], where P is the proportion of mice infected with a given dose of oocysts (number of mice infected/number of mice inoculated). The response logit values obtained experimentally were treated as the dependent (Y) variable for regression analysis with the log10 of the number of oocysts in each dose as the independent (X) variable. A regression analysis was used to perform the least squares regression, provide the regression equation parameters (bm), and to test the validity of the resulting regression model equation. The logit dose response model proposed by Finch and analyzed here produces a linear regression of the dose response function where the response lies between zero and 100%. Logarithmic transformations of zero and 100% responses cannot be done and are, therefore, not used in the logit model. 3.4.4.5 Calculation of Ozone Dose The product of the dissolved ozone concentration ‘C’ in mg/L and the contact time ‘T’ in minutes is referred to as the CT value. Thus, equivalent CT values can be produced by a small C multiplied by a large T or a large C for a small T. For example, if the average dissolved ozone concentration after 10 minutes of contact time is 0.5 mg/L, the CT value is 10 * 0.5 = 5 mg-minutes/L. CT values calculated during C. parvum challenge seedings were used to evaluate log10 inactivation for G. lamblia and virus by comparing CT values achieved against USEPA accepted values for inactivation of these contaminants (refer to Tables 3-4 and 3-5). Table 3-4. CT Values For Inactivation Of Giardia Cysts By Ozone At pH 6 To 9 Temperature (°C) Inactivation 0.5 5 10 15 20 25
0.5 log10 0.48 0.32 0.23 0.16 0.12 0.08 1.0 log10 0.97 0.63 0.48 0.32 0.24 0.16 1.5 log10 1.5 0.95 0.72 0.48 0.36 0.24 2.0 log10 1.9 1.3 0.95 0.63 0.48 0.32 2.5 log10 2.4 1.6 1.2 0.79 0.60 0.40 3.0 log10 2.9 1.9 1.4 0.95 0.72 0.48
Source: Appendix O to the Guidance Manual For Compliance With The Filtration And Disinfection Requirements For Public Water System Using Surface Water Sources (1991). Table 3-5. CT Values For Inactivation Of Viruses By Ozone Temperature (°C) Inactivation 0.5 5 10 15 20 25
2.0 log10 0.9 0.6 0.5 0.3 0.25 0.15 3.0 log10 1.4 0.9 0.8 0.5 0.4 0.25 4.0 log10 1.8 1.2 1.0 0.6 0.5 0.3
Source: Appendix O to the Guidance Manual For Compliance With The Filtration And Disinfection Requirements For Public Water System Using Surface Water Sources (1991).

30
In addition, CT values were calculated three times per day during the performance verification period. The minimum, maximum and average CT values from these data are reported in Chapter 4, Results and Discussion. 3.5 Recording Data The parameters and operating data collected by the technician were maintained in a bound logbook and transferred to computer spreadsheets on a daily basis. Documentation of study events was facilitated through the use of logbooks, photographs, data sheets and chain of custody forms. In addition any variations in the treatment plant regimen were noted, such as changes in disinfection levels in response to varying biological contamination and unusual source water episodes (i.e., weather related incidents (ice outs, storms), unusual river traffic or contaminant spills). Data handling is a critical component of any equipment evaluation testing. Care in handling data assures that the results are accurate and verifiable. Accurate sample analysis is meaningless without verifying that the numbers are being entered into spreadsheets and reports accurately and that the results are statistically valid. 3.5.1 Objectives The objective of the data handling protocol was to tabulate the collection of data for completeness and accuracy to permit ready retrieval for analysis and reporting. In addition, the use of computer spreadsheets allowed manipulation of the data for arrangement into forms, useful for evaluation. A second objective was the statistical analysis of the data as described in the “NSF/EPA ETV Protocol for Equipment Verification Testing for Inactivation of Microbiological Contaminants” (EPA/NSF 1999). 3.5.2 Procedures The data handling procedures were used for all aspects of the verification test. Procedures existed for the use of the logbooks used for recording the operational data, the documentation of photographs taken during the study, the use of chain of custody forms, entry of data into the customized spreadsheets, and the method for performing statistical analyses. Although data were collected at three locations (the test site, the University of Alberta, and Spectrum Labs) the COA offices were the central data collection point and all raw data and notes are on file. 3.5.2.1 Logbooks COA as the FTO for the project was responsible for the maintenance of the logbooks and field notebooks. Operational data was read and recorded for each day of the testing cycle Data was collected in bound logbooks and on charts from the instrumentation panels and individual testing instruments. There was a single field log book containing all on-site operating data that remained on site and contained instrument readings, on-site analyses and any comments concerning the test run with

31
respect to either the nature of the feedwater or the operation of the equipment. A copy of the logbook is presented as Appendix D. Each page of the logbook was sequentially numbered and identified as Osmonics ETV Test. Each completed page was signed by the on-duty FTO staff. Errors were crossed out with a single line and initialed. Deviations from the FOD whether by error or by a change in the conditions of either the test equipment or the water conditions were noted in the logbook. The logbook included a carbon copy of each page. The original logbook was stored on-site, the carbon copy sheets forwarded to the project engineer of COA at least once per week. This not only eased referencing the original data, but offered protection of the original record of results. 3.5.2.2 Chain of Custody Original chain of custody forms traveled with the samples from the test site to the laboratory (copies of which are attached as Appendix C). 3.5.2.3 Spreadsheets A COA associate entered data into a computer spreadsheet program (Microsoft© Excel) on a daily basis from the logbook and from any analytical reports. A back-up copy of the computer data was maintained off site. The database for the project was set up in the form of custom-designed spreadsheets (copies of which are attached as Appendix B). All data from the laboratory notebooks and the data logbook were entered into the appropriate spreadsheet. All recorded calculations were checked at this time. Following data entry, the spreadsheet was printed out and the printout was checked against the handwritten data sheet. Corrections were noted on the hard copies and corrected on the screen, and then a corrected version of the spreadsheet was printed out. The COA operator or engineer performing the entry or verification step initialized each step of the verification process. The data spreadsheets are attached to this report as Appendix B. Each challenge test run was numbered for coordination with the on-site data from that run along with the laboratory testing data. The operating conditions for each test run were entered into the logbooks and onto the spreadsheet. The spreadsheet consolidated the information from Tasks 2, 3, 4, and the results from any and all off-site laboratory analyses. Computer data were transferred from the test site to the FTO offices by the physical transfer of data disks. 3.6 Calculation of Data Quality Indicators 3.6.1 Representativeness Water quality parameter samples for the Osmonics PS 150 System were taken as indicated in Table 3-1. Off-site samples were delivered to the laboratory for analysis. The holding times are those indicated
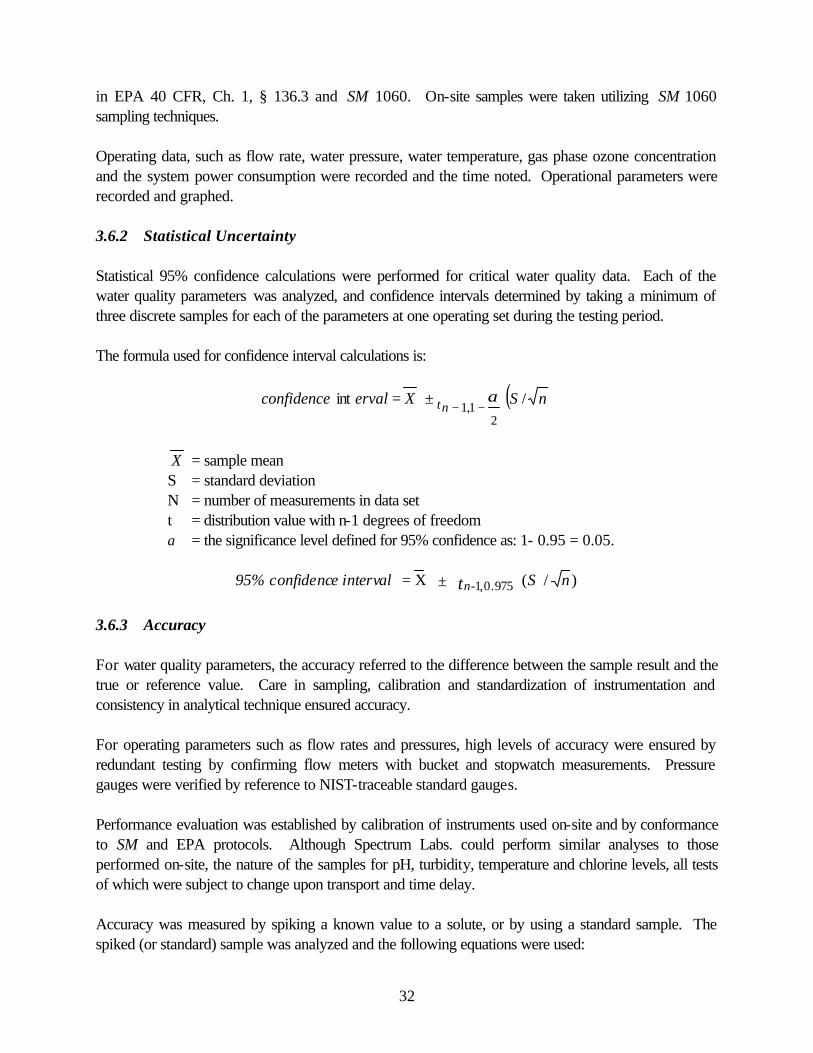
32
in EPA 40 CFR, Ch. 1, § 136.3 and SM 1060. On-site samples were taken utilizing SM 1060 sampling techniques. Operating data, such as flow rate, water pressure, water temperature, gas phase ozone concentration and the system power consumption were recorded and the time noted. Operational parameters were recorded and graphed. 3.6.2 Statistical Uncertainty Statistical 95% confidence calculations were performed for critical water quality data. Each of the water quality parameters was analyzed, and confidence intervals determined by taking a minimum of three discrete samples for each of the parameters at one operating set during the testing period. The formula used for confidence interval calculations is:
( )nSXerval confidence tn/ int
2
1,1α
−−±=
X = sample mean S = standard deviation N = number of measurements in data set t = distribution value with n-1 degrees of freedom α = the significance level defined for 95% confidence as: 1- 0.95 = 0.05.
95% confidence interval = X ± n-1,0.975t (S / n )
3.6.3 Accuracy For water quality parameters, the accuracy referred to the difference between the sample result and the true or reference value. Care in sampling, calibration and standardization of instrumentation and consistency in analytical technique ensured accuracy. For operating parameters such as flow rates and pressures, high levels of accuracy were ensured by redundant testing by confirming flow meters with bucket and stopwatch measurements. Pressure gauges were verified by reference to NIST-traceable standard gauges. Performance evaluation was established by calibration of instruments used on-site and by conformance to SM and EPA protocols. Although Spectrum Labs. could perform similar analyses to those performed on-site, the nature of the samples for pH, turbidity, temperature and chlorine levels, all tests of which were subject to change upon transport and time delay. Accuracy was measured by spiking a known value to a solute, or by using a standard sample. The spiked (or standard) sample was analyzed and the following equations were used:

33
For a spiked sample: %R = 100
A - BS
For a standard: %R = 100×
ObservedTrue
Where: %R = Recovery percent A = Result of spiked sample B = Result of un-spiked sample S = Spike value 3.6.4 Precision Precision was the measure of the degree of consistency from test to test, and was assured by replication. In the case of on-site testing for water quality, precision was ensured by triplicate tests and averaging; for single reading parameters, such as pressure and flow rate, precision was ensured by redundant readings from operator to operator. Travel blanks were not required for this testing. Matrix and method blanks were used for turbidity measurements, and pH standardization. The equation employed for precision was:
%RSD = D1/D2 x 100 %RSD = % Relative standard deviation D1 = Standard deviation of sample set D2 = Mean of recovery values (of replicates) 3.7 Equipment The following analytical equipment was used on-site during the verification testing:
• Ozone Gas Analyzer - The accuracy of the ozone gas analyzer (serial # 991275), manufactured by IN - USA, model # HI-S is verified by the manufacturer in accordance with the “statement of calibration procedure” dated November 29, 1999.
• A HACH 2100P portable turbidimeter was used for benchtop turbidity analysis. • Accuracy of all pressure gauges from which measurements were recorded were verified on site
with a National Institute of Standards and Technology (NIST) traceable pressure gauge certified by Muller Process Instrumentation (Certification # 9286-11).
34
• Measurements of temperature were completed with a Miller and Weber NIST traceable thermometer, in addition to Tel-Tru Thermometers. Certification #’s 10425 and 9340-1.
• Accuracy of the Mag-Flow meter on the Model PS 150 was verified volumetrically against time by University of Minnesota Hydraulics Lab Personnel.
• Dissolved ozone gas measurements were taken with a HACH 2120 spectrophotometer in conjunction with approved indigo AccuVac reagents and with Orbisphere model 26506 monitors and model 313 series in-line sensors.
• Chlorine measurements were taken with a HACH 2120 spectrophotometer in conjunction with approved indigo AccuVac reagents.
The operating procedures for the Model PS 150 are described in the O&M Manual. The O&M Manual for the treatment system was maintained on-site and is attached to this document Appendix A. Additionally, operating procedures and equipment descriptions were described in detail in Chapter 2 of this report. 3.8 Health and Safety Measures There were two major safety concerns for on-site staff with respect to this testing procedure. 1) The equipment to be tested is powered by 230 VAC electricity and, 2) The microbes are highly infectious. For protection against accidental infection by oocysts, strict environmental laboratory procedures were followed. Protective clothing such as gloves, glasses and lab coats was on hand and used when appropriate. The capture filters removed from the filtration housing were double bagged for shipment in protective containers. Laboratory personnel trained in biological safety did the handling of all live oocysts and oocyst-containing materials. Built into the equipment were a number of safety features. Since this equipment has been designed for installation in water treatment plants, interlock connections, breakers and other protective devices have been included in its manufacture. 3.9 QA/QC Procedures The objective of the Quality Assurance/Quality Control (QA/QC) procedures was to control the methods and instrumentation procedures such that the data were not subject to corruption. Adherence to analytical methods, both on site and off site, as published in Standard Methods or EPA-approved methods was assured. Moreover, instrumentation and standard reagents were used in accordance to NIST. Instruments used to gather data were standardized and calibrated in accordance with the schedules noted below.
35
3.9.1 QA/QC Verifications QA/QC verifications were performed at the beginning of each testing period included instrumentation checks, cleaning and maintenance of the turbidimeters, pressure gauges, tubing and other components. Flow meters were calibrated with the "bucket and stopwatch" technique. Turbidimeters were tested for volumetric accuracy and standardized. Results of the several verification and QA/QC procedures are detailed in the Chapter 4, Results and Discussions section. Daily QA/QC Verifications included:
• Bench-top turbidimeter calibration verified against standards of 0.1, 0.5, 3.0 and 5.0 NTU. • pH meter calibration verified at pH 7.01"0.01 and pH 10.01"0.01 with NIST-traceable pH
buffers. One-time QA/QC Verifications included:
• On-line flow meters cleaned and flow verified volumetrically. • Bench-top turbidimeter calibration against standards of 20, 100 and 800 NTU.
QA/QC Verifications at the beginning of each testing period included: • Verification of pressure gauges with NIST-traceable gauge. • Inspection of all tubing for unimpeded flow and integrity.
Further descriptions on verifications of on-site instrumentation are provided below. Laboratory results of water quality parameters are reported in standardized formats. Microbiological testing was reported both as raw numerical data and in standard statistical formats. Log10 reduction calculations were performed. All grab samples for water quality analyses, travel blanks, and other material sent to outside laboratories for analytical work were taken, packaged and shipped with chain of custody forms. 3.9.2 On-Site Analytical Methods Specific Instrumentation methods for on-site QA/QC accuracy were conducted during verification testing. Water quality parameters were measured by analytical or instrument methods outlined in Standard Methods (SM). On-site instruments were calibrated daily. Sample ports and sampling techniques remained consistent. 3.9.2.1 pH Analysis of pH was performed according to SM 4500-H+. A two-point calibration with NIST-traceable pH buffers of pH 7.01"0.01 and pH 10.01"0.01 was performed daily. Between tests the pH probe was kept wet in KCl solution. For on-site determination of pH, field procedures were used to limit absorbance of carbon dioxide to avoid skewing results by poorly buffered water. The samples were collected in a dedicated beaker and promptly analyzed.
36
3.9.2.2 Temperature Temperatures were measured daily in accordance with SM 2550 daily. The thermometer used was a NIST-traceable thermometer, marked in 0.1°C increments. The temperature was taken by immersing the thermometer to an index line scribed on the body into running water and allowing the mercury to stabilize. The thermometer was held upright during the readings. 3.9.2.3 Turbidity Turbidity was measured in accordance with SM 2130. The bench-top turbidimeter was calibrated at the beginning of the verification test, following the microbial challenge, and weekly thereafter as required by the Test Plan. The turbidimeter calibration was confirmed through the use of secondary standards before and after the calibration. The bench turbidimeter, a HACH 2100P, was calibrated to the manufacturer's recommended standards of 20, 100 and 800 NTU. The manufacturer explains that since the response signal is linear from 0-20 NTU, efforts to standardize to lower levels are fruitless and may instead throw the readings off. Standards are further required to be at least 65 NTU apart. In addition, weighting the curve to the range of interest (in this case at levels less than 5 NTU) also provides the opportunity for increasing error. The bench-top turbidimeter was a Hach 2100P, and is designed to shut off automatically after a specified period of inaction to preserve the battery; accordingly, it was not left on at all times. Manufacturer’s procedures for maintenance were followed and the schedules for maintenance and cleaning noted in the logbook. The turbidimeter was calibrated against freshly prepared Formazin dilutions from a standard suspension (4000 NTU) purchased from HACH. The standards were prepared using NIST traceable glassware, including pipettes and volumetric flasks. The bench-top turbidimeter was also calibrated using Gelex secondary standards following manufacturer’s instructions during the instrument calibration, and additional secondary standards were prepared or purchased from HACH. These standards were referenced daily in the ranges of concern. While the standards at 0.5, 1.0 and 3.0 NTU were relatively stable, the reference of 0.1 NTU was somewhat ambiguous. Samples were taken from a sample tap at a slow steady stream and along the side of a triple rinsed dedicated beaker to avoid air entrapment. Samples were poured from the beaker into a double-rinsed, clean sample vial and inserted into the chamber. This was repeated for influent and effluent samples.. All glassware for turbidity measurements were kept clean and handled with lint-free laboratory tissue. Sample cells were additionally wiped with a silicone-oiled velvet cloth. SM 2130 protocol was employed for measurement of turbidity. 3.9.2.4 Dissolved Ozone In-line dissolved ozone sensors, with monitors (Orbisphere, Model numbers 313 (sensor) and 26506 (monitor)) were properly installed and calibrated according to specific instructions provided by

37
Orbisphere. Additional verifications of calibration were performed using a Spectrophotometer (HACH Model 2120) in conjunction with HACH Indigo AccuVac reagent ampules. During initial operations it was noted the dissolved ozone measurements using the Indigo method produced inconsistent results while ozone dose, water quality and operational parameters remained unchanged. Accordingly, the manufacturer (Osmonics) and the FTO re-verified the Orbisphere sensors/monitors were calibrated according their manufacturer’s O&M manual prior to the start of the performance verification period. The sensors were not removed and reinstalled daily to verify proper installation of the previous days’ verification of the same. Rather, sensor-operating characteristics as defined within the Orbisphere O&M manual were observed. 3.9.2.5 Flow Meter
Rosemount Series 8700 flow meter accuracy was verified volumetrically against time. The flow was verified once as per the ETV Test Plan. 3.9.2.6 Ozone Gas Monitor The ozone gas monitor, model number H1-S (serial number 991275), calibration was certified by the manufacturer (In USA) on November 29, 1999. Verification of calibration in the field was performed in accordance with the wet-chemistry method described in Rakness et al (1996). Because errors were discovered within the prescribed method itself, corrections were made in order to produce reliable performance data. Further discussions are included in Chapter 4. 3.9.2.7 Free Chlorine Free chlorine residual was measured daily as specified by the ETV Test Plan with the HACH Spectrophotometer (Model 2120) using the HACH Indigo AccuVac ampules. 3.9.3 Off-Site Analysis For Chemical and Biological Samples Analytical procedures are described in Spectrum Laboratory’s Quality Assurance Plans (located in FOD). Tables 1a and 1b of the Code of Federal Regulations 40, Parts 136.3 cross-reference Standard Methods, EPA methods, American Society for Testing and Materials (ASTM) methods and U.S. Geological Survey (USGS) methods. Spectrum Labs follows EPA, SM or other accepted methodology for all of their analytical procedures. For example, to analyze alkalinity, EPA method §310.1 is used, this correlates to SM 2320B, which is the same as ASTM 1067-92 and USGS i-1030-85. All four of the testing methods are the same. 3.9.3.1 Organic Parameters, Total Organic Carbon and UV254 Absorbance Samples for analysis of TOC and UV254 were collected in furnished glass bottles supplied by Spectrum and were delivered by courier to Spectrum Labs (the travel time was approximately 20 minutes).
38
Samples were preserved, held and shipped in accordance with SM 5010B and SM 1060. Samples were analyzed at the laboratory for TOC using EPA method §415.1. DOC was analyzed at the laboratory using EPA method §415.1. UV254 Absorbance was analyzed using SM 5910B. 3.9.3.2 Inorganic Samples Inorganic Samples were collected, preserved and shipped in accordance with SM 3010B and C and 1060 and EPA §136.3, 40 CFR Chapter 1. Proper bottles and preservatives where required (Iron and Manganese for example) were used. Although the travel time was brief, samples were shipped cooled Samples were analyzed at the laboratory in accordance with the following methods: total alkalinity - EPA Method §310.2, bromide and bromate - EPA method §300.0, total hardness - EPA Method §130.1, calcium, iron, dissolved manganese and total manganese - EPA Method §200.7, and sulfide - EPA Method §376.2. 3.9.3.3 True Color True color was measured in accordance with SM 2120 with a spectrophotometer at 455 nm. The samples were collected in glass vials and maintained at a temperature of 4°C during shipment to Spectrum Labs. The samples were warmed to room temperature before analysis.
39
Chapter 4 Results and Discussion
4.1 Introduction The verification testing for the Osmonics Model PS 150 System conducted at the University of Minnesota St. Anthony Falls Hydraulic Laboratory in Minneapolis, Minnesota, commenced on December 5, 1999, and concluded after 216 hours of testing on December 14, 1999. Cryptosporidium parvum challenge testing was performed on December 5 through December 7, 1999. This section of the verification report presents the results of the testing and offers a discussion of the results. Results and discussions of the following are included: initial operations, equipment characteristics, effluent water quality, calculation of CT and inactivation of Cryptosporidium parvum, and QA/QC. 4.2 Initial Operations Period Results An initial operations period allowed the equipment manufacturer to refine the unit’s operating procedures and to make operational adjustments as needed to successfully meet their performance claims. The unit was on site at the University of Minnesota in November of 1999 and was operated during initial operations to establish the optimum treatment scheme prior to initiation of verification testing. The major operating parameters examined during initial operations were characterization of influent water, flow rates, hydraulic retention time, ozone dosage, and general equipment performance. 4.2.1 Characterization of Influent Water Historical untreated surface water quality data (1997) obtained from the City of Minneapolis Municipal Water Works department and reviewed for the same time frame as the verification testing period (December) exhibited the following characteristics: the temperature varied from 0.1°C to 1.8°C; pH was in the range of 8.11 to 8.35; total alkalinity ranged from 164 mg/L to 179 mg/L; total hardness ranged between 173 mg/L and 197 mg/L; true color ranged between 26 and 31 TCU and the turbidity range was between 2.7 and 4.2 NTU. Historical treated water quality data (1998) obtained from the City of Minneapolis Municipal Water Works department and reviewed for the same time frame as the verification testing period (December) exhibited the following characteristics: the temperature varied from 4°C to 8°C; pH in the range of 8.5 to 9.3; total alkalinity ranged from 50 mg/L to 70 mg/L; total hardness ranged between 84 mg/L and 94 mg/L; and the turbidity range was between 0.01 and 0.15 NTU. Review of this data previous to, and
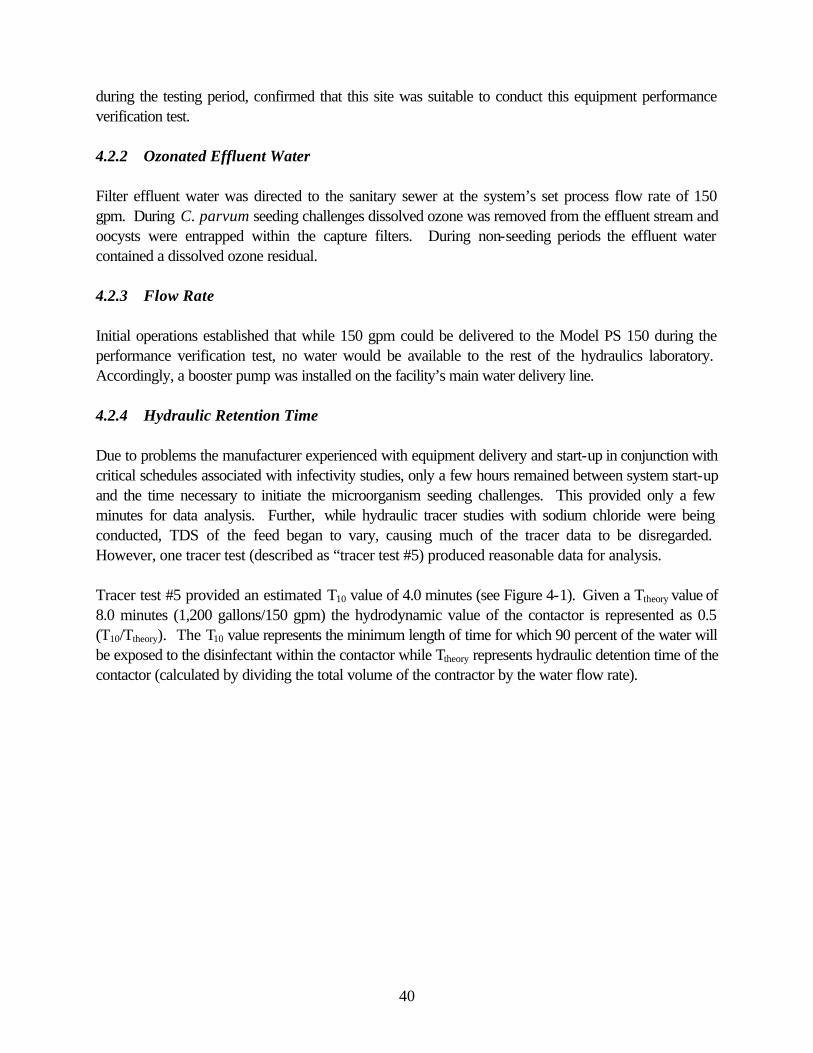
40
during the testing period, confirmed that this site was suitable to conduct this equipment performance verification test. 4.2.2 Ozonated Effluent Water Filter effluent water was directed to the sanitary sewer at the system’s set process flow rate of 150 gpm. During C. parvum seeding challenges dissolved ozone was removed from the effluent stream and oocysts were entrapped within the capture filters. During non-seeding periods the effluent water contained a dissolved ozone residual. 4.2.3 Flow Rate Initial operations established that while 150 gpm could be delivered to the Model PS 150 during the performance verification test, no water would be available to the rest of the hydraulics laboratory. Accordingly, a booster pump was installed on the facility’s main water delivery line. 4.2.4 Hydraulic Retention Time Due to problems the manufacturer experienced with equipment delivery and start-up in conjunction with critical schedules associated with infectivity studies, only a few hours remained between system start-up and the time necessary to initiate the microorganism seeding challenges. This provided only a few minutes for data analysis. Further, while hydraulic tracer studies with sodium chloride were being conducted, TDS of the feed began to vary, causing much of the tracer data to be disregarded. However, one tracer test (described as “tracer test #5) produced reasonable data for analysis. Tracer test #5 provided an estimated T10 value of 4.0 minutes (see Figure 4-1). Given a Ttheory value of 8.0 minutes (1,200 gallons/150 gpm) the hydrodynamic value of the contactor is represented as 0.5 (T10/Ttheory). The T10 value represents the minimum length of time for which 90 percent of the water will be exposed to the disinfectant within the contactor while Ttheory represents hydraulic detention time of the contactor (calculated by dividing the total volume of the contractor by the water flow rate).

41
Figure 4-1. Dimensionless Curve from Tracer Test #5
After the performance verification period began, the operation of the equipment could not be interrupted to conduct additional tracer studies. The manufacturer used a total retention volume of 1,200 gallons when programming the microprocessor used to monitor and adjust system ozone output to maintain selected CT values (see section 4.2.5). CT values were determined using the "conservative method" as described in Chapter 1 of the EPA/NSF ETV Protocol for Equipment Verification Testing of Microbiological Contaminant Inactivation. During performance verification testing and after completion of microbial challenge tests, COA field personnel measured the diameter and side shell height of the CT tank to verify its total volume. The diameter measured 66 inches and the side shell height measured 91 inches. Given these measurements, the total volume, (not including top and bottom domes), was calculated at 180.50 ft3 or 1,350 gallons (180.5 ft3 × 7.48 gallons per cubic foot)). Because this exceeded the total volume originally provided by the manufacturer, mechanical drawings of the CT tank were consulted. After confirming tank measurements with the mechanical drawings, the total volume of the CT tank was recalculated at 1,558.2 gallons (to include the volumes of the upper and lower domes). After calculating the volume of the interconnecting piping between the point of ozone injection and the CT tank, an additional 52.2 gallons were added to the CT tank's volume. This provides a total retention volume of 1,610.4 gallons. Additionally, performance verification of the flow meter used by the Model PS 150 established an actual flow rate of 9.6% greater than measured by the meter. While a flow rate had been established at 150 gpm with the PS 150 on-line flow sensor, the actual flow rate was 164.4 gpm.
Tracer Study #5Dimens ion less
0 .00
0 .10
0 .20
0 .30
0 .40
0 .50
0 .60
0 .70
0 .80
0 .90
1 .00
0 1 2 3 4 5 6 7 8 9 1 0 1 1
T i m e ( M i n u t e s )
C/Co
N o t e : 1 5 0 g p m
T 1 0 @ 4 m i n u t e s

42
This changed the Ttheory value to 9.8 minutes (1,610.4 gallons/164.4 gpm) and the T10/Ttheory value to 0.41 (T10/Ttheory = 4.0/9.8). Tracer study documentation is provided as Appendix D and analysis support is provided in Appendix G. 4.3 Verification Testing Results and Discussions The results and discussions of the equipment operation, maintenance, performance, water quality parameters, calculation of CT and inactivation of Cryptosporidium parvum are presented below. 4.3.1 Task 1 - Verification Testing Runs and Routine Equipment Operation The objective of this task was to operate the equipment provided by the manufacturer for at least 200 hours of ozone production and assesses its ability to meet water quality goals and other performance characteristics specified by Osmonics. The verification testing for the Osmonics Model PS 150 started on December 4, 1999 and continued for 216 hours of continuous (24 hours/day) operation and data recording. Ozone production was changed periodically throughout the test by the operator and was discontinued during the process control microbial challenge and for 20 minutes on 12/7/99 to reconnect the feed gas supply tube to the oxygen generator that had become disconnected. A recurring issue that was problematic to the operation of the Osmonics Model PS 150 involved the operators’ ability to set (or change) the CT value achieved by the system via the controller’s menu screen. This feature did not function during the course of the testing period. A further discussion of this is included in Section 4.4.1.2 Operational Reliability. 4.3.2 Task 2 - Influent and Effluent Water Quality Characterization A summary of the influent water quality information for Total Alkalinity, Bromide, Bromate, Calcium, Total Hardness, Iron, Dissolved Manganese, Total Manganese, Sulfide, TOC, DOC, and UV254 are presented below in Table 4-1.
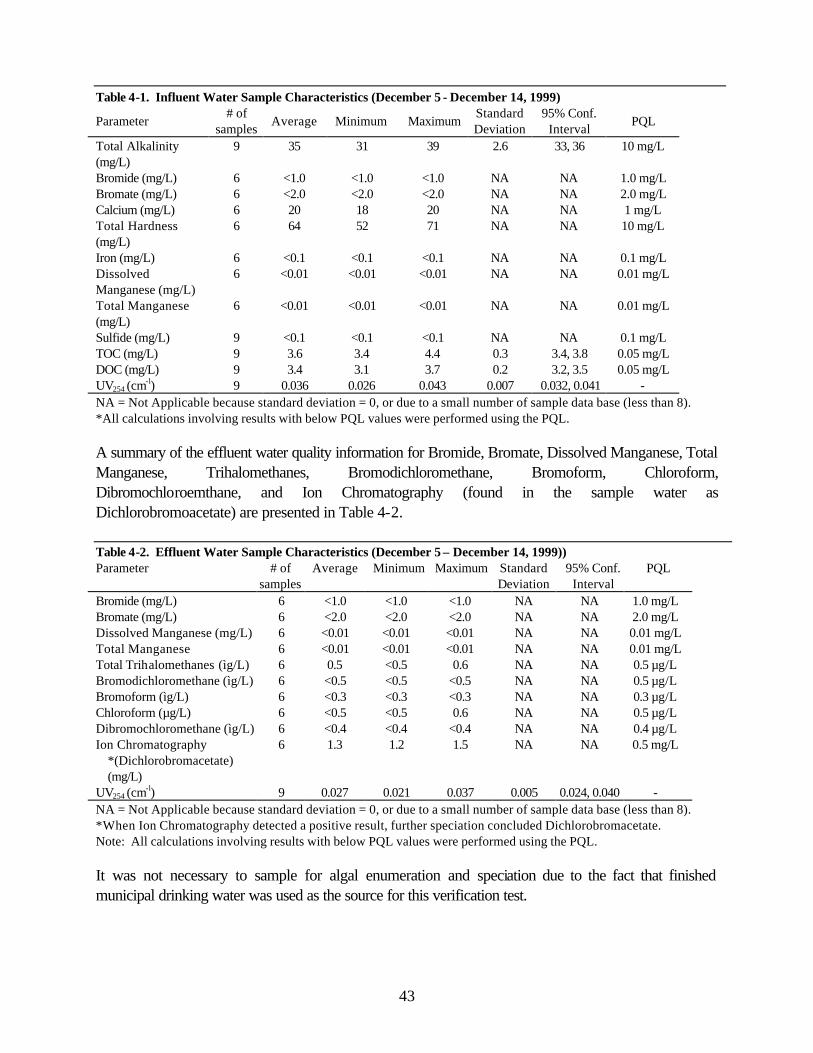
43
Table 4-1. Influent Water Sample Characteristics (December 5 - December 14, 1999)
Parameter # of
samples Average Minimum Maximum
Standard Deviation
95% Conf. Interval
PQL
Total Alkalinity (mg/L)
9 35 31 39 2.6 33, 36 10 mg/L
Bromide (mg/L) 6 <1.0 <1.0 <1.0 NA NA 1.0 mg/L Bromate (mg/L) 6 <2.0 <2.0 <2.0 NA NA 2.0 mg/L Calcium (mg/L) 6 20 18 20 NA NA 1 mg/L Total Hardness (mg/L)
6 64 52 71 NA NA 10 mg/L
Iron (mg/L) 6 <0.1 <0.1 <0.1 NA NA 0.1 mg/L Dissolved Manganese (mg/L)
6 <0.01 <0.01 <0.01 NA NA 0.01 mg/L
Total Manganese (mg/L)
6 <0.01 <0.01 <0.01 NA NA 0.01 mg/L
Sulfide (mg/L) 9 <0.1 <0.1 <0.1 NA NA 0.1 mg/L TOC (mg/L) 9 3.6 3.4 4.4 0.3 3.4, 3.8 0.05 mg/L DOC (mg/L) 9 3.4 3.1 3.7 0.2 3.2, 3.5 0.05 mg/L UV254 (cm-l) 9 0.036 0.026 0.043 0.007 0.032, 0.041 - NA = Not Applicable because standard deviation = 0, or due to a small number of sample data base (less than 8). *All calculations involving results with below PQL values were performed using the PQL. A summary of the effluent water quality information for Bromide, Bromate, Dissolved Manganese, Total Manganese, Trihalomethanes, Bromodichloromethane, Bromoform, Chloroform, Dibromochloroemthane, and Ion Chromatography (found in the sample water as Dichlorobromoacetate) are presented in Table 4-2. Table 4-2. Effluent Water Sample Characteristics (December 5 – December 14, 1999)) Parameter # of
samples Average Minimum Maximum Standard
Deviation 95% Conf.
Interval PQL
Bromide (mg/L) 6 <1.0 <1.0 <1.0 NA NA 1.0 mg/L Bromate (mg/L) 6 <2.0 <2.0 <2.0 NA NA 2.0 mg/L Dissolved Manganese (mg/L) 6 <0.01 <0.01 <0.01 NA NA 0.01 mg/L Total Manganese 6 <0.01 <0.01 <0.01 NA NA 0.01 mg/L Total Trihalomethanes (ìg/L) 6 0.5 <0.5 0.6 NA NA 0.5 µg/L Bromodichloromethane (ìg/L) 6 <0.5 <0.5 <0.5 NA NA 0.5 µg/L Bromoform (ìg/L) 6 <0.3 <0.3 <0.3 NA NA 0.3 µg/L Chloroform (µg/L) 6 <0.5 <0.5 0.6 NA NA 0.5 µg/L Dibromochloromethane (ìg/L) 6 <0.4 <0.4 <0.4 NA NA 0.4 µg/L Ion Chromatography
*(Dichlorobromacetate) (mg/L)
6 1.3 1.2 1.5 NA NA 0.5 mg/L
UV254 (cm-l) 9 0.027 0.021 0.037 0.005 0.024, 0.040 - NA = Not Applicable because standard deviation = 0, or due to a small number of sample data base (less than 8). *When Ion Chromatography detected a positive result, further speciation concluded Dichlorobromacetate. Note: All calculations involving results with below PQL values were performed using the PQL. It was not necessary to sample for algal enumeration and speciation due to the fact that finished municipal drinking water was used as the source for this verification test.

44
The water quality characteristics recorded on-site during the verification period are summarized below in Table 4-3 Table 4-3. On-Site Water Quality Characteristics (December 5 – December 14, 1999)
Parameter # of
samples Average Minimum Maximum
Standard Deviation
95% Conf.
Interval
PQL
Temperature-Influent (ºC) 27 5.5 4.7 6.5 0.51 5.3, 5.7 - Temperature-Effluent (ºC) 27 5.6 4.6 6.5 0.52 5.4, 5.8 - Ozone Residual-C0 Water (mg/L)1
27 0.9 0.2 3.98 0.86 0.6, 1.2 -
Ozone Residual-C Water (mg/L)2
27 0.6 0.04 1.78 0.50 0.4, 0.8 -
pH-Influent 27 7.7 7.4 8.1 0.18 7.6, 7.8 Color-Influent (Pt-Co) 27 1.4 <1 4.0 1 1, 2 1 TCU Color-Effluent (Pt-Co) 27 1.4 <1 9.0 2 1, 3 1 TCU Free Chlorine-Influent (mg/L) 27 0.01 <0.01 0.05 0.02 0.00, 0.02 0.013 Total Chlorine-Influent (mg/L)
27 0.12 0.05 0.27 0.05 0.10, 0.14 0.013
Turbidity-Influent (NTU) 25 0.14 0.08 0.31 0.06 0.1, 0.2 - Turbidity-Effluent (NTU) 25 0.14 0.08 0.26 0.06 0.1, 0.2 - 1 Concentration at time zero 2 Concentration at time zero plus retention time. 3 This is the Estimated Detection Level (EDL) for chlorine, this is not the same as the PQL. Hach (manufacturer of the DRT/2010 Spectrophotometer) provides a value called the Estimated Detection Limit for USEPA accepted and approved programs. The EDL is the calculated lowest concentration in a deionized water matrix that is different from zero with a 99% level of confidence. *All calculations involving results with below PQL values were performed using the PQL. 4.3.3 Task 3 - Documentation Of Operating Conditions and Treatment Equipment
Performance The purpose of this task was to accurately and fully document the operating conditions during treatment, and the performance of the Model PS 150 during the verification testing run. During this task, data was collected that described the operation of the equipment and provided information to be used to develop cost estimates for operation of the equipment.
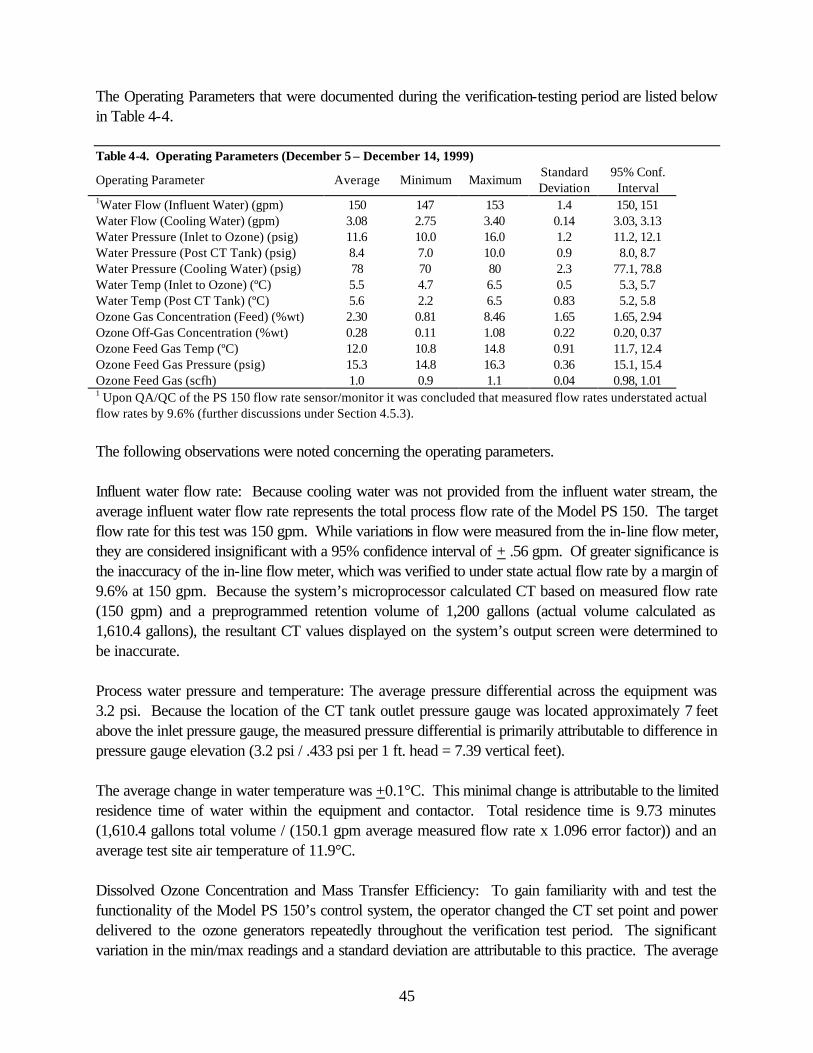
45
The Operating Parameters that were documented during the verification-testing period are listed below in Table 4-4. Table 4-4. Operating Parameters (December 5 – December 14, 1999)
Operating Parameter Average Minimum Maximum Standard Deviation
95% Conf. Interval
1Water Flow (Influent Water) (gpm) 150 147 153 1.4 150, 151 Water Flow (Cooling Water) (gpm) 3.08 2.75 3.40 0.14 3.03, 3.13 Water Pressure (Inlet to Ozone) (psig) 11.6 10.0 16.0 1.2 11.2, 12.1 Water Pressure (Post CT Tank) (psig) 8.4 7.0 10.0 0.9 8.0, 8.7 Water Pressure (Cooling Water) (psig) 78 70 80 2.3 77.1, 78.8 Water Temp (Inlet to Ozone) (ºC) 5.5 4.7 6.5 0.5 5.3, 5.7 Water Temp (Post CT Tank) (ºC) 5.6 2.2 6.5 0.83 5.2, 5.8 Ozone Gas Concentration (Feed) (%wt) 2.30 0.81 8.46 1.65 1.65, 2.94 Ozone Off-Gas Concentration (%wt) 0.28 0.11 1.08 0.22 0.20, 0.37 Ozone Feed Gas Temp (ºC) 12.0 10.8 14.8 0.91 11.7, 12.4 Ozone Feed Gas Pressure (psig) 15.3 14.8 16.3 0.36 15.1, 15.4 Ozone Feed Gas (scfh) 1.0 0.9 1.1 0.04 0.98, 1.01 1 Upon QA/QC of the PS 150 flow rate sensor/monitor it was concluded that measured flow rates understated actual flow rates by 9.6% (further discussions under Section 4.5.3). The following observations were noted concerning the operating parameters. Influent water flow rate: Because cooling water was not provided from the influent water stream, the average influent water flow rate represents the total process flow rate of the Model PS 150. The target flow rate for this test was 150 gpm. While variations in flow were measured from the in-line flow meter, they are considered insignificant with a 95% confidence interval of + .56 gpm. Of greater significance is the inaccuracy of the in-line flow meter, which was verified to under state actual flow rate by a margin of 9.6% at 150 gpm. Because the system’s microprocessor calculated CT based on measured flow rate (150 gpm) and a preprogrammed retention volume of 1,200 gallons (actual volume calculated as 1,610.4 gallons), the resultant CT values displayed on the system’s output screen were determined to be inaccurate. Process water pressure and temperature: The average pressure differential across the equipment was 3.2 psi. Because the location of the CT tank outlet pressure gauge was located approximately 7 feet above the inlet pressure gauge, the measured pressure differential is primarily attributable to difference in pressure gauge elevation (3.2 psi / .433 psi per 1 ft. head = 7.39 vertical feet). The average change in water temperature was +0.1°C. This minimal change is attributable to the limited residence time of water within the equipment and contactor. Total residence time is 9.73 minutes (1,610.4 gallons total volume / (150.1 gpm average measured flow rate x 1.096 error factor)) and an average test site air temperature of 11.9°C. Dissolved Ozone Concentration and Mass Transfer Efficiency: To gain familiarity with and test the functionality of the Model PS 150’s control system, the operator changed the CT set point and power delivered to the ozone generators repeatedly throughout the verification test period. The significant variation in the min/max readings and a standard deviation are attributable to this practice. The average

46
feed gas vs. off-gas concentrations (%wt) were 2.54 %wt and 0.31 %wt. This supports a .88% ((2.54 wt% - 0.31wt%) / 2.54 wt%) mass transfer efficiency of ozone gas into solution. 4.3.4 Task 4: Documentation of Equipment Performance: Calculation of CT and
Inactivation of Cryptosporidium parvum The purpose of this task was to evaluate the Model PS 150’s ability to demonstrate inactivation of C. parvum within defined influent water quality specifications at a flow rate of 150 gpm. The performance of ozone disinfection systems for inactivation of G. lamblia and virus was assessed by determining the equipment’s CT capabilities and comparing field-measured CT values against CT values published by Malcolm Pirnie, Inc. and CWC-HDR, Inc. (1989) and as cited in the EPA Guidance Manual (1991). Because CT values for inactivation of C. parvum have not been established, viable oocysts were introduced into the feed stream and collected after ozonation and subjected to neonatal mice infectivity studies in order to verify equipment performance. 4.3.4.1 Influent Water Characteristics Minneapolis municipal drinking water served as the source water for this performance verification test. Prior to entry in the ozone system, residual free chlorine and chloramines were removed with granulated activated carbon (Calgon, Centar) and carbon fines removed with five µm bag filters (3M™ model 525). Influent water quality parameters are discussed in Section 4.3.3: Task 3 - Documentation Of Operating Conditions and Treatment Equipment Performance. Table 4-5 describes influent water quality characteristics during C. parvum seeding/collection runs. Table 4-5. Influent Water Characteristics During Challenge Testing
Challenge # Date pH *Water Flow Rate
(gpm) Water Pressure Inlet
(psig) Influent Water
Temp (°C) 1 12/5/99 7.74 164.4 12 6.2 2 12/6/99 7.74 164.4 16 6.2 3 12/6/99 7.74 164.4 16 6.2 4 12/6/99 8.12 165.5 13.5 5.8 5 12/6/99 8.12 164.4 14 5.4
Process Control 12/7/99 8.08 164.4 10 5.7 *Corrected to actual (Flow meter reading x 1.096 error factor) 4.3.4.2 Operational and Analytical Data Tables Tables 4-6 and 4-7 summarize the operating conditions during challenge testing, calculation of CT values and infectivity study results for C. parvum oocysts.
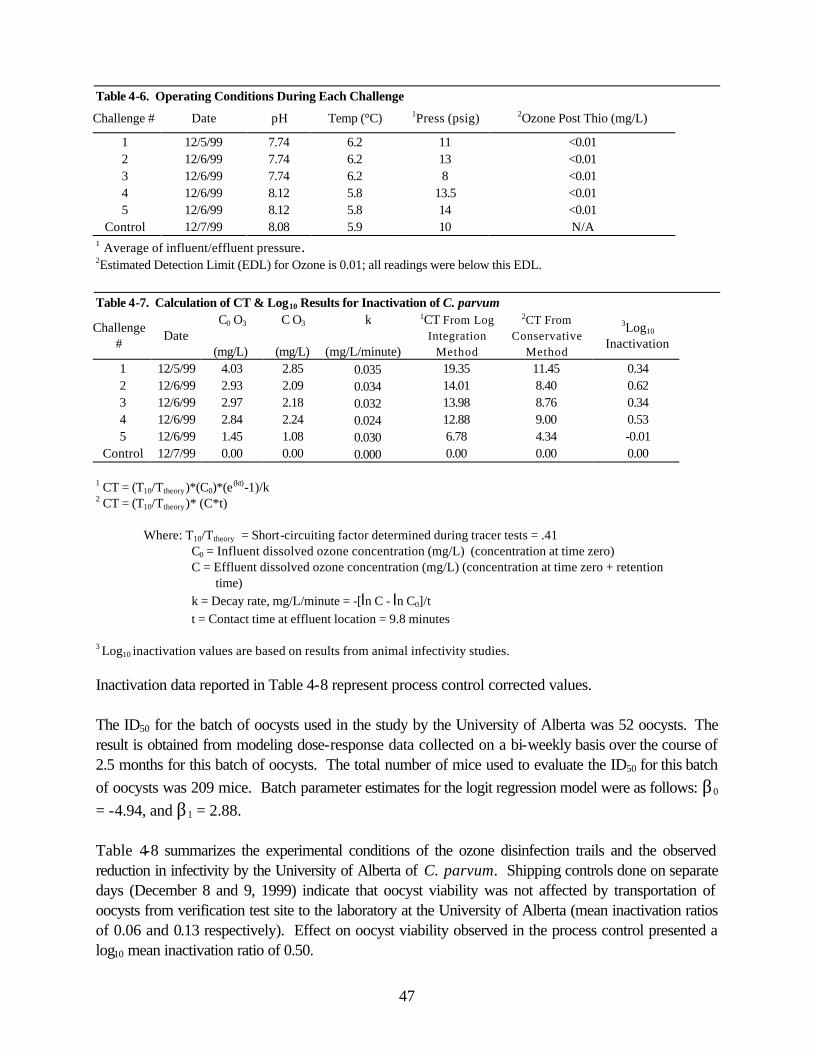
47
Table 4-6. Operating Conditions During Each Challenge
Challenge # Date pH Temp (°C) 1Press (psig) 2Ozone Post Thio (mg/L)
1 12/5/99 7.74 6.2 11 <0.01 2 12/6/99 7.74 6.2 13 <0.01 3 12/6/99 7.74 6.2 8 <0.01 4 12/6/99 8.12 5.8 13.5 <0.01 5 12/6/99 8.12 5.8 14 <0.01
Control 12/7/99 8.08 5.9 10 N/A 1 Average of influent/effluent pressure. 2Estimated Detection Limit (EDL) for Ozone is 0.01; all readings were below this EDL. Table 4-7. Calculation of CT & Log10 Results for Inactivation of C. parvum
Challenge #
Date C0 O3
(mg/L)
C O3
(mg/L)
k
(mg/L/minute)
1CT From Log Integration
Method
2CT From Conservative
Method
3Log10 Inactivation
1 12/5/99 4.03 2.85 0.035 19.35 11.45 0.34 2 12/6/99 2.93 2.09 0.034 14.01 8.40 0.62 3 12/6/99 2.97 2.18 0.032 13.98 8.76 0.34 4 12/6/99 2.84 2.24 0.024 12.88 9.00 0.53 5 12/6/99 1.45 1.08 0.030 6.78 4.34 -0.01
Control 12/7/99 0.00 0.00 0.000 0.00 0.00 0.00 1 CT = (T10/Ttheory)*(C0)*(e(kt)-1)/k 2 CT = (T10/Ttheory)* (C*t)
Where: T10/Ttheory = Short-circuiting factor determined during tracer tests = .41 C0 = Influent dissolved ozone concentration (mg/L) (concentration at time zero) C = Effluent dissolved ozone concentration (mg/L) (concentration at time zero + retention time)
k = Decay rate, mg/L/minute = -[ln C - ln C0]/t t = Contact time at effluent location = 9.8 minutes
3 Log10 inactivation values are based on results from animal infectivity studies.
Inactivation data reported in Table 4-8 represent process control corrected values. The ID50 for the batch of oocysts used in the study by the University of Alberta was 52 oocysts. The result is obtained from modeling dose-response data collected on a bi-weekly basis over the course of 2.5 months for this batch of oocysts. The total number of mice used to evaluate the ID50 for this batch of oocysts was 209 mice. Batch parameter estimates for the logit regression model were as follows: β0 = -4.94, and β1 = 2.88. Table 4-8 summarizes the experimental conditions of the ozone disinfection trails and the observed reduction in infectivity by the University of Alberta of C. parvum. Shipping controls done on separate days (December 8 and 9, 1999) indicate that oocyst viability was not affected by transportation of oocysts from verification test site to the laboratory at the University of Alberta (mean inactivation ratios of 0.06 and 0.13 respectively). Effect on oocyst viability observed in the process control presented a log10 mean inactivation ratio of 0.50.

48
Table 4-8 Summary of Inactivation Ratios of Oocysts (University of Alberta)
Sample Inoculum
(oocysts/mouse)
Infectivity results (#mice infected/#mice
innoculated)
Proportion Infected
Calculated Inactivation (log units)
Mean Inactivatio
n (log units)
Sample Inactivation Corrected to Process Control (log units)
25 1/10 0.1 0.45 0.29 - 50 2/10 0.2 0.47 100 6/10 0.6 0.14
In-house dose
response 200 8/10 0.8 0.10 1 50 0/5 0 >0.47 0.84 0.34 500 3/5 0.6 0.84 5,000 5/5 1 <1.5 50,000 5/5 1 500,000 5/5 1 2 50 0/5 0 >0.47 1.12 0.62 500 2/5 0.4 1.12 5,000 5/5 1 <1.5 50,000 5/5 1 500,000 5/5 1 3 50 0/5 0 >0.47 0.84 0.34 500 3/5 0.6 0.84 5,000 5/5 1 <1.5 50,000 5/5 1 500,000 5/5 1 4 50 1/5 0.2 0.47 1.03 0.53 500 2/5 0.4 1.12 5,000 4/5 0.8 1.5 50,000 5/5 1 <2.5 500,000 5/5 1 5 50 0/5 0 >0.47 0.49 -0.01 500 5/5 1 <0.50 5,000 5/5 1 50,000 5/5 1 500,000 5/5 1
25 1/5 0.2 0.16 0.06 - 50 3/5 0.6 -0.16 100 4/5 0.8 -0.20
Shipping Control (12/8/99)
200 3/5 0.6 0.44 25 1/5 0.2 0.16 0.13 - 50 2/5 0.4 0.12 100 3/5 0.6 0.14
Shipping Control (12/9/99)
200 4/5 0.8 0.10 50 1/5 0.2 0.47 0.50 - 100 3/5 0.6 0.14 200 3/5 0.6 0.44 400 4/5 0.8 0.41
Process Control
800 3/5 0.6 1.05
4.3.4.3 Discussion of Results Analysis of performance for inactivation of G. lamblia and Virus are based inactivation CT values presented in Tables 3-4 and 3-5. Performance data collected during the C. parvum seeding studies

49
were used to establish log10 reductions in order to have generated comparative results (Table 4-7). The minimum CT value established by these data is 3.92. Published CT values (Malcolm Pirnie, Inc. and CWC-HDR, Inc., 1989) required to achieve 3 and 4-log10 inactivation of G. lamblia and virus, respectively are 1.90 and 1.80 at a water temperature (worst case) of 5°C and pH between 6.0 and 9.0. The Model PS 150 is capable of achieving field-measured CT values comparable to published CT values that show inactivation of greater than 3 and 4-log10 respectively for G. lamblia and virus. Analysis of performance for inactivation of C. parvum is based on challenge testing with viable oocysts and neonatal mice infectivity analyses (refer to Table 4-8 above). While performance results for inactivation of C. parvum are significantly less than what can be expected for G. lamblia and virus based on published CT values, they reflect what can be reasonably expected given the CT values achieved during this test and water temperature (Finch et al., 2001). 4.4 Equipment Characteristics Results The qualitative, quantitative and cost factors of the tested equipment were identified during the verification period, in so far as possible. The results of these three factors are limited due to the short duration of the testing period (only 216 hours of ozone production). 4.4.1 Qualitative Factors Qualitative factors that were examined during verification testing were the susceptibility of the equipment to changes in environmental conditions, operational reliability, and equipment safety. 4.4.1.1 Susceptibility to Changes in Environmental Conditions Changes in environmental conditions can cause degradation in influent water quality that will have an impact on performance of the treatment system. This was not a concern during the course of this test because the finished drinking water supplied by the Minneapolis drinking water treatment plant was used as the source water. Further, the quality of this water was further refined with filtration through activated carbon and five µm filters. Accordingly, the influent water to the test equipment was of very high and consistent quality regardless of any change in environmental conditions. Other changes in environmental conditions that can impact the performance of ozone disinfection equipment include humidity, barometric pressure and temperature. Changes in humidity and barometric pressure may have effected the production of ozone gas and stability of dissolved ozone held in contacting systems. Because both feed gas to the ozone generator (oxygen) and water within the contactor were pressurized, changes in these conditions offered no relevance in this study. Temperature on the other hand could and did weigh heavily on the outcome of this study. More ozone is required to inactivate microorganisms in low water temperatures. The average temperature of the influent water during challenge testing was only 5.5°C. Temperature can also affect performance if an ozone disinfection system does not provide a cooling system for the ozone generation equipment. The Model PS 150 system is water-cooled and the ambient temperature did not exceed 60°F during this test.
50
4.4.1.2 Operational Reliability Ozonated water and especially ozone gas will oxidize most materials commonly used in the construction of water treatment equipment. Material incompatibility in the construction of an ozone disinfection system will quickly lead to system failure. Accordingly, materials compatibility is critical to the operational reliability of ozone disinfection systems. Every component exposed to ozonated water and gas within the Model PS 150 was meticulously inspected. It was verified that each was constructed of materials known to be compatible with ozone. A problematic design challenge, especially with ozone disinfection systems that utilize pressurized contacting systems is to assure that water (under pressure) will not flow through the ozone gas delivery valve back into the ozone generator. Such an occurrence will cause significant damage to the ozone generator and potentially to the air preparation equipment. The Model PS 150 addresses this problem with a design feature that incorporates an optical sensor and solenoid valve. If water enters the clear Teflon ozone gas delivery line, the optical sensor will detect it and close the solenoid valve, preventing water from flowing into the ozone generation equipment. This backflow prevention system was tested several times and proved to cease the flow of water instantaneously upon detection of the presence of any water droplets within the ozone delivery tubing. Unfortunately, once the solenoid valve closed, it did not open once the water droplets had been removed from the tubing. It was discovered with manipulation of the PLC, the valve would open, but not without manual intervention. Osmonics technicians agreed the current programming logic was cumbersome and changes will be made to resolve this system deficiency. During verification testing, ozone off-gas was not vented outside the location of installation. Because ozone can be detected by odor in very low concentrations (< 0.02 mg/L), any failure of destruct system would be known by the operators during the 216 continuous hours of verification testing. During this period, the operators did not detect any failure of the ozone off gas destruct system. The current long term maximum permissible exposure level to gaseous ozone allowed by the Occupational, Safety and Health Administration (OSHA) is 0.10 mg/L as a time-weighted average over eight hours, five days per week. OSHA's short-term limit is 0.3 mg/L over a 15-minute period. The Model PS 150 allows the operator to set (or change) the CT value achieved by the system through the controllers’ menu screen. Once the operator enters a CT value, the system automatically increases/decreases electrical power to the ozone generators to adjust the average dissolved ozone concentration in the process water. This feature did not function during the course of the performance verification period. Not withstanding, the operators changed CT values as calculated/displayed by the PS 150's microprocessor, by manipulating the electrical power (% of maximum) supplied to the ozone generator with the use of an auxiliary control panel. The format of the controllers’ menu screens was very comprehensive and easy to follow.

51
4.4.1.3 Evaluation of O&M Manual The O&M manual provided by the manufacturer primarily defined installation, operation and maintenance requirements for Osmonics Model PS 150. The manual provided information pertaining to basic installation, start-up, and operational process. A process schematic, trouble shooting guide, and associated O&M manuals for components used within the system were also provided. The O&M manual was reviewed for completeness and used during equipment installation, start-up, system operation, and trouble-shooting. It was found the manual provides adequate instruction for tasks required to perform these functions over the period of operation of the ETV test period. 4.4.1.4 Equipment Safety Evaluation of the safety of the treatment system was done by examination of the components of the system and identification of hazards associated with these components. A judgment as to the safety of the treatment system was made from these evaluations. 4.4.1.4.1 Electrical. High voltage electrical service connections, transformers and ozone generators were located within enclosures with electrical interlock access panels to ensure operator safety. 4.4.1.4.2 Ozone Gas. No ozone gas leaks were detected and the ozone off gas destruct system proved to be reliable during the performance verification period. 4.4.1.4.3 Pressurized Water Lines. All water lines were sufficient for the operating pressures experienced during the verification test period. 4.4.1.4.4 Pressurized Contact Tank. The contact tank is rated with a maximum operating pressure of 20 psi. It is highly recommended that a < 20 psi pressure relief-valve, rated at the maximum system flow (150 gpm), be added to this tank or into the plumbing system during installation. 4.4.2 Quantative Factors The Model PS 150 required a 230/60 single-phase 40-amp service connection. An electrical power meter was provided and installed by the University of Minnesota Hydraulic Laboratory. The power consumption of the treatment system was determined by reading a dedicated electric meter. Power consumption during the verification period totaled 699 kW hours and represented the total cost of operation. During the 216 hours of continuous operation the Model PS 150 system treated 1.944 million gallons of water resulting in an average power requirement of 359.57 kW hours per 1 million gallons treated.
52
4.5 QA/QC Results The objective of this task is to assure the high quality and integrity of all measurements of operational and water quality parameters during the ETV project. QA/QC verifications were recorded in the laboratory logbooks or spreadsheets. QA/QC documentation and calibration certifications are attached to this report as Appendix H. 4.5.1 Data Correctness Data correctness refers to data quality, for which there are four indicators: • Representativeness • Statistical Uncertainty • Accuracy • Precision Calculation of all of the above data quality indicators were outlined in the Chapter 3, Methods & Procedures. All water quality samples were collected according to the sampling procedures specified by the EPA/NSF ETV protocols, which ensured the representativeness of the samples. 4.5.1.1 Representativeness Operational parameters discussions are included under Task 3 – Documentation of Operations Conditions and Treatment Equipment Performance. Individual operational parameters, such as flow rate, turbidity data, and testing equipment verification are presented below in discussions on Daily, One-Time and Start of Testing Period QA/QC Results. 4.5.1.2 Statistical Uncertainty Ninety-five percent confidence intervals were calculated for the operating parameters of the Osmonics Model PS 150. These include water flow rates, water pressure, water temperature, ozone gas concentrations, and ozone feed gas data as discussed in Task 3 – Documentation of Operations Conditions and Treatment Equipment Performance. Ninety-five percent confidence intervals were also presented in the water samples summary tables in the discussion of Task 2 – Influent and Effluent Water Quality Characterization. 4.5.1.3 Accuracy For this ETV study, the accuracy refers to the difference between the sample result, and the true or reference value. Calculations of data accuracy were made to ensure the accuracy of the testing equipment in this study. Accuracy of parameters, and testing equipment verification are presented below in discussions on Daily, One-Time and Start of Testing Period QA/QC Results.
53
4.5.1.4 Precision Precision is a measure of the degree of consistency from test to test, and can be measured by replication. For on-site single reading parameters, such as pressure, pH and flow rates, precision was ensured by calibration of analytical equipment and redundant readings from operator to operator. Calibration procedures and results are presented in QA/QC Results. 4.5.2 Daily QA/QC Results The pH meter was calibrated daily against NIST-traceable pH buffers at 7.01"0.01 and 10.01"0.01. The pH meter was a Cole Palmer Oakton® WD-35615 Series. The pH calibration buffers were Oakton pH Singles 7.01"0.01 (model #35653-02), and pH Singles 10.01"0.01 (model #35653-03). The pH calibration was performed prior to the recorded inlet pH measurement. pH meters were calibrated to standards previous to each pH measurement to ensure accuracy of measurement. The water temperature was recorded daily with a NIST-traceable Miller Weber Thermometer, Model T-775/63CGC (certificate of calibration in Appendix I). The influent temperature averaged 5.5°C. The maximum influent temperature recorded during the testing period was 6.5°C, the minimum was 4.7°C. The effluent water temperature average was 5.6ºC. The maximum effluent temperature recorded was 6.5ºC, and the minimum effluent temperature was 4.6ºC. Free chlorine residual within the feed water to the ozone system was measured daily with a HACH Spectrophotometer (model 2120) using the HACH Indigo AccuVac ampules. Free Chlorine averaged 0.01 mg/L during the verification testing period. A maximum free chlorine reading was recorded at 0.05, and a minimum of -0.01 was recorded. All recorded measurements were near or beyond (denoted as negative values) the detection limits of the spectrophotometer. 4.5.3 One-Time QA/QC Verification Results The bench-top turbidimeter, a HACH 2100P, was calibrated at the beginning of the verification test, following the microbial challenge, and weekly thereafter as required by the Test Plan. COA performed calibration procedures on the bench-top, Hach 2100P turbidimeter. The instrument was calibrated to the manufacturer's recommended standards of 20, 100 and 800 NTU with fresh Formazin suspensions. Standards were made with dilutions from a standard Formazin suspension of 4,000 NTU. NIST-traceable glassware, including pipettes and volumetric flasks were used. The manufacturer explains that since the response signal is linear from 0-20 NTU, efforts to standardize to lower levels are fruitless and may instead throw the readings off. Calibration standards are further required to be at least 65 NTU apart. In addition, weighting the curve to the range of interest (in this case at levels less than 5 NTU) also provides the opportunity for increasing error. The manufacturer's recommended settings were also observed in subsequent calibrations. Fixed Gelex secondary standards were calibrated to the instrument following manufacturers instructions following calibration with Formazin standards. This is done each time the instrument is calibrated with

54
Formazin suspensions thereby standardizing the Gelex cells to that instrument for that period. When the instrument is recalibrated, the Gelex cells are also recalibrated. Additional secondary standards of 0.1, 0.5, 1 and 3 NTU were prepared from fresh Formazin stock, or purchased as a standard from Hach. These standards were referenced daily. While the comparison of the readings to the standards at 0.5, 1 and 3 NTU were relatively stable, the reference of 0.1 NTU was somewhat ambiguous as it is at or near the limit of detection for this instrument. The average influent turbidity reading from the Hach 2100P benchtop turbidimeter was 0.14 NTU. The maximum recorded influent turbidity during the testing period was 0.31 NTU, with a minimum influent of 0.08 NTU. The average effluent turbidity was 0.14 NTU. The maximum recorded effluent 0.26 NTU, and the minimum effluent of 0.08. 4.5.4 Results Of QA/QC Verifications At The Start Of Testing Period The gas pressure gauge was verified on December 13, 1999 by comparing the pressure shown on the gauge with the pressure shown on a NIST-traceable pressure gauge (Identification Number 9286-11). The inlet gauge had a reading of 14.9 psig, while the corresponding NIST-traceable gauge had a reading of 14.8 psig. The gas inlet temperature was also verified with a NIST-traceable temperature gauge, the gas inlet had a reading of 52.4°F, and the corresponding NIST-traceable reading was 52°F. Differences between the gauges were acceptable, and no further verification was needed. The water inlet gauge was verified on December 13, 1999 by comparing the pressure shown on the gauge with the pressure shown on a NIST-traceable pressure gauge (Identification Number 9286-11). The inlet gauge had a reading of 11.0 psig, the corresponding NIST-traceable gauge had a reading of 11.0 psig. The outlet gauge had a reading of 8.0, the NIST-traceable gauge had a reading of 8.0 psig. The water inlet temperature was verified with a NIST-traceable temperature gauge, the gas inlet had a reading of 5.1°C, and the corresponding NIST-traceable reading was 5.1°C. Differences between the gauges were acceptable, and no further verification was needed. The tubing and all water lines used on the treatment system were inspected at the beginning of the testing period (December 4, 1999). The tubing and lines were checked periodically throughout the testing period. They remained in good condition and replacements were not necessary. Rosemont Series 8700 flow meter accuracy was verified at 144.8 gpm volumetrically against time (Appendix H). The actual measured flow rate was 158.7 gpm. Therefore, the Rosemont flow meter understated actual flow rate by 9.6%. In-line dissolved ozone sensors with monitors (Orbisphere Model numbers 313 (sensor) and 26506 (monitor)) were installed and pre-calibrated according to specific instructions provided by Orbisphere. Additional verifications of calibration were performed using a Spectrophotometer (HACH model 2120) in conjunction with HACH Indigo AccuVac reagent ampules. During initial operations, dissolved ozone measurements using the HACH Indigo method produced inconsistent results, given consistent source water quality and ozone dose.

55
Accordingly, previous to the beginning of the ETV performance verification period, the FTO re-verified the Orbisphere sensors/monitors were calibrated in accordance with the “Air Calibration Method” described within the Orbisphere O&M manual. The sensors were not removed and reinstalled daily to verify proper installation of the previous day’s verification of the same as suggested in the ETV test plan. This practice would result in an increased probability of improper re-installation and air becoming entrapped in, and around, the sensor membrane. Rather, sensor-operating characteristics as defined within the Orbisphere O&M manual were observed to evaluate sensor performance and if the sensors required service. Both methods were performed throughout the verification period. The Orbisphere monitors/sensors produced repeatable results while ozone dose was held at a constant level. Conversely, the HACH Indigo/Spectrophotometer method did not demonstrate the same repeatability. In order to evaluate if greater reliability could be achieved by changing reagents, two ozone reagents were used (HACH AccuVac Ozone Reagent 0-0.75 mg/L O3 and HACH AccuVac Ozone Reagent 0-1.5 mg/L O3). Each of the five tests were conducted over an average of a two-hour period. Refer to Table 4-10. Table 4-9. Indigo/Spectrophotometer versus Orbisphere Readings
Number of Samples Tested Indigo/ Spectrophotometer Reading
Standard Deviation
Orbisphere Reading
Standard Deviation
AccuVac Ozone Reagent 0-0.75 mg/L O3 Average of 12 samples 0.53 0.07 0.42 0.01 Average of 16 samples 0.65 0.12 0.75 0.01 Average of 9 samples 0.43 0.05 0.34 0.00
AccuVac Ozone Reagent 0-1.5 mg/L O3 Average of 12 samples 0.83 0.15 1.06 0.00 Average of 10 samples 0.77 0.28 1.70 0.02
A Certificate of Calibration, dated November 29, 1999 was provided by the equipment manufacturer (IN USA), for the ozone gas monitor, model number H1-S (serial number 991275). The certificate is provided in Appendix I. The FTO experienced difficulties in meeting the requirement that the ozone gas monitor employed for measurement of gaseous ozone concentration be verified against wet chemistry Iodometric analysis. The ETV Test Plan specified the method as Rakness et al. 1996, as published in Ozone Science and Technology 18(3) p209 ff. COA obtained a copy of that document and employed the University of Minnesota, SAFHL to perform this verification. A review of that document by the FTO and SAFHL called attention to certain requirements. Among those is the requirement that the ozone gas monitor and the wet-chemistry test be in agreement by 2% or better as noted in the following paragraph:
"Ozone concentration may be determined by using the iodometric wet-chemistry method as a means of confirming the trustworthiness of the installed ozone gas monitors. It is important to note, however, that the UV (ozone gas) monitor reading be established independently of

56
the wet-chemistry result. Monitor temperature, pressure, and gas composition adjustments shall be determined using the procedure discussed in the preceding section. The wet-chemistry test result should be utilized only as an independent comparison of ozone gas monitor results. If the comparative ozone concentration exceeds ±2%, then this provides a clue that something is wrong with the ozone gas monitor installation or with the wet-chemistry test procedure. Both the ozone gas and wet-chemistry test procedures should then be re-evaluated to ensure they are being performed correctly. The meter may be repaired or replaced if it is not functioning properly." (Underlining and italics in the original).
Thus, SAFHL, in performing the tests, used 2% as one benchmark. SAFHL personnel attempted to perform the test repeatedly with limited success; these trials were used to refine the method, and to review calculations associated with the method. A wet test meter as specified within the cited paper was not used, rather SAFHL employed procedures that would be used to verify calibration of wet test meters themselves. Specifically, a water manometer to measure pressure, a rotometer calibrated by weight to measure flow and a NIST traceable thermometer to measure temperature. The apparatus was setup as indicated in the cited paper with the ozone stream taken from the generator at a “T”, and then again at a second “T” to split between the wet-test apparatus and the ozone gas monitor. Initial test results showed a discrepancy between the meter and the wet-test that exceeded the 2% limit. Accordingly, SAFHL attempted to resolve the procedure by again examining all reagents and by reviewing all calculations and calibrations. Following a series of trials the FTO contracted with professional consultants with significant experience with wet test chemistry for measurement of ozone gas concentration. The objective was to verify SAFHL had adhered to procedures required to secure accurate results while employing this wet test method. Their procedure was reviewed at the test site and it was concluded procedural errors had not been made by SAFHL. During this review process, it was discovered that the calculation of normality, a critical index, was incorrect in the cited paper, along with a specified reagent. An additional series of nine trials produced a correspondence of 3%, which while beyond the 2% suggested in the cited paper, was well within other documented expectations. Specifically, these tests produced an average measurement of 9.70 g/m3 with a 95% confidence interval of + 0.26 g/m3. Corresponding monitor readings produced an average of 9.55 g/m3 with a 95% confidence interval of + 0.33 g/m3. These data suggest the on-line ozone gas monitor understated actual ozone concentration by 0.15 g/m3. Data shown in Table 4-11 was collected using the average of two sodium thiosulphate normality methodologies (0.094 & 0.120) of cited paper and the International Ozone Association wet test methodology paper (IOA, 1987). The normality used was the 0.107N. IN USA meters have not been corrected.

57
Table 4-10. Summary Table of the Wet Tests 1(36-44) with Osmonics Model PS 150
Test Wet Test Titration
(N=0.107) (g/m3)
IN USA UV Adsorption
(g/m3)
% difference
(g/m3) 36 10.30 10.14 -1.52 37 10.40 10.41 0.05 38 9.43 9.34 -0.97 39 9.62 9.39 -2.36 40 9.49 9.33 -1.74 41 9.47 9.30 -1.79 42 9.23 9.15 -0.88 43 9.74 9.45 -2.97 44 9.64 9.43 -2.18
Average 9.70 9.55 -1.60 Minimum 9.23 9.15 -2.97 Maximum 10.40 10.41 0.05 Std Dev 0.40 0.43 0.90 95% Int. Confid. (9.44, 9.96) (9.27, 9.83) (-2.18, -1.01) 1 Due to difficulties experienced with the wet test method, as previously described, attempts continued beyond the ETV verification test period. Data used to generate Table 4-11 (test numbers 36 through 44) were recorded during May of 2000.
The ozone gas monitor employing UV adsorption technology is accepted as the better means of establishing ozone concentration in air or process gas while the iodometric method has severe limitations. Some of these limitations are discussed in an AWWARF Report, but to summarize, they include the effect of the formation of nitrogen oxides and the variance between the use of KI, NBKI and weakly buffered NBKIc. The report concludes: "When defined procedural checks are used . . . (this) . . .method may be useful as an independent check of an ozone gas monitor such as within ± 3 to 5 percent. However, the evidence that even microscopic details of the sample bubble passing through the reagent solution can effect the determination makes the iodometric determination of ozone not an ideal candidate as a standard method for ozone determination.” (Wood, D. et al. 1989, The Factors Influencing the Potassium Iodide and the Neutral Buffered Potassium Iodide Methods for the Determination of Ozone. Journal AWWA 81:6:72). Methods have been standardized for measurement of low concentrations of ozone, but not for the high levels encountered in this application. It should be noted however, that the purpose of gaseous ozone concentration measurements in this case is to assist in the calculation of mass transfer efficiency of ozone and into the source water. Since the ozone generator is controlled by a PLC that varies the applied electric power (and resultant concentration of ozone) in accordance with the measured demand of the water, the mass transfer issue is of lesser importance; in fact, it may represent only academic interest. 4.5.5 Analytical Laboratory QA/QC QA/QC procedures for laboratory analyses were based on SM, 19th Ed. (APHA, 1995) and Methods for Chemical Analysis of Water and Wastes (EPA, 1995).

58
Calibration results of the analytical instrumentation used to conduct the analyses on effluent water is recorded and kept on file at Spectrum Labs, Inc. QA/QC procedures and documentation pertinent to this verification test are on file at Spectrum Laboratories, and Cartwright, Olsen & Associates, LLC. All laboratory QA/QC procedures and controls were adequate to render the data acceptable. Calibration results of the analytical instrumentation used to conduct the animal infectivity studies are kept on file at University of Alberta, and COA. QA/QC procedures and documentation pertinent to infectivity studies are on file at the University of Alberta, Spectrum Labs, Inc., and COA.
59
Chapter 5 References
American Public Health Association, American Water Works Association, Water Environmental Federation, Standard Methods for the Examination of Water and Wastewater, 19th Edition, APHA, AWWA, WEF, Washington D.C., 1995. American Water Works Association, Guidance Manual for Compliance with the Filtration and Disinfection Requirements for Public Water Systems Using Surface Water Sources, AWWA, Denver, Colorado, 1991. Belosevic, M., R.A. Guy, R. Taghi-Kilani, N.F. Neumann, L.L. Gyurek, L.R.J. Liyange, P.J. Millard, and G.R. Finch. Nucleic acid stains as indicators of Cryptosporidium parvum oocysts viability. International Journal of Parasitology 27 (7): 787-798 (1997). DuPont, Herbert L, M.D., Cynthis L. Chappel, Ph.D., Charles R Sterling, Ph.D., Pablo C. Okhuysen, M.D., Joan B. Rose, Ph.D., and Walter Jakubowski. The Infectivity of Cryptosporidium parvum in Healthy Volunteers, New England Journal of Medicine 332 (13): 855-859 (1995). Finch, Gordon R., C.W. Daniels, E.K. Black F.W. Schaefer III and M. Belosevic. Dose Response of Cryptosporidium parvum in Outbred Neonatal CD-1 Mice. Applied and Environmental Microbiology 59 (11): 3661-3665 (1993). Finch, G.R., E.K. Black, Lyndon Gyürèk and M. Belosevic. Ozone Disinfection of Giardia and Cryptosporidium. AWWA 3P-2C-90661-9/95-CM (1994). Finch, G.R., Li, Hanbin, Inactivation of Cryptosporidium at 1°C Using Ozone or Chlorine Dioxide, Ozone Science and Engineering, Vol 21. pp 477-486, 1999. Finch, G.R., Haas, C.N., Oppenheimer, J.A., Gordon, G. and Trussell, R.R. Design Criteria for Inactivation of Cryptosporidium by Ozone in Drinking Water, Ozone Science and Engineering, Vol 23. pp 259-284, 2001. Frey, M.N. et.al., “A Synthesis Report of Cryptosporidium.” Paper presented at the American Water Works Association Annual Conference Presentation, Atlanta, Georgia, June 18, 1997. International Ozone Association, Iodometric Methods For The Determination Of Ozone In A Process Gas, Standardization Committee – Europe, 001/87(F). Kiminski, J.C. Correspondence in New England Journal of Medicine 331 (22): 1529-1530, (1994).
60
Korich, D.G., J.R. Mead, M.S. Madore, N.A. Sinclair and C.R. Sterling. Effects of Ozone, Chlorine Dioxide, Chlorine and Monochlorimine on Cryptosporidium parvum Oocyst Viability, Applied and Environmental Microbiology 56 (5): 1423-1428 (1990). LeChevallier, M.W., William D. Norton and Ramon G. Lee. Giardia and Cryptosporidium spp. in Surface Water Supplies, Applied and Environmental Microbiology 57 (9): 2610-2616 (1991). LeChevallier, M.W., William D. Norton and Ramon G. Lee. Giardia and Cryptosporidium spp. in Filtered Drinking Water Supplies, Applied and Environmental Microbiology 57 (9): 2617-2621 (1991). Li, Sylvana Y. et.al. Reliability of surrogates for determining Cryptosporidium removal, Journal AWWA, Vol. 89, No. 5, May 1997, pp 90-99. MacKenzie, W.R. et al. A Massive Outbreak in Milwaukee of Cryptosporidium Infection Transmitted through the Public Water Supply. New England Journal of Medicine 331 (3): 161-167 (1994). Malcolm Pirnie, Inc. and CWC-HDR, Inc. (1989). Guidance Manual For Compliance With The Filtration and Disinfection Requirements For Public Water Systems Using Surface Water Sources, for the Environmental Protection Agency, Science and Technology Branch, Office of Drinking Water, Washington, D.C., Contract No. 68-01-6989. Rakness, K. Gordon G., Langlais, G. Masschelein, W., Matsumoto, N., Richard, Y., Robson, C.M. and Somiya I (1996) "Guidance for Measurement of Ozone Concentration in the Process Gas from an Ozone Generator". Ozone: Science & Engineering 18(3):209-229. Rennecker, Jason L., Benito J. Marinas, James H. Owens and Eugene W. Rice, Inactivation of Cryptosporidium parvum oocysts with ozone, Water Research, Vol.33 No. 11, pp 2481-2488, 1999. U.S. Environmental Protection Agency/NSF International. ETV Protocol: Protocol for Equipment Verification Testing of Microbiological Contaminant Inactivation by Packaged and/or Modular Drinking Water Treatment Systems for Small Public or Private Water Supplies, EPA/NSF, Draft of February 20, 1998. U.S. Environmental Protection Agency/NSF International. EPA Test Plan:, Chapter 2, NSF Equipment Verification Testing Plan For Ozone And Advanced Oxidation Processes For Inactivation Of Microbiological Contaminants, EPA/NSF, Draft of February 20, 1998. U.S. Environmental Protection Agency, Office of Drinking Water, Guidance Manual for Compliance with the Filtration and Disinfection Requirements for Public Water System Using Surface Water Sources, EPA No. 68-1-6989, U.S. EPA, Washington, D.C., March 1991b.
61
U.S. Environmental Protection Agency, Method 1622: Cryptosporidium in Water by Filtration/IMS/FA. Office of Water. Washington, DC. EPA 821-R-97-023, (1998). U.S. Environmental Protection Agency, Method 1623: Cryptosporidium in Water by Filtration/IMS/FA. Office of Water. Washington, DC. EPA 821-R-99-023, (1999) “U.S. Geological Survey National Water-Quality Assessment Program” Upper Mississippi River Basin Study Unit, July 12, 1997, http:/www.cr.usgs.gov/umis/descrip.html, (November 10, 1999). Watanabe, M.E. New Cryptosporidium Testing Methods, Environmental Science and Technology. 30 (12): 532A-535A (1996). Water Quality Association, Ozone for Point-of-Use, Point-of-Entry, and Small Water System Water Treatment Applications, A Reference Manual, WQA, 1997. Wolfe, R.L. Ultraviolet disinfection of potable water, Environmental Science Technology 24 (6): 768-773 (1990).


![Research Article EVALUATION OF ANTI-INFLAMMATORY … · Percentage inhibition= [(absorbance of blank – absorbance of sample)/(absorbance of blank)]×100 1 In-vitro anti-inflammatory](https://static.fdocuments.in/doc/165x107/5e832a1607bd17145979ab05/research-article-evaluation-of-anti-inflammatory-percentage-inhibition-absorbance.jpg)


