Environmental Science Unit 3 – Air Pollution (STE 7th ed. Chapter 12)
105
Environmental Science Unit 3 – Air Pollution (STE 7th ed. Chapter 12)
-
Upload
roland-simon -
Category
Documents
-
view
225 -
download
1
Transcript of Environmental Science Unit 3 – Air Pollution (STE 7th ed. Chapter 12)
Environmental Science
Unit 3 – Air Pollution(STE 7th ed. Chapter 12)

Where are we going?
1. Air Pollution– Sources– Smog: Photochemical and industrial
2. Acid Deposition– Sources– Ecological Effects
3. Indoor Air Pollution– Sources– Health Effects
4. Health Effects of Gaseous and Particulate Pollutants
5. Preventing and Controlling Air Pollution– Laws – Trends– Technology

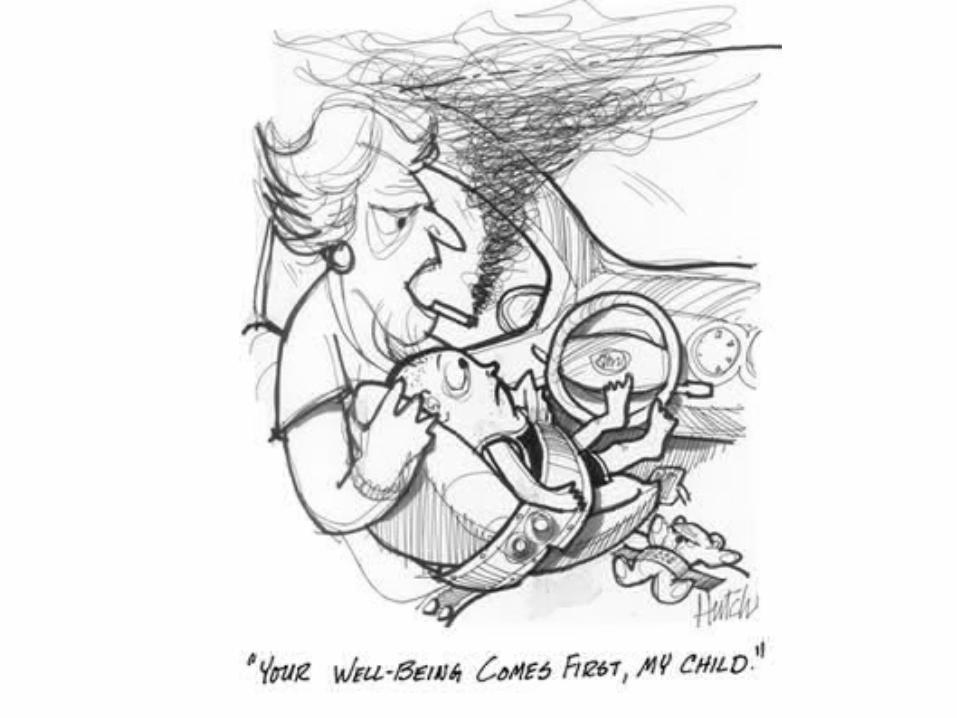
Cartoon

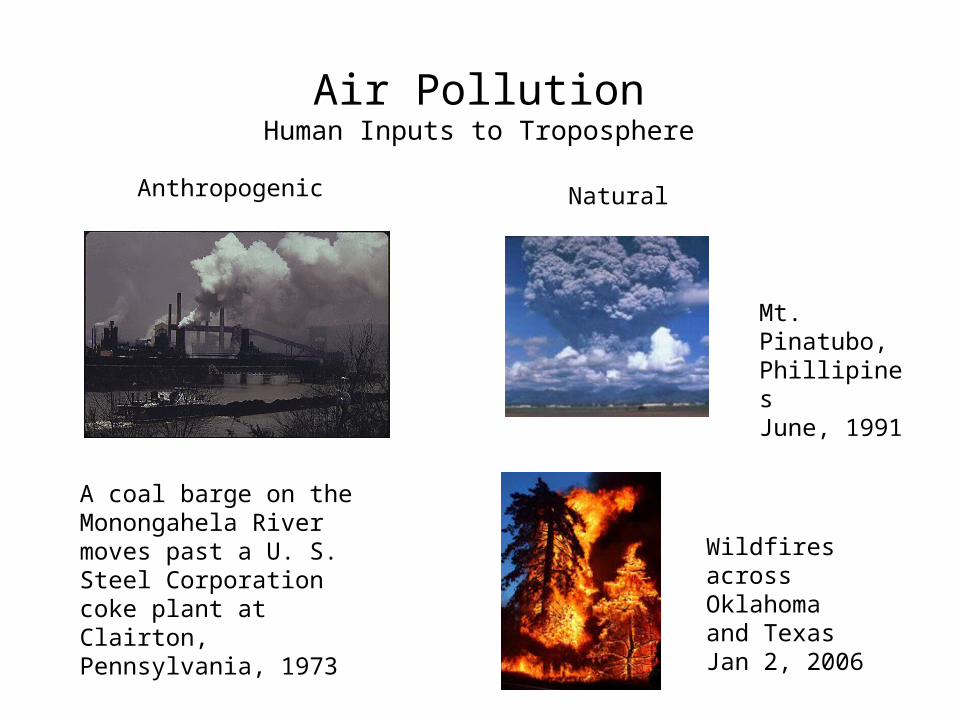
Air PollutionHuman Inputs to Troposphere
• modify Earth's gaseous nutrient cycles
• N & S compounds released by burning fossil fuels
• CO2 & other greenhouse
gases from burning fossil fuels & clearing forests
Air PollutionHuman Inputs to Troposphere
Anthropogenic vs. Natural Sources
A coal barge on the Monongahela River moves past a U. S. Steel Corporation coke plant at Clairton, Pennsylvania, 1973
Anthropogenic Natural
Wildfires across Oklahoma and TexasJan 2, 2006
Mt. Pinatubo, PhillipinesJune, 1991


Air PollutionSources
Anthropogenic sources:
fossil fuels (stationary source)
motor vehicles (mobile sources)
Natural:
Volcanoes
Forest Fires
Vegetation
Oceans
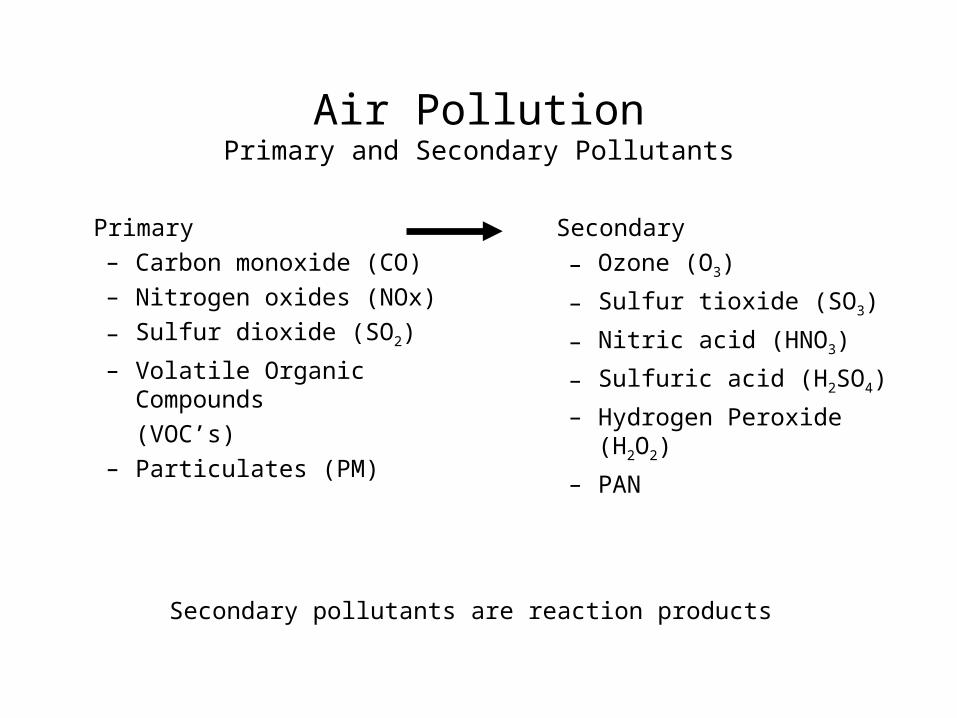
Air PollutionPrimary and Secondary Pollutants
Primary
– Carbon monoxide (CO)
– Nitrogen oxides (NOx)
– Sulfur dioxide (SO2)
– Volatile Organic Compounds
(VOC’s)
– Particulates (PM)
Secondary
– Ozone (O3)
– Sulfur tioxide (SO3)
– Nitric acid (HNO3)
– Sulfuric acid (H2SO4)
– Hydrogen Peroxide (H2O2)
– PAN
Secondary pollutants are reaction products

Air PollutionParticulate Matter

Air PollutionParticulate Matter
DLS PM Movie

Sources
Source: EPA National Emissions Inventory (NEI) Air Pollutant Emissions Trends Data
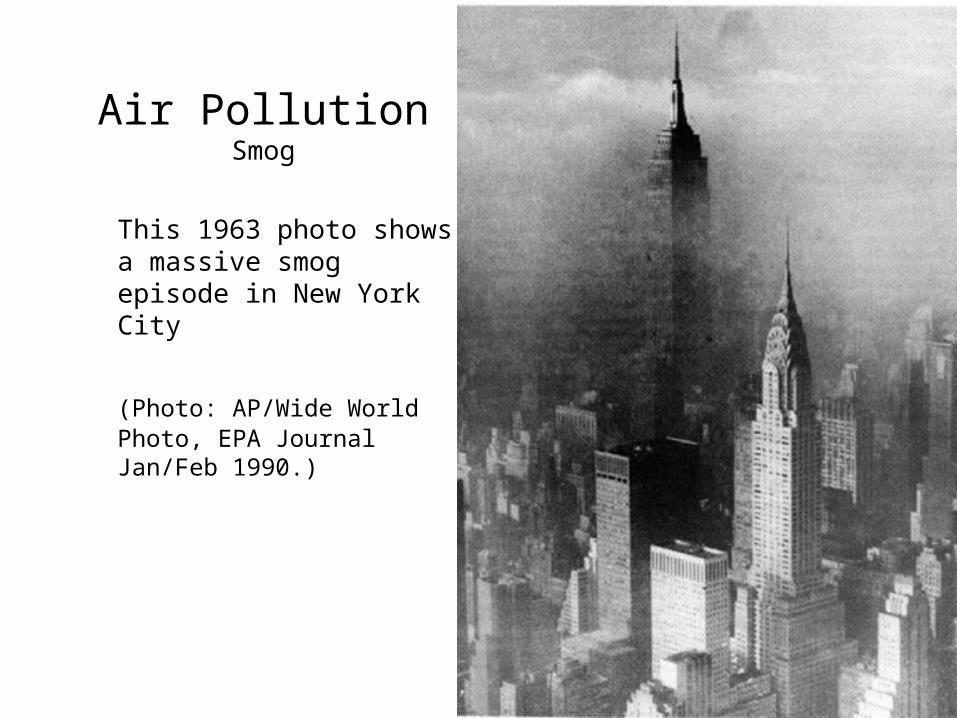
Air PollutionSmog
This 1963 photo shows a massive smog episode in New York City
(Photo: AP/Wide World Photo, EPA Journal Jan/Feb 1990.)

Air PollutionLondon Smog 1952
CNN 2004

Air PollutionLondon Smog 1952
• Smog = smoke + fog• Over 4,000 deaths were
attributable to the Great London Smog of December 1952
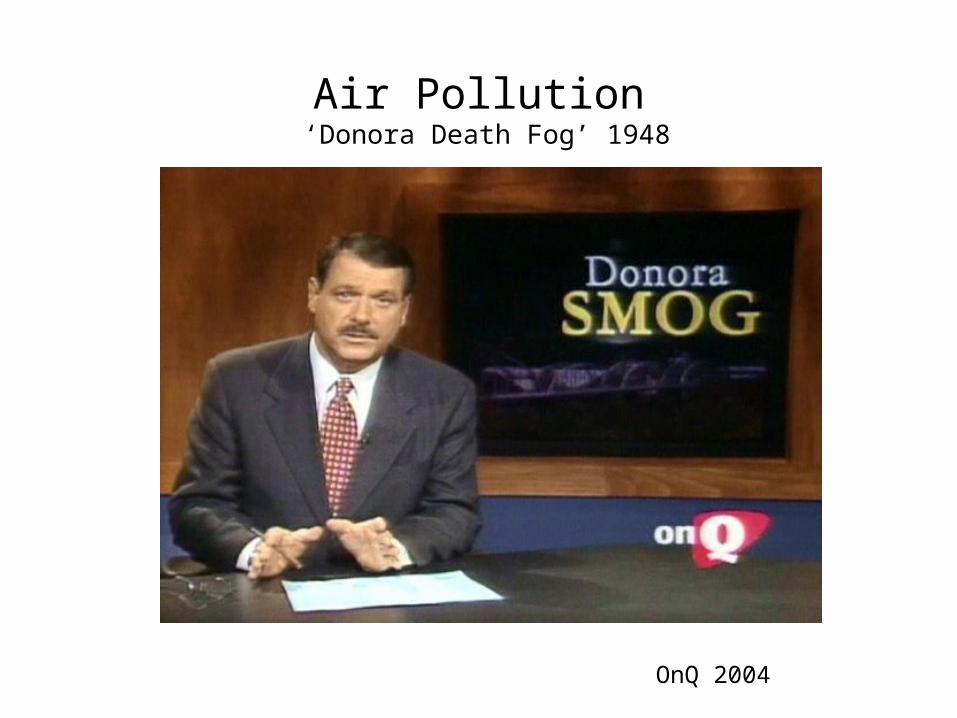
Air Pollution ‘Donora Death Fog’ 1948
OnQ 2004

Air Pollution‘Donora Death Fog’ 1948
• SE of Pittsburgh, surrounded by mountains in the Monongahela valley (subject to frequent thermal inversions)
• An inversion trapped pollutants for 5 days from:
– Steel mill, zinc smelter, sulfuric acid plant
• Results: 7,000 of 14,000 inhabitants fell ill, 20 died

Question
• Why has the incidence of smog moved from winter to summer?
Photochemical Smog

Photochemical Smog
NASA October 2000

Air PollutionPhotochemical Smog
NOx + VOCs → O3
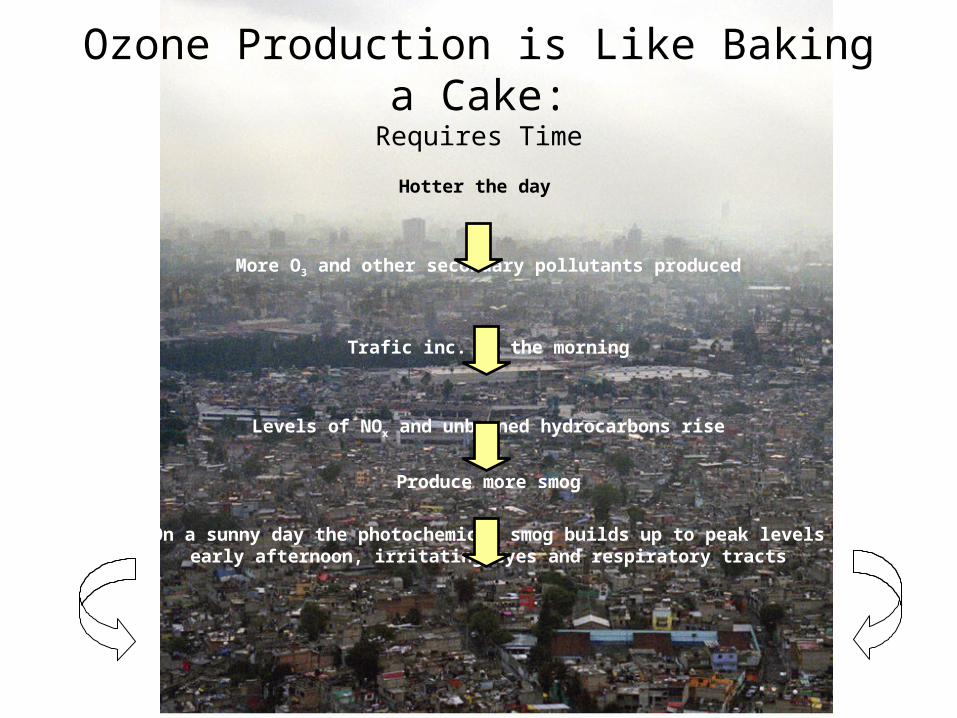
Ozone Production is Like Baking a Cake:Requires Time
Hotter the day
More O3 and other secondary pollutants produced
Trafic inc. in the morning
Levels of NOx and unburned hydrocarbons rise
Produce more smog
On a sunny day the photochemical smog builds up to peak levels early afternoon, irritating eyes and respiratory tracts
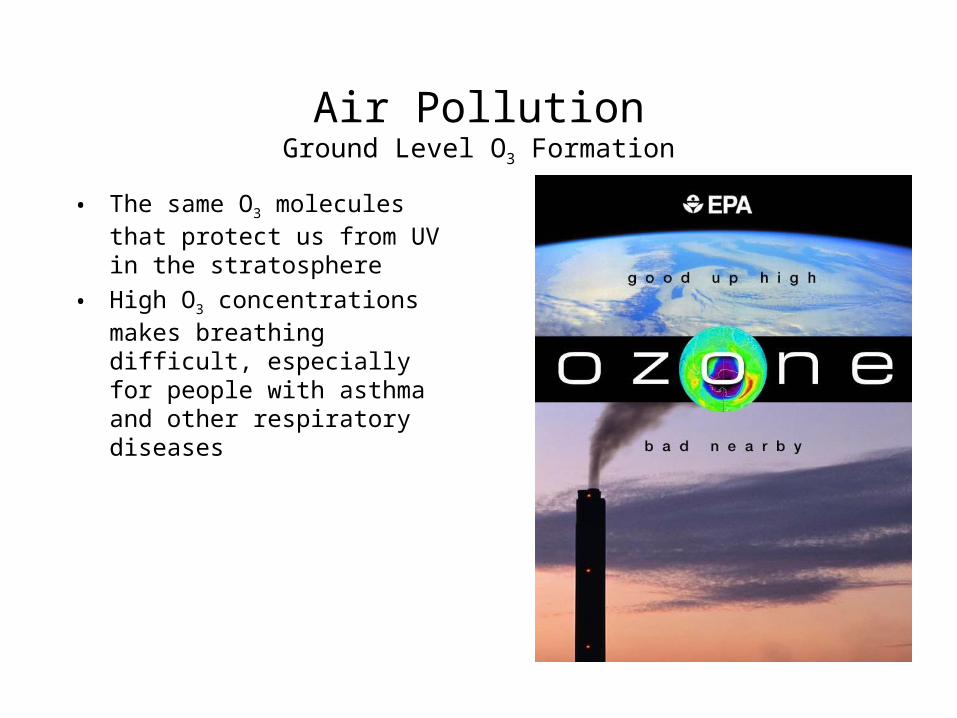
Air PollutionGround Level O3 Formation
• The same O3 molecules that protect us from UV in the stratosphere
• High O3 concentrations makes breathing difficult, especially for people with asthma and other respiratory diseases

Air PollutionOther Smog Types
• Industrial Smog– Sulfur dioxide– Sulfuric acid dropets – Particulates
• Sulfur compounds in coal an oil react with oxygen to form sulfur dioxide:
S + O2 SO2

Air PollutionFactors Affecting Severity
• Weather and topography, population, industry, types of fuel used
• Hills, valleys and buildings restrict air flow and allow pollutants to build up at ground level
• Concentration levels:
– Higher emission rate, higher the concentration
– Higher the wind speed the lower the concentration
– Lower the inversion height the higher the concentration

Question
Why do we have exceedences of CO in the winter evenings?
Why do we have exceedences of PM in the winter evenings?
Why do we have exceedences of O3 during summertime downwind of source regions?
Calm winds, temperature inversion
Wood burning fireplaces major source
Calm winds, temperature inversion
Sunshine, higher temperatures
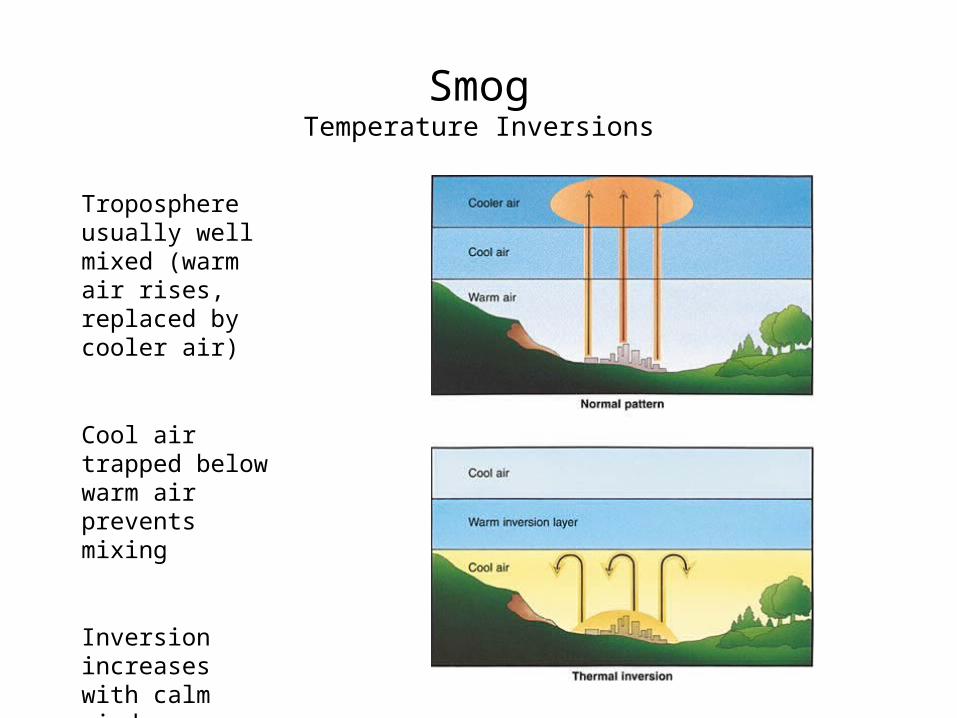
SmogTemperature Inversions
Troposphere usually well mixed (warm air rises, replaced by cooler air)
Cool air trapped below warm air prevents mixing
Inversion increases with calm winds

Demo
• Inversion Chamber movie
• Explain how the inversion chamber models an atmospheric thermal inversion
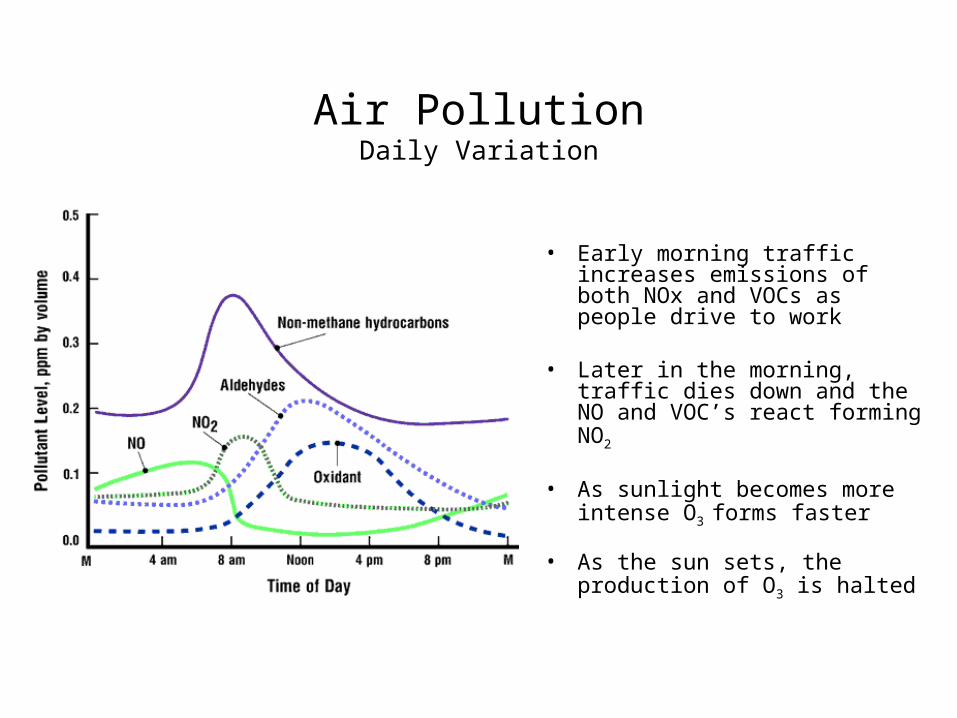
Air PollutionDaily Variation
• Early morning traffic increases emissions of both NOx and VOCs as people drive to work
• Later in the morning, traffic dies down and the NO and VOC’s react forming NO2
• As sunlight becomes more intense O3 forms faster
• As the sun sets, the production of O3 is halted

Air PollutionState of the Air
CNN 2003


Acid Rain

Movies – Acid Rain
Acid Rain: New Bad NewsThe debate over acid rain continues to grow. NOVA travels to West Germany, the mid-Atlantic states and New England to examine the controversy surrounding this phenomenon.Original broadcast date: 12/11/84 Topic: environment/ecology
HORIZON: A Killing RainAcid rain was one aspect of environmental pollution high on the green agenda of the 1980s. Looking at the evidence from northern europe, this programme examines the background to the spread and recognition of this deadly environmental poison.50 minutes. 1982.
FHS – Acid Rain

Acid DepositionAcid Rain Blamed on Power Companies
CNN 2000

Acid Deposition
Results from technological fix of one problem
(local air pollution)
What was the fix?
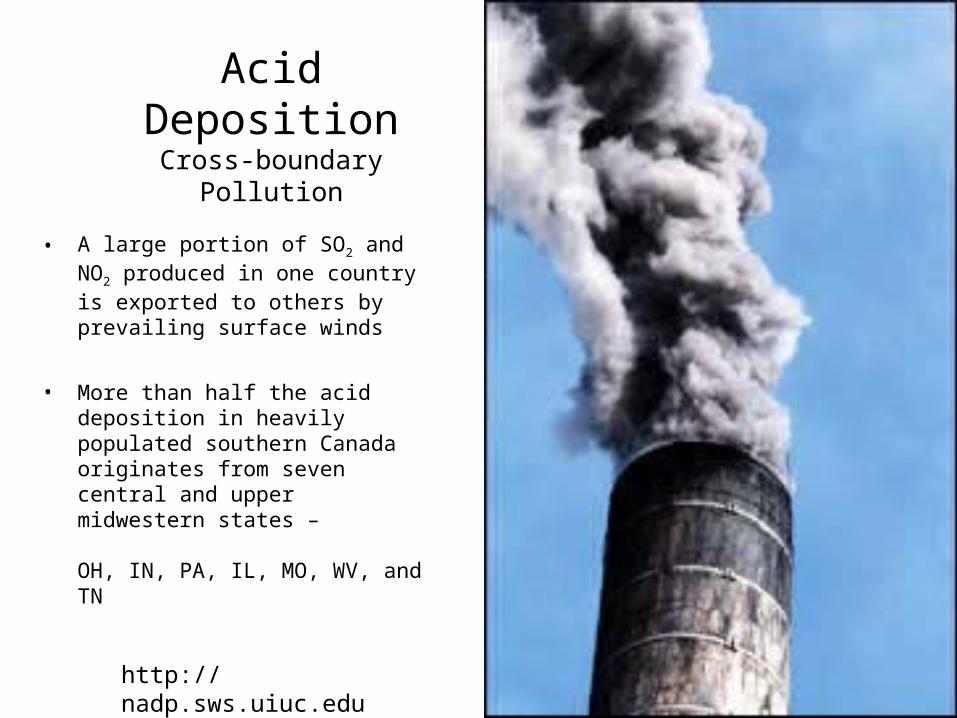
Acid DepositionCross-boundary Pollution
• A large portion of SO2 and NO2 produced in one country is exported to others by prevailing surface winds
• More than half the acid deposition in heavily populated southern Canada originates from seven central and upper midwestern states –
OH, IN, PA, IL, MO, WV, and TN
http://nadp.sws.uiuc.edu
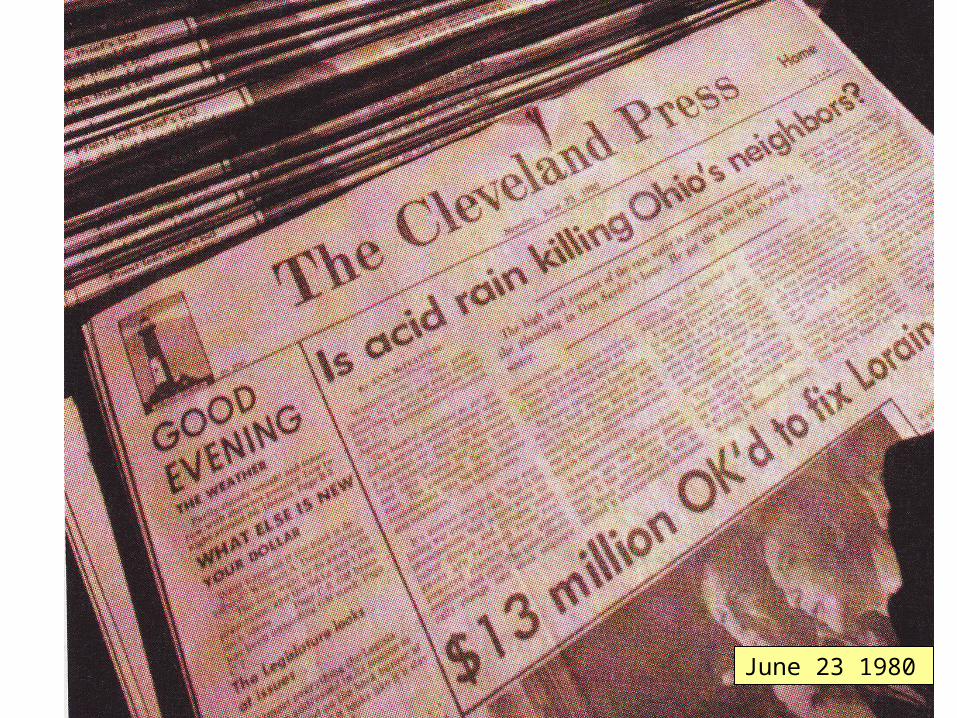
June 23 1980

Acid DepositionWhat is an acid?
Normal rainwater is weakly acidic (5.7) due to dissolved CO2
Acid Rain
Sour taste, litmus test, reaction with carbonate
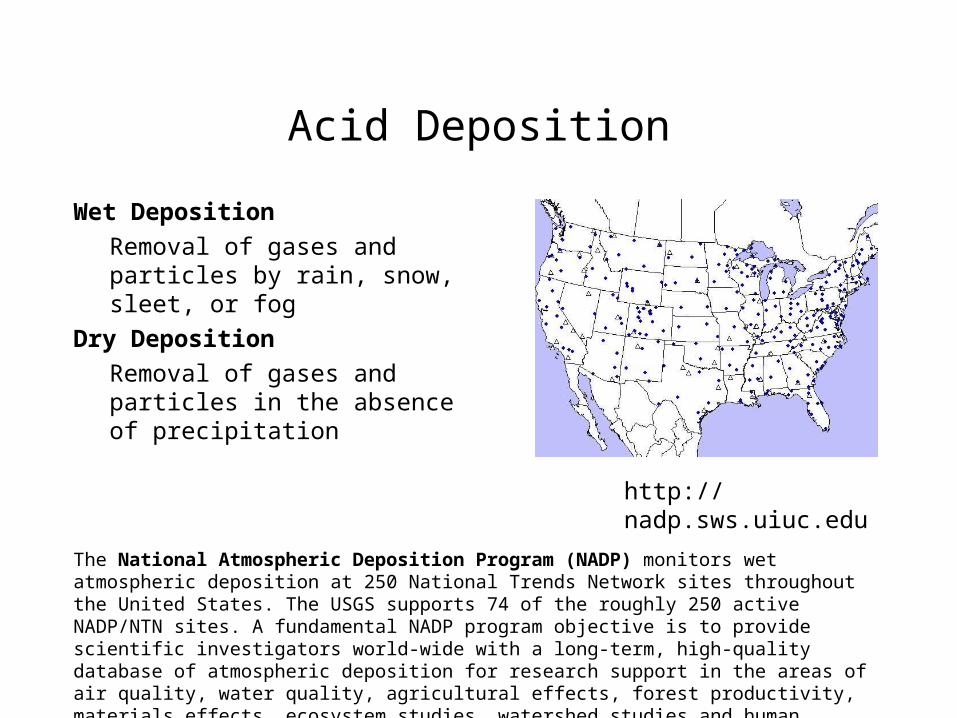
Acid Deposition
Wet Deposition
Removal of gases and particles by rain, snow, sleet, or fog
Dry Deposition
Removal of gases and particles in the absence of precipitation
http://nadp.sws.uiuc.edu
The National Atmospheric Deposition Program (NADP) monitors wet atmospheric deposition at 250 National Trends Network sites throughout the United States. The USGS supports 74 of the roughly 250 active NADP/NTN sites. A fundamental NADP program objective is to provide scientific investigators world-wide with a long-term, high-quality database of atmospheric deposition for research support in the areas of air quality, water quality, agricultural effects, forest productivity, materials effects, ecosystem studies, watershed studies and human health.

Acid Deposition (Wet and Dry)
Sulfur oxide (SOx) and nitrogen oxides (NOx) are not acids!
+ water + sunlight → Sulfuric acid and nitric acid
EPA

SOx and NOx
NOx
The highest NOx emissions are generally found in states with large urban areas, high population density, and heavy automobile traffic. Therefore, it is not surprising that the highest levels of atmospheric NO2 are measured over Los Angeles County, the car capital of the country.
SOx
Sulfur dioxide emissions are highest in regions with many coal-fired electric power plants, steel mills, and other heavy industries that rely on coal.
Allegheny County, in western Pennsylvania, is just such an area, and in 1990 it led the United States in atmospheric SO2 concentration.
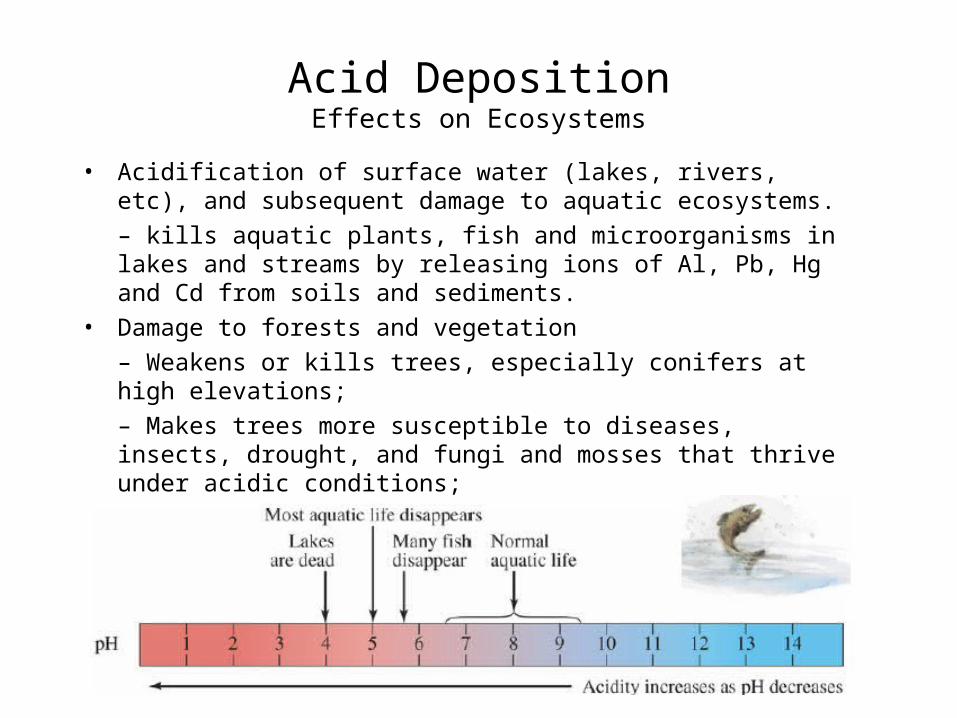
Acid DepositionEffects on Ecosystems
• Acidification of surface water (lakes, rivers, etc), and subsequent damage to aquatic ecosystems.
– kills aquatic plants, fish and microorganisms in lakes and streams by releasing ions of Al, Pb, Hg and Cd from soils and sediments.
• Damage to forests and vegetation
– Weakens or kills trees, especially conifers at high elevations;
– Makes trees more susceptible to diseases, insects, drought, and fungi and mosses that thrive under acidic conditions;
– Stunts growth of crops such as tomatoes, soybeans, spinach, carrots, broccoli and cotton

Acid DepositionEffects on Ecosystems
• Kills aquatic plants, fish and microorganisms in lakes and streams by releasing ions of Al, Pb, Hg and Cd from soils and sediments.
In acidified lakes the number of fish and amphibians is declining due to reactions of aluminum ions with proteins in the gills of fish and the embryo's of frogs
High aluminum concentrations do not only cause effects upon fish, but also upon birds and other animals that consume contaminated fish
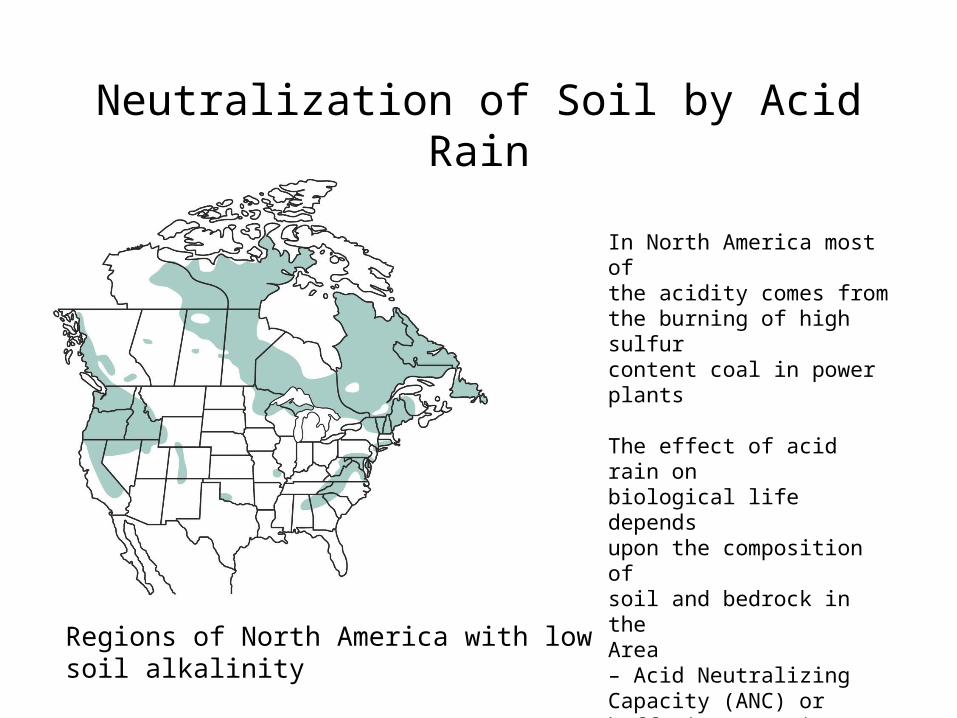
Neutralization of Soil by Acid Rain
In North America most ofthe acidity comes fromthe burning of high sulfurcontent coal in powerplants
The effect of acid rain onbiological life dependsupon the composition ofsoil and bedrock in theArea – Acid Neutralizing Capacity (ANC) or buffering capacity
Regions of North America with low soil alkalinity
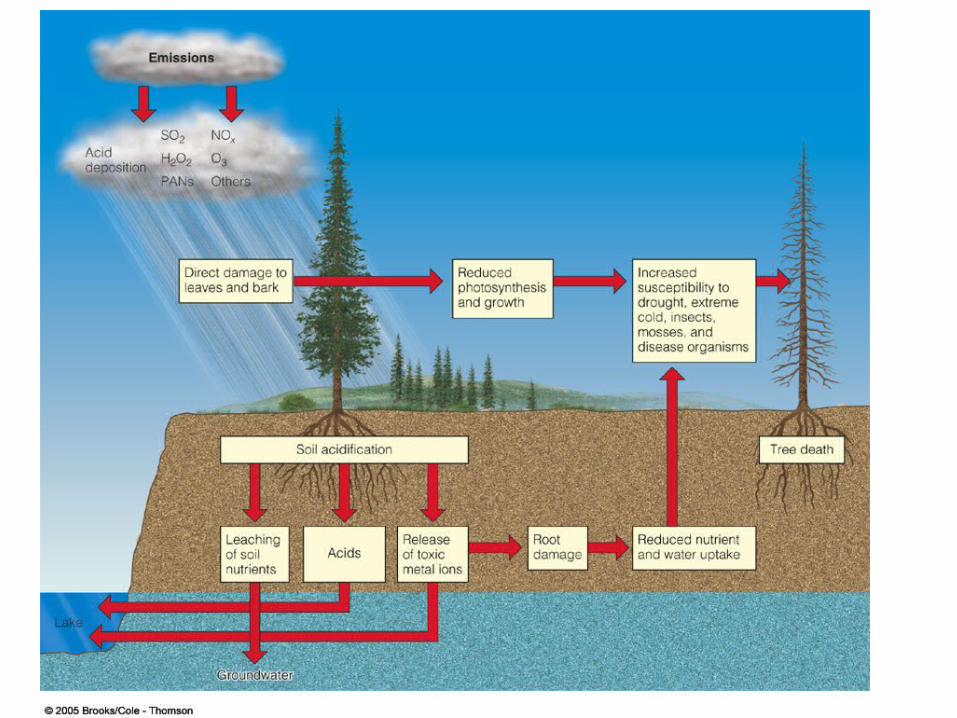
Effects on Trees and Soils
• Nutrient leaching
• Heavy metal release
• Weakens trees

Acid DepositionEffects on Humans
• Respiratory diseases
• Toxic metal leaching
• Damage to structures (limestone, marble)
•Damage to vehicles (rusting)
• Decreases visability
• Decreases productivity of fisheries, forests and farms

Acid DepositionSolutions
1980 National Acid Precipitation Assessment program
1990 CAA Ammendments
2000 Phase II CAA
Decreases in SO2 but increases in NOx


Acid DepositionNY Lakes
CNN 2001

Cartoon

Indoor Air PollutionIntroduction
Up Close and ToxicBull Frog Films (2002)

Indoor Air PollutionIntroduction
Indoor air pollution usually is a greater threat to human health than outdoor air pollution.
Why?
Indoor environments often concentrate chemical and biological contaminants
We spend 90% of our time indoors

Indoor Air PollutionIntroduction
• According to the American Medical Association 50% of all illness is caused or aggravated by polluted indoor air

Indoor Air PollutionIntroduction
• According to the EPA, the most dangerous indoor air pollutants in developed countries are:
– Tobacco smoke and fine particulates
– Formaldehyde
– Radioactive radon-222 gas
• The only one of these that has a recommended indoor level is radon

Indoor Air PollutionTobacco Smoke
• Tobacco smoke, second-hand smoke or passive smoking
• 4,000 different chemicals, 40 of which are carcinogenic

Indoor Air PollutionChemical Contaminants
• Formaldehyde– Building materials, smoking, household products– Particle board– Symptoms: burning eyes and throat, nausea– High levels may cause cancer

Indoor Air PollutionRadon-222
• Colorless, odorless gas
• Occurs due to geology
– Assoc. with Uranium
• Causes lung cancer
• Increased risk if smoker
• Prevented by ventilation

Health EffectsRadon Gas
Radon decay products build up in confined space –are breathed in, stick to surface of airways and emit α-particles
Highly energetic α, β particles rip through tissue causing cellular and genetic damage
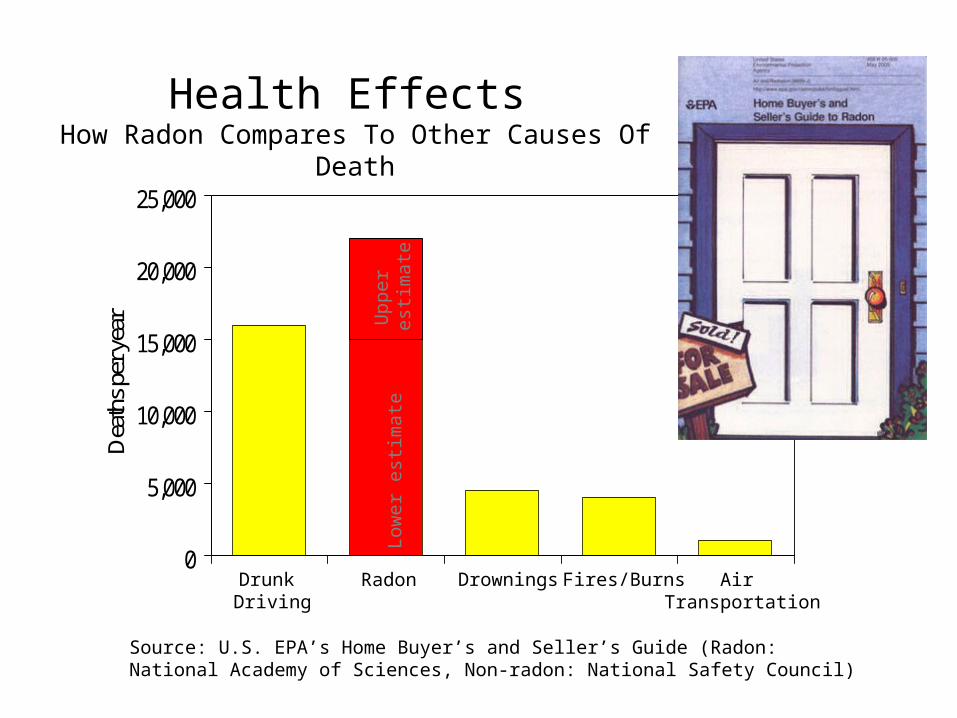
Health Effects How Radon Compares To Other Causes Of Death
0
5,000
10,000
15,000
20,000
25,000
Dea
ths
per y
ear
Low
er e
stim
ate
Drunk Driving
Drownings Fires/Burns Air Transportation
Radon
Upp
er
estim
ate
Source: U.S. EPA’s Home Buyer’s and Seller’s Guide (Radon: National Academy of Sciences, Non-radon: National Safety Council)

Indoor Air PollutionBiological Contaminants
• Mold, mildew, dust mites, bacteria, pet dander and pollen
• Humidity level is important
• Safe level ~30-50 %
• Can cause asthma attacks and allergic reactions in some people
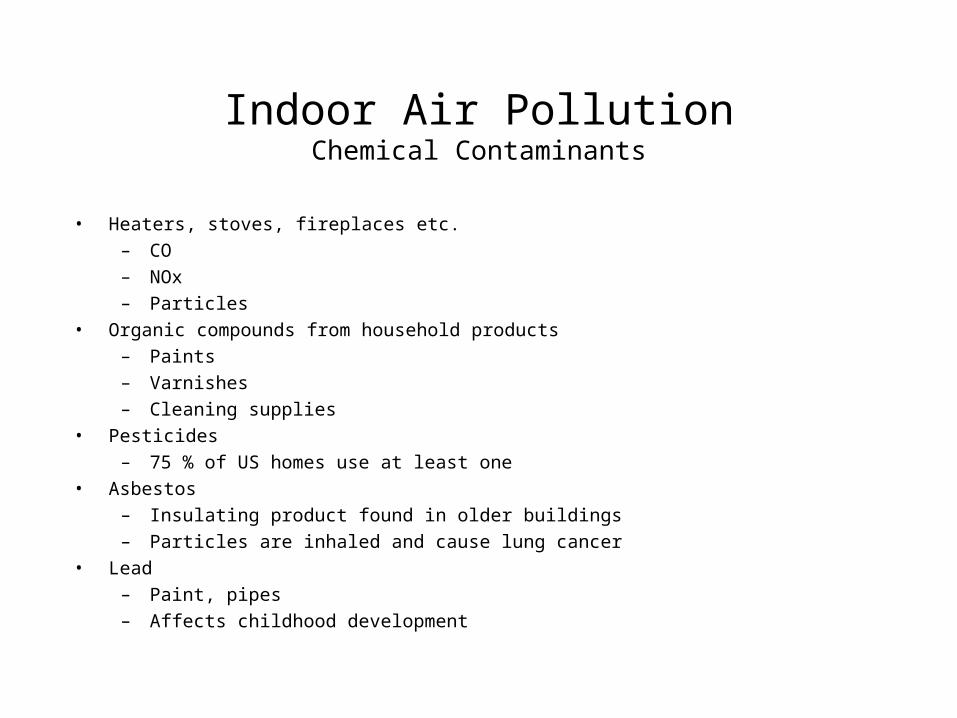
Indoor Air PollutionChemical Contaminants
• Heaters, stoves, fireplaces etc.
– CO
– NOx
– Particles
• Organic compounds from household products
– Paints
– Varnishes
– Cleaning supplies
• Pesticides
– 75 % of US homes use at least one
• Asbestos
– Insulating product found in older buildings
– Particles are inhaled and cause lung cancer
• Lead
– Paint, pipes
– Affects childhood development

Indoor Air Pollution
• Little effort has been devoted to reducing indoor air pollution even though it poses a much greater threat to human health than outdoor air pollution
NAAQSPM2.5 24 hr

Solutions
Indoor Air Pollution
Prevention
Cover ceiling tiles & lining of AC ducts to prevent release of mineral fibers
Use adjustable fresh air vents for work spaces
Increase intake of outside airBan smoking or limit it to well ventilated areas
Change air more frequently
Set stricter formaldehyde emissions standards for carpet, furniture, and building materials
Circulate a building’s air through rooftop green houses
Prevent radon infiltration Use exhaust hoods for stoves and appliances burning natural gasUse office machines in well
ventilated areas
Use less polluting substitutes for harmful cleaning agents, paints, and other products
Install efficient chimneys for wood-burning stoves
Cleanup or Dilution


Cartoon

PPG 05-01-2008
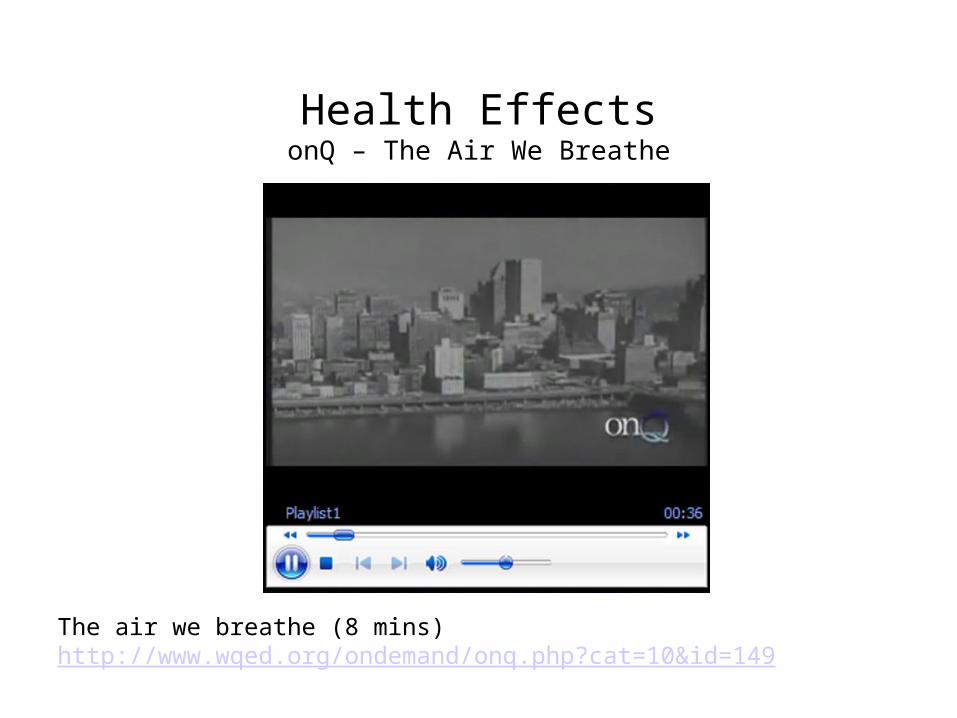
Health EffectsonQ – The Air We Breathe
The air we breathe (8 mins)http://www.wqed.org/ondemand/onq.php?cat=10&id=149
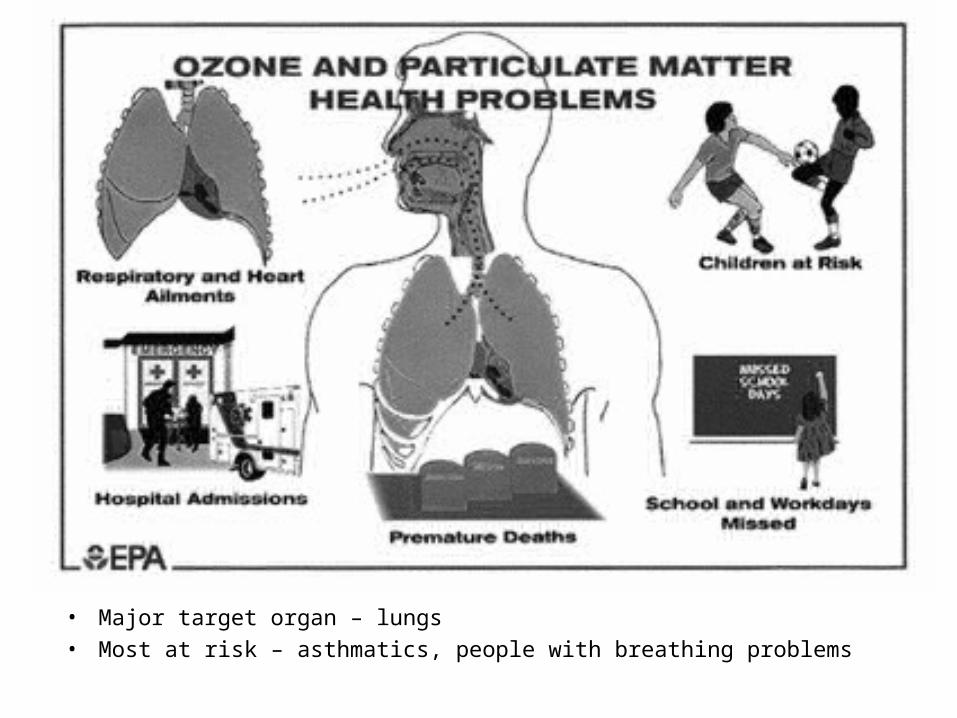
Health Effects
• Major target organ – lungs
• Most at risk – asthmatics, people with breathing problems

Health Effects
Carbon monoxide: binds to hemoglobin in red blood cells & reduces ability of blood to carry oxygen, heart failure
Sulfur dioxide: causes constriction of airways & can cause bronchitis
Nitrogen oxides: irritate lungs, cause conditions similar to bronchitis & emphysema
Ozone: causes coughing, chest pain, shortness of breath, & eye, nose & throat irriation
Volatile organics: cause mutations, reproductive problems, & cancer
Particulates: pass into blood streamHeart, lung problems, Cancer

Health Effects• Your respiratory system can help protect you from air pollution, but some
air pollutants can overcome these defenses
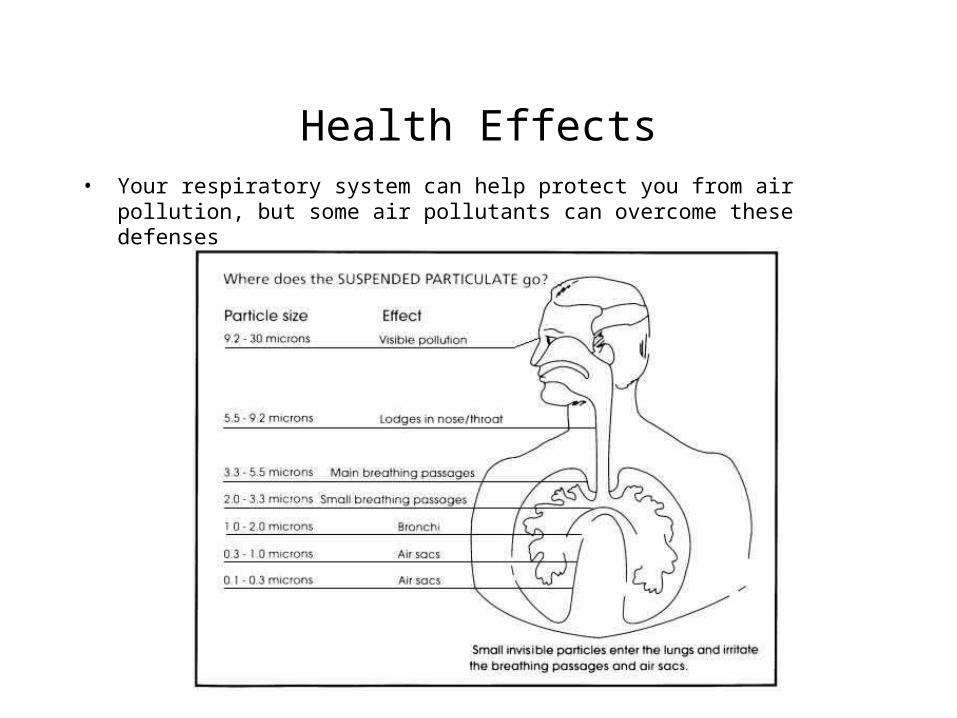
Health Effects• Your respiratory system can help protect you from air pollution, but some
air pollutants can overcome these defenses
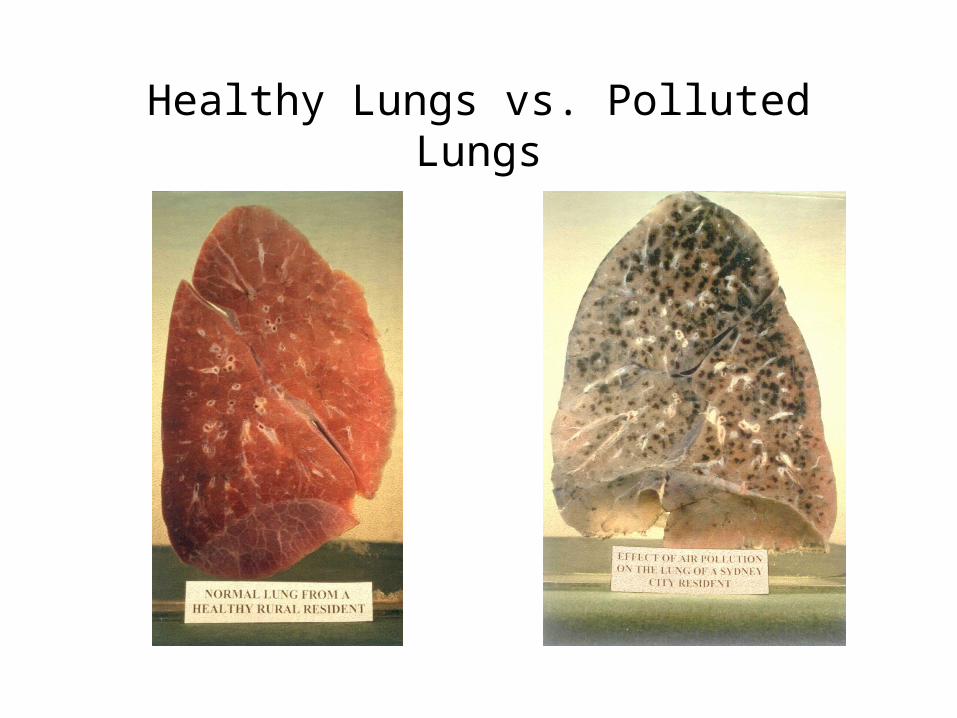
Healthy Lungs vs. Polluted Lungs
Health Effects
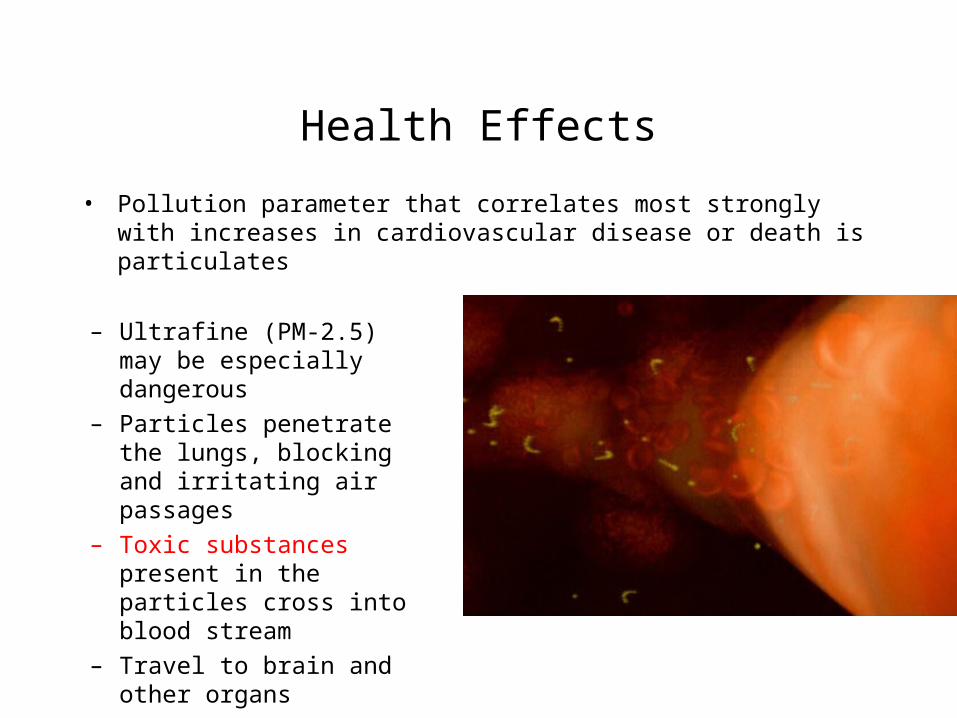
• Pollution parameter that correlates most strongly with increases in cardiovascular disease or death is particulates
– Ultrafine (PM-2.5) may be especially dangerous
– Particles penetrate the lungs, blocking and irritating air passages
– Toxic substances present in the particles cross into blood stream
– Travel to brain and other organs

Relationship Between PM 2.5 and Daily Deaths in 6 Cities
Fine particles that originated from auto emissions and sulfate from burning of coal are responsible for increased mortality rate
Cities with high PM2.5 (~20 mg m-3) had 1.4% higher death rate than cities with 10 mg m-3
A 10 mg m-3 drop results in 36,000 fewer earlier deaths per year (~same no. as die in auto accidents)
NO THRESHOLD!!!
Studies do not go as far to say PM directly responsible for all deaths
Schwartz et al., 2002

Health EffectsCNN Air Pollution
CNN 2004

Health EffectsCNN Women’s Health
ABC 2007

Air Pollution is a Big Killer
• Each year, urban air pollution prematurely kills about 800,000 people (W.H.O.)
c.f. 1,200,000 traffic deaths
– In the U.S., the EPA estimates that annual deaths related to indoor and outdoor air pollution range from 150,000 to 350,000

Air Pollution is a Big Killer
• Spatial distribution of premature deaths from air pollution in the United States

Air Pollution is a Big Killer
http://www.who.int/heli/risks/urban/urbanenv/en/

Air Pollution is a Big Killer


Cartoon
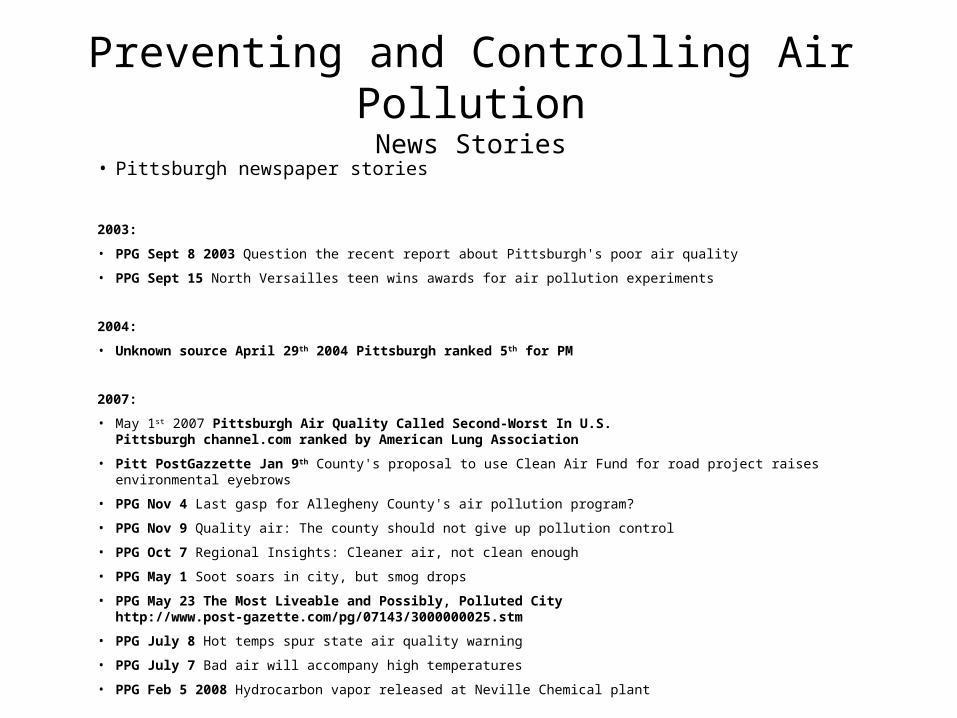
Preventing and Controlling Air PollutionNews Stories
• Pittsburgh newspaper stories
2003:
• PPG Sept 8 2003 Question the recent report about Pittsburgh's poor air quality
• PPG Sept 15 North Versailles teen wins awards for air pollution experiments
2004:
• Unknown source April 29th 2004 Pittsburgh ranked 5th for PM
2007:
• May 1st 2007 Pittsburgh Air Quality Called Second-Worst In U.S.Pittsburgh channel.com ranked by American Lung Association
• Pitt PostGazzette Jan 9th County's proposal to use Clean Air Fund for road project raises environmental eyebrows
• PPG Nov 4 Last gasp for Allegheny County's air pollution program?
• PPG Nov 9 Quality air: The county should not give up pollution control
• PPG Oct 7 Regional Insights: Cleaner air, not clean enough
• PPG May 1 Soot soars in city, but smog drops
• PPG May 23 The Most Liveable and Possibly, Polluted City http://www.post-gazette.com/pg/07143/3000000025.stm
• PPG July 8 Hot temps spur state air quality warning
• PPG July 7 Bad air will accompany high temperatures
• PPG Feb 5 2008 Hydrocarbon vapor released at Neville Chemical plant

Preventing and Controlling Air PollutionClean Air Act 1970
• require Environmental Protection Agency (EPA) to establish national ambient air quality standards (NAAQS);
• NAAQS apply to seven criteria pollutants: particulate matter, sulfur dioxide, carbon monoxide, nitrogen oxides, ozone, & lead;
• Primary and secondary standards health and property revised every 5 yrs
• national emission standards for toxic air pollutants require the EPA to regulate many toxic air pollutants
• The NAAQS drive the nation’s air pollution control programs. The Clean Air Act requires the States and EPA to develop strategies for reducing pollution from cars, factories and power plants in order to meet the air quality standards

Preventing and Controlling Air PollutionClean Air Act 1970
• national ambient air quality standards (NAAQS);
• The NAAQS drive the nation’s air pollution control programs. The Clean Air Act requires the States and EPA to develop strategies for reducing pollution from cars, factories and power plants in order to meet the air quality standards

Preventing and Controlling Air PollutionClean Air Act 1970
http://www.scorecard.org
Note: these standard have actually changed since 2003


Preventing and Controlling Air PollutionSolutions
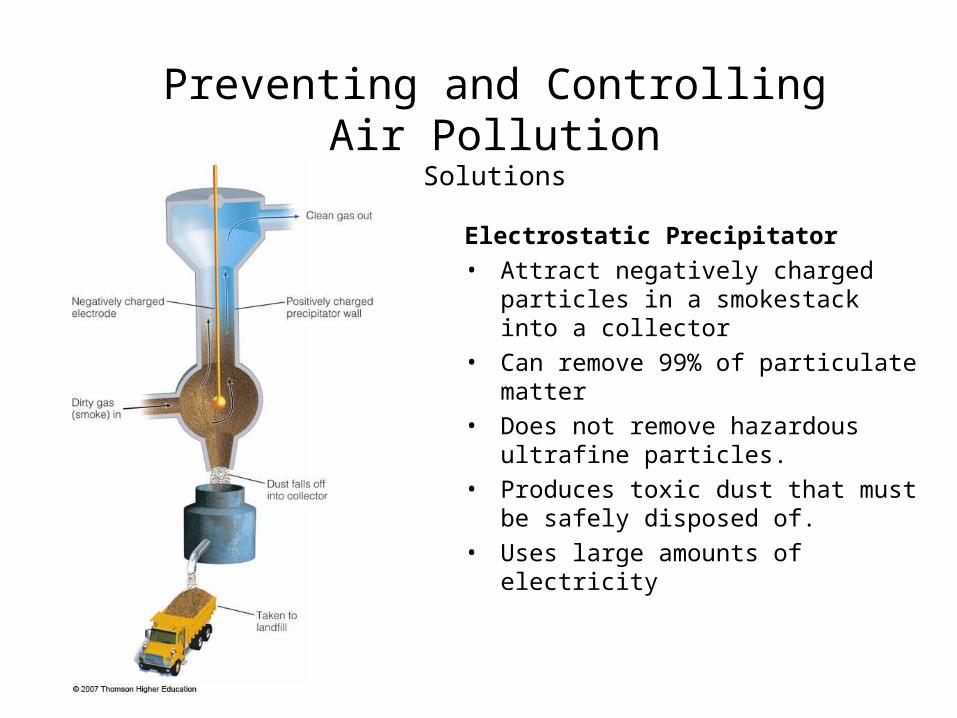
Preventing and Controlling Air PollutionSolutions
Electrostatic Precipitator
• Attract negatively charged particles in a smokestack into a collector
• Can remove 99% of particulate matter
• Does not remove hazardous ultrafine particles.
• Produces toxic dust that must be safely disposed of.
• Uses large amounts of electricity
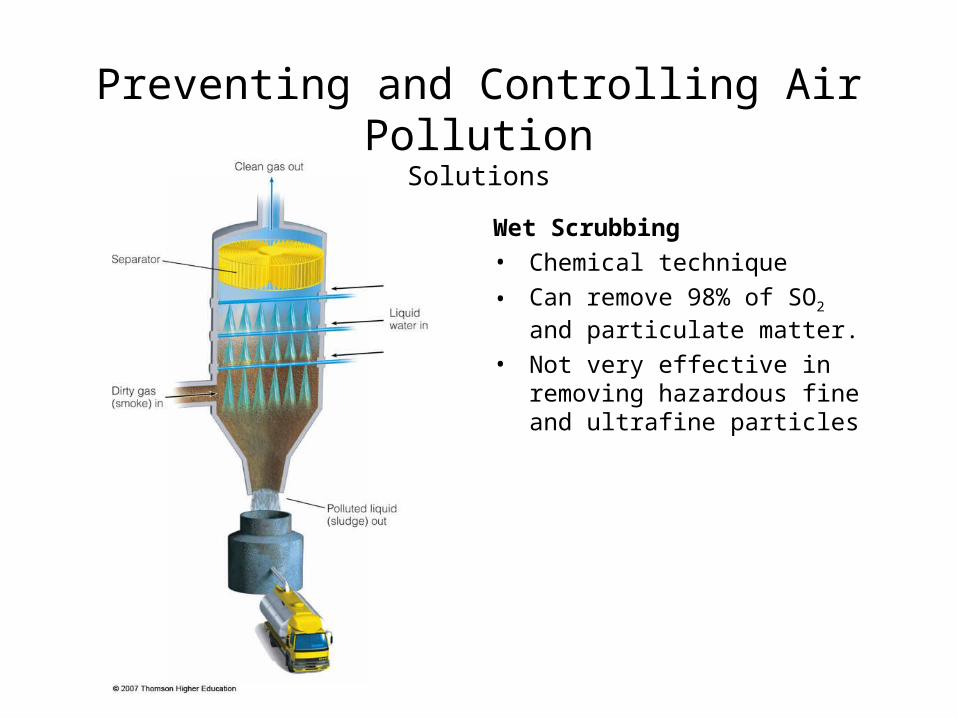
Preventing and Controlling Air PollutionSolutions
Wet Scrubbing
• Chemical technique
• Can remove 98% of SO2 and particulate matter.
• Not very effective in removing hazardous fine and ultrafine particles
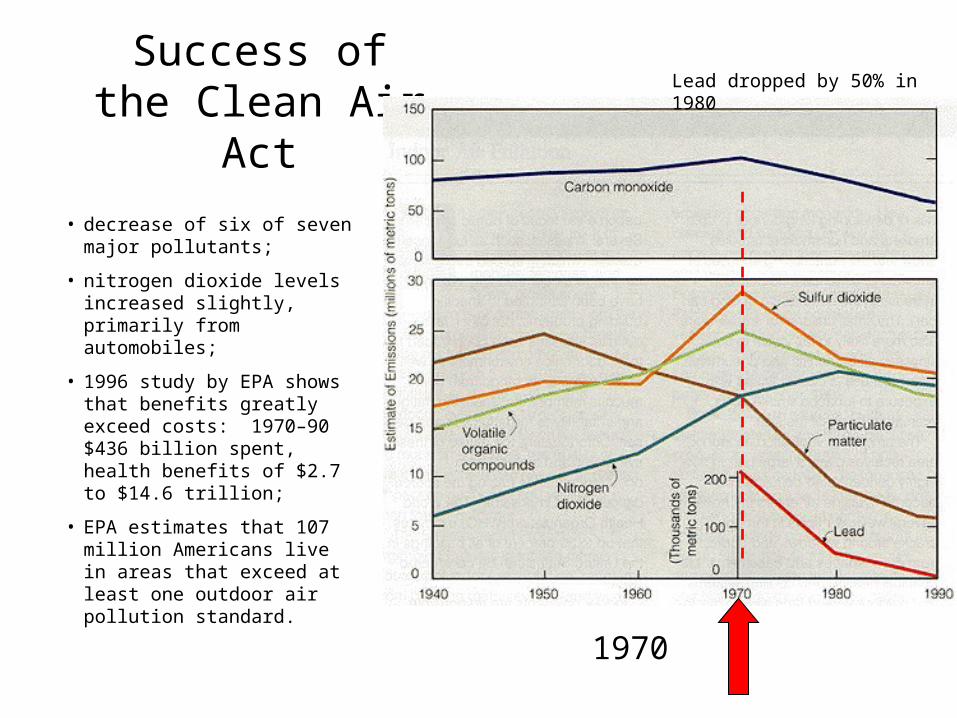
Success of the Clean Air Act
• decrease of six of seven major pollutants;
• nitrogen dioxide levels increased slightly, primarily from automobiles;
• 1996 study by EPA shows that benefits greatly exceed costs: 1970–90 $436 billion spent, health benefits of $2.7 to $14.6 trillion;
• EPA estimates that 107 million Americans live in areas that exceed at least one outdoor air pollution standard.
1970
Lead dropped by 50% in 1980

Preventing and Controlling Air PollutionDeficiencies of the CAA
• Environmental scientists point out several deficiencies in the CCA:
– The U.S. continues to rely on cleanup rather than prevention.
– The U.S. has failed to increase fuel-efficiency standards for automobiles.
– Regulation of emissions from motorcycles and two-cycle engines remains inadequate.
– There is little or no regulation of air pollution from oceangoing ships in American ports.
Preventing and Controlling Air PollutionDeficiencies of the CAA
– Airports are exempt from many air pollution regulations.
– The Act does not regulate the greenhouse gas CO2.
– The Act has failed to deal seriously with indoor air pollution.
– There is a need for better enforcement of the Clean Air Act.
– Executives of companies claim that correcting these deficiencies would: cost too much money,
harm the economy, and
cost jobs

Preventing and Controlling Air PollutionClean Power Act that Never Was
CNN 2002
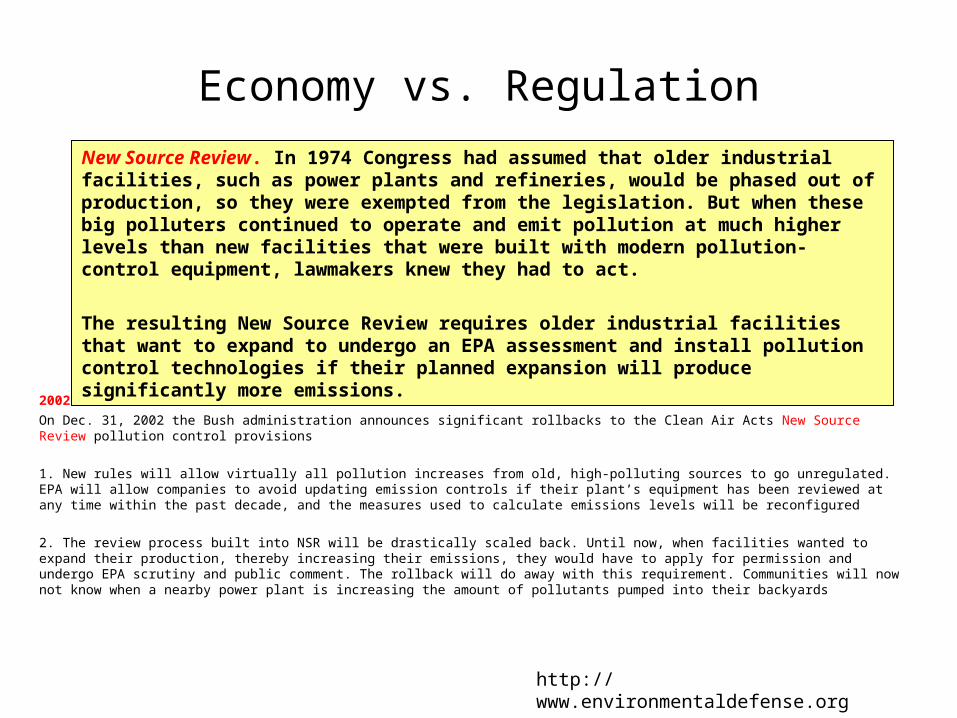
Economy vs. Regulation
2002: NSR Rollback Initiative
On Dec. 31, 2002 the Bush administration announces significant rollbacks to the Clean Air Acts New Source Review pollution control provisions
1. New rules will allow virtually all pollution increases from old, high-polluting sources to go unregulated. EPA will allow companies to avoid updating emission controls if their plant’s equipment has been reviewed at any time within the past decade, and the measures used to calculate emissions levels will be reconfigured
2. The review process built into NSR will be drastically scaled back. Until now, when facilities wanted to expand their production, thereby increasing their emissions, they would have to apply for permission and undergo EPA scrutiny and public comment. The rollback will do away with this requirement. Communities will now not know when a nearby power plant is increasing the amount of pollutants pumped into their backyards
http://www.environmentaldefense.org
New Source Review. In 1974 Congress had assumed that older industrial facilities, such as power plants and refineries, would be phased out of production, so they were exempted from the legislation. But when these big polluters continued to operate and emit pollution at much higher levels than new facilities that were built with modern pollution-control equipment, lawmakers knew they had to act.
The resulting New Source Review requires older industrial facilities that want to expand to undergo an EPA assessment and install pollution control technologies if their planned expansion will produce significantly more emissions.

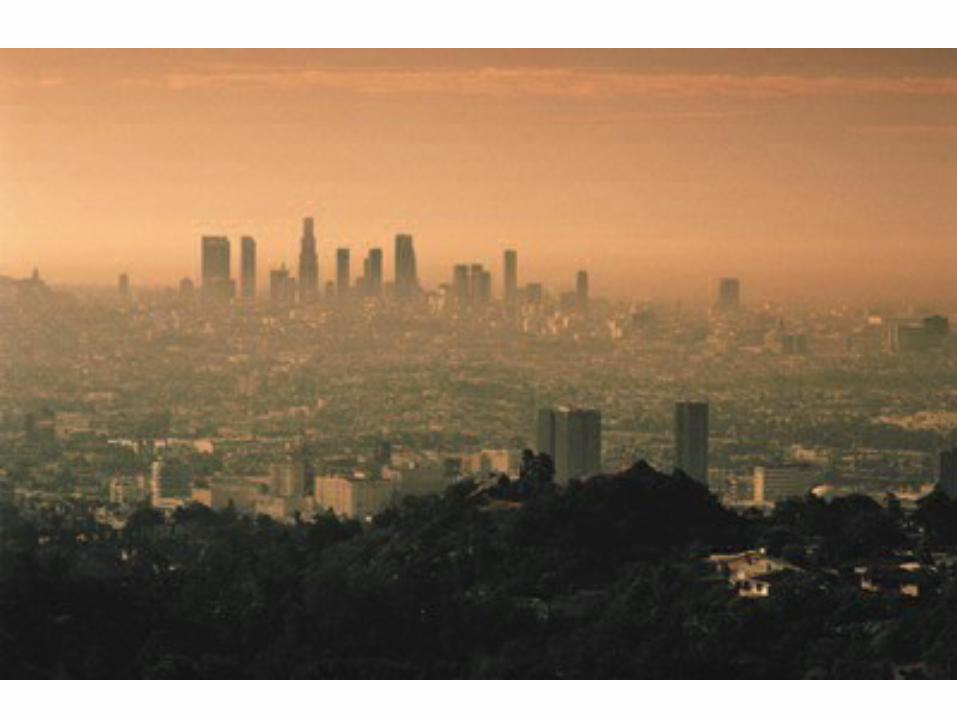
Preventing and Controlling Air PollutionLos Angeles
• Topography– Basin with the San Gabriel
Mountains to the east of the city.
• Weather – Subsiding air of the
subtropical high pressure system is compressed creating a warm layer of air aloft.
• Ocean current– Brings cold sea breeze
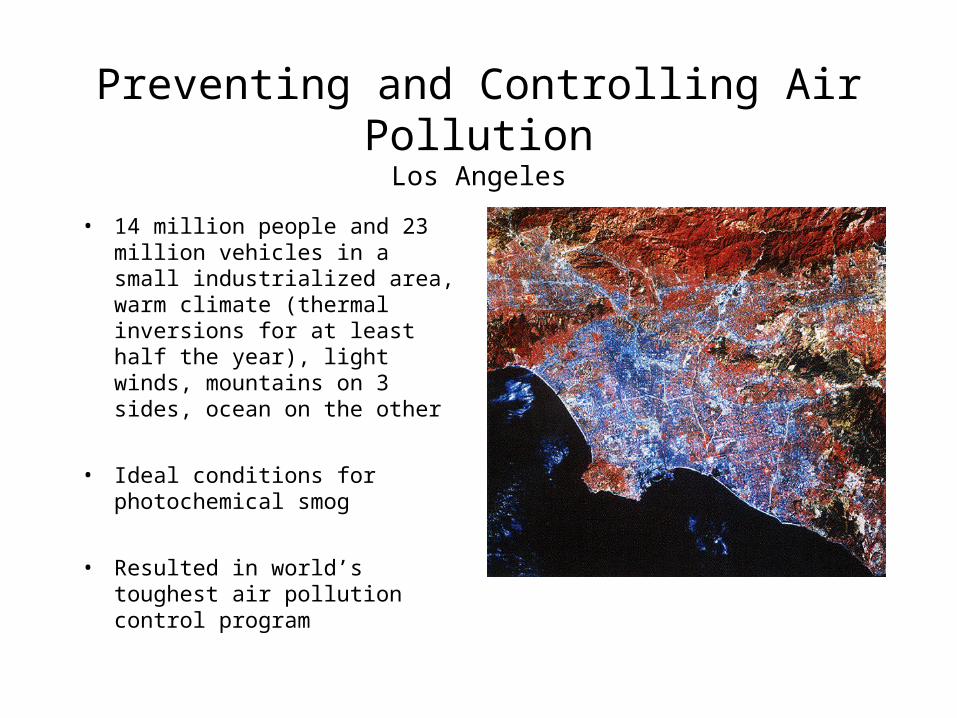
Preventing and Controlling Air PollutionLos Angeles
• 14 million people and 23 million vehicles in a small industrialized area, warm climate (thermal inversions for at least half the year), light winds, mountains on 3 sides, ocean on the other
• Ideal conditions for photochemical smog
• Resulted in world’s toughest air pollution control program

Mega Cities

Preventing and Controlling Air PollutionAir Quality Index
• The Air Quality Index is a scale used to report actual levels of O3 and other common pollutants
• Higher the AQI value, the greater the health concern
Action days are usually called when the AQI gets into the unhealthyranges. Different air pollution control agencies call them at differentlevels. In some places, action days are called when the AQI is forecast tobe Unhealthy for Sensitive Groups, or Code Orange
Source: http://airnow.gov
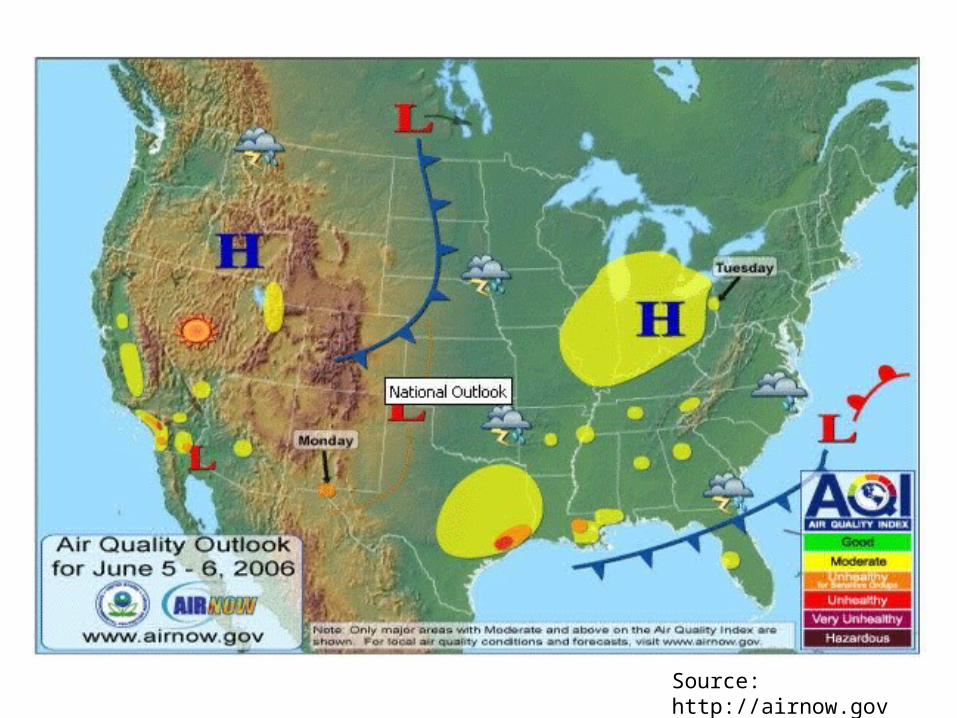
Source: http://airnow.gov

Preventing and Controlling Air PollutionReducing Outdoor Air Pollution
Green Solutions (5 mins)http://www.wqed.org/ondemand/onq.php?cat=10&id=77
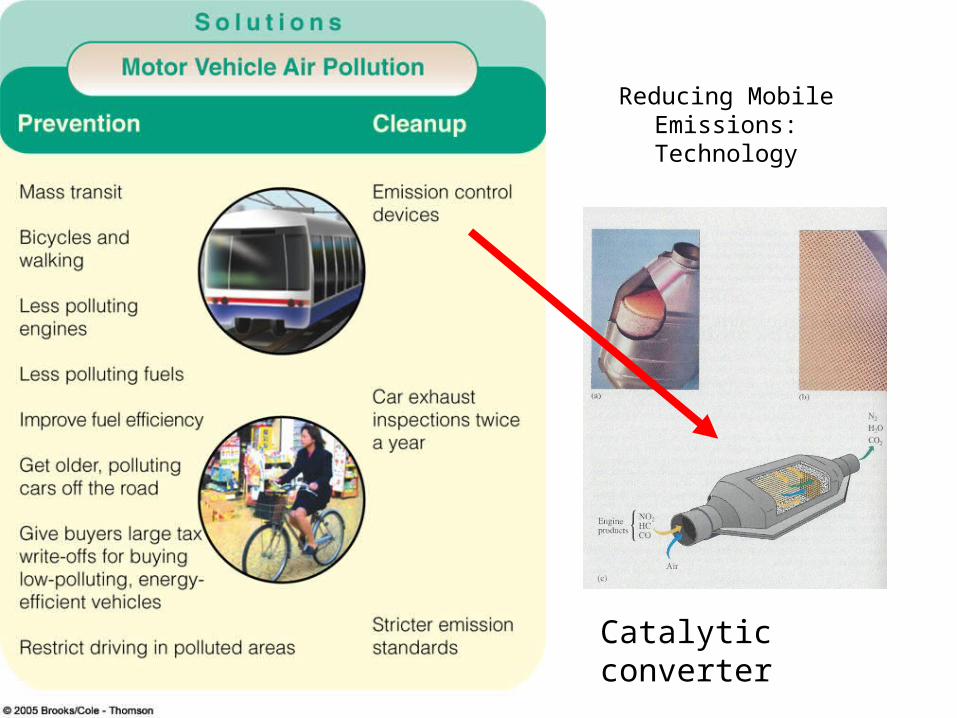
Reducing Mobile Emissions: Technology
Catalytic converter


![1. Kyrie eleison [Messe brève en Dom]...15 lei son 19 Pno. 23 son son - son son Pno. ste C}ri Chri Ste ste ste Ste ste ste Chri ste ste ste ste Chri Chri Chn Chn Chri Chri - son son](https://static.fdocuments.in/doc/165x107/5e609353fb97110321740385/1-kyrie-eleison-messe-brve-en-dom-15-lei-son-19-pno-23-son-son-son-son.jpg)