Environmental Risk Arising From Well-Construction Failure ... · cific design load. These may...
22
Environmental Risk Arising From Well-Construction Failure—Differences Between Barrier and Well Failure, and Estimates of Failure Frequency Across Common Well Types, Locations, and Well Age George E. King, Apache Corporation, and Daniel E. King, WG Consulting Group Summary Do oil and gas wells leak to the environment? This paper will show the great majority of wells do not pollute. The purpose of this paper is to explain basic concepts of well construction and illustrate differences between single-barrier failure in multiple- barrier well design and outright well-integrity failure that could lead to pollution by use of published investigations and reviews from data sets of more than 600,000 wells worldwide. For US wells, while individual-barrier failures (containment maintained and no pollution indicated) in a specific well group may range from very low to several percent (depending on geographical area, operator, era, well type, and maintenance quality), actual well-integrity failures are very rare. Well-integrity failure occurs when all barriers fail and a leak is possible. True well-integrity- failure rates are two to three orders of magnitude lower than sin- gle-barrier-failure rates. When one of these rare total-well-integrity failures occurs, gas is the most common fluid lost. Common final-barrier leak points are failed gaskets or valves at the surface and are easily and quickly repaired. If the failure is in the subsurface, an outward leak is uncommon because of a lower pressure gradient in the well than in outside formations. Subsurface leaks in oil and gas wells are rare, and routinely comprise exterior-formation salt water leaking into the well toward the lower pressure in the well. Failure frequencies are estimated for wells in several specific sets of environmental conditions (i.e., location, geologic strata, produced-fluid composition, and soils). Estimate accuracy de- pends on a sufficient database of wells with documented failures, divided into (1) barrier failures in a multiple-barrier system that did not create pollution, and (2) well-integrity failures that created a leak path, whether or not pollution was created. Estimated fail- ure-frequency comparisons are valid only for a specific set of wells operating under the same conditions with similar design and construction quality. Well age and construction era are important variables. There is absolutely no universal definition for well-fail- ure frequency. Introduction This paper is a continuation of the work on well-development environmental risk that began with a study of environmental risk from fracturing-related activity, in which the potential for possible pollution from materials transport was identified, as was a much lesser impact from leaks in the finished well (King 2012). Environ- mental risk to groundwater from the integrity of producing wells is addressed in this study, which also examines several other possi- bilities of environmental impact during the producing lifespan, from the end of construction until plugging and abandonment (P&A). For focus and brevity, this work is limited to the failure potential of the constructed barriers remaining in the producing well after drilling (e.g., casing, cement, packers, tubing, wellheads, and other downhole equipment that remains part of the producing well at the handover from drilling to production operations). Mechanical-barrier failures during well construction, injecting fluid into an underground formation, or P&A are outside the scope of this paper. For studies on those topics, the reader is referred to well-construction studies (Handal 2013; Steinsvik and Vegge 2008; Aadnoy et al. 2008), injection-well studies (US Code of Federal Regulations 2012), and well P&A studies (NPC 2011; Khalifeh et al. 2013; Faul et al. 1999). The information is from government, academic, and industry reports and care was taken to document the sources of all data. No company comparisons are made. Most of the information in the report is from North America because of the large well population and the wealth of available data from government, academic, and industry sources. Other production-well data sources have been considered to expand the data population for the analyses (Bonn 1998; Bazzari 1989; Liang 2012; Rao 2012; SINTEF 2010b). Well-Design Overview—Establishing Redundant Barriers Barriers may be active, passive, or in some cases, reactive. Active barriers, such as valves, can enable or prevent flow, while passive barriers are fixed structures, such as casing and cement. In the oil and gas industry, a reactive barrier may be a human or mechanical response to an activating or triggering event. When barriers are used in series (nested one inside the other), a multiple-barrier sys- tem is created; essentially a “defense-in-depth” barrier system (Hollnagel 1999; Fleming and Silady 2002; Skylet 1999; Sklet 2006a, b). Reactive barriers are invisible or unobtrusive in normal operations, but deploy a containment response when a pressure, flow-rate, or other behavior limit is exceeded. There are four criteria for developing a mechanical reactive barrier for a well [adapted from Hale et al. (2004)]: 1. Definition or specification of a barrier, understanding of causes of failure, and what signals could be monitored to help pre- dict or detect a failure. 2. A detection mechanism suitable to perceive a present or (preferably) an incipient failure. 3. An activation mechanism that will alarm, notify, or begin a response automatically. 4. A response mechanism that is suitable to prevent, control, or mitigate the failure. The difference between drilling and production-well barriers is that most production-well barriers are static (available continu- ously over an extended period of time, usually without requiring Copyright V C 2013 Society of Petroleum Engineers This paper (SPE 166142) was accepted for presentation at the SPE Annual Technical Conference and Exhibition, New Orleans, 30 September–2 October 2013, and revised for publication. Original manuscript received for review 10 July 2013. Revised manuscript received for review 24 September 2013. Paper peer approved 25 September 2013. November 2013 SPE Production & Operations 323
Transcript of Environmental Risk Arising From Well-Construction Failure ... · cific design load. These may...
Environmental Risk Arising FromWell-Construction Failure—Differences
Between Barrier and Well Failure,and Estimates of Failure Frequency
Across Common Well Types, Locations,and Well Age
George E. King, Apache Corporation, and Daniel E. King, WG Consulting Group
SummaryDo oil and gas wells leak to the environment? This paper willshow the great majority of wells do not pollute. The purpose ofthis paper is to explain basic concepts of well construction andillustrate differences between single-barrier failure in multiple-barrier well design and outright well-integrity failure that couldlead to pollution by use of published investigations and reviewsfrom data sets of more than 600,000 wells worldwide. For USwells, while individual-barrier failures (containment maintainedand no pollution indicated) in a specific well group may rangefrom very low to several percent (depending on geographicalarea, operator, era, well type, and maintenance quality), actualwell-integrity failures are very rare. Well-integrity failure occurswhen all barriers fail and a leak is possible. True well-integrity-failure rates are two to three orders of magnitude lower than sin-gle-barrier-failure rates.
When one of these rare total-well-integrity failures occurs, gasis the most common fluid lost. Common final-barrier leak pointsare failed gaskets or valves at the surface and are easily andquickly repaired. If the failure is in the subsurface, an outwardleak is uncommon because of a lower pressure gradient in thewell than in outside formations. Subsurface leaks in oil and gaswells are rare, and routinely comprise exterior-formation saltwater leaking into the well toward the lower pressure in the well.
Failure frequencies are estimated for wells in several specificsets of environmental conditions (i.e., location, geologic strata,produced-fluid composition, and soils). Estimate accuracy de-pends on a sufficient database of wells with documented failures,divided into (1) barrier failures in a multiple-barrier system thatdid not create pollution, and (2) well-integrity failures that createda leak path, whether or not pollution was created. Estimated fail-ure-frequency comparisons are valid only for a specific set ofwells operating under the same conditions with similar design andconstruction quality. Well age and construction era are importantvariables. There is absolutely no universal definition for well-fail-ure frequency.
IntroductionThis paper is a continuation of the work on well-developmentenvironmental risk that began with a study of environmental riskfrom fracturing-related activity, in which the potential for possiblepollution from materials transport was identified, as was a muchlesser impact from leaks in the finished well (King 2012). Environ-mental risk to groundwater from the integrity of producing wells is
addressed in this study, which also examines several other possi-bilities of environmental impact during the producing lifespan,from the end of construction until plugging and abandonment(P&A). For focus and brevity, this work is limited to the failurepotential of the constructed barriers remaining in the producingwell after drilling (e.g., casing, cement, packers, tubing, wellheads,and other downhole equipment that remains part of the producingwell at the handover from drilling to production operations).
Mechanical-barrier failures during well construction, injectingfluid into an underground formation, or P&A are outside the scopeof this paper. For studies on those topics, the reader is referred towell-construction studies (Handal 2013; Steinsvik and Vegge2008; Aadnoy et al. 2008), injection-well studies (US Code ofFederal Regulations 2012), and well P&A studies (NPC 2011;Khalifeh et al. 2013; Faul et al. 1999).
The information is from government, academic, and industryreports and care was taken to document the sources of all data. Nocompany comparisons are made. Most of the information in thereport is from North America because of the large well populationand the wealth of available data from government, academic, andindustry sources. Other production-well data sources have beenconsidered to expand the data population for the analyses (Bonn1998; Bazzari 1989; Liang 2012; Rao 2012; SINTEF 2010b).
Well-Design Overview—Establishing RedundantBarriersBarriers may be active, passive, or in some cases, reactive. Activebarriers, such as valves, can enable or prevent flow, while passivebarriers are fixed structures, such as casing and cement. In the oiland gas industry, a reactive barrier may be a human or mechanicalresponse to an activating or triggering event. When barriers areused in series (nested one inside the other), a multiple-barrier sys-tem is created; essentially a “defense-in-depth” barrier system(Hollnagel 1999; Fleming and Silady 2002; Skylet 1999; Sklet2006a, b). Reactive barriers are invisible or unobtrusive in normaloperations, but deploy a containment response when a pressure,flow-rate, or other behavior limit is exceeded.
There are four criteria for developing a mechanical reactivebarrier for a well [adapted from Hale et al. (2004)]:
1. Definition or specification of a barrier, understanding ofcauses of failure, and what signals could be monitored to help pre-dict or detect a failure.
2. A detection mechanism suitable to perceive a present or(preferably) an incipient failure.
3. An activation mechanism that will alarm, notify, or begin aresponse automatically.
4. A response mechanism that is suitable to prevent, control,or mitigate the failure.
The difference between drilling and production-well barriers isthat most production-well barriers are static (available continu-ously over an extended period of time, usually without requiring
Copyright VC 2013 Society of Petroleum Engineers
This paper (SPE 166142) was accepted for presentation at the SPE Annual TechnicalConference and Exhibition, New Orleans, 30 September–2 October 2013, and revised forpublication. Original manuscript received for review 10 July 2013. Revised manuscriptreceived for review 24 September 2013. Paper peer approved 25 September 2013.
November 2013 SPE Production & Operations 323

human observation or action), whereas most drilling-and-comple-tion (D&C) -activity barriers are dynamic (control is variable withtime and activity). Production barriers require less-continuousmonitoring compared with D&C barriers, which are dependent oncorrect human activity.
In most well configurations, uncemented sections of inner pipestrings are designed to collapse under any overpressuring externalload in the annulus before the pipe that forms the outer wall of theannulus can burst. This type of reactive barrier protects the integ-rity of the outer string with a sacrificial collapse of the innerstring. While effective, this fixed design is susceptible to changesin how the well is operated, such as converting a primary flowingwell to a gas lift with high-pressure lift gas in the innermost annu-lus. Burst strength of pipe is further reinforced by cement on theoutside, although this added burst strength is rarely considered inthe typical conservative design (Zinkham and Goodwin 1962).Redundant, sequential design elements control failure-producingforces so a well can survive without loss of well integrity, evenwith the loss of one or more barriers in a multiple-barrier system.This contained-failure approach, which is basically an overdesign,is the core of engineering design in which safety is paramount.Contained-failure approaches and redundant-barrier systems arecommon in all risk-based industries. For a well to pollute, a leakpath must form and extend from the inner hydrocarbon flow pathto the outside environment. Any barrier that interrupts this flowpath and prevents formation of a leak path is effective in prevent-ing pollution.
Barriers and Well IntegrityOil- and gas-producing wells are a nested collection of pipe,cement, seals, and valves that form multiple barriers between pro-duced well fluids and the outside environment. Barrier and integ-rity in well-design technology is loosely defined as follows:! Barriers are containment elements that can withstand a spe-
cific design load. These may comprise pipe that is effectivelycemented, seals, pipe body, valves, and pressure-rated housings(see Table 1). Typical design-load parameters include operating-environment factors such as temperature, pressure, fluid composi-tion, fluid velocity, and exposure time.! Multiple barriers are nested individual barriers designed and
built to withstand a specific load without help from other barriers.If an inside (or outside) barrier fails, the next barrier will provideisolation so that a leak path will not form. In modern designs, thenumber of barriers is typically proportional to the hazard potentialin specific well areas (Fig. 1). When a barrier failure occurs, anassessment will establish the magnitude of the health and environ-mental risk posed by the leak so that the repairs can be scheduledappropriately (Humphreys and Ross 2007). In the United States,state and federal regulations cover exemptions that may or may notbe granted to continue to operate (Bourgoyne et al. 1999, 2000; Cor-neliussen et al. 2007; Anders et al. 2008; Browning and Smith 1993;Vignes and Aadnoy 2008; Vignes 2011; Calosa et al. 2010; Crow2006; D’Alesio et al. 2011; Dethlefs and Chastain 2012; Duguayet al. 2012; Nygaard 2010; Carlsen and Randohl 2008).! Monitored barriers may have fluid-filled spaces (annuli)
between barriers that can be monitored for pressure increase or
fluid invasion. Annular spaces that are cemented to the surface areusually not monitored.! Well-integrity failure is an undesired result in which all bar-
riers in a potential leak path fail in such a way that a leak path iscreated. Whether or not pollution occurs, however, depends onthe direction of pressure differential and buoyancy of the leakingfluid. There is a natural pressure gradient outside the well, estab-lished by fluids and trapped pressure environments. The gradientinside the well is a function of the pressure at the highest point ofcontainment and the fluid-density gradients from top to bottom.Because multiple fluid phases, often with pressure-dependent den-sities, are commonly present in a wellbore in both flowing andstatic conditions, the potential for pressure underbalance and/oroverbalance is difficult to describe, and a leak path from a wellcould flow fluid outward in one operating condition and inward inanother operating condition.
RiskThe definition of risk used here includes the recognition that,although there is a degree of risk in every action, the frequency ofoccurrence and the impact of a detrimental outcome create a riskor threat level that we can understand and accept or reject on thebasis of what we believe, hopefully from assessment of facts.When solid occurrence numbers are not available, probability isused as a proxy. While the use of a proxy such as probability isnecessary in many cases, an element of uncertainty is inescapablyincluded.
Wells are designed and built as pressure vessels, using exactdata on as many variables of the formation and producing condi-tions as we know and considering how they will change as under-ground forces are altered by producing or injecting fluids intorocks with fluid-filled porosity that have reached equilibrium.Altering the fluid fill or composition may be followed by stressalteration. One challenge to well design is that every inch of adepositional formation is different from the inch above and theinch below; hence, the need to design for the unknown and theworst load. Well design is a geomechanical, fit-for-purpose engi-neering effort and definitely not a “one-size-fits-all” approach.
All phases of the well design must consider loads and forcesplaced on the well from the first cementing operation through frac-turing and to the end of production. Well-failure causes includesimple, one-variable induced failures and more-complex failure sce-narios. Whenever possible, a failure should be traced back to a rootcause. Although examining surface failures is a practical approach(in which pollution can be more quickly and unambiguously docu-mented), determining root cause of subsurface failures from whichthe failed equipment cannot always be retrieved is more difficult,and the direct or indirect environmental damage, if it occurs at all,may not be seen for months after the incident. The most importantelement of risk control is to prevent barrier failure by predicting theperformance of barriers under any operating conditions.
Neither human nor natural endeavors are risk free (Ritchie2013). To work with risk requires an assessment of the impactand the probability of an undesirable outcome. For this reason, theactual expression of risk must be made on the basis of a quantita-tive risk assessment and may be compared to other industries inwhich significant risk is an issue (Oakley 2005; Martland and
TABLE 1—EXAMPLES OF OPERATIONS BARRIERS
Barrier DescriptionNumberPresent
Pressure Rating ofProducing-Well Barriers Durability of Barrier Elements
Casing" cement 2 to 7 Very High Very High—many cases of 70" years producing life
Hangers" seals 2 to 4 High High—internal seals
Pipe between seals 1 to 3 High Very High where corrosion inhibition is maintained
Packoffs and some plugs 1 to 2 Moderate Moderate—internal seal
Safety valves (surface, tubing, or annular) 1 Moderate to High Moderate—internal seal; frequently tested
Valves, spools, seals in production tree 4 to 20" Moderate to High Moderate—can be isolated quickly
324 November 2013 SPE Production & Operations

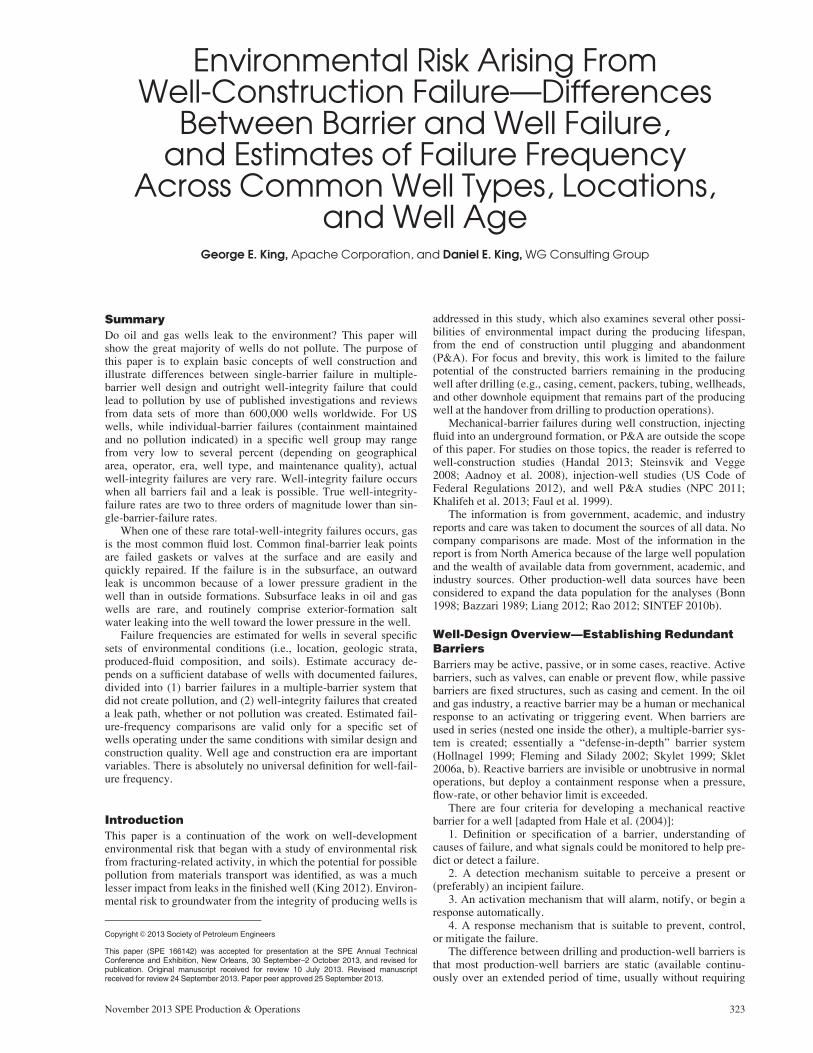
Mann 2012). The concept of “as low as reasonably practicable”(ALARP) is widely accepted in risk-based industries and by thepublic, although many people have not heard the term (Fig. 2).
For example, actuarial tables of the life-insurance industry onpilots and onboard staff (showing no elevated life risk from flyingin scheduled airlines) and the public’s acceptance of the airlines asa safe way to travel are an educated acceptance of risk. The ALARPterm comes from the UK and North Sea and is based on safety prac-tices and law in the area of safety-critical systems [Health andSafety Executive (ALARP) 2013]. The basic principle is that the re-sidual risk shall be ALARP, but all endeavors accept a risk thresh-old that can be described as a judgment of the balance of risk andsocial benefit. Within that definition, however, the implied responsi-bility is that future risk must always be further diminished by apply-ing learnings and developments from study of past operations.
For risks of any type, it is important for decision makers to seemore than just a mass of separate pieces of information; it is im-portant to understand the context of the separate risks, how theymight interact and either counterbalance or amplify a single riskelement (David and Pinons 2009).
Decreasing risk is a primary concern with hydraulic fracturingand well construction. Use of evolving technologies in cementing,pipe alloys, wellhead seals, and even transport has driven occur-rence and impact of potential detrimental outcomes from fractur-ing-related activities to very low levels, as described in Table 2and illustrated in Fig. 3 (King 2012). The data in Fig. 3 presentexamples of case histories of both occurrences and impacts andcontain real-world examples and outcomes of the interrelatedfunctions of well construction and hydraulic fracturing. The detri-mental fracturing possibilities in Fig. 3 are highly region-specific,with major influence exercised by presence of natural seeps, localgeology (including near-surface fault presence), natural-fracture
barriers, the presence of natural fractures, variable earth stresses,infrastructure development, and other factors. Frequency of occur-rence and the impact of these events are derived from documentedsources (King 2012).
Possibility vs. ProbabilityFailure frequency, impact assessment, and risk rankings areneeded to learn what problems are most important and requirerapid attention. Identifying problems without ranking them forfrequency and impact is somewhat similar to comparing a largeasteroid collision with a tripping hazard created by a wrinkle inthe carpet. Both are hazards, but one is catastrophic, with a minis-cule chance of occurring and few ways to avoid it, while the other,although frequently encountered, is a minor issue and easily cor-rected. Impact and frequency are used in every risk-based industryas the basis for preparation, plans, and changes to designs.
Effectiveness of BarriersThe only constant in the geology of the Earth is change, asattested to by millions of years of earthquakes; volcanic activity;formation flows; mountain erosion; natural seeps of oil, gas, andsalt water; and a great many other continuously changing proc-esses, large and small. The natural containment barriers in reser-voirs are extremely strong; proved by the fact that low-density oiland gas remained trapped there even after millions of years ofmajor earthquakes and other tectonic evens. Some areas, however,such as the northeastern US, have natural-formation arrangementsthat allow slow movement of oil, gas, and salt water to the sur-face. These natural pathways (seeps) have been active for millionsof years and communities of flora and fauna have developed tomake use of the output of these natural hydrocarbon seeps.
Vertical section5,000 to 8,000 ft
Barriers in a shallower(producing) well—4 well sectionsshown
Corrosive Brines
Surface: Two barriers typical.
Shallow depth: Two to four barriers depending on well type,presence of protected resources (water), corrosion potential, others.
Mid depth: Two barriers typical, with added protection near corrosivebrines. Cement overlaps between casing strings and liners. Special-composition cements considered when CO2 or H2S is an issue.
Deep: One barrier typical, with openhole completions used in some instances. Tubing and exposed casing at depth may be of specializedalloy if required to resist corrosion potential.
Ground LevelFresh Water(!50 to !80 ft)
Zone
Surface
Shallow
MidDepth Very Low 1 to 2
Deep4
1
2
3
4
3
2
1
Near zero 1
Low toModerate
2 to 4
Low 2
Hazard toGround-
water
Number of Barriers
Usable Water(<10,000 ppm)(<100 to > 3,000 ft)Deeper horizontal
wells (includingthe horizontalsection) are 15,000to greater than20,000 ftmeasured depthand vertical totaldepths of approximately18,000 ft
Fig. 1—Examples of well-construction barriers for specific areas of the well.
November 2013 SPE Production & Operations 325
From the study of forces of ruin (wear, corrosion, erosion,decomposition, weather, cyclic loads) that degrade all things natu-ral and man-made, engineers describe behaviors that will destructand counteractions that will preserve or extend. An engineeredstructure, perhaps perfect at the time of construction, remains per-fect only for a period of time. We trust skyscrapers, ships, air-planes, cars, and bridges to perform over an expected lifetime.They are designed to have an acceptable, although nonzero, risklevel as they age or when weather or load conditions change. All
ALARP
As Low As Reasonably Practicable
Level of Risk
Unacceptable
MarginalAcceptability
High Impactand Occurrence
High Impactand Low Occurrence
Low Impact and ModerateOccurrence
ProfessionalAcceptance
WidelyAcceptedby Public
Very Low Impact andLow Occurrence
Target Level or Risk = 0
Learning Loop
Fig. 2—ALARP (as low as reasonably practicable) risk assess-ment with generalized acceptance levels and learning loop.
TABLE 2—FRACTURING RISK EVENTS
Event Event Description
1 Spill transport of fresh or low salt water
2 Spill 15 gal biocide
3 Spill 50 lbm dry additives
4 Spill 150 gal from truck wreck
5 Spill 2,500 gal from refueler wreck
6 Spill fracture tank of water, no additives
7 Spill fracture tank of water with food-grade polymer only
8 Spill 10 gal diesel during refueling
9 Spill 100 bbl of produced water
10 Fracture ruptures surface casing
11 Cooling pulls tubing string out of packer
12 Fracture opens mud channel, well<2,000 ft
13 Fracture opens mud channel, well>2,000 ft
14 Fracture intersects another well in pay zone
15 Fracture intersects properly abandoned wellbore
16 Fracture intersects improperly abandoned wellbore
17 Fracture to surface or groundwater through the rock,well>2,000 ft deep
18 Fracture produces earthquake that can be felt at surface
19 Fracture intersects a natural seep
20 Fracture produces emissions in excess of limits
21 Normal fracture operations—no problems
10—Highest level point-source pollution—similar to acid mine drainage (AMD)
7—Limited toxic pollution, slow or nobiodegradation, less toxic than AMD
4—Spill or leak of 500 gal of nontoxicbut persistant chemical—similar tospreading salt on icy roads
1—Small spill of < 5 gal or 20 L of nontoxic, biodegradeable food-grade chemical20
1461113
715
1 9128
1018
3 1619417
2 5
Occurrence (more frequent)
Catastrophic Risk Levels
Con
sequ
ence
(m
ore
seve
re)
Riskreduction
21
Eve
ry ti
me
or 1
00%
1 in
10
or 1
0%
1 in
100
or
1%
1 in
1,0
00 o
r 0.
1%
1 in
10,
000
or 0
.01%
1 in
100
,000
or
0.00
1%
1 in
1 m
illio
n or
0.0
001%
1 in
10
mill
ion
or 0
.000
01%
1 in
100
mill
ion
or 0
.000
001%
1 in
1 b
illio
n or
0.0
0000
01%
Fig. 3—Risk reduction achieved in hydraulic fracturing by application of developing technology (King 2012).
326 November 2013 SPE Production & Operations

these lessons must enter into both design and maintenance toreduce risk. In engineering design, multiple fail-safe principlesand redundant systems are included that both warn of a potentialproblem and prevent an immediate one. For the oil and gas indus-try, redundant barriers in well design perform this purpose withgreat reliability.
A casing string under fracturing conditions will experiencelarge increases in internal pressure as a result of fracturing pres-sure and decreases in average temperature caused by the fractur-ing fluids. The forces created by fracturing are attributed to foureffects: piston force (pressure changes inside a confined space),buckling effect (pipe-shape deflection caused by higher pressureinside the pipe than outside), ballooning effect (pressure insidethe pipe slightly enlarging the pipe diameter and shortening itslength), and temperature effect (cooling contracts the pipe andraises tensile loading) (Clark 1987). If the well is a multifracturedhorizontal well, loads on the coupling through the bend areas andmultiple fracture cycles are also added to the stresses (Chamberset al. 1995). Cementing the casing removes many of the problemswith buckling (Durham 1987), but the stresses during fracturingare low at the start and usually stabilize and build slowly after thefracture-initiation step, often (but not always) reaching a peaknear the end of the job when temperature and ballooning effectshave offset part of the buckling loads.
Age vs. Construction Era or VintageFrom early failures to “old-age” wear, time is portrayed to be theenemy of any engineered structure, regardless of the engineeringdiscipline. Although aging is a significant issue, it must beremembered that failures of the past are what our knowledge oftoday is built upon, and as learnings progress, the failure rates of alater time should be lower than those of the era before it. Every-thing we know about success is based on mistakes we have made,but only if we learn from them. A key issue with operators is howthey capture and incorporate learnings into the next design.
For any risk rating, time is a consideration that cannot beignored. In well construction, time has at least four majorinfluences:
1. Time impacts the knowledge available at the time of wellconstruction. This in turn must reflect the knowledge that wentinto forming the design of the well, the materials available at thetime of construction, and the knowledge-based regulations thatgoverned construction at that time. Failure rates measured in aspecific time period are artifacts of that period; they should not bereflective of wells designed and completed later. In well construc-tion, the last 15 years have arguably brought more advances (newpipe alloys, better pipe joints, improved coatings, new cements,and subsurface diagnostics by seismic and logging delivering bet-ter understanding of earth forces) than the previous 15 decades ofoil and gas operations.
2. Early-time failures reflect both the quality of well construc-tion and general early component failure (similar to items on anew car that must be repaired in the first few weeks of operation).
3. Time reflects the potential for natural degradation of materi-als and changing earth stresses, both natural and man-made.Structures age; that is inescapable. The impact of aging, however,is highly geographically variable and controllable to a degreewith maintenance. Structures in dry climates and soils often ageslowly, while structures in wet areas, salt-spray zones, acid soils,and tectonically active areas can be degraded and even destroyedin a few years. The oldest producing wells, for example, are morethan a century old and many have not leaked, while high-pres-sure/high-temperature (HP/HT), thermal-cycled, and corrosive-environment wells may have a well life of a decade or less beforepermanent plugging and isolation is required.
Time has also recorded changes in energy-source availability,from the easily obtainable conventional-reservoir petroleum re-sources to dependence on and development of resources that aremuch more difficult to access. This, in turn, has created technol-ogy-driven approaches that have been difficult for some, bothinside and outside the industry, to learn and accept.
The potential for downhole leaks to the environment may di-minish rapidly as the reservoir pressure is depleted. Low-bottom-hole-pressure wells do not have the driving force to opposeconstant hydrostatic pressure of fluids outside the wellbore; hence,if a leak path is formed through the sequence of barriers, the high-est potential is for exterior fluids (usually salt water) to leak into awellbore. However, if gas leaks into the well, buoyancy will driveit upward toward the wellhead. Older wells that have been main-tained through monitoring and repair can be extended past theirdesign life through programs that assess damage and repair or re-equip wells as needed. An example from a 1932-vintage Bahrainoil field in the Arabian Gulf illustrates a moderate degree of cas-ing damage from exterior corrosion, and how the threat was mini-mized through design and workovers (Sivakumar and Janahi2004). Casing leaks (one-barrier failure) seem to have occurred inmany of the 750 wells, in which corrosive saltwater flowed intothe wells (minimum exterior pollution). In a sequence of designchanges dating from 1932 to the early 2000s, casing damage andbarrier failures were driven down from 60% frequency to a rareoccurrence by inspection, monitoring, and proper maintenance.Another example from Ekofisk fields in the North Sea involvedoverburden deformation caused by production-induced compac-tion of highly porous, soft-chalk reservoirs. The compaction andhorizontal movement of the chalk formations created more than150 casing-deformation incidences near or in the deep-chalk res-ervoir. Significant numbers of collapses began appearing afternearly 8 years of oil production in 1982 to 1984, and by 1994, cas-ing deformations, some to the point of casing collapse, had beenmeasured on wells from all three of the production platforms andboth water-injector platforms. Pressure maintenance through addi-tion of water injection in 1987 was the first documented methodto completely halt the deformations in older wells, while changesto well design proved effective in handling the deformation prob-lem in new wells (Schwall and Denney 1994; Schwall et al.1996). In the Ekofisk example, although the deep casing was oftencollapsed, there was no leak path formed that could allow escapeof hydrocarbons to shallow environments.
In general terms, well-construction problems can be caused byleaking pipe connections, inadequate cementing, corrosion, cyclicloads, thermal extremes, earth stresses, abrasion, and other fac-tors. Failures are most commonly reflected by a barrier failure,and few of these failures are severe enough to breach all the bar-riers and pollute groundwater. The modern US petroleum industryis nearly 100 years old, delineated by creation of effectivecementing technology, the birth of modern pressure-controlmethods. US and dedicated worldwide petroleum-developmentattempts go back more than 100 years before that. Risk reductionhas been driven by changes in technology, with an increasing im-portance to environmental drivers emerging in the past 25 years.
From the first US gas wells that used wooden pipe (circa1820s) to a few years after the beginning of the twentieth century,zonal isolation of early wells was haphazard at best. The first truelong-term isolation attempts applying Portland cement in 1903marked the start of the cemented-pipe era. The effective two-plugcementing system invented by Almond Perkins in 1916 movedcement into a proven isolation technique (Oklahoma HistoricalSociety 2013). Along the way, advances in every well-construc-tion technology improved zonal-isolation reliability. Major erasof operation and the notable improvements are shown in Table 3.
Note that the learnings in era time period produce lower ratesof well failures afterward. When comparing failure rates of wells,regardless of location, well type, or operator, the wells and theproblems associated with those wells should be compared within asingle time period of well development. Additionally, technologyadvances have driven improvements in wells, often without a clearintent to accomplish that goal. For example, rotary drilling enableddevelopment of surface pressure-control systems that eliminatedmost blowouts, hydraulic fracturing drove better cementing prac-tices, and pipe designs and horizontal wells reduced the total wellcount in many areas, thereby sharply lowering any risk of surfaceand subsurface pollution of freshwater formations. Development
November 2013 SPE Production & Operations 327

of HP/HT reservoirs drove development of better seals and pres-sure-handling technology.
Studies of Well FailuresAccording to a review of state-investigated exploration-and-pro-duction (E&P) pollution incidences in Ohio (185 cases in approxi-mately 65,000 wells) and Texas (211 cases in approximately250,000 wells), the majority of pollution incidents were fromD&C; production; wells that were no longer operated, but had notbeen maintained or properly plugged and abandoned (also knownas orphaned wells); and waste disposal (Table 4). The produc-tion-well problems were dominated by leaks from pipelines andtanks. These data include a significant amount of legacy databefore the Texas regulations on pits, cementing, and barrierdesign were changed in 1969 (Kell 2012). A large overhaul ofTexas well regulations in 2012–13 further stiffened well-designand implementation requirements.
Many of the D&C incidents were cement-isolation problems,some before the cementing regulations were changed in 1969 or1996, and before those being examined again currently. Fifty-seven of the 75 waste-related incidents in Texas during the studyperiod were legacy issues with disposal pits that were outlawed in1969. Texas has an industry tax-funded program that has reducedthe number of orphaned wells from 18,000 in 2002 to less than8,000 in 2009, and currently is engaging in P&A of 1,400 wells/yrof the remaining total of orphaned wells (Kell 2012).
A review of Ohio wells similarly suggested that the pollutionincidents were related to early completion practices. Direct quotesfrom the report of Kell (2012) report follow.
“During the 25 year study period (1983–2007), Ohio docu-mented 185 groundwater contamination incidents caused by his-toric or regulated oilfield activities. Of those, 144 groundwatercontamination incidents were caused by regulated activities, and41 incidents resulted from orphaned well leakage. Seventy-six ofthe incidents caused by regulated activities (52.7 percent)occurred during the first five years of the study (1983–1987).”
“When viewed in five year increments, the number of inci-dents caused by regulated activities declined significantly (90.1percent) during the study period. Seventy-eight percent (113) ofall documented regulated activity incidents were caused by dril-ling or production phase activities. Improper construction ormaintenance of reserve pits was the primary source of ground-water contamination, which accounted for 43.8 percent of allregulated activity incidents (63) in Ohio.”
“During the 16 year study period (1993–2008), Texas docu-mented 211 groundwater contamination incidents. More than 35percent of these incidents (75) resulted from waste managementand disposal activities including 57 legacy incidents caused byproduced water disposal pits that were banned in 1969 and closedno later than 1984. Releases that occurred during productionphase activities including storage tank or flow line leaks resultedin 26.5 percent of all activity regulated by the Texas RailroadCommission (TRC) incidents (56) in Texas.”
“During the study period, over 16,000 horizontal shale gaswells, with multi-staged hydraulic fracturing stimulations, were
TABLE 3—APPROXIMATE TIMELINE FOR POLLUTION POTENTIAL BY ERA
Time EraApproximation Operation Norms
Era Potential For Pollution FromWell Construction
1820s to 1916 Cable-tool drilling; no cement isolation; wells openlyvented to atmosphere.
High
1916 to 1970 Cementing isolation steadily improving. Moderate
1930s to present Rotary drilling replacing cable tool; pressure-control systemsand well-containment systems developed.
Moderate
1952 to present Hydraulic fracturing commercialized; reduced the number ofdevelopment wells and required better pipe, couplings, and
cement isolation (Clark 1987; Sugden et al. 2012).
Low from fracturing aspects (King 2012)
Mid-1960s to 2000 Gas-tight couplings and joint makeup improving. Moderate for vertical wells, joint designsimproving for horizontal wells.
Mid-1970s to present Cementing improvements, including cement design software;data on flow at temperature; dynamic cementing; swelling
cement; flexible, gas-tight; and self-healing cements enteringmarket (Baumgarte et al. 1999; Beirute et al. 1992; Lockyearet al. 1990; Parcevaux and Sault 1984; Ravi et al. 2002a, b;
Chenevert and Shrestha 1991; Holt and Lahoti 2012).
Lower
1988 to present Multiple-fracture horizontal wells; pad drilling reducingenvironmental land footprint up to 90%. Improvements in
lower-toxicity chemicals from late 1990s.
Lower
2005 to present Well-integrity assessments; premium couplings; addingadditional barriers and cementing full strings (Valigura and
Tallin 2005).
Lower, particularly after 2010 when statelaws were strengthened on well design.
2008 to present Chemical-hazard and endocrine disruptors recognized infracturing chemicals and sharply reduced. Real-time
well-integrity needs being studied to achieve early warningand problem avoidance.
Lowest yet, most states caught up withdesign and inspection requirements.
TABLE 4—INCIDENTS INVESTIGATED AND IDENTIFIED
Pollution Causes (Kell 2012)
State Ohio Texas
Study period (years) 26 16
Number of wells producing 65,000 250,000
Number of cases investigated 185 211
Site related 0 0
D&C related 74 10
Fracture related 0 0
Producer related 39 56
Orphan-well related 41 30
Waste-disposal related 26 75
P&A related 5 1
Unknown 0 39
328 November 2013 SPE Production & Operations
completed in Texas. Prior to 2008, only one horizontal shale gaswell was completed in Ohio. During their respective study peri-ods, neither the oil nor gas regulating bodies of the states of Texas(TRC) or Ohio (Division of Minerals Resource Management)identified a single groundwater contamination incident resultingfrom site preparation, drilling, well construction, completion, hy-draulic fracturing stimulation, or production operations at any ofthese horizontal shale gas wells.”
The incident rate of problems from exploration to P&A, ifbased on the number of producing wells, would be 1 in nearly1,200, while the rate of incidents on total wells drilled in Texas(more than one million, with more than 250,000 in operation),would be approximately 1 in 5,000. Note that there were no inci-dents that directly involved fracturing. This is consistent withrecent studies (King 2012). These data also indicate that historicalenvironmental incidents associated with oil and gas developmentwere more commonly associated with aboveground fluid han-dling, leaking tanks or flowlines, or use of surface pits to containfluids, and were less commonly associated with actual well designand construction. Steps have been taken to improve the safety andprotection provided by all aspects of hydrocarbon production andtransport, as documented in the data by the reduction in incidentsin recent wells.
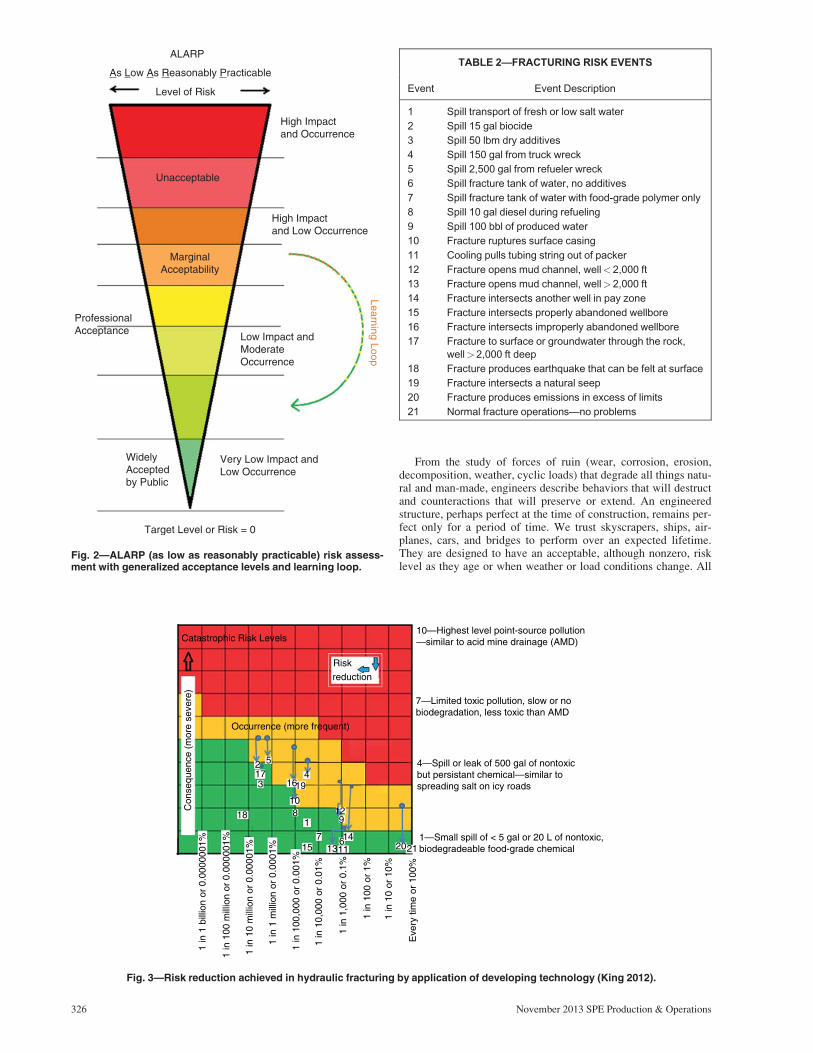
On a worldwide scale, the barrier-failure rate varies consider-ably. In a study that examined well-integrity issues, not failures, awide variance between barrier failures in different regions indi-cates that conditions, and perhaps perceptions, may play a role inhow well-barrier failures are reported and treated; Table 5(Feather 2011).
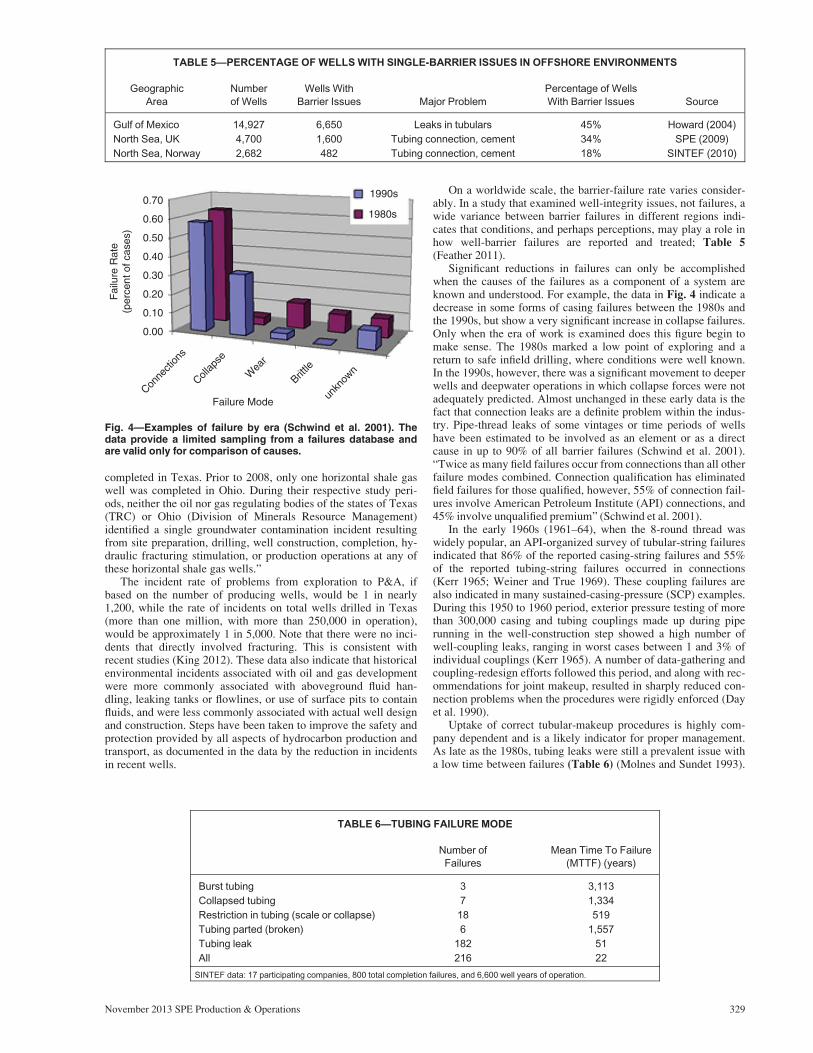
Significant reductions in failures can only be accomplishedwhen the causes of the failures as a component of a system areknown and understood. For example, the data in Fig. 4 indicate adecrease in some forms of casing failures between the 1980s andthe 1990s, but show a very significant increase in collapse failures.Only when the era of work is examined does this figure begin tomake sense. The 1980s marked a low point of exploring and areturn to safe infield drilling, where conditions were well known.In the 1990s, however, there was a significant movement to deeperwells and deepwater operations in which collapse forces were notadequately predicted. Almost unchanged in these early data is thefact that connection leaks are a definite problem within the indus-try. Pipe-thread leaks of some vintages or time periods of wellshave been estimated to be involved as an element or as a directcause in up to 90% of all barrier failures (Schwind et al. 2001).“Twice as many field failures occur from connections than all otherfailure modes combined. Connection qualification has eliminatedfield failures for those qualified, however, 55% of connection fail-ures involve American Petroleum Institute (API) connections, and45% involve unqualified premium” (Schwind et al. 2001).
In the early 1960s (1961–64), when the 8-round thread waswidely popular, an API-organized survey of tubular-string failuresindicated that 86% of the reported casing-string failures and 55%of the reported tubing-string failures occurred in connections(Kerr 1965; Weiner and True 1969). These coupling failures arealso indicated in many sustained-casing-pressure (SCP) examples.During this 1950 to 1960 period, exterior pressure testing of morethan 300,000 casing and tubing couplings made up during piperunning in the well-construction step showed a high number ofwell-coupling leaks, ranging in worst cases between 1 and 3% ofindividual couplings (Kerr 1965). A number of data-gathering andcoupling-redesign efforts followed this period, and along with rec-ommendations for joint makeup, resulted in sharply reduced con-nection problems when the procedures were rigidly enforced (Dayet al. 1990).
Uptake of correct tubular-makeup procedures is highly com-pany dependent and is a likely indicator for proper management.As late as the 1980s, tubing leaks were still a prevalent issue witha low time between failures (Table 6) (Molnes and Sundet 1993).
TABLE 5—PERCENTAGE OF WELLS WITH SINGLE-BARRIER ISSUES IN OFFSHORE ENVIRONMENTS
GeographicArea
Numberof Wells
Wells WithBarrier Issues Major Problem
Percentage of WellsWith Barrier Issues Source
Gulf of Mexico 14,927 6,650 Leaks in tubulars 45% Howard (2004)
North Sea, UK 4,700 1,600 Tubing connection, cement 34% SPE (2009)
North Sea, Norway 2,682 482 Tubing connection, cement 18% SINTEF (2010)
0.701990s
1980s0.60
0.50
0.40
Fai
lure
Rat
e(p
erce
nt o
f cas
es)
0.30
0.20
0.10
0.00
Failure ModeCon
necti
ons
Collap
se
Wea
r
Brittle
unkn
own
Fig. 4—Examples of failure by era (Schwind et al. 2001). Thedata provide a limited sampling from a failures database andare valid only for comparison of causes.
TABLE 6—TUBING FAILURE MODE
Number ofFailures
Mean Time To Failure(MTTF) (years)
Burst tubing 3 3,113
Collapsed tubing 7 1,334
Restriction in tubing (scale or collapse) 18 519
Tubing parted (broken) 6 1,557
Tubing leak 182 51
All 216 22
SINTEF data: 17 participating companies, 800 total completion failures, and 6,600 well years of operation.
November 2013 SPE Production & Operations 329
When compared to other tubing failures, connection leaks werean obvious problem.
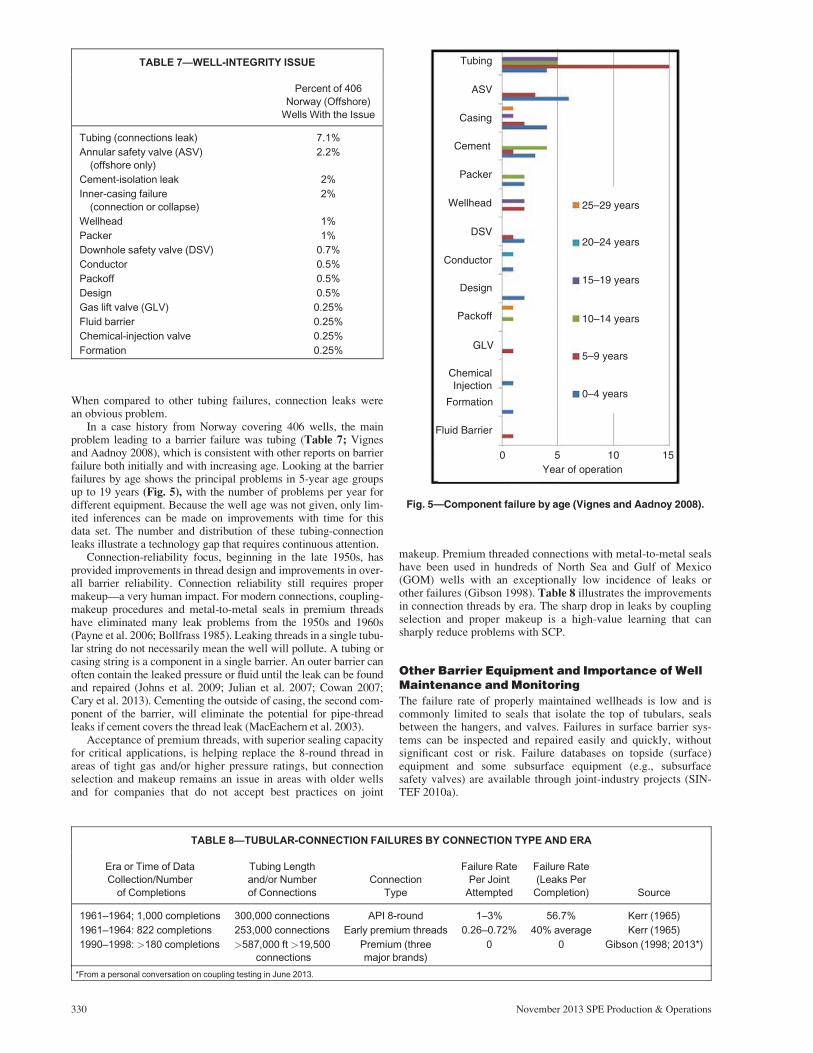
In a case history from Norway covering 406 wells, the mainproblem leading to a barrier failure was tubing (Table 7; Vignesand Aadnoy 2008), which is consistent with other reports on barrierfailure both initially and with increasing age. Looking at the barrierfailures by age shows the principal problems in 5-year age groupsup to 19 years (Fig. 5), with the number of problems per year fordifferent equipment. Because the well age was not given, only lim-ited inferences can be made on improvements with time for thisdata set. The number and distribution of these tubing-connectionleaks illustrate a technology gap that requires continuous attention.
Connection-reliability focus, beginning in the late 1950s, hasprovided improvements in thread design and improvements in over-all barrier reliability. Connection reliability still requires propermakeup—a very human impact. For modern connections, coupling-makeup procedures and metal-to-metal seals in premium threadshave eliminated many leak problems from the 1950s and 1960s(Payne et al. 2006; Bollfrass 1985). Leaking threads in a single tubu-lar string do not necessarily mean the well will pollute. A tubing orcasing string is a component in a single barrier. An outer barrier canoften contain the leaked pressure or fluid until the leak can be foundand repaired (Johns et al. 2009; Julian et al. 2007; Cowan 2007;Cary et al. 2013). Cementing the outside of casing, the second com-ponent of the barrier, will eliminate the potential for pipe-threadleaks if cement covers the thread leak (MacEachern et al. 2003).
Acceptance of premium threads, with superior sealing capacityfor critical applications, is helping replace the 8-round thread inareas of tight gas and/or higher pressure ratings, but connectionselection and makeup remains an issue in areas with older wellsand for companies that do not accept best practices on joint
makeup. Premium threaded connections with metal-to-metal sealshave been used in hundreds of North Sea and Gulf of Mexico(GOM) wells with an exceptionally low incidence of leaks orother failures (Gibson 1998). Table 8 illustrates the improvementsin connection threads by era. The sharp drop in leaks by couplingselection and proper makeup is a high-value learning that cansharply reduce problems with SCP.
Other Barrier Equipment and Importance of WellMaintenance and MonitoringThe failure rate of properly maintained wellheads is low and iscommonly limited to seals that isolate the top of tubulars, sealsbetween the hangers, and valves. Failures in surface barrier sys-tems can be inspected and repaired easily and quickly, withoutsignificant cost or risk. Failure databases on topside (surface)equipment and some subsurface equipment (e.g., subsurfacesafety valves) are available through joint-industry projects (SIN-TEF 2010a).
TABLE 7—WELL-INTEGRITY ISSUE
Percent of 406Norway (Offshore)
Wells With the Issue
Tubing (connections leak) 7.1%
Annular safety valve (ASV)(offshore only)
2.2%
Cement-isolation leak 2%
Inner-casing failure(connection or collapse)
2%
Wellhead 1%
Packer 1%
Downhole safety valve (DSV) 0.7%
Conductor 0.5%
Packoff 0.5%
Design 0.5%
Gas lift valve (GLV) 0.25%
Fluid barrier 0.25%
Chemical-injection valve 0.25%
Formation 0.25%
Tubing
ASV
Casing
Cement
Packer
Wellhead
DSV
Conductor
Design
Packoff
GLV
ChemicalInjection
Formation
Fluid Barrier
0 5
0–4 years
5–9 years
10–14 years
15–19 years
20–24 years
25–29 years
Year of operation10 15
Fig. 5—Component failure by age (Vignes and Aadnoy 2008).
TABLE 8—TUBULAR-CONNECTION FAILURES BY CONNECTION TYPE AND ERA
Era or Time of DataCollection/Number
of Completions
Tubing Lengthand/or Numberof Connections
ConnectionType
Failure RatePer Joint
Attempted
Failure Rate(Leaks Per
Completion) Source
1961–1964; 1,000 completions 300,000 connections API 8-round 1–3% 56.7% Kerr (1965)
1961–1964: 822 completions 253,000 connections Early premium threads 0.26–0.72% 40% average Kerr (1965)
1990–1998: >180 completions >587,000 ft >19,500connections
Premium (threemajor brands)
0 0 Gibson (1998; 2013*)
*From a personal conversation on coupling testing in June 2013.
330 November 2013 SPE Production & Operations

Geographic and Well-Type Variance of Risk inWell CompletionsThe type of well and its location form the largest variable on riskto well completions. Wells must be designed to handle the specificenvironment, both inside and outside the well. A simplistic viewof how certain well types might be viewed for barrier-failure riskis shown in Fig. 6.
Although the well-type comparison of failure estimates is sim-plistic, it highlights issues created by thermal and pressure loadingin cyclic operations and the effects of corrosive environmentsinside and outside the well that must be properly handled in thedesign phase. Lower risks of horizontal multiple-fracture wellsmay be a surprise to some, but observations in Kell (2012) regard-ing the absence of incidences in the previously referenced Texasstudy of 16,000 horizontal wells provide significant proof andsubstantiate engineering expectations that wells properly designedfor hydraulic stimulation with modern techniques and materialscan provide excellent environmental protection.
A first-pass comparison of failures as they relate to well typeis given in Table 7 (Molnes and Sundet 1993). MTTF data areuseful as a general comparison of longevity of well equipment ascompared to other equipment or similar equipment in differentwells. As recognized in the industry, the produced-fluid type has asignificant influence on the durability and longevity of the tubingstring. The MTTF shows oil production to have the least “wear”impact, and water injection to have the most wear because corro-sion and thread leaks affected by corrosion are the dominant fail-ure mechanisms (Table 9). This has significant impact on barrierlongevity and reinforces the expectation that wells designed forwater injection typically require more attention during metallurgyselection and ongoing inspection than wells handling a less corro-sive hydrocarbon stream.
SCP. One of the first signs of a compromised barrier is SCP orsustained annular pressure (SAP), known also as surface casing-vent flow (SCVF) when the casing vent is opened to relieve thepressure (API RP 90 2006; Attard 1991; Bourgoyne et al. 1999;Soter et al. 2003; Tinsley et al. 1980; Watson and Bachu 2009;Bachu and Watson 2006, 2009). SCP or SAP is described as devel-opment of a sustained pressure in between the tubing and casing orbetween a pair of casing strings that is not caused solely by heatingof the well when placed on production. A sustained pressure maybe bled off quickly, but returns over hours or days after the annulusis shut in. Each of the annular spaces (Fig. 7) is a separate pressurevessel, and the casing strings are nested to provide redundant bar-riers. Although one barrier may develop a leak, secondary barrierswill contain the pressure and prevent a leak to the outside.
Depending on the type, pressure, and depth of a well, theremay be two to five or more annular spaces in a well. The presenceof sustained pressure in the annulus area indicates two things:
Higher Failure Rate
Fire Flood
HP/HT
High CompactionStress
Fractured New Well
Lower Failure Rate
Horizontal Multifractured
Fractured Old Well
Corrosive Environment
Corrosive Exterior Fluid
Cyclic Steam
Fig. 6—Estimate of failure frequency by well type.
TABLE 9—TUBING-SERVICE TIME BY WELL TYPE (SINTEFDATA)
Well TypeService Time(tubing years)
Number ofFailures
MTTF(years)
Oil Production 5,496 3 3,113
Gas/CondensateProduction
1,522 7 1,334
Water Injection 1,756 18 518
Gas Injection 533 6 1,556
Data from Molnes and Sundet (1993). Total tubing base of 9,333 well years.
Tubing/production-casing annulus
Production-/intermediate-casing annulus
Intermediate-liner-tie-back/intermediate-casing annulus
Intermediate-/surface-casing annulus
Fig. 7—A well schematic showing five casing strings and a tub-ing string with a packer set in the tubing/production-casingannulus.
November 2013 SPE Production & Operations 331

1. There may be a seepage-rate flow through at least one tub-ing string or casing string or through the cement. From this andother studies, the flow path is most likely either in a pipe couplingin an uncemented steel-pipe string or a microannulus or othertype of leak in the cement sheath surrounding the pipe.
2. The pipe and cement on the outside of the annulus are con-taining the pressure (and fluids), and there may be no significantleak to the environment outside of the well, known also as gasmigration (Watson and Bachu 2009).
Wells are created with nested redundant barriers that are designedso that a secondary, and sometimes a tertiary, barrier backs up theprimary barrier. When SAP is detected in a well, the well must beassessed for safety and containment before further well operationscan be considered. If remaining barriers are not capable of containingpressure and fluids, the well must be shut in and secured.
The presence of SAP appears to be related to geographic loca-tion and geology of the sediments (presence of soft formationsand natural seepage paths of gas or oil), the operator’s construc-tion procedures, the type of well (corrosive-fluid production,high-pressure, cyclic behavior, high-temperature formations), andthe age of the well. Complications from reservoir compaction inyoung weak rocks often cause casing or tubing collapse, requiringchanges in design (Bruno 1992; Burkowsky et al. 1981; Fredrichet al. 1996; Hilbert et al. 1999; Li et al. 2003).
Barrier- and Well-Failure Frequency From CaseHistories and DatabasesUsing extensive presented literature from several technical soci-eties, Table 10 captures ranges of barrier failures without appa-rent leaks and well-integrity failure (all barriers in a sequencefail) in which fluids (oil and gas) may move from inside to outsidethe well (contamination/pollution) or from outside to inside thewell (intrusion of salt water).
Reported leak rates without specific leak-path determinationswere assumed under worst-case scenario to be leaks rather thanbarrier failures.
Offshore wells are examples of the high end of the barrier-fail-ure range, even though completed production wells in this grouppresent virtually no potential for groundwater pollution becauseof the absence of subsurface freshwater aquifers offshore. Thedata are presented for comparison purposes to well constructionfor land-based wells with higher-strength formations.
US GOM offshore well data show the worst-case barrier failureand pollution potential reporting because the wells are mainly ingas-charged, often high-initial-pressure (overpressured), geologi-
cally young and soft marine sands—a combination of geologic andproduction extremes that presents a difficult well-constructionenvironment. Interestingly, for at least the past 3 decades in theGOM, excluding the outlier of the Macondo D&C blowout in2010, the amount of oil entering the GOM from natural seeps is 50to 500 times the amount spilled or leaked from producing wells(National Research Council 2003; BOEM 2010) (Fig. 8).
GOM-produced-oil leakage by decade as a percentage of oilproduced ranges from a low of 0.00005 (1990–99) to 0.007%(1960–69). Macondo (D&C-activity failure) was the clear outlierin GOM oil spills with just less than 1% spillage in 2010. Naturalseeps are shown as constant-volume estimates, but many of thenatural seeps are episodic in nature.
SCP. Industry experience on the GOM offshore continental shelfhas shown that the most serious problems with SCP have resultedfrom tubing leaks. Pollution from SCP is minor, but a risk of ablowout is increased in some cases (Bourgoyne et al. 1999, 2000).Examples of wells with high barrier failure and low well-integrityfailure in these offshore environments document the higher bar-rier-failure rate offshore and the positive effect of the multiple-barrier system in controlling pollution (reduction of well-integrityfailures to levels far below barrier failure) (Table 11).
The sixth example, a study of 175 wells in Sumatra Islandshowed the consequences of time in a changing environmentcoupled with lack of sufficient maintenance. This combinationcreated a barrier-failure rate of 43% and a well-failure rate (withpotential exterior leakage) of up to 4% (Calosa et al. 2010).
Why Well-Integrity Failures Produce FewPollution IncidentsAs opposed to loss of control during drilling in high-pressure res-ervoirs, such as the Macondo well, loss of control from completedand producing wells occurs very infrequently for several reasons:!Many drilling failures are the result of unexpected high pres-
sure or other drilling-related factors in which the pressure barriersare mostly dynamic (mud weight and blowout-preventer control)and before the full range of permanent barriers are installed thatexist in a completed well. The expected frequency of surfacereleases in production wells (completed wells) is between one andtwo orders of magnitude lower during production than during dril-ling (Fischer 1996). Workovers during the life of the producingwells do raise the risk of a release, although the frequency is stillapproximately one order of magnitude lower than during drillingactivities (Edmondson and Hide 1996).
TABLE 10—DISTRIBUTION OF BARRIER FAILURES AND WELL-INTEGRITY FAILURES SHOWING IMPROVEMENT BY ERA(ALL LAND WELLS)
Area/Numberof Wells
Number ofConstruction
Failures
Barrier-FailureFrequency Range
(Containment)
Well-IntegrityFailure Range
(Containment Lost)
Leaks toGroundwater by
Sampling Data Sources
OH/64,830 74 fail initial cementtest; 39 fail inproduction.
1983–2007 0.035%in 34,000 wells(0.1% in older
wells—worst case)
0.06% for all wells Detail not available Kell (2012)
TX/253,090 10 fail initial cementtest; 56 fail inproduction.
0.02% all wells 0.02% for older erawells; 0.004% for
newer wells
0.005–0.01% forproducers;
0.03–0.07% forinjectors
Kell (2012) TexasGroundwater Pro-
tection Council(TGPC) data(1997–2011)
TX/16,000 horizontal,multifractured
No reported fail-ures—added
barrier.
No failure reported No failure date orpollution reports
No well-associatedpollution
Kell (2012)
MN/671 Salt-creep crushcasing
5.5% Unknown None reported Clegg (1971)
Alberta/316,000 Total vent-flow data No separation dataavailable
4.6% taken as worstcase.
No data—mostlygas escape
Watson and Bachu(2009)
332 November 2013 SPE Production & Operations

! Completed wells are constructed of multiple barriers thathave been tested and are monitored where applicable.! Most importantly, the pressure inside a completed producing
oil or gas well drops constantly during primary production. In oilwells, with little or no gas pressure, the potential for liquids insidethe well to flow to the outside of the well is sharply reduced con-sidering the outside fluid gradients that increase the outside (leak-opposing) pressure with increasing depth. Gas wells are notaffected in quite the same manner. Although decreased pressurein the gas well diminishes the driving pressure, the lack of liquidhydrostatic backpressure allows more pressure near the surfacethan would be possible in an oil well.
Cementing BasicsCasing and cement barriers in a well result from running casing toan acceptable depth in the formation after drilling a section of a
well. Each section is cased and cemented before the drilling canbe continued to deepen the well. If the cement in a section of thewell fails to pass testing requirements, the cement isolation mustbe repaired before drilling of the next section can commence. Thesteel casing provides burst, collapse, and tension strength, and thecement fill of the annular space between the drilled hole and theoutside of the casing string provides the seal that isolates fluidsand pressures. The cement on the outside of the specific stringmay reach the surface or to a lower level, depending on the needsof the completion and the threat level of an isolation failure in theoverall design. The amount of cement required to isolate a pipestring depends on the pressures to be isolated and the quality ofthe isolation (pressure test and bonding to inner pipe and outerpipe or formation). The overall effectiveness of the seal dependson the amount of cement fill, the properties of the set cement,elimination of mud and gas channels within the cement, and the
6,000,000,000
5,000,000,000
4,000,000,000
3,000,000,000
Bar
rels
of o
il
Decade
2,000,000,000
1,000,000,000
01960–69 1970–79 1980–89
1990–992000–09 2010
Oil leaked
Natural-seep oilOil produced
500,000,000
1,120,000
4,500,000
11,200,000
18,0002,000
7,000106,000 11,200,00011,200,000
11,200,00011,200,000
1,460,000,000
3,455,000,0003,387,000,000
4,051,000,000
5,450,000,000
Oil produced
Natural-seep oil
Oil leaked
99,000
Sin
gle
year
Fig. 8—Fifty years of GOM oil production, natural-seep estimates, and oil leaks by decade. The 2010 Macondo spill volume was avery high-side outlier, but is a reminder of spill potential.
TABLE 11—SCP REPORTS—BARRIER AND WELL FAILURE FOR PLATFORM-BASED DEVIATED OFFSHORE WELLS
Area/WellsBarrier-Failure Frequency(Containment Maintained)
Well-Integrity Failure(Containment Lost) Data Source
US GOM—11,498wells (3,542active)
30% overall had barrier failure with(tubing/production casing) SCP of
50% of cases. 90% of SCP had lessthan 1,000 psi. 10% more seriousform of SCP requiring immediate
shut-in to avoid pollution.
0.01–0.05% of wellsleaked. This compared to
total measured losses of oilof 0.00005% to 0.0003% of
all produced oil(1980–2009).
Bourgoyne et al. (1999;2000); National Research
Council (2003); BOEM(2010); Wojtanowicz et al.
(2001)
UG GOM—4,099wells (shoe testonly; all repaired)
12–18% of all wells failed one cementtest. All required repair before con-
tinuing drilling.
Zero—cement repairedand tested successfully.
Harris et al. (2001)
Norway—406compaction,shear, and sandfailures
18% None reported (barrier fail-ure and shut in for repair).
Vignes and Aadnoy (2008)
GOM andTrinidad—2,120sand-controlfailures
0.05 to >1% sand-control failures,well control maintained.
Approximately 0.0001%failure at surface because
of erosion.
King et al. (2003)
Matagorda IslandPlatform—17wells—subsi-dence andcompaction
80–100% had some level of SCP; thehigh number is because of high pres-
sure and formation compaction.
Wells routinely shut in andrepaired before restart.
Li et al. (2003)
Sumatra—175—Example of nomaintenance
43% had some form of barrier failure. Well leaks were reportedas 1 to 4% before repairs
were started.
Calosa et al. (2010)
November 2013 SPE Production & Operations 333

bonding of the cement to the pipe and the formation (Watson andBachu 2009; Lockyear et al. 1990).
The cement does not need to be perfect over every foot of thecemented area, but at least some part of the cement column mustform a durable and permanent seal that isolates fluids from mov-ing behind the pipe that could contaminate or cause detrimentalmixing of fluids from one formation with fluids from another for-mation (i.e., provide hydraulic isolation). The required amount ofthis “perfect” cement in a longer column of cement has beenshown to be at least 50 ft (Fig. 9). This figure documents 27 short-term comparisons of successful isolation of pressure in a stackedand sequentially completed pay with as much as 14,000-psi pres-sure differential between zones in high-pressure gas wells alongthe soft sediments of the Louisiana Gulf Coast and the GOM.Industry commonly uses from 200 to 600 ft of cement in overlapsections.
Additional barriers in a well may include a tubing string andpacker with a monitored annulus between the tubing (the flowpath) and the inner casing string.
Depending on the region and the specific geologic conditions,there may be need for one to three barriers in a simple completionwith low risk, and likely two to five barriers in higher-risk areas.The differences in design consider pressure, depth, separation,presence of usable water, corrosion potential, and cementingeffectiveness in an area, as well as operator expertise in bothdesign and execution (Smith et al. 2012; Popa et al. 2008). Someannuli between casing strings are cemented to surface and someare left open to enable monitoring of any leak potential from theinside string (O’Brien 1996). A cement sheath is expected to pro-vide mechanical support to the casing string and must provideboth mechanical and hydraulic isolation for all productive hori-zons for the life of the well (Gray et al. 2009).
Cement Effectiveness in Reducing Pollution RiskUsing results from a study of subsurface water-injection opera-tions in the Williston basin, a model was developed to assess themaximum quantifiable risk that water from water-injection wellswould reach an underground source of drinking water. The upperbound of the probability of injection water escaping the wellboreand reaching underground sources of drinking water (USDW) isseven chances in one million well years where casing and cementcover the drinking-water aquifers. Where surface casings do notcover USDW, the probability is six chances in 1,000 well years(Michie and Koch 1991). The 1,000:1 improvement is a testimonyto the efficiency of annular cement.
Cement Bond, Isolation Quality, and Bond TestingThe question of how to most effectively test the cement isolationis more involved than most people anticipate. Cement-bond logs(CBLs), for example, are not always the best investigation tool.
Whether or not a bond log should be run depends on the accuracyand usefulness of the information it gives in a particularapplication.
CBLs, which may be sonic or ultrasonic, range from simpleaveraging instruments (similar to those that came out in 1960) tothe more-sophisticated models that investigate 60# segments ofthe cemented annulus around the tool (Grosmangin et al. 1961;Flournoy and Feaster 1963; Fertl et al. 1974; Fertl and Pilkington1975; Pilkington 1992; Bigelow 1985; Jutten et al. 1991; Good-win and Crook 1992; Gai et al. 1996; Frisch et al. 2000, 2002;Garnier et al. 2007). A properly run and executed CBL or cement-evaluation tool (CET) can provide some information on cementfill behind the pipe, going past the single area of the cementedshoe and upward and along the wellbore, where a pressure testwill not reach.
CBLs are widely used as indicators to help achieve a goodcement job in the first few wells in an area and validate a goodcementing program that will be used on subsequent wells. CBLsmay also be needed after a pressure test has failed on a section ofthe well during initial construction. For well rework and suspectedchanges in integrity, many other leak-detection methods offermore-accurate determination of leaks than can be produced with aCBL (Johns et al. 2009; Julian et al. 2007). CBLs can give a rea-sonable estimate of bonding and a semiquantitative idea of pres-ence or absence of larger cement channels, but will not certifypressure or hydraulic isolation of a zone. Field performance for aproperly run and calibrated CBL is approximately 90% in findingchannels of 10% or more of total annular space (Albert et al.1988). Smaller annular channels are not easily identifiable with abond log because of variations in cement composition that createdensity differences in the cement. This finding was proved bylong-term production without problems, water-free well perform-ance (water isolation), and pressure measurements over time(Flournoy and Feaster 1963). Data in these field tests showedmany wells with effective isolation even though the percentage ofacceptable bond ranged from 31 to 75%. Error within the applica-tion and interpretation of CBLs has resulted in numerous work-overs to repair cement that was not faulty, resulting in highworkover costs and a decrease in the well integrity by unneces-sary perforating and attempting to block squeeze cement that waseffective in isolating a zone but “appeared” to have poor bondcharacteristics on an imprecise CBL.
With the exception of a pressure test, requiring a CET on ev-ery cement job appears to be a questionable policy, with possibledetrimental economic and structural consequences for squeezecementing attempts made on wells with cement indicated as sus-pect by CBL investigation, but proved to be effective by a pres-sure test and long-term production.
Methane leakage from the ground may also be associated withwell construction by soil and rock disturbance as the well is beingdrilled or for a short time after completion (Dusseault et al. 2000,2001). Soil gas disturbance and subsequent venting either aroundthe casing (short term) or into the well (longer term) are usuallyfound where a large amount of organic materials and/or small gasaccumulations are found and either continuously produced ortrapped near surface. Examples are swamp lands, muskegs, tarsands, and some permafrost areas (Slater 2010; Macedo et al.2012; Dousett et al. 1997). Of 316,000 wells in the province ofAlberta, Canada, an estimated 4.6% had small SCVFs that lasteda few hours or more after completion (Watson and Bachu 2009).In a 20,500-well subset of steam-injection wells in the shallowtar-sands area in Alberta, almost 15% experienced SCVFs(Nygaard 2010). This drives home the point of geographical loca-tion and illustrates the difficulty of achieving effective seals inshallow, highly gas-productive areas that also are rich in gas seepsand often are poorly consolidated.
Natural Surface Seeps of Gas and Oil—NaturalPathways and Natural Pollution SourcesUnderstanding hydrocarbon movement within natural seeps of oiland gas is critical to the realization that many forms of methane
Isolation—Pressure Differential vs. Cemented SeparationNo breakdown, Tuscaloosa
14,000
Max
imum
Diff
eren
tial P
ress
ure
Bet
wee
n Z
ones
, psi 12,000
10,000
8,000
6,000
4,000
2,000
00 100 200
Cemented Separation Between Zones, ft300 400
No breakdown, MatagordaIsolation breakdown, Tuscaloosa
Fig. 9—Zone-to-zone isolation testing rub by Amoco on Mata-gorda (GOM) and Tuscaloosa (Pointe Coupe Parish, Louisiana)from 1990 to 1997 (from an internal Amoco report).
334 November 2013 SPE Production & Operations

migration are, in fact, a part of nature. Seep maps from the 1930sand 1940s (Link 1952) show a direct correlation with many fields,and hundreds of oil seeps are documented in the GOM and morethan a thousand on land in North America, with perhaps as manyas 10,000 seeps worldwide (Etiope 2009a, b). While many unin-formed observers may recognize the correlation between docu-mented hydrocarbon emissions and the presence of oil and gaswells, they may misread the causality. The presence of natural gasor oil seeps is often the first indicator of highly prospective dril-ling locations.
Wells are concentrated where significant hydrocarbons accu-mulations and natural seepage exist (Fig. 10)—a comment so evi-dent as to not need stating, except for the strident dialogue againstthe smallest leakage of hydrocarbon to the surface of the Earth. Itis, in fact, these small methane leaks that drew attention to thelarger mass of hydrocarbons that lay deep beneath the surface.Producible hydrocarbon accumulations have a common trait—natural seeps of gas and oil bring hydrocarbon fluids to the surfacethrough natural pathways in significant quantities (Wilson et al.
1974; Kvenvolden and Cooper 2003; Kvenvolden and Rogers2005; National Research Council 2003). Organisms in water andsoil have evolved to degrade and use these hydrocarbon sourcesas food.
Natural seeps are significant contributors to the global atmos-pheric-methane budget in which the worldwide total global meth-ane seep of 5 to 10 Bcf/D ranks just behind the wetlandsemissions of 10 to 15 Bcf/D (Kvenvolden and Rogers 2005; Lei-fer et al. 2006; Etiope and Klusman 2002; Wilson et al. 1974).
Fig. 11 presents a compilation of the most severe US oil spillsfrom wells and transport. Because spill volumes are rough esti-mates, several sources were used to achieve a reasonable assess-ment of oil lost. Spills may originate from many sources, buttransportation is a primary source. Of the three major spills in thetable from the upstream end (E&P) of the oil business, all threeare from drilling- or workover-related causes, not from producingwells.
The yearly ranking of natural-seep contributions of oil intowaters off California from the Coal Point seep (largest natural oilseep in the world with daily seep rates of 2,000 to 3,000 gal of oiland 2 MMscf/D of gas) and the oil leakage by the 600" naturalseeps underlying productive areas of the GOM). The Kuwaitwell-sabotage incident was where more than 600 wells wereopened or the wellheads shattered with explosives. Interestingly,the use of up to 700 lbm (approximately 320 kg) of high explo-sives in direct contact with each wellhead only damaged the cas-ing to a depth of approximately 8 to 13 ft (2.4 to 4 m) (Cudd1992). The average yearly flow from the GOM and land-basednatural seeps that are carried into the GOM every year is esti-mated to be approximately 25% of the volume spilled by the 99days of uncontrolled flow from the Macondo well (Nationalresearch Council 2003).
The information on seeps and spills from tanker and pipelinesources is shown only to put the leak volumes in perspective on atotal oil-leakage basis, not to attempt to excuse spill behaviors.Seep volumes have a high degree of volume variance becausemost seeps are episodic in nature.
Surface flow rates of many oil and gas seeps have droppedsharply in the past century as wells produced fluids from the reser-voirs that fed the seeps (Quigley et al. 1999). Edwin Drake fol-lowed the oil and gas seeps along Oil Creek, near Titusville,Pennsylvania and, in 1859, developed the first purpose-drilled USwell for oil that achieved commercial production. The well hit oilat a depth of 69.5 ft, which is shallower than many current Penn-sylvania water-supply wells.
Hydrocarbons are generated in two ways—by thermal matura-tion of organic materials that form a range of alkanes from C1
(Methane) to oils of C20", and by biologic activity that formsmost short-chain alkanes such as methane gas. Hydrocarbons andfresh-/usable-water aquifers often share pore space within many
Total: 4.3 Million Wells
Wells per 100 sq miles1–50
51–250
251–500
501–1000
> 1000
Sedimentary basins
Source: Kvenvolden and Rogers (2005), Etiope and Klusman (2002)
Sedimentary Basins in US and CanadaWell Density in US and Canada
Includes information and data supplied by IHS Global Incorporated and its affiliates: Copyright 2011 all rights reserved
Areas of possible micro- and macroseeps ofmethane to the surface
Fig. 10—Comparison with well density and natural-seep location.
1,000
10,000
100,000
1,000,000
10,000,000
Lakeview Gusher,CA Onshore, 1910
Santa BarbaraBlowout, CA, 1969Tanker Grounding,
MA, 1976Tanker Grounding,
AK, 1989Tanker Grounding,
TX, 1990Sabotage, Kuwait,
1992Tanker Grounding,
LA, 2000Pipelines Rupturedby Hurricanes,…
Barge Collision, LA,2008
Tanker Collision, TX,2010
Pipeline Corrosion,MI, 2010
Macondo Blowout,GOM, 2010
Natural Seeps,Coal Point, CA, Yearly
Natural Seeps,GOM, Yearly
Barrels
Single estimate
High value range
Fig. 11—Spills within the US with reference to the sabotagereleases in Kuwait of 1991 and yearly US natural-seep volumes.
November 2013 SPE Production & Operations 335
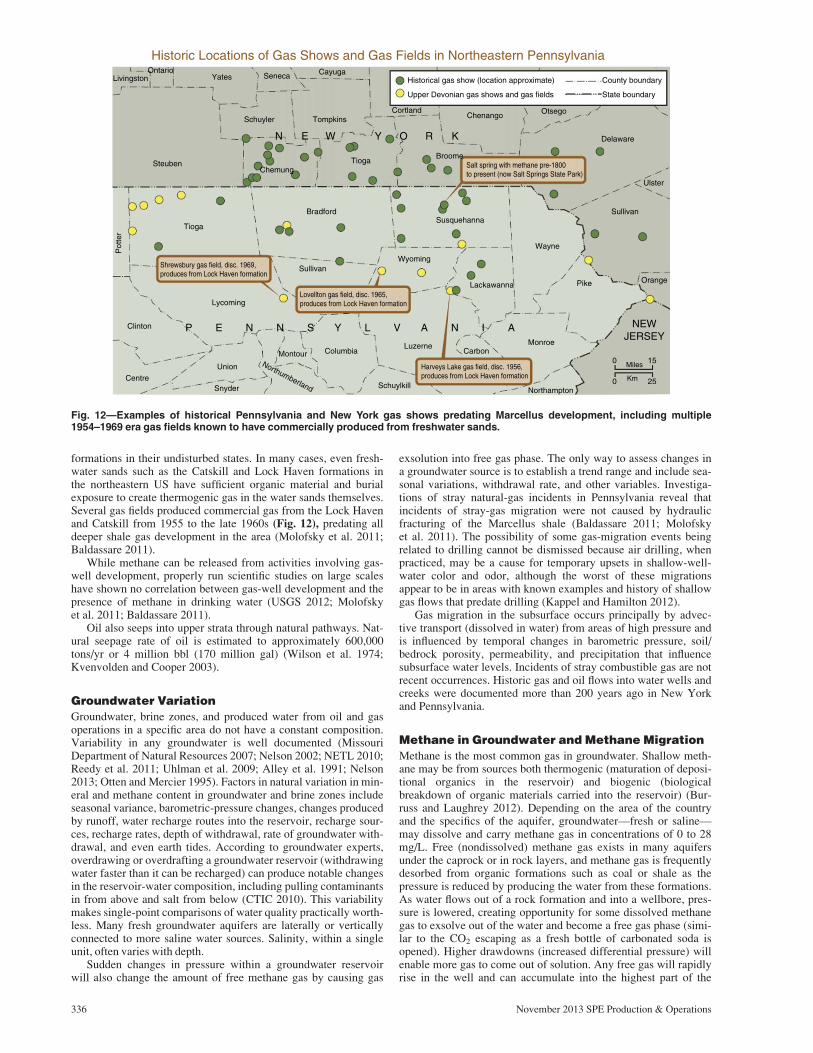
formations in their undisturbed states. In many cases, even fresh-water sands such as the Catskill and Lock Haven formations inthe northeastern US have sufficient organic material and burialexposure to create thermogenic gas in the water sands themselves.Several gas fields produced commercial gas from the Lock Havenand Catskill from 1955 to the late 1960s (Fig. 12), predating alldeeper shale gas development in the area (Molofsky et al. 2011;Baldassare 2011).
While methane can be released from activities involving gas-well development, properly run scientific studies on large scaleshave shown no correlation between gas-well development and thepresence of methane in drinking water (USGS 2012; Molofskyet al. 2011; Baldassare 2011).
Oil also seeps into upper strata through natural pathways. Nat-ural seepage rate of oil is estimated to approximately 600,000tons/yr or 4 million bbl (170 million gal) (Wilson et al. 1974;Kvenvolden and Cooper 2003).
Groundwater VariationGroundwater, brine zones, and produced water from oil and gasoperations in a specific area do not have a constant composition.Variability in any groundwater is well documented (MissouriDepartment of Natural Resources 2007; Nelson 2002; NETL 2010;Reedy et al. 2011; Uhlman et al. 2009; Alley et al. 1991; Nelson2013; Otten and Mercier 1995). Factors in natural variation in min-eral and methane content in groundwater and brine zones includeseasonal variance, barometric-pressure changes, changes producedby runoff, water recharge routes into the reservoir, recharge sour-ces, recharge rates, depth of withdrawal, rate of groundwater with-drawal, and even earth tides. According to groundwater experts,overdrawing or overdrafting a groundwater reservoir (withdrawingwater faster than it can be recharged) can produce notable changesin the reservoir-water composition, including pulling contaminantsin from above and salt from below (CTIC 2010). This variabilitymakes single-point comparisons of water quality practically worth-less. Many fresh groundwater aquifers are laterally or verticallyconnected to more saline water sources. Salinity, within a singleunit, often varies with depth.
Sudden changes in pressure within a groundwater reservoirwill also change the amount of free methane gas by causing gas
exsolution into free gas phase. The only way to assess changes ina groundwater source is to establish a trend range and include sea-sonal variations, withdrawal rate, and other variables. Investiga-tions of stray natural-gas incidents in Pennsylvania reveal thatincidents of stray-gas migration were not caused by hydraulicfracturing of the Marcellus shale (Baldassare 2011; Molofskyet al. 2011). The possibility of some gas-migration events beingrelated to drilling cannot be dismissed because air drilling, whenpracticed, may be a cause for temporary upsets in shallow-well-water color and odor, although the worst of these migrationsappear to be in areas with known examples and history of shallowgas flows that predate drilling (Kappel and Hamilton 2012).
Gas migration in the subsurface occurs principally by advec-tive transport (dissolved in water) from areas of high pressure andis influenced by temporal changes in barometric pressure, soil/bedrock porosity, permeability, and precipitation that influencesubsurface water levels. Incidents of stray combustible gas are notrecent occurrences. Historic gas and oil flows into water wells andcreeks were documented more than 200 years ago in New Yorkand Pennsylvania.
Methane in Groundwater and Methane MigrationMethane is the most common gas in groundwater. Shallow meth-ane may be from sources both thermogenic (maturation of deposi-tional organics in the reservoir) and biogenic (biologicalbreakdown of organic materials carried into the reservoir) (Bur-russ and Laughrey 2012). Depending on the area of the countryand the specifics of the aquifer, groundwater—fresh or saline—may dissolve and carry methane gas in concentrations of 0 to 28mg/L. Free (nondissolved) methane gas exists in many aquifersunder the caprock or in rock layers, and methane gas is frequentlydesorbed from organic formations such as coal or shale as thepressure is reduced by producing the water from these formations.As water flows out of a rock formation and into a wellbore, pres-sure is lowered, creating opportunity for some dissolved methanegas to exsolve out of the water and become a free gas phase (simi-lar to the CO2 escaping as a fresh bottle of carbonated soda isopened). Higher drawdowns (increased differential pressure) willenable more gas to come out of solution. Any free gas will rapidlyrise in the well and can accumulate into the highest part of the
Historic Locations of Gas Shows and Gas Fields in Northeastern Pennsylvania
LivingstonOntario
Yates Seneca Cayuga
Schuyler
SteubenChemung
Bradford
TiogaBroome
Chenango
Historical gas show (location approximate)
Upper Devonian gas shows and gas fields
County boundary
State boundary
Cortland Otsego
Delaware
Ulster
Sullivan
OrangePike
0 15
0 25
NEWJERSEY
Wayne
Susquehanna
Wyoming
Lackawanna
Sullivan
Lycoming
Tioga
Pot
ter
Union
Montour ColumbiaLuzerne
CarbonMonroe
Miles
KmSchuylkill
Northumberland NorthamptonSnyderCentre
Clinton
Salt spring with methane pre-1800to present (now Salt Springs State Park)
Shrewsbury gas field, disc. 1969,produces from Lock Haven formation
Lovellton gas field, disc. 1965,produces from Lock Haven formation
Harveys Lake gas field, disc. 1956,produces from Lock Haven formation
Tompkins
N
P E N N S Y L V A N I A
E W Y O R K
Fig. 12—Examples of historical Pennsylvania and New York gas shows predating Marcellus development, including multiple1954–1969 era gas fields known to have commercially produced from freshwater sands.
336 November 2013 SPE Production & Operations
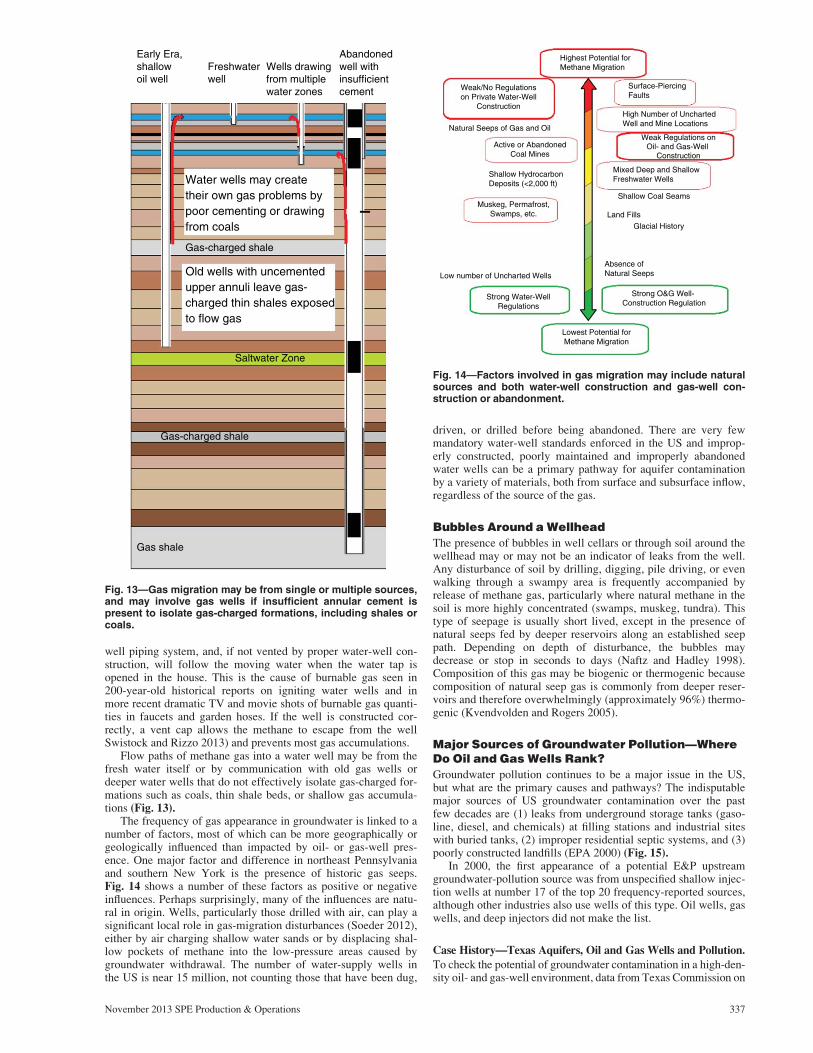
well piping system, and, if not vented by proper water-well con-struction, will follow the moving water when the water tap isopened in the house. This is the cause of burnable gas seen in200-year-old historical reports on igniting water wells and inmore recent dramatic TV and movie shots of burnable gas quanti-ties in faucets and garden hoses. If the well is constructed cor-rectly, a vent cap allows the methane to escape from the wellSwistock and Rizzo 2013) and prevents most gas accumulations.
Flow paths of methane gas into a water well may be from thefresh water itself or by communication with old gas wells ordeeper water wells that do not effectively isolate gas-charged for-mations such as coals, thin shale beds, or shallow gas accumula-tions (Fig. 13).
The frequency of gas appearance in groundwater is linked to anumber of factors, most of which can be more geographically orgeologically influenced than impacted by oil- or gas-well pres-ence. One major factor and difference in northeast Pennsylvaniaand southern New York is the presence of historic gas seeps.Fig. 14 shows a number of these factors as positive or negativeinfluences. Perhaps surprisingly, many of the influences are natu-ral in origin. Wells, particularly those drilled with air, can play asignificant local role in gas-migration disturbances (Soeder 2012),either by air charging shallow water sands or by displacing shal-low pockets of methane into the low-pressure areas caused bygroundwater withdrawal. The number of water-supply wells inthe US is near 15 million, not counting those that have been dug,
driven, or drilled before being abandoned. There are very fewmandatory water-well standards enforced in the US and improp-erly constructed, poorly maintained and improperly abandonedwater wells can be a primary pathway for aquifer contaminationby a variety of materials, both from surface and subsurface inflow,regardless of the source of the gas.
Bubbles Around a WellheadThe presence of bubbles in well cellars or through soil around thewellhead may or may not be an indicator of leaks from the well.Any disturbance of soil by drilling, digging, pile driving, or evenwalking through a swampy area is frequently accompanied byrelease of methane gas, particularly where natural methane in thesoil is more highly concentrated (swamps, muskeg, tundra). Thistype of seepage is usually short lived, except in the presence ofnatural seeps fed by deeper reservoirs along an established seeppath. Depending on depth of disturbance, the bubbles maydecrease or stop in seconds to days (Naftz and Hadley 1998).Composition of this gas may be biogenic or thermogenic becausecomposition of natural seep gas is commonly from deeper reser-voirs and therefore overwhelmingly (approximately 96%) thermo-genic (Kvendvolden and Rogers 2005).
Major Sources of Groundwater Pollution—WhereDo Oil and Gas Wells Rank?Groundwater pollution continues to be a major issue in the US,but what are the primary causes and pathways? The indisputablemajor sources of US groundwater contamination over the pastfew decades are (1) leaks from underground storage tanks (gaso-line, diesel, and chemicals) at filling stations and industrial siteswith buried tanks, (2) improper residential septic systems, and (3)poorly constructed landfills (EPA 2000) (Fig. 15).
In 2000, the first appearance of a potential E&P upstreamgroundwater-pollution source was from unspecified shallow injec-tion wells at number 17 of the top 20 frequency-reported sources,although other industries also use wells of this type. Oil wells, gaswells, and deep injectors did not make the list.
Case History—Texas Aquifers, Oil and Gas Wells and Pollution.To check the potential of groundwater contamination in a high-den-sity oil- and gas-well environment, data from Texas Commission on
Early Era,shallowoil well
Freshwaterwell
Wells drawingfrom multiplewater zones
Abandonedwell withinsufficientcement
Water wells may createtheir own gas problems bypoor cementing or drawingfrom coals
Old wells with uncementedupper annuli leave gas-charged thin shales exposedto flow gas
Saltwater Zone
Gas-charged shale
Gas-charged shale
Gas shale
Fig. 13—Gas migration may be from single or multiple sources,and may involve gas wells if insufficient annular cement ispresent to isolate gas-charged formations, including shales orcoals.
Highest Potential forMethane Migration
Weak/No Regulationson Private Water-Well
Construction
Surface-PiercingFaults
High Number of UnchartedWell and Mine Locations
Weak Regulations onOil- and Gas-Well
Construction
Mixed Deep and ShallowFreshwater Wells
Shallow Coal Seams
Land FillsGlacial History
Absence ofNatural Seeps
Strong O&G Well- Construction Regulation
Strong Water-WellRegulations
Low number of Uncharted Wells
Shallow HydrocarbonDeposits (<2,000 ft)
Natural Seeps of Gas and Oil
Muskeg, Permafrost,Swamps, etc.
Active or AbandonedCoal Mines
Lowest Potential forMethane Migration
Fig. 14—Factors involved in gas migration may include naturalsources and both water-well construction and gas-well con-struction or abandonment.
November 2013 SPE Production & Operations 337
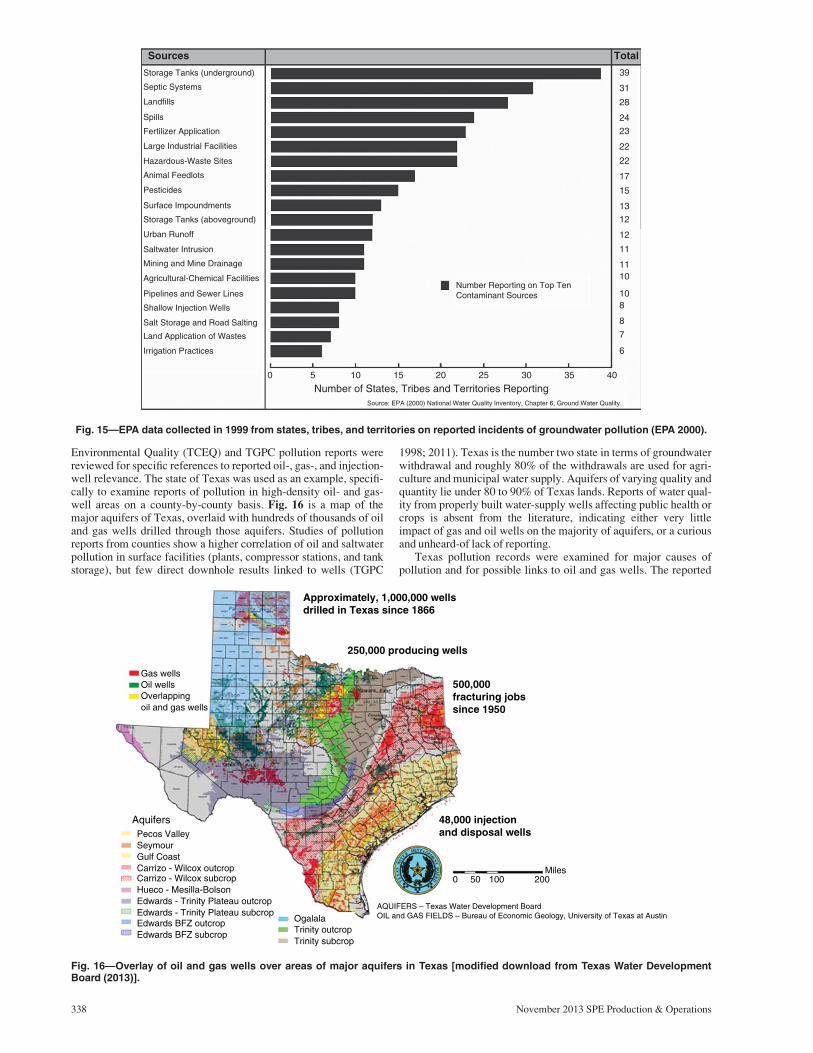
Environmental Quality (TCEQ) and TGPC pollution reports werereviewed for specific references to reported oil-, gas-, and injection-well relevance. The state of Texas was used as an example, specifi-cally to examine reports of pollution in high-density oil- and gas-well areas on a county-by-county basis. Fig. 16 is a map of themajor aquifers of Texas, overlaid with hundreds of thousands of oiland gas wells drilled through those aquifers. Studies of pollutionreports from counties show a higher correlation of oil and saltwaterpollution in surface facilities (plants, compressor stations, and tankstorage), but few direct downhole results linked to wells (TGPC
1998; 2011). Texas is the number two state in terms of groundwaterwithdrawal and roughly 80% of the withdrawals are used for agri-culture and municipal water supply. Aquifers of varying quality andquantity lie under 80 to 90% of Texas lands. Reports of water qual-ity from properly built water-supply wells affecting public health orcrops is absent from the literature, indicating either very littleimpact of gas and oil wells on the majority of aquifers, or a curiousand unheard-of lack of reporting.
Texas pollution records were examined for major causes ofpollution and for possible links to oil and gas wells. The reported
Sources Total
Storage Tanks (underground)
Septic Systems
Landfills
Spills
Fertilizer Application
Large Industrial Facilities
Hazardous-Waste Sites
Animal Feedlots
Pesticides
Surface Impoundments
Storage Tanks (aboveground)
Urban Runoff
Saltwater Intrusion
Mining and Mine Drainage
Agricultural-Chemical Facilities
Pipelines and Sewer Lines
Shallow Injection Wells
Salt Storage and Road Salting
Land Application of Wastes
Irrigation Practices
Number Reporting on Top TenContaminant Sources
0 5 10 15 20 25 30 35 40Number of States, Tribes and Territories Reporting
Source: EPA (2000) National Water Quality Inventory, Chapter 6, Ground Water Quality.
39
31
28
2423
22
22
17
15
1312
12
11
1110
108
87
6
Fig. 15—EPA data collected in 1999 from states, tribes, and territories on reported incidents of groundwater pollution (EPA 2000).
AquifersPecos ValleySeymourGulf CoastCarrizo - Wilcox outcropCarrizo - Wilcox subcropHueco - Mesilla-BolsonEdwards - Trinity Plateau outcropEdwards - Trinity Plateau subcropEdwards BFZ outcrop Ogalala
AQUIFERS – Texas Water Development BoardOIL and GAS FIELDS – Bureau of Economic Geology, University of Texas at Austin
Trinity outcropTrinity subcrop
Edwards BFZ subcrop
0 50 100 200Miles
Gas wellsOil wellsOverlappingoil and gas wells
Approximately, 1,000,000 wellsdrilled in Texas since 1866
250,000 producing wells
500,000fracturing jobssince 1950
48,000 injectionand disposal wells
Fig. 16—Overlay of oil and gas wells over areas of major aquifers in Texas [modified download from Texas Water DevelopmentBoard (2013)].
338 November 2013 SPE Production & Operations

information (volumes of pollutant released) was not available.Fig. 17 shows a strong, but decreasing reporting frequency ofimpact from underground gasoline and diesel storage tanks at fill-ing stations, and variable exposure to manufacturing chemicals,solvents, and waste oils, and very small incidents of spills involv-ing road transport of oil.
The percentage of pollution reports that TCEQ and TGPCidentified as under TRC authority varied between less than 1% toa maximum of approximately 10% of the total new pollutionreports each year. Further analysis of these reports showed abreakdown of cases in which surface facilities (tanks, separators,gas plants, compressors, and gathering lines) and pipelines wereresponsible for approximately 90% of the pollution incidentsunder TRC jurisdiction. The remaining reports of pollution,roughly less than 1% of the total reported each year, concernedthe 200,000 to 250,000 wells that are producing, injecting, orshut-in in Texas during the respective time period. All leaks wereascribed to wells whether they had been investigated or not—aworst-case approach. No leaks from abandoned wells were listed,although these may have been addressed under the Texas orphan-
well program, which ranks and then plugs and abandons morethan 1,400 wells/yr, on the basis of proceeds from a tax on permitsand operators. The breakdown is shown in Fig. 18.
Conclusions1. Current redundant-barrier well design with nested cemented
casing strings is effective in sharply reducing pollution poten-tial from oil and gas wells.
2. One or more barriers in a properly designed and constructedoil or gas well may fail without creating a pollution pathwayor significantly raising the risk of groundwater pollution.
3. The overall risk of groundwater pollution from a producingwell is extremely low.
4. Individual barrier-failure rates and well-failure rates varywidely with type of well, geographical location, and mainte-nance culture of the operator, as well as with the regulatoryregime in place in the respective jurisdiction.
5. Individual well-barrier element failure rates are often one totwo orders of magnitude greater than well-integrity failures in
Gasoline (from underground petroleum storage tank)Semivolatile Organic Compound and Volatile Organic Compound
Chlorinated SolventsTotal Petroleum Hydrocarbons (non-TRC control)
Chlorinated Mixed MaterialsUnidentified Metals
All Benzene and BTEX materialsDiesel (from underground petroleum storage tank)
UnknownToxic Metals (Sb, As, Pb, Hg, Cr, Zn, etc.)
Waste OilMethyl Tertiarybutyl Ether (fuel additive)
Pesticides and HerbicidesNitrate and Nitrite
Polychlorinated BiphenylPolycyclic Aromatic Hydrocarbon
BariumCrude Oil (transport)
RadioactiveBrominated and Other Halogenated
2000
2006
2011
0 500 1000 1500 2000 2500 3000 3500 4000 4500 5000
Fig. 17—Reported incidents of groundwater pollution in Texas (TGPC records from 2000 to 2011; BTEX 5 benzene, toluene, ethyl-benzene, and xylene).
% of new complaints of underground stroge tanks
% of new TCEQ complaints that are surface TRC
% of new TCEQ complaints that are pipeline TRC
% of new TCEQ complaints that are injection/saltwater disposal wells TRC
% of new TCEQ complaints that are oil wells TRC
% of new TCEQ complaints that are gas well TRC
19980.0%
Per
cent
of T
otal
New
Cla
ims
10.0%
20.0%
30.0%
40.0%
50.0%
60.0%
70.0%
80.0%
90.0%
2000 2002 2004 2006 2008 2010 2012
Fig. 18—Comparison of new underground-storage-tank pollution reports from possible well-pollution claims and reports separat-ing subsurface from surface (facility, tank batteries, compressor locations, and gas plants), pipelines and injection, and oil andgas wells using data from TGPC, TCEQ, and TRC pollution reporting from 2000 to 2011.
November 2013 SPE Production & Operations 339
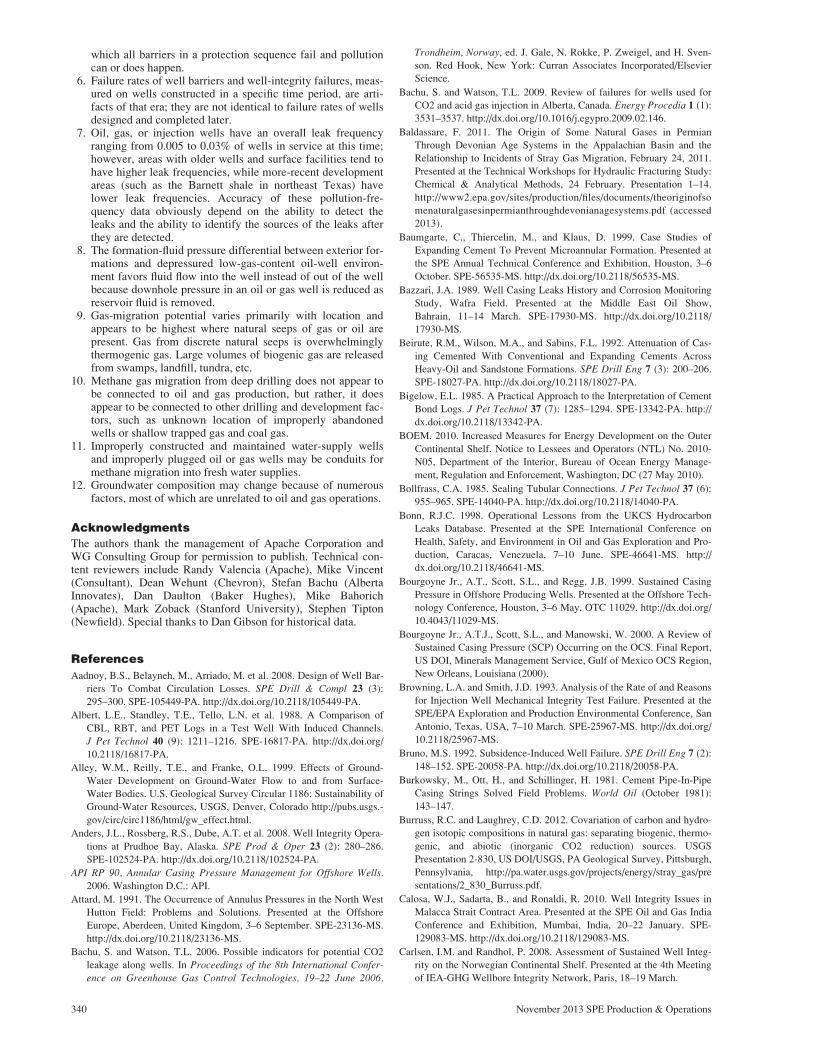
which all barriers in a protection sequence fail and pollutioncan or does happen.
6. Failure rates of well barriers and well-integrity failures, meas-ured on wells constructed in a specific time period, are arti-facts of that era; they are not identical to failure rates of wellsdesigned and completed later.
7. Oil, gas, or injection wells have an overall leak frequencyranging from 0.005 to 0.03% of wells in service at this time;however, areas with older wells and surface facilities tend tohave higher leak frequencies, while more-recent developmentareas (such as the Barnett shale in northeast Texas) havelower leak frequencies. Accuracy of these pollution-fre-quency data obviously depend on the ability to detect theleaks and the ability to identify the sources of the leaks afterthey are detected.
8. The formation-fluid pressure differential between exterior for-mations and depressured low-gas-content oil-well environ-ment favors fluid flow into the well instead of out of the wellbecause downhole pressure in an oil or gas well is reduced asreservoir fluid is removed.
9. Gas-migration potential varies primarily with location andappears to be highest where natural seeps of gas or oil arepresent. Gas from discrete natural seeps is overwhelminglythermogenic gas. Large volumes of biogenic gas are releasedfrom swamps, landfill, tundra, etc.
10. Methane gas migration from deep drilling does not appear tobe connected to oil and gas production, but rather, it doesappear to be connected to other drilling and development fac-tors, such as unknown location of improperly abandonedwells or shallow trapped gas and coal gas.
11. Improperly constructed and maintained water-supply wellsand improperly plugged oil or gas wells may be conduits formethane migration into fresh water supplies.
12. Groundwater composition may change because of numerousfactors, most of which are unrelated to oil and gas operations.
AcknowledgmentsThe authors thank the management of Apache Corporation andWG Consulting Group for permission to publish. Technical con-tent reviewers include Randy Valencia (Apache), Mike Vincent(Consultant), Dean Wehunt (Chevron), Stefan Bachu (AlbertaInnovates), Dan Daulton (Baker Hughes), Mike Bahorich(Apache), Mark Zoback (Stanford University), Stephen Tipton(Newfield). Special thanks to Dan Gibson for historical data.
ReferencesAadnoy, B.S., Belayneh, M., Arriado, M. et al. 2008. Design of Well Bar-
riers To Combat Circulation Losses. SPE Drill & Compl 23 (3):
295–300. SPE-105449-PA. http://dx.doi.org/10.2118/105449-PA.
Albert, L.E., Standley, T.E., Tello, L.N. et al. 1988. A Comparison of
CBL, RBT, and PET Logs in a Test Well With Induced Channels.J Pet Technol 40 (9): 1211–1216. SPE-16817-PA. http://dx.doi.org/
10.2118/16817-PA.
Alley, W.M., Reilly, T.E., and Franke, O.L. 1999. Effects of Ground-
Water Development on Ground-Water Flow to and from Surface-Water Bodies. U.S. Geological Survey Circular 1186: Sustainability ofGround-Water Resources, USGS, Denver, Colorado http://pubs.usgs.-
gov/circ/circ1186/html/gw_effect.html.
Anders, J.L., Rossberg, R.S., Dube, A.T. et al. 2008. Well Integrity Opera-
tions at Prudhoe Bay, Alaska. SPE Prod & Oper 23 (2): 280–286.SPE-102524-PA. http://dx.doi.org/10.2118/102524-PA.
API RP 90, Annular Casing Pressure Management for Offshore Wells.2006. Washington D.C.: API.
Attard, M. 1991. The Occurrence of Annulus Pressures in the North WestHutton Field: Problems and Solutions. Presented at the OffshoreEurope, Aberdeen, United Kingdom, 3–6 September. SPE-23136-MS.
http://dx.doi.org/10.2118/23136-MS.
Bachu, S. and Watson, T.L. 2006. Possible indicators for potential CO2
leakage along wells. In Proceedings of the 8th International Confer-ence on Greenhouse Gas Control Technologies, 19–22 June 2006,
Trondheim, Norway, ed. J. Gale, N. Rokke, P. Zweigel, and H. Sven-son. Red Hook, New York: Curran Associates Incorporated/ElsevierScience.
Bachu, S. and Watson, T.L. 2009. Review of failures for wells used forCO2 and acid gas injection in Alberta, Canada. Energy Procedia 1 (1):3531–3537. http://dx.doi.org/10.1016/j.egypro.2009.02.146.
Baldassare, F. 2011. The Origin of Some Natural Gases in PermianThrough Devonian Age Systems in the Appalachian Basin and theRelationship to Incidents of Stray Gas Migration, February 24, 2011.
Presented at the Technical Workshops for Hydraulic Fracturing Study:Chemical & Analytical Methods, 24 February. Presentation 1–14.
http://www2.epa.gov/sites/production/files/documents/theoriginofsomenaturalgasesinpermianthroughdevonianagesystems.pdf (accessed2013).
Baumgarte, C., Thiercelin, M., and Klaus, D. 1999. Case Studies ofExpanding Cement To Prevent Microannular Formation. Presented atthe SPE Annual Technical Conference and Exhibition, Houston, 3–6
October. SPE-56535-MS. http://dx.doi.org/10.2118/56535-MS.
Bazzari, J.A. 1989. Well Casing Leaks History and Corrosion MonitoringStudy, Wafra Field. Presented at the Middle East Oil Show,
Bahrain, 11–14 March. SPE-17930-MS. http://dx.doi.org/10.2118/17930-MS.
Beirute, R.M., Wilson, M.A., and Sabins, F.L. 1992. Attenuation of Cas-
ing Cemented With Conventional and Expanding Cements AcrossHeavy-Oil and Sandstone Formations. SPE Drill Eng 7 (3): 200–206.
SPE-18027-PA. http://dx.doi.org/10.2118/18027-PA.
Bigelow, E.L. 1985. A Practical Approach to the Interpretation of CementBond Logs. J Pet Technol 37 (7): 1285–1294. SPE-13342-PA. http://
dx.doi.org/10.2118/13342-PA.
BOEM. 2010. Increased Measures for Energy Development on the OuterContinental Shelf. Notice to Lessees and Operators (NTL) No. 2010-
N05, Department of the Interior, Bureau of Ocean Energy Manage-ment, Regulation and Enforcement, Washington, DC (27 May 2010).
Bollfrass, C.A. 1985. Sealing Tubular Connections. J Pet Technol 37 (6):
955–965. SPE-14040-PA. http://dx.doi.org/10.2118/14040-PA.
Bonn, R.J.C. 1998. Operational Lessons from the UKCS HydrocarbonLeaks Database. Presented at the SPE International Conference on
Health, Safety, and Environment in Oil and Gas Exploration and Pro-duction, Caracas, Venezuela, 7–10 June. SPE-46641-MS. http://dx.doi.org/10.2118/46641-MS.
Bourgoyne Jr., A.T., Scott, S.L., and Regg, J.B. 1999. Sustained CasingPressure in Offshore Producing Wells. Presented at the Offshore Tech-nology Conference, Houston, 3–6 May. OTC 11029. http://dx.doi.org/
10.4043/11029-MS.
Bourgoyne Jr., A.T.J., Scott, S.L., and Manowski, W. 2000. A Review ofSustained Casing Pressure (SCP) Occurring on the OCS. Final Report,
US DOI, Minerals Management Service, Gulf of Mexico OCS Region,New Orleans, Louisiana (2000).
Browning, L.A. and Smith, J.D. 1993. Analysis of the Rate of and Reasons
for Injection Well Mechanical Integrity Test Failure. Presented at theSPE/EPA Exploration and Production Environmental Conference, San
Antonio, Texas, USA, 7–10 March. SPE-25967-MS. http://dx.doi.org/10.2118/25967-MS.
Bruno, M.S. 1992. Subsidence-Induced Well Failure. SPE Drill Eng 7 (2):
148–152. SPE-20058-PA. http://dx.doi.org/10.2118/20058-PA.
Burkowsky, M., Ott, H., and Schillinger, H. 1981. Cement Pipe-In-PipeCasing Strings Solved Field Problems. World Oil (October 1981):
143–147.
Burruss, R.C. and Laughrey, C.D. 2012. Covariation of carbon and hydro-gen isotopic compositions in natural gas: separating biogenic, thermo-
genic, and abiotic (inorganic CO2 reduction) sources. USGSPresentation 2-830, US DOI/USGS, PA Geological Survey, Pittsburgh,Pennsylvania, http://pa.water.usgs.gov/projects/energy/stray_gas/pre
sentations/2_830_Burruss.pdf.
Calosa, W.J., Sadarta, B., and Ronaldi, R. 2010. Well Integrity Issues inMalacca Strait Contract Area. Presented at the SPE Oil and Gas India
Conference and Exhibition, Mumbai, India, 20–22 January. SPE-129083-MS. http://dx.doi.org/10.2118/129083-MS.
Carlsen, I.M. and Randhol, P. 2008. Assessment of Sustained Well Integ-
rity on the Norwegian Continental Shelf. Presented at the 4th Meetingof IEA-GHG Wellbore Integrity Network, Paris, 18–19 March.
340 November 2013 SPE Production & Operations
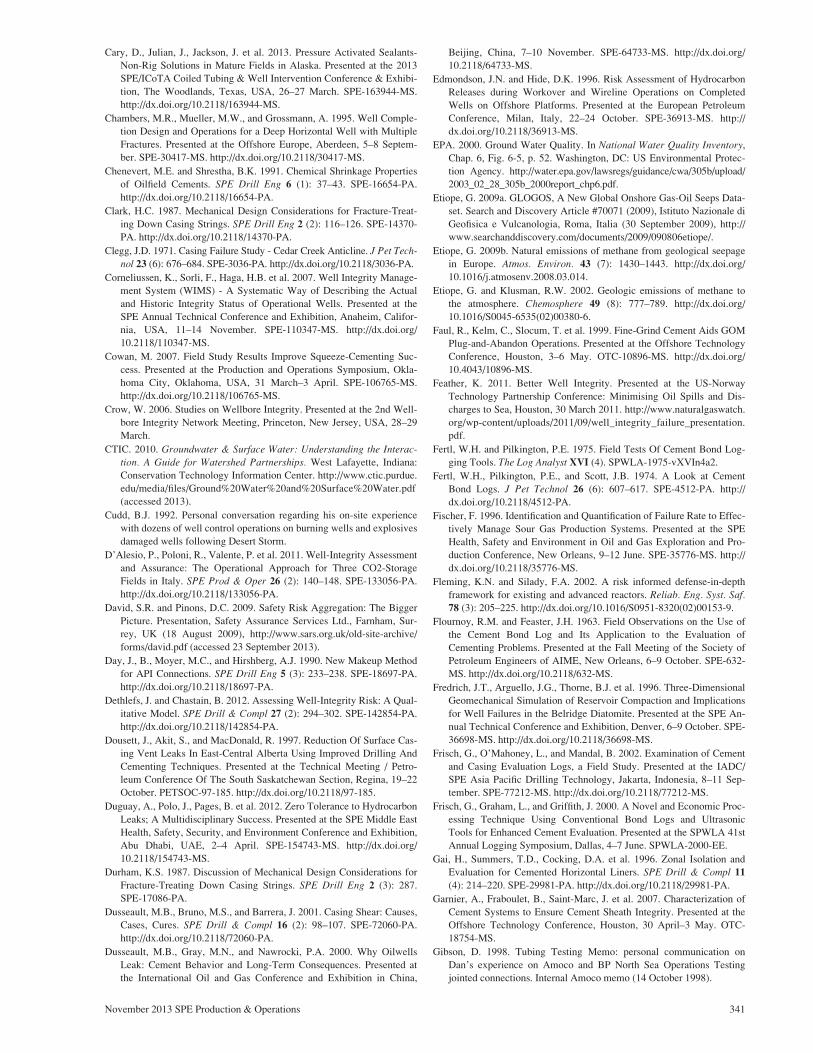
Cary, D., Julian, J., Jackson, J. et al. 2013. Pressure Activated Sealants-Non-Rig Solutions in Mature Fields in Alaska. Presented at the 2013SPE/ICoTA Coiled Tubing & Well Intervention Conference & Exhibi-
tion, The Woodlands, Texas, USA, 26–27 March. SPE-163944-MS.http://dx.doi.org/10.2118/163944-MS.
Chambers, M.R., Mueller, M.W., and Grossmann, A. 1995. Well Comple-tion Design and Operations for a Deep Horizontal Well with Multiple
Fractures. Presented at the Offshore Europe, Aberdeen, 5–8 Septem-ber. SPE-30417-MS. http://dx.doi.org/10.2118/30417-MS.
Chenevert, M.E. and Shrestha, B.K. 1991. Chemical Shrinkage Propertiesof Oilfield Cements. SPE Drill Eng 6 (1): 37–43. SPE-16654-PA.
http://dx.doi.org/10.2118/16654-PA.
Clark, H.C. 1987. Mechanical Design Considerations for Fracture-Treat-
ing Down Casing Strings. SPE Drill Eng 2 (2): 116–126. SPE-14370-PA. http://dx.doi.org/10.2118/14370-PA.
Clegg, J.D. 1971. Casing Failure Study - Cedar Creek Anticline. J Pet Tech-nol 23 (6): 676–684. SPE-3036-PA. http://dx.doi.org/10.2118/3036-PA.
Corneliussen, K., Sorli, F., Haga, H.B. et al. 2007. Well Integrity Manage-ment System (WIMS) - A Systematic Way of Describing the Actual
and Historic Integrity Status of Operational Wells. Presented at theSPE Annual Technical Conference and Exhibition, Anaheim, Califor-nia, USA, 11–14 November. SPE-110347-MS. http://dx.doi.org/
10.2118/110347-MS.
Cowan, M. 2007. Field Study Results Improve Squeeze-Cementing Suc-
cess. Presented at the Production and Operations Symposium, Okla-homa City, Oklahoma, USA, 31 March–3 April. SPE-106765-MS.
http://dx.doi.org/10.2118/106765-MS.
Crow, W. 2006. Studies on Wellbore Integrity. Presented at the 2nd Well-
bore Integrity Network Meeting, Princeton, New Jersey, USA, 28–29March.
CTIC. 2010. Groundwater & Surface Water: Understanding the Interac-tion. A Guide for Watershed Partnerships. West Lafayette, Indiana:Conservation Technology Information Center. http://www.ctic.purdue.
edu/media/files/Ground%20Water%20and%20Surface%20Water.pdf(accessed 2013).
Cudd, B.J. 1992. Personal conversation regarding his on-site experiencewith dozens of well control operations on burning wells and explosives
damaged wells following Desert Storm.
D’Alesio, P., Poloni, R., Valente, P. et al. 2011. Well-Integrity Assessment
and Assurance: The Operational Approach for Three CO2-StorageFields in Italy. SPE Prod & Oper 26 (2): 140–148. SPE-133056-PA.http://dx.doi.org/10.2118/133056-PA.
David, S.R. and Pinons, D.C. 2009. Safety Risk Aggregation: The Bigger
Picture. Presentation, Safety Assurance Services Ltd., Farnham, Sur-rey, UK (18 August 2009), http://www.sars.org.uk/old-site-archive/forms/david.pdf (accessed 23 September 2013).
Day, J., B., Moyer, M.C., and Hirshberg, A.J. 1990. New Makeup Methodfor API Connections. SPE Drill Eng 5 (3): 233–238. SPE-18697-PA.
http://dx.doi.org/10.2118/18697-PA.
Dethlefs, J. and Chastain, B. 2012. Assessing Well-Integrity Risk: A Qual-
itative Model. SPE Drill & Compl 27 (2): 294–302. SPE-142854-PA.http://dx.doi.org/10.2118/142854-PA.
Dousett, J., Akit, S., and MacDonald, R. 1997. Reduction Of Surface Cas-ing Vent Leaks In East-Central Alberta Using Improved Drilling And
Cementing Techniques. Presented at the Technical Meeting / Petro-leum Conference Of The South Saskatchewan Section, Regina, 19–22October. PETSOC-97-185. http://dx.doi.org/10.2118/97-185.
Duguay, A., Polo, J., Pages, B. et al. 2012. Zero Tolerance to Hydrocarbon
Leaks; A Multidisciplinary Success. Presented at the SPE Middle EastHealth, Safety, Security, and Environment Conference and Exhibition,Abu Dhabi, UAE, 2–4 April. SPE-154743-MS. http://dx.doi.org/
10.2118/154743-MS.
Durham, K.S. 1987. Discussion of Mechanical Design Considerations for
Fracture-Treating Down Casing Strings. SPE Drill Eng 2 (3): 287.SPE-17086-PA.
Dusseault, M.B., Bruno, M.S., and Barrera, J. 2001. Casing Shear: Causes,Cases, Cures. SPE Drill & Compl 16 (2): 98–107. SPE-72060-PA.
http://dx.doi.org/10.2118/72060-PA.
Dusseault, M.B., Gray, M.N., and Nawrocki, P.A. 2000. Why Oilwells
Leak: Cement Behavior and Long-Term Consequences. Presented atthe International Oil and Gas Conference and Exhibition in China,
Beijing, China, 7–10 November. SPE-64733-MS. http://dx.doi.org/10.2118/64733-MS.
Edmondson, J.N. and Hide, D.K. 1996. Risk Assessment of HydrocarbonReleases during Workover and Wireline Operations on Completed
Wells on Offshore Platforms. Presented at the European PetroleumConference, Milan, Italy, 22–24 October. SPE-36913-MS. http://dx.doi.org/10.2118/36913-MS.
EPA. 2000. Ground Water Quality. In National Water Quality Inventory,Chap. 6, Fig. 6-5, p. 52. Washington, DC: US Environmental Protec-
tion Agency. http://water.epa.gov/lawsregs/guidance/cwa/305b/upload/2003_02_28_305b_2000report_chp6.pdf.
Etiope, G. 2009a. GLOGOS, A New Global Onshore Gas-Oil Seeps Data-set. Search and Discovery Article #70071 (2009), Istituto Nazionale di
Geofisica e Vulcanologia, Roma, Italia (30 September 2009), http://www.searchanddiscovery.com/documents/2009/090806etiope/.
Etiope, G. 2009b. Natural emissions of methane from geological seepagein Europe. Atmos. Environ. 43 (7): 1430–1443. http://dx.doi.org/10.1016/j.atmosenv.2008.03.014.
Etiope, G. and Klusman, R.W. 2002. Geologic emissions of methane to
the atmosphere. Chemosphere 49 (8): 777–789. http://dx.doi.org/10.1016/S0045-6535(02)00380-6.
Faul, R., Kelm, C., Slocum, T. et al. 1999. Fine-Grind Cement Aids GOMPlug-and-Abandon Operations. Presented at the Offshore TechnologyConference, Houston, 3–6 May. OTC-10896-MS. http://dx.doi.org/
10.4043/10896-MS.
Feather, K. 2011. Better Well Integrity. Presented at the US-Norway
Technology Partnership Conference: Minimising Oil Spills and Dis-charges to Sea, Houston, 30 March 2011. http://www.naturalgaswatch.
org/wp-content/uploads/2011/09/well_integrity_failure_presentation.pdf.
Fertl, W.H. and Pilkington, P.E. 1975. Field Tests Of Cement Bond Log-ging Tools. The Log Analyst XVI (4). SPWLA-1975-vXVIn4a2.
Fertl, W.H., Pilkington, P.E., and Scott, J.B. 1974. A Look at CementBond Logs. J Pet Technol 26 (6): 607–617. SPE-4512-PA. http://dx.doi.org/10.2118/4512-PA.
Fischer, F. 1996. Identification and Quantification of Failure Rate to Effec-
tively Manage Sour Gas Production Systems. Presented at the SPEHealth, Safety and Environment in Oil and Gas Exploration and Pro-duction Conference, New Orleans, 9–12 June. SPE-35776-MS. http://
dx.doi.org/10.2118/35776-MS.
Fleming, K.N. and Silady, F.A. 2002. A risk informed defense-in-depth
framework for existing and advanced reactors. Reliab. Eng. Syst. Saf.78 (3): 205–225. http://dx.doi.org/10.1016/S0951-8320(02)00153-9.
Flournoy, R.M. and Feaster, J.H. 1963. Field Observations on the Use ofthe Cement Bond Log and Its Application to the Evaluation of
Cementing Problems. Presented at the Fall Meeting of the Society ofPetroleum Engineers of AIME, New Orleans, 6–9 October. SPE-632-MS. http://dx.doi.org/10.2118/632-MS.
Fredrich, J.T., Arguello, J.G., Thorne, B.J. et al. 1996. Three-DimensionalGeomechanical Simulation of Reservoir Compaction and Implications
for Well Failures in the Belridge Diatomite. Presented at the SPE An-nual Technical Conference and Exhibition, Denver, 6–9 October. SPE-
36698-MS. http://dx.doi.org/10.2118/36698-MS.
Frisch, G., O’Mahoney, L., and Mandal, B. 2002. Examination of Cement
and Casing Evaluation Logs, a Field Study. Presented at the IADC/SPE Asia Pacific Drilling Technology, Jakarta, Indonesia, 8–11 Sep-tember. SPE-77212-MS. http://dx.doi.org/10.2118/77212-MS.
Frisch, G., Graham, L., and Griffith, J. 2000. A Novel and Economic Proc-
essing Technique Using Conventional Bond Logs and UltrasonicTools for Enhanced Cement Evaluation. Presented at the SPWLA 41stAnnual Logging Symposium, Dallas, 4–7 June. SPWLA-2000-EE.
Gai, H., Summers, T.D., Cocking, D.A. et al. 1996. Zonal Isolation andEvaluation for Cemented Horizontal Liners. SPE Drill & Compl 11(4): 214–220. SPE-29981-PA. http://dx.doi.org/10.2118/29981-PA.
Garnier, A., Fraboulet, B., Saint-Marc, J. et al. 2007. Characterization of
Cement Systems to Ensure Cement Sheath Integrity. Presented at theOffshore Technology Conference, Houston, 30 April–3 May. OTC-
18754-MS.
Gibson, D. 1998. Tubing Testing Memo: personal communication on
Dan’s experience on Amoco and BP North Sea Operations Testingjointed connections. Internal Amoco memo (14 October 1998).
November 2013 SPE Production & Operations 341

Goodwin, K.J. and Crook, R.J. 1992. Cement Sheath Stress Failure. SPEDrill Eng 7 (4): 291–296. SPE-20453-PA. http://dx.doi.org/10.2118/20453-PA.
Gray, K.E., Podnos, E., and Becker, E. 2009. Finite-Element Studies ofNear-Wellbore Region During Cementing Operations: Part I. SPEDrill & Compl 24 (1): 127–136. SPE-106998-PA. http://dx.doi.org/
10.2118/106998-PA.
Grosmangin, M., Kokesh, P.P., and Majani, P. 1961. A Sonic Method forAnalyzing the Quality of Cementation of Borehole Casings. J PetTechnol 13 (2): 165–171. SPE-1512-PA. http://dx.doi.org/10.2118/1512-G.
Hale, A., Gossens, L., Ale, B. et al. 2004. Mandating safety barriers and
controls at the workplace. Presented at the International Conference onProbabilistic Safety Assessment and Management (PSAM 7 - ESREL
’04), Berlin, Germany, 14–18 June.
Handal, A. 2013. Safety Barrier Analysis and Hazard Identification ofBlowout Using Managed Pressure Drilling Compared With Conven-
tional Drilling. Presented at the 2013 IADC/SPE Managed PressureDrilling & Underbalanced Operations Conference & Exhibition, SanAntonio, Texas, USA, 17–18 April. SPE-164564-MS. http://dx.doi.
org/10.2118/164564-MS.
Harris, K., Grayson, G., and Langlinais, J. 2001. Obtaining SuccessfulShoe Tests in the Gulf of Mexico: Critical Cementing Factors. Pre-
sented at the SPE Annual Technical Conference and Exhibition, NewOrleans, 30 September–3 October. SPE-71388-MS. http://dx.doi.org/
10.2118/71388-MS.
Health and Safety Executive (HSE). 2013. ALARP Suite of Guidance,http://www.hse.gov.uk/risk/theory/alarp.htm.
Hilbert Jr., L.B., Gwinn, R.L., Moroney, T.A. et al. 1999. Field-Scale and
Wellbore Modeling of Compaction-Induced Casing Failures. SPEDrill & Compl 14 (2): 92–101. SPE-56863-PA. http://dx.doi.org/
10.2118/56863-PA.
Hollnagel, E. 1999. Accidents and Barriers. Proc., 7th Conference on Cog-nitive Science Approaches to Process Control (CSAPC ’99), Ville-
neuve d’Ascq, France, 2024 September, 175.
Holt, C. and Lahoti, N.N. 2012. Dynamic Cementation Improves WellboreConstruction and Reduces the Hazards of Groundwater Contamination
in Shale Plays. Presented at the SPE Canadian UnconventionalResources Conference, Calgary, 30 October–1 November. SPE-162739-MS. http://dx.doi.org/10.2118/162739-MS.
Howard, D. 2004. API committee addresses annular casing pressure man-agement. Oil Gas J. 102 (38).
Humphreys, A.T. and Ross, R.C. 2007. Overcoming the Loss of a Primary
Barrier in an HP/HT Well–Investigation and Solution. Presented at theSPE/IADC Drilling Conference, Amsterdam, 20–22 February. SPE-105736-MS. http://dx.doi.org/10.2118/105736-MS.
Johns, J.E., Blount, C.G., Dethlefs, J.C. et al. 2009. Applied UltrasonicTechnology in Wellbore-Leak Detection and Case Histories in AlaskaNorth Slope Wells. SPE Prod & Oper 24 (2): 225–232. SPE-102815-
PA. http://dx.doi.org/10.2118/102815-PA.
Julian, J.Y., King, G.E., Johns, J.E. et al. 2007. Detecting Ultra-smallLeaks With Ultrasonic Leak Detection-Case Histories From the North
Slope, Alaska. Presented at the International Oil Conference and Exhi-bition in Mexico, Veracruz, Mexico, 27–30 June. SPE-108906-MS.
http://dx.doi.org/10.2118/108906-MS.
Jutten, J., Toma, I., Morel, Y. et al. 1991. Integration of Cement Job Datafor Better Bond Index Interpretation. Presented at the SPE Production
Operations Symposium, Oklahoma City, Oklahoma, USA, 7–9 April.SPE-21690-MS. http://dx.doi.org/10.2118/21690-MS.
Kappel, W. and Hamilton, H. 2012. Dissolved Methane Found in Some
New York Groundwater. News Release, US DOI, US Geological Sur-vey, Washington, DC (04 September 2012), http://www.usgs.gov/newsroom/article.asp?ID$3391#.UFIa5FHGx8F.
Kell, S. 2012. State Oil and Gas Agency Groundwater Investigations andTheir Role in Advancing Regulatory Reforms, A Two State Review:Ohio and Texas. Ground Water Protection Council, Oklahoma City,
Oklahoma (August 2011), http://fracfocus.org/sites/default/files/publications/state_oil__gas_agency_groundwater_investigations_optimized.
pdf.
Kerr, H.P. 1965. Thread Leaks in Tubing and Casing Strings. API Drillingand Production Practice (May 1965). API 65-014.
Khalifeh, M., Hodne, H., Saasen, A. et al. 2013. Techniques and Materialsfor North Sea Plug and Abandonment Operations. Presented at the2013 Offshore Technology Conference, Houston, 6–9 May. OTC-
23915-MS. http://dx.doi.org/10.4043/23915-MS.
King, G.E. 2012. Hydraulic Fracturing 101: What Every Representative,Environmentalist, Regulator, Reporter, Investor, University Researcher,
Neighbor and Engineer Should Know About Estimating Frac Risk andImproving Frac Performance in Unconventional Gas and Oil Wells. Pre-
sented at the SPE Hydraulic Fracturing Technology Conference, TheWoodlands, Texas, USA, 6–8 February 2012. SPE-152596-MS. http://dx.doi.org/10.2118/152596-MS.
King, G.E., Wildt, P.J., and O’Connell, E. 2003. Sand Control CompletionReliability and Failure Rate Comparison With a Multi-Thousand WellDatabase. Presented at the SPE Annual Technical Conference and Ex-
hibition, Denver, 5–8 October. SPE-84262-MS. http://dx.doi.org/10.2118/84262-MS.
Kvenvolden, K.A. and Cooper, C.K. 2003. Natural seepage of crude oil
into the marine environment. Geo-Mar. Lett. 23 (3–4): 140–146.http://dx.doi.org/10.1007/s00367-003-0135-0.
Kvenvolden, K.A. and Rogers, B.W. 2005. Gaia’s breath—global methane
exhalations. Mar. Pet. Geol. 22 (4): 579–590. http://dx.doi.org/10.1016/j.marpetgeo.2004.08.004.
Li, X., Mitchum, F.L., Bruno, M. et al. 2003. Compaction, Subsidence,
and Associated Casing Damage and Well Failure Assessment for theGulf of Mexico Shelf Matagorda Island 623 Field. Presented at the
SPE Annual Technical Conference and Exhibition, Denver, 5–8 Octo-ber. SPE-84553-MS. http://dx.doi.org/10.2118/84553-MS.
Liang, Q. 2012. Casing Thermal Stress and Wellhead Growth Behavior
Analysis. Presented at the SPE Asia Pacific Oil and Gas Conferenceand Exhibition, Perth, Australia, 22–24 October. SPE-157977-MS.http://dx.doi.org/10.2118/157977-MS.
Leifer, I., Luyendyk, B.P., Boles, J., and Clark, J.F. 2006. Natural marineseepage blowout: Contribution to atmospheric methane. Global Bio-geochemical Cycles 20 (GB3008). http://dx.doi.org/10.1029/2005GB
002668.
Link, W.K. 1952. Significance of Oil and Gas Seeps in World Oil Explora-tion. AAPG Bull. 36 (8): 1505–1540.
Lockyear, C.F., Ryan, D.F., and Gunningham, M.M. 1990. Cement Chan-neling: How To Predict and Prevent. SPE Drill Eng 5 (3): 201–208.SPE-19865-PA. http://dx.doi.org/10.2118/19865-PA.
MacEachern, D.P., Algu, D.R., Cowan, M. et al. 2003. Advances in Tie-back Cementing. Presented at the SPE/IADC Drilling Conference,Amsterdam, 19–21 February. SPE-79907-MS. http://dx.doi.org/10.2118/
79907-MS.
Macedo, K.G., Schneider, J., Sylvestre, C.J. et al. 2012. Elimination ofSurface Casing Vent Flow and Gas Migration in the Lloydminster
Area. Presented at the SPE Heavy Oil Conference Canada, Calgary,12–14 June. SPE-157922-MS. http://dx.doi.org/10.2118/157922-MS.
Martland, R. and Mann, P. 2012. Examining the Suitability of E&P Major
Accident Prevention Design Principles in a Changing Global Environ-ment and Comparisons With the Rail, Nuclear and Aviation Industries.
Presented at the International Conference on Health, Safety and Envi-ronment in Oil and Gas Exploration and Production, Perth, Australia,11–13 September. SPE-156910-MS. http://dx.doi.org/10.2118/156910-
MS.
Michie, T.W. and Koch, C.A. 1991. Evaluation of Injection-Well RiskManagement in the Williston Basin. J Pet Technol 43 (6): 737–741.
SPE-20693-PA. http://dx.doi.org/10.2118/20693-PA.
Missouri Department of Natural Resources. 2007. Why Groundwater LevelsChange. WRC Information Report, Water Resources Center, Division
of Environmental Quality, Missouri Department of Natural Resources,Jefferson City, Missouri (26 July 2007), http://www.dnr.mo.gov/env/
wrc/docs/whywaterlevelschange.pdf.
Molnes, E. and Sundet, I. 1993. Reliability of Well Completion Equip-ment. Presented at the Offshore Europe, Aberdeen, 7–10 September.
SPE-26721-MS. http://dx.doi.org/10.2118/26721-MS.
Molofsky, L.J., Connor, J.A., Farhat, S.K. et al. 2011. Methane in Pennsyl-vania water wells unrelated to Marcellus shale fracturing. Oil Gas J.109 (49): 54–67.
Naftz, D.L. and Hadley, H.K. 1998. Determination of Methane Concentra-tions in Shallow Ground Water and Soil Gas near Price, Utah.
342 November 2013 SPE Production & Operations
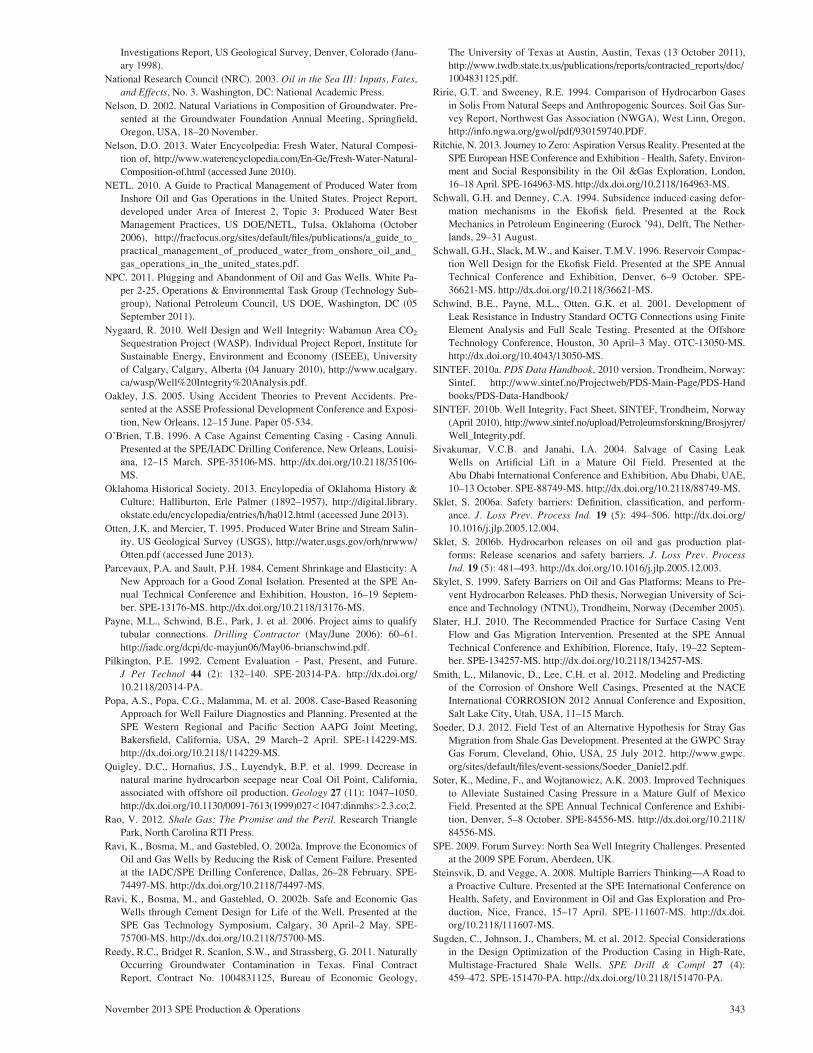
Investigations Report, US Geological Survey, Denver, Colorado (Janu-ary 1998).
National Research Council (NRC). 2003. Oil in the Sea III: Inputs, Fates,and Effects, No. 3. Washington, DC: National Academic Press.
Nelson, D. 2002. Natural Variations in Composition of Groundwater. Pre-sented at the Groundwater Foundation Annual Meeting, Springfield,
Oregon, USA, 18–20 November.
Nelson, D.O. 2013. Water Encycolpedia: Fresh Water, Natural Composi-tion of, http://www.waterencyclopedia.com/En-Ge/Fresh-Water-Natural-
Composition-of.html (accessed June 2010).
NETL. 2010. A Guide to Practical Management of Produced Water fromInshore Oil and Gas Operations in the United States. Project Report,
developed under Area of Interest 2, Topic 3: Produced Water BestManagement Practices, US DOE/NETL, Tulsa, Oklahoma (October2006), http://fracfocus.org/sites/default/files/publications/a_guide_to_
practical_management_of_produced_water_from_onshore_oil_and_gas_operations_in_the_united_states.pdf.
NPC. 2011. Plugging and Abandonment of Oil and Gas Wells. White Pa-
per 2-25, Operations & Environmental Task Group (Technology Sub-group), National Petroleum Council, US DOE, Washington, DC (05September 2011).
Nygaard, R. 2010. Well Design and Well Integrity: Wabamun Area CO2
Sequestration Project (WASP). Individual Project Report, Institute forSustainable Energy, Environment and Economy (ISEEE), University
of Calgary, Calgary, Alberta (04 January 2010), http://www.ucalgary.ca/wasp/Well%20Integrity%20Analysis.pdf.
Oakley, J.S. 2005. Using Accident Theories to Prevent Accidents. Pre-
sented at the ASSE Professional Development Conference and Exposi-tion, New Orleans, 12–15 June. Paper 05-534.
O’Brien, T.B. 1996. A Case Against Cementing Casing - Casing Annuli.
Presented at the SPE/IADC Drilling Conference, New Orleans, Louisi-ana, 12–15 March. SPE-35106-MS. http://dx.doi.org/10.2118/35106-
MS.
Oklahoma Historical Society. 2013. Encylopedia of Oklahoma History &Culture: Halliburton, Erle Palmer (1892–1957), http://digital.library.okstate.edu/encyclopedia/entries/h/ha012.html (accessed June 2013).
Otten, J.K. and Mercier, T. 1995. Produced Water Brine and Stream Salin-ity. US Geological Survey (USGS), http://water.usgs.gov/orh/nrwww/Otten.pdf (accessed June 2013).
Parcevaux, P.A. and Sault, P.H. 1984. Cement Shrinkage and Elasticity: ANew Approach for a Good Zonal Isolation. Presented at the SPE An-nual Technical Conference and Exhibition, Houston, 16–19 Septem-
ber. SPE-13176-MS. http://dx.doi.org/10.2118/13176-MS.
Payne, M.L., Schwind, B.E., Park, J. et al. 2006. Project aims to qualifytubular connections. Drilling Contractor (May/June 2006): 60–61.
http://iadc.org/dcpi/dc-mayjun06/May06-brianschwind.pdf.
Pilkington, P.E. 1992. Cement Evaluation - Past, Present, and Future.J Pet Technol 44 (2): 132–140. SPE-20314-PA. http://dx.doi.org/
10.2118/20314-PA.
Popa, A.S., Popa, C.G., Malamma, M. et al. 2008. Case-Based ReasoningApproach for Well Failure Diagnostics and Planning. Presented at the
SPE Western Regional and Pacific Section AAPG Joint Meeting,Bakersfield, California, USA, 29 March–2 April. SPE-114229-MS.http://dx.doi.org/10.2118/114229-MS.
Quigley, D.C., Hornafius, J.S., Luyendyk, B.P. et al. 1999. Decrease innatural marine hydrocarbon seepage near Coal Oil Point, California,associated with offshore oil production. Geology 27 (11): 1047–1050.
http://dx.doi.org/10.1130/0091-7613(1999)027<1047:dinmhs>2.3.co;2.
Rao, V. 2012. Shale Gas: The Promise and the Peril. Research TrianglePark, North Carolina RTI Press.
Ravi, K., Bosma, M., and Gastebled, O. 2002a. Improve the Economics ofOil and Gas Wells by Reducing the Risk of Cement Failure. Presentedat the IADC/SPE Drilling Conference, Dallas, 26–28 February. SPE-
74497-MS. http://dx.doi.org/10.2118/74497-MS.
Ravi, K., Bosma, M., and Gastebled, O. 2002b. Safe and Economic GasWells through Cement Design for Life of the Well. Presented at the
SPE Gas Technology Symposium, Calgary, 30 April–2 May. SPE-75700-MS. http://dx.doi.org/10.2118/75700-MS.
Reedy, R.C., Bridget R. Scanlon, S.W., and Strassberg, G. 2011. Naturally
Occurring Groundwater Contamination in Texas. Final ContractReport, Contract No. 1004831125, Bureau of Economic Geology,
The University of Texas at Austin, Austin, Texas (13 October 2011),http://www.twdb.state.tx.us/publications/reports/contracted_reports/doc/1004831125.pdf.
Ririe, G.T. and Sweeney, R.E. 1994. Comparison of Hydrocarbon Gases
in Solis From Natural Seeps and Anthropogenic Sources. Soil Gas Sur-vey Report, Northwest Gas Association (NWGA), West Linn, Oregon,http://info.ngwa.org/gwol/pdf/930159740.PDF.
Ritchie, N. 2013. Journey to Zero: Aspiration Versus Reality. Presented at theSPE European HSE Conference and Exhibition - Health, Safety, Environ-
ment and Social Responsibility in the Oil &Gas Exploration, London,16–18 April. SPE-164963-MS. http://dx.doi.org/10.2118/164963-MS.
Schwall, G.H. and Denney, C.A. 1994. Subsidence induced casing defor-mation mechanisms in the Ekofisk field. Presented at the Rock
Mechanics in Petroleum Engineering (Eurock ’94), Delft, The Nether-lands, 29–31 August.
Schwall, G.H., Slack, M.W., and Kaiser, T.M.V. 1996. Reservoir Compac-tion Well Design for the Ekofisk Field. Presented at the SPE AnnualTechnical Conference and Exhibition, Denver, 6–9 October. SPE-
36621-MS. http://dx.doi.org/10.2118/36621-MS.
Schwind, B.E., Payne, M.L., Otten, G.K. et al. 2001. Development ofLeak Resistance in Industry Standard OCTG Connections using FiniteElement Analysis and Full Scale Testing. Presented at the Offshore
Technology Conference, Houston, 30 April–3 May. OTC-13050-MS.http://dx.doi.org/10.4043/13050-MS.
SINTEF. 2010a. PDS Data Handbook, 2010 version. Trondheim, Norway:Sintef. http://www.sintef.no/Projectweb/PDS-Main-Page/PDS-Hand
books/PDS-Data-Handbook/
SINTEF. 2010b. Well Integrity. Fact Sheet, SINTEF, Trondheim, Norway
(April 2010), http://www.sintef.no/upload/Petroleumsforskning/Brosjyrer/Well_Integrity.pdf.
Sivakumar, V.C.B. and Janahi, I.A. 2004. Salvage of Casing LeakWells on Artificial Lift in a Mature Oil Field. Presented at theAbu Dhabi International Conference and Exhibition, Abu Dhabi, UAE,
10–13 October. SPE-88749-MS. http://dx.doi.org/10.2118/88749-MS.
Sklet, S. 2006a. Safety barriers: Definition, classification, and perform-
ance. J. Loss Prev. Process Ind. 19 (5): 494–506. http://dx.doi.org/10.1016/j.jlp.2005.12.004.
Sklet, S. 2006b. Hydrocarbon releases on oil and gas production plat-forms: Release scenarios and safety barriers. J. Loss Prev. ProcessInd. 19 (5): 481–493. http://dx.doi.org/10.1016/j.jlp.2005.12.003.
Skylet, S. 1999. Safety Barriers on Oil and Gas Platforms; Means to Pre-
vent Hydrocarbon Releases. PhD thesis, Norwegian University of Sci-ence and Technology (NTNU), Trondheim, Norway (December 2005).
Slater, H.J. 2010. The Recommended Practice for Surface Casing VentFlow and Gas Migration Intervention. Presented at the SPE Annual
Technical Conference and Exhibition, Florence, Italy, 19–22 Septem-ber. SPE-134257-MS. http://dx.doi.org/10.2118/134257-MS.
Smith, L., Milanovic, D., Lee, C.H. et al. 2012. Modeling and Predictingof the Corrosion of Onshore Well Casings. Presented at the NACEInternational CORROSION 2012 Annual Conference and Exposition,
Salt Lake City, Utah, USA, 11–15 March.
Soeder, D.J. 2012. Field Test of an Alternative Hypothesis for Stray GasMigration from Shale Gas Development. Presented at the GWPC StrayGas Forum, Cleveland, Ohio, USA, 25 July 2012. http://www.gwpc.
org/sites/default/files/event-sessions/Soeder_Daniel2.pdf.
Soter, K., Medine, F., and Wojtanowicz, A.K. 2003. Improved Techniques
to Alleviate Sustained Casing Pressure in a Mature Gulf of MexicoField. Presented at the SPE Annual Technical Conference and Exhibi-
tion, Denver, 5–8 October. SPE-84556-MS. http://dx.doi.org/10.2118/84556-MS.
SPE. 2009. Forum Survey: North Sea Well Integrity Challenges. Presentedat the 2009 SPE Forum, Aberdeen, UK.
Steinsvik, D. and Vegge, A. 2008. Multiple Barriers Thinking—A Road toa Proactive Culture. Presented at the SPE International Conference onHealth, Safety, and Environment in Oil and Gas Exploration and Pro-
duction, Nice, France, 15–17 April. SPE-111607-MS. http://dx.doi.org/10.2118/111607-MS.
Sugden, C., Johnson, J., Chambers, M. et al. 2012. Special Considerationsin the Design Optimization of the Production Casing in High-Rate,
Multistage-Fractured Shale Wells. SPE Drill & Compl 27 (4):459–472. SPE-151470-PA. http://dx.doi.org/10.2118/151470-PA.
November 2013 SPE Production & Operations 343

Swistock, B.R. and Rizzo, D. 2013. Methane Gas and Its Removal fromWells in Pennsylvania. Water Facts #24, Penn State Extension, http://extension.psu.edu/natural-resources/water/drinking-water/water-testing/
pollutants/methane-gas-and-its-removal-from-wells-in-pennsylvania.Texas Groundwater Protection Committee. 1998. Joint Groundwater Mon-
itoring and Contamination Report - 1997. Joint Groundwater Monitor-ing and Contamination Report SFR-056/98, Texas Commission onEnvironmental Quality, Austin, Texas (June 1998).
Texas Groundwater Protection Committee. 2011. Joint Groundwater Mon-itoring and Contamination Report - 2011. Joint Groundwater Monitor-
ing and Contamination Report SFR-056/11, Texas Commission onEnvironmental Quality, Austin, Texas (August 2012), http://www.tceq.texas.gov/assets/public/comm_exec/pubs/sfr/056-11.pdf.
Texas Water Development Board. 2013. TWDB Maps, http://www.twdb.texas.gov/mapping/maps.asp (1980 aquifer map).
Tinsley, J.M., Miller, E.C., Sabins, F.L. et al. 1980. Study of Factors CausingAnnular Gas Flow Following Primary Cementing. J Pet Technol 32 (8):1427–1437. SPE-8257-PA. http://dx.doi.org/10.2118/8257-PA.
Uhlman, K., Rock, C., and Artiola, J. 2009. Arizona Drinking Water Well Con-taminants. Fact Sheet AZ1503, Arizona Cooperative Extension, College of
Agricultural and Life Sciences, The University of Arizona, Tucson, Ari-zona (November 2009), http://cals.arizona.edu/pubs/water/az1503.pdf.
US Code of Federal Regulations. 2012. 40 CFR § 146, Underground Injec-
tion Control Program: Criteria and Standards. http://www.gpo.gov/fdsys/pkg/CFR-2012-title40-vol24/xml/CFR-2012-title40-vol24-part146.xml (accessed June 2013).
USGS. 2012. Dissolved Methane in New York Groundwater, http://pubs.usgs.gov/of/2012/1162/ (accessed June 2013).
Valigura, G.A. and Tallin, A. 2005. Connections for HPHT Well Applica-tions and Connection Leak Probability. Presented at the SPE HighPressure/High Temperature Sour Well Design Applied Technology
Workshop, The Woodlands, Texas, USA, 17–19 May. SPE-97588-MS. http://dx.doi.org/10.2118/97588-MS.
Vignes, B. 2011. Qualification of Well Barrier Elements - Test Medium,Test Temperatures and Long-term Integrity. Presented at the SPE Eu-ropean Health, Safety and Environmental Conference in Oil and Gas
Exploration and Production, Vienna, Austria, 22–24 February. SPE-138465-MS. http://dx.doi.org/10.2118/138465-MS.
Vignes, B. and Aadnoy, B.S. 2008. Well-Integrity Issues Offshore Nor-way. Presented at the IADC/SPE Drilling Conference, Orlando, Flor-ida, USA, 4–6 March. SPE-112535-MS. http://dx.doi.org/10.2118/
112535-MS.
Watson, T.L. and Bachu, S. 2009. Evaluation of the Potential for Gas andCO2 Leakage Along Wellbores. SPE Drill & Compl 24 (1): 115–126.SPE-106817-PA. http://dx.doi.org/10.2118/106817-PA.
Weiner, P.D. and True, M.E. 1969. A Method of Obtaining Leakproof APIThreaded Connections in High-pressure Gas Service. Presented at the
API Drilling and Production Practice 1969 conference, API-69-040.Wilson, R.D., Monaghan, P.H., Osanik, A. et al. 1974. Natural marine oil
seepage. Science 184 (24 May 1974): 857–865.
Wojtanowicz, A.K., Nishikawa, S., and Rong, X. 2001. Diagnosis andRemediation of Sustained Casing Pressure in Wells. Final Report,
Minerals Management Service, US Department of Interior, Herndon,Virginia (31 July 2001), http://citeseerx.ist.psu.edu/viewdoc/download?doi$10.1.1.115.6097&rep$rep1&type$pdf.
Zinkham, R.E. and Goodwin, R.J. 1962. Burst Resistance of PipeCemented Into the Earth. J Pet Technol 14 (9): 1033–1040. SPE-291-
PA. http://dx.doi.org/10.2118/291-PA.
George E. King is Apache Corporation’s Distinguished Engi-neering Advisor and a registered professional engineer in mul-tiple states, with 42 years of industry experience in mostaspects of completion, well construction, and well-failureanalysis. His work has focused on unconventional formations,sand control, perforating, fracturing, and well-construction riskanalysis. Previously, King was an adjunct professor at the Uni-versity of Tulsa, where he taught completions and workoversfor 11 years. He is the author of 68 technical papers. King holdsa degree in chemistry from Oklahoma State University anddegrees in chemical engineering and petroleum engineeringfrom the University of Tulsa. He was awarded the 2004 SPE Pro-duction Operations Award and the 2012 Engineer of the Yearaward from the Houston Region of the Texas Society of Profes-sional Engineers.
Daniel King is a director in the Risk, Systems, and CompliancePractice at WG Consulting, specializing in business intelli-gence. Before joining WG Consulting, he served 10 years inmany different roles for Occidental Petroleum. King has morethan 10 years of upstream oil and gas experience, with astrong background in data management and analyticalproducts, and has served a wide range of disciplines in theenergy industry, including engineering, geology, petrophysics,finance, and information technology, with expertise extend-ing to analytics, project management, data mining, and datamanagement. He holds a BS degree in management informa-tion services from Oklahoma State University.
344 November 2013 SPE Production & Operations