Environmental profile of PV mass production -...
27
Environmental profile of PV mass production: globalization Mariska de Wild-Scholten 26 th European Photovoltaic Solar Energy Conference, Hamburg 8 September 2011
Transcript of Environmental profile of PV mass production -...

Environmental profile of PV mass production:
globalization
Mariska de Wild-Scholten26th European Photovoltaic Solar Energy Conference, Hamburg
8 September 2011

Outline
Life Cycle Assessment
Energy payback time
Carbon footprint
Data request
2Mariska de Wild-Scholten 8 September 2011
& Globalizationof the PV industry
Life Cycle Assessment
3
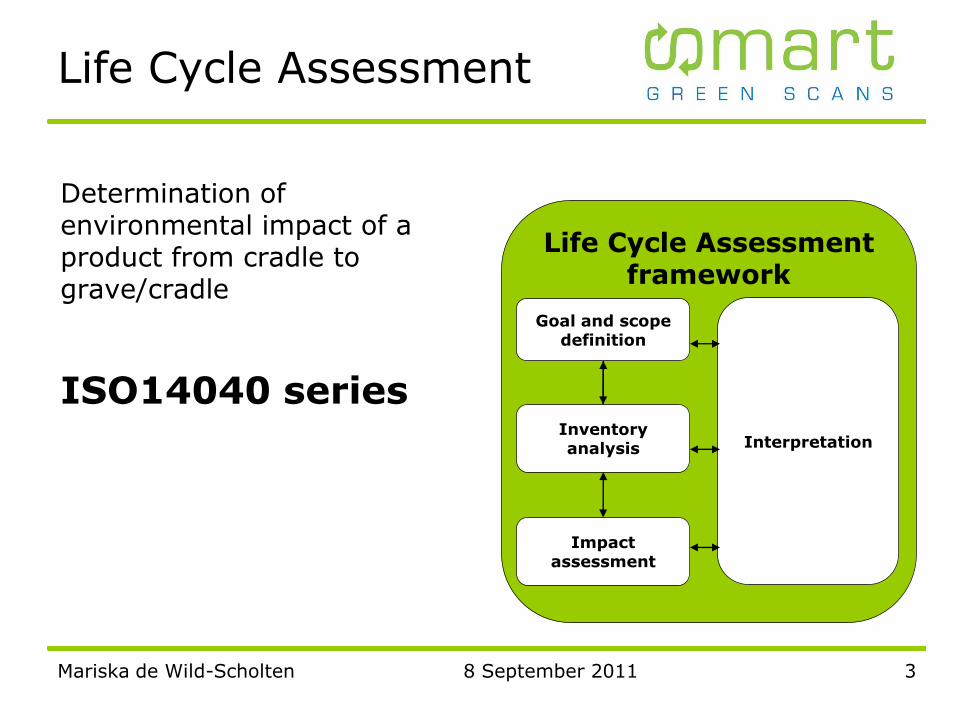
Determination of environmental impact of a product from cradle to grave/cradle
ISO14040 series
Life Cycle Assessment framework
Goal and scope definition
Inventory analysis
Impact assessment
Interpretation
8 September 2011Mariska de Wild-Scholten

Life Cycle
4Mariska de Wild-Scholten 8 September 2011
manufacturing
use
installation
recycling
transport
transport
transport mining & refining

Market share ofcell technologies
5Mariska de Wild-Scholten 8 September 2011
0%
20%
40%
60%
80%
100%
Photon International March 2011
other
CIS
CdTe
a-Si/μc-Si
ribbon c-Si
multi c-Si
mono c-Si
0
5000
10000
15000
20000
25000
2000 2001 2002 2003 2004 2005 2006 2007 2008 2009 2010
An
nu
al P
V P
rod
uct
ion
[M
W]
Rest of World
United States
Taiwan
PR China
Europe
Japan
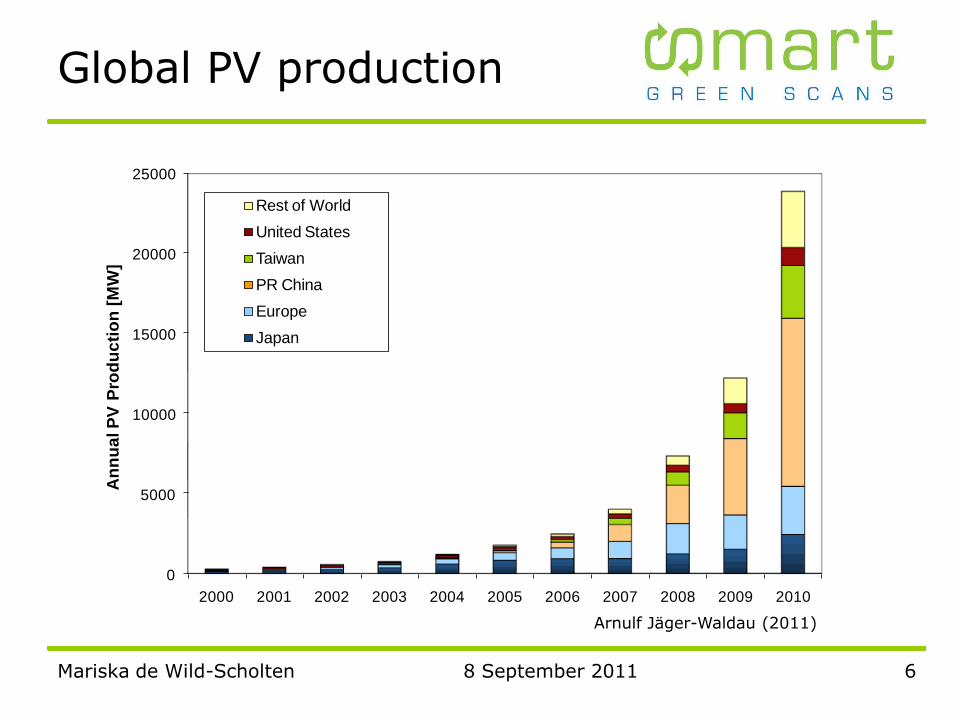
Global PV production
6Mariska de Wild-Scholten 8 September 2011
Arnulf Jäger-Waldau (2011)

7
Global PV production
8 September 2011Mariska de Wild-Scholten
Raspe in Sun & Wind Energy 10/2010
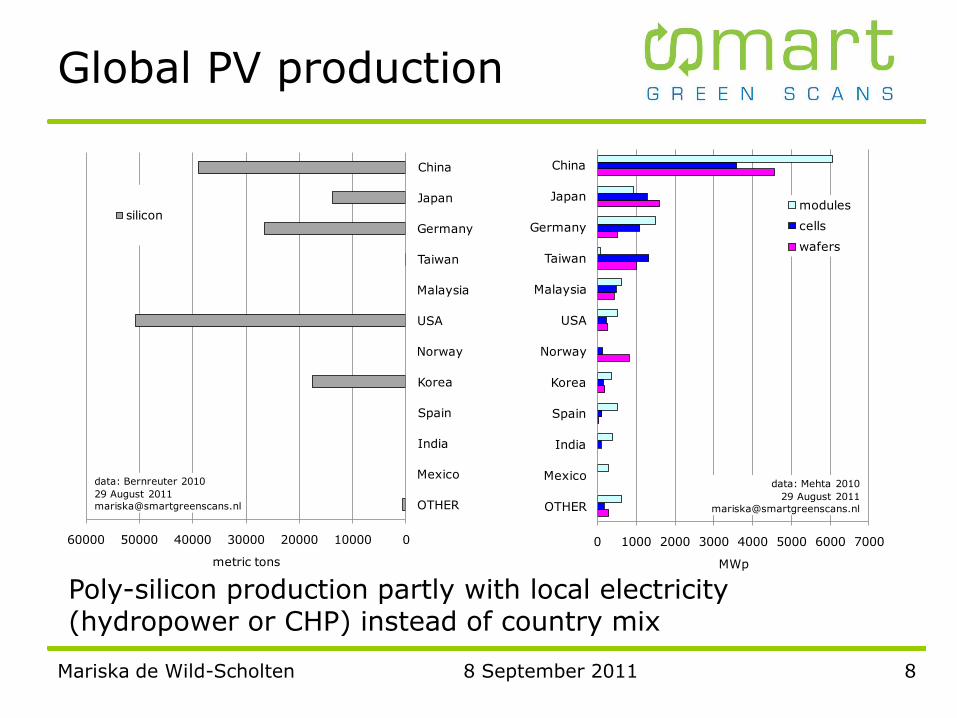
Global PV production
8Mariska de Wild-Scholten 8 September 2011
0100002000030000400005000060000
OTHER
Mexico
India
Spain
Korea
Norway
USA
Malaysia
Taiwan
Germany
Japan
China
metric tons
data: Bernreuter 2010
29 August 2011
silicon
0 1000 2000 3000 4000 5000 6000 7000
OTHER
Mexico
India
Spain
Korea
Norway
USA
Malaysia
Taiwan
Germany
Japan
China
MWp
data: Mehta 2010
29 August 2011
modules
cells
wafers
Poly-silicon production partly with local electricity (hydropower or CHP) instead of country mix

Energy payback time
9Mariska de Wild-Scholten 8 September 2011
10
Energy payback time
8 September 2011Mariska de Wild-Scholten
0.0
0.5
1.0
1.5
2.0
2.5
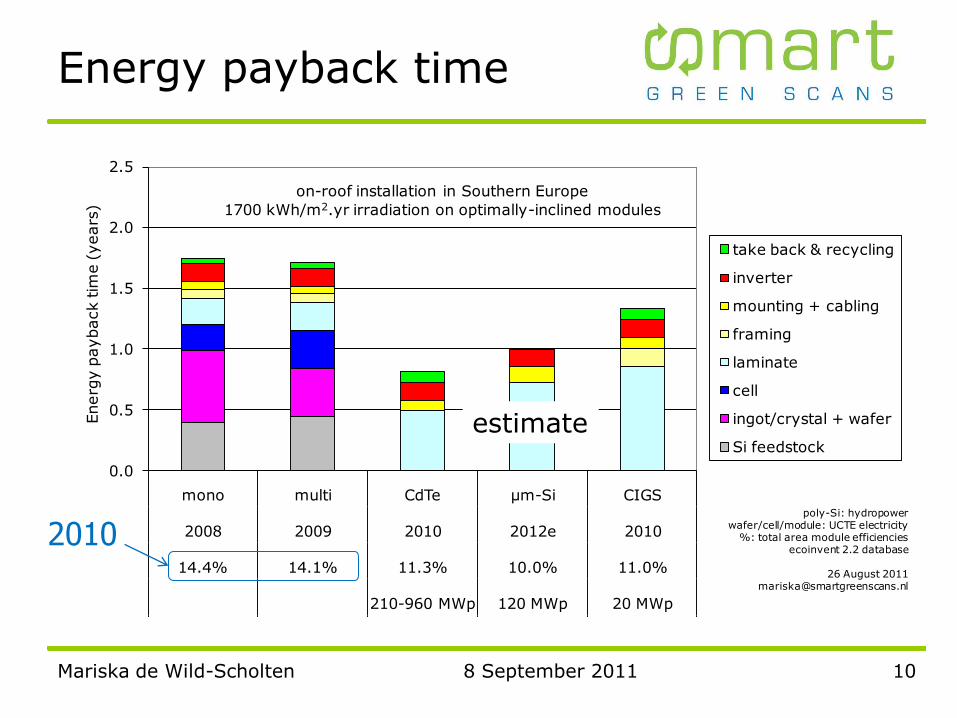
mono multi CdTe µm-Si CIGS
2008 2009 2010 2012e 2010
14.4% 14.1% 11.3% 10.0% 11.0%
210-960 MWp 120 MWp 20 MWp
Energ
y p
ayback tim
e (years
)
poly-Si: hydropowerwafer/cell/module: UCTE electricity
%: total area module efficienciesecoinvent 2.2 database
26 August [email protected]
on-roof installation in Southern Europe
1700 kWh/m2.yr irradiation on optimally-inclined modules
take back & recycling
inverter
mounting + cabling
framing
laminate
cell
ingot/crystal + wafer
Si feedstock
2010
estimate
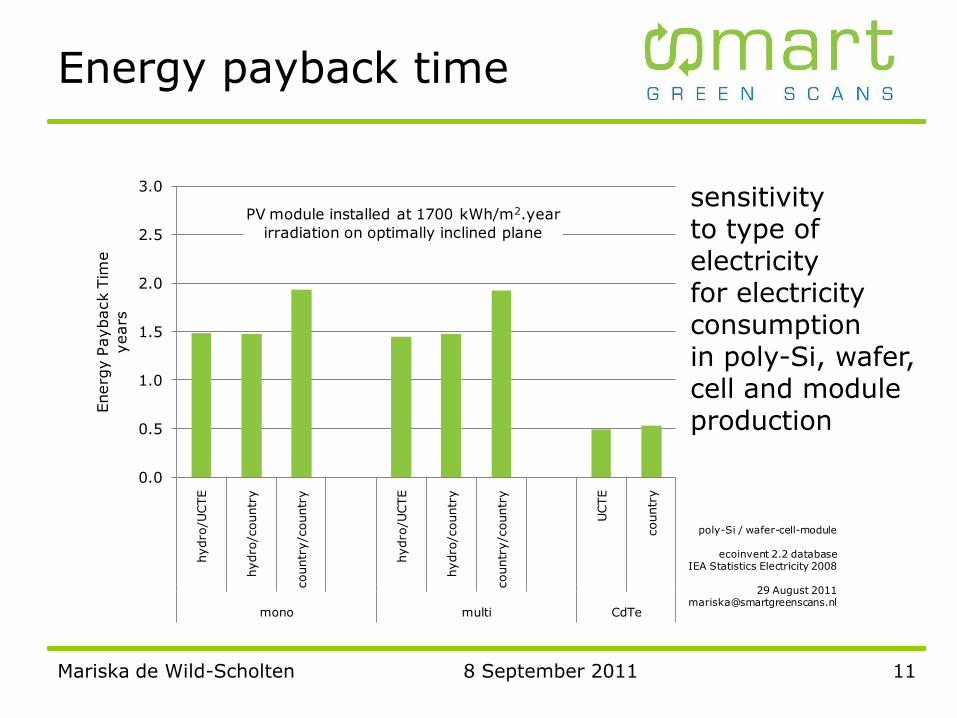
0.0
0.5
1.0
1.5
2.0
2.5
3.0hydro
/UCTE
hydro
/countr
y
countr
y/c
ountr
y
hydro
/UCTE
hydro
/countr
y
countr
y/c
ountr
y
UCTE
countr
y
mono multi CdTe
Energ
y P
ayback T
ime
years
poly-Si / wafer-cell-module
ecoinvent 2.2 databaseIEA Statistics Electricity 2008
29 August [email protected]
PV module installed at 1700 kWh/m2.year
irradiation on optimally inclined plane
Energy payback time
11Mariska de Wild-Scholten 8 September 2011
sensitivityto type ofelectricityfor electricityconsumptionin poly-Si, wafer,cell and moduleproduction
Energy payback time
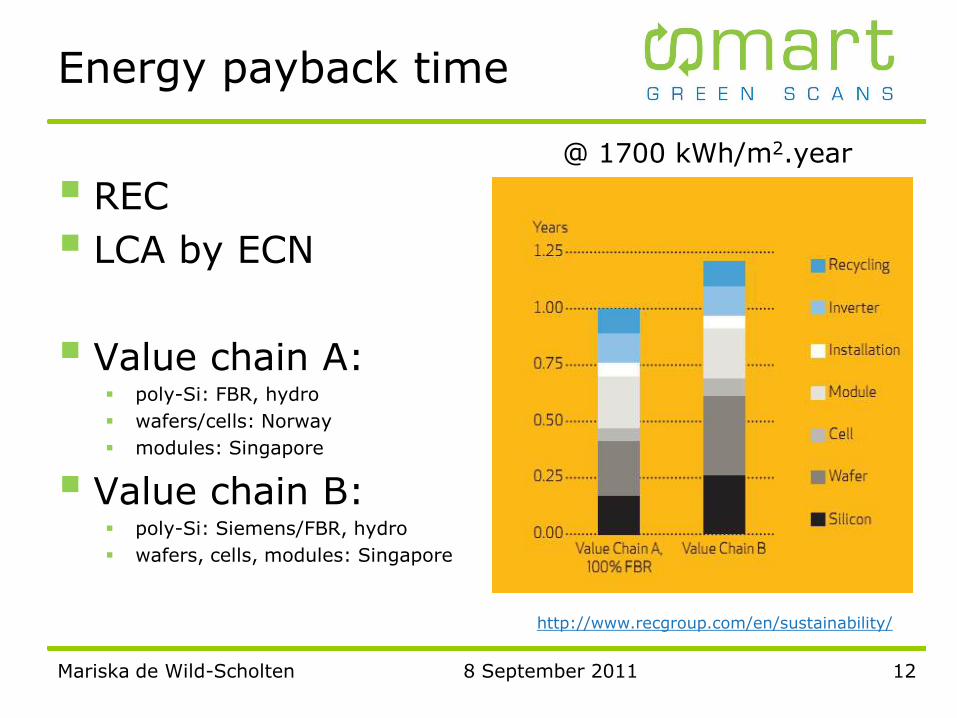
REC
LCA by ECN
Value chain A: poly-Si: FBR, hydro
wafers/cells: Norway
modules: Singapore
Value chain B: poly-Si: Siemens/FBR, hydro
wafers, cells, modules: Singapore
12Mariska de Wild-Scholten 8 September 2011
http://www.recgroup.com/en/sustainability/
@ 1700 kWh/m2.year

13
Energy payback time
8 September 2011Mariska de Wild-Scholten
0.0
0.5
1.0
1.5
2.0
Soitec (was Concentrix) Amonix
CX-M400/S420 7700
25.5%
2011 2011
Energ
y p
ayback tim
e
years
%: total area module efficienciesAmonix: Fthenakis, Kimecoinvent 2.2 database
[email protected] August 2011
2-axis tracking CPV system in Catania (Sicily, Italy)
1794 kWh/m2.yr direct normal irradiation (DNI) in-plane
end-of-life
O&M
installation
inverter
tracking
module
cell
Global irradiation in Catania is 1925 kWh/m2.year

Cold Bay (Alaska)mariska@
smartgreenscans.nl
Dagget (California)
Catania(Sicily, Italy)
0
500
1000
1500
2000
2500
3000
0 500 1000 1500 2000 2500 3000
DN
I 2-
axi
s tr
ack
er
kW
h/m
2.y
ea
r
GIobal Irradiation south-facing/optimized angle/no tracking
kWh/m2.year
30-Year Average of Monthly Solar Radiation, 1961-1990 (U.S.A.)http://rredc.nrel.gov/solar/old_data/nsrdb/1961-1990/redbook/sum2/
DNI vs global irradiation
14Mariska de Wild-Scholten 8 September 2011
1794 -----------
||||
1925
Compare CPV with flat plate PV only for one DNI-GI combination (location)!

15
Carbon footprint=
life-cycle CO2-equivalent emissions
now with module degradation included: 20% / 30 years
8 September 2011Mariska de Wild-Scholten

0
10
20
30
40
50
mono multi CdTe µm-Si CIGS
2008 2009 2010 2012e 2010
14.4% 14.1% 11.3% 10.0% 11.0%
30 years 30 years 30 years 30 years 30 years
210-960 MWp 120 MWp 20 MWp
Carb
on footp
rint
g C
O2-e
q/k
Wh
poly-Si: hydropowerwafer/cell/module: UCTE electricity
degradation: 20%/30 yearsecoinvent 2.2 database
26 August [email protected]
on-roof installation in Southern Europe
1700 kWh/m2.year irradiation on optimally-inclined modules
takeback & recycling
inverter
mounting + cabling
frame
laminate
cell
wafer
silicon feedstock
Carbon footprint
16Mariska de Wild-Scholten 8 September 2011
2010
estimate

Carbon Footprint
REC
LCA by ECN
Value chain A: poly-Si: FBR, hydro
wafers/cells: Norway
modules: Singapore
Value chain B: poly-Si: Siemens/FBR, hydro
wafers, cells, modules: Singapore
17Mariska de Wild-Scholten 8 September 2011
http://www.recgroup.com/en/sustainability/
@ 1700 kWh/m2.year
Carbon footprint electricity
18Mariska de Wild-Scholten 8 September 2011
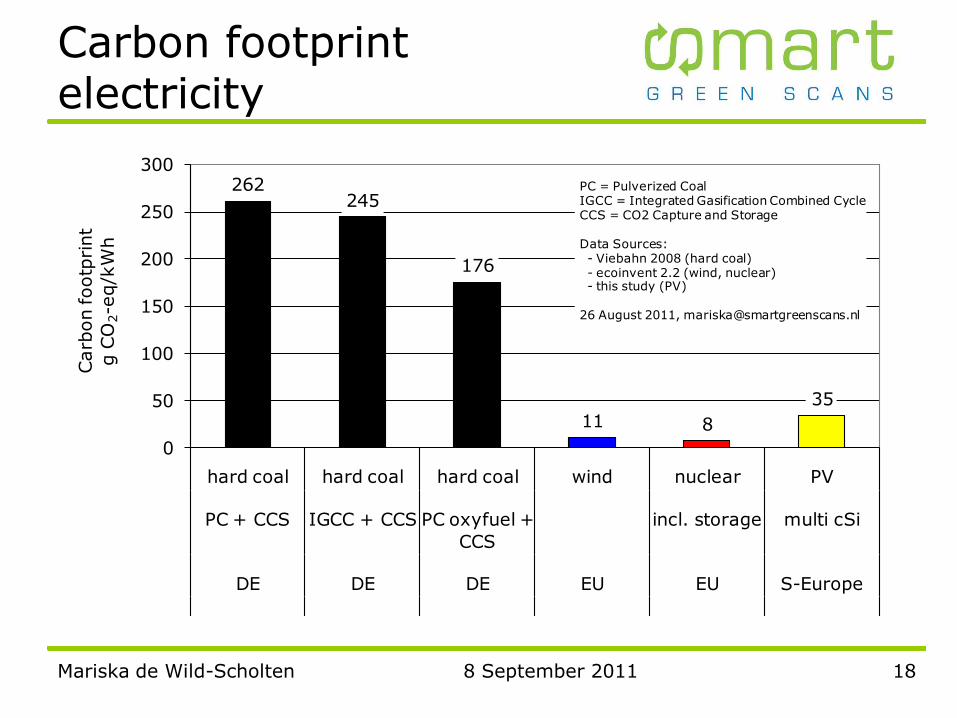
262245
176
11 8
35
0
50
100
150
200
250
300
hard coal hard coal hard coal wind nuclear PV
PC + CCS IGCC + CCS PC oxyfuel +
CCS
incl. storage multi cSi
DE DE DE EU EU S-Europe
2020 2020 2020 2005 2005 2010
Carb
on footp
rint
g C
O2-e
q/k
Wh
PC = Pulverized CoalIGCC = Integrated Gasification Combined CycleCCS = CO2 Capture and Storage
Data Sources:- Viebahn 2008 (hard coal)- ecoinvent 2.2 (wind, nuclear)- this study (PV)
26 August 2011, [email protected]

Carbon footprint electricity
19Mariska de Wild-Scholten 8 September 2011
0.0 0.2 0.4 0.6 0.8 1.0
Mexico 2008
India 2008
Spain 2005
Korea 2008
USA 2008
Malaysia 2008
Taiwan 2008
Germany 2005
Japan 2008
China 2008
UCTE 2005
hard coal
lignite
peat
oil
natural gas
industrial gas
hydropower
nuclear power
photovoltaic
wind power
cogeneration
other
waste
634
868
526
639
778
1012
889
680
589
1166
531
0 500 1000 1500
Mexico 2008
India 2008
Spain 2005
Korea 2008
USA 2008
Malaysia 2008
Taiwan 2008
Germany 2005
Japan 2008
China 2008
UCTE 2005
gram CO2-eq/kWh --- IPCC2007 GWP100a
high uncertaintytop productionlocations

Carbon footprint
20Mariska de Wild-Scholten 8 September 2011
0
10
20
30
40
50
60
70
80
hydro
/UCTE
hydro
/countr
y
countr
y/c
ountr
y
hydro
/UCTE
hydro
/countr
y
countr
y/c
ountr
y
UCTE
countr
y
mono multi CdTe
Carb
on F
ootp
rint
g C
O2-e
q/k
Wh
poly-Si / wafer-cell-modulemodule degradation: 20%/30 years
ecoinvent 2.2 databaseIEA Statistics Electricity 2008
29 August [email protected]
PV module installed at 1700 kWh/m2.year
irradiation on optimally inclined plane
sensitivityto type ofelectricityfor electricityconsumptionin poly-Si, wafer,cell and moduleproduction

Installation location
21Mariska de Wild-Scholten 8 September 2011
http://re.jrc.ec.europa.eu/pvgis/cmaps/eu_opt/PVGIS-EuropeSolarPotential.pdf
kW
h/m
2.y
ear
1700
DECZ
IT
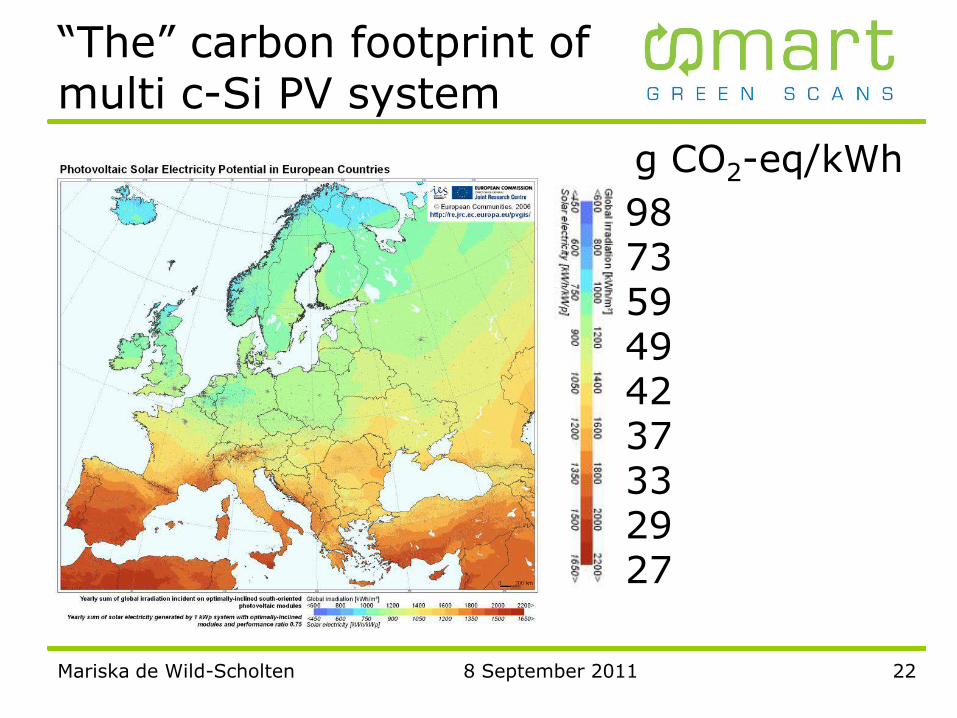
“The” carbon footprint of multi c-Si PV system
22
4.5 years
3.4 years
2.7 years
2.2 years
1.9 years
1.7 years
1.5 years
1.3 years
1.2 years
4.5 years
3.4 years
2.7 years
2.2 years
1.9 years
1.7 years
1.5 years
1.3 years
1.2 years
987359494237332927
8 September 2011Mariska de Wild-Scholten
g CO2-eq/kWh

Data & assumptions
23Mariska de Wild-Scholten 8 September 2011
mono multi μm-Si CdTe CIS
DATA SOURCES
poly-silicon 1 1
ingot/wafer 1 3
cell Schottler2009 2 + Schottler2009
module same as multi 2 Oerlikon Solar THINFAB First Solar DE, US, MY DE
mounting 1 1 1 1 1
inverter ecoinvent 2.2 ecoinvent 2.2 ecoinvent 2.2 ecoinvent 2.2 ecoinvent 2.2
KEY PARAMETERS
wafer thickness 180 μm 180 μm
cell size 156 mm x 156 mm 156 mm x 156 mm
module size 6 x 10 cells 6 x 10 cells
glass single single double double double
EVA or PVB EVA EVA EVA EVA PVB
frame yes yes no no yes
mounting on -roof Schletter Schletter fiX Schletter (cSi) Schletter (cSi)
inverter 2.5 kW 2.5 kW 2.5 kW 2.5 kW 2.5 kW
module recycling via glass recycler via glass recycler excl. filtercake recycling same as CdTe
average total module efficiency 14.4% 14.1% 10.0% 11.3% 11.0%
degradation (%/year) 0.67 0.67 0.67 0.67 0.67
performance ratio 0.75 0.75 0.75 0.75 0.75
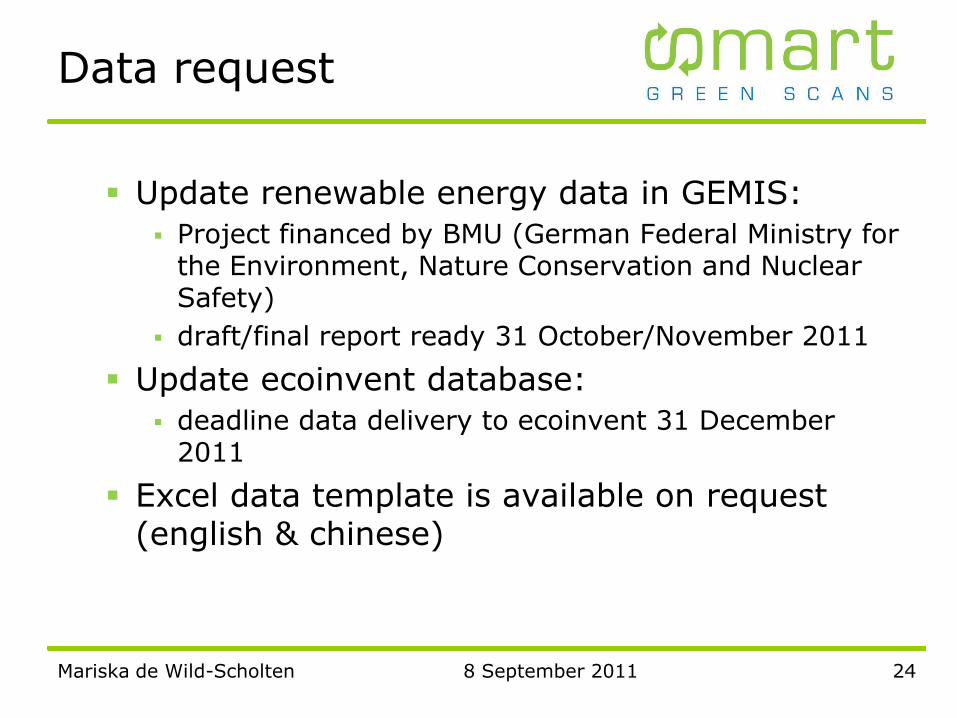
Data request
Update renewable energy data in GEMIS:
Project financed by BMU (German Federal Ministry for the Environment, Nature Conservation and Nuclear Safety)
draft/final report ready 31 October/November 2011
Update ecoinvent database:
deadline data delivery to ecoinvent 31 December 2011
Excel data template is available on request (english & chinese)
24Mariska de Wild-Scholten 8 September 2011
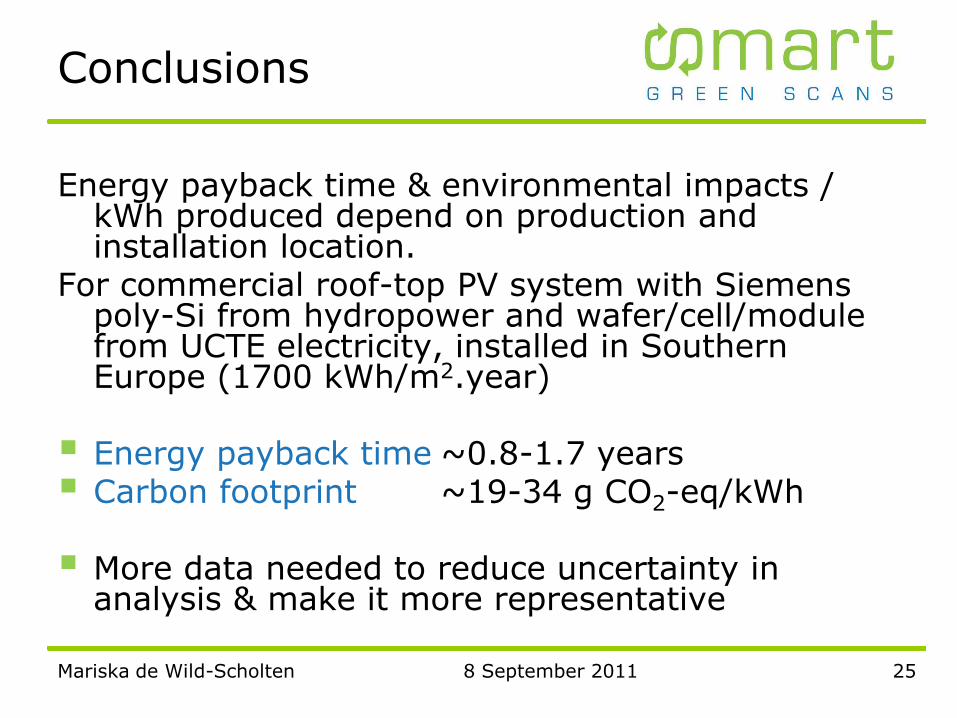
Conclusions
Energy payback time & environmental impacts / kWh produced depend on production and installation location.
For commercial roof-top PV system with Siemens poly-Si from hydropower and wafer/cell/module from UCTE electricity, installed in Southern Europe (1700 kWh/m2.year)
Energy payback time ~0.8-1.7 years Carbon footprint ~19-34 g CO2-eq/kWh
More data needed to reduce uncertainty in analysis & make it more representative
25Mariska de Wild-Scholten 8 September 2011
Acknowledgements:
BMU
Certisolis
First Solar
Further info:
http://smartgreenscans.nl/
download this presentation
free energy payback time tool thin film PV module
IEA PVPS Task 12
EPIA Sustainability Working Group
26Mariska de Wild-Scholten 8 September 2011
Thank you!
Tropical Aquarium Hagenbeck in Hamburg