Environmental Product Declaration - Huella Ambiental
35
Environmental Product Declaration Under the general rules of the Environmental Footprint Institute. Environmental Footprint in accordance with ISO 14040, ISO 14044, ISO 14025 and EN 15804+A1 without program registration for: Steel Wood Density Board (SDB) Steel Wood Industries FZCO (Dubai Branch) Diffusion institution: Environmental Footprint Institute Product group classification: UN CPC 31431 Registration number: 280120EFD Issue date: 28-01-2020 Validity date: 28-01-2024 An Environmental Product Declaration (EPD) should provide current information and may be updated if conditions change. The stated validity is therefore subject to the continued registration and publication at www.environmentalfootprintinstitute.org Geographical scope: United Arab Emirates (UAE)
Transcript of Environmental Product Declaration - Huella Ambiental

Environmental Product Declaration Under the general rules of the Environmental Footprint Institute.
Environmental Footprint in accordance with ISO 14040, ISO 14044, ISO 14025 and EN 15804+A1
without program registration for:
Steel Wood Density Board (SDB)
Steel Wood Industries FZCO (Dubai Branch)
Diffusion institution: Environmental Footprint Institute
Product group classification: UN CPC 31431
Registration number: 280120EFD
Issue date: 28-01-2020
Validity date: 28-01-2024
An Environmental Product Declaration (EPD) should
provide current information and may be updated if
conditions change. The stated validity is therefore subject
to the continued registration and publication at
www.environmentalfootprintinstitute.org
Geographical scope: United Arab Emirates (UAE)
2
Environmental Product Declaration of Steel Wood Density Boards In accordance with ISO 14025 and EN 15804
GENERAL INFORMATION
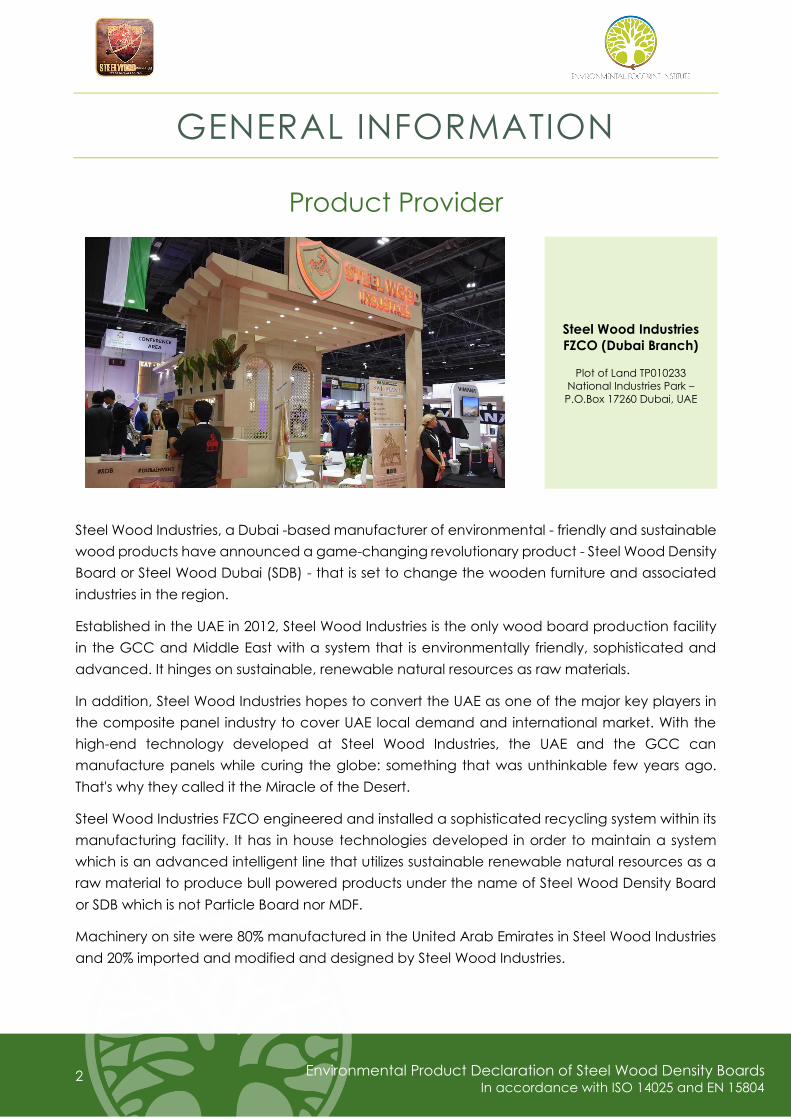
Product Provider
Steel Wood Industries, a Dubai -based manufacturer of environmental - friendly and sustainable
wood products have announced a game-changing revolutionary product - Steel Wood Density
Board or Steel Wood Dubai (SDB) - that is set to change the wooden furniture and associated
industries in the region.
Established in the UAE in 2012, Steel Wood Industries is the only wood board production facility
in the GCC and Middle East with a system that is environmentally friendly, sophisticated and
advanced. It hinges on sustainable, renewable natural resources as raw materials.
In addition, Steel Wood Industries hopes to convert the UAE as one of the major key players in
the composite panel industry to cover UAE local demand and international market. With the
high-end technology developed at Steel Wood Industries, the UAE and the GCC can
manufacture panels while curing the globe: something that was unthinkable few years ago.
That's why they called it the Miracle of the Desert.
Steel Wood Industries FZCO engineered and installed a sophisticated recycling system within its
manufacturing facility. It has in house technologies developed in order to maintain a system
which is an advanced intelligent line that utilizes sustainable renewable natural resources as a
raw material to produce bull powered products under the name of Steel Wood Density Board
or SDB which is not Particle Board nor MDF.
Machinery on site were 80% manufactured in the United Arab Emirates in Steel Wood Industries
and 20% imported and modified and designed by Steel Wood Industries.
Steel Wood Industries
FZCO (Dubai Branch)
Plot of Land TP010233
National Industries Park –
P.O.Box 17260 Dubai, UAE

3
Environmental Product Declaration of Steel Wood Density Boards In accordance with ISO 14025 and EN 15804
Products
Steel Wood Industries FZCO (Dubai Branch) produces Steel Wood Density Board (SDB) which is
as per definition an environmental-friendly composite wood material, that is made up of 100%
post-consumer recycled random mix of wood species (including SDB waste panels excluding
MDF).
Trees are not to be cut to manufacture SDB as the raw material need to be 100% unusable wood
residues and waste wood. Should there be a non-environmental tree proven and justified by
international norms, the manufacturer should not engage in trimming and cutting of the tree
and a third party needs to be engaged in such an operation to maintain the chain of custody
requirements enforced by the FSC Certification Body or similar. SDB is a recycled material
manufactured in an SDB dedicated-intelligented line that produces high mechanical properties
when compared to the mother-wood species.
SWI manufactures thicknesses from 8 mm to 44 mm with combination of thicknesses and
densities varying from 630 kg/m3 to 830 kg/m3. The breeds and brands of SDB are Ox-products
some of which are summarized in the table below:
Steel Wood Industries FZCO sustainable practices
Steel Wood Industries FZCO (Dubai Branch) operations are certified in accordance with industry
standards to meet regulations. These are some of the sustainable practices throughout their
manufacturing operations:
• Follows the Green Building Regulations published by Dubai Municipality Circular No. (198)
of 2014.
• Contribution to obtain LEED system certifications in construction projects.

4
Environmental Product Declaration of Steel Wood Density Boards In accordance with ISO 14025 and EN 15804
• Report of Carbon Footprint Calculation (November 2019) based on “NEDCCS-RGW:
Natural Economic Direct Carbon Capture System - Reverse Global Warming”. This report
(Annex I in this document), includes the calculation of Avoided Emissions with a negative
carbon dioxide value of -1,031,930 MTCO2 per year at 125 CBM per day capacity
• As calculated and declared by Steelwood Industries SDB have a Negative Carbon
Calculations based on “WARM Version 14 – U.S Environmental Protection Agency of
Chapter 10 Wood Flooring and Chapter 11 Wood Products” with a result of -1,093,605.72
MT of CO2e per year at 125 CBM per day capacity.
• As declared by Steelwood Industries the end of life of Steel Boards is not to a landfill but
sent for recycling as SDB can be re-recycled.
Declared Unit
This EPD presents the environmental impacts of the production of 1 CBM (equivalent to 1 cubic
meter) of Steel Wood Density Board (SDB) manufactured by Steel Wood Industries plant in Dubai,
UAE.
The EPD only covers the Cradle to Gate stage because other downstream stages, like
distribution, use phase or disposal, are very dependent on scenarios, and are better developed
for specific installation or construction works EPDs.
Considering that the manufacturing processes are equal regardless the type of SDB, this EPD
represents the environmental impacts of a generic SDB manufacturing. To allow a general
distribution of all the raw materials, regardless the type of SDB, the number of components
supplied to the plant in 2018 has been divided by the total production of SDB in 2018.
System boundaries
A simplified model of the manufacture process of SDB production is described, enumerating the
main activities included in the system boundaries. In the boundaries of this EPD, the end of the
product life cycle is the gate of the Steel Wood plant that manufactures the SDB before
distribution.
It is important to consider that this EPD refers to the SDB manufacturing. Raw materials in Module
A1 include the consumer raw wood and resins, process in module A3 include all the processes
needed to manufacture the wood panels, including milling, drying, glue blending, hot press,
trimming and packaging of the SDB.

5
Environmental Product Declaration of Steel Wood Density Boards In accordance with ISO 14025 and EN 15804
The scope of this EPD is "cradle to gate with options".
Possible scopes of the Life Cycle Assessment (LCA) defined in EN 15804:2012+A1:2014
Product stage
Construction
process
stage
Use stage End of life stage
Resource
Recovery
Stage
Ra
w m
ate
ria
ls
Tra
nsp
ort
Ma
nu
fac
turin
g
Tra
nsp
ort
Co
nst
ruc
tio
n in
sta
llatio
n
Use
Ma
inte
na
nc
e
Re
pa
ir
Re
pla
ce
me
nt
Re
furb
ish
me
nt
Op
era
tio
na
l en
erg
y u
se
Op
era
tio
na
l wa
ter
use
De
-co
nst
ruc
tio
n d
em
olit
ion
Tra
nsp
ort
Wa
ste
pro
ce
ssin
g
Dis
po
sal
Re
use
Re
co
ve
ry
Re
cyc
ling
po
ten
tia
l
A1 A2 A3 A4 A5 B1 B2 B3 B4 B5 B6 B7 C1 C2 C3 C4 D
X X X ND ND ND ND ND ND ND ND ND ND ND ND ND ND
X = Included, ND=Module not declared, NR= Module not relevant
Modules from A4 to D are not declared (X refers to considered stage, NR refers to not relevant
stage and ND to not declared stage).
Considering that the analysis has a “cradle to gate with options” scope (A1-A3 and A4) the
Reference Product Life is nor relevant and has not been included.
In the following schemes, the modules are linked to the real phases of the manufacturing and
distribution process.

6
Environmental Product Declaration of Steel Wood Density Boards In accordance with ISO 14025 and EN 15804
Product Stage
The raw materials such as: raw wood, resins and other components, are transported to the plant
where SDBs are manufactured. The manufacture of the SDBs and other raw materials and
components have been included in the system boundaries of the life cycle assessment. Once
the raw material and other components are manufactured, they are transported to the facilities
of Steel Wood plant in Dubai.
The following diagram (generated by Air.e LCA software) comprises the raw materials,
components, transports, processes, energy and fuel consumption and wastes included in the
life cycle assessment:
Here we include a brief description of the Steel Wood Density Boards (SBD) manufacture process
(A3 module):

7
Environmental Product Declaration of Steel Wood Density Boards In accordance with ISO 14025 and EN 15804
Content declaration
The following list includes the main materials used in the manufacture of the SDB. Only wood
and resins are part of the final product.
Material Percentage (Approx.)
Recycled raw wood 90%
Resins and other chemicals 10%
8
Environmental Product Declaration of Steel Wood Density Boards In accordance with ISO 14025 and EN 15804
TECHNICAL INFORMATION
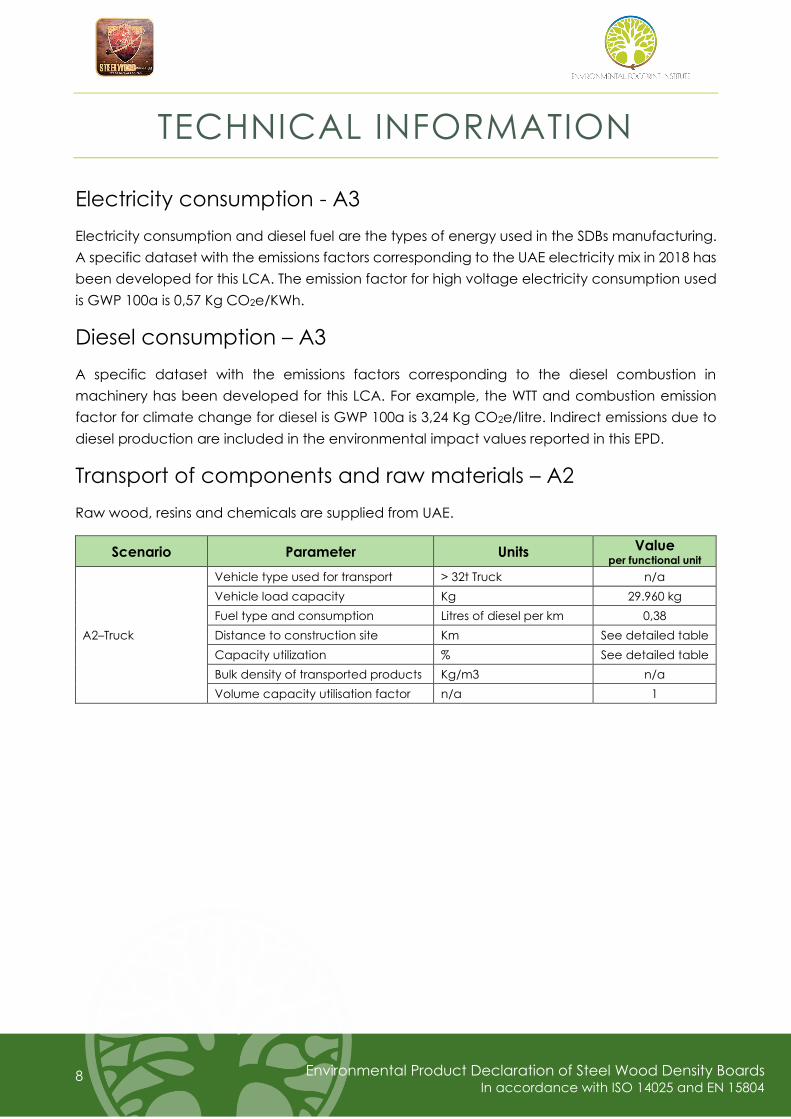
Electricity consumption - A3
Electricity consumption and diesel fuel are the types of energy used in the SDBs manufacturing.
A specific dataset with the emissions factors corresponding to the UAE electricity mix in 2018 has
been developed for this LCA. The emission factor for high voltage electricity consumption used
is GWP 100a is 0,57 Kg CO2e/KWh.
Diesel consumption – A3
A specific dataset with the emissions factors corresponding to the diesel combustion in
machinery has been developed for this LCA. For example, the WTT and combustion emission
factor for climate change for diesel is GWP 100a is 3,24 Kg CO2e/litre. Indirect emissions due to
diesel production are included in the environmental impact values reported in this EPD.
Transport of components and raw materials – A2
Raw wood, resins and chemicals are supplied from UAE.
Scenario Parameter Units Value per functional unit
A2–Truck
Vehicle type used for transport > 32t Truck n/a
Vehicle load capacity Kg 29.960 kg
Fuel type and consumption Litres of diesel per km 0,38
Distance to construction site Km See detailed table
Capacity utilization % See detailed table
Bulk density of transported products Kg/m3 n/a
Volume capacity utilisation factor n/a 1

9
Environmental Product Declaration of Steel Wood Density Boards In accordance with ISO 14025 and EN 15804
Calculation rules
Version 3.5 of software Air.e LCA™ with Ecoinvent™ 3.5 database have been used for LCA
modelling and impacts calculations.
ILCD rev 2.0 April 2018 has been used for impacts methods.
Annual Statistics 2018 report from Dubai Electricity & Water Authority has been used to create
the model of Dubai electricity mix.
All processes in main facilities related to the product have been included in the assessment.
Minor components not directly related to the product, with less than 1% impact, such as office
supplies, have been excluded from the assessment.
Only main means of transport have been included for materials purchases and delivery of coil
coating paints. “Last mile” transport has been excluded. As far as final destinations of coil
coating paints are not known in detail, transport distances have been calculated from factory
to city purchaser. Operation in port has also been excluded.
Road distances calculated using Google Maps. Maritime distances calculated using
MarineTraffic Voyage Planner.
When allocation rules where needed in the LCA, a mass approach has been used.
Cut-off rules: more than 99% of the materials and energy consumption have been included.
All transports of components have been included in the LCA considering real distances travelled
by materials used from January 2018 to December 2018. Transport of raw materials needed to
manufacture components are estimated in a global scale according to Ecoinvent™ criteria.
The Polluter Payer Principle and the Modularity Principle had been followed.

10
Environmental Product Declaration of Steel Wood Density Boards In accordance with ISO 14025 and EN 15804
ENVIRONMENTAL PERFORMANCE
In the following tables, the environmental performance of 1 cubic meter (CBM) of Steel Wood
Density Board (SDB) is presented for every sub-phase. The environmental impacts calculation
follows the environmental footprint methodology.
Potential Environmental Impact
A1
Raw material
(only wood)
A1-A3
Chemicals,
production and
SDB
manufacturing
Total
Global Warming Potential (GWP100)
(kg of CO2 equivalent) -1,200.00 1,589.57 389.57
Ozone depletion
(kg of CFC11 equivalent) 1.09e-6 46.82e-6 47.91e-6
Acidification of land and water
(mol H+ equivalent) 0.06 2.06 2.12
Eutrophication
(kg of P equivalent) 1.42e-3 76.57e-3 77.99e-3
Photochemical ozone creation
(kg of non-methane volatile organic
compounds NMVOC equivalent)
0.09 0.84 0.93
Depletion of resources (final reserve)
(kg of Sb equivalent) 5.34e-5 1.32e-3 1.37e-3
Depletion of resources (fossil)
kJ net calorific value 0.93e-5 7.12 7.12
11
Environmental Product Declaration of Steel Wood Density Boards In accordance with ISO 14025 and EN 15804
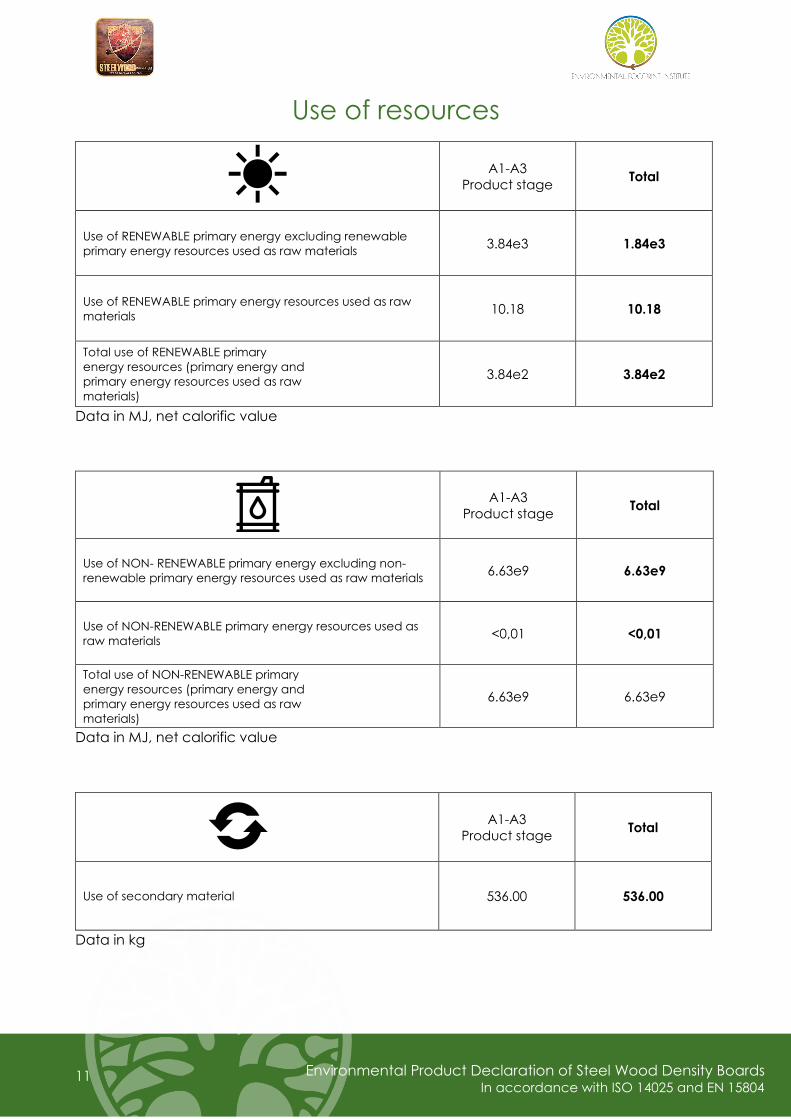
Use of resources
A1-A3
Product stage Total
Use of RENEWABLE primary energy excluding renewable
primary energy resources used as raw materials 3.84e3 1.84e3
Use of RENEWABLE primary energy resources used as raw
materials 10.18 10.18
Total use of RENEWABLE primary
energy resources (primary energy and
primary energy resources used as raw
materials)
3.84e2 3.84e2
Data in MJ, net calorific value
A1-A3
Product stage Total
Use of NON- RENEWABLE primary energy excluding non-
renewable primary energy resources used as raw materials 6.63e9 6.63e9
Use of NON-RENEWABLE primary energy resources used as
raw materials <0,01 <0,01
Total use of NON-RENEWABLE primary
energy resources (primary energy and
primary energy resources used as raw
materials)
6.63e9 6.63e9
Data in MJ, net calorific value
A1-A3
Product stage Total
Use of secondary material 536.00 536.00
Data in kg

12
Environmental Product Declaration of Steel Wood Density Boards In accordance with ISO 14025 and EN 15804
A1-A3
Product stage Total
Use of net fresh water 6.58e2 6.58e2
Data in m3
A1-A3
Product stage Total
Use of RENEWABLE secondary fuels <0.01 <0.01
Use of NON-RENEWABLE secondary fuels <0.01 <0.01
Data in MJ, net calorific value
Waste disposed
A1-A3
Product stage Description
Hazardous waste disposed 43.25e4
Chemicals
(In house water
treatment plant)
Non-hazardous waste disposed 44.35e4 Solid Waste
Radioactive waste disposed <0.01 -
Data in kg

13
Environmental Product Declaration of Steel Wood Density Boards In accordance with ISO 14025 and EN 15804
Other output flows
A1-A3
Product stage Description
Components for re-use (Kg) 0 -
Materials for recycling (Kg)1 90.00 Nails
Materials for energy recovery (MJ) 41.88e3 Dust
Exported energy (MJ) 0 -
DIFFERENCES VERSUS PREVIOUS
VERSIONS OF THE EPD
This is the first version of the Environmental Product Declaration (EPD) so there is no previous
version of this EPD.
1 Theoretically all SDB can be recycled after end of life.

14
Environmental Product Declaration of Steel Wood Density Boards In accordance with ISO 14025 and EN 15804
INFORMATION AND VERIFICATION
Diffusion institution:
The Environmental Footprint Institute
Calle CIRCE 49A
Madrid 28022
Spain
www.environmentalfootprintinstitute.org
EPD registration number: REF: 271219EFP CR:P-3155
Published: 27-12-2019
Valid until: 27-12-2024
Product Category Rules: UNE-EN 15804:2012 + A1:2014
Sustainability of construction works.
Environmental Product Declarations.
Core rules for the product category of
construction products.
Product group classification: UN CPC 31431
Reference year for data: January 2018 – December 2018
Geographical scope: United Arab Emirates (UAE)
Product category rules (PCR): UNE-EN 15804:2012
PCR review was conducted by: The Environmental Footprint Institute.
Chair: Iván Jiménez.
Contact: [email protected]
Independent verification of the declaration and data, according to ISO 14040 and
ISO 14025:
Process Certification (internal) X Verification (external) Pending verification
Third party verifier: Alfredo Costalago Alcántara
Accredited by: The Environmental Footprint Institute

15
Environmental Product Declaration of Steel Wood Density Boards In accordance with ISO 14025 and EN 15804
MANDATORY STATEMENTS
Explanatory material can be obtained from EPD owner and/or LCA author. Contact information
can be found below.
The verifier and The Environmental Footprint Institute do not make any claim or present any
responsibility about the legality of the product.
EPDs within the same product category but from different programmes may not be
comparable.
CONTACT INFORMATION
EPD owner:
STEEL WOOD INDUSTRIES FZCO (DUBAI BRANCH)
NATIONAL INDUSTRIES PARK
P.O. BOX 17260 JAFZA 3, DUBAI, UAE
Phone : +971 4 880 7576
Fax: +971 4 880 7574
LCA author:
S. Beskirajan, GCAS Quality Certifications
P.O.Box 65561, Dubai, UAE
www.gcasquality.com
Rubén Jiménez, Solid Forest S.L.
CP 28703, San Sebastián de los Reyes, SPAIN
www.solidforest.com Argen
Programme operator: The Environmental Footprint Institute
Calle Circe 49A Madrid, Spain
www.environmentalfootprintinstitute.com
info@ environmentalfootprintinstitute.com
Alfredo Costalago Alcántara

16
Environmental Product Declaration of Steel Wood Density Boards In accordance with ISO 14025 and EN 15804
REFERENCES
This Environmental Product Declaration has been developed and diffused following the
instructions of the Environmental Footprint Institute. Further information and the document itself
with reference 170919EFP are available at: (www.environmentalfootprintinstitute.org)
LCA Report: Life Cycle Inventory of Steel wood Density Boards.
Software: Air.e LCA rev. 3.5.2 (www.solidforest.com)
Main database: Ecoinvent 3.5 (www.ecoinvent.org)
Normative: ISO 14040:2006 “Environmental management -- life cycle assessment -- principles
and framework”, ISO 14044:2006 “Environmental management -- life cycle assessment --
requirements and guidelines”, ISO 14020 “ Environmental Labelling: General Principles”, ISO
14025:2006 “Environmental labels and declarations -- type III environmental declarations --
principles and procedures” and EN 15804

17
Environmental Product Declaration of Steel Wood Density Boards In accordance with ISO 14025 and EN 15804
ANNEX I
Report of Carbon Footprint Calculation (November 2019) developed by Steel Wood Industries
FZCO, verified by Connie Klinkam and based on “NEDCCS-RGW: Natural Economic Direct
Carbon Capture System - Reverse Global Warming”.

1
NEDCCS-RGW: NATURAL ECONOMIC DIRECT CARBON CAPTURE SYSTEM –
REVERSE GLOBAL WARMING
Steel Wood Industries FZCO (Dubai Branch) Plot of Land TP010233
National Industries Park
(Received November 4 – Approved November 25)
Declaration Number: 13CA24184.1911.4
Abstract. Nowadays, a life-cycle assessment and environmental product declaration is scientifically needed to
highlight the performance of materials for applications governed by the uprising green building regulations and
standards, strict purchasing guidelines, and energy climate change policy issues. The study allocated here will be
directed towards the calculation of negative carbon dioxide or carbon capture due to the recycling of 100% post-
consumer wood and wood residuals.
Keywords: Environmental performance, wood products, life cycle assessment, LCA, embodied energy, carbon
store, carbon footprint.
INTRODUCTION
The objective of this study is intended to highlight the relation between SDB as a product being from
100% post-consumer recycled wood and Carbon Emission Reduction. The full case-study was done on a Dubai-based mill under the name of Steel
Wood Industries FZCO (Dubai Branch). Throughout the full study, reference will be made to WARM V.14 and openLCA V.15 – U.S
Environmental Protection Agency of Chapter 10 Wood Flooring and Chapter 11 Wood Products.1
Composite wood material discussed within this paper is SDB-type which is as per definition an environmental-friendly composite wood material,
that is made up of 100% post-consumer recycled random mix of wood species (including SDB waste panels excluding MDF). Trees are not to be cut to
manufacture SDB as the raw material need to be 100% unusable wood residues and waste wood. Should there be a non-environmental tree proven
and justified by international norms, the manufacturer should not engage in trimming and cutting of the tree and a third party needs to be
engaged in such an operation to maintain the chain of custody requirements enforced by the FSC
Certification Body or similar. SDB is a recycled material manufactured in an SDB dedicated-intelligented line that produces high mechanical
properties when compared to the mother-wood species. (APA Product Report PR-C509).
The LCA performed for SDB is to be done and verified and attested by a third party for Steel Wood Industries FZCO (Dubai Branch). The data provided
within this study are yet to be modelled in WARM
pending modelling the SDB-LCA into the NEDCCS
model. LCA data are valuable when it comes to establishing whether a product is green in terms of its favorable environmental performance, as a
benchmark for improving environmental-friendliness, and for comparison with alternative materials. The data form the foundation for the scientific
assessment in terms of a variety of environmental functioning measures. It provides data that can be used to establish the performance of SDB for many
green-type product standards, guidelines, and public policies. Issues in which the data can be used are
sustainability, global warming, climate change, carbon storage, carbon trading and caps, biofuel use, green-product purchasing, and green building.
Should the model widespread, it opens the door for NEDCCS: RGW (Reverse Global Warming) achieving requirements set by UNFCCC to be used as
a natural direct carbon-capture method. Re-forestation can be achieved thus increasing the carbon-capture from the atmosphere resulting with time to lowering
the greenhouse gases; GHG. The excessive abundancy of post-consumer wood can fill the
increasing demands for the growing market. This LCA consists of an accounting of all inputs and outputs of a material from its natural resources in the
ground through production of a product and can include downstream transportation, product use, disposal, and/or recycling.
2
DEFINITIONS
SDB: Steel Wood Density Board Wood Type
Ox-products: brands bred from SDB for specific end-product application and used summarized in the table below:
Table 1- Ox-products Definitions
PROCEDURE
LCA of manufacturing SDB for this study covers
the environmental impacts from the in-ground
resources for wood, resin, fuels and electricity
through transportation and manufacturing process.
This is referred to as a cradle-to-product gate study
(Fig 1). The study was conducted for the duration
covering October 2018 – September 2019 and done
in accordance with ISO 14040 and 14044 protocol
(ISO 2006a, ISO 2006b). Primary data were
estimated on a one-year full run for a capacity of
125 CBM a day.
MANUFACTURING PROCESS
SDB line manufacturing process is highly
automated on an SDB oriented and intelligented
production line. The process consists of the
following production steps.
Incoming Material: 100% post-consumer wood is
delivered by contractors and waste management
companies to SWI premises without ending up in
landfill. 100% pos-consumer is to include a random
mix of used wood that is considered as a raw
material. SWI QAQC will inspect the material and
accordingly accept or reject it based on the criteria
specified in the SDB guidelines; specifically, not to
include post-consumer MDF. The material is then
stored inside an open yard – based on the FIFO
(First in First Out) Method where its MC is
averaged to be at 10% weight basis.
Wood Shredding: Accepted sorted wood as per SWI
guidelines is passed through a shredder and ferrous
metals like nails, clips, etc ... are then separated
through magnets. Metal outcome is then sent for
recycling through approved list of scrap companies.
Refining: Oversized particles are then refined, a process of mechanically reducing the particle
geometry into uniform sizes of desired dimensions; this process is usually accomplished with the use of SWI Intelligented separation system and refining
hammermills.
Drying: Particles are sent through SWI intelligented rotary dryers in a single-pass configuration. Particles enter the dryers at moisture content of 7% to 14% oven dry basis and are dried to a targeted
MC of about 1 – 5%. Dryers in SWI premises function on green energy and fine rejected dust in
furnace consuming around 3tons/24hr. (Normal consumption on non-SWI intelligented line is around 40tons/24hr).
Blending: This is a process in which resin is mixed with dry particles. The average resin content in this
study is accounted to be 10% of final board weight.
Forming: Blended particles with glue are then distributed in a SWI intelligented forming machine to form 3 layers (1 core and 2 surface). The size of
particles, moisture and resin content are controlled for the face and core layers to obtain the desired panel properties maintaining the SDB guidelines set
by APA and CPA.
Hot Pressing: Formed mats are conveyed into a large hot press in which all openings close simultaneously. The presses operate at enough
Product Density Range
(kg/m3) Replacement
Reference
Chapter in
WARM version
14
OXFRAME
Made from
SDB-type
composite
wood door
compatible
for fire rated
doors
630 – 700
Av: 665 Solid Wood
Chapter 10:
Forest Carbon
Calculations
OXNAR
Made from
SDB-type
composite
wood door
compatible
for fire rated
doors
680 – 700
Av: 690
Composite Wood
Material Door
(Particle Board)
Mineral Cores
Chapter 11: Net
Carbon Emission
Calculations
OXSAWT
Made from
SDB-type
composite
wood door
compatible
for acoustic
panels
650 – 700
Av: 675
Composite Wood
Material Door
(Particle Board)
Mineral Cores
Chapter 11: Net
Carbon Emission
Calculations
OXNAR-
SAWT
Made from
SDB-type
composite
wood door
compatible
for fire-rated
and acoustic
doors
680 – 740
Av: 710
Composite Wood
Material Door
(Particle Board)
Mineral Cores
Chapter 11: Net
Carbon Emission
Calculations
OXPANELS
Made from
SDB-type
composite
wood panels
for wall
paneling
applications
720 – 800
Av: 760
MDF Panels
Chipboard Panels
Chapter 11: Net
Carbon Emission
Calculations
OXTILES
Made from
SDB-type
composite
wood panels
for flooring
applications
720 – 800
Av: 760
Fire Rated
Plywood
Chapter 11: Net
Carbon Emission
Calculations

3
temperature, pressure and duration to ensure required thermodynamics and kinetics to cure the
resin.
Cooling: Hot panels exiting the press are placed on a star cooler wheel to enable the temperature of the panels to drop thus completing the manufacturing
process.
Sanding: Panels are sanded on both major surfaces to targeted thickness and smoothness. Sander dust coming of this process is either recycled back into the process or is used as a fuel for the dryers.
Functional Unit
For this study, material flows, fuel use, electricity use, and emissions data are normalized to a per production unit volume basis of 1.0 m3—the functional unit—of finished SDB ready to ship.
Lifecycle Assessment Modeling
The environmental impact analysis was done using openLCA v15 WARM software and include the EPA database to provide impacts for fuels, waste and electricity.
System Boundary Conditions
It is a complex method to separate the full production process into unit process; thus, the black box approach was adopted in this report calculation
method. For onsite emissions only, the emissions considered are those that occur because of on-site combustion of fuels whether for process heat or
operating equipment. For the cradle-to-gate with options emissions, all impacts are considered including those for the delivery of chemicals to SWI
site. Note that the delivery of raw material is outside the scope of SWI (to maintain the SDB definition) and
delivery of end products as well are outside the scope of SWI (to maintain the universal calculations of Carbon Dioxide Emissions).
Table 2- Illustration of Mandatory and Optional Elements
and Information Modules adapted from EN 15804:2012
PRODUCT END OF LIFE BENEFITS
A1 A2 A3 C1 C2 C3 C4 D
RA
W M
AT
ER
IAL
SU
PP
LY
TR
AN
SP
OR
T
MA
NU
FA
CT
UR
ING
DE
MO
LIT
ION
TR
AN
SP
OR
T
WA
ST
E
PR
OC
ES
SIN
G
DIS
PO
SA
L
RE
US
E-
RE
CO
VE
RY
_
RE
CY
CL
ING
PO
TE
NT
IAL
M M O O O O O O
A1: Raw Material supply; including processing of secondary material input if any – Applicable on to chemicals in SWI case.
A2: Transport of raw material and secondary material to the manufacturer if any – Applicable on
chemicals in SWI case.
A3: Manufacturing of the construction products and all upstream processes from Cradle to Gate – Applicable to System Boundary Conditions
C1: Demolition of Building/Building Products – Optional – Not Considered
C2: Transport of the demolition to the end-of-life waste facility – Optional – Not Considered
C3: Waste processing operations for reuse, recovery or recycling – Optional – Not Considered
C4: Final Disposal of end-of-life construction product – Optional – Not Considered
D: Reuse/Recovery/Recycling Potential Evaluated as net impacts and benefits.
POSITIVE CARBON CALCULATIONS
The below table will include a listing of all inputs and outputs for the on-site manufacturing of SDB for the duration of October 2018 – September 2019.
End-Product: This parameter is to indicate in cubic meters the amount of end-product SDB produced during the duration of October 2018 – September 2019.
100% Post-Consumer Wood Required: This parameter is to indicate the total post-consumer raw
wood required to manufacture the end product. Note that this factor is then used to calculate the source
reduction – forest carbon storage calculation – and net recycling factors. The number accounted is in tons at 10% Water Content. In the following
calculations, this number is then transformed to tree equivalence at 50-50 Water Content.
Glue Manufacturing: This parameter is to indicate
Figure 1- SWI Production Process

4
the kilometers driven to deliver both Chemical A and Chemical B to SWI site for the purpose of
manufacturing.
Energy Purchase: This parameter is to indicate the amount of diesel used to manufacture the end products and the kilometers driven for the purpose
of delivery.
Electricity Consumption: This parameter is to indicate the total electricity consumption in KWH for the purpose of manufacturing the End Product.
Water Consumption: This parameter is to indicate the total water consumption in Liters for the purpose
of manufacturing the End Product.
Waste Generated: This parameter is to indicate the waste generated for the purpose of manufacturing the end product. Waste in this section is further divided into four subsections 1- Chemical Liquid
Waste which is recycled on site using a water treatment plant. The outcome is then sent to sewerage disposal. 2- Solid Waste which is sent for
disposal as per municipality requirements 3- Metals which are then sent for recycling through an
approved list of scarp collectors. 4- Dust Consumption which is the green energy used in both furnace and boiler.
Table 3- Data (Input-Output) for Calculation
DATA FOR OCTOBER 2018 – SEPTEMBER 2019
END PRODUCT 37,500.00 CBM
RAW MATERIAL 100% POST CONSUMER
WOOD REQUIRED
25,650.00 TONS
GLUE
MANUFACTURING RESIN 3170.00 TONS
ENERGY PURCHASE
DIESEL
CONSUMPTION 411,192.00 L
KILOMETERS
DRIVEN
3,480.00 KM
ELECTRICITY CONSUMPTION 5,869,500.00 KWH
WATER CONSUMPTION 2,400,000.00 L
WASTE GENERATED
CHEMICAL
LIQUID WASTE
432,500.00 L
SOLID WASTE 11,036.67 KG
METALS 361,200.00 KG
DUST (GREEN
ENERGY)
2,412,816.00 KG
Taking the calculations, the necessity requires the calculation of raw material use and waste generated per CBM. The below table summarizes the reported
inputs and outputs to produce one CBM of SDB.
Table 4- Data (Input-Output) for Calculation per CBM
REQUIRED (INPUT/OUTPUT) PER CBM
END PRODUCT 1.00 CBM
RAW MATERIAL POST CONSUMER
WOOD 684.00 KG
GLUE
MANUFACTURING RESIN 8.45 KG
ENERGY PURCHASE 10.96 L
0.093 KM
ELECTRICITY CONSUMPTION 156 KWH
WATER CONSUMPTION 64 L
WASTE GENERATED
CHEMICAL
LIQUID 11.53 L
SOLID
WASTE 0.294 KG
METALS 9.632 KG
DUST
GREEN
ENERGY
64.34 KG
Note that the water meter is common between office area and manufacturing area – estimated ate 50% for offices and 40% for production.
Further to the table above, the approach of the RMAM (Raw Material Acquisition and Manufacturing) will be taken in order to calculation the emissions from the manufacturing process. Note
that the RMAM includes 1- GHG emissions from energy used during the RMAM process; 2- GHG emissions from energy used to transport materials
and 3- non energy GHG emissions resulting from the manufacturing process. Noting that the RMAM calculation in WARM also incorporates the “retail
transportation” which includes the average emissions from truck, rail, water and other modes of
transportation required to deliver the material. As mentioned before, the case study will be accounting the cradle-to-gate approach thus negating the “retail
transportation” factor.
The steps in calculating the RMAM are mentioned in WARM Version 14 page 11-7; following the same method – the below process will highlight the net positive emission factors from manufacturing
process and material acquisition.
Step 1- Reference made to Exhibit 11-6
Table 5- Exhibit 11-6 in MTCO2E/MT
MATERIAL
(A)
PROCESS
ENERGY
(B)
TRANSPORTATION
ENERGY
(C)
PROCESS
NON-
ENERGY
(D)
NET
EMISSIONS
(E)
DIMENSIONAL
LUMBER 0.0907 0.0725 0 0.163
MDF 0.2358 0.1179 0 0.353
AVERAGE 0.1632 0.0952 0 0.258
Summary
Calculation reference to Table 4 of Net Emissions from Manufacturing in MTCO2/Ton is positive
0.258 MTCO2/Ton

5
Table 6- Net Emissions from Manufacturing in MTCO2E
RAW MATERIAL ACQUISITION AND MANUFACTURING EMISSION FACTOR FOR
VIRGIN PRODUCTION OF WOOD
CBM PER YEAR 37,500 CBM
TONS PER YEAR 28,500 TONS AT 760 KG/M3
DENSITY
NET EMISSIONS FROM
MANUFACTURING AT (0.258)
FACTOR
7,353 MTCO2E
Step 2- Reference made to Exhibit 11-17
Table 7- Exhibit 11-17 in MTCO2E/MT
MATERIAL COMBUSTION MTCO2E/MT
WOOD PRODUCTS 0.589
Summary
Calculation reference to Table 4 of Net Emissions from Manufacturing in MTCO2/Ton is positive
0.589 MTCO2/Ton
Table 8- Net Emissions from Combustion in MTCO2E
UTILITY GHG EMISSIONS OFFSET FROM COMBUSTION OF WOOD PRODUCTS
TONS PER YEAR 2,412 TONS COMBUSTED
NET EMISSIONS FROM
COMBUSTION AT (0.589) FACTOR 1,422 MTCO2E
Reference made to Table 3 of the report, Electricity
consumption and diesel consumption are the sole
types of energy used during the manufacturing
process of SDB. In accordance to ISO 14025 and
EN 15804; reference should be made to the
United Arab Emirates as a benchmark for both
usages of Electricity and Diesel.
Electricity Consumption: A specific dataset with
the emissions factors corresponding to the UAE
electricity mix for the duration of October 2018
to September 2019 has been developed for this
LCA. The emission factor for electricity high
voltage consumed is GWP 100a 0.57
KgCO2e/KWH.
Table 9- Net Emissions from Electricity Consumption in
MTCO2E
NET EMISSIONS FROM ELECTRICITY CONSUMPTION IN MTCO2E
KWH PER YEAR 5,869,500 KWH PER YEAR
FACTOR 0.57 KgCO2e/KWH
NET EMISSIONS FROM
ELECTRCITY CONSUMPTION AT
(0.57 KgCO2/KWH)
3,345 MTCO2E
Diesel Consumption: A specific dataset with the
emissions factors corresponding to the UAE
diesel mix for the duration of October 2018 to
September 2019 has been developed for this
LCA. The emission factor for diesel combustion
is GWP 100a 3.24 KgCO2e/Liter.
Table 10- Net Emissions from Diesel Combustion in
MTCO2E
NET EMISSIONS FROM DIESEL COMBUSTION IN MTCO2E
LITERS PER YEAR 411,192 LITERS PER YEAR
FACTOR 3.24 KgCO2e/L
NET EMISSIONS FROM DIESEL
COMBUSTION AT (3.24
KgCO2/KWH)
1,332 MTCO2E
Total Positive Carbon Dioxide Emission Per
Year
Table 11- Total Positive Carbon Dioxide Emissions per Year
Note that reference to reports provided by the
manufacturer on Stack Analysis – their Sulfur
Dioxide (SO2); Oxides of Nitrogen (NOx) and
Carbon Monoxide (CO) tested in accordance to
USEPA EMC Method No.17 are considered to be
negligible.
TOTAL POSITIVE CARBON DIOXIDE EMISSION
NET EMISSIONS
FROM
MANUFACTURING
AT (0.2584) FACTOR
7,353 MTCO2E
NET EMISSIONS
FROM COMBUSTION
AT (0.58955) FACTOR 1,422 MTCO2E
NET EMISSIONS
FROM ELECTRCITY
CONSUMPTION AT
(0.57 KgCO2/KWH)
3,345 MTCO2E
NET EMISSIONS
FROM DIESEL
COMBUSTION AT
(3.24 KgCO2/KWH)
1,332 MTCO2E
Total 13,453 Negative Carbon Dioxide Tons per
Year

6
NEGATIVE CARBON CALCULATIONS
The below flow diagram will act as a summary
for the approach taken throughout the paper for
the calculation of negative carbon dioxide factor
and the carbon-capture of SDB-type and Steel
Wood Industries FZCO (Dubai Branch) a single
site mill as per WARM v14 maintaining the fact
that the NEDCCS is yet to be modelled.
Figure 2 - (A, B, C, D, E, F) Synopsis and approach for
carbon calculation
REFERENCE MADE TO CHAPTER 10 – WOOD FLOORING
This chapter describes the methodology used in EPA’s Waste Reduction Model (WARM)
generating an estimate lifecycle GHG emissions factors for wood products – considering the starting
point as waste generation.
The below Exhibit and flowchart (Exhibit 10-1 Life Cycle of Wood Flooring in WARM) highlights the
life cycle in which SWI and SDB as a model can engage in. Knowing that this section is solely for solid hardwoods flooring. However, as per the CE
Mark certificate issued by Euro Veritas having the harmonized standard tested in accordance to EN 13986:2004 + A1:2015 “Composite Wood Panels
in Class P1,P3,P5,P7; SDB-type and Ox-products can replace OSB, Plywood, MDF, Particleboard,
Chipboard and above all Solid Wood which is the main concern in this chapter. (Refer to Figure 2)
Note that the recycling aspect is not modeled in
Figure 3 knowing that WARM V.14 and EPA did
not strongly believe that solid wood can be recycled
the thing that Steel Wood Industries FZCO (Dubai
Branch) defied through its technology.
Steel Wood Industries FZCO (Dubai Branch) by its
product – SDB-type engages in the following
materials management options as described in the
referenced manual:
Forest Carbon Calculations for Virgin
Production of Wood Flooring
Based on the above, the net emissions for wood
products under each of the above-mentioned
management option is highlighted in Exhibit 10-10
of the reference manual as referenced below:
Note that Carbon Released from Wood Products
and as defined in the reference, is directly related to
the action of harvesting in which Steel Wood
Industries FZCO (Dubai Branch) is not engaged in.
SDB-type and as per definition is an
environmental-friendly composite wood material,
that is made up of 100% post-consumer recycled random mix wood species (including SDB waste
panels excluding MDF). Trees are not to be cut to manufacture SDB as the raw material” need 100%
unusable wood residues and waste wood. Should
there be a “non-environmental tree” proven and justified by international norms, the manufacturer
should not engage in trimming and cutting of the tree and a third party needs to be engaged in such
an operation to maintain the chain of custody
requirements enforced by the FSC certification body or similar. SDB is a recycled material
manufactured in an SDB dedicated-intelligented
line, that produces high mechanical properties when
WARM VERSION 14
Chapter 10 - Wood Flooring
A- Forest Carbon Calculations for
Virgin Production
B- Source Reduction
Chapter 11 - Wood Product
C- Net Emission Calculations of
Recycling
D- Net Emission Calculations of
Landfilling
E- Net Emission Calculations for
Combustion
F- Capacity Functionof Carbon Dioxide Stored in
Wood
Figure 3- Exhibit 10-1 Life Cycle of Wood Flooring
(edited)

7
compared to the mother-wood species. (APA
Product Report PR-C509).
Based on the above, Steel Wood Industries FZCO
(Dubai Branch) – “the manufacturer” is not
engaging in the cutting or transportation of raw
materials and thus the Carbon Released from
Wood Products is to be factored out to 0.
Note that One Metric Ton = 0.907 Short Tons -
Converting the above into Metric Tons is
summarized in the below table.
Table 12- Forest Carbon Storage Calculations in
MTCO2E/Ton
Material Forest Carbon
Released
Carbon Released from
Wood Products
Net Carbon
Released
Wood
Flooring -5.336
Note that as per FSC
Recycled 100%
Certificate of 100%
Post Consumer Wood –
SWI is not engaged in
cutting trees and thus
this is factored to be 0
-5.336
Summary
Calculation reference to Figure (1, A) of Forest
Carbon Calculations for Virgin Products is -5.336
MTCO2/Ton
REFERENCE MADE TO CHAPTER 11 – WOOD PRODUCTS
This chapter describes the methodology used in
EPA’s Waste Reduction Model (WARM);
generating an estimate lifecycle greenhouse gas
emissions factors for wood products – considering
the starting point as waste generation.
The above Exhibit and flowchart (Exhibit 11-1: Life
Cycle of Wood Products in WARM) highlights the
life cycle of Generic Wood Products (Not SWI-
SDB flowchart).
As per the above figure, Steel Wood Industries
FZCO (Dubai Branch) by its product – SDB-type
engage in the following materials management
options as described in the referenced manual.
Table 13- Compatibility with Chapter 11 of Wood
Based on the above, the net emissions for wood
products under each of the above-mentioned
materials management option is highlighted in
Exhibit 11-3 of the reference manual as referenced
below:
Note that One Metric Ton = 0.907 Short Tons -
Converting the above into Metric Tons is
summarized in the below table:
Method Aim Compatible
Source Reduction
(Figure 1,B)
Aims at the reduction of
dimensional lumber and
wood manufactured,
reducing the GHG
emissions – considering
the carbon storage that
results in increased forest
carbon stocks
Reference made to ECC
Certificate issued by CPA –
SWI and SDB engage in
source reduction.
Recycling
(Figure 1,C)
Though not strongly
believed by EPA that
dimensional lumber and
MDF can be recycled in a
closed loop system; EPA
has developed a model if
the recycled material
avoids and offsets the
GHG emissions
SWI with its technology
can engage in recycling a
random mix of wood as
entitled in APA report and
presented in FSC Recycled
100% certificate of TT-
CCO-06091.
Combustion
(Figure 1,E)
Aims at converting the
energy in municipal solid
waste (MSW) to deliver
energy
Raw material entering SWI
site either ends up as a final
product; un-used fine dust
from sanding and
preparation is diverted to
combustion for energy
usage for boiler and
furnace with green-energy
stack emission compliance.
Landfilling
(Figure 1,D)
Normal lifecycle of a
wood product ends in a
landfill, and because
recycled, WARM factors
the transportation energy
being saved.
Raw material presented in
the Incoming Material
Form mentions that our
wood is 100% post-
consumer wood – also
highlighted in FSC
Certificate. Furthermore,
SDB can be re-recycled
maintaining SDB
compliance allowing for
circular economy.
Figure 2-Exhibit 11-1 Life Cycle of Wood Products (edited)

8
Table 14- Exhibit 11-3 in MTCO2E/Ton
Material
Net Source
Reduction
(Reuse)
Emissions for
Current Mix of
Inputs
Net
Recycling
Emissions
Net
Combustion
Emissions
Net
Landfilling
Emissions
Dimensional
Lumber -2.238 -2.712 -0.628 -1.041
MDF -2.425 -2.723 -0.628 -0.970
Average -2.331 -2.717 -0.628 -1.005
Summary
Calculation reference to Figure 1 Section D,C,E
of Net Emissions for Wood Products under
Materials Management Option Applicable to Steel
Wood Industries FZCO (Dubai Branch) is: -3.773
MTCO2/Ton
Note that the Net Source Reduction (Reuse) of
Figure 1, B Emissions for Current Mix of Inputs Factor is factored with the Forest Carbon Storage
Calculations of Figure 1 Section A.
STEEL WOOD INDUSTRIES FZCO (DUBAI BRANCH) CAPACITY AND CARBON REDUCTION
General Capacity Calculations and Tree Equivalence
The calculation below will convert the dry (10%
average random-mix post-consumer wood arriving
at Steel Wood Industries Premises in UAE weather
conditions) to equivalence of forest tree.
Table 15- Factor Calculation of Dry Wood Received vs.
Useable Consumer Log Conserved
Per Day tons 96.25 10%
water*
Water Content 10% (due to dry and hot UAE Weather
and stored in outside bins by end users) * 9.63 tons
Net Wood (0% water assumptions by calculations) 86.63 tons
Water Content in Wood Fiber for Production
(requirement for production) 1.44 tons
Total Wood for Production at average water retention
in wood fiber 88.07
1.5%
water
Internally Yield 0.92 %
Debarked Tree Equivalence Recycled (tree Average at
50 water to wood ratio) 173.25 50/50
Loss of Normal Drying (due to dry and hot UAE
Weather and stored in outside bins by end users) * 77.00 tons
Wood Arriving at average 10% water content 96.25 tons
Ratio of Production to Original Tree 1.97 Full
Tree
Ratio of Production requirements to Original Tree
accounting for water content is: 1.97
Noting that the useable part of the tree is the
Timber part of the tree is in it debark log and bark,
stumps, crowns and roots are not used for the
purpose of wood manufacturing
Based on the above, the useable timber ratio is
averaged to be: (51.2% (softwood) + 46.4%
(hardwood)/2) = 49 %
Summary of Carbon Factors
Calculations Done are based on the below
flowchart
Figure 3- Synopsis and approach for carbon calculation
with actuals
WARM VERSION 14
Chapter 10 -Wood Flooring
A- Forest Carbon
Calculations for Virgin
Production
-5.336 MTCO2/Ton
B- Source Reduction
-2.331 MTCO2/Ton
Chapter 11 -Wood Product
C- Net Emission
Calculations of Recycling
-2.7175 MTCO2/Ton
D- Net Emission
Calculations of Landfilling
-1.005 MTCO2/Ton
E- Net Emission Calculations for
Combustion
-0.628 MTCO2/Ton
F- Capacity Functionof
Carbon Dioxide Stored

9
Based on Forest Carbon Storage Calculation
Table 16- Forest Carbon Storage Calculation Net Emission
Factor
Net Carbon Released
Net Source Reduction
(Reuse) Emissions for
Current Mix of Inputs
Total
-5.336 MTCO2/Ton -2.331 MTCO2/Ton -7.667 MTCO2/Ton
Table 17- Forest Carbon Storage Calculator based on SWI
Capacity
Forest Carbon Storage Calculation
CBM per Day 125 CBM
Average Density Produced 760 kg/cbm
Mass of Timber for Production at 1.5%
at resin 10% in tons 85.5 tons
Working days 300 days
Mass of Timber Per Year 25,650 tons
Tree Equivalent of Recycled Post
Consumer Annually (1.97 Factor from
Table 5 above)
50,459
tree equivalent in tons not
accounting for debarking of
logs, tree crown, lost stump
and roots.
Useable Timber Ratio (Softwood:
51.2%) (Hardwood: 46.4%). Average
to:
49% End of Life Not Modelled in
WARM*
Actual Tree Conserved for Forest
Carbon Storage 103,399
tree equivalent in tons
accounting for debarking of
logs, tree crown, lost stump
and roots.
Forest Carbon Storage Calculation at
Factor (-7.667) -793,075
tons per year of Carbon
Dioxide from Forest Carbon
Storage Calculation
The conservation of the Tree in the Virgin Forest
Does Not Only Economically Carbon Captures by
Natural Means but also allows for the natural
synthesis of Oxygen (along with sea planktons) for
continued life on earth and a cleaner Environment.
This model allows us to cover increased timber
demands as a function of population increase while
conserving our forests. This opens doors for a viable
economical/environmental climate change solution.
The essence of NEDCCS is not modelled in
nowadays Direct CarbonCapture Models
worldwide which is allowing for the natural
synthesis of Oxygen. This factor will be very hard
to model as the environmental issue is not only
GHGs but also the depletion of oxygen without
substitute to the lungs of earth -trees-.
Based on Recycling and Landfilling Calculation
Table 18- Net Emissions Factor Recycling and Landfilling
Net Recycling
Emissions
Net Landfilling
Emissions Net Emissions
-2.7175 -1.005 -3.723MTCO2/Ton
Table 19- Net Emissions factor Recycling and Landfilling
on Actual SWI Capacity
Net Emissions (Recycling and Landfilling)
CBM per Day 125 CBM
Average Density Produced 760 kg/cbm
Mass of Post-Consumer for
Production at 1.5% at resin 10% in
tons
85.5 tons
Working days 300 days
Mass of Post-Consumer Per Year 25,650 tons
Actual Post-Consumer Recycled
Annually 50,459
Tons of Post-Consumer
Recycled
Net Emissions (Recycling,
Landfilling) at Factor (-3.723) -188,212
tons per year of Carbon
Dioxide Recycling,
Landfilling
Based on Combustion Calculation
Table 20- Net Emissions Factor for Combustion
Net Combustion
Emissions Net Emissions
-0.628 -0.628 MTCO2/Ton
Table 21- Net emissions Factor for Combustion on Actual
SWI Capacity
Net Emissions (Combustion)
Tons per Year (Additional to
Capacity Calculations in Ton at
10% Water Content)
3,600 Tons
Net Emissions (Combustion) at
Factor (-0.628) -2,268
Tons per year of Carbon
Dioxide from Combustion
Based on Carbon Stored (Sequestrated) in
Manufactured Panels
Every 1 m3 of SDB-type has stored negative 1290
kg of CO2.
Table 22- Carbon Stored in end-product SDB for 300 days
Daily Capacity Total for 300 Days
125 CBM -48,375.00 MTCO2E

10
Total Negative Carbon Dioxide Emission
Table 23- Total Negative Carbon Dioxide Emissions on
Actual SWI Capacity
RESULTS ELABORATION
The total negative Carbon Dioxide Tons per year is
factored based on the below requirements:
Steel Wood Industries FZCO (Dubai Branch) is not
engaged in the initial transportation and raw
material factoring out the “Carbon Released from
Wood Products” as a positive 1.18 MTCO2/Short
Ton.
Steel Wood Industries FZCO (Dubai Branch)
engages in the source reduction for port-consumer
raw material need, giving the necessary time for a
tree to do its job, which is the “Forest Carbon
Storage Calculation based on Net Carbon
Released from Exhibit 10-10 and Net Source
Reduction from Exhibit 11-3” as a negative 7.667
MTCO2/MT.
Steel Wood Industries FZCO (Dubai Branch)
engages in recycling though as mentioned in page
11-6 of WARM; “EPA does not believe that
recycling of MDF and dimensional lumber is a
common practice in the US, WARM models an
emission factors for the recycled credit input by
assuming that the recycled material avoids or
offsets the GHG emissions” ; thus engaging in the
Net Recycling Emissions Factor. Steel Wood
Industries FZCO (Dubai Branch) also engages in
offsetting the amount of wood materials sent to
landfills at the end of life service by diverting the
same to recycling thus engaging in the Net
Landfilling Emissions Factor. Both landfilling
and recycling factor out to negative 3.773
MTCO2/MT. Not to mention that Steel Wood
Industries FZCO (Dubai Branch) raw material
either ends up as an end-product or as a green
energy to run its furnace and boiler; offsetting the
need for electricity production from powerplants
thus engaging in the Net Combustion Emissions
Factor. All the above factor to a Net Emissions of
negative -0.628 MTCO2/MT.
Based on the above, the general factor was
calculated and the total negative carbon dioxide
tones per year at 125 CBM per day capacity is
negative -1,031,930 MTCO2. (a non-modeled
NEDCCS: RGW factor by SWI)
Table 24- General Emission Reduction Factor
General Factor
Total -1,031,930 Negative Carbon Dioxide Tons per Year
Tree Equivalent of
Recycled Post
Consumer Annually
54,572
Post-consumer Raw Material recycled at Steel
Wood Industries as per capacity listed above
that:
Net Carbon Released and Net Forest
Reduction for Forest Carbon Storage
Calculation (Conserving the Virgin Tree in
Our Forests)
Net Recycling Emission Factor, Net
Landfilling Emission Factor and Net
Combustion Emission Factor (Eliminating
Burden to Our Environment due to re-
recyclability of SDB)
Factor of Oxygen Synthesis is not Modeled in
WARM
1 ton of Recycled
Wood in CO2
Equivalence
-19.09 MTCO2/Ton
EMISSION FACTORS MODELLED PER FUNCTIONAL UNIT
Reference made to Table 1 of this report, Table 25
will give a summary on Emission factors modelled
reference to the range of products provided by the
manufacturer solely dependent on the product
density accounting for 10% resin only. This factor
is subject to change due to the fact that both Forest
Carbon Storage Factor and Net Recycling -
Landfilling factor are directly related to the amount
of post-consumer wood used for the purpose of
manufacturing.
Total
Forest Carbon
Storage Calculation
at Factor (-7.667)
-793,075
tons per year of Carbon Dioxide
from Forest Carbon Storage
Calculation
Net Emissions
(Recycling,
Landfilling) at
Factor (-3.7225)
-188,212 tons per year of Carbon Dioxide
Recycling, Landfilling
Net Emissions
(Combustion) at
Factor (-0.628)
-2,268 Tons per year of Carbon Dioxide
from Combustion
Daily Net Carbon
Stored in
Manufactured
Panels
-52,245 Tons per year of Carbon Dioxide
stored in manufactured panels
Total -1,031,930 Negative Carbon Dioxide Tons per
Year
11
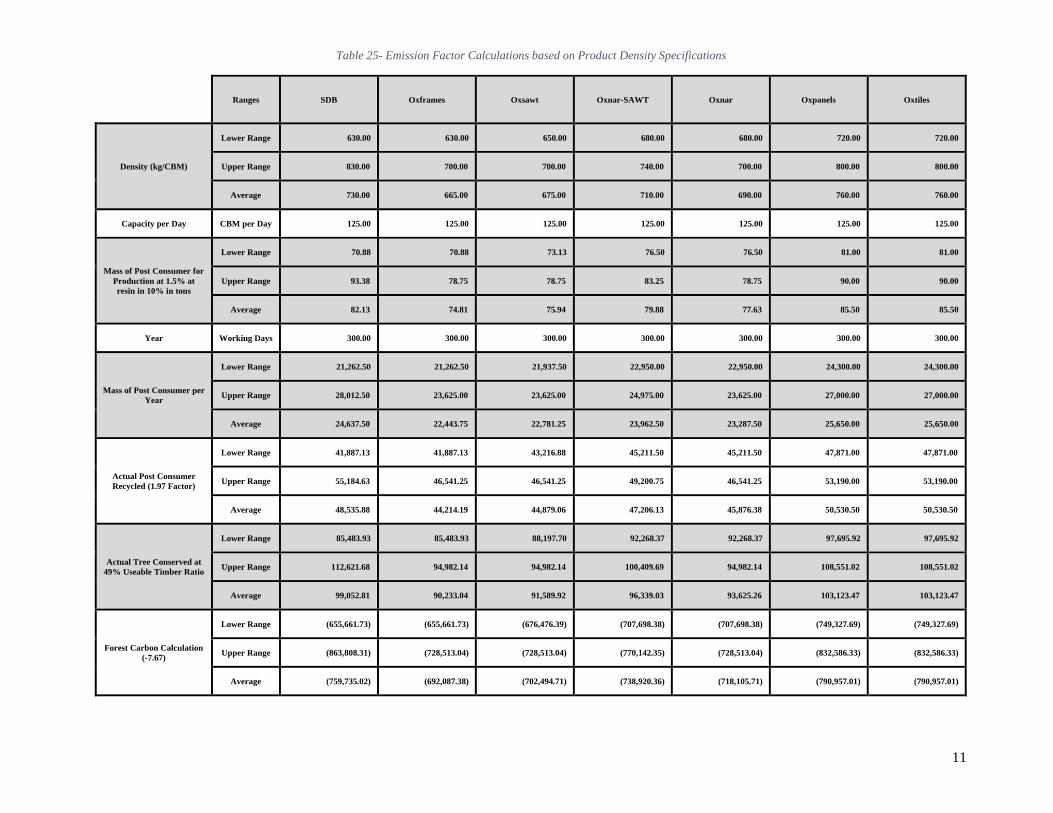
Table 25- Emission Factor Calculations based on Product Density Specifications
Ranges SDB Oxframes Oxsawt Oxnar-SAWT Oxnar Oxpanels Oxtiles
Density (kg/CBM)
Lower Range 630.00 630.00 650.00 680.00 680.00 720.00 720.00
Upper Range 830.00 700.00 700.00 740.00 700.00 800.00 800.00
Average 730.00 665.00 675.00 710.00 690.00 760.00 760.00
Capacity per Day CBM per Day 125.00 125.00 125.00 125.00 125.00 125.00 125.00
Mass of Post Consumer for
Production at 1.5% at
resin in 10% in tons
Lower Range 70.88 70.88 73.13 76.50 76.50 81.00 81.00
Upper Range 93.38 78.75 78.75 83.25 78.75 90.00 90.00
Average 82.13 74.81 75.94 79.88 77.63 85.50 85.50
Year Working Days 300.00 300.00 300.00 300.00 300.00 300.00 300.00
Mass of Post Consumer per
Year
Lower Range 21,262.50 21,262.50 21,937.50 22,950.00 22,950.00 24,300.00 24,300.00
Upper Range 28,012.50 23,625.00 23,625.00 24,975.00 23,625.00 27,000.00 27,000.00
Average 24,637.50 22,443.75 22,781.25 23,962.50 23,287.50 25,650.00 25,650.00
Actual Post Consumer
Recycled (1.97 Factor)
Lower Range 41,887.13 41,887.13 43,216.88 45,211.50 45,211.50 47,871.00 47,871.00
Upper Range 55,184.63 46,541.25 46,541.25 49,200.75 46,541.25 53,190.00 53,190.00
Average 48,535.88 44,214.19 44,879.06 47,206.13 45,876.38 50,530.50 50,530.50
Actual Tree Conserved at
49% Useable Timber Ratio
Lower Range 85,483.93 85,483.93 88,197.70 92,268.37 92,268.37 97,695.92 97,695.92
Upper Range 112,621.68 94,982.14 94,982.14 100,409.69 94,982.14 108,551.02 108,551.02
Average 99,052.81 90,233.04 91,589.92 96,339.03 93,625.26 103,123.47 103,123.47
Forest Carbon Calculation
(-7.67)
Lower Range (655,661.73) (655,661.73) (676,476.39) (707,698.38) (707,698.38) (749,327.69) (749,327.69)
Upper Range (863,808.31) (728,513.04) (728,513.04) (770,142.35) (728,513.04) (832,586.33) (832,586.33)
Average (759,735.02) (692,087.38) (702,494.71) (738,920.36) (718,105.71) (790,957.01) (790,957.01)
12
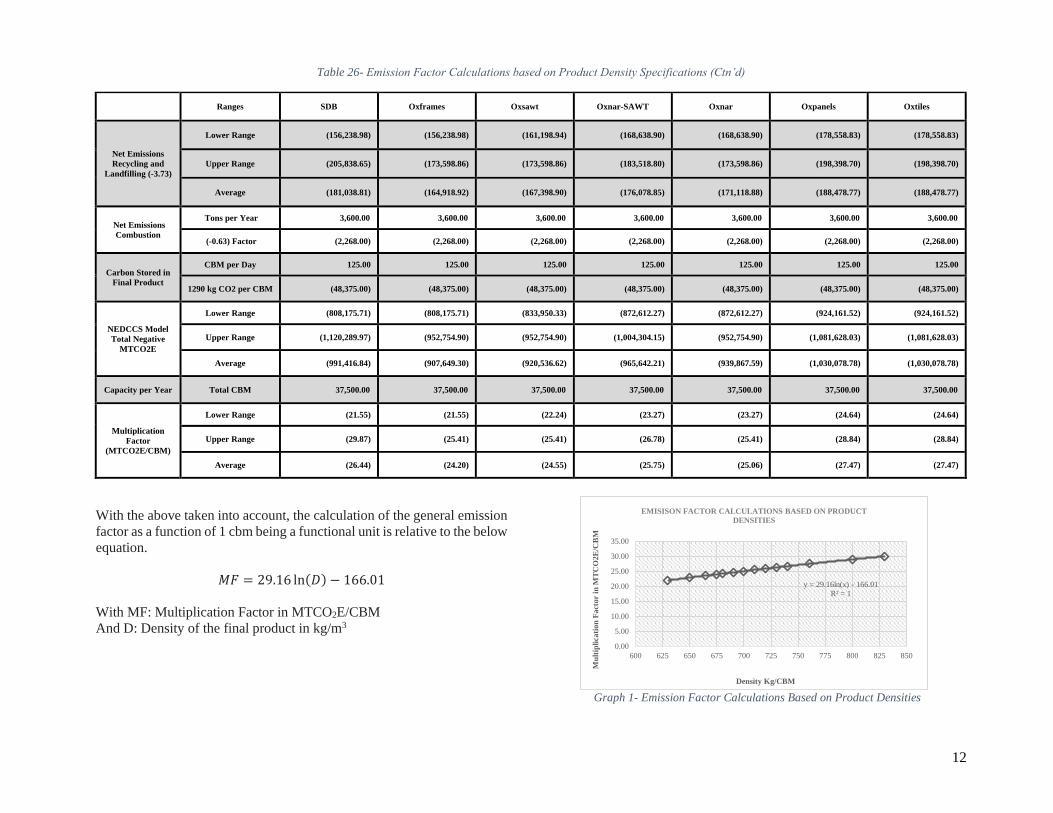
Table 26- Emission Factor Calculations based on Product Density Specifications (Ctn’d)
Ranges SDB Oxframes Oxsawt Oxnar-SAWT Oxnar Oxpanels Oxtiles
Net Emissions
Recycling and
Landfilling (-3.73)
Lower Range (156,238.98) (156,238.98) (161,198.94) (168,638.90) (168,638.90) (178,558.83) (178,558.83)
Upper Range (205,838.65) (173,598.86) (173,598.86) (183,518.80) (173,598.86) (198,398.70) (198,398.70)
Average (181,038.81) (164,918.92) (167,398.90) (176,078.85) (171,118.88) (188,478.77) (188,478.77)
Net Emissions
Combustion
Tons per Year 3,600.00 3,600.00 3,600.00 3,600.00 3,600.00 3,600.00 3,600.00
(-0.63) Factor (2,268.00) (2,268.00) (2,268.00) (2,268.00) (2,268.00) (2,268.00) (2,268.00)
Carbon Stored in
Final Product
CBM per Day 125.00 125.00 125.00 125.00 125.00 125.00 125.00
1290 kg CO2 per CBM (48,375.00) (48,375.00) (48,375.00) (48,375.00) (48,375.00) (48,375.00) (48,375.00)
NEDCCS Model
Total Negative
MTCO2E
Lower Range (808,175.71) (808,175.71) (833,950.33) (872,612.27) (872,612.27) (924,161.52) (924,161.52)
Upper Range (1,120,289.97) (952,754.90) (952,754.90) (1,004,304.15) (952,754.90) (1,081,628.03) (1,081,628.03)
Average (991,416.84) (907,649.30) (920,536.62) (965,642.21) (939,867.59) (1,030,078.78) (1,030,078.78)
Capacity per Year Total CBM 37,500.00 37,500.00 37,500.00 37,500.00 37,500.00 37,500.00 37,500.00
Multiplication
Factor
(MTCO2E/CBM)
Lower Range (21.55) (21.55) (22.24) (23.27) (23.27) (24.64) (24.64)
Upper Range (29.87) (25.41) (25.41) (26.78) (25.41) (28.84) (28.84)
Average (26.44) (24.20) (24.55) (25.75) (25.06) (27.47) (27.47)
With the above taken into account, the calculation of the general emission
factor as a function of 1 cbm being a functional unit is relative to the below
equation.
𝑀𝐹 = 29.16 ln(𝐷) − 166.01
With MF: Multiplication Factor in MTCO2E/CBM
And D: Density of the final product in kg/m3
y = 29.16ln(x) - 166.01
R² = 1
0.00
5.00
10.00
15.00
20.00
25.00
30.00
35.00
600 625 650 675 700 725 750 775 800 825 850
Mu
ltip
lica
tion
Fact
or
in M
TC
O2E
/CB
M
Density Kg/CBM
EMISISON FACTOR CALCULATIONS BASED ON PRODUCT
DENSITIES
Graph 1- Emission Factor Calculations Based on Product Densities

13
NEDCCS: NATURAL ECONOMICAL DIRECT CARBON CAPTURE SYSTEM
“While MDF can be made from a combination of
virgin and post-consumer recycled materials,
EPA has not located evidence that MDF is
manufactured with recycled material in the
United States. Dimensional Lumber cannot be
manufactured from recycled material.
Furthermore, the weak mechanical properties of
particleboard and the enforcing limitations to
MDF usage by a multitude of States and countries
worldwide enforces the need for a new product
type with superior and durable mechanical
properties become eminent. Both composite
materials mentioned earlier do not resolve the
environmental impacts due to a multitude of
limitations mentioned in WARM V.14 report.
SDB opened a door for a recycled material that
can be re-recycled maintaining healthy emission
factors and preserving the environment by
capturing carbon naturally and economically
while providing the need for a durable and
superior physical and mechanical property
stronger than the mother tree. Note that until date
the concept of recycling generally accounts or a
weaker end-product, a concept defied in SDB-
recycling and SWI technology.
NEDCCS PREMODEL
The below exhibit (reference to EPA
methodologies exhibits) will highlight the
NEDCCS model (Natural Economical Direct
Carbon Capture System) model from Steel Wood
Industries FZCO (Dubai Branch) perception
where it engages not only in the life cycle of a
product but rather introduces the circular
economy where SDB can be re-recycled.
Figure 4- SDB NEDCCS:RGW Model (Recycle/Reuse)
FACTORS NOT MODELLED IN WARM
There are a couple of factors which are essential to be respected in the NEDCCS model which are note mentioned out in WARM V.14 and openLCA
V.15. This section will thoroughly discuss the necessary taking the NEDCCS model a step ahead regarding:
Note that Steel Wood Industries FZCO (Dubai Branch) will be referred to as the “manufacturer”
1- Logistics Prior to Cradle
The manufacturer is not engaging in the initial
harvesting of material; neither in the
transportation nor in segregation of it as it defies
the initial definition of SDB “Steel Wood
Density Board”. Knowing the same, the positive
1.18 MTCO2E/Short Ton referenced from
Exhibit 10-10 in the forest Carbon Storage
Calculations for Virgin Production of Wood
Flooring is not only neutralized to be zero but
rather considered as a factor for negative carbon
dioxide calculations when discussing the cradle
to gate life cycle assessment of the
manufacturer. Factor value to be calculated
accordingly. Positive values are to be part of the
LCA of the harvesting party for Universal
Calculations.
2- Timber Equivalence
The manufacturer and as per SDB definition are
allowed to adapt as raw material only post-
consumer wood. The timber equivalences
calculated in WARM does not model the initial
tree having 51% of its total volume (mass) not
included in production (crown, stumps and
debarks). Note that a tree is cut only for the use
of its timber part.
This factor was adapted in NEDCCS model of
Forest Carbon Storage Calculations where the
mass of 100% post-consumer wood was further
divided into the useable timber ratio based on
(softwood 51.2% and hardwood 46.4%)
averaging out to 49%. In other words, the factor
is to be included in the tree equivalence
calculation as per the equation below: (Note that
the 51% remaining of the tree has biomass energy
and carbon captured that is not used in SDB)
which SWI is manufacturing.

14
Actual Trees Conserved for Production =
[(Mass of Timber per Year in Tons) * 1.97]/0.49
*Note that this factor was accounted in our
negative carbon calculations
3- Energy Factor Function to Location
The calculations done in WARM do not consider the initial water content of the post-consumer material which is directly related to the method of
storage of the post-consumer raw wood. Keep in mind that the current manufacturer being case studied is located in Dubai, where the yearly
precipitation level is low and thus water content of material does not exceed 10% compared to an average of 50% water content in different areas
overseas. The generic manufacturers will have to account for the use of energy to evaporate 40% of the water content (a factor that is levelled in Dubai
due to natural evaporation by ambient heat and direct sunlight). Factors known for evaporation
are further divided into a- Heat Capacity of Water C=4200 J/kgC and b- Latent Heat of Vaporization of Water LV=2256 KJ/kg for a normal mill
harvesting trees.
Taking this a step ahead; and considering the evaporation of 1000 Liters of Water at Dubai
ambient average Temperature of 35 degrees Celsius
a- Energy Required (35°C → 100 °C)
Q1 = m * C * ΔT
Q1 = 1000 * 4200 * (100 – 35)
Q1 = 1000 * 4200 * 65
Q1 = 273,000,000 J = 273,000 KJ
b- Energy Required (100°C → 100°C)
Q2 = m * LV
Q2 = 1000 * 2256
Q2 = 2,256,000 KJ
c- At least the dryer is set at 180°C (outside Dubai Model); Energy Required (180°C →
100°C)
Q3 = m * C * ΔT
Q3 = 1000 * 1996 * (180 – 100)
Q3 = 1000 * 1996 * 80
Q3 = 159,680,000 J = 159,680 KJ
d- Total Energy Required to Evaporate 1000
Liters of Water
QT = Q1 + Q2 + Q3
QT = 273,000 KJ + 2,256,000 KJ + 159,680
KJ
QT = 2,688,680 KJ/Ton = 2,688.68 KJ/Kg not
accounting for heat losses and the energy of the dryer. (0% loss of heat noting that the efficiencies of heat loss increase in hotter
weather than in cooler weather while drying the 10%; dryer efficiency is higher and is estimated to be at 5-7% if not less; equivalent
fossil fuel had to be consumed in conventional “particle board” or composite wood material mills LCA.) This is not accounting for the
head absorbed by the drier, heat losses and the ejects of hot air into the atmosphere.
4- Energy Within Burning Chamber
Noting that energy used in boilers and furnaces is composed of less than 10% water dust by natural
transport (as drying also occurs in blower driven pneumatics while transferring wood-dust-to energy). This factor allows for a more efficient
furnace and boiler as increased water content vs wood within the boiler and furnace cools the
chamber. Dry matter increases the efficiency of boiler chamber when compared to the conventional “particle board” or composite wood material 50-50
water content burning of wood. This is proven by the fact that the original supplier of the furnace estimated a consumption of 40 tons/24hr – at SWI
premises the furnace runs on an average of 3 tons/24hr.
The above factor is neglected in Dubai’s case
knowing that natural circumstances are doing the necessary and wood is received at 10% Water Content. WARM and NEDCCS model should
calculate the factor of energy saved and the same factor should be accounted in the Net Recycling
Emissions during the process. The same factor should consider that the combustion of wood at 10% water content is different than that of wood at
50% water content. Energy saving is also a factor knowing that wood at 10% water content has a lower flashpoint and energy release than that at
50% water content which reversible engages in cooling. (Remark: Factor is to be estimated as per location and precipitation percentage).

15
5- Weight to Weight Ratio Effect on
Landfilling
It is noticeable to note that landfilling in deserts is
different than landfilling in other countries due to
the water content of wood. 1 ton of wood at 50-50%
water content has 50% carbon; whereas 1 ton of
wood at 90-10% water content has 90% carbon –
knowing that carbon is stored in dry matter only.
The recycled ton in SWI premises diverted from the
landfill has 900 kgs of carbon stored which is
captured during manufacturing. This factor is to be
accounted for in the Net Landfilling and Net
Recycling factors modelled previously by WARM.
6- Re-recyclability Factor Modelling
The NEDCCS model dictates that the end-product
should be re-recycled maintaining the same
physical and mechanical properties. The factor of
re-recyclability is further not accounted in the
Forest Carbon Calculations and thus shall be taken
into account; adding to that the reuse factor which
as per WARM is calculated in (N-1) * Source
Reduction Factor with N being the number of times
used and 1 being the initial use of the board. Noting
that not all incoming material to SWI is directly
recycled. During the segregation process, post-
consumer wood which is still in a useable condition
(pallets) are reused before sent for recycling. This
adds to the Source Reduction, Forest Carbon
Storage and Recycling factor extending the Life
Cycle of the post-consumer raw material.
7- Major changes between the conventional manufacturing and SWI premises are noted out in
the table below: Table 27- Comparison of Conventional Manufacturing vs.
NEDCCS
Comparison (Conventional vs. NEDCCS)
Conventional NEDCCS
Raw Material Water
Content
Location Dependent –
Average of 50% Average of 10%
Energy Required to
Evaporate 1000 L of Water
at 100% dryer Efficiency
5688.68 KJ/Kg Natural Evaporation by Sun
to 10% average
Dryer Temperature and
Efficiency and ambient
temperature
Lower Efficiency at 50%
WC (estimated at 40
tons/24hr)
Highly Efficient at 10% WC
(estimated at 3tons/24hr)
Transportation and
Harvesting of Raw Material
By manufacturer – through
cutting controlled trees
Only accepts 100% post-
consumer trees covering
demands and allowing for
natural carbon-capture
Source Reduction Factor Doesn’t engage Engages in the plantation of
virtual trees
Weight to Weight Factor 50% Stored Carbon in Dry
Matter at 50-50 WC
90% Stored Carbon in Dry
Matter at 90-10 WC
Oxygen Factor Doesn’t engage
Engages in the natural
synthesis of oxygen (only
model)
ECONOMICAL IMPACT OF NEDCCS “VIRTUAL TREES”
The NEDCCS: RGW opens doors for nations worldwide to engage in as it has proven to have a
positive economic impact. The return on investments as well as the positive effect on the environment would relieve many governments and
economies worldwide. It provides an economical solution for climate change and commitments to UNFCCC programs by nations that endorsed the
Paris Agreement. In addition, it would play in the favor of governments and would allow less withdrawals from the Convention thus providing a
better future for the coming generations.
Steel Wood Industries operates from the desert
dunes in Dubai. Thousands of Square miles of desert extend in the Middle East from the Arabian Gulf to North Africa. Forestation in this region is
simply impossible and comes with a huge amount of positive GHG. Forestation requires a couple of factors to become feasible; good soil type,
acceptable ambient temperatures and sweet water. Soil in deserts is made of desert sand which is not a good platform for vegetation. The transport of soil
over existing desert sand results in positive carbon emissions. Temperatures reach up to 50 degrees centigrade in June, July and August in some areas
in the UAE thus many plant species dry-out before benefitting from their natural carbon-capture cycle.
Water is scarce and agriculture in desert areas where sweet water is scarce would require desalination plants from sea water for irrigation.
The overall vegetation in desert regions is an expensive and almost impossible solution for climate change.
The NEDCCS: RGW model, however, can be implemented in these regions. We witness a lot of construction in real estate and thus imports of huge
amounts of plywood for molding concrete for towers and buildings. Once these materials are reused and recycled, they enter the NEDCCS:
RGW. The equivalent amount of negative carbon in the NEDCCS: RGW saves hundreds of
thousands of trees annual. In other words, the tree equivalent saved by countries that cannot engage in a feasible vegetation can be considered as “Virtual-
Trees” planted anywhere on the globe to cover the increased demands and lessen the tension from our forests. Noting that GHGs emissions will be
extremely positive as water has the highest heat capacity of 4200 J/kgC compared to other liquids
16
known to humans. The NEDCCS: RGW would invite a multitude of countries in the Middle East,
and dry States in North America, Australia, Africa etc. to make use of the post-consumer wood. Once the model becomes viral, we can be wishful and
witness a decrease in Carbon Dioxide in the atmosphere by natural tree means and thus lower
the concentration of GHG in the atmosphere with time and hopefully reach the reverse global warming before it is too late.
The need for SDB and the NEDCCS: RGW is now a global need. A multitude of restrictions in deforestation is now set by the UN and certain
governments. The re-recyclability and thus the re-use of SDB can always play a role in covering demands. Our local studies for post-consumer
wood which end up in landfills are millions of tons annually locally. This resource is now being buried and is converting valuable land into landfills.
REFERENCES
ANSI (2009) Particleboard. American National Standard. ANSI A208.1-2009. Composite Panel
Association, Gaithersburg, MD. 15 pp.
BSI (2008) PAS 2050: Specification for the assessment of the life cycle green house gas
emissions of goods and services. British Standards Institution, London, UK. 36 pp.
CORRIM (2001) Research guidelines for life cycle
inven- tories. Consortium for Research on Renewable Industrial Materials. CORRIM, Inc. University of Washington, Seattle, WA. 2 Apr. 47
pp.
CPA (2005) 2004 North American shipments report— Particleboard, medium density fiberboard,
and hard- board. Composite Panel Association, 18922 Premiere Court, Gaithersburg, MD. 20879.
Ecoinvent (2004) Ecoinvent database and methodology. Data version 1.1. June. http://www.ecoinvent.org/filead
min/documents/en/01_OverviewAndMethodology.pdf (15 January 2008).
EIA (2007) Net generation by energy source by
type of producer, 1995 through 2006. Energy Information Administration. http://www.eia.doe.gov/cneaf/electricity/
epa/epat1p1.html (27 November 2007).
FAL (2004) The Franklin Associates life cycle inventory database. SimaPro7 Life-Cycle
Assessment Software Package version 7.1 Franklin
Associates Ltd. June. http://www.pre.nl/download/manuals/DatabaseMa
nual FranklinUS98.pdf (15 January 2008).
IPCC (1996) Climate change 1995—Impacts, adaptations and mitigation of climate change:
Scientific–technical anal- yses. Intergovernmental Panel on Climate Change. Panel on Climate.
Cambridge University Press, Cambridge, UK.
IPCC (2001a) Climate change 2001: The scientific basis. Con- tribution of Working Group I to the
Third Assessment Re- port. Panel on Climate. Intergovernmental Panel on Climate Change. Cambridge University Press, Cambridge, UK.
IPCC (2001b) Climate change 2001: The mitigation. Contri- bution of Working Group III to the Third Assessment Re- port. Panel on Climate.
Intergovernmental Panel on Climate Change. Cambridge University Press, Cambridge, UK.
IPCC (2007) Chapter 2 Changes in atmospheric
constitu- ents and radiative forcing. In The physical science basis. Contribution of Working Group I to
the Fourth Assess- ment Report. Intergovernmental Panel on Climate Change. http://www.ipcc.ch/pdf/assessment-report/ar4/
wg1/ar4-wg1-chapter2.pdf (15 December 2008).
ISO (2006a) Environmental management—Life cycle as- sessment—Principles and framework.
ISO 14040. First Editon 2006-06-31. International Organization for Stan- dardization, Geneva, Switzerland. 32 pp.
ISO (2006b) Environmental management—Life cycle as- sessment—Requirements and guidelines.
ISO 14044. First Edition 2006-07-01. International
Organization for Standardization, Geneva, Switzerland. 46 pp.
Johnson LR, Lippke B, Marshall JD, Comnick J (2005) Life-cycle impacts of forest resource activities in the Pacific Northwest and southeast
United States. Wood Fiber Sci 37(CORRIM Special Issue):30 – 46.
Kline ED (2005) Gate-to-gate life inventory of
oriented strand board. Wood Fiber Sci 37(CORRIM Special Is- sue):74 – 84.
Milota MR, West CD, Hartley ID (2005) Gate-to-
gate life inventory of softwood lumber production. Wood Fiber Sci 37(CORRIM Special Issue):47 –
57.
PRe´ Consultants (2007) SimaPro7 Life-cycle assessment

17
software package, Version 7.10. Plotterweg 12, 3821 BB Amersfoort, The Netherlands.
http://www.pre.nl/sima pro/manuals/default.htm (27 February 2007).
Skog KE (2008) Sequestration of carbon in
harvested wood products for the United States. Forest Prod J 58(8):56 – 72. USDOE (2007) Net
generation by energy source by type of producer. US Department of Energy. http://www.eia.doe. gov/cneaf/electricity/epa/generation_state.xls (15
January
2007).
USEPA (2003) Wood waste combustion in boilers.
20 pp. In AP42 Fifth Edition, Volume I, Chapter 1: External combustion sources. US Environmental Protection Agen- cy.
http://www.epa.gov/tnn/chief/ap42/ch01/index.html (18 January 2008).
USEPA (2004) National emission standards for
hazardous air pollutants: Plywood and composite wood products; effluent limitations guidelines and
standards for the tim- ber products point source category; list of hazardous air pollutants, lesser quantity designations, source category list.
http://www.epa.gov/EPA-WATER/2004/July/Day- 30/w6298a.htm (10 December 2007).
Wilson JB (2008) Particleboard: A life-cycle inventory of manufacturing panels from resource through product. Phase II final report. Consortium
for Research on Re- newable Industrial Materials. May CORRIM, Inc. Uni- versity of Washington, Seattle, WA. 58 pp.
Wilson JB (2009) Life-cycle inventory of resins used in wood composites manufacture. Phase II
final report. Consortium for Research on Renewable Industrial Mate- rials. March. CORRIM, Inc. University of Washington, Seattle,
WA. 88 pp.
Wilson JB (2010) Life-cycle inventory of formaldehyde- based resins used in wood
composites in terms of resources, emissions, energy and carbon. Wood Fiber Sci 42(CORRIM Special Issue):125 – 143.
Wilson JB, Sakimoto ET (2005) Gate-to-gate life-cycle inventory of softwood plywood production.
Wood Fiber Sci 37(CORRIM Special Issue):58 – 73.
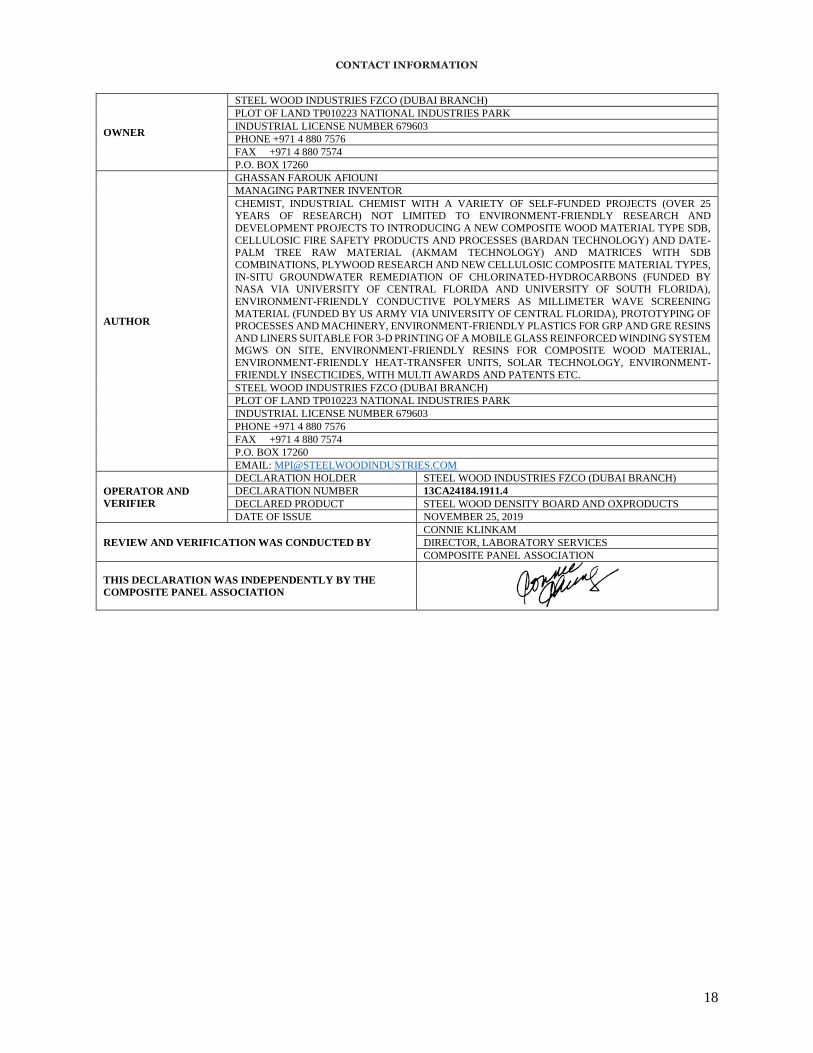
18
CONTACT INFORMATION
OWNER
STEEL WOOD INDUSTRIES FZCO (DUBAI BRANCH)
PLOT OF LAND TP010223 NATIONAL INDUSTRIES PARK
INDUSTRIAL LICENSE NUMBER 679603
PHONE +971 4 880 7576
FAX +971 4 880 7574
P.O. BOX 17260
AUTHOR
GHASSAN FAROUK AFIOUNI
MANAGING PARTNER INVENTOR
CHEMIST, INDUSTRIAL CHEMIST WITH A VARIETY OF SELF-FUNDED PROJECTS (OVER 25 YEARS OF RESEARCH) NOT LIMITED TO ENVIRONMENT-FRIENDLY RESEARCH AND
DEVELOPMENT PROJECTS TO INTRODUCING A NEW COMPOSITE WOOD MATERIAL TYPE SDB,
CELLULOSIC FIRE SAFETY PRODUCTS AND PROCESSES (BARDAN TECHNOLOGY) AND DATE-PALM TREE RAW MATERIAL (AKMAM TECHNOLOGY) AND MATRICES WITH SDB
COMBINATIONS, PLYWOOD RESEARCH AND NEW CELLULOSIC COMPOSITE MATERIAL TYPES,
IN-SITU GROUNDWATER REMEDIATION OF CHLORINATED-HYDROCARBONS (FUNDED BY NASA VIA UNIVERSITY OF CENTRAL FLORIDA AND UNIVERSITY OF SOUTH FLORIDA),
ENVIRONMENT-FRIENDLY CONDUCTIVE POLYMERS AS MILLIMETER WAVE SCREENING
MATERIAL (FUNDED BY US ARMY VIA UNIVERSITY OF CENTRAL FLORIDA), PROTOTYPING OF PROCESSES AND MACHINERY, ENVIRONMENT-FRIENDLY PLASTICS FOR GRP AND GRE RESINS
AND LINERS SUITABLE FOR 3-D PRINTING OF A MOBILE GLASS REINFORCED WINDING SYSTEM MGWS ON SITE, ENVIRONMENT-FRIENDLY RESINS FOR COMPOSITE WOOD MATERIAL,
ENVIRONMENT-FRIENDLY HEAT-TRANSFER UNITS, SOLAR TECHNOLOGY, ENVIRONMENT-
FRIENDLY INSECTICIDES, WITH MULTI AWARDS AND PATENTS ETC.
STEEL WOOD INDUSTRIES FZCO (DUBAI BRANCH)
PLOT OF LAND TP010223 NATIONAL INDUSTRIES PARK
INDUSTRIAL LICENSE NUMBER 679603
PHONE +971 4 880 7576
FAX +971 4 880 7574
P.O. BOX 17260
EMAIL: [email protected]
OPERATOR AND
VERIFIER
DECLARATION HOLDER STEEL WOOD INDUSTRIES FZCO (DUBAI BRANCH)
DECLARATION NUMBER 13CA24184.1911.4
DECLARED PRODUCT STEEL WOOD DENSITY BOARD AND OXPRODUCTS
DATE OF ISSUE NOVEMBER 25, 2019
REVIEW AND VERIFICATION WAS CONDUCTED BY
CONNIE KLINKAM
DIRECTOR, LABORATORY SERVICES
COMPOSITE PANEL ASSOCIATION
THIS DECLARATION WAS INDEPENDENTLY BY THE
COMPOSITE PANEL ASSOCIATION