
Environmental Pollution & It's Control
8
Environmental Pollution & it’s Control 1 ACKNOWLEDGEMENT: At first we thank to our honorable course teacher Dr. Arun Kanti Guha to give us such kind of assignment that help us to gather huge knowledge about characterization of dy eing house waste water of different industrial zones of BANGLADESH. To complete this assignment we are really great full to him for his proper guide line. We also collected many information from the article published in BANGLADESH TEXTILE TODAY which was also done by Dr. Arun Kanti Guha & Md. Shariful Islam. At last it is important to that all of our group members habe done a tremendous job to complete this assignment.
-
Upload
fakrul-hasan-khan -
Category
Documents
-
view
221 -
download
0
Transcript of Environmental Pollution & It's Control
8/8/2019 Environmental Pollution & It's Control
http://slidepdf.com/reader/full/environmental-pollution-its-control 1/8
Environmental Pollution & it’s Control
1
ACKNOWLEDGEMENT:
At first we thank to our honorable course teacher Dr. Arun Kanti Guha to give us such kind of
assignment that help us to gather huge knowledge about characterization of dyeing house waste
water of different industrial zones of BANGLADESH. To complete this assignment we are
really great full to him for his proper guide line. We also collected many information from the
article published in BANGLADESH TEXTILE TODAY which was also done by Dr. Arun Kanti
Guha & Md. Shariful Islam. At last it is important to that all of our group members habe done a
tremendous job to complete this assignment.
8/8/2019 Environmental Pollution & It's Control
http://slidepdf.com/reader/full/environmental-pollution-its-control 2/8
Environmental Pollution & it’s Control
2
INTRODUCTION:
The quality of water is at vital concern for mankind since it is directly linked with human
welfare.But this water is polluted day by day.Among so many reasons the most important reason
or the main culprit is the garment factoriesas well as dyeing houses.But at presnt this sector is
playing a vital role in our economy.In wet processing technology of textiles it includes somesteps such as sizing,desizing,scouring etc.Here large volume of water is used which is about(12-
65)L of water for one metre of cloth.Due to these steps many toxic materials are used.For these
reason water is highly polluted.This waste water is dumped into different areas.To get rid of
these problems area based waste water characterization is essential.We have to know pollution
levels of different textile industrial zones because different areas characterisation is different.
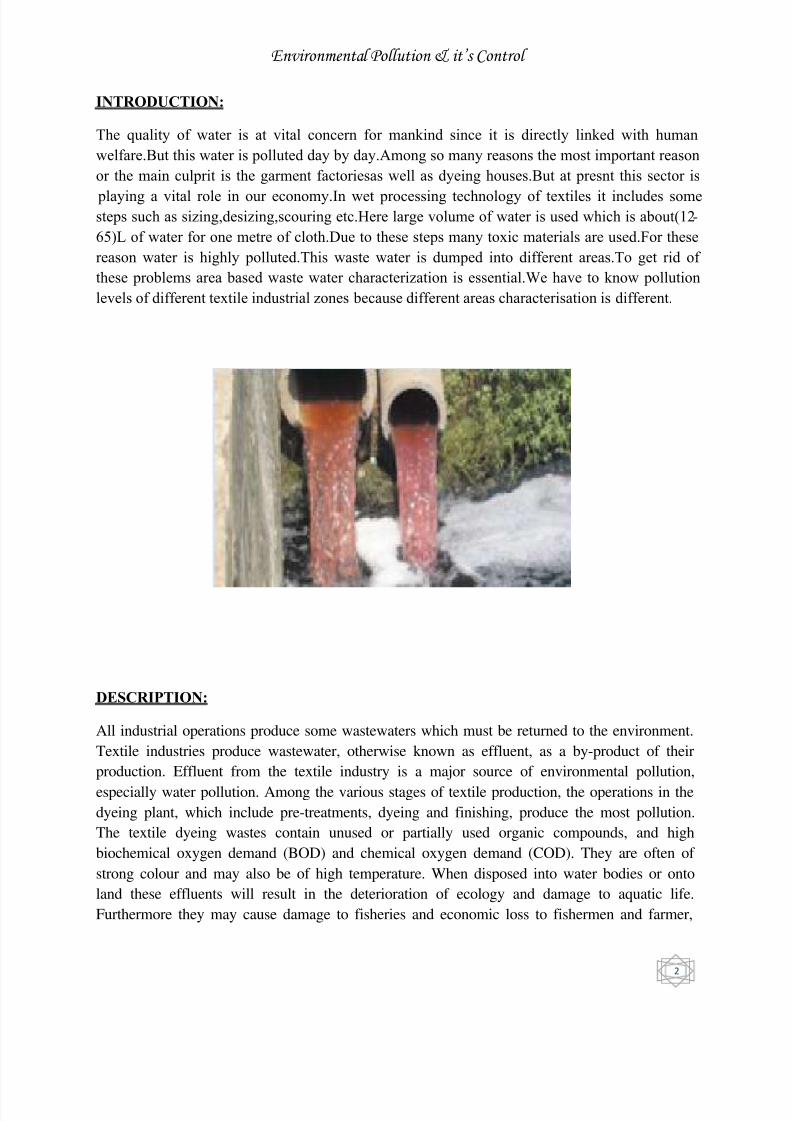
DESCRIPTION:
All industrial operations produce some wastewaters which must be returned to the environment.
Textile industries produce wastewater, otherwise known as effluent, as a by-product of their
production. Effluent from the textile industry is a major source of environmental pollution,
especially water pollution. Among the various stages of textile production, the operations in the
dyeing plant, which include pre-treatments, dyeing and finishing, produce the most pollution.
The textile dyeing wastes contain unused or partially used organic compounds, and high
biochemical oxygen demand (BOD) and chemical oxygen demand (COD). They are often of
strong colour and may also be of high temperature. When disposed into water bodies or onto
land these effluents will result in the deterioration of ecology and damage to aquatic life.
Furthermore they may cause damage to fisheries and economic loss to fishermen and farmer,

8/8/2019 Environmental Pollution & It's Control
http://slidepdf.com/reader/full/environmental-pollution-its-control 3/8
Environmental Pollution & it’s Control
3
there may be impacts on human
health. The rise in the number of
industries in Bangladesh, including
textile dyeing operations, has
seriously increased the pollution that
the country is experiencing.
Consequently national laws have
been enacted to protect the
environment from this pollution. In
Bangladesh textile dyeing is
categorized as a Red Category
Industry under the Environmental
Conservation Act (1995). In
accordance with the Act and
Environmental Rules (1997) it is mandatory for textile dyeing factories to install effluenttreatment plants (ETPs) to treat wastewater before it leaves the factory premises.(1)
ENVIRONMENTAL PARAMETERS OF TEXTILE EFFLUENT:
pH:It is the negative logarithm of the concentration of the hydrogen ion.It is expressed as:
pH= -log()
BOD: It means bio-chemical oxygen demand.It means the required oxygen to decompose
organic matters present in waste water by bacteria through oxidation process.
COD: It means chemical oxygen demand. It means the required oxygen to decompose
chemicals present in waste water through oxidation process.
TDS: It means total dissolved solid.It is the amount of total dissolved solid in waste
water.
TSS: It means total suspended solid.
MLSS: It means mixed liquor suspended solids.
8/8/2019 Environmental Pollution & It's Control
http://slidepdf.com/reader/full/environmental-pollution-its-control 4/8
Environmental Pollution & it’s Control
4
Phenol
Alkalinity
Color
Metals
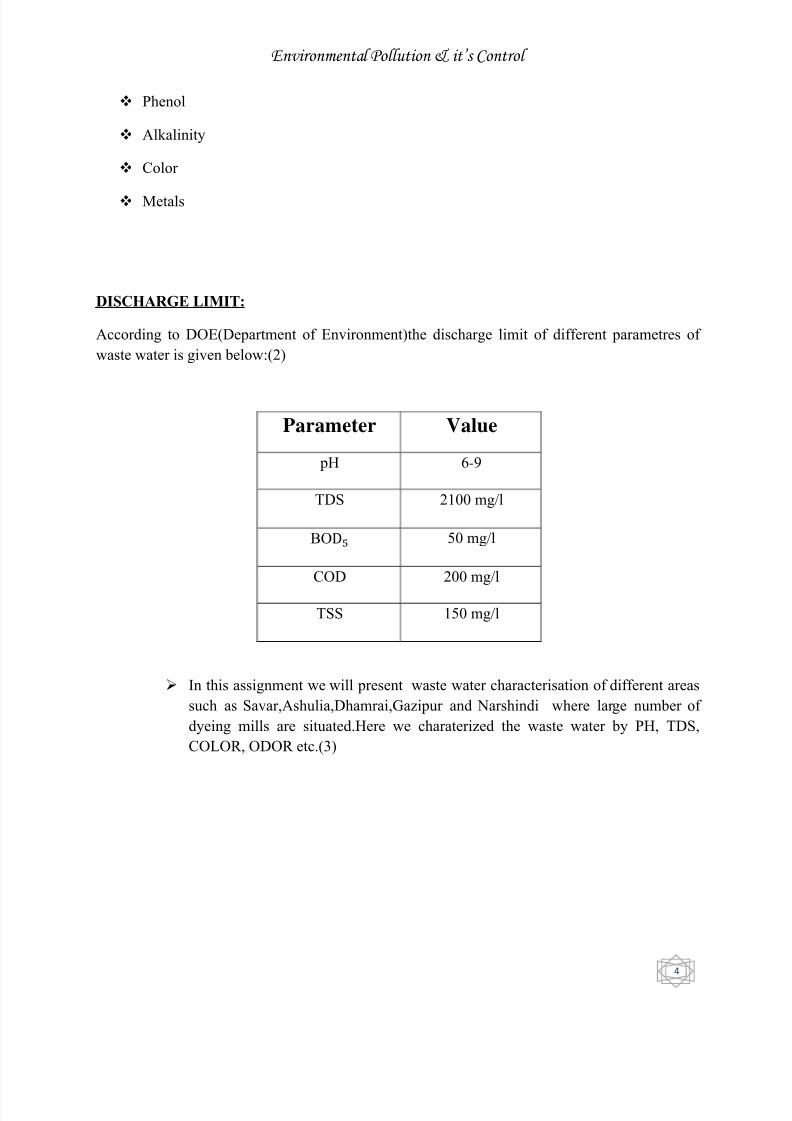
DISCHARGE LIMIT:
According to DOE(Department of Environment)the discharge limit of different parametres of
waste water is given below:(2)
Parameter Value
pH 6-9
TDS 2100 mg/l
BO 50 mg/l
COD 200 mg/l
TSS 150 mg/l
In this assignment we will present waste water characterisation of different areas
such as Savar,Ashulia,Dhamrai,Gazipur and Narshindi where large number of
dyeing mills are situated.Here we charaterized the waste water by PH, TDS,
COLOR, ODOR etc.(3)

8/8/2019 Environmental Pollution & It's Control
http://slidepdf.com/reader/full/environmental-pollution-its-control 5/8
Environmental Pollution & it’s Control
5
Here the analytical results of some areas are given below;
Table-1: Textile waste water analytical results of SAVAR area
Table-2: Textile waste water analytical results of NARSHINDI area
Sample no. Color ODOR pH TDS (mg/l)
1 Blue Pungent 10.5 2386
2 Blue Odorless 10.4 2136
3 Blue Odorless 10.7 3226
4 Blue Odorless 10.4 2560
5 Blue Odorless 10.4 2810
Sample no. Color ODOR pH TDS (mg/l)
1 Grey Foul odor 5.9 261
2 Grey Foul odor 5.5 260
3 Grey Foul odor 5.0 262
4 Black Foul odor 14 2676
5 Pale pink Pungent 6.1 288
6 Pale pink Pungent 9.8 127
7 Pale green Pungent 10.7 456
8 Yellowish Pungent 14 1638
9 Pale green Pungent 9 593
10 Pale green Pungent 10.0 390

8/8/2019 Environmental Pollution & It's Control
http://slidepdf.com/reader/full/environmental-pollution-its-control 6/8
Environmental Pollution & it’s Control
6
Table-3: Textile waste water analytical results of ASHULIA area
Sample no. Color ODOR pH TDS (mg/l)
1 Pale blue Pungent 6.9 490
2 Pale blue Pungent 7.2 498
Table-4: Textile waste water analytical results of DHAMRAI area
Sample no. Color ODOR pH TDS (mg/l)
1 Pale blue Pungent 6.7 524
2 Pale blue Pungent 6.9 518
3 Pale blue Pungent 6.9 518
Table-5: Textile waste water analytical results of GAZIPUR area
Sample no. Color ODOR pH TDS (mg/l)
1 Grey Odorless 7.1 1010
2 Grey Odorless 7.3 1177
3 Grey Foul odor 9.1 892
4 Pale blue Foul odor 7.5 665
5 Yellowish Odorless 7.8 501
6 Yellowish Odorless 8.8 830
7 Pale blue Foul odor 9.6 3304
8 Pale blue Foul odor 9.8 2808
9 Pale blue Foul odor 8.7 798
10 Pale blue Foul odor 9.2 1107

8/8/2019 Environmental Pollution & It's Control
http://slidepdf.com/reader/full/environmental-pollution-its-control 7/8
Environmental Pollution & it’s Control
7
Now here, the maximum pH values of different areas of Bangladesh are given
below;
And then the maximum values of TDS of waste water of different areas are given
below;
0
5
10
15
ASHULIA DHAMRAI GAZIPUR NARSHINDI SAVAR
7.2 6.9
9.8
14
10.7
AREAS
p H v a l u e
Fig: A column diagram of maximum values of pH of different Areas of Bangladesh
0
500
1000
1500
2000
2500
3000
3500
Ashulia Dhamrai Gazipur Narshindi Savar
498 538
3304
31093226
Areas
T D S v a l u e ( m g / l )
Fig: A column diagram of maxium values of TDS of waste water of different areas

8/8/2019 Environmental Pollution & It's Control
http://slidepdf.com/reader/full/environmental-pollution-its-control 8/8
Environmental Pollution & it’s Control
8
CONCLUSION:
As we know about the importance of water and also know the importance of prevention of the
pollution of water caused by dyeing houses. But it is a positive sign that many industries are alsomaking progress in establishing and operating their own ETPs to comply with national and
international requirements, and also because of increased personal awareness of the negative
impacts of industrial effluent.(4).
REFERENCE:
1. Government of People’s Republic of Bangladesh, Ministry of Environment andForests, The Environment Conversation Rules 1997, Schedule 10, Rule 13 (Un-
official English Version)
2. www.doe- bd.org
3. Dr. Arun Kanti Guha and Md. Shariful Islam, Bangladesh Textile Today,2009,2,4,(issue1)
4. M.S.Ali, S. Ahmed and M.M.S. Khan, Characteristics and Treatment Process of Wastewater in Dyeing Plant , Paper No. 4, Journal of Chemical Engineering, The
Institute of Engineers, Bangladesh, Vol. ChE23, No.1, 2005.


