
Environmental Policy, River Pollution, and Infant Health...
21
Environmental Policy, River Pollution, and Infant Health: Evidence from Kanpur, India Feb 1, 2016 Quy-Toan Do (The World Bank) Shareen Joshi (Georgetown University) Samuel Stolper (Harvard University)
Transcript of Environmental Policy, River Pollution, and Infant Health...

Environmental Policy, River Pollution, and Infant Health: Evidence from Kanpur, India
Feb 1, 2016
Quy-Toan Do (The World Bank)
Shareen Joshi (Georgetown University)
Samuel Stolper (Harvard University)

The Basic Question
• How does environmental policy impact health in the developing world?
• Why does this matter?
• Good policy is hard to come by
• E.g., Greenstone and Hanna (2014)
• Policy frequently faces opposition on economic grounds (jobs, wages)
• Avoidance is an alternative strategy
• E.g., Kremer, Leino, Miguel, and Zwane (2012)
>> The mechanism matters

History has many examples of the penalties associated with high pollution
• Alsan and Goldin (2015): the establishment of water and sewage systems in Massachussets can explain about 37 percent of the decline in mortality between 1880—1915
• Hanlon (2015): in 19th century England, industrial pollution explains about 33 percent of the mortality penalty of living close to factories

Overview of this paper
• We evaluate the impact of a policy that targets industrial water pollution in Kanpur, India• Policy: Unprecedented judicial verdict that mandates new
treatment plants, plans for pollution control and major information campaigns
• Estimate impacts on pollution and infant mortality
• We test whether the pollution channel explains the full impact of the policy on infant mortality• Pollution is not the only mechanism
• Income, education and behavior modification are also plausible

Location of our study

The tannery industry
• Most tanneries do the following:• Washing -> Liming -> Fleshing -> Tanning ->
Splitting -> Finishing
• Highly polluting:• More than 175 polluting • Many chemicals highly toxic, carcinogenic and
known to cause birth defects• Large disease burden
• In India, highly concentrated around three cities: Kolkata, Chennai and Kanpur• Kanpur is on the banks of the Ganges in the
plains of India• For more than 100 years, Kanpur has been
the “leather capital” of India

We study the first ever public interest litigation
• M.C. Mehta v. Union of India, Writ Petition No. 3727, filed in 1985 against tannery owners and the Kanpur municipalities for failing to keep the river clean:
– Supreme Court of India ruled in his favor in October 1987o Tanneries ordered to either set up “primary treatment plants as approved by
the State Board with effect from Oct 1, 1987” or “stop business entirely”
o Municipality required to clean sewers, expand the sewage system and treat waste
o Ban on placing dead bodies into the river
• The policy is quasi-random wrt both pollution and mortality– Mr. Mehta had no connections with Kanpur– Selection was random

Skipping the theoretical model for now...We estimate three equations
1. Mortality on Kanpur Regulation (“Mortality DD”)
𝑀𝑜𝑟𝑡𝑎𝑙𝑖𝑡𝑦𝑖𝑡 = 𝛼0 + 𝛼1𝑃𝑜𝑙𝑖𝑐𝑦𝑖𝑡 + 𝛼𝟐 𝑃𝑜𝑙𝑙𝑖𝑡𝑈𝑆+ 𝛼3𝑋𝑖𝑡 + 𝜂𝑖𝑡
1. Pollution on Kanpur Regulation (“Pollution DD”)
𝑃𝑜𝑙𝑙𝑖𝑡 = 𝛽0 + 𝛽1𝑃𝑜𝑙𝑖𝑐𝑦𝑖𝑡 + 𝛽𝟐 𝑃𝑜𝑙𝑙𝑖𝑡𝑈𝑆+ 𝛽3𝑋𝑖𝑡 + 𝜀𝑖𝑡
2. Mortality on Pollution (“River IV”)
𝑀𝑜𝑟𝑡𝑎𝑙𝑖𝑡𝑦𝑖𝑡 = 𝜃0 + 𝜃𝟏 𝑃𝑜𝑙𝑙𝑖𝑡 + 𝜃2𝑃𝑜𝑙𝑖𝑐𝑦𝑖𝑡 + 𝜃3𝑋𝑖𝑡 + 𝜇𝑖𝑡
We use two instruments: Upstream Pollution and Policy

We use over-identification tests as mechanisms tests
• If the impact is only through pollution: Policy Pollution Mortality
• Then
reduced-form impact (Policy Mortality)
= reduced-form impact (Policy Pollution)
* reduced-form impact (Pollution Mortality)
• This is equivalent to testing that 𝑃𝑜𝑙𝑖𝑐𝑦𝑖𝑡 is a valid instrument for Pollution.
• We thus estimate 2SLS regression models using (a) upstream pollution alone as an instrument; and (b) upstream pollution and the policy, BOTH as instruments
• A Hansen (or Sargan) J-statistic assesses overidentifcation

Data
• Water pollution: Monitor-months from 1986-2004 (CPCB)
• 470 monitors along 162 rivers 38,789 observations
• Latitude and longitude of monitors
• We focus mainly on BOD
• Infant mortality: Two different samples of child-months
• DLHS-II, RCH: 264,375 births 2.6 million observations
• Children only identified by district, NOT town/village
• Policy:• Kanpur verdict (Oct 1987)

We construct a measure of upstream pollution using the geography of river flow
• Assign to every monitor an upstream counterpart• Identify the river on which the
monitor resides• Follow that river upstream until it
enters a new district• Find the next monitor upstream:
• If its distance from the original monitor falls within [X,Y], assign it as the upstream monitor
• If not, continue upstream until a monitor is found within [X,Y]
• If no monitor is found within [X,Y], drop that monitor from the sample
• If a river splits (due to the joining of a tributary), take the average of upstream monitors
• X in {0, 20, 50, 75, 100}• Y in {200, 300}

Econometric details
• Controls: air temperature, rainfall, distance upstream, incidence of the National River Conservation Plan, Common Effluent treatment plant capacity
• Policy impacts:𝑌𝑖𝑡 = 𝑎 + 𝒃𝑃𝑜𝑙𝑖𝑐𝑦𝑖𝑡 + 𝑑𝑋𝑖𝑡 + 𝜑𝑖𝑡 + 𝜆𝑡 + 𝑒𝑖𝑡
𝑌𝑖𝑡 is either infant mortality or pollution
• Mechanisms: instrumental variables
• Pollution is the endogenous variable
• Upstream pollution and policy are instruments
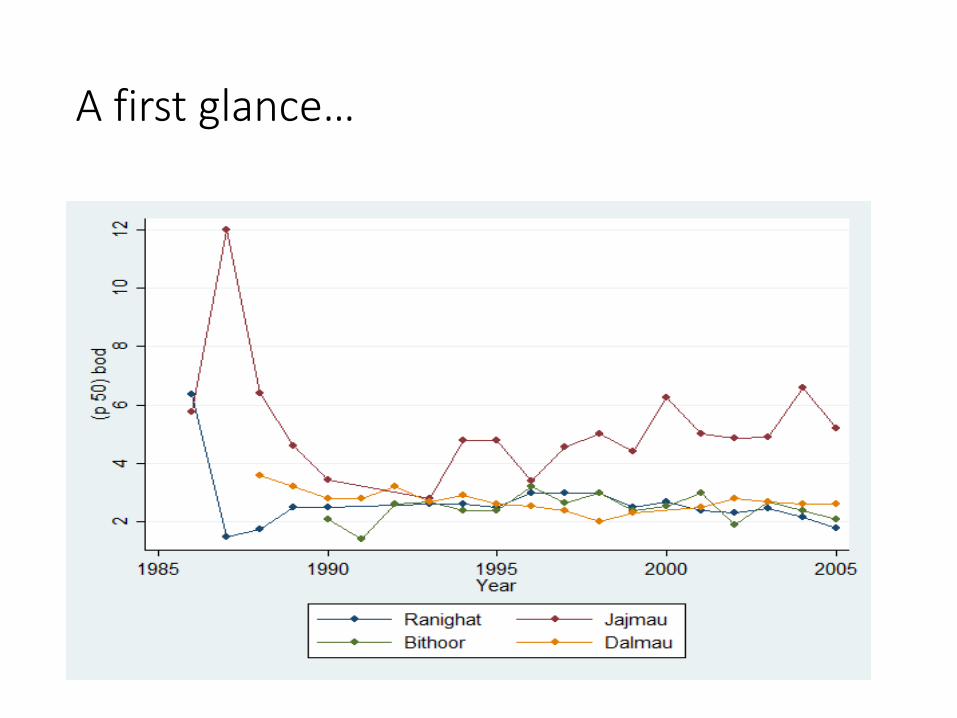
A first glance…

Another simple look…
Before the Verdict After the Verdict Difference
Kanpur Rest of the Ganga Basin
Difference Kanpur Rest of the Ganga Basin
Child died within the first month of birth 136 0.110 1836 0.0719 0.0384 1478 0.0568 487064 0.0554 0.00138 -0.037*
(0.100) (0.819) (0.019)
Child died within the first year of birth 1302 0.154 19337 0.103 0.0502 17222 0.0662 487064 0.0723 -0.00610 -0.006*
(0.0879) (0.353) (0.003)
Female 1302 0.471 19337 0.474 -0.00273 17222 0.484 487064 0.480 0.00393 0.007
(0.848) (0.310) (0.015)

Reduced form regressions show policy reduces mortality

Policy also lowers industrial pollution

In the IV regressions, we find a positive relationship between pollution and mortality

Mechanisms
• Hypothesis testing gives us a “failure to reject”, which suggests that the policy has likely affected mortality only through pollution
• Other factors have had a small effect (upper bound TBA)

Conclusions
• Identified impact of environmental policy regulation
• Assessed quantitative importance of one mechanism: lower reduction as opposed to avoidance

Extra Slides

Summary stats of key variables
All districts Kanpur District
Variable Obs Mean Std. Dev. Min Max Obs Mean Std. Dev. Min Max
(A) RCH Data – averaged at the district level
Died within 1 month 142248 0.053 0.107 0 1 498 0.085 0.121 0 1
Died within 1 year 141336 0.080 0.138 0 1 496 0.127 0.158 0 1
Female literacy 142247 0.431 0.285 0 1 498 0.388 0.241 0 1
Hindu 142248 0.757 0.299 0 1 498 0.824 0.191 0 1
SC 142183 0.183 0.195 0 1 498 0.272 0.193 0 1
ST 142183 0.162 0.281 0 1 498 0.006 0.029 0 0
Piped water 142248 0.418 0.332 0 1 498 0.163 0.174 0 1
Wealth Index 142248 -0.065 0.593 -1.080 2.978 498 -0.088 0.575 -1 3
Rural 142248 0.688 0.251 0 1 498 0.470 0.322 0 1
After verdict 142248 0.683 0.465 0 1 498 0.683 0.466 0 1
(B) Pollution data – averaged at the district level
bod 22792 3.858 7.716 0.1 105 155 3.887 2.256 1 14
cod 22792 24.723 27.461 0.2 346 155 15.993 5.801 4 42
calc 23597 74.077 71.558 1 940 176 78.625 40.263 22 216
fcoli 17065 17449.220 96847.580 1 2100000 109 196020.300 325526.100 3 2100000
totcoli 17065 46410.510 241296.500 1 6300000 109 510203.700 855120.100 230 4600000