Environmental policy and invention crowding out. · PDF fileThe SEEDS Working Paper Series are...
27
by Nicolò Barbieri Environmental policy and invention crowding out. Unlocking the automotive industry from fossil fuel path dependence
Transcript of Environmental policy and invention crowding out. · PDF fileThe SEEDS Working Paper Series are...
by
Nicolò Barbieri
Environmental policy and invention crowding out. Unlocking theautomotive industry from fossil fuel path dependence

SEEDS is an interuniversity research centre. It develops research and higher education projects inthe fields of ecological and environmental economics, with a special focus on the role of policy andinnovation. Main fields of action are environmental policy, economics of innovation, energyeconomics and policy, economic evaluation by stated preference techniques, waste managementand policy, climate change and development.
The SEEDS Working Paper Series are indexed in RePEc and Google Scholar.Papers can be downloaded free of charge from the following websites:http://www.sustainability-seeds.org/.
Enquiries:[email protected]
SEEDS Working Paper 6/2015March 2015by Nicolò Barbieri
The opinions expressed in this working paper do not necessarily reflect the position of SEEDS as a whole.
1
Environmental policy and invention crowding out.
Unlocking the automotive industry from fossil fuel
path dependence
Nicolò Barbieri*
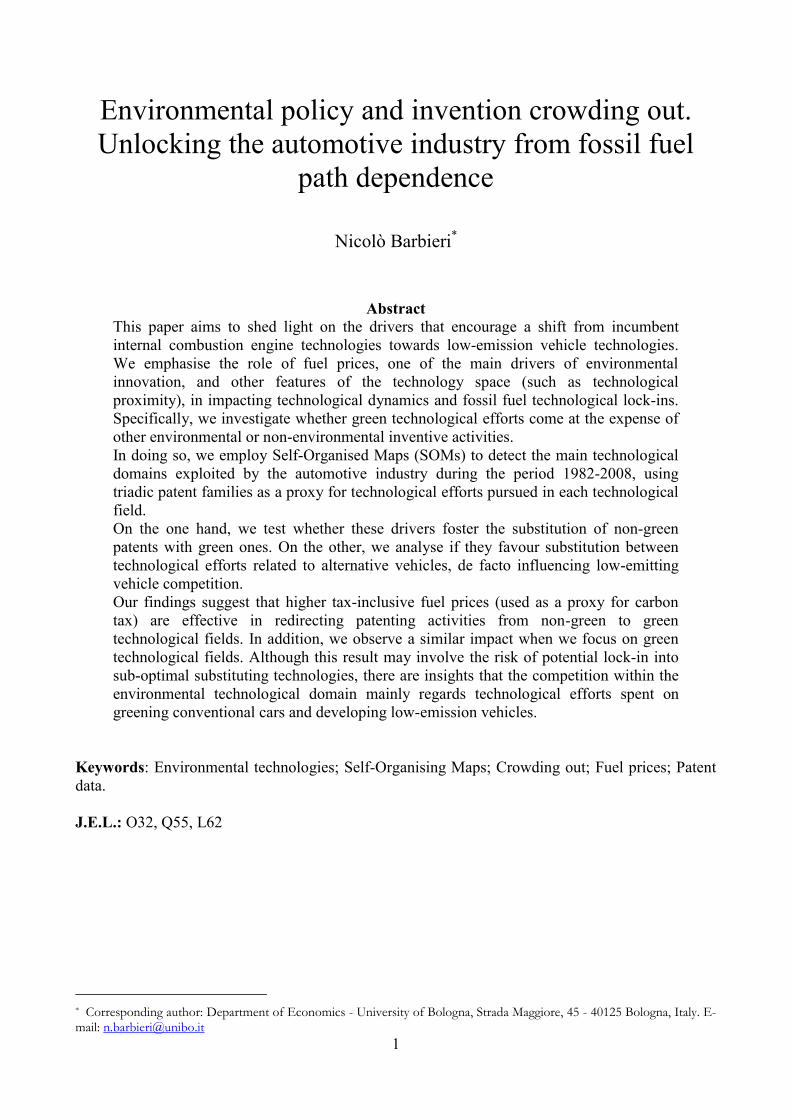
Abstract
This paper aims to shed light on the drivers that encourage a shift from incumbent
internal combustion engine technologies towards low-emission vehicle technologies.
We emphasise the role of fuel prices, one of the main drivers of environmental
innovation, and other features of the technology space (such as technological
proximity), in impacting technological dynamics and fossil fuel technological lock-ins.
Specifically, we investigate whether green technological efforts come at the expense of
other environmental or non-environmental inventive activities.
In doing so, we employ Self-Organised Maps (SOMs) to detect the main technological
domains exploited by the automotive industry during the period 1982-2008, using
triadic patent families as a proxy for technological efforts pursued in each technological
field.
On the one hand, we test whether these drivers foster the substitution of non-green
patents with green ones. On the other, we analyse if they favour substitution between
technological efforts related to alternative vehicles, de facto influencing low-emitting
vehicle competition.
Our findings suggest that higher tax-inclusive fuel prices (used as a proxy for carbon
tax) are effective in redirecting patenting activities from non-green to green
technological fields. In addition, we observe a similar impact when we focus on green
technological fields. Although this result may involve the risk of potential lock-in into
sub-optimal substituting technologies, there are insights that the competition within the
environmental technological domain mainly regards technological efforts spent on
greening conventional cars and developing low-emission vehicles.
Keywords: Environmental technologies; Self-Organising Maps; Crowding out; Fuel prices; Patent
data.
J.E.L.: O32, Q55, L62
*Corresponding author: Department of Economics - University of Bologna, Strada Maggiore, 45 - 40125 Bologna, Italy. E-mail: [email protected]

2
1 Introduction
„La Jamais Contente‟, invented by Camille Jenatzy in 1899, was the first electric vehicle that went
over 100 km/h (Armand and Tarascon, 2008). It provides an insight into how the car market was
structured at the end of the 19th century when different technologies (i.e. steam, electric and
gasoline cars) competed for a market in which no technology dominated (Basalla, 1988). However,
at the turn of the century, gasoline cars reached an advantage mainly driven by economic and
technical factors such as mass production and rapid solution to technical problems (i.e. engine start,
water consumption, low maximum speed, etc.), consolidating the dominant position of internal
combustion engine vehicles (ICEVs) within the automotive industry (Cowan and Hultén, 1996).
Although in the 1970s, fundamental changes affected the car market; growing concern over traffic
congestion and air pollution, as well as oil crises, contributed to modifying the economic and social
factors that governed technological developments in that industry. Since then, different
technological trajectories have taken place, increasing the variety of low-emission vehicles (LEVs)
that compete with ICEVs, i.e. electric (EV), hybrid (HV) and fuel cell (FCV) vehicles.
The economic metaphor that can be drawn from this story is that, even if these alternative
technological trajectories provide improved environmental performance that is able to meet current
needs, evolutionary economists emphasise that the process of technology selection is path
dependent, not predictable ex ante and irreversible, and thus, the market may select sub-optimal
technologies due to increasing returns to adoption (Arthur, 1989; Bruckner et al., 1996; Frenken et
al., 2004). This conservatism in market selection, on the one hand, negatively affects the probability
that alternative technologies will be adopted („self-reinforcement‟) and, on the other, allows
producers to take advantage of economies of scale and R&D investments (David, 1985)1. In
addition to path dependence in technology adoption, Acemoglu et al. (2012) states that a path-
dependent process characterises the type of innovation that is produced, providing incentives for
firms that spent innovative efforts in dirty technology in the past to innovate in dirty technologies in
the future.
Moreover, it should be noted that the evolutionary process at the basis of technological change
emphasises that the success of technological advances cannot be determined ex ante (Nelson and
Winter, 1982). This is mainly due to the uncertainty that surrounds design and planning processes.
Indeed, successful technological advances are the result of a process in which, at any time, a range
of technological opportunities is undertaken and proposed to the selection environment (Gelijns et
al., 2001). Therefore, there is competition between innovations and what determines a prevailing
technology is the result of ex post selection (Gelijns et al., 2001).
In this regard, it is pointed out that technological uncertainty also affects the development of low-
emission vehicles. Indeed, a first source of uncertainty is linked to the capability of alternative cars
to substitute conventional vehicle designs, whereas the second is mainly related to competition
between alternative vehicles due to the fact that, in the current state, it is unclear which alternative
option should be preferred from both an economic and environmental perspective (Frenken et al.,
2004).
In this complex framework where uncertainty, path-dependence and competition (ICEVs vs. LEVs
and between LEVs) stand out, several authors highlight that policy intervention may represent one
of the main factors that will allow socio-technical lock-ins to be overcome (Faber and Frenken,
2009; Rennings et al., 2013), and specifically, ICEV lock-in to be avoided (Cowan and Hultén,
1996)2. During recent decades, many authors have highlighted the role of environmental policies in
1In David (1985), the author ascribed QWERTY lock-in to technical interrelatedness, economies of scale and quasi-
irreversibility of investment. 2The authors identified, in addition to regulations, other factors such as crisis in the existing technology, technological
breakthrough, changes in taste, niche markets and scientific results (Cowan and Hultén, 1996).

3
inducing the development of environmentally-sound technologies (Popp et al. 2010; Bergek et al.,
2014). However, when technologies compete, even if it has been emphasised that environmental
policies lead to increasing innovative performances and market competitiveness (Porter and van der
Linde, 1995), the production of eco-innovation sometimes causes secondary effects; these include
environmental rebound, green paradox and crowding-out (van den Bergh, 2013).
In this regard, environmental policies lead to higher opportunity costs that derive from real resource
requirements (financial and human resources) to develop and adopt alternative technologies needed
to comply with policy requirements (Jaffe et al., 2002). Therefore, they may trigger innovation in
green technological domains that drive away inventive activities from non-environmental and/or
environmental ones, thus becoming a potential source of innovation crowding out.
This paper delves into the broad range of factors that influence innovation dynamics in a sample of
automotive firms, focusing on the effectiveness of environmental policy in unlocking innovation
from ICEV technologies. In this regard, the presence of a crowding out effect may favour achieving
this objective because, even if crowding out of every type of innovation reduces social benefits3 and
eventually decreases competitiveness, it may contribute to unlocking the automotive industry from
fossil fuel path dependence, i.e. decreasing ICEV innovation efforts in favour of those related to
LEVs.
Apart from a few exceptions which are discussed in the next section, this topic remains almost
unchartered and only a very small portion of the debate is focused on the policy-driven crowding
out effect. In addition, the main lack in this literature is the study of “what” is being crowded out.
Therefore, if improvements in technologies with negative environmental effects are crowded out to
favour green technological advances, the costs of crowding out for the society will be hampered
(Popp, 2005), or otherwise increased if crowding out affects other environmental technological
efforts. Thus, we test whether innovative efforts on environmental technologies come at the expense
of other eco-innovations.
The paper is structured as follows: Section 2 introduces the related literature and Section 3 explores
the main features that characterise the automotive technological system presenting the data and
identifying the main technological trajectories through Self-Organising Maps (SOMs). Section 4
describes how we build our main variables and the empirical model whereas Section 5 discusses the
results. Finally, Section 6 concludes.
2 Literature review
In a recent overview of the studies that investigate eco-innovation from an evolutionary perspective,
Cecere et al. (2014) emphasises that technological, social, organisational and institutional lock-ins
affect environmental innovation development and adoption.
In this framework, firm-level strategies, technological niches and regulations are keys to
overcoming path dependence on dominant technological designs. In particular, an outstanding
branch of literature provides evidence of the effectiveness of environmental policy in boosting eco-
innovation (surveyed in Popp et al., 2010), shedding light on its potential to unlock the
technological system. Indeed, studies on environmental regulations have been finalised to assess
whether environmental policy fosters technological change towards a more sustainable path.
However, the literature does not provide insights into the potential shift from non-green inventions
to green ones.
In order to understand the overall effect of green regulation on the economic system, we study its
potential, secondary consequences, i.e., the potential crowding out effect, that eco-innovation may
3The social returns to research are greater than private returns for firms (Mansfield et al., 1977; Pakes, 1985; Jaffe,
1986)
4
have on other innovation, should be investigated to appreciate the overall impact beyond the
development of new green technological efforts.
Environmental innovation may come at the expense of non-green ones or be complementary to
them in firms‟ innovation portfolios. In both cases, it is important to investigate the role of
environmental policies to assess how technological systems can escape fossil fuel lock-in. However,
the literature on the crowding out effect has been limited by the difficulty in addressing the issue
empirically. In addition, it is arduous to distinguish, even ex post, whether a change in innovation
activities has been caused by policy intervention or by research opportunities and firm strategies.
Whereas conventional wisdom predicts that environmental policy interventions decrease the
productivity of optimising firms, evolutionary economists maintain that regulated firms improve
their innovative efforts which, in turn, cause an upsurge in their economic performance (Porter and
van der Linde, 1995).
In this regard, when addressing the issue of the effects that the development of innovation may
cause, a new stream of literature has analysed the opportunity cost of environmental innovation.
This opportunity cost, caused by a “crowding out effect” and indirectly connected to the policy
framework (i.e. technical and economic resources that compliance behaviours may require), impacts
on the effectiveness and efficiency of environmental policies in unlocking the industry. If
improvements in technologies with negative environmental effects are crowded out to favour green
technological advances, the costs of crowding out for the society will be lower (Popp, 2005) than if
it impacted other environmental technological efforts.
One of the seminal works that discuss the presence of a crowding out effect is Gray and Shadbegian
(1998). The authors examine the impact of environmental regulation stringency in the pulp and
paper industry. In their study, crowding out affects investment decisions on pollution abatement and
productive (non-environmental) capital investments. The results seem to provide evidence that
pollution abatement investments crowd out other productive investments in high polluting plants.
Marin (2014), using a dataset of Italian manufacturing firms, provides insights (at least in the short
run) that environmental innovation comes at the expense of non-environmental innovation. This
possible evidence of crowding out is mainly driven by the lower return that distinguishes eco-
innovation from other investments coupled with the constrained financial resources devoted to
R&D activities.
When firms are not financially constrained, a decrease in non-environmental innovations, caused by
an increase in eco-innovation, does not always imply that the crowding out effect reduces social and
private benefits. Popp and Newell (2012) investigates whether the increase in climate R&D
spending induces a lower level of R&D investments in other fields. First, the authors find no
evidence of crowding out across sectors „mitigating the concern that new energy R&D programs
will draw resources away from other innovative sectors of the economy‟ (Popp and Newell, 2012;
pp. 990). Second, using patent data as a proxy for R&D expenditure, they examine whether this
hypothesis holds within sectors, finding that an increase in alternative energy patents leads to a
decrease in other patents. However, the absence of financial constraints for those firms may prove
that the crowding out effect has been driven by changes in market opportunities. This result
underlines the positive environmental effect of crowding out that seems to induce the development
of greener technologies at the expense of dirty ones, facilitating the achievement of environmental
policy objectives.
More evidence of an R&D offset comes from Kneller and Manderson (2012). Their results
highlight that an increase in environmental compliance costs boosts environmental innovation.
Although, the effect of environmental expenditures does not positively impact the total amount of
R&D investments, suggesting that environmental R&D crowds out non-environmental R&D4.
Mainly due to the research questions they answer, these studies focus on the environmental
innovation effect without directly examining the role of environmental policies. An exception is
4 The authors highlighted that there is no evidence that environmental capital crowds out non-environmental capital.

5
Hottenrott and Rexhäuser (2013) that employs survey-based data in order to detect which firms
introduce environmental technologies as a consequence of policy compliance behaviour. The study
suggests that while there is evidence that environmental innovation crowds out firms‟ in-house
R&D expenditure, this does not seem to influence the number of existing R&D projects, their
outcome or the amount of investments in fixed assets (both innovation-related and others). In
addition, the authors advocate that firms prefer scaling down long-term oriented R&D activities that
are not directly connected to production and that provide relatively uncertain returns.
Our paper takes advantage of the findings of these studies to analyse whether environmental policy
stringency encourages a shift from non-environmental inventions to environmental ones. In doing
so, we fill the gap in the literature that assesses the effectiveness of environmental policy in
unlocking the technological system from path dependence on non-environmental inventive efforts.
Therefore, the first research question is the following:
Does environmental policy induce a shift from non-environmental invention to
environmentally friendly inventive activities?
Finally, two main propositions are put forward from the literature on technological substitution
(David, 1985; Arthur, 1989). First, even if substituting technologies are available and superior to the
dominant one, technological substitution is not assured due to the presence of increasing returns to
adoption. Second, in a technological substitution process, a pool of new technologies compete for
dominance although lock-ins into sub-optimal substituting technologies are still possible due to path
dependence of sequential adoption decision. With regard to these points, in the automotive industry
both propositions apply, at least in part, due to the presence of competition between conventional
and low-emitting vehicles and between alternative vehicles designs that may substitute conventional
cars (Frenken et al., 2004).
Due to the fact that the potential shift from non-green to green inventions may also affect the
environmental domain because of competition between low-emitting vehicle technologies, i.e.
green inventions come at the expense of other green inventions, we investigate „what‟ has been
crowded out. In this case, if environmental policies drag away resources from environmental
technological domains to develop other green inventions, the risk of technological change lock-ins
into a sub-optimal substituting technology will be higher because of the absence of a superior
alternative technology, from both an economic and environmental perspective, at the current stage.
This leads to the second research question:
Does environmental policy alter competition between alternative low-emissions vehicles?
Does it cause a shift among environmental inventive activities?
3 The automotive technological system
3.1 Patent data in the automotive sector
In order to answer the abovementioned research questions, our study focuses on large-size
incumbent automotive firms. The motivations that support this choice are manifold. First, due to its
high impact on local and global air pollution, policy makers all over the world have advocated the
need to decrease the emission of pollutants released by vehicles. To do so, many efforts have been
made, especially over the last decades, regarding the environmental regulatory system to hamper
transport sector environmental impacts. Second, many scholars have highlighted the presence of
carbon lock-ins in the automotive industry (Cowan and Hultén, 1996; Frenken et al., 2004; Aghion
et al., 2012). Third, the industry had been challenged by deep structural changes, especially over the

6
last few years. The industry has been hit hard by recent financial uncertainty, imposing a
reconsideration of knowledge capital management (Laperche et al., 2011). In addition to the
dynamics that have characterised the industry from this perspective (R&D rationalisation; R&D
collaboration; etc.), the increasing demand for low-emitting vehicles, together with environmental
regulations, has provided the incentives to develop new environmentally-sound technologies and
reduce vehicle emission levels. Finally, intellectual property (in particular patent protection)
assumes, especially in the automotive industry, a pivotal role for triggering profits and competitive
advantage (Laperche et al., 2011).
Since our paper aims to explore the dynamics of inventive efforts made in different technological
fields, we employ patents as a proxy for invention. Griliches (1990) points out that patents sorted by
their priority year have a strong correlation with R&D expenditures. In addition, patents are the
only kind of data that provide information on the technical features of inventive activities, essential
information to test our hypotheses. However, we must be aware of patent data limitations (see, for
example, Griliches, 1990). The main problems arise from variability in their quality (Lanjouw et al.,
1998) and from their selection process (keyword search; patent classification search; etc).
In this paper, we employ a methodology based on triadic patent families defined by the OECD as a
“set of patents taken at the EPO, USTPO and JPO that share one or more properties” (Dernis and
Khan, 2004; pp.17). One of those properties is that patents must pertain to the same patent family5.
In doing this, we focus on high quality patent data since most important inventions are protected in
these three patent offices. Moreover, we reduce the influence of the heterogeneity of patent offices‟
regulation systems (Dernis and Khan, 2004). In addition, to deal with patent sample selection
problems that come from the type of search that is carried out6, we collected the automotive firms
included in the R&D scoreboards (IRI) from the 2006-2011 editions7. In doing so, we focus on
firms that perform constant and considerable amounts of R&D investment. Indeed, incumbent firms
are expected to carry out large R&D programmes thanks to consolidated financial and R&D
capabilities (Cohen and Klepper, 1996). Subsequently, we gathered the patents filed by those 71
firms, retrieving their name from the Derwent Corporate Tree8 in order to obtain the whole
corporate structure and their standardised applicant names. This process allows us to account for the
complex globalised structure of the automotive industry and reduce noise caused mainly by spelling
variations in assignees‟ names.
3.2 Self-Organising Maps
We collected all the patent family applications filed by the former sample of firms from the
Thomson Innovation database obtaining a total of 247,510 patent families, of which 54,371 are
triadic patent families (TPFs). In addition, we discerned between green and non-green TPFs by
exploring their technological classification codes. Different technological classification have been
proposed to analyse the technological content of patent data. In this paper we use Cooperative
Patent Classifications (CPC) codes9, which provide a hierarchical and language independent
5 Patent families are defined by the OECD as “the set of patents (or applications) filed in several countries which are
related to each other by one or several common priority filings” (OECD, 2009; pp.71). 6 Many ways to collect patents are adopted in the literature. However, relevant drawbacks are associated with patent
classification searches (Costantini et al., 2013) and applicant name searches (Thoma et al., 2010). 7 Before 2006 and after 2011, R&D Scoreboard editions the number of firms ranked was different from that of 2006-
2011 (500 and 2000 instead of 1000 firms). The 2006-2011 editions are therefore homogeneous and comparable. 8 The Corporate Tree tool covers the top 2,500 patenting companies for those authorities and takes into account
mergers, acquisitions, divestitures, spelling differences (but not reassignments). Six firms were not included in the
Corporate Tree tool. For these we found the patent in the OECD "Harmonised Applicants' Names" database by
searching the applicant name field. 9CPC is a new classification introduced in the USPTO and EPO that includes a section for emerging technologies
(http://www.cooperativepatentclassification.org). For an application of CPC patent maps, see (Leydesdorff et al., 2013)
7
classification of patent technical domains. In particular, what makes this classification appealing for
our study is the possibility of detecting green patents through the Y02 class “Technologies or
applications for mitigation or adaptation against climate change” that we use to identify the
environmental inventions in our dataset.
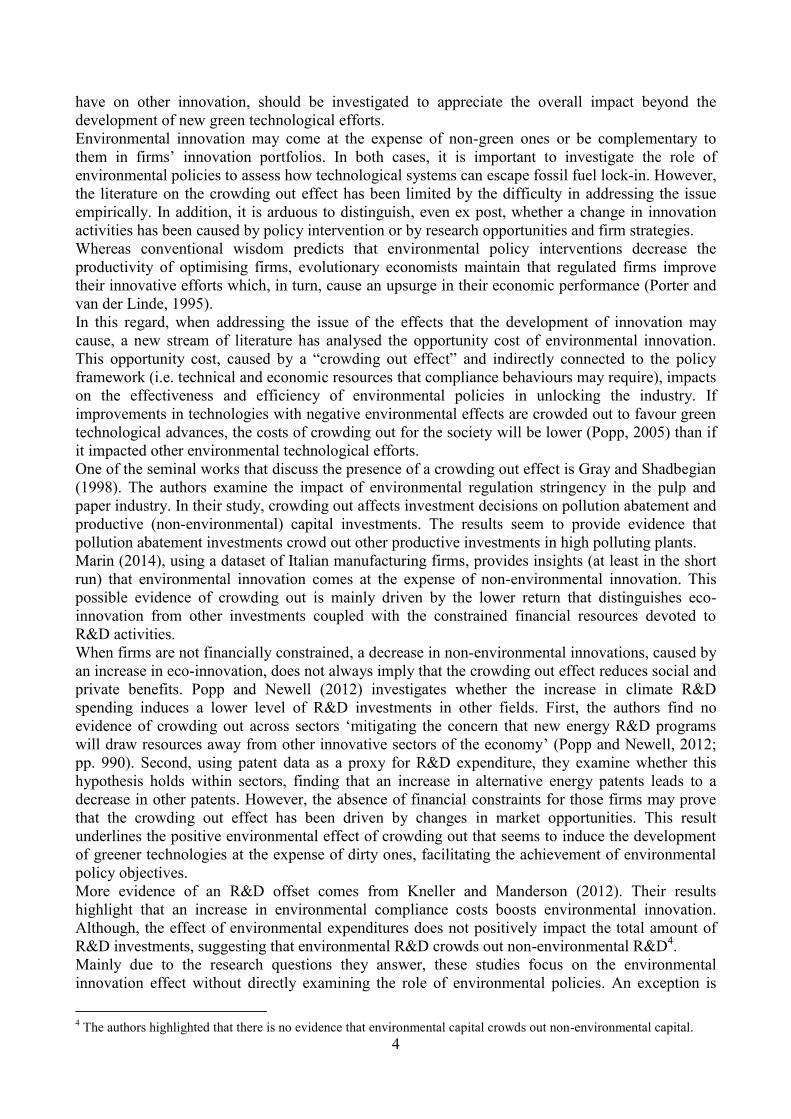
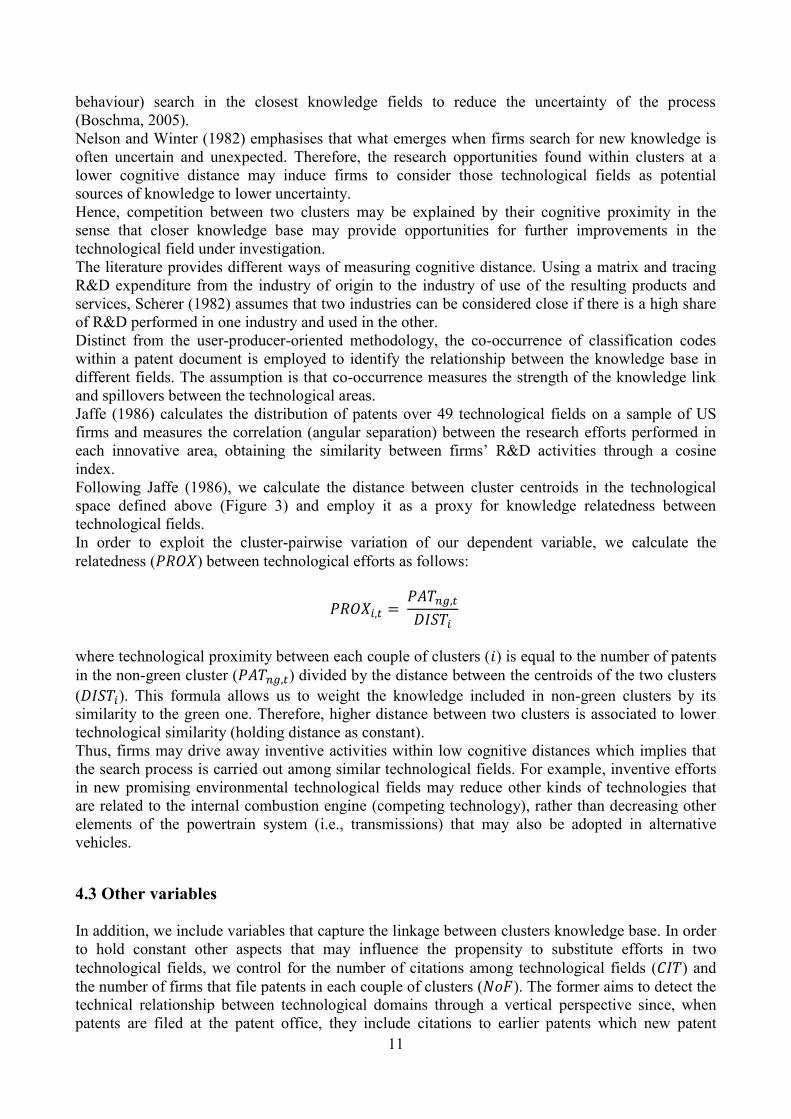
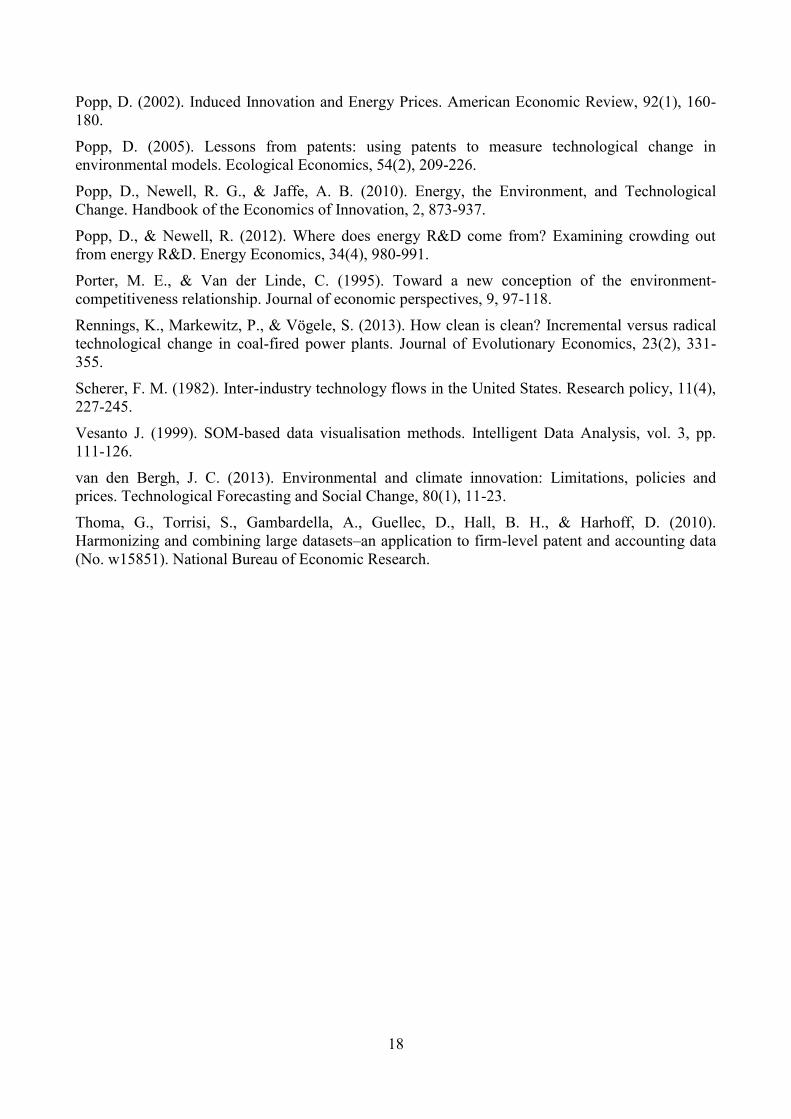
Figure 1 illustrates the trends in green and non-green TPF applications sorted by their earliest
priority year. We can appreciate from the histograms that the percentage of green TPF per year
steadily rose from 1980 to 2006 (when it reached its maximum) and then gradually fell until 2009,
whereas the percentage of non-green patents followed the opposite trend. Moreover, we can
appreciate that the percentage of green and non-green TPFs over the total (respectively, green and
non-green) TPF applications in the whole period, sharply increased from 1990 onwards. However,
while the percentage of non-green patents has fluctuated since 2000, the one related to green patents
continued to grow until 2006. These issues highlight that the distribution of green patents grew in
recent years probably due to environmental policy efforts made in both greening ICEV technologies
and developing new alternative vehicle propulsion systems.
However, in order to investigate which inventive activities may impact technological advance
dynamics, we further discerned between the type of technologies that are included in the green and
non-green technological fields. In doing so, we assume that the share of CPC classes between
inventions represents a proxy for their technological similarity, i.e. the higher the number of CPC
classes that occur among the patents, the greater their technological relatedness. Unlike other
approaches that use patents to measure the relatedness between technological fields (Jaffe, 1986;
Nesta and Saviotti, 2005; Breschi et al., 2003; to cite a few), we employ technological fields to map
inventions based on their technological similarity10
.
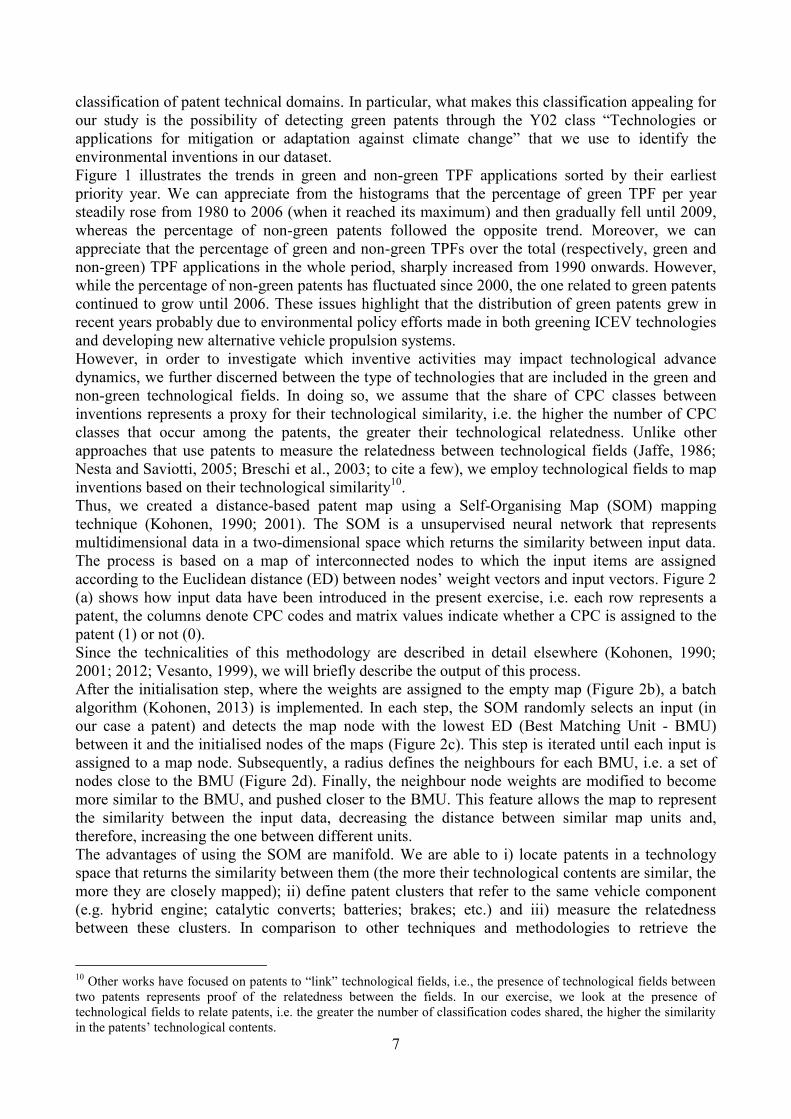
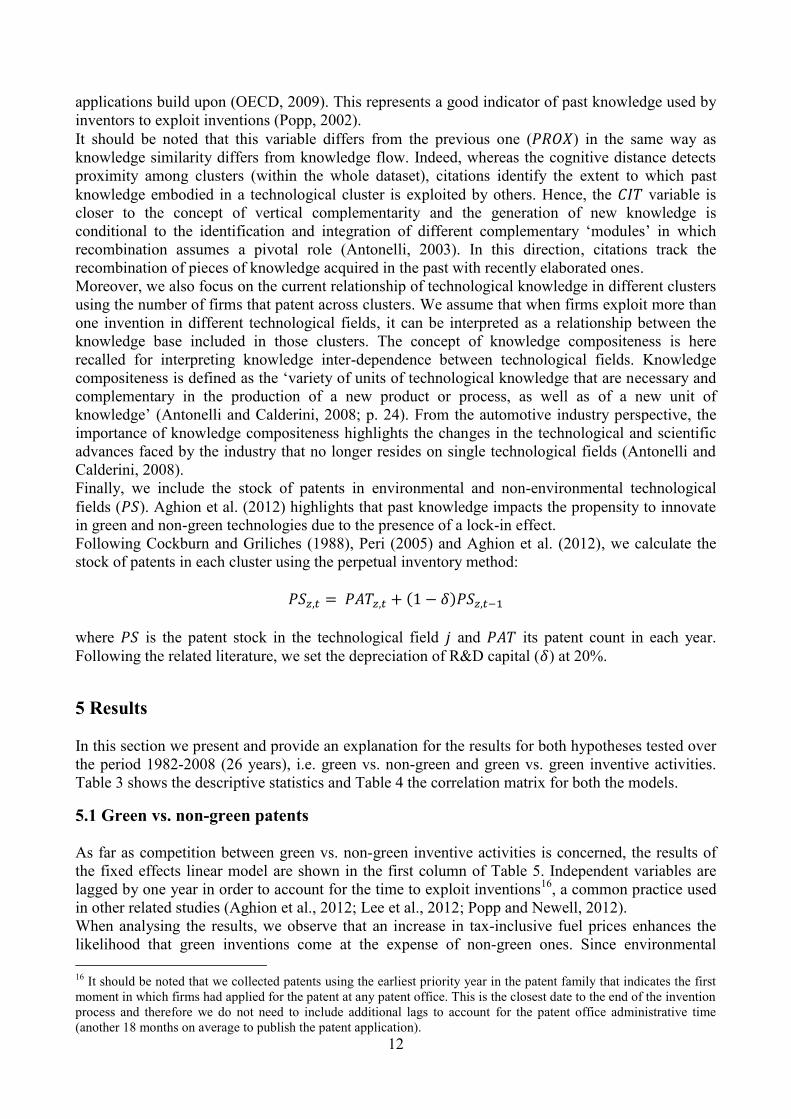
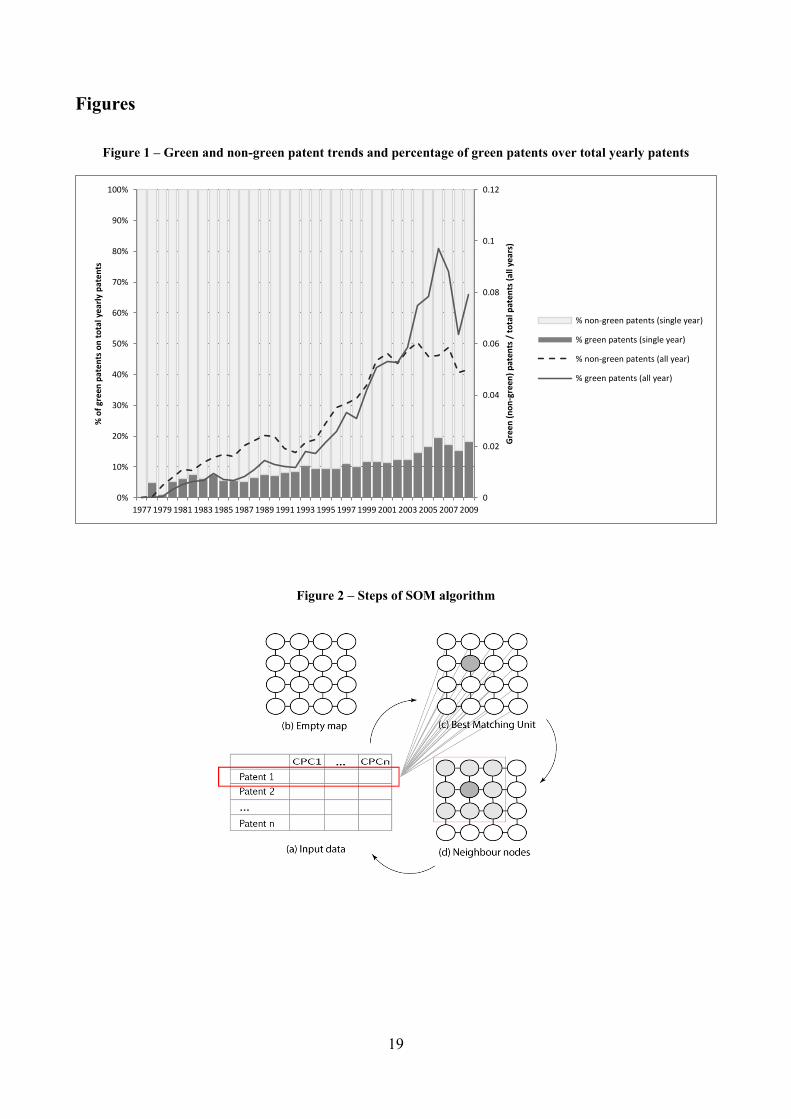
Thus, we created a distance-based patent map using a Self-Organising Map (SOM) mapping
technique (Kohonen, 1990; 2001). The SOM is a unsupervised neural network that represents
multidimensional data in a two-dimensional space which returns the similarity between input data.
The process is based on a map of interconnected nodes to which the input items are assigned
according to the Euclidean distance (ED) between nodes‟ weight vectors and input vectors. Figure 2
(a) shows how input data have been introduced in the present exercise, i.e. each row represents a
patent, the columns denote CPC codes and matrix values indicate whether a CPC is assigned to the
patent (1) or not (0).
Since the technicalities of this methodology are described in detail elsewhere (Kohonen, 1990;
2001; 2012; Vesanto, 1999), we will briefly describe the output of this process.
After the initialisation step, where the weights are assigned to the empty map (Figure 2b), a batch
algorithm (Kohonen, 2013) is implemented. In each step, the SOM randomly selects an input (in
our case a patent) and detects the map node with the lowest ED (Best Matching Unit - BMU)
between it and the initialised nodes of the maps (Figure 2c). This step is iterated until each input is
assigned to a map node. Subsequently, a radius defines the neighbours for each BMU, i.e. a set of
nodes close to the BMU (Figure 2d). Finally, the neighbour node weights are modified to become
more similar to the BMU, and pushed closer to the BMU. This feature allows the map to represent
the similarity between the input data, decreasing the distance between similar map units and,
therefore, increasing the one between different units.
The advantages of using the SOM are manifold. We are able to i) locate patents in a technology
space that returns the similarity between them (the more their technological contents are similar, the
more they are closely mapped); ii) define patent clusters that refer to the same vehicle component
(e.g. hybrid engine; catalytic converts; batteries; brakes; etc.) and iii) measure the relatedness
between these clusters. In comparison to other techniques and methodologies to retrieve the
10
Other works have focused on patents to “link” technological fields, i.e., the presence of technological fields between
two patents represents proof of the relatedness between the fields. In our exercise, we look at the presence of
technological fields to relate patents, i.e. the greater the number of classification codes shared, the higher the similarity
in the patents‟ technological contents.
8
cognitive distance between technological fields, the SOM provides a distance-based output where
the patents are located according to their global and local similarity.
3.3 Exploring the technological space
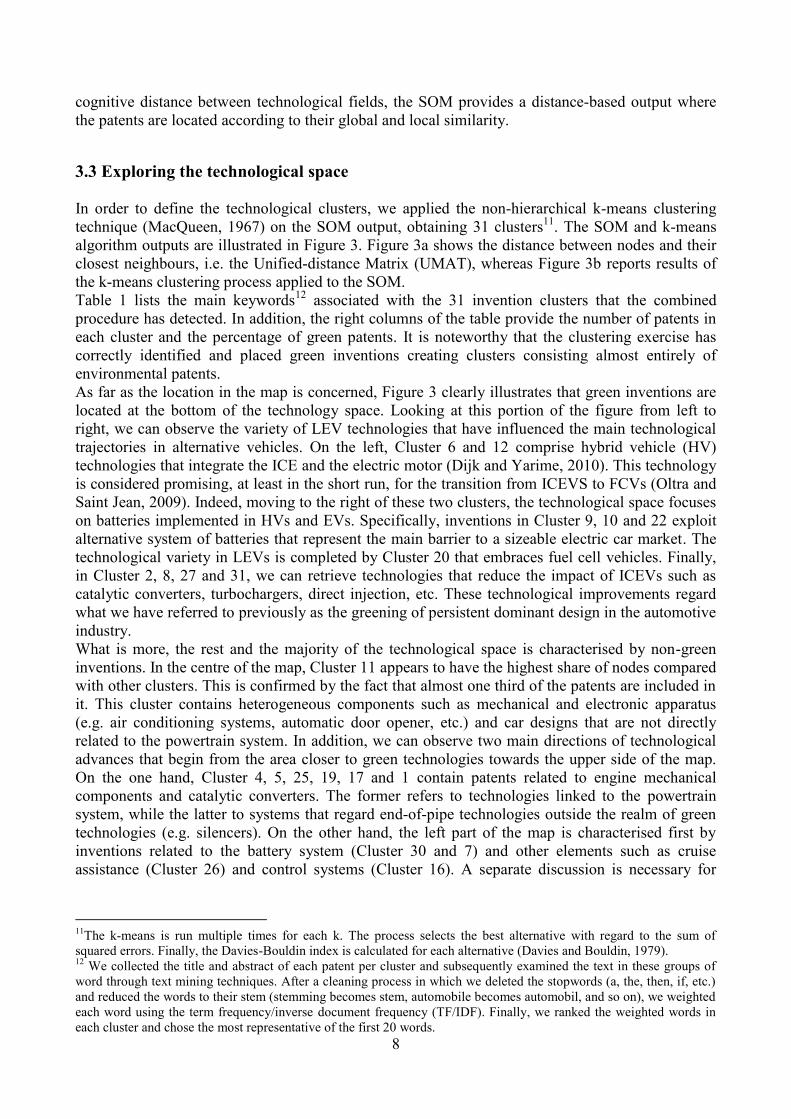
In order to define the technological clusters, we applied the non-hierarchical k-means clustering
technique (MacQueen, 1967) on the SOM output, obtaining 31 clusters11
. The SOM and k-means
algorithm outputs are illustrated in Figure 3. Figure 3a shows the distance between nodes and their
closest neighbours, i.e. the Unified-distance Matrix (UMAT), whereas Figure 3b reports results of
the k-means clustering process applied to the SOM.
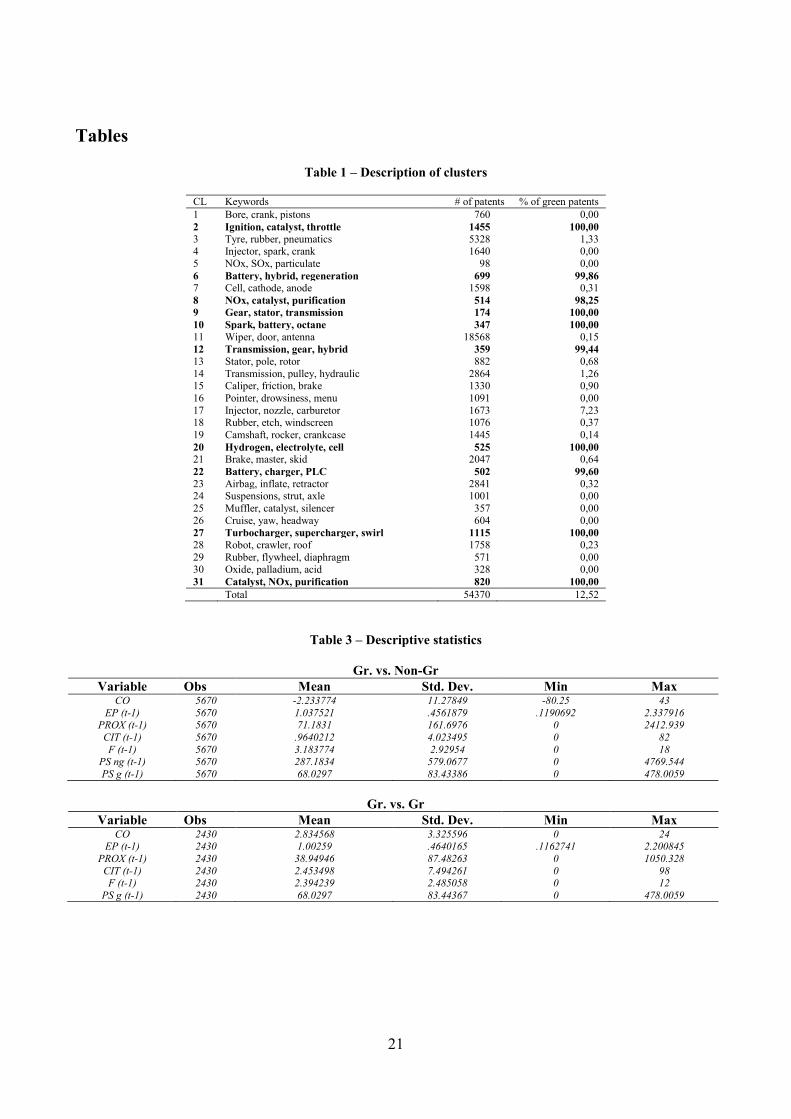
Table 1 lists the main keywords12
associated with the 31 invention clusters that the combined
procedure has detected. In addition, the right columns of the table provide the number of patents in
each cluster and the percentage of green patents. It is noteworthy that the clustering exercise has
correctly identified and placed green inventions creating clusters consisting almost entirely of
environmental patents.
As far as the location in the map is concerned, Figure 3 clearly illustrates that green inventions are
located at the bottom of the technology space. Looking at this portion of the figure from left to
right, we can observe the variety of LEV technologies that have influenced the main technological
trajectories in alternative vehicles. On the left, Cluster 6 and 12 comprise hybrid vehicle (HV)
technologies that integrate the ICE and the electric motor (Dijk and Yarime, 2010). This technology
is considered promising, at least in the short run, for the transition from ICEVS to FCVs (Oltra and
Saint Jean, 2009). Indeed, moving to the right of these two clusters, the technological space focuses
on batteries implemented in HVs and EVs. Specifically, inventions in Cluster 9, 10 and 22 exploit
alternative system of batteries that represent the main barrier to a sizeable electric car market. The
technological variety in LEVs is completed by Cluster 20 that embraces fuel cell vehicles. Finally,
in Cluster 2, 8, 27 and 31, we can retrieve technologies that reduce the impact of ICEVs such as
catalytic converters, turbochargers, direct injection, etc. These technological improvements regard
what we have referred to previously as the greening of persistent dominant design in the automotive
industry.
What is more, the rest and the majority of the technological space is characterised by non-green
inventions. In the centre of the map, Cluster 11 appears to have the highest share of nodes compared
with other clusters. This is confirmed by the fact that almost one third of the patents are included in
it. This cluster contains heterogeneous components such as mechanical and electronic apparatus
(e.g. air conditioning systems, automatic door opener, etc.) and car designs that are not directly
related to the powertrain system. In addition, we can observe two main directions of technological
advances that begin from the area closer to green technologies towards the upper side of the map.
On the one hand, Cluster 4, 5, 25, 19, 17 and 1 contain patents related to engine mechanical
components and catalytic converters. The former refers to technologies linked to the powertrain
system, while the latter to systems that regard end-of-pipe technologies outside the realm of green
technologies (e.g. silencers). On the other hand, the left part of the map is characterised first by
inventions related to the battery system (Cluster 30 and 7) and other elements such as cruise
assistance (Cluster 26) and control systems (Cluster 16). A separate discussion is necessary for
11
The k-means is run multiple times for each k. The process selects the best alternative with regard to the sum of
squared errors. Finally, the Davies-Bouldin index is calculated for each alternative (Davies and Bouldin, 1979). 12
We collected the title and abstract of each patent per cluster and subsequently examined the text in these groups of
word through text mining techniques. After a cleaning process in which we deleted the stopwords (a, the, then, if, etc.)
and reduced the words to their stem (stemming becomes stem, automobile becomes automobil, and so on), we weighted
each word using the term frequency/inverse document frequency (TF/IDF). Finally, we ranked the weighted words in
each cluster and chose the most representative of the first 20 words.

9
Cluster 13, 14, 15, 21 and 24. Those clusters include mechanical developments in transmission (13-
15), suspension (24) and brake systems (21).
Concluding our description of the technological space, we find safety technologies in Cluster (23)
and tyres and pneumatics patents in Cluster (3).
4 Testing the crowding out hypotheses
4.1 Dependent variable
In this section we describe the variables used to analyse what influences automotive technological
system dynamics. First we describe the dependent variable that allows us to measure the shift in
innovative efforts made in each technological field. We calculated the variable as follows:
where is the patent count moving average, refers to specific clusters defined before and
the growth rate in the for each cluster. Finally, in order to account for the shift from one
technological cluster to the other, we calculate the dependent variable through the following
formula:
this is the difference between the growth rate in the patent count moving average in a green cluster
( ) and the one related to a non-green cluster ( ). represents each couple of green and non-green
clusters. Therefore, when the variable is positive, the growth rate related to green clusters is
higher than the one in a non-green cluster. We assume that positive values of this variable imply a
shift in the technological advances toward more sustainable technologies.
Similarly, the variable can be used to test the potential crowding out effect among green clusters
as follows:
| |
where is equal to the difference between two patent count moving averages related to and
(with ) with representing each couple of green clusters. The absolute value helps us
to interpret the results since the output in this case is bidirectional.
Therefore, we test the first and second research questions on a total of and observations respectively
13.
The strength of this approach resides in the capability to account for relative increase (decrease) in
patent counts related to both technological clusters ( vs. and vs. ), i.e. a technological
field increases more than in proportion to another.
A possible model for analysing what affects competition between inventive efforts in different
technological fields can be written as follows:
13
The patent count in each green technological fields is compared with every other green field except itself. In addition,
due to the fact that the outcome is symmetric (e.g. if the outcome of the comparison between cl2 and cl6 is equal to 1,
its opposite, cl6 vs. cl2, is equal to 0), the number of observations has been reduced to avoid double counting.
10
( )
where the dependent variable, , is a function of environmental policy stringency ( ). In
addition, we check if technological relatedness provides incentives to shift from to
technological efforts by including the variable that captures cognitive proximity between the
technological clusters to the model. Moreover, we control for those factors that may influence the
propensity to decrease inventive efforts in one technological field in favour of another ( ).
Finally, fixed effects capture the unobservable cluster-pairwise-specific time invariant
heterogeneity, whereas is the cluster-pairwise-specific time trend that accounts for unobservable
factors associated with each couple of clusters and varies over time.
4.2 Independent variables
The variable is designed to include the main driver of environmental innovative activities in the
automotive sector, i.e. post-tax fuel prices.
Over the last decades, a widespread literature has analysed the effect of fuel prices on innovation
(see Crabb and Johnson, 2007; Hascic et al., 2009; Aghion et al., 2012; among others). These
studies shape a consolidated framework that provides evidence of the positive impact of
environmental policy on environmental innovation. What is more, if this variable positively impacts
our dependent variable it provides an insight that higher stringency increases the probability that
green inventions come at the expense of non-green inventive activities, highlighting that instead of
being additional, green technological efforts crowd out non-green ones. In this case, we advocate
that environmental policies may be effective in reducing path dependence on conventional non-
environmental technologies. On the other hand, a negative effect may represent an insight that even
if environmental regulation induces firms to enhance their inventive activities in the green field,
they do not affect non-green technological improvements, showing their ineffectiveness in
redirecting technological advances away from ICEV technologies.
Following Aghion et al. (2012), post-tax fuel prices are here used as a proxy for carbon tax. Due to
the fact that fuel prices are available only at the country level, the idea is to apply the following
formula to exploit the yearly cluster-level variation of the dependent variable14
:
∑
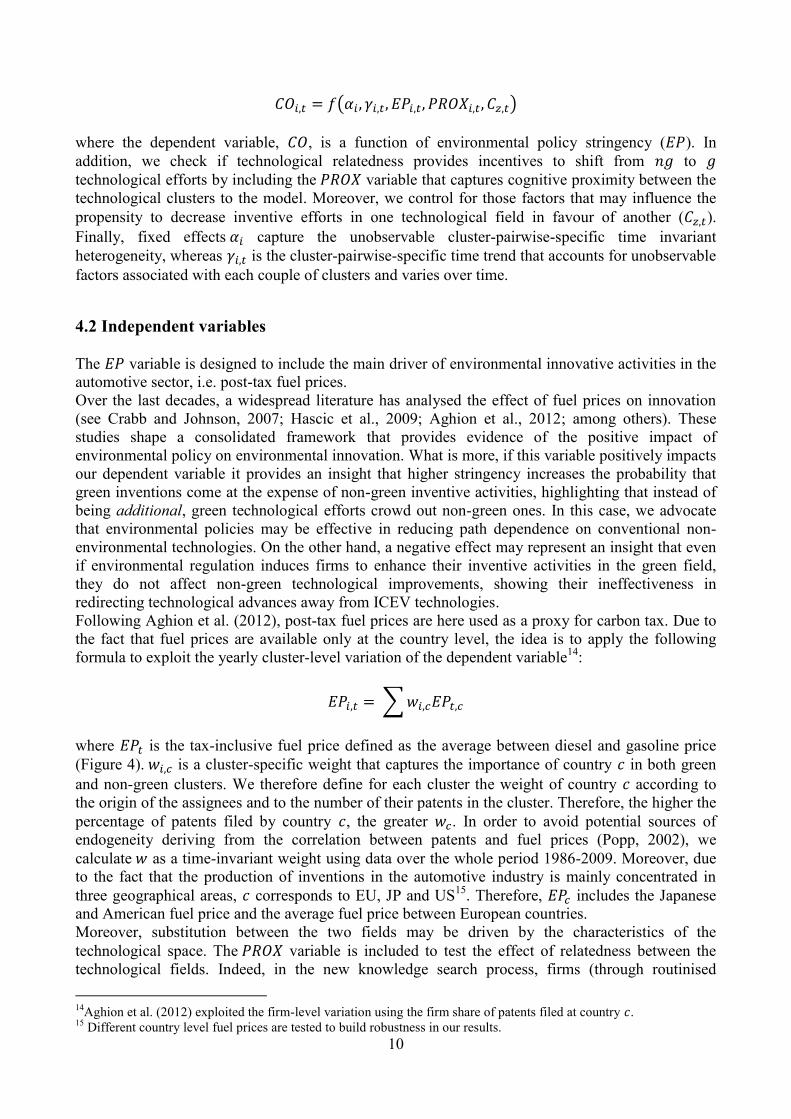
where is the tax-inclusive fuel price defined as the average between diesel and gasoline price
(Figure 4). is a cluster-specific weight that captures the importance of country in both green
and non-green clusters. We therefore define for each cluster the weight of country according to
the origin of the assignees and to the number of their patents in the cluster. Therefore, the higher the
percentage of patents filed by country , the greater . In order to avoid potential sources of
endogeneity deriving from the correlation between patents and fuel prices (Popp, 2002), we
calculate as a time-invariant weight using data over the whole period 1986-2009. Moreover, due
to the fact that the production of inventions in the automotive industry is mainly concentrated in
three geographical areas, corresponds to EU, JP and US15
. Therefore, includes the Japanese
and American fuel price and the average fuel price between European countries.
Moreover, substitution between the two fields may be driven by the characteristics of the
technological space. The variable is included to test the effect of relatedness between the
technological fields. Indeed, in the new knowledge search process, firms (through routinised
14
Aghion et al. (2012) exploited the firm-level variation using the firm share of patents filed at country . 15
Different country level fuel prices are tested to build robustness in our results.
11
behaviour) search in the closest knowledge fields to reduce the uncertainty of the process
(Boschma, 2005).
Nelson and Winter (1982) emphasises that what emerges when firms search for new knowledge is
often uncertain and unexpected. Therefore, the research opportunities found within clusters at a
lower cognitive distance may induce firms to consider those technological fields as potential
sources of knowledge to lower uncertainty.
Hence, competition between two clusters may be explained by their cognitive proximity in the
sense that closer knowledge base may provide opportunities for further improvements in the
technological field under investigation.
The literature provides different ways of measuring cognitive distance. Using a matrix and tracing
R&D expenditure from the industry of origin to the industry of use of the resulting products and
services, Scherer (1982) assumes that two industries can be considered close if there is a high share
of R&D performed in one industry and used in the other.
Distinct from the user-producer-oriented methodology, the co-occurrence of classification codes
within a patent document is employed to identify the relationship between the knowledge base in
different fields. The assumption is that co-occurrence measures the strength of the knowledge link
and spillovers between the technological areas.
Jaffe (1986) calculates the distribution of patents over 49 technological fields on a sample of US
firms and measures the correlation (angular separation) between the research efforts performed in
each innovative area, obtaining the similarity between firms‟ R&D activities through a cosine
index.
Following Jaffe (1986), we calculate the distance between cluster centroids in the technological
space defined above (Figure 3) and employ it as a proxy for knowledge relatedness between
technological fields.
In order to exploit the cluster-pairwise variation of our dependent variable, we calculate the
relatedness ( ) between technological efforts as follows:
where technological proximity between each couple of clusters ( ) is equal to the number of patents
in the non-green cluster ( ) divided by the distance between the centroids of the two clusters
( ). This formula allows us to weight the knowledge included in non-green clusters by its
similarity to the green one. Therefore, higher distance between two clusters is associated to lower
technological similarity (holding distance as constant).
Thus, firms may drive away inventive activities within low cognitive distances which implies that
the search process is carried out among similar technological fields. For example, inventive efforts
in new promising environmental technological fields may reduce other kinds of technologies that
are related to the internal combustion engine (competing technology), rather than decreasing other
elements of the powertrain system (i.e., transmissions) that may also be adopted in alternative
vehicles.
4.3 Other variables
In addition, we include variables that capture the linkage between clusters knowledge base. In order
to hold constant other aspects that may influence the propensity to substitute efforts in two
technological fields, we control for the number of citations among technological fields ( ) and
the number of firms that file patents in each couple of clusters ( ). The former aims to detect the
technical relationship between technological domains through a vertical perspective since, when
patents are filed at the patent office, they include citations to earlier patents which new patent
12
applications build upon (OECD, 2009). This represents a good indicator of past knowledge used by
inventors to exploit inventions (Popp, 2002).
It should be noted that this variable differs from the previous one ( ) in the same way as
knowledge similarity differs from knowledge flow. Indeed, whereas the cognitive distance detects
proximity among clusters (within the whole dataset), citations identify the extent to which past
knowledge embodied in a technological cluster is exploited by others. Hence, the variable is
closer to the concept of vertical complementarity and the generation of new knowledge is
conditional to the identification and integration of different complementary „modules‟ in which
recombination assumes a pivotal role (Antonelli, 2003). In this direction, citations track the
recombination of pieces of knowledge acquired in the past with recently elaborated ones.
Moreover, we also focus on the current relationship of technological knowledge in different clusters
using the number of firms that patent across clusters. We assume that when firms exploit more than
one invention in different technological fields, it can be interpreted as a relationship between the
knowledge base included in those clusters. The concept of knowledge compositeness is here
recalled for interpreting knowledge inter-dependence between technological fields. Knowledge
compositeness is defined as the „variety of units of technological knowledge that are necessary and
complementary in the production of a new product or process, as well as of a new unit of
knowledge‟ (Antonelli and Calderini, 2008; p. 24). From the automotive industry perspective, the
importance of knowledge compositeness highlights the changes in the technological and scientific
advances faced by the industry that no longer resides on single technological fields (Antonelli and
Calderini, 2008).
Finally, we include the stock of patents in environmental and non-environmental technological
fields ( ). Aghion et al. (2012) highlights that past knowledge impacts the propensity to innovate
in green and non-green technologies due to the presence of a lock-in effect.
Following Cockburn and Griliches (1988), Peri (2005) and Aghion et al. (2012), we calculate the
stock of patents in each cluster using the perpetual inventory method:
where is the patent stock in the technological field and its patent count in each year.
Following the related literature, we set the depreciation of R&D capital ( ) at 20%.
5 Results
In this section we present and provide an explanation for the results for both hypotheses tested over
the period 1982-2008 (26 years), i.e. green vs. non-green and green vs. green inventive activities.
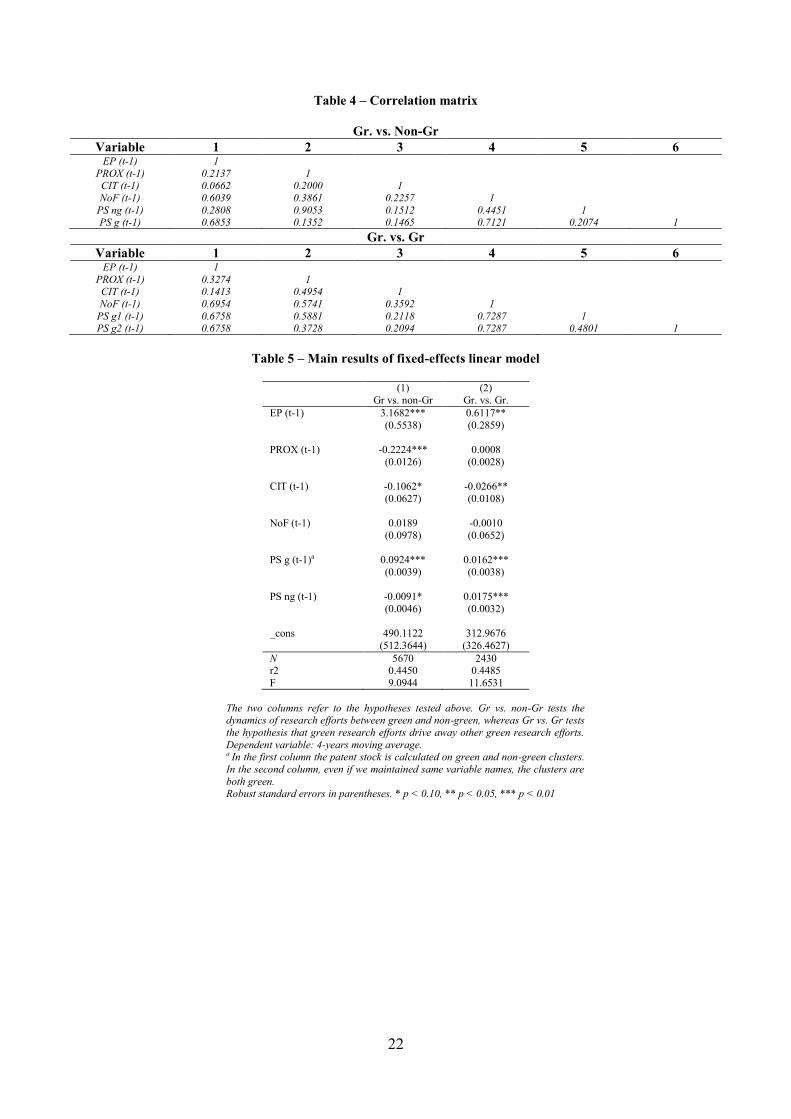
Table 3 shows the descriptive statistics and Table 4 the correlation matrix for both the models.
5.1 Green vs. non-green patents
As far as competition between green vs. non-green inventive activities is concerned, the results of
the fixed effects linear model are shown in the first column of Table 5. Independent variables are
lagged by one year in order to account for the time to exploit inventions16
, a common practice used
in other related studies (Aghion et al., 2012; Lee et al., 2012; Popp and Newell, 2012).
When analysing the results, we observe that an increase in tax-inclusive fuel prices enhances the
likelihood that green inventions come at the expense of non-green ones. Since environmental
16
It should be noted that we collected patents using the earliest priority year in the patent family that indicates the first
moment in which firms had applied for the patent at any patent office. This is the closest date to the end of the invention
process and therefore we do not need to include additional lags to account for the patent office administrative time
(another 18 months on average to publish the patent application).

13
regulations trigger environmental automotive inventive efforts (Aghion et al., 2012; Lee et al.,
2012; Hascic et al., 2009), the results seem to provide evidence that firms tend to reallocate R&D
resources from non-green to green investments due to the need to comply with policy requirements.
This result can be interpreted as an insight that post-tax fuel prices impact competition between the
two technological fields and contribute to crowding out ICEVs inventive activities in favour of
alternatively propelled vehicle technologies. Therefore, on the one hand, we advocate that
environmental regulation is effective in unlocking the automotive technological system from path
dependence on conventional vehicle innovation. Higher fuel prices encourage firms to carry out
environmental inventive activities while discouraging dirty invention development (Aghion et al.,
2012). On the other hand, an increase in environmental policy stringency hampers non-
environmental patent efforts and thus the social benefit that arises from new eco-innovation.
Other remarks can be extrapolated from the proximity variable. The coefficient indicates that the
greater the dissimilarity between technological clusters (i.e. distant cluster in the technological
space), the lower the shift from non-environmental to environmental inventive activities. Thus, we
point out that firms have a tendency to reduce efforts in the technological clusters that are closer
(i.e. related in terms of CPC classes) to the green ones. From Figure 3, we observe that more distant
technological clusters (the upper side of the map) with respect to green clusters, are not directly
related to internal combustion engines. This issue highlights the fact that, when holding constant
other variables, firms‟ patent strategies are directed towards increasing efforts in environmental
technologies at the expense of non-green inventions such as conventional engines, or alternatively,
that this effect is lower for those clusters that are more distant in the technological space. This result
confirms the abovementioned competition between the main technological trajectories in the
automotive industry. The efforts made in these alternative powered engines (such as hybrid, electric
and fuel cell), compete with inventions directly related to fossil fuel engines rather than with
technologies that can also be adopted in alternative cars, i.e. safety, transmission, brake
technologies and tyres.
5.2 Green vs. green patents
In addition, we investigate the potential effect of environmental policy on competition between
green technologies. This issue is fundamental to testing whether green inventions drive away
inventive efforts from other green fields due to policy stringency or other factors that influence
technological competition. In so doing, we account for the effect of each green technological cluster
on the others included in the green domain. From Table 5 column 2, we can observe that the
environmental policy coefficient is positive and significant. This means that there are insights that
tax-inclusive fuel prices impact competition between alternative technological advances. Therefore,
this issue highlights that environmental policies may redirect technological efforts towards other
environmental domains increasing the likelihood of a potential lock-in into sub-optimal alternative
technology. Indeed, instead of inducing improvements in a particular technological field, tax-
inclusive fuel prices should encourage firms to exploit a variety of technological trajectories
(Frenken et al., 2004) because, at the current stage of technological advances in low emission
vehicles, it is hard to assess whether an alternative technology is superior to the others. For
example, even though fuel cell vehicles are considered the most promising technology compared
with hybrid and electric cars, important bottlenecks must be solved and therefore the risk of lock-in
into a technology which may turn out to be sub-optimal in the future remains (Frenken et al., 2004).
In this regard, we provide a suggestive interpretation of these results by categorising the clusters
within four main groups. As stated in Section 3.3, the main trajectories that characterise green R&D
efforts are end-of-pipe technologies, HVs, EVs and FCVs. Following Popp and Newell (2012),
Table 6 shows the correlation between the percentage of patents per year in each category among
three time ranges. We can observe that the highest negative correlation is between end-of-pipe

14
technologies and other vehicle propulsion technologies in all time ranges. This issue provides
insights that competition between green patenting activities mainly regards these two broad
categories of technological efforts i.e. end-of-pipe vs. EVs, HVs and FCVs. Thus, even within the
environmental technological domain, the competition between the two vehicle designs characterises
the technology space.
Moreover, the proximity variable is positive and statistically insignificant meaning that
technological relatedness among the technology space does not influence the shift from green to
other green technological efforts. Indeed, firms respond to technological opportunities that are
constantly being proposed by technological advances, highlighting the absence of a dominant
technology among alternatives to fossil fuel engine. Therefore, due to the fact that environmental
patenting efforts are made in a variety of technological fields, the dynamic changes in these
technological trajectories induce firms to invest in a portfolio of environmentally friendly
technologies that face higher technological opportunities at that moment. However, in this case, the
similarity between technological activities does not impact the shift from one technological field to
the other.
5.3 Robustness checks
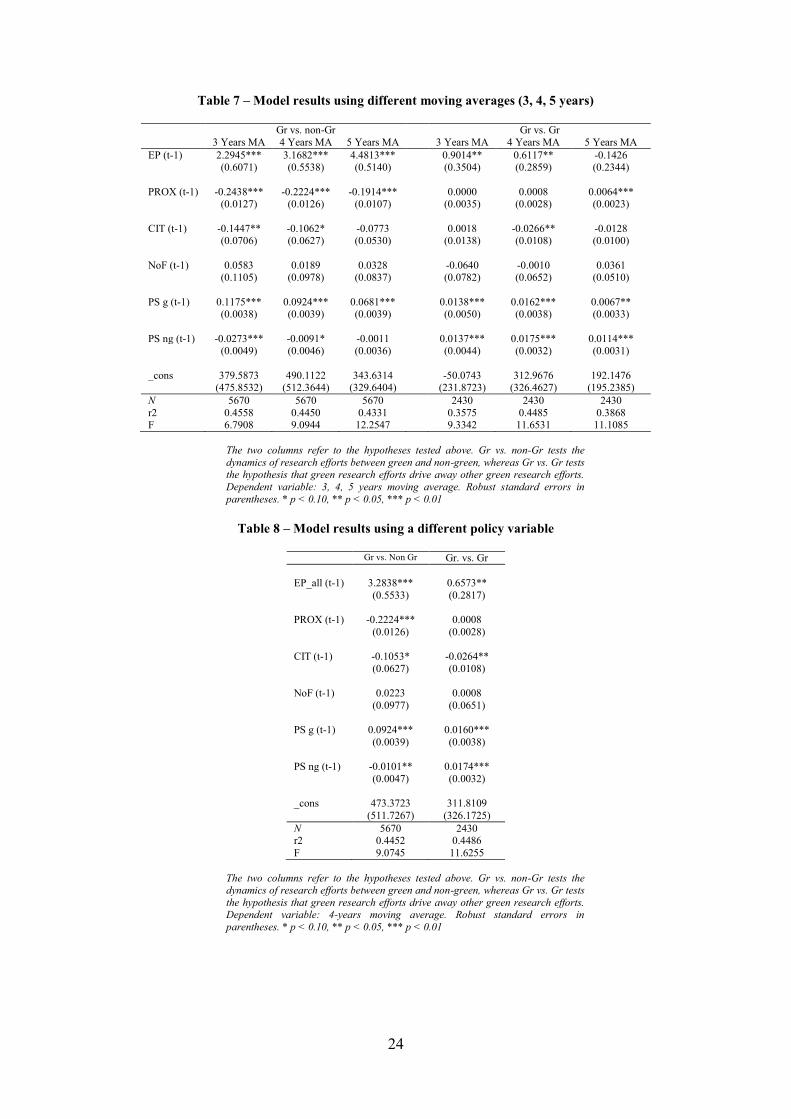
In this Section we provide some robustness checks to assess the reliability of the model results
using different variables. Table 7 shows the results employing a 3, 4, 5 year patent count moving
average as dependent variable. Previously, a 4-year moving average was used to provide the main
results, although we can observe that coefficient signs and their significance are almost the same
using different dependent variables in both models, at least as far as the main independent variables
are concerned.
Moreover, we run the model using a different proxy for the environmental policy variable (Table 8).
Whereas results in Table 5 are obtained using tax-inclusive fuel prices in three main countries (i.e.
EU, JP and US), Table 8 shows the model results using the whole set of countries in each cluster17
( ). This variable is obtained by calculating the share of patents from each country of origin in
each cluster, multiplied by the tax-inclusive fuel price of each country. Again, the coefficient signs
and significance are almost the same using the two variables.
Finally, Table 9 shows the results using fuel taxes instead of tax-inclusive fuel prices. However, due
to the availability of fuel tax data, the period of study is reduced (1986-2008). Also in this case the
models show similar results to those obtained using tax-inclusive fuel prices. This result provides an
insight into fuel tax effectiveness in fostering competition between alternatives.
6 Conclusions
In this paper we have analysed the dynamics of inventive activities pursued by large automotive
firms with a specific focus on the role played by environmental policies in influencing competition
between conventional (ICE) and low-emission vehicle technologies.
Our findings suggest that tax-inclusive fuel prices, employed as a proxy for carbon tax, induce a
shift from non-environmental inventive efforts towards those related to the development of
alternative vehicles and we have provided insights that environmental regulation encourages a
crowding out effect that favours substitution instead of complementarity among inventive efforts.
Therefore, we have highlighted the effectiveness of regulation in unlocking the automotive
technological system from fossil fuel path dependent technologies.
17
AT, DE, FR, IT, JP, KR, SE, UK, US

15
What is more, together with environmental policy, other factors affect competition. In particular,
the technological similarity between green and non-green clusters assumes a pivotal role. The fact
that technological relatedness positively impacts the shift from non-green to green inventions is
confirmed. Indeed, environmental technologies related to hybrid, electric and fuel cell vehicles
compete with internal combustion engine technologies that are close to them in the technological
space. Therefore, substitution mainly affects close technologies, such as propulsion system
technologies, rather than complementary technologies such as transmissions, body design, tires and
safety systems.
Finally, the hypothesis that environmental policies may impact competition between alternative
technological efforts has been tested. The results seem to provide evidence that tax-inclusive fuel
prices affect competition between environmental technological domains. This issue may increase
the risk of lock-in into suboptimal substituting vehicle technologies mainly due to the fact that, at
the current stage of development in alternative technologies, the community of technologists is
unable to identify a best alternative to internal combustion engine vehicles. In addition, we have
observed that this effect regards green inventive activities and environmental technologies related to
fossil fuel vehicles. Indeed, even within the environmental technological domain there is
competition between low-emission vehicle technologies and the greening of conventional design.
However, further investigation is needed to assess the direction of this potential shift. That is, if
alternative vehicle inventions crowd out technological efforts that reduce the environmental impact
of conventional cars, the likelihood of unlocking the automotive industry from fossil fuel path
dependence would be increased. Otherwise, driving away inventive efforts from long run
(development of alternative powertrain systems) to short run technological solutions (catalytic
converters, improved efficiency of conventional engines, etc.) would hamper the capability of the
automotive industry to escape internal combustion engine lock-in.
References
Acemoglu, D., Aghion, P., Bursztyn, L., & Hemous, D. (2012). The Environment and Directed
Technical Change. The American Economic Review, 102(1), 131-166.
Aghion, P., Dechezlepretre, A., Hemous, D., Martin, R., and Reenen, J. V. (2012). Carbon Taxes,
Path Dependency and Directed Technical Change: Evidence from the Auto Industry. Working
Paper 18596, National Bureau of Economic Research.
Antonelli, C. (2003). Knowledge complementarity and fungeability: implications for regional
strategy. Regional Studies, 37(6-7), 595-606.
Antonelli, C., & Calderini, M. (2008). The governance of knowledge compositeness and
technological performance: the case of the automotive industry in Europe. Economics of Innovation
and New Technology, 17(1-2), 23-41.
Armand, M., & Tarascon, J. M. (2008). Building better batteries. Nature, 451(7179), 652-657.
Arthur, W. B. (1989). Competing technologies, increasing returns, and lock-in by historical events.
The economic journal, 116-131.
Basalla, G. (Ed.). (1988). The evolution of technology. Cambridge University Press.
Bergek, A., Berggren, C., & KITE Research Group. (2014). The impact of environmental policy
instruments on innovation: A review of energy and automotive industry studies. Ecological
Economics, 106, 112-123.
Boschma, R. (2005). Proximity and innovation: a critical assessment. Regional studies, 39(1), 61-74

16
Breschi, S., Lissoni, F., & Malerba, F. (2003). Knowledge-relatedness in firm technological
diversification. Research Policy, 32(1), 69-87.
Bruckner, E., Ebeling, W., Montaño, M. J., & Scharnhorst, A. (1996). Nonlinear stochastic effects
of substitution - an evolutionary approach. Journal of Evolutionary Economics, 6(1), 1-30.
Cecere, G., Corrocher, N., Gossart, C., & Ozman, M. (2014). Lock-in and path dependence: an
evolutionary approach to eco-innovations. Journal of Evolutionary Economics, 24(5), 1037-1065.
Cockburn, I., & Griliches, Z. (1988). Industry Effects and Appropriability Measures in the Stock
Market's Valuation of R&D and Patents. The American Economic Review, 419-423.
Cohen, W. M., & Klepper, S. (1996). A reprise of size and R & D. The Economic Journal, 925-951.
Costantini, V., Crespi, F., & Curci, Y. (2013). BioPat: An Investigation Tool for Analysis of
Industry Evolution, Technological Paths and Policy Impact in the Biofuels Sector. In The Dynamics
of Environmental and Economic Systems (pp. 203-226). Springer Netherlands.
Cowan, R., & Hultén, S. (1996). Escaping lock-in: the case of the electric vehicle. Technological
forecasting and social change, 53(1), 61-79.
Crabb, J. M., & Johnson, D. K. (2007). Fueling the Innovative Process: Oil Prices and Induced
Innovation in Automotive Energy-Efficient Technology. Technical report, Colorado College
Department of Economics and Business, Colorado Springs, CO.
David, P. A. (1985). Clio and the Economics of QWERTY. The American economic review, 332-
337.
Davies, D. L., & Bouldin, D. W. (1979). A cluster separation measure. Pattern Analysis and
Machine Intelligence, IEEE Transactions on, (2), 224-227.
Dernis, H. and M. Khan (2004), “Triadic Patent Families Methodology”, OECD Science,
Technology and Industry Working Papers, 2004/02, OECD Publishing.
http://dx.doi.org/10.1787/443844125004
Dijk, M., & Yarime, M. (2010). The emergence of hybrid-electric cars: innovation path creation
through co-evolution of supply and demand. Technological Forecasting and Social Change, 77(8),
1371-1390.
Faber, A., & Frenken, K. (2009). Models in evolutionary economics and environmental policy:
Towards an evolutionary environmental economics. Technological Forecasting and Social Change,
76(4), 462-470.
Frenken, K., Hekkert, M., & Godfroij, P. (2004). R&D portfolios in environmentally friendly
automotive propulsion: variety, competition and policy implications. Technological Forecasting and
Social Change, 71(5), 485-507.
Gelijns, A. C., Zivin, J. G., & Nelson, R. R. (2001). Uncertainty and technological change in
medicine. Journal of Health Politics, Policy and Law, 26(5), 913-924.
Gray, W. B., & Shadbegian, R. J. (1998). Environmental regulation, investment timing, and
technology choice. The Journal of Industrial Economics, 46(2), 235-256.
Griliches, Z. (1990). Patent Statistics as Economic Indicators: A Survey. Journal of Economic
Literature, 1661-1707.
Hascic I., de Vries F., Johnstone N. and Medhi N., (2009). Effects of environmental policy on the
type of innovation: The case of automotive emission-control technologies. OECD Journal:
Economic Studies. OECD Publishing, vol. 2009(1), pages 1-18.

17
Hottenrott, H., & Rexhäuser, S. (2013). Policy-induced environmental technology and inventive
efforts: Is there a crowding out? (No. 128). DICE Discussion Paper.
Jaffe, A. B. (1986). Technological Opportunity and Spillovers of R&D: Evidence from Firms'
Patents, Profits, and Market Value. The American Economic Review, 76(5), 984-1001.
Jaffe, A. B., Newell, R. G., & Stavins, R. N. (2002). Environmental policy and technological
change. Environmental and resource economics, 22(1-2), 41-70.
Kohonen, T. (1990). The self-organizing map. Proceedings of the IEEE, 78(9), 1464-1480.
Kohonen, T. (2001). Self-organizing maps (Vol. 30). Springer Science & Business Media.
Kohonen, T. (2013). Essentials of the self-organizing map. Neural Networks, 37, 52-65.
Kneller, R., & Manderson, E. (2012). Environmental regulations and innovation activity in UK
manufacturing industries. Resource and Energy Economics, 34(2), 211-235.
Lanjouw, J. O., Pakes, A., & Putnam, J. (1998). How to count patents and value intellectual
property: The uses of patent renewal and application data. The Journal of Industrial Economics,
46(4), 405-432.
Laperche, B., Lefebvre, G., & Langlet, D. (2011). Innovation strategies of industrial groups in the
global crisis: Rationalization and new paths. Technological forecasting and social change, 78(8),
1319-1331.
Lee, J., Veloso, F. M., & Hounshell, D. A. (2011). Linking induced technological change, and
environmental regulation: Evidence from patenting in the US auto industry. Research Policy, 40(9),
1240-1252
Leydesdorff, L., Alkemade, F., Heimeriks, G., & Hoekstra, R. (2014). Patents as instruments for
exploring innovation dynamics: geographic and technological perspectives on “photovoltaic cells”.
Scientometrics, 1-23.
MacQueen J. B. (1967). Some methods for classification and analysis of multivariate
observations.In Proceedings of 5th Berkeley symposium on mathematical statistics and probability,
pp. 281–297.
Mansfield, E., Rapoport, J., Romeo, A., Wagner, S., & Beardsley, G. (1977). Social and private
rates of return from industrial innovations*. The Quarterly Journal of Economics, 221-240.
Marin, G. (2014). Do Eco-Innovations harm productivity growth through crowding out? Results of
an extended CDM model for Italy. Research Policy, 43(2), 301-317.
Nelson, R.R. and Winter, S.G. (1982). An evolutionary theory of economic change. Cambridge
Mass: Harvard University Press.
Nesta, L., & Saviotti, P. P. (2005). Coherence of the knowledge base and the firm's innovative
performance: evidence from the us pharmaceutical industry. The Journal of Industrial Economics,
53(1), 123-142.
OECD (2009), Patent Statistics Manual, OECD, Paris.
Oltra, V., & Saint Jean, M. (2009). Variety of technological trajectories in low emission vehicles
(LEVs): a patent data analysis. Journal of Cleaner Production, 17(2), 201-213.
Pakes, A. (1985). On Patents, R & D, and the Stock Market Rate of Return. The Journal of Political
Economy, 390-409.
Peri, G. (2005). Determinants of knowledge flows and their effect on innovation. Review of
Economics and Statistics, 87(2), 308-322.
18
Popp, D. (2002). Induced Innovation and Energy Prices. American Economic Review, 92(1), 160-
180.
Popp, D. (2005). Lessons from patents: using patents to measure technological change in
environmental models. Ecological Economics, 54(2), 209-226.
Popp, D., Newell, R. G., & Jaffe, A. B. (2010). Energy, the Environment, and Technological
Change. Handbook of the Economics of Innovation, 2, 873-937.
Popp, D., & Newell, R. (2012). Where does energy R&D come from? Examining crowding out
from energy R&D. Energy Economics, 34(4), 980-991.
Porter, M. E., & Van der Linde, C. (1995). Toward a new conception of the environment-
competitiveness relationship. Journal of economic perspectives, 9, 97-118.
Rennings, K., Markewitz, P., & Vögele, S. (2013). How clean is clean? Incremental versus radical
technological change in coal-fired power plants. Journal of Evolutionary Economics, 23(2), 331-
355.
Scherer, F. M. (1982). Inter-industry technology flows in the United States. Research policy, 11(4),
227-245.
Vesanto J. (1999). SOM-based data visualisation methods. Intelligent Data Analysis, vol. 3, pp.
111-126.
van den Bergh, J. C. (2013). Environmental and climate innovation: Limitations, policies and
prices. Technological Forecasting and Social Change, 80(1), 11-23.
Thoma, G., Torrisi, S., Gambardella, A., Guellec, D., Hall, B. H., & Harhoff, D. (2010).
Harmonizing and combining large datasets–an application to firm-level patent and accounting data
(No. w15851). National Bureau of Economic Research.
19
Figures
Figure 1 – Green and non-green patent trends and percentage of green patents over total yearly patents
Figure 2 – Steps of SOM algorithm
0
0.02
0.04
0.06
0.08
0.1
0.12
0%
10%
20%
30%
40%
50%
60%
70%
80%
90%
100%
1977 1979 1981 1983 1985 1987 1989 1991 1993 1995 1997 1999 2001 2003 2005 2007 2009G
reen
(n
on
-gre
en)
pat
ents
/ t
ota
l pat
ents
(al
l yea
rs)
% o
f gr
een
pat
ents
on
to
tal y
earl
y p
aten
ts
% non-green patents (single year)
% green patents (single year)
% non-green patents (all year)
% green patents (all year)

20
Figure 3 – Unified-distance matrix and clustering results
a)
b)
Figure 4 – Average post-tax fuel price between premium unleaded 95 RON and diesel in OECD countries
Source: Own figure using data from IEA
0
0.2
0.4
0.6
0.8
1
1.2
1.4
1.6
1980 1982 1984 1986 1988 1990 1992 1994 1996 1998 2000 2002 2004 2006 2008 2010 2012
Tota
l pri
ce (
USD
/un
it u
sin
g P
PP
)
21
Tables
Table 1 – Description of clusters
CL Keywords # of patents % of green patents
1 Bore, crank, pistons 760 0,00
2 Ignition, catalyst, throttle 1455 100,00
3 Tyre, rubber, pneumatics 5328 1,33 4 Injector, spark, crank 1640 0,00
5 NOx, SOx, particulate 98 0,00
6 Battery, hybrid, regeneration 699 99,86
7 Cell, cathode, anode 1598 0,31
8 NOx, catalyst, purification 514 98,25
9 Gear, stator, transmission 174 100,00
10 Spark, battery, octane 347 100,00
11 Wiper, door, antenna 18568 0,15
12 Transmission, gear, hybrid 359 99,44
13 Stator, pole, rotor 882 0,68
14 Transmission, pulley, hydraulic 2864 1,26 15 Caliper, friction, brake 1330 0,90
16 Pointer, drowsiness, menu 1091 0,00
17 Injector, nozzle, carburetor 1673 7,23 18 Rubber, etch, windscreen 1076 0,37
19 Camshaft, rocker, crankcase 1445 0,14
20 Hydrogen, electrolyte, cell 525 100,00
21 Brake, master, skid 2047 0,64
22 Battery, charger, PLC 502 99,60
23 Airbag, inflate, retractor 2841 0,32 24 Suspensions, strut, axle 1001 0,00
25 Muffler, catalyst, silencer 357 0,00
26 Cruise, yaw, headway 604 0,00
27 Turbocharger, supercharger, swirl 1115 100,00
28 Robot, crawler, roof 1758 0,23
29 Rubber, flywheel, diaphragm 571 0,00 30 Oxide, palladium, acid 328 0,00
31 Catalyst, NOx, purification 820 100,00
Total 54370 12,52
Table 3 – Descriptive statistics
Gr. vs. Non-Gr
Variable Obs Mean Std. Dev. Min Max CO 5670 -2.233774 11.27849 -80.25 43
EP (t-1) 5670 1.037521 .4561879 .1190692 2.337916 PROX (t-1) 5670 71.1831 161.6976 0 2412.939
CIT (t-1) 5670 .9640212 4.023495 0 82
F (t-1) 5670 3.183774 2.92954 0 18 PS ng (t-1) 5670 287.1834 579.0677 0 4769.544
PS g (t-1) 5670 68.0297 83.43386 0 478.0059
Gr. vs. Gr
Variable Obs Mean Std. Dev. Min Max CO 2430 2.834568 3.325596 0 24
EP (t-1) 2430 1.00259 .4640165 .1162741 2.200845
PROX (t-1) 2430 38.94946 87.48263 0 1050.328
CIT (t-1) 2430 2.453498 7.494261 0 98 F (t-1) 2430 2.394239 2.485058 0 12
PS g (t-1) 2430 68.0297 83.44367 0 478.0059
22
Table 4 – Correlation matrix
Gr. vs. Non-Gr
Variable 1 2 3 4 5 6 EP (t-1) 1
PROX (t-1) 0.2137 1 CIT (t-1) 0.0662 0.2000 1
NoF (t-1) 0.6039 0.3861 0.2257 1
PS ng (t-1) 0.2808 0.9053 0.1512 0.4451 1 PS g (t-1) 0.6853 0.1352 0.1465 0.7121 0.2074 1
Gr. vs. Gr
Variable 1 2 3 4 5 6 EP (t-1) 1
PROX (t-1) 0.3274 1 CIT (t-1) 0.1413 0.4954 1
NoF (t-1) 0.6954 0.5741 0.3592 1
PS g1 (t-1) 0.6758 0.5881 0.2118 0.7287 1 PS g2 (t-1) 0.6758 0.3728 0.2094 0.7287 0.4801 1
Table 5 – Main results of fixed-effects linear model
(1) (2)
Gr vs. non-Gr Gr. vs. Gr.
EP (t-1) 3.1682*** 0.6117**
(0.5538) (0.2859)
PROX (t-1) -0.2224*** 0.0008
(0.0126) (0.0028)
CIT (t-1) -0.1062* -0.0266**
(0.0627) (0.0108)
NoF (t-1) 0.0189 -0.0010
(0.0978) (0.0652)
PS g (t-1)a 0.0924*** 0.0162***
(0.0039) (0.0038)
PS ng (t-1) -0.0091* 0.0175***
(0.0046) (0.0032)
_cons 490.1122 312.9676
(512.3644) (326.4627)
N 5670 2430 r2 0.4450 0.4485
F 9.0944 11.6531
The two columns refer to the hypotheses tested above. Gr vs. non-Gr tests the dynamics of research efforts between green and non-green, whereas Gr vs. Gr tests
the hypothesis that green research efforts drive away other green research efforts.
Dependent variable: 4-years moving average. a In the first column the patent stock is calculated on green and non-green clusters.
In the second column, even if we maintained same variable names, the clusters are
both green. Robust standard errors in parentheses. * p < 0.10, ** p < 0.05, *** p < 0.01

23
Table 6 – Correlation between percentage of patents per year in each environmental inventive activity.
Correlation matrix 1986-1993
End-of-
pipe
EV HV FCV
End-of-
pipe
1.00
EV -0.92 1.00
(0.00)
HV -0.01 -0.35 1.00
(0.99) (0.39)
FCV -0.25 0.08 0.04 1.00
(0.54) (0.86) (0.93)
Correlation matrix 1994-2001
End-of-
pipe
1.00
EV -0.02 1.00
(0.97)
HV -0.79 -0.42 1.00
(0.02) (0.30)
FCV -0.63 -0.53 0.51 1.00
(0.09) (0.18) (0.20)
Correlation matrix 2002-2009
End-of-pipe
1.00
EV -0.71 1.00 (0.05)
HV -0.36 -0.31 1.00
(0.39) (0.45)
FCV -0.70 0.20 0.30 1.00
(0.05) (0.64) (0.48)
24
Table 7 – Model results using different moving averages (3, 4, 5 years)
Gr vs. non-Gr Gr vs. Gr
3 Years MA 4 Years MA 5 Years MA 3 Years MA 4 Years MA 5 Years MA
EP (t-1) 2.2945*** 3.1682*** 4.4813*** 0.9014** 0.6117** -0.1426 (0.6071) (0.5538) (0.5140) (0.3504) (0.2859) (0.2344)
PROX (t-1) -0.2438*** -0.2224*** -0.1914*** 0.0000 0.0008 0.0064*** (0.0127) (0.0126) (0.0107) (0.0035) (0.0028) (0.0023)
CIT (t-1) -0.1447** -0.1062* -0.0773 0.0018 -0.0266** -0.0128 (0.0706) (0.0627) (0.0530) (0.0138) (0.0108) (0.0100)
NoF (t-1) 0.0583 0.0189 0.0328 -0.0640 -0.0010 0.0361 (0.1105) (0.0978) (0.0837) (0.0782) (0.0652) (0.0510)
PS g (t-1) 0.1175*** 0.0924*** 0.0681*** 0.0138*** 0.0162*** 0.0067** (0.0038) (0.0039) (0.0039) (0.0050) (0.0038) (0.0033)
PS ng (t-1) -0.0273*** -0.0091* -0.0011 0.0137*** 0.0175*** 0.0114***
(0.0049) (0.0046) (0.0036) (0.0044) (0.0032) (0.0031)
_cons 379.5873 490.1122 343.6314 -50.0743 312.9676 192.1476 (475.8532) (512.3644) (329.6404) (231.8723) (326.4627) (195.2385)
N 5670 5670 5670 2430 2430 2430
r2 0.4558 0.4450 0.4331 0.3575 0.4485 0.3868 F 6.7908 9.0944 12.2547 9.3342 11.6531 11.1085
The two columns refer to the hypotheses tested above. Gr vs. non-Gr tests the
dynamics of research efforts between green and non-green, whereas Gr vs. Gr tests the hypothesis that green research efforts drive away other green research efforts.
Dependent variable: 3, 4, 5 years moving average. Robust standard errors in
parentheses. * p < 0.10, ** p < 0.05, *** p < 0.01
Table 8 – Model results using a different policy variable
Gr vs. Non Gr Gr. vs. Gr
EP_all (t-1) 3.2838*** 0.6573**
(0.5533) (0.2817)
PROX (t-1) -0.2224*** 0.0008
(0.0126) (0.0028)
CIT (t-1) -0.1053* -0.0264**
(0.0627) (0.0108)
NoF (t-1) 0.0223 0.0008
(0.0977) (0.0651)
PS g (t-1) 0.0924*** 0.0160***
(0.0039) (0.0038)
PS ng (t-1) -0.0101** 0.0174***
(0.0047) (0.0032)
_cons 473.3723 311.8109
(511.7267) (326.1725)
N 5670 2430 r2 0.4452 0.4486
F 9.0745 11.6255
The two columns refer to the hypotheses tested above. Gr vs. non-Gr tests the dynamics of research efforts between green and non-green, whereas Gr vs. Gr tests
the hypothesis that green research efforts drive away other green research efforts. Dependent variable: 4-years moving average. Robust standard errors in
parentheses. * p < 0.10, ** p < 0.05, *** p < 0.01
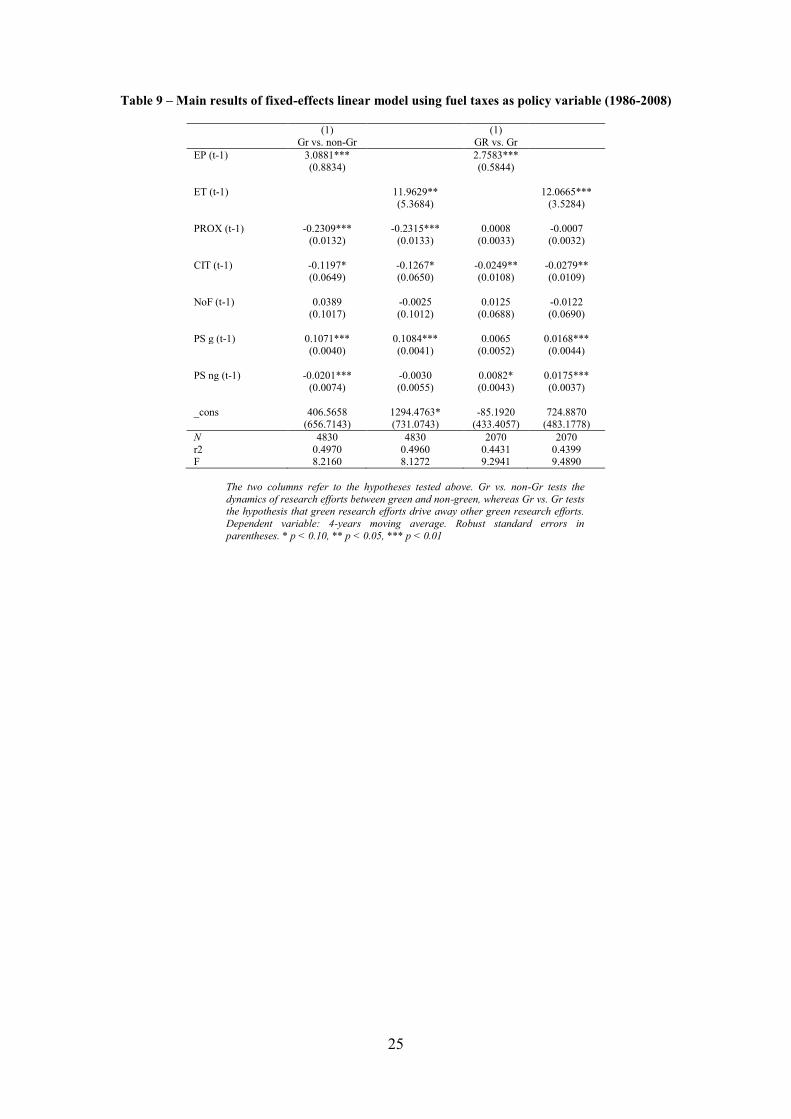
25
Table 9 – Main results of fixed-effects linear model using fuel taxes as policy variable (1986-2008)
(1) (1)
Gr vs. non-Gr GR vs. Gr
EP (t-1) 3.0881*** 2.7583*** (0.8834) (0.5844)
ET (t-1) 11.9629** 12.0665*** (5.3684) (3.5284)
PROX (t-1) -0.2309*** -0.2315*** 0.0008 -0.0007 (0.0132) (0.0133) (0.0033) (0.0032)
CIT (t-1) -0.1197* -0.1267* -0.0249** -0.0279** (0.0649) (0.0650) (0.0108) (0.0109)
NoF (t-1) 0.0389 -0.0025 0.0125 -0.0122 (0.1017) (0.1012) (0.0688) (0.0690)
PS g (t-1) 0.1071*** 0.1084*** 0.0065 0.0168***
(0.0040) (0.0041) (0.0052) (0.0044)
PS ng (t-1) -0.0201*** -0.0030 0.0082* 0.0175*** (0.0074) (0.0055) (0.0043) (0.0037)
_cons 406.5658 1294.4763* -85.1920 724.8870 (656.7143) (731.0743) (433.4057) (483.1778)
N 4830 4830 2070 2070
r2 0.4970 0.4960 0.4431 0.4399 F 8.2160 8.1272 9.2941 9.4890
The two columns refer to the hypotheses tested above. Gr vs. non-Gr tests the
dynamics of research efforts between green and non-green, whereas Gr vs. Gr tests the hypothesis that green research efforts drive away other green research efforts.
Dependent variable: 4-years moving average. Robust standard errors in
parentheses. * p < 0.10, ** p < 0.05, *** p < 0.01