Environmental Performance in Low Carbon Electricity Systems
63
Case Studies with the Ecodesign Toolbox 3 Developed for European Copper Institute (ECI) Brussels, Belgium Evaluating Environmental Performance in Low-Carbon Energy Systems March 2009
-
Upload
hans-de-keulenaer -
Category
Documents
-
view
217 -
download
0
Transcript of Environmental Performance in Low Carbon Electricity Systems
8/14/2019 Environmental Performance in Low Carbon Electricity Systems
http://slidepdf.com/reader/full/environmental-performance-in-low-carbon-electricity-systems 1/63
Case Studies with theEcodesign Toolbox 3
Developed for
European Copper Institute (ECI)Brussels, Belgium
Evaluating Environmental Performancen Low-Carbon Energy Systems
March 2009

8/14/2019 Environmental Performance in Low Carbon Electricity Systems
http://slidepdf.com/reader/full/environmental-performance-in-low-carbon-electricity-systems 2/63
Title of the study:
Evaluating Environmental Performance in Low-Carbon Energy Systems
Client:
Sergio Ferreira
European Copper Institute
- Leonardo ENERGY Program
Avenue de Tervuren, 168
1150 Brussels
Belgium
www.eurocopper.org
www.leonardo-energy.org
Authors:
Flora VadasAlexander Stoffregen
Dr. Constantin Herrmann
PE INTERNATIONAL GmbHHauptstraße 111 – 11370771 Leinfelden – Echterdingen
Phone +49 711 341817 – 0Fax +49 711 341817 – 25
E-Mail [email protected]
Internet www.pe-international.com
8/14/2019 Environmental Performance in Low Carbon Electricity Systems
http://slidepdf.com/reader/full/environmental-performance-in-low-carbon-electricity-systems 3/63
List of Contents
3
List of Contents
List of Contents .................................................................................................................. 3
List of Figures .................................................................................................................... 5
List of Tables ..................................................................................................................... 8
Nomenclature .................................................................................................................... 9
Glossary ...................................................................................................................... 10
1 Case study 1: environmental impact of the electricity mix .............................. 11
1.1 Background & Objective ................................................................................ 11
1.2 System description ........................................................................................ 11
1.3 Results & Discussion ..................................................................................... 12
1.3.1 Primary Energy Demand (net calorific value): Figure 1-1 ............................... 12
1.3.2 Global Warming and CO2 emissions: Figure 1-2 ............................................ 13
1.3.3 Selected impact categories: Figure 1-3, Table 1-2 ......................................... 14
2 Case Study 2: Low-Energy House heating system ........................................ 16
2.1 Introduction .................................................................................................... 16
2.2 System description ........................................................................................ 16
2.3 Results & Discussion ..................................................................................... 17
2.3.1 Primary Energy Demand (net calorific value): Figure 2-1 and Figure 2-2 ....... 17
2.3.2 Global Warming and CO2 emissions: Figure 2-3 ............................................ 19
2.3.3 Selected impact categories: Figure 2-4 .......................................................... 20
2.4 Conclusions ................................................................................................... 21
3 Case Study 3: Low Energy House versus Passive House ............................. 22
3.1 Introduction .................................................................................................... 22
3.2 System description ........................................................................................ 22
3.3 Results & Discussion ..................................................................................... 23
3.3.1 Primary Energy Demand (net calorific value): Figure 3-1 and Figure 3-2 ....... 23
3.3.2 Global Warming and CO2 emissions: Figure 3-3 ............................................ 24
3.3.3 Selected impact categories: Figure 3-4 .......................................................... 25
3.4 Conclusions ................................................................................................... 26
4
Case Study 4: Primary Energy versus Global Warming ................................. 27
4.1 Introduction .................................................................................................... 27
4.2 System description ........................................................................................ 27
4.3 Results .......................................................................................................... 28
4.3.1 Primary Energy Demand (net calorific value, in MJ): Figure 4-1 andFigure 4-2 ...................................................................................................... 28
4.3.2 Global Warming and CO2 emissions: Figure 4-3 ............................................ 28
4.3.3 Selected impact categories: Figure 4-4 .......................................................... 30
4.4 Conclusions ................................................................................................... 31
5 Case Study 5: Investment into higher efficiency motors or wind turbines ....... 33
5.1 Introduction .................................................................................................... 33
5.2 System description ........................................................................................ 33
8/14/2019 Environmental Performance in Low Carbon Electricity Systems
http://slidepdf.com/reader/full/environmental-performance-in-low-carbon-electricity-systems 4/63
List of Contents
4
5.2.1 Wind turbine Life Cycle Costing (LCC)........................................................... 33
5.2.2 Electric motor LCC......................................................................................... 34
5.3 Results & Discussion ..................................................................................... 35
5.3.1 Primary Energy Demand reduction (net calorific value, in MJ): Figure 5-2 ..... 36
5.3.2 Global Warming and CO2 emission reduction: Figure 5-3 .............................. 37
5.3.3 Reduction in selected impact categories: Figure 5-4 ...................................... 37
5.4 Conclusions ................................................................................................... 38
6 Case Study 6: building a new house for 1 million Euros ................................. 40
6.1 Introduction .................................................................................................... 40
6.2 System description ........................................................................................ 40
6.3 Life Cycle Costing (LCC) of the LEH and the PH ........................................... 41
6.3.1 System A: Construction costs only ................................................................. 41
6.3.2 System B: Construction and use phase costs ................................................ 42
6.4 Results & Discussion ..................................................................................... 42
6.4.1 Primary Energy Demand (PED) reduction (net calorific value, in MJ):Figure 6-1, Figure 6-2 and Figure 6-3 ............................................................ 42
6.4.2 Global Warming and CO2 emission reduction: Figure 6-3 and Figure 6-4 ...... 49
6.4.3 Reduction in selected impact categories: Figure 6-4 ...................................... 51
6.5 Conclusions ................................................................................................... 52
7 Case Study 7: renovating/improving a standard house for 1 million Euros ..... 54
7.1 Introduction .................................................................................................... 54
7.2 System description ........................................................................................ 54
7.3 Life Cycle Costing (LCC) of the scenarios ..................................................... 55
7.3.1 LCC for construction only............................................................................... 55
7.3.2 LCC for construction plus use phase ............................................................. 55
7.4 Results & Discussion ..................................................................................... 56
7.4.1 Primary Energy Demand (PED) reduction (net calorific value, in MJ):Figure 7-1 ...................................................................................................... 56
7.4.2 Global Warming and CO2 emission reduction: Figure 7-2 .............................. 57
7.4.3 Reduction in selected impact categories: Figure 7-3 ...................................... 58
7.5 Conclusions ................................................................................................... 59
Literature ...................................................................................................................... 60 Supplement A Parameter settings of the 3 housing types (all row houses with
buildings on either sides) ............................................................................... 61

8/14/2019 Environmental Performance in Low Carbon Electricity Systems
http://slidepdf.com/reader/full/environmental-performance-in-low-carbon-electricity-systems 5/63
List of Figures
5
List of Figures
Figure 1-1: Primary Energy Demand (net calorific value, in MJ) of producing
1kWh power, as contributed by renewable and non-renewableenergy sources .....................................................................................12
Figure 1-2: Global Warming Potential (kg CO2-equiv.) and CO2 emissions(kg) from the production of 1kWh power ...............................................14
Figure 1-3: Relative contribution of 1kWh of power provision to selectedimpact categories; ................................................................................15
Figure 2-1: Primary Energy Demand (net calorific value, in GJ) over the lifecycle of the house, as contributed by renewable and non-renewable energy sources ....................................................................18
Figure 2-2: Primary Energy Demand (net calorific value, in GJ) of the life cyclephases of the house, as contributed by renewable and non-renewable energy sources. The manufacture phase contribution isshown only once, since it is the same for all scenarios. ........................19
Figure 2-3: Global Warming Potential (ton CO2-eq.) and CO2 emissions (ton)throughout the life cycle of the house ...................................................20
Figure 2-4: Relative contribution of the houses with different heatingequipment to selected impact categories. The gas condensing
heater with current grid mix scenario represents 100%.........................21
Figure 3-1: Primary Energy Demand (net calorific value, in GJ) over the lifecycle of the house, as contributed by renewable and non-renewable energy sources ....................................................................24
Figure 3-2: Primary Energy Demand (net calorific value, in GJ) over the lifecycle of the house, as contributed by house manufacture, gasheater life cycle and electric equipment (heat pump and ventilator)life cycle ...............................................................................................24
Figure 3-4: Relative contribution of the housing types to selected impact
categories. The LH with current grid mix conditions represents100%. ...................................................................................................26
Figure 4-1: Primary Energy Demand (net calorific value, in GJ) over the lifecycle of the house, as contributed by renewable and non-renewable energy sources ....................................................................29
Figure 4-2: Primary Energy Demand (net calorific value, in GJ) over the lifecycle of the house, as contributed by house manufacture, gasheater life cycle and electric equipment (heat pump and ventilator)life cycle ...............................................................................................29
Figure 4-3: Emissions of CO2 and other greenhouse gases (ton CO2-equiv.) .........30
8/14/2019 Environmental Performance in Low Carbon Electricity Systems
http://slidepdf.com/reader/full/environmental-performance-in-low-carbon-electricity-systems 6/63
List of Figures
6
Figure 4-4: Relative contribution of the houses fitted with various heatingequipment to selected impact categories. The LEH with currentgrid mix represents 100%. ....................................................................31
Figure 5-1:
Left: Relative GWP (in kg CO2-equivalents) contributed by themanufacture and use phases of the scenarios considered; Right:Relative PED (net calorific value, MJ) contributed by themanufacture and use phases of the scenarios considered. ..................35
Figure 5-2: Reduction of PED (net calorific value, in GJ) by investment intowind turbine or higher efficiency e-motors. E-motor scenarios (a)exclude costs of electricity for running the motors, scenarios (b)include costs of electricity. ....................................................................36
Figure 5-3: Reduction of CO2(-equivalent) emissions (ton) by investment into
wind turbines or higher efficiency e-motors. E-motor scenarios (a)exclude costs of electricity for running the e-motors, scenarios (b)include costs of electricity. ....................................................................37
Figure 5-4: Relative reduction in selected impact categories by investment intowind turbines or higher efficiency e-motors. The reduction by thewind turbine scenario represents 100%. ...............................................38
Figure 6-1: Primary Energy Demand (GJ, net calorific value) of the varioushousing options. ...................................................................................43
Figure 6-2: Global Warming Potential (ton CO2-eq.) and CO2 emissions (both
in tonnes) .............................................................................................45 Figure 6-3: Contribution of the five housing types to selected impact
categories. ............................................................................................45 Figure 6-4: Primary Energy (net calorific value, in GJ) reduction in the various
investment scenarios and their life cycle phases (total life cycleimpacts are shown in red). ....................................................................47
Figure 6-5: Primary Energy Demand (net calorific value, in GJ) reduction in thevarious investment scenarios, showing the total PED as well as theshare of renewable and non-renewable resources. PED from
renewable resources shows a “negative reduction” to be
interpreted as an increase compared to the baseline scenario.NSH - night storage heater ...................................................................48
Figure 6-6: Net reduction of Primary Energy Demand (net calorific value, inGJ) affordable with given expenditure. Key: Blue diamonds – LEH;Red squares – PH with heat pump; Green triangles – PH with nightstorage heater (NSH). ..........................................................................49
Figure 6-7: Reduction of CO2(-equivalent) emissions (tonnes) under thevarious investment scenarios. NSH – night storage heater. ..................50
Figure 6-8: Net reduction of Global Warming Potential (in ton CO2-equivalents)affordable with given expenditure. Key: Blue diamonds – LEH; Red

8/14/2019 Environmental Performance in Low Carbon Electricity Systems
http://slidepdf.com/reader/full/environmental-performance-in-low-carbon-electricity-systems 7/63
List of Figures
7
squares – PH with heat pump; Green triangles – PH with nightstorage heater (NSH). ..........................................................................51
Figure 6-9: Reduction in selected impact categories by the various investment
scenarios. Reduction by the LEH scenario is considered as 100%in each of the impact categories, reduction by the other scenariosis given in percentages relative to this scenario. NSH – nightstorage heater. .....................................................................................52
Figure 7-1: Reduction of the Primary Energy Demand (net calorific value, GJ)of the standard house’s use phase under various scenarios.................57
Figure 7-2: Reduction of CO2(-equivalent) emissions (in tonnes) under thevarious investment scenarios. ...............................................................58
Figure 7-3: Reduction in selected impact categories by the various investment
scenarios. Reduction by the “Standard plus gas condens” scenariowith investment in construction phase only is considered as 100%in each of the impact categories. Reduction by the other scenariosis given in percentages relative to this scenario. ...................................59

8/14/2019 Environmental Performance in Low Carbon Electricity Systems
http://slidepdf.com/reader/full/environmental-performance-in-low-carbon-electricity-systems 8/63
List of Tables
8
List of Tables
Table 1-1: Share of renewable and non-renewable energy sources for the
power grid mixes in the four scenarios under investigation. ..................11
Table 1-2: Contribution of producing 1kWh electric power to selected impactcategories. ............................................................................................15
Table 2-1: Scenarios of heating equipment and grid mix .......................................17
Table 3-1: Scenarios considered in Case Study 3. ................................................23
Table 4-1: Scenarios considered in Case Study 4 .................................................28
Table 5-1: Efficiency scenarios of the e-motor (11kW, 4 poles) .............................34
Table 5-2:
LCC of the e-motors in the different efficiency scenarios. Figuresare taken from ECOMOTORS2008, but the costs of electric powerare excluded since these depend on the amount used, and this willbe calculated anew in this study. ..........................................................34
Table 6-1: Basic settings of the systems considered in case study 6 .....................41
Table 6-2: Construction costs of the two housing types considered. ......................42
Table 6-3: Use phase costs of the various building types, each 130m2. Key:PH – PH with heat pump, PH (NSH) – PH with night storageheater, Standard – standard house with conventional gas boiler. .........42
Table 7-1: Basic parameters of the scenarios of case study 7. ..............................55
Table 7-2: Costs of construction of the improvement options .................................55
Table 7-3: Costs and savings of the use phase of improvement options ...............56

8/14/2019 Environmental Performance in Low Carbon Electricity Systems
http://slidepdf.com/reader/full/environmental-performance-in-low-carbon-electricity-systems 9/63

8/14/2019 Environmental Performance in Low Carbon Electricity Systems
http://slidepdf.com/reader/full/environmental-performance-in-low-carbon-electricity-systems 10/63
Glossary
10
Glossary
Term Definition
Standard House Row house with houses attached on both sides. In general the U-value for houses after 1990 is below 0.4 W/(m2*K) (WSVO 1995 inGermany < 0.5) . See below for three examples defining someexterior walls for standard houses after 1990. Heat-absorbing glass(double) U-value 1.1 (noble gas)-1.8 (air), air exchange rate 0.7-0.5,concrete ceiling, pitched roof, heat load 70 -120 kWh/(m2*a) 1.Vertically perforated bricks 30 cm (650 kg/m3, λ= 0.12 W/(m*K)), lightmortar (700kg/m3), exterior plaster lime cement, interior plaster limegypsum U-Value 0.35-0.4 W/(m2*K); 2. sand-lime bricks 17,5 cm
(1500 kg/m3, λ= 0.75 W(m*K)) + 12cm EPS (15 kg/m3, λ= 0.035W/(m*K)) exterior plaster lime cement, interior plaster lime gypsum U-Value 0.25-0.3; 3. Aerated concrete bricks 30 cm (400 kg/m3, λ= 0.1W/(m*K)) exterior plaster lime cement, interior plaster lime gypsum U-Value 0.3-0.35 W/(m2*K).
Low-Energy House Row house with houses attached on both sides. Build after 1990, U-value exterior walls 0.15-0.30 W/(m2*K), roof 0.15-0.25 W/(m2*K),base plate 0.2-0.3 W/(m2*K), Window heat absorbing glazing (doubleor triple), noble gas) U-Value 0.7-1.4 W/(m2*K), mechanicalventilation, sometimes with heat recovery, air exchange rate 0.6, heatdemand 15-60 kWh/(m2*a). Examples for exterior walls: wooden
wallboard, sand-lime bricks + isolation, aerated concrete + isolation.Passive House Row house with houses attached on both sides. Build after 1990, U-
value exterior walls < 0.15 W/(m2*K), roof < 0.15 W/(m2*K), baseplate <0.16 W/(m2*K), Window heat absorbing glazing (triple) U-Value<0.8W/(m2*K), mechanical ventilation with heat recovery, efficiencyfor heat recovery > 80%), air exchange rate 0.6, heat demand <15kWh/(m2*a). Examples for exterior walls: wooden wallboard including25 cm mineral wool and more, 15 cm sand-lime bricks with 30 cmEPS, 24 cm aerated concrete + 20 cm mineral wool
8/14/2019 Environmental Performance in Low Carbon Electricity Systems
http://slidepdf.com/reader/full/environmental-performance-in-low-carbon-electricity-systems 11/63
11
1 Case study 1: environmental impact of the electricity mix
1.1 Background & Objective
Case study 1 was constructed with the intention of assessing how the choice of powergrid mix influences the environmental impact of producing electricity. Electric power canbe produced from various renewable and non-renewable resources, and the technologiesto harvest renewable resources are gaining momentum, together with the global pressureto increase their contribution to energy provision. In the EU targets have been set for 2020to generate 20% of the total energy demand from renewable resources. National schemeshave been set up to reach this overall goal, stricter for the more advanced andeconomically stable nations and laxer for the economically more disadvantaged ones.Although the target is very demanding, the potential benefits are likely to compensate forthe efforts within a short time. In this theoretical exercise, the environmental impact of the
current grid mix is assessed against potential future scenarios of electricity production in2020, 2030 and under conditions of “zero carbon” emissions. The baseline for thecomparison is the provision of 1kWh of electric power.
1.2 System description
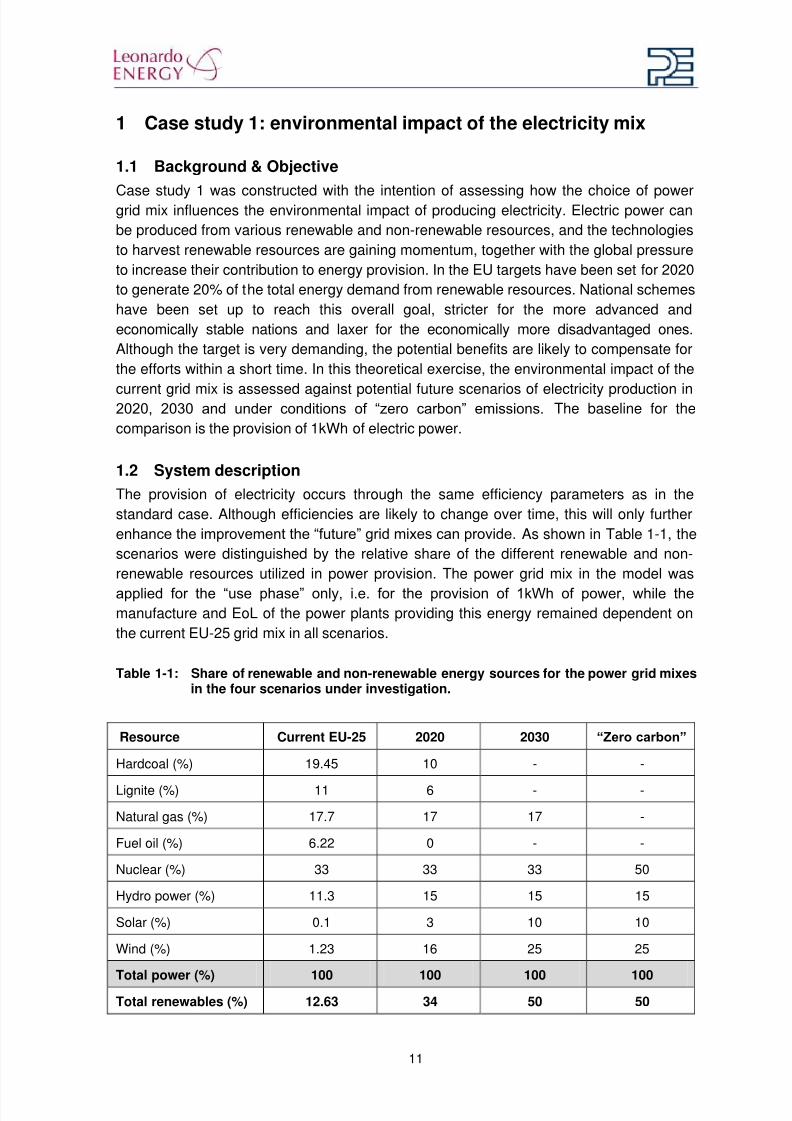
The provision of electricity occurs through the same efficiency parameters as in thestandard case. Although efficiencies are likely to change over time, this will only furtherenhance the improvement the “future” grid mixes can provide. As shown in Table 1-1, thescenarios were distinguished by the relative share of the different renewable and non-renewable resources utilized in power provision. The power grid mix in the model was
applied for the “use phase” only, i.e. for the provision of 1kWh of power, while the
manufacture and EoL of the power plants providing this energy remained dependent onthe current EU-25 grid mix in all scenarios.
Table 1-1: Share of renewable and non-renewable energy sources for the power grid mixesin the four scenarios under investigation.
Resource Current EU-25 2020 2030 “Zero carbon”
Hardcoal (%) 19.45 10 - -
Lignite (%) 11 6 - -
Natural gas (%) 17.7 17 17 -
Fuel oil (%) 6.22 0 - -
Nuclear (%) 33 33 33 50
Hydro power (%) 11.3 15 15 15
Solar (%) 0.1 3 10 10
Wind (%) 1.23 16 25 25
Total power (%) 100 100 100 100Total renewables (%) 12.63 34 50 50

8/14/2019 Environmental Performance in Low Carbon Electricity Systems
http://slidepdf.com/reader/full/environmental-performance-in-low-carbon-electricity-systems 12/63
12
The definition of the current EU-25 grid mix is based on the latest GaBi standard dataset.The inventory is based on measured operating data taken from national statistics,literature and / or calculated via energy carrier composition in combination with (literature-based) combustion models.
Since the futuristic scenarios described in Table 1-1 are merely targets and intentions, thenumbers in the table are barely more than projections and assumptions based on currenttrends and an optimistic outlook. As for the 2020 grid mix, some of the numbers weretaken from the recommendations made by the Renewable Energy Road Map of theCommission of European Communities. The “Zero Carbon” scenario is only figurative of a
“near -zero-CO2-emissions” situation, not being necessarily realistic.
1.3 Results & Discussion
The results clearly demonstrate that with an increasing share of renewable energy
sources, the environmental impact of power provision will decrease.
1.3.1 Primary Energy Demand (net calorific value): Figure 1-1
Primary Energy Demand (PED) will decrease linearly, with an increasing share ofrenewables. The reason is that renewable energy sources, such as the energy ofsolar irradiation, wind and water, is considered a virtually unlimited supply andtherefore, the losses incurred due to low efficiencies are not fully considered asconsumed primary energy. With as little as one third of renewable share in powerprovision (2020 grid mix), over 1MJ is saved for every kWh used; with half of theenergy coming from renewables (2030 grid mix), 2.5 MJ are saved for every kWh
used.
0
2
4
6
8
10
12
14
Current EU25 2020 2030 Zero Carbon P r i m a r y E n e r g
y D e m a n d ( n e t c a l .
v a
l u e , M J )
Primary energy f rom non-renewable resources (net cal. value) [MJ]
Primary energy from renewable resources (net cal. value) [MJ]
Figure 1-1: Primary Energy Demand (net calorific value, in MJ) of producing 1kWh power,
as contributed by renewable and non-renewable energy sources
The “green” share of PED in the figure quantifies the energy coming directly from a
renewable resource such as wind or solar irradiation. In order to produce 1MJ ofpower from a wind power plant, there is a certain share of energy required formanufacturing the plant (the value of which diminishes the longer it is in use) and

8/14/2019 Environmental Performance in Low Carbon Electricity Systems
http://slidepdf.com/reader/full/environmental-performance-in-low-carbon-electricity-systems 13/63
13
maintaining it. This energy derives largely from the power grid mix, and isunchanged throughout the scenarios, and therefore part of this energy is non-renewable. In addition, as mentioned before, the losses incurred in producingrenewable energy are not fully considered, while these amount to ca. 60-70% of
the PED in case of non-renewable power generation. The effect is that the shareof non-renewables is much higher in the PED calculation than in Table 1-1describing the contribution of power plants in the grid mix.
With an equal share of renewables, but substituting natural gas with nuclearpower, the efficiency of power generation decreases, resulting in a higher PED inthe “zero carbon” scenario.
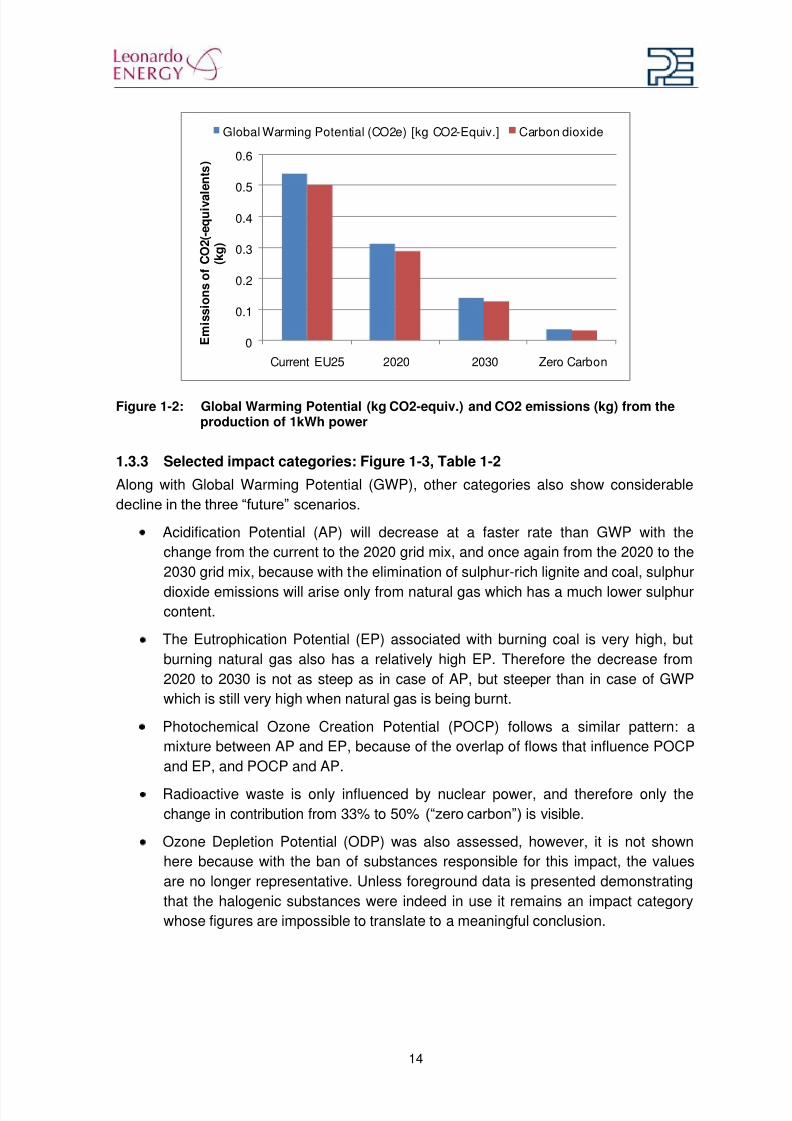
1.3.2 Global Warming and CO2 emissions: Figure 1-2
CO2 and other greenhouse gas emissions will also be decreasing linearly with the
increasing share of renewable, although at a considerably faster pace. For eachkWh used one would be able to save 0.2kg CO2 emissions with the 2020 scenariocoming true, and almost 0.4kg with the realization of the 2030 scenario. Thismeans 4kg to 8kg of CO2 emissions saved per day and per household countingwith ca. 20kWh used in an average household per day [PE INTERNATIONAL 2009].
In case of substituting the 17% of fossil fuel-based resources still present in the2030 grid mix with nuclear power (“zero carbon” scenario), the CO2 emissionsamount to only 7% of the current grid mix emissions. Although this scenario iscalled “zero carbon”, carbon dioxide emissions cannot be completely avoided - theGaBi model includes not only the use but also the manufacture of the power plants
and their maintenance. These processes, as mentioned in section 1.2, rely on bothliquid fuels for transport and power from the current grid mix, rather than from thenew one.
8/14/2019 Environmental Performance in Low Carbon Electricity Systems
http://slidepdf.com/reader/full/environmental-performance-in-low-carbon-electricity-systems 14/63
14
0
0.1
0.2
0.3
0.4
0.5
0.6
Current EU25 2020 2030 Zero Carbon
E m i s s i o n s o f C O 2 ( - e q u i v a l e n t s )
( k g )
Global Warming Potential (CO2e) [kg CO2-Equiv.] Carbon dioxide
Figure 1-2: Global Warming Potential (kg CO2-equiv.) and CO2 emissions (kg) from the
production of 1kWh power
1.3.3 Selected impact categories: Figure 1-3, Table 1-2
Along with Global Warming Potential (GWP), other categories also show considerabledecline in the three “future” scenarios.
Acidification Potential (AP) will decrease at a faster rate than GWP with thechange from the current to the 2020 grid mix, and once again from the 2020 to the2030 grid mix, because with the elimination of sulphur-rich lignite and coal, sulphur
dioxide emissions will arise only from natural gas which has a much lower sulphurcontent.
The Eutrophication Potential (EP) associated with burning coal is very high, butburning natural gas also has a relatively high EP. Therefore the decrease from2020 to 2030 is not as steep as in case of AP, but steeper than in case of GWPwhich is still very high when natural gas is being burnt.
Photochemical Ozone Creation Potential (POCP) follows a similar pattern: amixture between AP and EP, because of the overlap of flows that influence POCPand EP, and POCP and AP.
Radioactive waste is only influenced by nuclear power, and therefore only thechange in contribution from 33% to 50% (“zero carbon”) is visible.
Ozone Depletion Potential (ODP) was also assessed, however, it is not shownhere because with the ban of substances responsible for this impact, the valuesare no longer representative. Unless foreground data is presented demonstratingthat the halogenic substances were indeed in use it remains an impact categorywhose figures are impossible to translate to a meaningful conclusion.

8/14/2019 Environmental Performance in Low Carbon Electricity Systems
http://slidepdf.com/reader/full/environmental-performance-in-low-carbon-electricity-systems 15/63
15
Table 1-2: Contribution of producing 1kWh electric power to selected impact categories.
Environmental Quantities Current EU-25 2020 2030 Zero carbon
GWP (CO2e) [kg CO2-Equiv.] 5.39E-01 3.12E-01 1.38E-01 3.54E-02
AP [kg SO2-Equiv.] 2.86E-03 1.42E-03 2.52E-04 1.51E-04
EP [kg Phosphate-Equiv.] 1.29E-04 7.00E-05 2.56E-05 1.25E-05
ODP [kg R11-Equiv.] 1.31E-07 1.31E-07 1.31E-07 1.98E-07
POCP [kg Ethene-Equiv.] 1.67E-04 8.71E-05 2.36E-05 1.02E-05
Radioactive waste (kg) 1.75E-03 1.75E-03 1.75E-03 2.65E-03
0%
20%
40%
60%
80%
100%
120%
140%
GWP (CO2e) [kgCO2-Equiv.]
AP [kg SO2-Equiv.] EP [kg Phosphate-Equiv.]
POCP [kg Ethene-Equiv.]
Radioactive waste(kg)
Current EU-25
2020
2030
Zero Carbon
Figure 1-3: Relative contribution of 1kWh of power provision to selected impact
categories;
8/14/2019 Environmental Performance in Low Carbon Electricity Systems
http://slidepdf.com/reader/full/environmental-performance-in-low-carbon-electricity-systems 16/63
16
2 Case Study 2: Low-Energy House heating system
2.1 Introduction
In this case study the analysis targets a comparison between heating systems in a Low-energy house. The definition of a low-energy house can be found in the Glossary. Heatingsystems today are still largely fossil fuel-based, although electric heating systems are alsogaining ground. Considerable debate surrounds the use of electric heaters versus efficient(~100%) gas heaters. While gas is the cleanest of fossil fuels with regards to emissions,and the heat gain is also very high, electric power has the potential to improve itsemission profile by the incorporation of more and more renewable resources. Today,however, electric power is both inefficient (for a single unit of usable energy produces 2units of losses) and still largely dependent on fossil fuels. In this case study the BestAvailable Technology of both heating systems will be compared, namely gas condensing
boilers and electric heat pumps . The efficiency of gas condensing boilers lies in theircapacity to capture the latent heat of water vapour produced through the burning processthat would otherwise (in older designs) escape through the vent. On the other hand, theheat pump utilizes the thermal energy in air or groundwater to pump heat into the house,and while the pumping itself requires energy, the produced thermal energy (heat) is fourtimes higher than the electricity consumed by the equipment.
In addition to comparing different heating technologies, the case study also endeavours toassess them using different “future” grid mixes (see also Case study 1: environmentalimpact of the electricity mix). “Current” scenarios refer to the use of the latest GaBi power
grid mix dataset for EU-25 countries. Therefore the analysis not only compares the best
available technologies of today, but also looks at how the relationship may change incircumstances where electric power provision will derive increasingly from renewableresources (for more information see Case study 1: environmental impact of the electricitymix). While it may seem unfair to show potential improvement for only one of thetechnologies under scrutiny, it is indeed only realistic to expect an increase in renewableenergy sources in the grid mix, while there is little to no room left for improvement in gas-based heating systems. The basis for comparison is the provision of heating for the lifecycle of the same low-energy house.
2.2 System description
All systems under investigation are based on a Low-Energy House as defined in theGlossary. The main parameters distinguishing this housing type from other houses aresummarized in 1.1.1.1Supplement A. The building of the house itself is part of the system,as well as the use phase including heating and the operation of a circulation pump andmechanical ventilation. (The latter two are electric equipment, the ventilator is required tomaintain air quality inside the tightly insulated walls of the low energy house, and can alsobe designed with a heat recovery system.) The electric and heating equipmentmanufacture and disposal are modelled as part of the use phase of the house on accountof the equipment’s function in the system. The lifetime of the house spans 50 years, all
results refer to this lifecycle unless otherwise stated.

8/14/2019 Environmental Performance in Low Carbon Electricity Systems
http://slidepdf.com/reader/full/environmental-performance-in-low-carbon-electricity-systems 17/63
17
Table 2-1: Scenarios of heating equipment and grid mix
Scenario name Heating equipment Non-renewables in gridmix
Renewables in grid mix(%)
Heat pump: Current Heat pump Oil, coal, lignite, nuclear,natural gas 12.63
Gas condens:Current
Gas condensing heater Oil, coal, lignite, nuclear,natural gas
12.63
Heat pump: 2020 Heat pump Coal, lignite, nuclear,natural gas
34
Gas condens: 2020 Gas condensing heater Coal, lignite, nuclear,natural gas
34
Heat pump: 2030 Heat pump Nuclear, natural gas 50
Gas condens: 2030 Gas condensing heater Nuclear, natural gas 50
2.3 Results & Discussion
Overall, the heat pump is the more environmentally solution, although with today’s grid
mix, the advantage is not as clear as using the “future” grid mixes.
2.3.1 Primary Energy Demand (net calorific value): Figure 2-1 and Figure 2-2
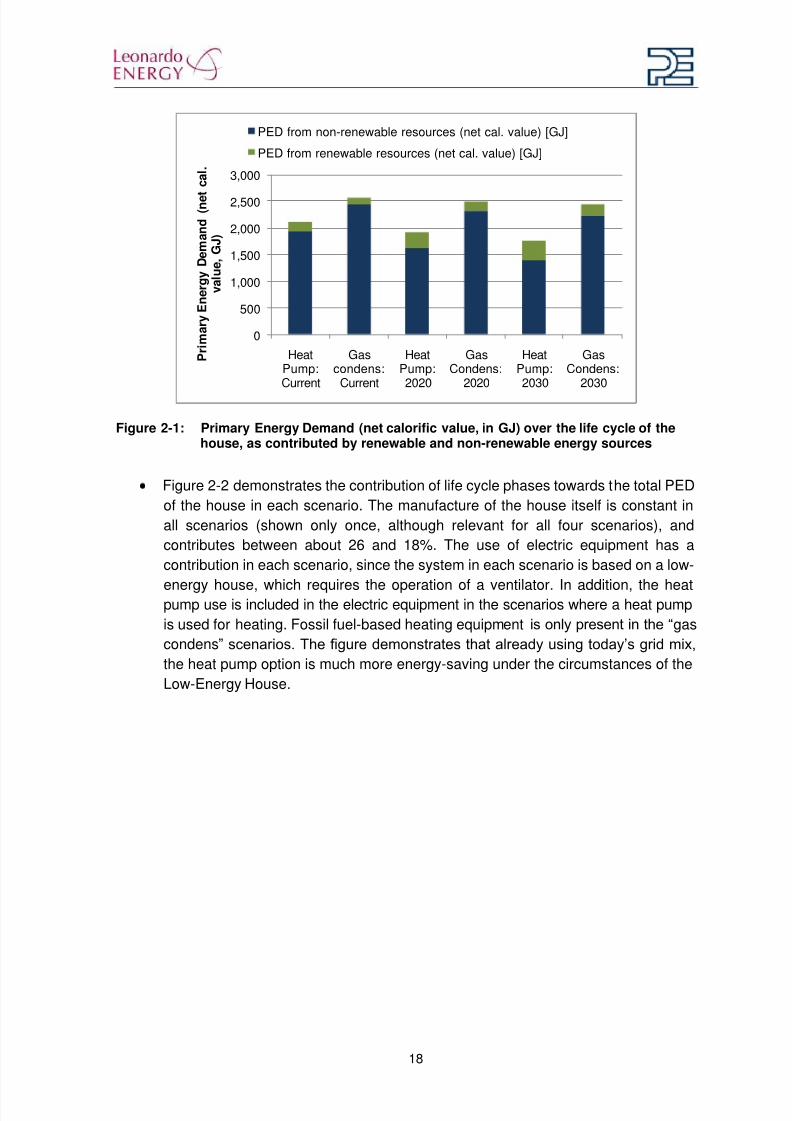
In the two “current” scenarios the Primary Energy Demand (PED) of the houseusing the heat pump is considerably lower than using the gas condensing heater,which is the best fossil fuel-based heating equipment available today. In one yearover 9GJ of PED can be saved using the heat pump, amounting to over 450 GJover the life cycle of the house
In the “future” grid mix scenarios the PED of the houses using both heatingequipments will decrease, but the house using the heat pump will benefit from thechanged grid mix to a larger extent.
8/14/2019 Environmental Performance in Low Carbon Electricity Systems
http://slidepdf.com/reader/full/environmental-performance-in-low-carbon-electricity-systems 18/63
18
0
500
1,000
1,500
2,000
2,500
3,000
HeatPump:Current
Gascondens:Current
HeatPump:2020
GasCondens:
2020
HeatPump:2030
GasCondens:
2030
P r i m a r y E n e r g y D e m a n d ( n e t c a l .
v a l u e , G J )
PED from non-renewable resources (net cal. value) [GJ]
PED from renewable resources (net cal. value) [GJ]
Figure 2-1: Primary Energy Demand (net calorific value, in GJ) over the life cycle of the
house, as contributed by renewable and non-renewable energy sources
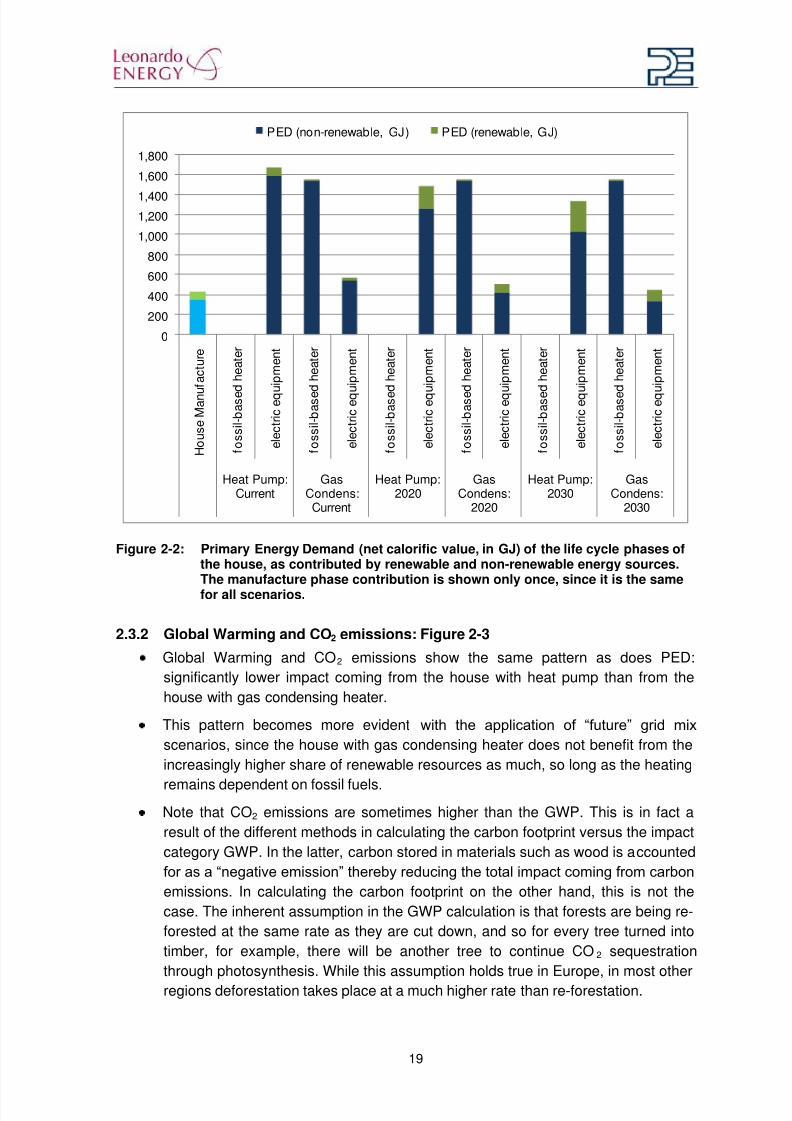
Figure 2-2 demonstrates the contribution of life cycle phases towards the total PEDof the house in each scenario. The manufacture of the house itself is constant inall scenarios (shown only once, although relevant for all four scenarios), andcontributes between about 26 and 18%. The use of electric equipment has acontribution in each scenario, since the system in each scenario is based on a low-
energy house, which requires the operation of a ventilator. In addition, the heatpump use is included in the electric equipment in the scenarios where a heat pumpis used for heating. Fossil fuel-based heating equipment is only present in the “gascondens” scenarios. The figure demonstrates that already using today’s grid mix,
the heat pump option is much more energy-saving under the circumstances of theLow-Energy House.
8/14/2019 Environmental Performance in Low Carbon Electricity Systems
http://slidepdf.com/reader/full/environmental-performance-in-low-carbon-electricity-systems 19/63
19
0
200
400
600
800
1,000
1,200
1,400
1,600
1,800
H o u s e M a n u
f a c t u r e
f o s s i l - b a s e d h e a t e r
e l e c t r i c e q u i p m e n t
f o s s i l - b a s e d h e a t e r
e l e c t r i c e q u i p m e n t
f o s s i l - b a s e d h e a t e r
e l e c t r i c e q u i p m e n t
f o s s i l - b a s e d h e a t e r
e l e c t r i c e q u i p m e n t
f o s s i l - b a s e d h e a t e r
e l e c t r i c e q u i p m e n t
f o s s i l - b a s e d h e a t e r
e l e c t r i c e q u i p m e n t
Heat Pump:Current
GasCondens:Current
Heat Pump:2020
GasCondens:
2020
Heat Pump:2030
GasCondens:
2030
PED (non-renewable, GJ) PED (renewable, GJ)
Figure 2-2: Primary Energy Demand (net calorific value, in GJ) of the life cycle phases of
the house, as contributed by renewable and non-renewable energy sources.The manufacture phase contribution is shown only once, since it is the samefor all scenarios.
2.3.2 Global Warming and CO2 emissions: Figure 2-3
Global Warming and CO2 emissions show the same pattern as does PED:significantly lower impact coming from the house with heat pump than from thehouse with gas condensing heater.
This pattern becomes more evident with the application of “future” grid mix
scenarios, since the house with gas condensing heater does not benefit from theincreasingly higher share of renewable resources as much, so long as the heating
remains dependent on fossil fuels.Note that CO2 emissions are sometimes higher than the GWP. This is in fact aresult of the different methods in calculating the carbon footprint versus the impactcategory GWP. In the latter, carbon stored in materials such as wood is accountedfor as a “negative emission” thereby reducing the total impact coming from carbon
emissions. In calculating the carbon footprint on the other hand, this is not thecase. The inherent assumption in the GWP calculation is that forests are being re-forested at the same rate as they are cut down, and so for every tree turned intotimber, for example, there will be another tree to continue CO2 sequestrationthrough photosynthesis. While this assumption holds true in Europe, in most otherregions deforestation takes place at a much higher rate than re-forestation.

8/14/2019 Environmental Performance in Low Carbon Electricity Systems
http://slidepdf.com/reader/full/environmental-performance-in-low-carbon-electricity-systems 20/63
20
0
20
40
60
80
100
120140
160
HeatPump:Current
Gascondens:Current
HeatPump:2020
GasCondens:
2020
HeatPump:2030
GasCondens:
2030
C O 2 ( - e q u i v . ) e m i s s i o n s i n t o n n e s
Carbon dioxide (ton)
Global Warming Potential (CO2e) [ton CO2-Equiv.]
Figure 2-3: Global Warming Potential (ton CO2-eq.) and CO2 emissions (ton) throughout
the life cycle of the house
2.3.3 Selected impact categories: Figure 2-4
Acidification Potential (AP) demonstrates a slightly different pattern than was seenfrom the PED and GWP figures. Compared with the house using the heat pump,the house that uses gas condensing heating has about 40% lower impact whenthe current grid mix is applied. Using the 2020 grid mix the heat pump still has a
higher impact, but using the 2030 grid mix, heat pump becomes more beneficialfor the environment. The reason for this is the low sulphur-content of natural gasfuelling the boiler, while high-sulphur containing fuels (like coal and lignite) are stillincluded in the current and the 2020 grid mix (see also Case study 1:environmental impact of the electricity mix). In the 2030 grid mix natural gas is theonly fossil fuel, and since this resource constitutes only 17% of the grid, the impactof the heat pump becomes lower than that of the gas boiler.
Eutrophication Potential (EP) demonstrates a similar but attenuated pattern: whileusing the current grid mix the gas heater is more advantageous, already in 2020the heat pump becomes more beneficial. This is due to the fact that emissions of
nitrogen oxides are associated with all fossil fuel burning processes and thereforeonly their complete elimination will decrease the EP impact category substantially.
Photochemical Ozone Creation Potential (POCP) is influenced by NOx emissionsas well, and therefore the pattern is very similar as with EP.

8/14/2019 Environmental Performance in Low Carbon Electricity Systems
http://slidepdf.com/reader/full/environmental-performance-in-low-carbon-electricity-systems 21/63
21
0%
20%
40%
60%
80%
100%
120%
140%
160%
180%
Acidif ication Potential[kg SO2-Equiv.]
EutrophicationPotential [kg
Phosphate-Equiv.]
Global WarmingPotential (CO2e) [kg
CO2-Equiv.]
Photochem. OzoneCreation Potential [kg
Ethene-Equiv.]
Gas condens: Current Heat Pump: Current
Gas Condens: 2020 Heat Pump: 2020
Gas Condens: 2030 Heat Pump: 2030
Figure 2-4: Relative contribution of the houses with different heating equipment to
selected impact categories. The gas condensing heater with current grid mixscenario represents 100%.
2.4 Conclusions
Heat pumps (assuming 4:1 output-to-input energy and no additional heatingrequired) are a more environmentally friendly solution and still with potential forimprovement in the future.
With regards to Global Warming and Primary Energy, already with the current gridmix in place they provide the best available technology.
With higher volume of renewable energy sources contributing to the power gridmix, however, heat pumps will beat gas condensing boilers in all impactcategories. While today’s gas boilers may show further improvements, they will
always be dependent on a fossil resource, whose burning will produce CO2, SO2 and NOx emissions, among others, responsible for many of the environmentalproblems, such as Global Warming, Acid Rain, Eutrophication (over-fertilization),Summer Smog creation etc.

8/14/2019 Environmental Performance in Low Carbon Electricity Systems
http://slidepdf.com/reader/full/environmental-performance-in-low-carbon-electricity-systems 22/63
22
3 Case Study 3: Low Energy House versus Passive House
3.1 Introduction
Low Energy and so-called Passive Houses (LEH and PH, respectively) representinnovative design and technologies implemented in favour of energy efficiency. Comparedto a standard house, both of these housing types have increased window surface areafacing South, increased insulation on both walls and windows, sand-lime brick replacingthe traditional bricks. The general description of the housing types is provided in theGlossary, while the list of parameters defining the houses in the model is provided in1.1.1.1Supplement A. The difference between LEH and PH is mostly question of degreeof efficiency: insulation is better in the PH and therefore the total heat demand of thesame size house is much reduced. To match this high level of efficiency an electric heatpump is the desirable choice, while in the LEH the best available fossil fuel-based heater,
i.e. the gas condensing boiler, is implemented. (More on the two heating systems can begleaned from Case Study 2: Low-Energy House heating system.
In Case Study 2: Low-Energy House heating system, the gas condensing heater wascompared to the heat pump inside the LEH. In the present Case Study the comparison isbetween the two houses with their standard heating system, i.e. gas condensing boiler forLEH and heat pump for PH. In addition to comparing different heating technologies, thecase study also endeavours to assess them using different “future” grid mixes (see also
Case study 1: environmental impact of the electricity mix). “Current” scenarios refer to the
use of the latest GaBi power grid mix dataset for EU-25 countries. Therefore the analysisnot only compares the best available technologies of today, but also looks at how the
relationship may change in circumstances where electric power provision will deriveincreasingly from renewable resources (for more information see Case study 1:environmental impact of the electricity mix.
3.2 System description
Both LEH and PH have the same size and climate conditions, while differing slightly intheir insulation materials etc (see 1.1.1.1Supplement A). The heaters in both representBest Available Technologies. The LCA study includes the building of the house itself inboth cases, as well as their use phase including heating and ventilation. (The ventilator is
an electric equipment required to maintain air quality inside the tightly insulated walls ofboth the LEH and PH, and can also be designed with a heat recovery system.) Theelectric and heating equipment manufacture and disposal are modelled as part of the use
phase of the house on account of the equipment’s function in the system. The lifetime ofthe house spans 50 years, all results refer to this lifecycle unless otherwise stated. Table3-1 summarizes the most important distinctions between the scenarios investigated in thisstudy.

8/14/2019 Environmental Performance in Low Carbon Electricity Systems
http://slidepdf.com/reader/full/environmental-performance-in-low-carbon-electricity-systems 23/63

8/14/2019 Environmental Performance in Low Carbon Electricity Systems
http://slidepdf.com/reader/full/environmental-performance-in-low-carbon-electricity-systems 24/63
24
0
500
1,000
1,500
2,000
2,500
3,000
PH LEH PH LEH PH LEH
Current 2020 2030
P r i m a r y E n e r g y D e m a n d ( n e t , G
J )
Primary energy f rom non-renewable resources (net cal. value) [GJ]
Primary energy from renewable resources (net cal. value) [GJ]
Figure 3-1: Primary Energy Demand (net calorific value, in GJ) over the life cycle of the
house, as contributed by renewable and non-renewable energy sources
0
500
1,000
1,500
2,000
2,500
3,000
PH: Current LEH: Current PH: 2020 LEH: 2020 PH: 2030 LEH: 2030
P r i m a r y E n e r g y D e m a n d ( n e t , G J )
House Manufacture Life cycle gas heater Life cycle electric equipment
Figure 3-2: Primary Energy Demand (net calorific value, in GJ) over the life cycle of the
house, as contributed by house manufacture, gas heater life cycle and electricequipment (heat pump and ventilator) life cycle
3.3.2 Global Warming and CO2 emissions: Figure 3-3
As compared to the LEH with gas condensing boiler, the PH with an electric heat
pump can save over 1 ton of CO2 emissions every year already with today’s gridmix in place.

8/14/2019 Environmental Performance in Low Carbon Electricity Systems
http://slidepdf.com/reader/full/environmental-performance-in-low-carbon-electricity-systems 25/63
25
In future scenarios, with increasing amount of renewable energy sources largelyfree of emissions, this can grow to be almost 1.5 tons a year!
Note that CO2 emissions are sometimes higher than the GWP. This is in fact a
result of the different methods in calculating the carbon footprint versus the impactcategory GWP. In the former, carbon stored in materials such as wood isaccounted for as a “negative emission” thereby reducing the total impact coming
from carbon emissions (see also Case Study 2: Low-Energy House heatingsystem section 2.3.2).
0
20
40
60
80
100
120
140
160
PH LEH PH LEH PH LEH
Current 2020 2030
C O 2 ( - e q u i v . ) e m i s s i o n s i n
t o n n e s
Carbon dioxide (ton) Global Warming Potential (CO2e) [ton CO2-Equiv.]
Figure 3-3: Emissions of CO2 and other greenhouse gases (ton CO2-equiv.)
3.3.3 Selected impact categories: Figure 3-4
Acidification Potential (AP) demonstrates a slightly different pattern than was seenfrom the PED and GWP figures. The PH has a higher AP than does the LEH undercurrent conditions of power generation. Using the 2020 grid mix the PH hasroughly the same impact as the LEH, but using the 2030 grid mix, the PH becomesmore beneficial for the environment. This is almost the same pattern as wasshown in Case Study 2: Low-Energy House heating system where the two heating
systems were compared within the LEH. The reason, as was explained there, isthe low sulphur-content of natural gas fuelling the boiler, while high-sulphurcontaining fuels (like coal and lignite) are included in the current grid mix (see alsoCase study 1: environmental impact of the electricity mix) resulting in SO2 emissions contributing to acidification. On the other hand, the PH has a lower heatdemand than the LEH and therefore much less electric power needs to beconsumed, therefore offsetting the difference in SO2 emissions already withmoderate renewable share in the grid mix (2020).
The Eutrophication Potential (EP) of the two houses are identical assuming current
grid mix conditions, but increasing the share of renewables (2020 and 2030) thebalance is quickly tilted in favour of the PH. Fossil fuel burning generates NOx emissions, and gas burning is not so much more favourable than coal burning that

8/14/2019 Environmental Performance in Low Carbon Electricity Systems
http://slidepdf.com/reader/full/environmental-performance-in-low-carbon-electricity-systems 26/63
26
it could offset the advantage of the PH gained by the decreased heat demand andthe higher efficiency of the heat pump. As more of fossil fuels are being replacedby renewable resources, NOx emissions reduce drastically together with EP.
Photochemical Ozone Creation Potential (POCP) is influenced by NO x emissionsas well as carbon monoxide and VOCs, and therefore the pattern visible is somesort of a mix between the EP and GWP patterns in the graph.
0%
20%
40%
60%
80%
100%
120%
140%
Acidif ication Potential[kg SO2-Equiv.]
EutrophicationPotential [kg
Phosphate-Equiv.]
Global WarmingPotential (CO2e) [kg
CO2-Equiv.]
Photochem. OzoneCreation Potential [kg
Ethene-Equiv.]
LEH: Current PH: Current LEH: 2020 PH: 2020 LEH: 2030 PH: 2030
Figure 3-4: Relative contribution of the housing types to selected impact categories. The
LH with current grid mix conditions represents 100%.
3.4 Conclusions
The conclusion from Case Study 2: Low-Energy House heating system wasconfirmed and reinforced: the system PH + electric heat pump is moreenvironmentally advantageous than the system LEH + gas condensing heater,given the high efficiency of the heat pump and tight insulation of the PH.
Building a PH results in environmental benefits that quickly offset the initialenvironmental “investments”, e.g. PED, due to consequent low energy needs.
The combined effect of a lower heat demand (as a direct result of better insulationand other building parameters) and the high-efficiency heat pump compensate forthe losses incurred through electric power provision in both energetic andenvironmental terms
Although in most impact categories (with the exception of AP) the PH fares betteralready using the current grid mix, the future holds much potential for improvementwith increasing shares of renewable resources contributing to the power grid
8/14/2019 Environmental Performance in Low Carbon Electricity Systems
http://slidepdf.com/reader/full/environmental-performance-in-low-carbon-electricity-systems 27/63
27
4 Case Study 4: Primary Energy versus Global Warming
4.1 Introduction
In previous case studies, the best available fossil fuel-based heating system wascompared with the best available electric heating system (Case Study 2: Low-EnergyHouse heating system, Case Study 3: Low Energy House versus Passive House). Arelatively outdated technology of heaters, however, may in the future prove to imply theenvironmentally cleaner solution. Night storage (or accumulation) heaters are electricappliances that produce and store heat overnight when electricity from the grid is cheaperdue to a situation of more available provision than demand, and release it throughout theday. Although intended more as an economical incentive for customers, the long-termenvironmental consequences are worth considering and re-visiting. On the one hand,using night time electricity may re-distribute the power demand over day slightly better
resulting in so-called “peak-shaving” or a decrease in the peak-time energy demand. Thiseffect is very difficult to quantify though and is therefore purely speculative. On the otherhand, future power grid mixes may contain sufficiently high shares of renewable resourcesthat make it possible to (partially) shut down the fossil-fuel based plants overnight. Whileelectricity is still consumed, and the losses through the grid are considerable (~65%), thebenefits in terms of emissions can become significant, and shall be investigated with thiscase study.
4.2 System description
In the scenarios investigated, four out of the six have already been looked into in Case
Study 3: Low Energy House versus Passive House (LEH and PH, respectively). Theadditional scenarios are the LEH fitted with a night storage heater using today’s power
grid mix (GaBi 2006 Databases), and the LEH fitted with a night storage heater using the“night tariff” of the grid mix in 2030 (theoretical mix, for more information see Case study1: environmental impact of the electricity mix). The “night tariff” in this case means thatduring the night, which is when the night storage heater is operational, the grid mixcontains 7% natural gas, 42% nuclear power, 19.2% hydropower, and 31.8% wind power.Compared to the day tariff, this means that the natural gas plant was downscaled, thesolar panels are not functional and the other three sources are proportionallycompensating for the decreased sources. Table 4-1 summarizes the scenarios
investigated according to the major differences between them.
The LCA study includes the building of the house itself in all cases, as well as the house’s use phase including heating and ventilation. (The ventilator is an electric equipmentrequired to maintain air quality inside the tightly insulated walls of both the LEH and PH,and can also be designed with a heat recovery system.) The electric and heatingequipment manufacture and disposal are modelled as part of the use phase of the houseon account of the equipment’s function in the system. The lifetime of the house spans 50years, all results refer to this lifecycle unless otherwise stated.
According to the model, the night storage heaters work with 90% efficiency. This means
that about 10% of the consumed power is lost and 90% is converted to heat used to warmthe house to the required temperature. This efficiency figure is a worst-case estimate, also

8/14/2019 Environmental Performance in Low Carbon Electricity Systems
http://slidepdf.com/reader/full/environmental-performance-in-low-carbon-electricity-systems 28/63
28
accounting for any extra heating required if the storage heater proves insufficient for thehouse.
Table 4-1: Scenarios considered in Case Study 4
Scenario name Heating equipment Heat demand peryear (kWh)
Renewables in gridmix (%)
LEH: Current Gas condensingheater
4979.8 12.63
PH: Current Heat pump 2168.6 12.63
LEH: Storage Current Night storage heater 4979.8 12.63
LEH: 2030 Gas condensingheater
4979.8 50
PH: 2030 Heat pump 2168.6 50
LEH: Storage 2030 Night storage heater 4979.8 50
4.3 Results
4.3.1 Primary Energy Demand (net calorific value, in MJ): Figure 4-1 and Figure 4-2
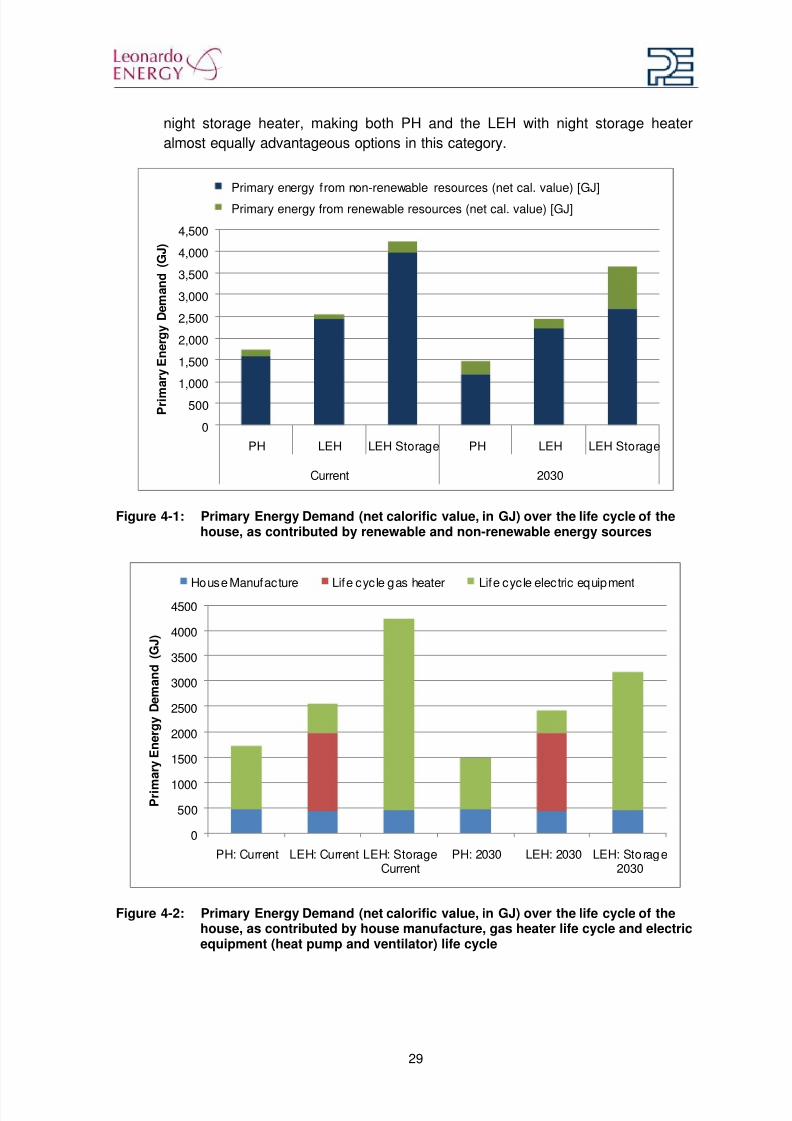
Primary Energy Demand (PED) is lowest for the PH with the heat pump under bothcurrent and future grid mix scenarios.
The LEH with gas condensing heater ranks second in terms of PED in both currentand future grid mix scenarios.
The LEH with the night storage heater has ca. 1.5 times higher PED than the LEHand ca. 2.5 times greater PED than the PH in both grid mix scenarios.
The increased share of renewable sources of energy benefits the electricequipment using houses the most.
In Figure 4-2 one can observe that the manufacture phase of all scenarios isrelatively small and roughly the same. It becomes obvious that the differential totalPED derives from the use phase of the house, i.e. the use of heating equipment.
4.3.2 Global Warming and CO2 emissions: Figure 4-3
The picture painted by the chart showing Global Warming Potential and CO2 emissions demonstrates a strikingly different pattern from that of PED: The PH isstill the environmentally least harmful option among the systems observed in bothgrid mix scenarios, but the LEH fitted with night storage heating is almost equallylow in emissions when taking into account night tariffs and the renewableresources in the grid mix of 2030.
Although both night storage heaters and heat pumps are electric equipment, the
night tariff system has only 7% of fossil fuel dependence under the 2030 grid mixscenario, while heat pump continues to rely on daytime tariff, therefore utilizing17% of fossil fuels. This difference compensates for the lower efficiency of the
8/14/2019 Environmental Performance in Low Carbon Electricity Systems
http://slidepdf.com/reader/full/environmental-performance-in-low-carbon-electricity-systems 29/63
29
night storage heater, making both PH and the LEH with night storage heateralmost equally advantageous options in this category.
0
500
1,000
1,500
2,000
2,500
3,000
3,500
4,000
4,500
PH LEH LEH Storage PH LEH LEH Storage
Current 2030
P r i m
a r y E n e r g y D e m a n d ( G J )
Primary energy from non-renewable resources (net cal. value) [GJ]
Primary energy from renewable resources (net cal. value) [GJ]
Figure 4-1: Primary Energy Demand (net calorific value, in GJ) over the life cycle of the
house, as contributed by renewable and non-renewable energy sources
0
500
1000
1500
2000
2500
3000
3500
4000
4500
PH: Current LEH: Current LEH: StorageCurrent
PH: 2030 LEH: 2030 LEH: Storage2030
P r i m
a r y E n e r g y D e m a n d ( G J )
House Manufacture Life cycle gas heater Life cycle electric equipment
Figure 4-2: Primary Energy Demand (net calorific value, in GJ) over the life cycle of the
house, as contributed by house manufacture, gas heater life cycle and electricequipment (heat pump and ventilator) life cycle

8/14/2019 Environmental Performance in Low Carbon Electricity Systems
http://slidepdf.com/reader/full/environmental-performance-in-low-carbon-electricity-systems 30/63
30
0
50
100
150
200
250
PH LEH LEH Storage PH LEH LEH Storage
Current 2030
C O 2 ( - e q u i v . ) e m i s s i o n s i n t o
n n e s
Carbon dioxide (ton) Global Warming Potential (CO2e) [tonCO2-Equiv.]
Figure 4-3: Emissions of CO2 and other greenhouse gases (ton CO2-equiv.)
4.3.3 Selected impact categories: Figure 4-4
Using the current grid mix, the LEH with the night storage heater has by far thehighest impact in all investigated categories
By contrast, using the future grid mix and night tariff of 2030, the LEH with nightstorage heater competes with the PH for the best place
Acidification Potential (AP) behaves slightly differently from other categories due tothe influence of SO2 on this category. Fossil fuels have general high sulphurcontent, and when burnt, release SO2. However, comparing a gas condensingboiler with an electric heat pump, natural gas has a low sulphur content andtherefore reliance on purely gas has a relatively lower impact than reliance on thecurrent grid mix which contains other fossil fuels. (See also Case study 1:environmental impact of the electricity mix.)
Eutrophication Potential (EP) is affected by nitrogen oxides (NOx), which areassociated with any fossil fuel burning process to different degrees. Therefore, the
general rule is that the more fossil fuels are burnt the higher this impact scored in acategory.
Photochemical Ozone Creation Potential is impacted by a combination ofcombustion gases, and therefore it behaves somewhat similarly to NOx in thisspecific case.

8/14/2019 Environmental Performance in Low Carbon Electricity Systems
http://slidepdf.com/reader/full/environmental-performance-in-low-carbon-electricity-systems 31/63
31
0%
50%
100%
150%
200%
250%
300%
350%
Acidification Potential[kg SO2-Equiv.]
EutrophicationPotential [kg
Phosphate-Equiv.]
Global WarmingPotential (CO2e) [kg
CO2-Equiv.]
Photochem. OzoneCreation Potential[kg Ethene-Equiv.]
LEH: Current LEH: Storage PH: Current
LEH: 2030 LEH: Storage 2030 PH: 2030
Figure 4-4: Relative contribution of the houses fitted with various heating equipment to
selected impact categories. The LEH with current grid mix represents 100%.
4.4 Conclusions
Night storage heaters, due to the relatively low efficiency of energy provision andconversion, have the highest environmental impact considering today’s power grid
mix composition.With higher shares of renewable resources in the grid mix, however, the night tariffcould become almost completely independent of fossil resources. Harvesting thisoff-peak energy, night storage heaters would avoid considerable amounts ofemissions making them comparable to heat pumps.
In addition to decreased emissions resulting from the heating of the house, thepower demand could become better distributed and possibly allow for diminishedtotal power production in the grid given the two-tariff system. On the other hand,the re-distribution of power usage must go hand-in-hand with an increase in
utilization of renewable resources. Otherwise the renewable share of the grid willnot be able to meet the demand posed by the night tariff system. The long termeffects of an increasing number of night storage heaters on the grid is difficult topredict and especially to quantify. Although the outcome may be overall positive,structural and functional requirements of such a system are numerous. Thissystem would have to be capable of covering for unexpected power surges duringthe day, while also ensuring that increasing power demand during the night due tomore and more storage heaters can be provided from renewable resources.
The impact of a single house with night storage heater on the other hand, ispredictable: the energy requirements (PED) will still be higher than other heating
solutions even if the energy provision becomes more and more burden-free for theenvironment. In other words, the (primarily) technical challenge of higher energydemand must be tackled.

8/14/2019 Environmental Performance in Low Carbon Electricity Systems
http://slidepdf.com/reader/full/environmental-performance-in-low-carbon-electricity-systems 32/63
32
At the same time, the heat pump, while requiring higher initial investment forinstallation, already today and even more so with the prospect of a cleaner gridmix, offers to reduce both environmental impacts and PED, given the assumptionson efficiency in our system (see Case Study 2: Low-Energy House heating
system).
8/14/2019 Environmental Performance in Low Carbon Electricity Systems
http://slidepdf.com/reader/full/environmental-performance-in-low-carbon-electricity-systems 33/63
33
5 Case Study 5: Investment into higher efficiency motors orwind turbines
5.1 IntroductionIn case studies 1-4, considerations of energy use were purely environmental. Decision-making processes, however, need to factor in economics as this may change rankingsentirely: if a limited amount of money has to be spent, cheaper solutions may beimplemented numerous times and thus the multiple uses of smaller changes may evenoutperform a single grandiose scheme. To assess the economic aspects of electricity use,a simple yet powerful exercise will be conducted in this chapter. A million Euros can beinvested a million ways, but two of them were chosen for this purpose: (1) a wind-powerturbine that will allow electric power generation with almost no carbon dioxide emissions,and (2) an electric motor with a high efficiency construction. While the one creates
practically emission-free power, the other reduces the electricity consumed. The questioninvestigated here is which one prevails when environmental gains are factored in withtheir costs.
5.2 System description
There are two systems compared: investment of 1 million Euros into wind power and 1million Euros into higher efficiency motors.
5.2.1 Wind turbine Life Cycle Costing (LCC)
Wind turbine installations and maintenance costs have been on the decrease as
developing technologies facilitate these operations more and more. The followingassumptions are based on the German on-shore wind farms (ISET2005,WINDGUARD2007) representing average European continental conditions.
The installation cost of turbines average around 1304.75 € /kW capacity
The maintenance cost of turbines average around 50 € /kW capacity per year
The average lifetime of a turbine is 20 years
This means that a 1MW(=1000kW) turbine would cost:
1304.75 *1000 + 50 *20*1000 = 2.305 million €
With 1 million investment 0.43 MW wind turbine capacity can be bought
The average efficiency of a continental wind turbine in Central Europe is ca. 20%.This includes wind availability as well technical limitations of power conversion.
The power production capacity of a 1MW wind turbine is then:
1*0.2MW
Over the lifetime of the wind turbine this means:
0.2MW*24*365*20*1000 = 35,040,000 kWh
Therefore the buying power of 1 million translates to
35,040,000 kWh * 0.43 = 15,203,384 kWh of energy
8/14/2019 Environmental Performance in Low Carbon Electricity Systems
http://slidepdf.com/reader/full/environmental-performance-in-low-carbon-electricity-systems 34/63
34
The improvement potential will be quantified by comparing the environmental impact ofthe equivalent amount of energy from the current EU-25 grid mix with the energy from thewind power bought.
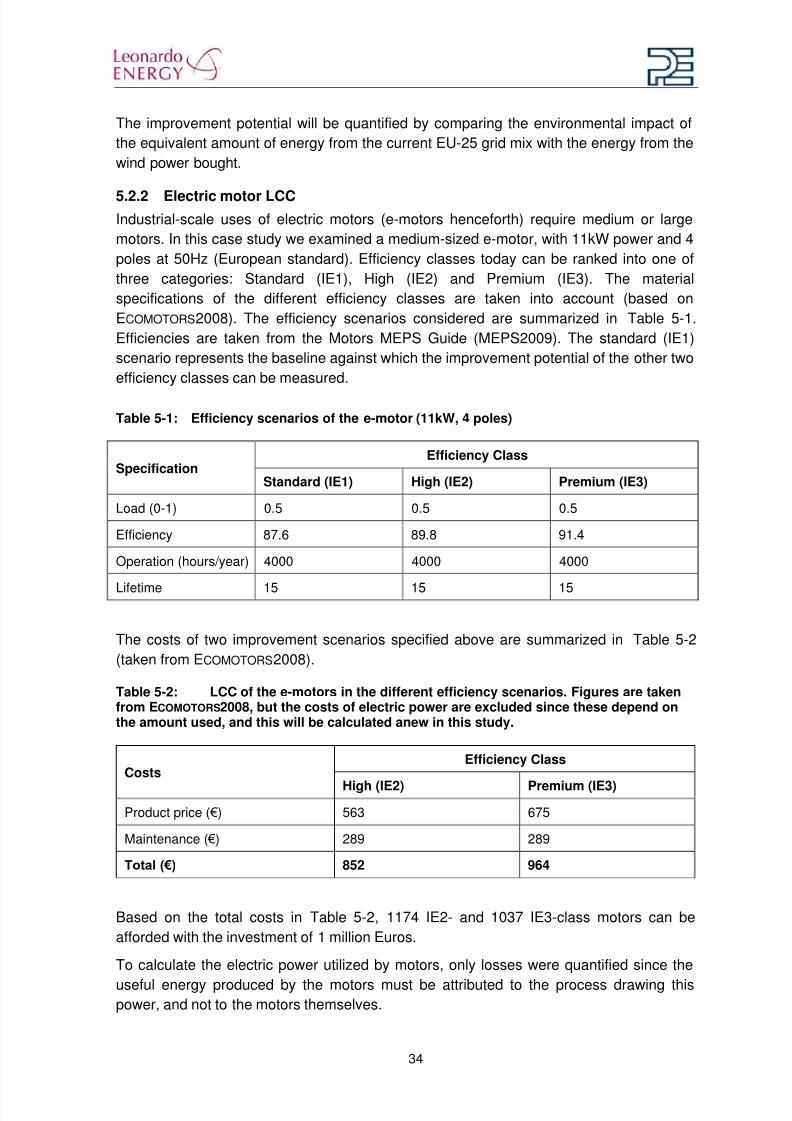
5.2.2 Electric motor LCCIndustrial-scale uses of electric motors (e-motors henceforth) require medium or largemotors. In this case study we examined a medium-sized e-motor, with 11kW power and 4poles at 50Hz (European standard). Efficiency classes today can be ranked into one ofthree categories: Standard (IE1), High (IE2) and Premium (IE3). The materialspecifications of the different efficiency classes are taken into account (based onECOMOTORS2008). The efficiency scenarios considered are summarized in Table 5-1. Efficiencies are taken from the Motors MEPS Guide (MEPS2009). The standard (IE1)scenario represents the baseline against which the improvement potential of the other twoefficiency classes can be measured.
Table 5-1: Efficiency scenarios of the e-motor (11kW, 4 poles)
SpecificationEfficiency Class
Standard (IE1) High (IE2) Premium (IE3)
Load (0-1) 0.5 0.5 0.5
Efficiency 87.6 89.8 91.4
Operation (hours/year) 4000 4000 4000
Lifetime 15 15 15
The costs of two improvement scenarios specified above are summarized in Table 5-2(taken from ECOMOTORS2008).
Table 5-2: LCC of the e-motors in the different efficiency scenarios. Figures are takenfrom ECOMOTORS2008, but the costs of electric power are excluded since these depend onthe amount used, and this will be calculated anew in this study.
CostsEfficiency Class
High (IE2) Premium (IE3)
Product price ( €) 563 675
Maintenance ( €) 289 289
Total (€) 852 964
Based on the total costs in Table 5-2, 1174 IE2- and 1037 IE3-class motors can beafforded with the investment of 1 million Euros.
To calculate the electric power utilized by motors, only losses were quantified since the
useful energy produced by the motors must be attributed to the process drawing thispower, and not to the motors themselves.
8/14/2019 Environmental Performance in Low Carbon Electricity Systems
http://slidepdf.com/reader/full/environmental-performance-in-low-carbon-electricity-systems 35/63
35
The calculations were as follows:
(Output power / Efficiency)*(1-Efficiency)*Load*Hours of operation during lifetime
This calculation resulted in 46.71MWh used by standard e-motors, 37.48MWh by IE2-
class e-motors, and 31.05MWh by IE3-class e-motors. The source of electric power wasin each case the current EU-25 grid mix. In order to quantify the electric power costs associated with the losses data from the European Energy Portal (www.energy.eu) wasretrieved and averaged over the EU27 countries for industrial uses up to 2000 MWh( €0.127/kWh). Adding electricity to the initial and maintenance costs of the e-motors, only179 high-efficiency and 204 premium efficiency e-motors could be afforded with a millionEuros. Since these costs are normally borne by the factory/plant utilizing the useful energyof the motors, calculations were made both excluding and including these costs, andcorrespond to e-motor scenarios (a) and (b) in the results section.
5.3 Results & Discussion
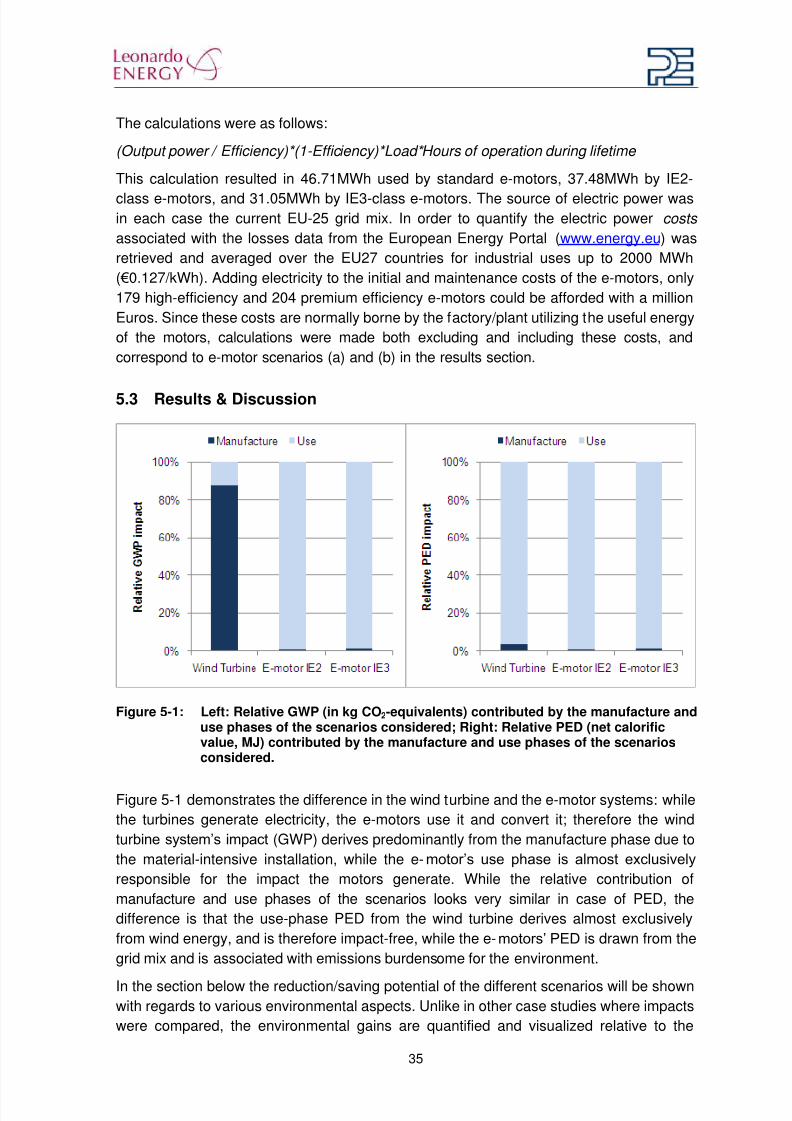
Figure 5-1: Left: Relative GWP (in kg CO2-equivalents) contributed by the manufacture anduse phases of the scenarios considered; Right: Relative PED (net calorificvalue, MJ) contributed by the manufacture and use phases of the scenariosconsidered.
Figure 5-1 demonstrates the difference in the wind turbine and the e-motor systems: whilethe turbines generate electricity, the e-motors use it and convert it; therefore the windturbine system’s impact (GWP) derives predominantly from the manufacture phase due tothe material-intensive installation, while the e-motor’s use phase is almost exclusively
responsible for the impact the motors generate. While the relative contribution ofmanufacture and use phases of the scenarios looks very similar in case of PED, thedifference is that the use-phase PED from the wind turbine derives almost exclusivelyfrom wind energy, and is therefore impact-free, while the e-motors’ PED is drawn from thegrid mix and is associated with emissions burdensome for the environment.
In the section below the reduction/saving potential of the different scenarios will be shownwith regards to various environmental aspects. Unlike in other case studies where impactswere compared, the environmental gains are quantified and visualized relative to the

8/14/2019 Environmental Performance in Low Carbon Electricity Systems
http://slidepdf.com/reader/full/environmental-performance-in-low-carbon-electricity-systems 36/63
36
baseline scenarios. The baselines are, in case of the wind turbines, the provision ofenergy from the current EU-25 grid mix, and in case of the e-motors, the standardefficiency (IE1) e-motor. Therefore, in all figures below larger (positive) values meanlarger environmental benefit, while negative values mean an environmental impact larger
than that of the baseline.
5.3.1 Primary Energy Demand reduction (net calorific value, in MJ): Figure 5-2
-100,000
-50,000
0
50,000
100,000
150,000
200,000
Wind Turbine E-motor IE2(a)
E-motor IE3(a)
E-motor IE2(b)
E-motor IE3(b)
P r i m a r y E n e r g y D e m a n d s a
v i n g ( n e t c a l .
V a l u e , G J )
PED from ren. and non ren. resources (net cal. value) [GJ]
PED from non-renewable resources (net cal. value) [GJ]
PED from renewable resources (net cal. value) [GJ]
Figure 5-2: Reduction of PED (net calorific value, in GJ) by investment into wind turbine or
higher efficiency e-motors. E-motor scenarios (a) exclude costs of electricityfor running the motors, scenarios (b) include costs of electricity.
With regards to PED the Premium efficiency-class (IE3) e-motor shows the largestimprovement, when excluding electricity costs of use phase.
The second rank is debatable since the total PED is lower in case of the high-efficiency e-motor, but taking only non-renewable resources into account the windturbine shows by far the greatest reduction. Since the increase in non-renewablesdoes not lead to either resource depletion issues or emissions increases, the windpower should be considered more beneficial.
This pattern is a result of (1) the energy provision by the wind power utilizingalmost exclusively renewable energy sources, while (2) the energy use from thepower grid mix during manufacture is dwarfed by the use phase energy provision(see Figure 5-1).
Including the costs of energy provision during the use phase of motors make theirreduction potential incomparably small relative to that of the wind power plant.
8/14/2019 Environmental Performance in Low Carbon Electricity Systems
http://slidepdf.com/reader/full/environmental-performance-in-low-carbon-electricity-systems 37/63
37
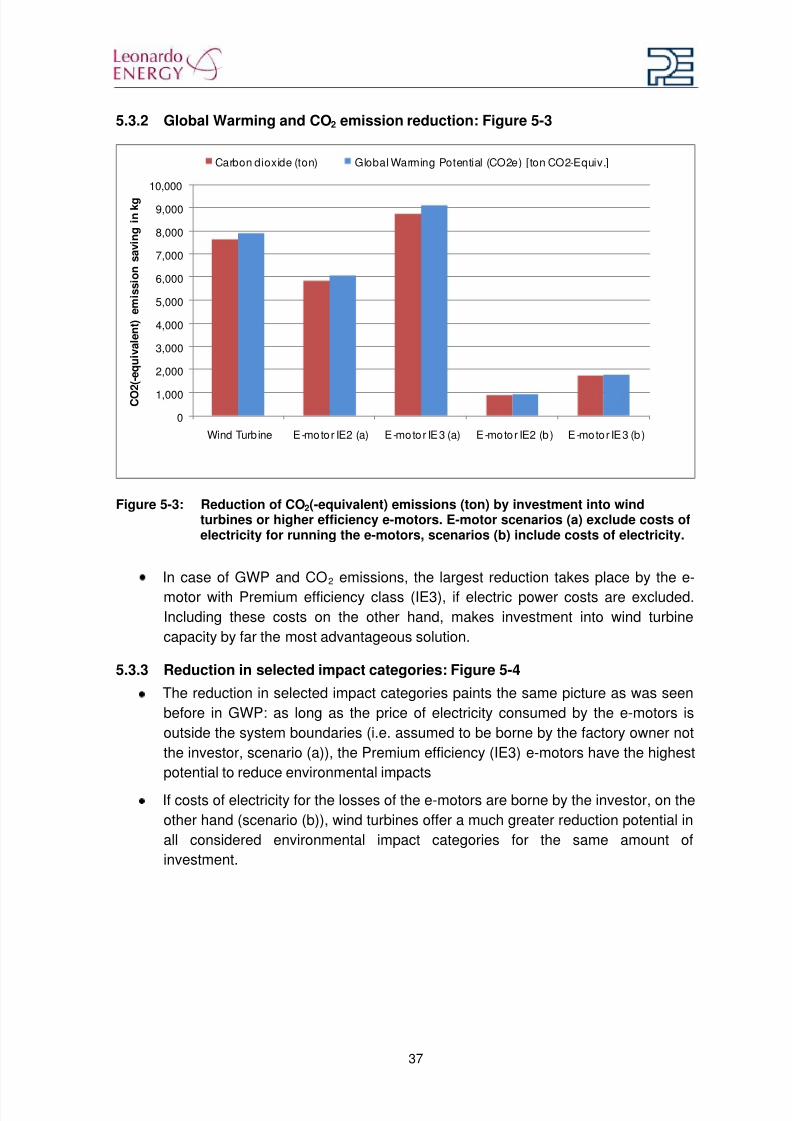
5.3.2 Global Warming and CO2 emission reduction: Figure 5-3
0
1,000
2,000
3,000
4,000
5,000
6,000
7,000
8,000
9,000
10,000
Wind Turbine E-motor IE2 (a) E-motor IE3 (a) E-motor IE2 (b) E-motor IE3 (b)
C O 2 ( - e q u i v a l e n t ) e m i s s i o n s a v i n g i n k g
Carbon dioxide (ton) Global Warming Potential (CO2e) [ton CO2-Equiv.]
Figure 5-3: Reduction of CO2(-equivalent) emissions (ton) by investment into wind
turbines or higher efficiency e-motors. E-motor scenarios (a) exclude costs ofelectricity for running the e-motors, scenarios (b) include costs of electricity.
In case of GWP and CO2 emissions, the largest reduction takes place by the e-motor with Premium efficiency class (IE3), if electric power costs are excluded.Including these costs on the other hand, makes investment into wind turbinecapacity by far the most advantageous solution.
5.3.3 Reduction in selected impact categories: Figure 5-4
The reduction in selected impact categories paints the same picture as was seenbefore in GWP: as long as the price of electricity consumed by the e-motors isoutside the system boundaries (i.e. assumed to be borne by the factory owner notthe investor, scenario (a)), the Premium efficiency (IE3) e-motors have the highestpotential to reduce environmental impacts
If costs of electricity for the losses of the e-motors are borne by the investor, on theother hand (scenario (b)), wind turbines offer a much greater reduction potential inall considered environmental impact categories for the same amount ofinvestment.

8/14/2019 Environmental Performance in Low Carbon Electricity Systems
http://slidepdf.com/reader/full/environmental-performance-in-low-carbon-electricity-systems 38/63
38
Figure 5-4: Relative reduction in selected impact categories by investment into windturbines or higher efficiency e-motors. The reduction by the wind turbinescenario represents 100%.
5.4 Conclusions
While the wind power can generate large quantities of practically emission-freeenergy, the power plant’s manufacture phase is both material and energy intensive
resulting in large environmental burdens even though these burdens are equallyallocated per kWh produced during the lifetime of the plant.
On the other hand, the impact of e-motors is determined largely by their use phasethrough the energy consumed by the losses. It becomes clear that themanufacture-phase investment into relatively larger quantities of electric steel andcopper (Figure 5-1) pays off quickly during the use phase as efficiency increases
(Figure 5-2 - Figure 5-4).
The cost of electric power for the losses created by the e-motors is a crucial factorin this analysis. Whether this cost is considered along with the investment dependson the situation: if the investor is also the manufacturer using the e-motors, thesecosts must be taken into account as part of the investment. In this case, a windturbine capacity affordable with a million Euros would be the straightforward choicefor investment. On the other hand, if the cost of electricity lost by the motors is notcarried by the investor, then the Premium efficiency (IE3) e-motors ’ environmentalbenefits prevail, since more of the same motors can be bought with the same
amount of money.Many small investments (e.g. e-motors) can outweigh the environmental benefit ofa single large-scale investment (wind turbine), if and only if, the considered
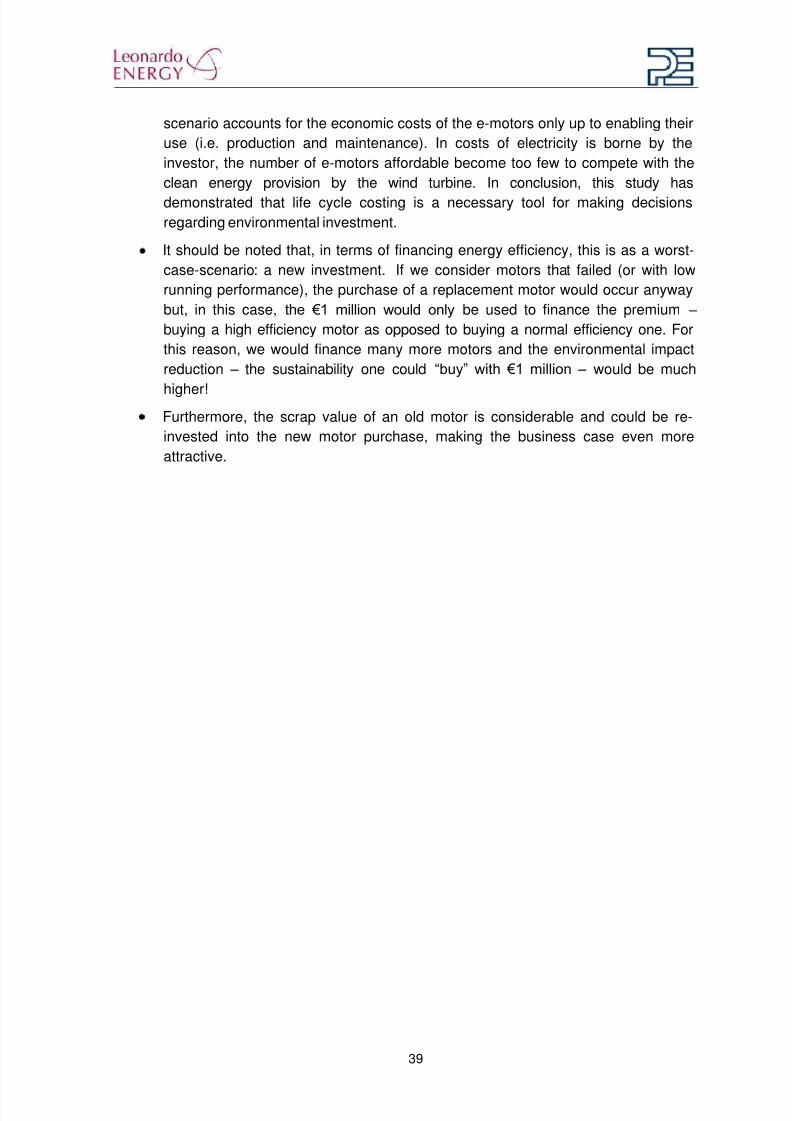
8/14/2019 Environmental Performance in Low Carbon Electricity Systems
http://slidepdf.com/reader/full/environmental-performance-in-low-carbon-electricity-systems 39/63
39
scenario accounts for the economic costs of the e-motors only up to enabling theiruse (i.e. production and maintenance). In costs of electricity is borne by theinvestor, the number of e-motors affordable become too few to compete with theclean energy provision by the wind turbine. In conclusion, this study has
demonstrated that life cycle costing is a necessary tool for making decisionsregarding environmental investment.
It should be noted that, in terms of financing energy efficiency, this is as a worst-case-scenario: a new investment. If we consider motors that failed (or with lowrunning performance), the purchase of a replacement motor would occur anywaybut, in this case, the €1 million would only be used to finance the premium – buying a high efficiency motor as opposed to buying a normal efficiency one. Forthis reason, we would finance many more motors and the environmental impactreduction – the sustainability one could “buy” with €1 million – would be much
higher!Furthermore, the scrap value of an old motor is considerable and could be re-invested into the new motor purchase, making the business case even moreattractive.

8/14/2019 Environmental Performance in Low Carbon Electricity Systems
http://slidepdf.com/reader/full/environmental-performance-in-low-carbon-electricity-systems 40/63
40
6 Case Study 6: building a new house for 1 million Euros
6.1 Introduction
In case studies 3-4 the environmental benefits of a Low-Energy House (LEH) werecompared to a Passive House (PH) both equipped with the best available technology tosuit the house type (see Case Study 3: Low Energy House versus Passive House andCase Study 4: Primary Energy versus Global Warming). In this case study, theenvironmental comparison was complemented with an economic assessment of thedecision alternatives. This case study can be thought of as a cost-benefit analysis ofbuilding a new house with different environmental and economic costs and benefits.Basically, the study aims at analysing the sustainability one can “buy” investing €1 million
in different concepts.
Three alternatives for improvement are considered, using a “Standard house” as the
baseline (see definition in the Glossary and parameter settings in the Appendix). The LEHwith gas condensing heater represents one option, the PH with heat pump another, whilethe PH with night storage heater a third one. The environmental benefits of the first twooptions have been discussed before (Case Study 3: Low Energy House versus PassiveHouse) and will only be referred to here. The storage heater benefits have beendiscussed in the context of the LEH (Case Study 4: Primary Energy versus GlobalWarming), and so this scenario is expected to show improvement compared to that inCase Study 4. The night storage heater (NSH) scenario will also be investigated using thefuture grid mix of 2030 with a night tariff system in place.
6.2 System description
The systems considered in this case study are summarized in Table 6-1. More elaboratedescriptions of the house types can be found in Case Study 3: Low Energy House versusPassive House and regarding the night storage heater Case Study 4: Primary Energyversus Global Warming can be referred to. In all four scenarios the system boundariesinclude the manufacture of the house and its use phase including heating and ventilation.The quantification of the benefits of each scenario takes place by calculating the reductionof environmental impacts compared to the standard house. The system analyses thebenefits from the perspective of a larger scale housing investment, and quantifies
investment into the alternative building types (PH or LEH) relative to an investment into anew standard house. Therefore both financially and environmentally the investment intothe standard house is considered the baseline, and this includes its manufacture phase.The lifetime of the houses are in each case 50 years, use phase comparisons areconsidered over this period in the LEH, the PH and the standard house.

8/14/2019 Environmental Performance in Low Carbon Electricity Systems
http://slidepdf.com/reader/full/environmental-performance-in-low-carbon-electricity-systems 41/63
41
Table 6-1: Basic settings of the systems considered in case study 6
Scenario name Heating equipment Heat demand peryear (kWh)
Renewables in gridmix (%)
LEH Gas condensingheater
4979.8 12.63
PH with heat pump Heat pump 2168.6 12.63
PH with NSH today Night storage heater 2168.6 12.63
PH with NSH 2030 Night storage heater 2168.6 50
6.3 Life Cycle Costing (LCC) of the LEH and the PH
6.3.1 Construction costs
Costs are averages and are rounded based on figures from http://www.energiesparen-im-haushalt.de. The costs sum up the initial investment relative to the investment cost of astandard house (Table 6-2), and as such exclude maintenance costs and cost ofelectricity over the lifetime of the buildings. Taking the cost difference for the alternativebuilding types as shown in Table 6-2, €1 million allows investing into improving roughly 33houses from Standard to LEHs or 17 Standard to PHs Therefore the results presented insection 6.4.2 will in fact reflect:
1. LEH with gas condensing heater: ∆ Impact [{(33 X manufacture of standardhouse) + (33 X use phase of standard house)} – {(33 X manufacture of LEH with
gas condensing heater) + (33 X use phase of LEH with gas condensing heater)}]2. PH with heat pump: ∆ Impact [{(17 X manufacture of standard house) + (17 X use
phase of standard house)} – {(17 X manufacture of PH with heat pump) + (17 Xuse phase of PH with heat pump)}]
3. PH with storage heater today: ∆ Impact [{(17 X manufacture of standard house)+ (17 X use phase of standard house} – {(17 X manufacture of PH with storageheater) + (17 X use phase of PH with storage heater)}]
4. PH with storage heater in 2030: ∆ Impact [{(17 X manufacture of standard house)+ (17 X use phase of standard house} – {(17 X manufacture of PH with storage
heater) + (17 X use phase of PH with storage heater and 2030 night tariff)}]

8/14/2019 Environmental Performance in Low Carbon Electricity Systems
http://slidepdf.com/reader/full/environmental-performance-in-low-carbon-electricity-systems 42/63
42
Table 6-2: Construction costs of the two housing types considered.
Costs LEH PH StandardHouse
Price per m2 ( €) 1600 1850 1380
Total cost of house (130m2) ( €) Ca. 210,000 Ca. 240,000 Ca. 180,000
Cost difference from StandardHouse
30,000 60,000 NA
6.3.2 Use phase costs
In addition to examining the buying power of €1 million regarding construction of newhouses only, it was deemed valuable to estimate the use phase costs of each house, andcalculate the potential savings of the alternative houses. Table 6-3 summarizes these
costs for all the houses considered as well as the savings made during the lifetime of thealternative houses relative to the standard house.
Table 6-3: Use phase costs of the various building types, each 130m2. Key: LEH – LEH with
gas condensing boiler; PH – PH with heat pump; PH (NSH) – PH with nightstorage heater; Standard – standard house with conventional gas boiler.
Housetype
Gasconsumption (kWh)
Gasconsumptioncosts* (€)
Powerconsumption (kWh)
Powerconsumptioncosts* (€)
Total usephasecosts (€)
Totalsavings(€)
LEH 344849 25,236 48492 8,612 33,848 65,381
PH 0.00 - 99565 17,682 17,682 81,547
PH (NSH) 0.00 - 167765 29,794 29,794 69,435
Standard 1302250 95,299 22131 3,930 99,299 -
*Gas and electricity prices were taken from the European Energy Portal (www.energy.eu) and averaged over
EU countries in 2009. The average gas price was 0.07 € /kWh for domestic use under 500m3 consumption. The
average electricity price was 0.18 € /kWh for domestic use under 3500kWh/year consumption.
6.4 Results & Discussion
In the section below each environmental impact category will be evaluated from twodifferent aspects. First, the impact of the single houses (standard house along with thevarious alternatives) will be shown in absolute numbers. Then the reduction/savingpotential of the four different alternative scenarios will be presented.
6.4.1 Comparison of single houses
In the figures below, one single house of each type is compared with the others in termsof their environmental impact. The standard house (1) as the baseline option is shownalong with the LEH (2), the PH with heat pump (3), the PH with NSH today (4) and usingthe grid mix of 2030 with night tariff system (5).

8/14/2019 Environmental Performance in Low Carbon Electricity Systems
http://slidepdf.com/reader/full/environmental-performance-in-low-carbon-electricity-systems 43/63
43
6.4.1.1 Primary Energy Demand (PED) (net calorific value, in GJ): Figure 6-1
The PED of the standard house is about twice as high as any of the alternativehousing options
Among the alternative housing options, the PH with the heat pump has the lowesttotal PED; considering, however, only the PED from non-renewable resources, thePH with NSH and the 2030 grid mix has an even lower impact. As described inCase study 1: environmental impact of the electricity mix, the 2030 grid mix has avery high share of renewables, which is clearly visible in the figure.
The PH with the NSH and today’s grid mix is the most energy intensive alternative to the standard house. With over 4 times lower efficiency than the heat pump,combined with the inherent losses through the grid mix, this solution has the leastto offer in environmental terms (see also Case Study 4: Primary Energy versusGlobal Warming).
0
1,000
2,000
3,000
4,000
5,000
6,000
7,000
Standard (1) LEH (1) PH (1) withheat pump
PH (1) withNSH today
PH (1) withNSH 2030 P
r i m a r y E n e r g y D e m a n d
( n e t c a l . v a l u e , G J )
Primary energy f rom non-renewable resources (net cal. value) [GJ]
Primary energy f rom renewable raw materials (net cal. value) [GJ]
Figure 6-1: Primary Energy Demand (GJ, net calorific value) of the various housing
options.
6.4.1.2 Global Warming Potential (GWP) and CO2 emissions (tonnes): Figure 6-2
As seen in case of PED, the standard house has the highest contribution to GWPand CO2 emissions.
The pattern seen here follows that of PED from non-renewable resources. Sincefossil-based non-renewable resources are carbon chains that emit CO2 whenburnt, GWP is directly linked to this impact. The PH with the future grid mix of 2030containing 50% renewables, as well as a night tariff system in which even feweremissions are generated (see Case Study 4: Primary Energy versus GlobalWarming), has by far the lowest impact in these categories.

8/14/2019 Environmental Performance in Low Carbon Electricity Systems
http://slidepdf.com/reader/full/environmental-performance-in-low-carbon-electricity-systems 44/63
44
Considering only today’s alternatives, the PH with heat pump stands out as the
most environmentally friendly option in this category.
As in case of PED, the PH with the NSH has the highest impact among the
alternatives to the standard house, but as we move towards an energy mix (2030scenario) with lower CO2 content, this situation inverts.

8/14/2019 Environmental Performance in Low Carbon Electricity Systems
http://slidepdf.com/reader/full/environmental-performance-in-low-carbon-electricity-systems 45/63
45
0
50
100
150
200
250
300
350
400
Standard (1) LEH (1) PH (1) withheat pump
PH (1) withNSH today
PH (1) withNSH 2030
E m i s s i o n o f C O 2 - e q u i v a l e n t s ( t o
n )
Carbon dioxide (ton) Global Warming Potential (CO2e) [ton CO2-Equiv.]
Figure 6-2: Global Warming Potential (ton CO2-eq.) and CO2 emissions (both in tonnes)
6.4.1.3 Selected impact categories: Figure 6-3
0%
20%
40%
60%
80%
100%
120%
Acidif ication Potential[kg SO2-Equiv.]
EutrophicationPotential [kg
Phosphate-Equiv.]
Global WarmingPotential (CO2e) [ton
CO2-Equiv.]
Photochem. OzoneCreation Po tential [kg
Ethene-Equiv.]
Standard (1) LEH (1) PH (1) with heat pump
PH (1) with NSH today PH (1) with NSH 2030
Figure 6-3: Contribution of the five housing types to selected impact categories.
In the selected impact categories somewhat different patterns emerge from whatwe have seen so far
While GWP closely follows the PED from non-renewable resources, AcidificationPotential (AP) differs significantly. This can be attributed to the fact that GWP is
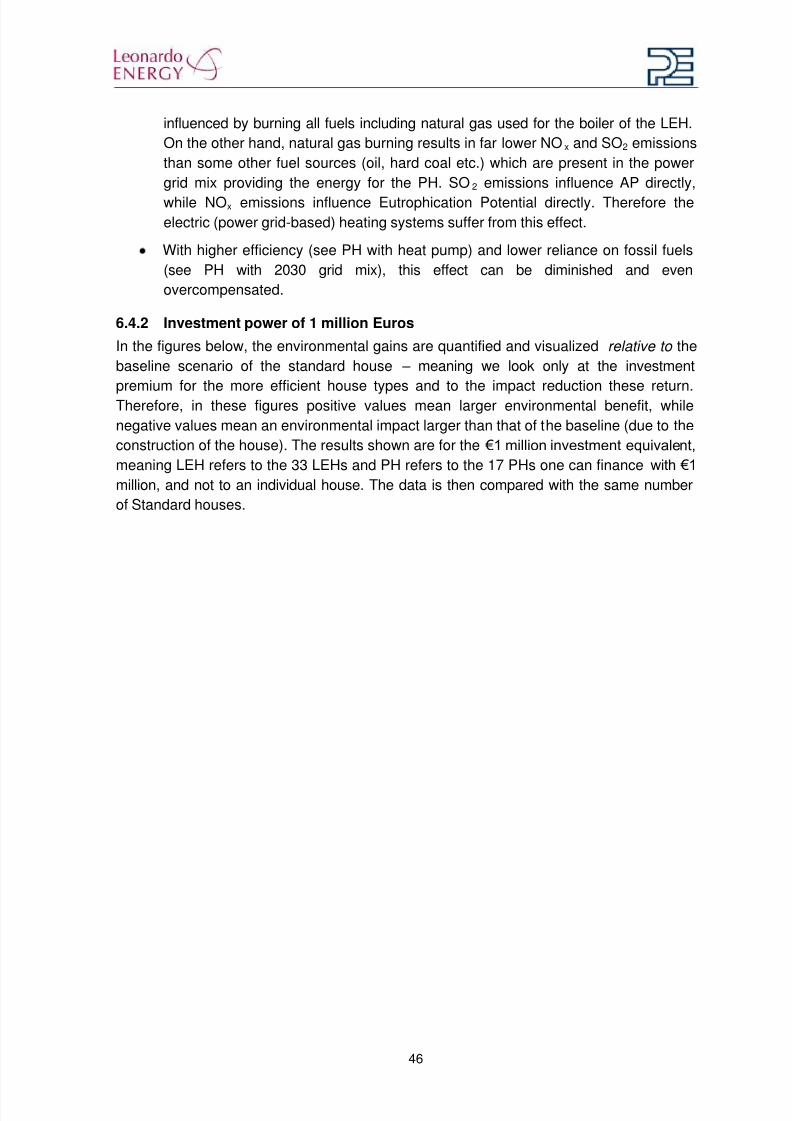
8/14/2019 Environmental Performance in Low Carbon Electricity Systems
http://slidepdf.com/reader/full/environmental-performance-in-low-carbon-electricity-systems 46/63
46
influenced by burning all fuels including natural gas used for the boiler of the LEH.On the other hand, natural gas burning results in far lower NOx and SO2 emissionsthan some other fuel sources (oil, hard coal etc.) which are present in the powergrid mix providing the energy for the PH. SO2 emissions influence AP directly,
while NOx emissions influence Eutrophication Potential directly. Therefore theelectric (power grid-based) heating systems suffer from this effect.
With higher efficiency (see PH with heat pump) and lower reliance on fossil fuels(see PH with 2030 grid mix), this effect can be diminished and evenovercompensated.
6.4.2 Investment power of 1 million Euros
In the figures below, the environmental gains are quantified and visualized relative to thebaseline scenario of the standard house – meaning we look only at the investment
premium for the more efficient house types and to the impact reduction these return.Therefore, in these figures positive values mean larger environmental benefit, whilenegative values mean an environmental impact larger than that of the baseline (due to theconstruction of the house). The results shown are for the €1 million investment equivalent,
meaning LEH refers to the 33 LEHs and PH refers to the 17 PHs one can finance with €1
million, and not to an individual house. The data is then compared with the same numberof Standard houses.

8/14/2019 Environmental Performance in Low Carbon Electricity Systems
http://slidepdf.com/reader/full/environmental-performance-in-low-carbon-electricity-systems 47/63
47
6.4.2.1 Reduction in Primary Energy Demand (PED) (net calorific value, in GJ):
0
20,000
40,000
60,000
80,000
100,000
120,000
140,000
T O T A L
L C
M a n u f a c t u r e
U s e
T O T A L
L C
M a n u f a c t u r e
U s e
T O T A L
L C
M a n u f a c t u r e
U s e
T O T A L
L C
M a n u f a c t u r e
U s e
LEH PH with heatpump PH with NSH today PH with NSH 2030
P
r i m a r y E n e r g y s a v i n g s ( n e t c a l . v a l u e ,
G J )
Figure 6-4: Primary Energy (net calorific value, in GJ) reduction in the various investment
scenarios and their life cycle phases (total life cycle impacts are shown in red).
In Figure 6-4 it becomes clear that the contribution of the use phase is thedominant phase of the life cycle of the houses. Even though the manufacturephase is a costly investment in environmental and economical terms, relative tothe baseline of the standard house’s manufacture, there is little (in case of the
LEH) or no gain from this phase. .
In both Figure 6-4Fehler! Verweisquelle konnte nicht gefunden werden. andFigure 6-5 it is evident that the LEH scenario has the highest reduction potential,with twice as many houses affordable as in case of the PH scenarios. While thesingle LEH could not compete with the energy efficiency of the PH with the heat
pump, twice as many LEHs become more environmentally friendly than the PHalternative.
The PH with the heat pump and the futuristic scenario of PH with night storageheater and the 2030 grid mix and night tariff system, are a close match in terms ofenvironmental gain. The night storage heater in the PH results in a lower PEDgiven the futuristic energy provision scenario of 2030 than using today’s grid mix.
This is due to the increased share of renewables (see Case study 1:environmental impact of the electricity mix).
In Figure 6-5 one can also note that while the total PED is reduced greatly
compared to the standard house in all scenarios, the share of renewablesincreases in the three PH options (see negative increase). This is due to the factthe energy required for heating comes from the power grid mix which also contains
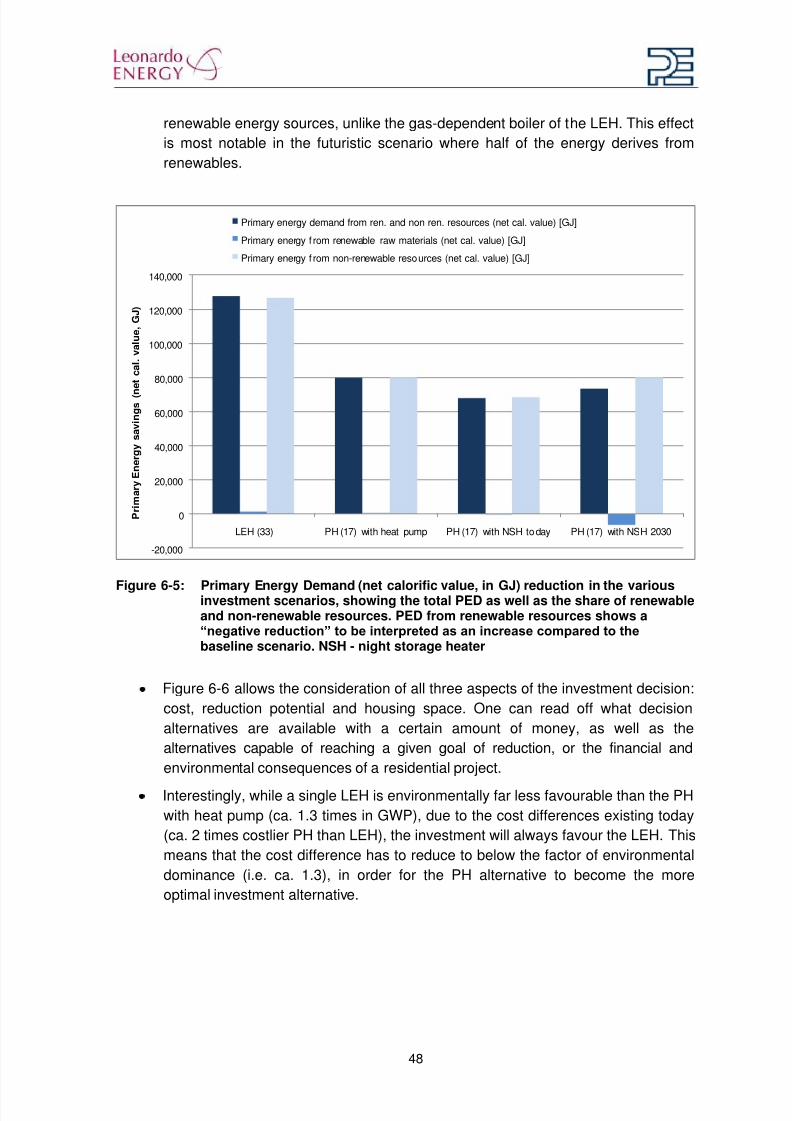
8/14/2019 Environmental Performance in Low Carbon Electricity Systems
http://slidepdf.com/reader/full/environmental-performance-in-low-carbon-electricity-systems 48/63
48
renewable energy sources, unlike the gas-dependent boiler of the LEH. This effectis most notable in the futuristic scenario where half of the energy derives fromrenewables.
-20,000
0
20,000
40,000
60,000
80,000
100,000
120,000
140,000
LEH (33) PH (17) with heat pump PH (17) with NSH today PH (17) with NSH 2030
P r i m a r y E n e r g y s a v i n g s ( n
e t c a l . v a l u e ,
G J )
Primary energy demand from ren. and non ren. resources (net cal. value) [GJ]
Primary energy f rom renewable raw materials (net cal. value) [GJ]
Primary energy f rom non-renewable resources (net cal. value) [GJ]
Figure 6-5: Primary Energy Demand (net calorific value, in GJ) reduction in the variousinvestment scenarios, showing the total PED as well as the share of renewable
and non-renewable resources. PED from renewable resources shows a“negative reduction” to be interpreted as an increase compared to thebaseline scenario. NSH - night storage heater
Figure 6-6 allows the consideration of all three aspects of the investment decision:cost, reduction potential and housing space. One can read off what decisionalternatives are available with a certain amount of money, as well as thealternatives capable of reaching a given goal of reduction, or the financial andenvironmental consequences of a residential project.
Interestingly, while a single LEH is environmentally far less favourable than the PHwith heat pump (ca. 1.3 times in GWP), due to the cost differences existing today(ca. 2 times costlier PH than LEH), the investment will always favour the LEH. Thismeans that the cost difference has to reduce to below the factor of environmentaldominance (i.e. ca. 1.3), in order for the PH alternative to become the moreoptimal investment alternative.

8/14/2019 Environmental Performance in Low Carbon Electricity Systems
http://slidepdf.com/reader/full/environmental-performance-in-low-carbon-electricity-systems 49/63
49
0
20,000
40,000
60,000
80,000
100,000
120,000
0 200,000 400,000 600,000 800,000 1,000,000 1,200,000 P
r i m a r y E n e r g y D e m a n d ( n e t c a l . v a l u e ,
G J )
PH (NSH) PH LEH
Figure 6-6: Net reduction of Primary Energy Demand (net calorific value, in GJ) affordable
with given expenditure. Key: Blue diamonds – LEH; Red squares – PH withheat pump; Green triangles – PH with night storage heater (NSH).
6.4.2.2 Global Warming and CO2 emission reduction: Figure 6-7 and Figure 6-8
The pattern of Global Warming Potential (GWP) looks slightly different from thepattern in total PED, although it follows the pattern of PED from non-renewables.The supremacy of the LEH alternative remains unbeatable due to the number of
houses affordable (33 vs. 17 PHs).
While in terms of the total PED the PH with heat pump could not be distinguishedfrom the PH with NSH with the 2030 grid mix, in terms of GWP and CO2 emissionsthe latter has a clearly greater reduction potential. With the 50% renewable sharein the 2030 grid mix, not only does the total PED decrease but also the associatedemissions decline drastically, enabling an enormous reduction in CO2 and GWP.

8/14/2019 Environmental Performance in Low Carbon Electricity Systems
http://slidepdf.com/reader/full/environmental-performance-in-low-carbon-electricity-systems 50/63

8/14/2019 Environmental Performance in Low Carbon Electricity Systems
http://slidepdf.com/reader/full/environmental-performance-in-low-carbon-electricity-systems 51/63
51
0
1,000
2,000
3,000
4,000
5,000
6,000
7,000
0 200,000 400,000 600,000 800,000 1,000,000 1,200,000 R e d u c t i o n i n G l o b a l W a r m i n g P o t
e n t i a l
( t o n C O 2 - e q . )
Cost of housing investment (Euros)
LEH PH PH (NSH)
Figure 6-8: Net reduction of Global Warming Potential (in ton CO2-equivalents) affordable
with given expenditure. Key: Blue diamonds – LEH; Red squares – PH withheat pump; Green triangles – PH with night storage heater (NSH).
6.4.3 Reduction in selected impact categories: Figure 6-9
As in the case of GWP, other impact categories also demonstrate that the highestenvironmental benefits today can be reaped from the LEH investment scenariogiven current conditions.
As regards to the future, electric heating through the 2030 grid mix (especially withthe night tariff system) has a higher reduction potential in terms of AcidificationPotential, since the grid mix composition in this theoretical scenario does not relyon any fossil fuels.
Under current conditions, the PH with the night storage heater is the leastworthwhile investment. Not only is the reduction potential the lowest in all impactcategories, but in fact its Acidification Potential (AP) is higher than that of thestandard house. This is because the current grid mix contains fossil fuels (Coal,Oil, Lignite) that have much higher sulphur content than does natural gas (the fuel
burnt in the standard house), thus result in high SO2 emissions upon burning. Thisand the inefficiency of the grid means that the impact becomes very high.
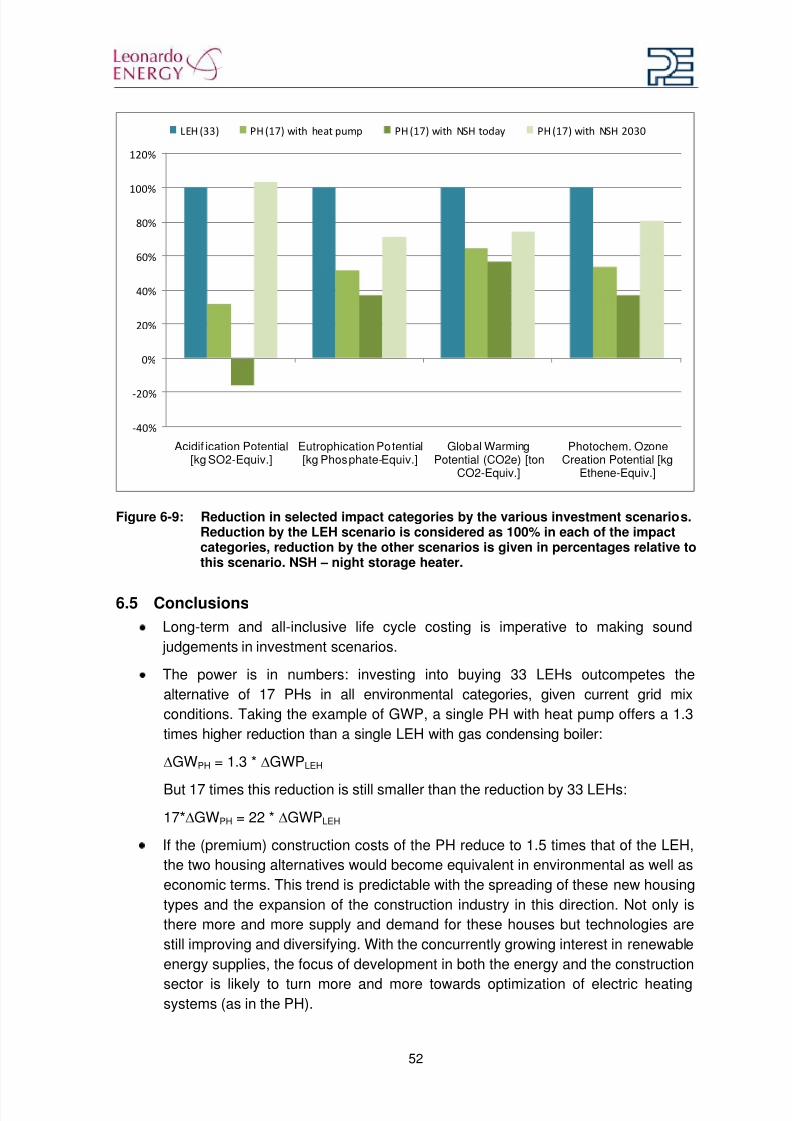
8/14/2019 Environmental Performance in Low Carbon Electricity Systems
http://slidepdf.com/reader/full/environmental-performance-in-low-carbon-electricity-systems 52/63
52
-40%
-20%
0%
20%
40%
60%
80%
100%
120%
Acidif ication Potential[kg SO2-Equiv.]
Eutrophication Potential[kg Phosphate-Equiv.]
Global WarmingPotential (CO2e) [ton
CO2-Equiv.]
Photochem. OzoneCreation Potential [kg
Ethene-Equiv.]
LEH (33) PH (17) with heat pump PH (17) with NSH today PH (17) with NSH 2030
Figure 6-9: Reduction in selected impact categories by the various investment scenarios.
Reduction by the LEH scenario is considered as 100% in each of the impactcategories, reduction by the other scenarios is given in percentages relative tothis scenario. NSH – night storage heater.
6.5 Conclusions
Long-term and all-inclusive life cycle costing is imperative to making sound judgements in investment scenarios.
The power is in numbers: investing into buying 33 LEHs outcompetes thealternative of 17 PHs in all environmental categories, given current grid mixconditions. Taking the example of GWP, a single PH with heat pump offers a 1.3times higher reduction than a single LEH with gas condensing boiler:
∆GWPH = 1.3 * ∆GWPLEH
But 17 times this reduction is still smaller than the reduction by 33 LEHs:
17*∆GWPH = 22 * ∆GWPLEH
If the (premium) construction costs of the PH reduce to 1.5 times that of the LEH,the two housing alternatives would become equivalent in environmental as well aseconomic terms. This trend is predictable with the spreading of these new housingtypes and the expansion of the construction industry in this direction. Not only isthere more and more supply and demand for these houses but technologies arestill improving and diversifying. With the concurrently growing interest in renewableenergy supplies, the focus of development in both the energy and the construction
sector is likely to turn more and more towards optimization of electric heatingsystems (as in the PH).
8/14/2019 Environmental Performance in Low Carbon Electricity Systems
http://slidepdf.com/reader/full/environmental-performance-in-low-carbon-electricity-systems 53/63
53
The presented comparative assessment is not applicable to investment scenarioswhen living space is the first priority
In the results section the use phase savings were not considered since the savings
over the lifetime of both the LEH and the PH with heat pump would have resultedin a net financial gain (ca. 65,000 Euros saved overcompensate the 30,000invested in a single LEH, while ca. 81,000 Euros saved overcompensate the60,000 invested in the PH). It is noteworthy, however, that considering theabsolute investment costs, the LEH would compensate for the initial building costsin a little over 3 years, while the investment into the PH would already be returnedbefore the end of the 3rd year!

8/14/2019 Environmental Performance in Low Carbon Electricity Systems
http://slidepdf.com/reader/full/environmental-performance-in-low-carbon-electricity-systems 54/63
54
7 Case Study 7: renovating/improving a standard house for 1million Euros
7.1 IntroductionIn Case Study 6: building a new house for 1 million Euros the investment costs andenvironmental payoffs of newly built houses were compared. In this case study, therenovation options of a standard house (see Glossary and parameter settings inAppendix) will be compared both in terms of the environmental benefits obtainable withthe investment of 1 million Euros in each case. Two alternatives are considered: inscenario (1) the standard house will simply be equipped with a gas condensing heater, theBest Available Technology among fossil fuel-based heating systems; in scenario (2) thestandard house will be renovated with additional insulation and equipped with gascondensing heater. While one option represents a very economical but short-sighted
approach, the alternative represents a financially more burdensome, yet far-sightedapproach. The question addressed here is whether the lower investment costs cancompensate for the higher consumption in the use phase of the standard house versusthe newly insulated house.
7.2 System description
The systems considered in this case study are summarized in Table 7-1. In bothscenarios the baseline system is a standard house (see definition in the Glossary andparameter settings in the Appendix) that should undergo improvements from an energeticpoint of view. The manufacture phase includes the renovation in the second scenario,
while excluding the manufacture of the house itself since it is assumed to have existed forabout 30 years at the time of the investment. The use phase consists of the manufactureof the new boilers as well as the heating of the house by a gas condensing boiler with hotwater storage (virtual efficiency 106%). Some electric power is utilized for the operation ofthe boiler and the pump circulating the hot water. Mechanical ventilation is not installed ineither the standard or the renovated house. The lifetime of the house is 20 years,considering that the house was built about 30 years earlier. The quantification of thebenefits of each scenario takes place by calculating the reduction of environmentalimpacts compared to the use phase of a standard house with a lower-efficiencyconventional gas boiler (efficiency 93.5%).

8/14/2019 Environmental Performance in Low Carbon Electricity Systems
http://slidepdf.com/reader/full/environmental-performance-in-low-carbon-electricity-systems 55/63
55
Table 7-1: Basic parameters of the scenarios of case study 7.
Scenario name Heating equipment Insulation (U-value) Heat demandper year(kWh)Exterior wall Roof Window
New boiler only Gas condensingheater, virtualefficiency factor106%
0.43191 0.4 3 27216
Full renovation Gas condensingheater, virtualefficiency factor106%
0.06159 0.3 1.2 18884
7.3 Life Cycle Costing (LCC) of the scenarios
7.3.1 LCC for construction only
As in Case Study 6: building a new house for 1 million Euros, the base case considersonly the construction/realization costs of the two alternative improvement scenarios.These costs are summarized in Table 7-2. Based on these costs 167 standard housescan be equipped with the gas boiler, while only 28 houses can be fully renovated, giventhe financial limit of 1 million Euros. As in Case Study 6, the calculation of theenvironmental improvement was done by taking the 20-year use phase of the standardhouse and subtracting the environmental burdens of the alternative systems (including
renovation). The gains over a single house were then multiplied by the number ofaffordable solutions, i.e. 167 for the “new boiler only” scenario and by 28 for the “full
renovation” scenario. This means almost six times as many of the former as of the lattertypes of improvements.
Table 7-2: Costs of construction of the improvement options
Alternatives Improvement Cost ( €)
New boiler only Equipment with gas condensing boiler 6,000*
Full renovation Renovation including insulation, new windows, gascondensing boiler
35,644**
*http://www.buderus.de/Online_Anwendungen/Heizsystemberater-2229947.html
** Costs of a single family house were taken from http://www.energiesparen-im-haushalt.de/energie/bauen-
und-modernisieren/modernisierung-haus/modernisierung-kosten-haus.html. Taking into account the reduced
material costs of a row house, 67% of those costs was used here .
7.3.2 LCC for construction plus use phase
Table 7-3 summarizes the costs associated with the use phase of the scenariosconsidered. It becomes clear that compared to the unimproved standard house with
conventional gas heater both improvement scenarios demonstrate considerable savings,financially speaking. While the total savings are over fourfold in case of the renovatedhouse’s use phase, the sum gained would suffice to cover only 0.45 more renovations,

8/14/2019 Environmental Performance in Low Carbon Electricity Systems
http://slidepdf.com/reader/full/environmental-performance-in-low-carbon-electricity-systems 56/63
56
compared with 0.57 new boilers affordable with the gain from the scenario “new boiler
only”. This means that if we deduct the savings of the use phase from the constructioncosts, the available number of new boilers amount to 383, and the number of fullrenovations to 51, that is, about 7.5 more new boilers than full renovations.
Table 7-3: Costs and savings of the use phase of improvement options
Consumption (kWh) over 20 years Energy costs over 20 years (€)
gas electricity renovation standard house savings(€)
New boileronly
474,158.94 9015.28 36300 39,691.58 3,391.58
Fullrenovation
313,619.56 8651.67 23565 16,126.31
7.4 Results & Discussion
In the section below the reduction/saving potential of the different scenarios will be shownwith regards to various environmental aspects. Unlike in other case studies where impactswere compared, the environmental gains are quantified and visualized relative to thebaseline scenario of the standard house. Therefore, in all figures below, positive valuesmean larger environmental benefit, while negative values mean an environmental impactlarger than that of the baseline. In order to quantify environmental benefits of thescenarios, the gains of each scenario were multiplied by the number of affordable
improvements. Therefore:Considering only the construction costs (henceforth “construction only”):
New boiler only: [environmental benefit compared to standard house] * 167
Full renovation: [environmental benefit compared to standard house] * 28
Considering the construction costs and use phase savings (henceforth “construction plus
use”):
New boiler only: [environmental benefit compared to standard house] * 383
Full renovation: [environmental benefit compared to standard house] * 51
7.4.1 Primary Energy Demand (PED) reduction (net calorific value, in MJ): Figure7-1
PED reduction is by far the highest when considering the use phase in the lifecycle costing. Due to the large savings during the use phase many moreimprovements can be made with 1 million Euros of investment (see section 7.3.2).
Whether or not the use phase savings are taken into account, the ranking ofscenarios does not change. The new boilers with increased efficiency may notresult in as high a reduction as the reduction when insulation is also provided, butmultiplied by the number of affordable improvements, the total savings becomesignificantly higher. This effect only multiplies when use phase savings areconsidered.

8/14/2019 Environmental Performance in Low Carbon Electricity Systems
http://slidepdf.com/reader/full/environmental-performance-in-low-carbon-electricity-systems 57/63
57
-10,000
0
10,000
20,000
30,000
40,000
50,000
60,000
70,000
80,000
90,000
new boiler only full renovation new boiler only full renovation
Construction plus use phase Construction phase only
N e t r e d u c t i o n
o f P E D ( n e t c a l . v a l u e , i n G J )
PED from non-renewable resources (net cal. value) [GJ]
PED from renewable resources (net cal. value) [GJ]
Figure 7-1: Reduction of the Primary Energy Demand (net calorific value, GJ) of the
standard house’s use phase under various scenarios.
7.4.2 Global Warming and CO2 emission reduction: Figure 7-2
The pattern visible with the reduction of CO2(-equivalent) emissions is very muchlike the patterns discernable in PED because unlike in Case Study 6: building anew house for 1 million Euros, the same grid mix conditions apply.
Construction and use phase costs considered all scenarios benefit from the usephase savings that allow for further houses to be equipped with gas boiler orrenovated.
Even when construction phase costs are considered alone, the new boiler only
scenario takes the lead by about 1.5 as much reduction as result from the fullrenovation. In simple words the much fewer affordable full renovations cannotcompete with the multiplied effect of installing a new boiler.

8/14/2019 Environmental Performance in Low Carbon Electricity Systems
http://slidepdf.com/reader/full/environmental-performance-in-low-carbon-electricity-systems 58/63

8/14/2019 Environmental Performance in Low Carbon Electricity Systems
http://slidepdf.com/reader/full/environmental-performance-in-low-carbon-electricity-systems 59/63
59
Although not shown here, the impacts of the newly built PH and LEH can beexpected to behave similarly as the renovation option, only more dramatically,since the construction itself has an impact that is also dependent on the currentgrid mix including high sulphur content fossil fuels.
0%
50%
100%
150%
200%
250%
AP [kg SO2-Equiv.] EP [kg Phosphate-Equiv.]
GWP (CO2e) [kg CO2-Equiv.]
POCP [kg Ethene-Equiv.]
R e l a t i v e r e d u c t i o n i n s e l e c t e d i m p a c t c a t e g o r i e s
Construction+use: Standard+gascondens Construction+use: Renovation
Construction only: Standard+gascondens Construction only: Renovation
Figure 7-3: Reduction in selected impact categories by the various investment scenarios.
Reduction by the “Standard plus gas condens” scenario with investment inconstruction phase only is considered as 100% in each of the impactcategories. Reduction by the other scenarios is given in percentages relativeto this scenario.
7.5 Conclusions
As was demonstrated already in Case Study 6: building a new house for 1 millionEuros, power is in numbers. With current cost prices, the number of affordablesmall-scale solutions has a much more powerful potential to reduce environmental
impacts.
Even though it could have been presumed that considering use phase savings incosts could improve the position of the full renovation scenario, the savingsrelative to the cost of the improvement still favoured the new boiler only scenario.This means that the multiplication effect of the new boiler only scenario was evenhigher than that of the full renovation scenario.
While in PED and GWP reduction, the new boiler only scenario was about 1.5 to 2times more successful than the full renovation scenario, in the impact categoriesAP, EP and to a lesser degree POCP, the new boiler only scenario was about 5-8
times more successful. This can be attributed to the fact that the renovation phasealso has environmental impacts, in relative terms higher in AP and EP than inGWP, due to the higher dependence on fossil fuels other than natural gas.
8/14/2019 Environmental Performance in Low Carbon Electricity Systems
http://slidepdf.com/reader/full/environmental-performance-in-low-carbon-electricity-systems 60/63
60
Literature
COM2007 Renewable Energy Road Map. Renewable energies in the 21stcentury: building a more sustainable future. Communication from
the commission to the council and European Parliament. Brussels,10.1.2007. COM(2006) 848 final
ECOMOTORS2008 de Almeida, A.T., Ferreira , F.J.T.E., Fong, J., Fonseca, P. (2008)EUP Lot 11 Motors Final Report. ISR University of Coimbra,Portugal. Available athttp://www.ecomotors.org/files/Lot11_Motors_1-8_280408_final.pdf
ISET2005 Institut für Solare Energieversorgungstechnik (ISET) (2006).Effizienz der Windenergie - Auszug aus: Windenergie ReportDeutschland 2005. Erstellt im Auftrag des Bundesministeriums fürUmwelt, Naturschutz und Reaktorsicherheit. Überarbeiteter und
ergänzter Sonderdruck des Bundesverbandes WindEnergie e.V.,Berlin 2006WINDGUARD2007 Deutsche WindGuard GmbH (2007). Kostensituation der
Windenergienutzung an LandMEPS2009 De Almeida, A.T., Boteler, R., Brunner, C.U., Doppelbauer, M.,
Hoyt, W. (2009) Electric Motor MEPS Guide. 1st Edition. Zurich,Switzerland.
PE INTERNATIONAL
2009 Ecodesign Toolbox 3. A parameterized model reflecting the lifecycle of a house with all ist energy-using equipment.August 2009.Delivered to the European Copper Institute.

8/14/2019 Environmental Performance in Low Carbon Electricity Systems
http://slidepdf.com/reader/full/environmental-performance-in-low-carbon-electricity-systems 61/63
61
Supplement A Parameter settings of the 3 housing types(all row houses with buildings on either sides)
standard house low energy house passive house
Base parameters
lifetime of building 50 50 50
new building or renovation new house new house new house
Building settings
Building geometry
length (m) 7.22 7.22 7.22
width (m) 9 9 9
storey height (m) 2.7 2.7 2.7
storey number 2 2 2
flap tile height (m) 0 0 0
selection of basement (on or off) off off off
window (south) (m2) 6 16 22
window (west & east) (m2) 0 0 0
window (north) (m2) 5 4 4
Building material
Selection and definition of exterior wall
Selection of exterior wall (brick, sand-lime
brick, aerated concrete wooden wallboard) brick sand-lime brick
sand-lime
brick
Selection of u-value exterior wall
(calculated or typed in) typed in typed in typed in
U-value exrerior wall typed in (W/(m2*K)) 0.431907 0.06159 0.035736
Definition of wall types
Vertically perforated brick wall
Thickness of layers
Bricks (m) 0.2359
Density of materials
Bricks (kg/m3) 1000
Sand lime brick wall
Thickness of layers
EPS insulation (m) 0.0439 0.067544
Bricks (m) 0.1131 0.11114
Roof
Thickness of materials
Mineral wool for insulation (m) 0.1 0.2 0.3
Thickness of materials
Concrete (m) 0.16 0.16 0.16
EPS (m) 0.04 0.2 0.3Tubes and cable
cable (kg) 100 100 100
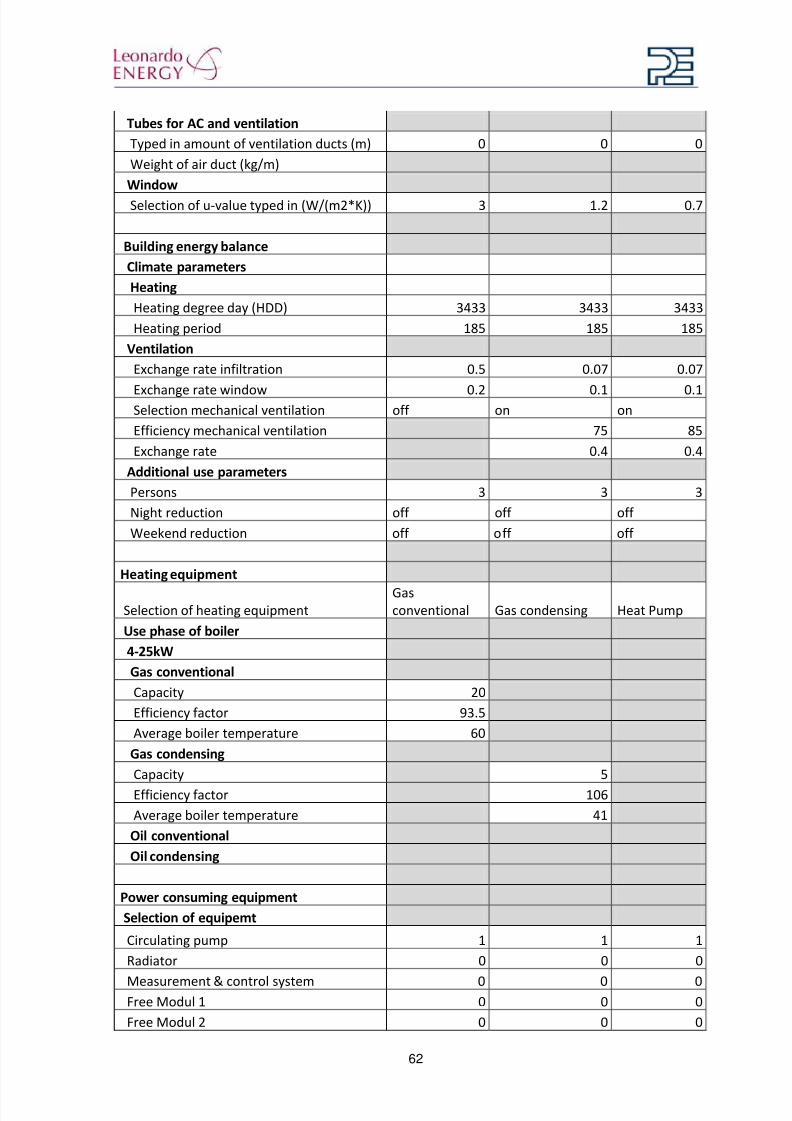
8/14/2019 Environmental Performance in Low Carbon Electricity Systems
http://slidepdf.com/reader/full/environmental-performance-in-low-carbon-electricity-systems 62/63
62
Tubes for AC and ventilation
Typed in amount of ventilation ducts (m) 0 0 0
Weight of air duct (kg/m)
Window
Selection of u-value typed in (W/(m2*K)) 3 1.2 0.7
Building energy balance
Climate parameters
Heating
Heating degree day (HDD) 3433 3433 3433
Heating period 185 185 185
Ventilation
Exchange rate infiltration 0.5 0.07 0.07
Exchange rate window 0.2 0.1 0.1Selection mechanical ventilation off on on
Efficiency mechanical ventilation 75 85
Exchange rate 0.4 0.4
Additional use parameters
Persons 3 3 3
Night reduction off off off
Weekend reduction off off off
Heating equipment
Selection of heating equipmentGasconventional Gas condensing Heat Pump
Use phase of boiler
4-25kW
Gas conventional
Capacity 20
Efficiency factor 93.5
Average boiler temperature 60
Gas condensing
Capacity 5
Efficiency factor 106
Average boiler temperature 41
Oil conventional
Oil condensing
Power consuming equipment
Selection of equipemt
Circulating pump 1 1 1
Radiator 0 0 0
Measurement & control system 0 0 0Free Modul 1 0 0 0
Free Modul 2 0 0 0

8/14/2019 Environmental Performance in Low Carbon Electricity Systems
http://slidepdf.com/reader/full/environmental-performance-in-low-carbon-electricity-systems 63/63
Use phase
Circulating Pump
Power demand for application 266 266 266
Power demand for loss 0 0 0
Room air conditioner
Cooling on or off off off off
SEER of cooling
Electric radiator
Heat pump
COP of heat pump 4
Power Supply
Hardcoal 19.45 19.45 19.45
Lignite 11 11 11Natural gas 17.7 17.7 17.7
Fuel oil 6.22 6.22 6.22
Nuclear 33 33 33
Hydro power 11.3 11.3 11.3
Solar 0.1 0.1 0.1
Wind 1.23 1.23 1.23