Environmental performance evaluation of Ro-Ro passenger ... · Marine Environment Protection...
13
General rights Copyright and moral rights for the publications made accessible in the public portal are retained by the authors and/or other copyright owners and it is a condition of accessing publications that users recognise and abide by the legal requirements associated with these rights. Users may download and print one copy of any publication from the public portal for the purpose of private study or research. You may not further distribute the material or use it for any profit-making activity or commercial gain You may freely distribute the URL identifying the publication in the public portal If you believe that this document breaches copyright please contact us providing details, and we will remove access to the work immediately and investigate your claim. Downloaded from orbit.dtu.dk on: Apr 21, 2020 Environmental Performance Evaluation of Ro-Ro Passenger Ferry Transportation Danish information paper for the work in the MEPC committee under The International Maritime Organisation, IMO in London, January 2012 Kristensen, Hans Otto Holmegaard; Hagemeister, Constantin Publication date: 2012 Document Version Publisher's PDF, also known as Version of record Link back to DTU Orbit Citation (APA): Kristensen, H. O. H., & Hagemeister, C. (2012). Environmental Performance Evaluation of Ro-Ro Passenger Ferry Transportation: Danish information paper for the work in the MEPC committee under The International Maritime Organisation, IMO in London, January 2012.
Transcript of Environmental performance evaluation of Ro-Ro passenger ... · Marine Environment Protection...

General rights Copyright and moral rights for the publications made accessible in the public portal are retained by the authors and/or other copyright owners and it is a condition of accessing publications that users recognise and abide by the legal requirements associated with these rights.
Users may download and print one copy of any publication from the public portal for the purpose of private study or research.
You may not further distribute the material or use it for any profit-making activity or commercial gain
You may freely distribute the URL identifying the publication in the public portal If you believe that this document breaches copyright please contact us providing details, and we will remove access to the work immediately and investigate your claim.
Downloaded from orbit.dtu.dk on: Apr 21, 2020
Environmental Performance Evaluation of Ro-Ro Passenger Ferry TransportationDanish information paper for the work in the MEPC committee under The InternationalMaritime Organisation, IMO in London, January 2012Kristensen, Hans Otto Holmegaard; Hagemeister, Constantin
Publication date:2012
Document VersionPublisher's PDF, also known as Version of record
Link back to DTU Orbit
Citation (APA):Kristensen, H. O. H., & Hagemeister, C. (2012). Environmental Performance Evaluation of Ro-Ro PassengerFerry Transportation: Danish information paper for the work in the MEPC committee under The InternationalMaritime Organisation, IMO in London, January 2012.

Trafikdage på Aalborg Universitet 2011 ISSN 1603 9696
1
Environmental Performance Evaluation of Ro-Ro Passenger Ferry Transportation
Authors: Hans Otto Holmegaard Kristensen ([email protected]) The Technical University of Denmark Constantin Hagemeister. Nordic Yards. Wismar
Abstract With increasing focus on the environmental performance of different transport modes (for example trucks, trains, ships and aircraft) it is of utmost importance that the different transport modes are compared on an equal basis so that the environmental impact, defined as energy demand and/or emissions per transport unit, is related to the same unit for the different transport forms. For Ro-Ro passenger ferries it can be difficult to find a suitable common transport unit, as they often transport a mix of cargo, such as passengers, passenger cars, trucks, lorries, busses and other rolling transport units. In this paper a method for determination of a common transport unit for Ro-Ro passenger ships will be described. Ro-Ro Passenger Ships (Fig. 1 and 2) A Ro-Ro passenger ship (often also called a Ro-Ro ferry or even just a ferry) is a passenger ship which can carry more than 12 passengers (a ship carrying less than 12 passengers is by definition a cargo ship) and which has one or more cargo decks for carriage of rolling cargo, such as cars, trucks, lorries and other rolling cargo. The size and capacity of Ro-Ro passenger ships vary considerably with a length ranging from 20 m up to more than 200 m (the largest Ro-Ro passenger ship delivered in 2010 has a length of 240 m and an overall Ro-Ro capacity of 5500 lane metres).

Trafikdage på Aalborg Universitet 2011 ISSN 1603 9696
2
Fig. 1 1200 lane metre Ro-Ro passenger ship (Mette Mols) for 600 passengers
Fig. 2 1000 lane metre Ro-Ro passenger ship (Pearl Seaways) for 2200 passengers

Trafikdage på Aalborg Universitet 2011 ISSN 1603 9696
3
EEDI (Energy Efficiency Design Index) In the International Maritime Organization (IMO) there has been a debate over the last two to three years about the so-called Energy Efficiency Design Index (EEDI) expressing the CO2 emissions per unit transport work. For most ships the unit for the EEDI will be gram CO2 per ton deadweight per nautical mile. Originally, this unit was also suggested for Ro-Ro passenger ships. However, this led to a very large scatter in the statistical data of the EEDI in calculations of the Index for a large statistical sample of Ro-Ro passenger ships. One of the reasons for this scatter is the ship design diversity of Ro-Ro passenger ships. Some of the ships carry relatively few passengers and much cargo such as lorries, resulting in a relatively high deadweight, while other Ro-Ro passenger ferries carry many passengers and focus more on service and amusement (‘eat, drink and sleep’) for the passengers. Such a concept leads to large passenger spaces (cafeterias, restaurants and cabins) requiring large ships with a relatively low deadweight. In both cases a large amount of volume is needed, which in general is proportional to the gross register tonnage (GT) of the ship. Therefore, IMO has suggested that in the EEDI calculation procedure for Ro-Ro passenger ships, deadweight has to be replaced by GT, so that the unit of the EEDI for Ro-Ro passenger ships is gram CO2/GT/nautical mile. Energy Efficiency Operational Index (EEOI) For existing ships, IMO has suggested introducing a so-called Energy Efficiency Operational Indicator. The Marine Environment Protection Committee (MEPC) has agreed to circulate guidelines (MEPC.1 - Circ.684) for voluntary use of the Ship Energy Efficiency Operational Indicator (EEOI). These guidelines can be used to establish a consistent approach to voluntary use of an EEOI, which can be used in the evaluation of a ship’s performance with regard to CO2 emissions. As the amount of CO2 emitted from a ship is directly related to the consumption of bunker fuel oil, the EEOI can also provide useful information on a ship’s performance with regard to fuel efficiency. These EEOI Guidelines present the concept of an indicator for the energy efficiency of a ship in operation, as an expression of efficiency in the form of CO2 emitted per unit of transport work. As the Guidelines are recommendatory in nature and present a possible use of an operational indicator the shipowners, ship operators and parties concerned are invited to implement either these Guidelines or an equivalent method in their environmental management systems and consider adoption of the principles herein when developing plans for performance monitoring. In its most simple form the Energy Efficiency Operational Indicator is defined as the ratio of mass of CO2 emitted per unit of transport work:
EEOI = Mass of CO2/ (transport work) Transport Work and Allocation Principle For vessels such as Ro-Ro passenger ships carrying a mixture of passengers (either travelling with their cars or as pure 'foot passengers') and freight some operators may wish to consider as appropriate a kind of weighted average based on the relative distribution of passengers and freight or the use of other parameters or indicators. On a Ro-Ro passenger ship some of the internal volume is occupied for the carriage of rolling cargo as for example trucks/trailers and cars, while other volume is dedicated to carrying passengers, which entails volume for restaurants, cafeterias, corridors, toilets, different types of service rooms, galleys and pantries.
Trafikdage på Aalborg Universitet 2011 ISSN 1603 9696
4
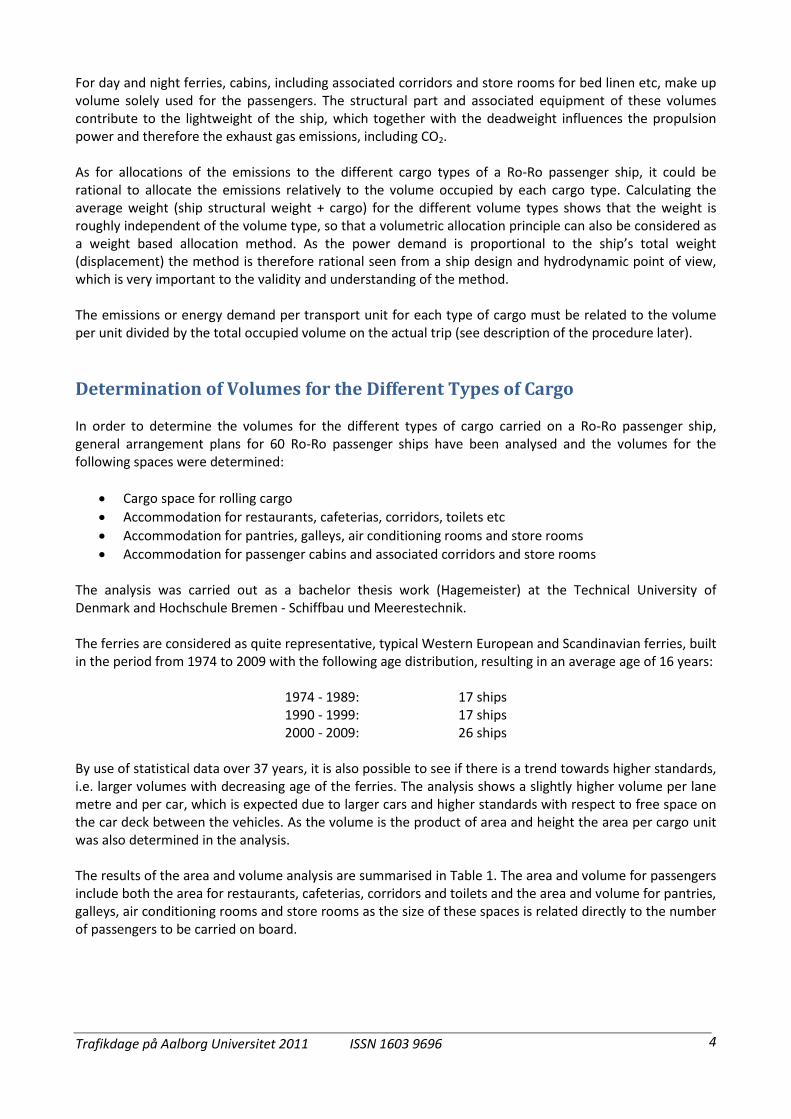
For day and night ferries, cabins, including associated corridors and store rooms for bed linen etc, make up volume solely used for the passengers. The structural part and associated equipment of these volumes contribute to the lightweight of the ship, which together with the deadweight influences the propulsion power and therefore the exhaust gas emissions, including CO2. As for allocations of the emissions to the different cargo types of a Ro-Ro passenger ship, it could be rational to allocate the emissions relatively to the volume occupied by each cargo type. Calculating the average weight (ship structural weight + cargo) for the different volume types shows that the weight is roughly independent of the volume type, so that a volumetric allocation principle can also be considered as a weight based allocation method. As the power demand is proportional to the ship’s total weight (displacement) the method is therefore rational seen from a ship design and hydrodynamic point of view, which is very important to the validity and understanding of the method. The emissions or energy demand per transport unit for each type of cargo must be related to the volume per unit divided by the total occupied volume on the actual trip (see description of the procedure later). Determination of Volumes for the Different Types of Cargo In order to determine the volumes for the different types of cargo carried on a Ro-Ro passenger ship, general arrangement plans for 60 Ro-Ro passenger ships have been analysed and the volumes for the following spaces were determined:
• Cargo space for rolling cargo • Accommodation for restaurants, cafeterias, corridors, toilets etc • Accommodation for pantries, galleys, air conditioning rooms and store rooms • Accommodation for passenger cabins and associated corridors and store rooms
The analysis was carried out as a bachelor thesis work (Hagemeister) at the Technical University of Denmark and Hochschule Bremen - Schiffbau und Meerestechnik. The ferries are considered as quite representative, typical Western European and Scandinavian ferries, built in the period from 1974 to 2009 with the following age distribution, resulting in an average age of 16 years:
1974 - 1989: 17 ships 1990 - 1999: 17 ships 2000 - 2009: 26 ships
By use of statistical data over 37 years, it is also possible to see if there is a trend towards higher standards, i.e. larger volumes with decreasing age of the ferries. The analysis shows a slightly higher volume per lane metre and per car, which is expected due to larger cars and higher standards with respect to free space on the car deck between the vehicles. As the volume is the product of area and height the area per cargo unit was also determined in the analysis. The results of the area and volume analysis are summarised in Table 1. The area and volume for passengers include both the area for restaurants, cafeterias, corridors and toilets and the area and volume for pantries, galleys, air conditioning rooms and store rooms as the size of these spaces is related directly to the number of passengers to be carried on board.
Trafikdage på Aalborg Universitet 2011 ISSN 1603 9696
5
Table 1 Area and volume equivalents.
Unit General Low comfort High comfort
m2 per lane metre 4 - -
m3 per lane metre 24 - -
m2 per car 15 - -
m3 per car 67.5 - -
m2 per unberthed passenger 3.5 - -
m3 per unberthed passenger 10 7 13
m2 per berthed passenger 4.5 - -
m3 per berthed passenger 13 - -
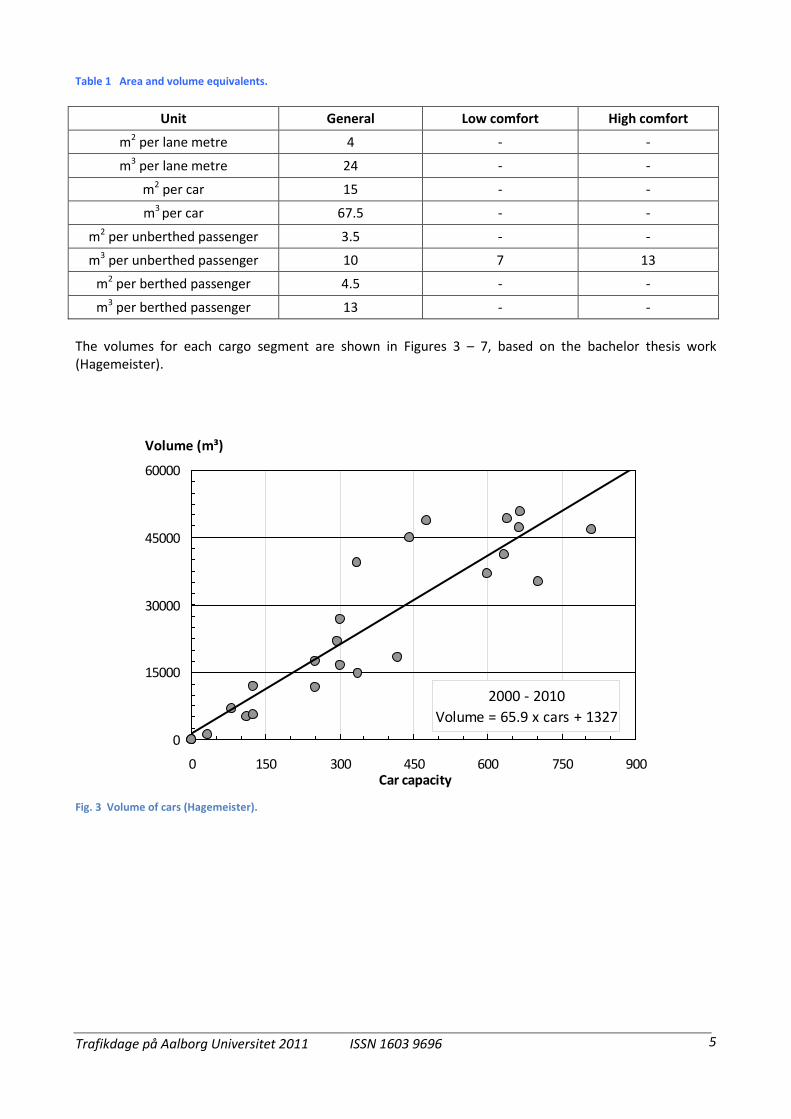
The volumes for each cargo segment are shown in Figures 3 – 7, based on the bachelor thesis work (Hagemeister).
2000 - 2010Volume = 65.9 x cars + 1327
0
15000
30000
45000
60000
0 150 300 450 600 750 900Car capacity
Volume (m³)
Fig. 3 Volume of cars (Hagemeister).

Trafikdage på Aalborg Universitet 2011 ISSN 1603 9696
6
2000 - 2010Volume = 24.1 x lanemetres
0
20000
40000
60000
80000
100000
0 1000 2000 3000 4000Lanemetres
Volume (m³)
Fig. 4 Volume of trucks and lorries (Hagemeister).
Volume = 9.2 x passengers
Volume = 5.0 x passengers
0
6000
12000
18000
24000
30000
0 600 1200 1800 2400 3000Passengers
Volume (m³)
High comfort class
Low comfort class
a
Fig. 5 Volume of passenger related accommodation (restaurants, cafeterias, corridors, toilets etc) (Hagemeister).
Trafikdage på Aalborg Universitet 2011 ISSN 1603 9696
7
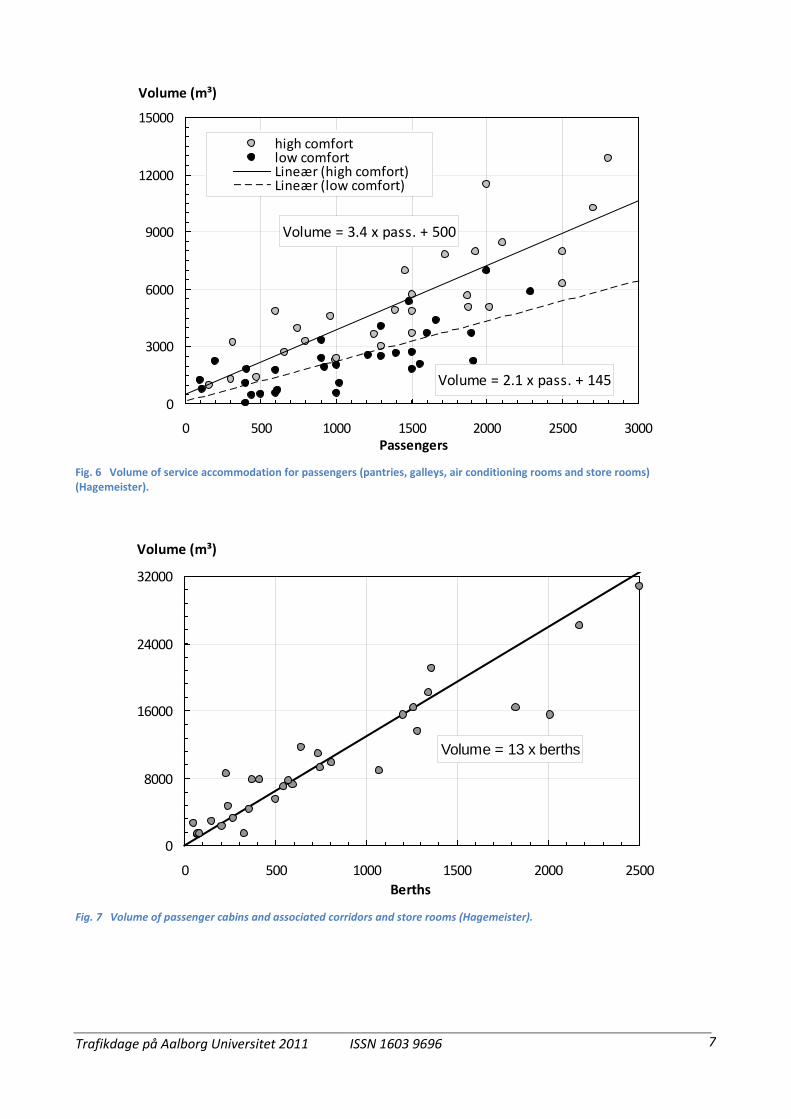
Volume = 3.4 x pass. + 500
Volume = 2.1 x pass. + 1450
3000
6000
9000
12000
15000
0 500 1000 1500 2000 2500 3000Passengers
Volume (m³)
high comfortlow comfortLineær (high comfort)Lineær (low comfort)
Fig. 6 Volume of service accommodation for passengers (pantries, galleys, air conditioning rooms and store rooms) (Hagemeister).
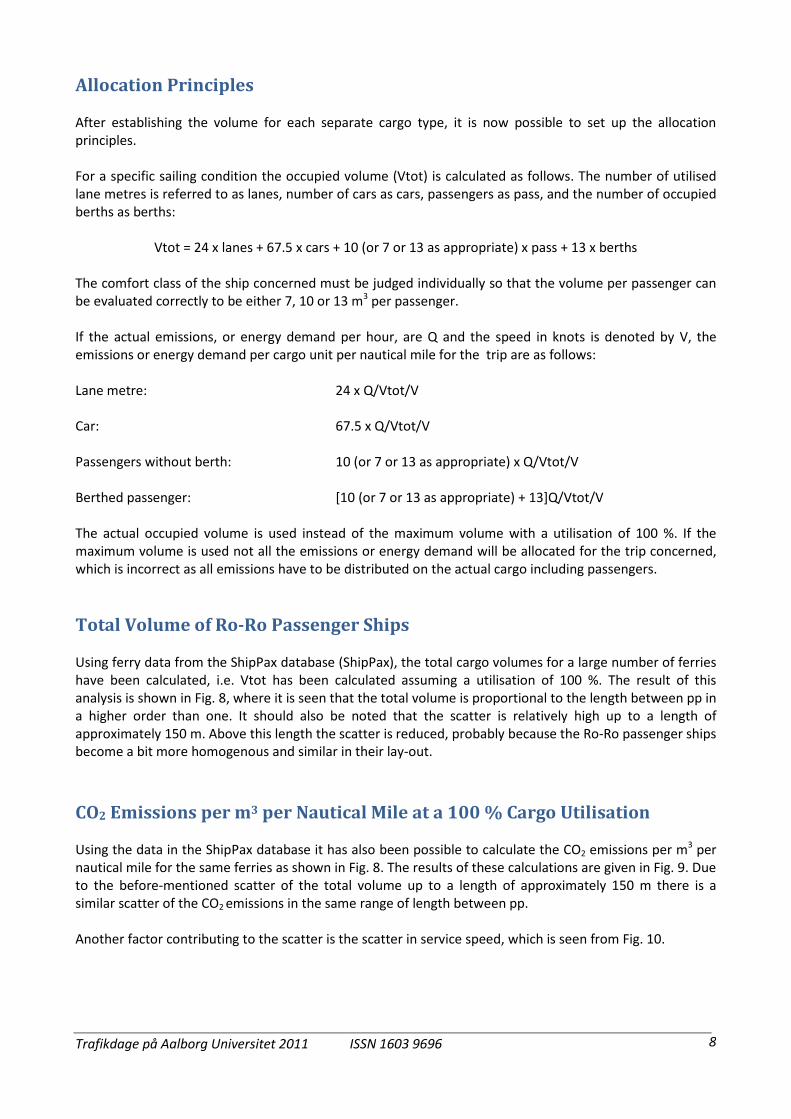
Volume = 13 x berths
0
8000
16000
24000
32000
0 500 1000 1500 2000 2500Berths
Volume (m³)
Fig. 7 Volume of passenger cabins and associated corridors and store rooms (Hagemeister).
Trafikdage på Aalborg Universitet 2011 ISSN 1603 9696
8
Allocation Principles After establishing the volume for each separate cargo type, it is now possible to set up the allocation principles. For a specific sailing condition the occupied volume (Vtot) is calculated as follows. The number of utilised lane metres is referred to as lanes, number of cars as cars, passengers as pass, and the number of occupied berths as berths:
Vtot = 24 x lanes + 67.5 x cars + 10 (or 7 or 13 as appropriate) x pass + 13 x berths The comfort class of the ship concerned must be judged individually so that the volume per passenger can be evaluated correctly to be either 7, 10 or 13 m3 per passenger. If the actual emissions, or energy demand per hour, are Q and the speed in knots is denoted by V, the emissions or energy demand per cargo unit per nautical mile for the trip are as follows: Lane metre: 24 x Q/Vtot/V Car: 67.5 x Q/Vtot/V Passengers without berth: 10 (or 7 or 13 as appropriate) x Q/Vtot/V Berthed passenger: [10 (or 7 or 13 as appropriate) + 13]Q/Vtot/V The actual occupied volume is used instead of the maximum volume with a utilisation of 100 %. If the maximum volume is used not all the emissions or energy demand will be allocated for the trip concerned, which is incorrect as all emissions have to be distributed on the actual cargo including passengers. Total Volume of Ro-Ro Passenger Ships Using ferry data from the ShipPax database (ShipPax), the total cargo volumes for a large number of ferries have been calculated, i.e. Vtot has been calculated assuming a utilisation of 100 %. The result of this analysis is shown in Fig. 8, where it is seen that the total volume is proportional to the length between pp in a higher order than one. It should also be noted that the scatter is relatively high up to a length of approximately 150 m. Above this length the scatter is reduced, probably because the Ro-Ro passenger ships become a bit more homogenous and similar in their lay-out. CO2 Emissions per m3 per Nautical Mile at a 100 % Cargo Utilisation
Using the data in the ShipPax database it has also been possible to calculate the CO2 emissions per m3 per nautical mile for the same ferries as shown in Fig. 8. The results of these calculations are given in Fig. 9. Due to the before-mentioned scatter of the total volume up to a length of approximately 150 m there is a similar scatter of the CO2 emissions in the same range of length between pp. Another factor contributing to the scatter is the scatter in service speed, which is seen from Fig. 10.

Trafikdage på Aalborg Universitet 2011 ISSN 1603 9696
9
0
25000
50000
75000
100000
125000
30 70 110 150 190 230
Length pp (m)
Tota
l vol
ume
(m3 )
Fig. 8 Total volume for rolling cargo and passengers of Ro-Ro passenger ships (ShipPax 2011).
0
6
12
18
24
30
40 80 120 160 200 240
Length pp (m)
gram
CO
2/m
3 /nm
Fig. 9 CO2 emissions per m3 per nautical mile of Ro-Ro passenger ships (ShipPax 2011).

Trafikdage på Aalborg Universitet 2011 ISSN 1603 9696
10
8
12
16
20
24
28
32
30 70 110 150 190 230Length pp (m)
Serv
ice
spee
d (k
nots
)
Fig. 10 Service speed of Ro-Ro passenger ships (ShipPax 2011).
Comparison of CO2 Emissions per t Payload on Ro-Ro Ship and on Road It is seen from Fig. 9 that the average CO2 emissions for Ro-Ro passenger ships are roughly 10 g/m3/nautical mile with a 100 % utilisation of the ship. The average CO2 emissions per lane metre are therefore 24 x 10 = 240 g/lm/nautical mile = 240/1.852 = 130 g/lm/km. For Ro-Ro cargo ships operating at a normal service speed (Fig. 11) the corresponding figure is approximately 150 g/lm/nautical mile = 80 g/lm/km, depending on the ship’s size, according to Fig. 12. For a 15 m long truck carrying 30 t cargo the average CO2 emission is approximately 70 g/lm/km. By assuming that the same truck is transported (with a load of 30/15 = 2 t/lane metre) on a Ro-Ro passenger ship and a Ro-Ro cargo ship, the following specific CO2 emissions are obtained: Ro-Ro passenger ship: 130/2 = 65 g/t/km Ro-Ro cargo ship: 80/2 = 40 g/t/km Truck: 70/2 = 35 g/t/km Fig. 13 shows a comparison of CO2 emissions per lane metre per nautical mile for Ro-Ro passenger ships and Ro-Ro cargo ships.

Trafikdage på Aalborg Universitet 2011 ISSN 1603 9696
11
10
14
18
22
26
80 100 120 140 160 180 200
Length pp (m)
Serv
ice
spee
d (k
nots
)
Fig. 11 Service speed of Ro-Ro cargo ships (ShipPax 2011).
0
50
100
150
200
250
300
1000 1500 2000 2500 3000 3500 4000 4500
Lanemeter
CO2 e
mis
sion
s (g/
lm/n
aut.m
ile)
Fig. 12 CO2 emissions per lane metre per nautical mile of Ro-Ro cargo ships (ShipPax 2011).

Trafikdage på Aalborg Universitet 2011 ISSN 1603 9696
12
0
200
400
600
800
1000
1200
30 70 110 150 190 230
Length pp (m)
CO2 e
miss
ions
(g/l
m/n
aut.m
ile)
Ro-Ro cargo shipsRo-Ro passenger ships
Truck (15 m with 30 t cargo)
Fig. 13 CO2 emissions per lane metre per nautical mile of Ro-Ro ships versus trucks.
Conclusions
1. An analysis of the volume demand for different cargo types (lorries, cars and passengers) on Ro-Ro passenger ships shows that the volume per unit for the various cargo types is nearly independent of the ship size, i.e. it is nearly constant for the different cargo types.
2. Using the volume per cargo unit thus found, it is possible to allocate the emissions and energy demand on the different cargo segments relative to the actual volume each of them occupies. Calculations show that the average weight (ship weight + cargo weight) per volume is more or less on the same level for the different cargo segments, which means that the volumetric allocation method is also a weight based allocation method. Thus, the method is justified as the energy demand of a Ro-Ro passenger ship is proportional to the ship’s displacement.
3. Due to the diversity of Ro-Ro passenger ships, it is difficult to find accurate figures for the exhaust gas emissions and energy demand per transport unit. Especially, for smaller ferries the variation is great.
4. However, calculating the energy demand per ton cargo per km shows that the energy demand is highest for Ro-Ro passenger ships, less for Ro- Ro cargo ships and lowest when the cargo is carried by lorries.
Reference List
• Hagemeister, C: Determination of a suitable transport unit for evaluation of environmental performance of Ro-Ro passenger ships. Bachelor thesis from Hochschule Bremen - Natur und Technik Studiengang - Schiffbau und Meerestechnik 2010.
• ShipPax database - extract from January 2011. ShipPax information, Halmstad, Sweden.