Environmental Multimedia Distribution of Nanomaerials · Environmental Multimedia Distribution of...
44
Environmental Multimedia Distribution of Nanomaerials NSF: DBI-0830117 Yoram Cohen Center for Environmental Implications of Nanomaterials, Chemical and Biomolecular Engineering Department, and Institute of the Environment and Sustainability University of California, Los Angeles Fate & Transport Analysis Models of ENM Toxicity Environmental Impact Assessment http://www.nanoinfo.org
Transcript of Environmental Multimedia Distribution of Nanomaerials · Environmental Multimedia Distribution of...

Environmental Multimedia Distribution of Nanomaerials
NSF: DBI-0830117
Yoram Cohen Center for Environmental Implications of Nanomaterials,
Chemical and Biomolecular Engineering Department, and Institute of the Environment and Sustainability
University of California, Los Angeles
Fate & Transport Analysis
Models of ENM Toxicity
Environmental Impact Assessment http://www.nanoinfo.org

Is this Engineered Nanomaterial Environmentally Safe?
Physicochemical Characterization
In Vitro In Vivo Toxicity
LT Exp.
Exposure Assessment
Transport and Fate studies/
Modeling
Environmental Concentrations
Hazard Identification
In Silico Toxicity Monitoring
Quantitative Nano-SAR
Mechanistic Conceptual
• Dose- Response • Hazard Thresholds In
form
atio
n/D
ata
Man
agem
ent
HT Exp.
Environmental Impact Assessment
Experimental Studies / M
odels
Decision Analysis
Product manufacturing & use approval
Product/process redesign Exposure control

Outline Engineered nanomaterials (ENMs) do not respect environmental phase boundaries
Range of exposure concentrations and releases of ENMs
Fate & transport (F&T) analysis (estimate environmental exposure concentrations): • Single medium models • Is the particle size distribution important?
Deterministic F&T models specific to ENMs
F&T exposure model selection: Complexity vs Uncertainty
Model validation

Particles
Atmosphere
Suspended Solids
Biota
Vegetation
Sediment Groundwater
Soil Matrix Water
Dry/Wet Deposition
Aerosolization
Runoff
Flooding
Dry/Wet Deposition
- Wind Resuspension
Environmental Intermedia Transport in a Multimedia System

Intermedia Transport of ENMs is Governed by their PSD Precipitation scavenging
Sedimentation
Wind resuspension Aerosolization
Dry deposition/collection
Rain Collection Efficiency
Particle Diameter (µm)
Rain
Col
lect
ion
Effic
ienc
y

Intermedia Transport of ENMs is Governed by their PSD Precipitation scavenging
Sedimentation
Wind resuspension Aerosolization
Dry deposition/collection
Rain Collection Efficiency
Particle Diameter (µm)
Rain
Col
lect
ion
Effic
ienc
y
Nanoparticles: - Transport processes are not constrained
by phase equilibria - Intermedia transport is affected
by particle size - Possible interfacial/interphase accumulation?
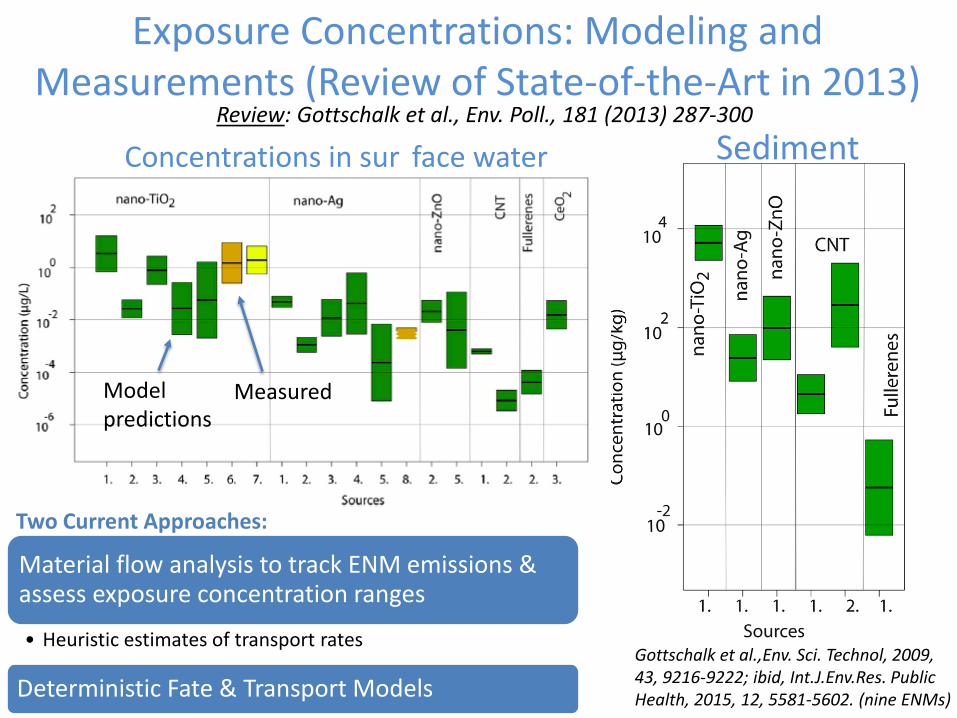
Exposure Concentrations: Modeling and Measurements (Review of State-of-the-Art in 2013)
Review: Gottschalk et al., Env. Poll., 181 (2013) 287-300
Model predictions
Measured
Concentrations in sur face water Sediment
Material flow analysis to track ENM emissions & assess exposure concentration ranges
• Heuristic estimates of transport rates
Deterministic Fate & Transport Models
Two Current Approaches:
Gottschalk et al.,Env. Sci. Technol, 2009, 43, 9216-9222; ibid, Int.J.Env.Res. Public Health, 2015, 12, 5581-5602. (nine ENMs)
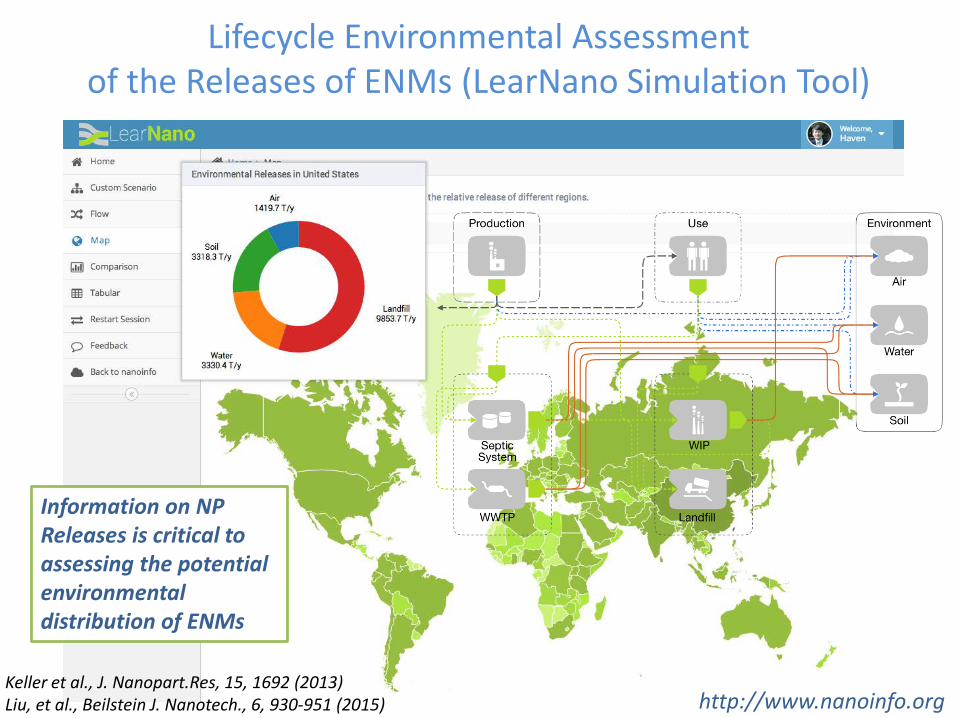
Lifecycle Environmental Assessment of the Releases of ENMs (LearNano Simulation Tool)
http://www.nanoinfo.org
Information on NP Releases is critical to assessing the potential environmental distribution of ENMs
Keller et al., J. Nanopart.Res, 15, 1692 (2013) Liu, et al., Beilstein J. Nanotech., 6, 930-951 (2015)
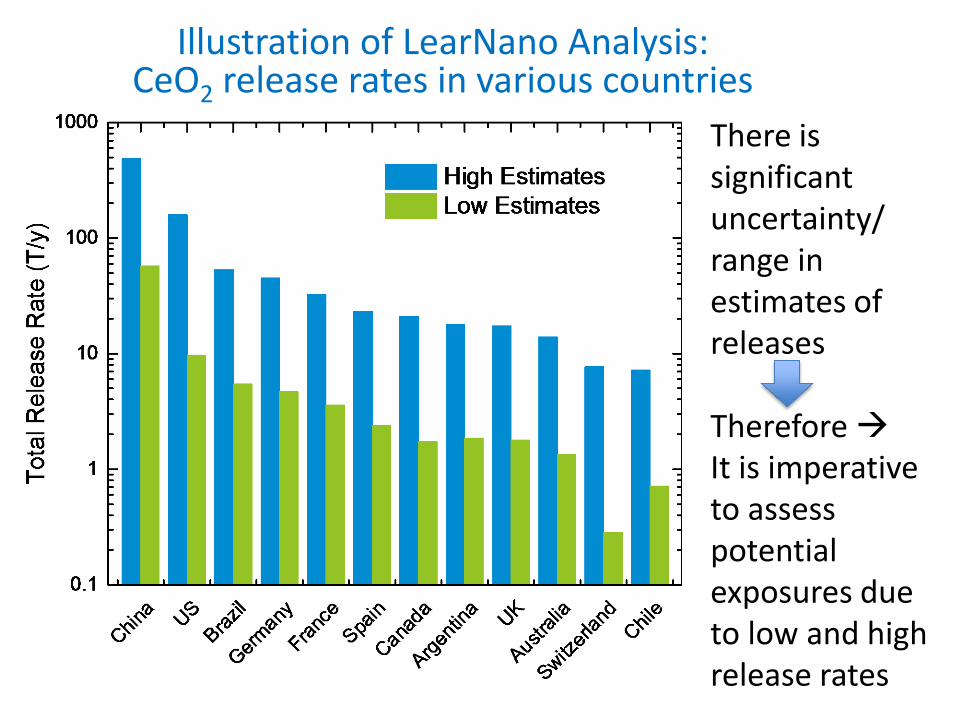
Illustration of LearNano Analysis: CeO2 release rates in various countries
There is significant uncertainty/ range in estimates of releases Therefore It is imperative to assess potential exposures due to low and high release rates

Illustration of LearNano Analysis: CeO2 release rates in various countries
There is significant uncertainty/ range in estimates of releases Therefore It is imperative to assess potential exposures due to low and high release rates
Caution: Would using an average or median values or upper/low estimates be acceptable from regulatory or other applications?

Contribution of various ENMs use applications to environmental mass distribution in Los Angeles
Simulation using LearNano/ MendNano: 1-year simulation
Major contributions: (i) Coatings, paints & pigments (ii) Energy, environment (iii) Cosmetics
Liu, et al., Beilstein J. Nanotech., 6, 930-951 (2015); ibid, Environ. Sci. Tech. , 48, 3281-3292 (2014).
Estimation of Releases requires compilation of data from multiples sources and where there may exist significant degree of data uncertainty & variability of various conditions (e.g., env., manufact., lifecycle)

Environmental Fate & Transport Analysis: Single-Medium Models
Atmospheric dispersion
• Extensive collection of models (analytical and numerical from box models to 3-D (some consider deposition)
Sediment transport in flowing streams • Analytical and numerical models
(typically consider a single size or a few size bins; recent models consider both homoaggregation, heteroaggregation and sedimentation)
Decreasing concentration
s,iv, 3( )i i ij E i j i
j j j j
C C Cu D Ct x x x x
δ ∂ ∂ ∂∂ ∂ + = + ∂ ∂ ∂ ∂ ∂
Agricultural drainage canal (SJV, CA) Surface water
( )( )ii i i i
C C K C R St
∂+ = − +
∂ i ju∇ ∇ ∇
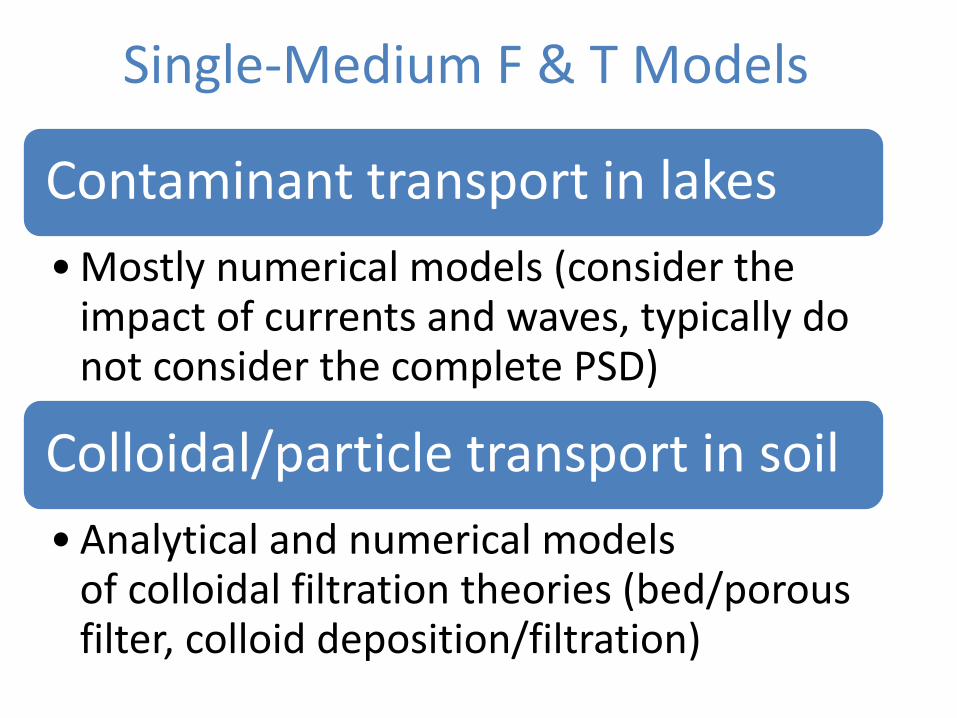
Single-Medium F & T Models
Contaminant transport in lakes •Mostly numerical models (consider the
impact of currents and waves, typically do not consider the complete PSD)
Colloidal/particle transport in soil •Analytical and numerical models
of colloidal filtration theories (bed/porous filter, colloid deposition/filtration)

Dispersion and Sedimentation in a Flowing Stream (Continuous Discharge: A Simple 1-D model for a single species)
C/Co
x/L
sed conv
river sed
V L tDaV h t
= = river D
E conv
V L tPecD t
= =
Vsed – sedimentation velocity Vriver – average current speed L – length of stream h - river depth DE – longitudinal dispersion coefficient
(1,1)
(1,100)
(1,10)
Lower Pec
Concentration varies significantly downstream from the release point
(Pec, Da)
(10,10)
(10,100)
(10,1)
Increasing Da
(Generalized solution in terms of dimensionless parameters)
∞

Spatial Explicit F&T Modeling of Nanoparticles in a Flowing Stream
• Quik, de Klein and Koelmans, Water Research, 80, 200-208 (2015): – Integration of the Smoluchowski Coagulation Equation with the
DUFLOW Modeling Studio for 1-D simulation of hydrology + solute F&T in an open channel. Simulations : River Dommel
Heteroaggregates
Homoagregates Heteroaggregates
Homoagregates Heterogeneous Channel Flow Homogenous
Channel Flow 5 Particle bins
Initial Conc: 10 ng/L

Aquatic Stream Model for ENMs (Water, Sediment, NPs, SPM)
Rhine river model: TiO2 Case study
• Series of linked aquatic compartments (approximates finite-difference approach)
• Considers NP particle size distribution (PSD)
• Suspended particulate matter (SPM) PSD: log-normal distribution
• Use of attachment efficiency (αhet-agg)
Praetorius et al., 2012, 46 (12), 6705–67132012
* Flows are in ton/yr
Approach can in principle be extended to include additional compartment and transport processes
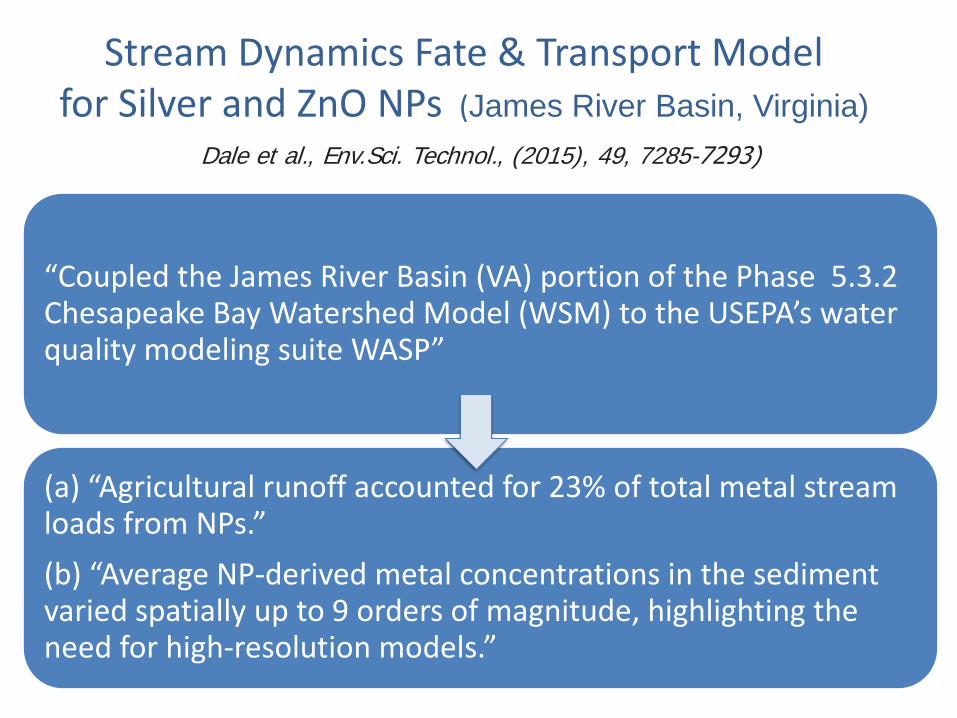
Stream Dynamics Fate & Transport Model for Silver and ZnO NPs (James River Basin, Virginia)
“Coupled the James River Basin (VA) portion of the Phase 5.3.2 Chesapeake Bay Watershed Model (WSM) to the USEPA’s water quality modeling suite WASP”
(a) “Agricultural runoff accounted for 23% of total metal stream loads from NPs.” (b) “Average NP-derived metal concentrations in the sediment varied spatially up to 9 orders of magnitude, highlighting the need for high-resolution models.”
Dale et al., Env.Sci. Technol., (2015), 49, 7285-7293)
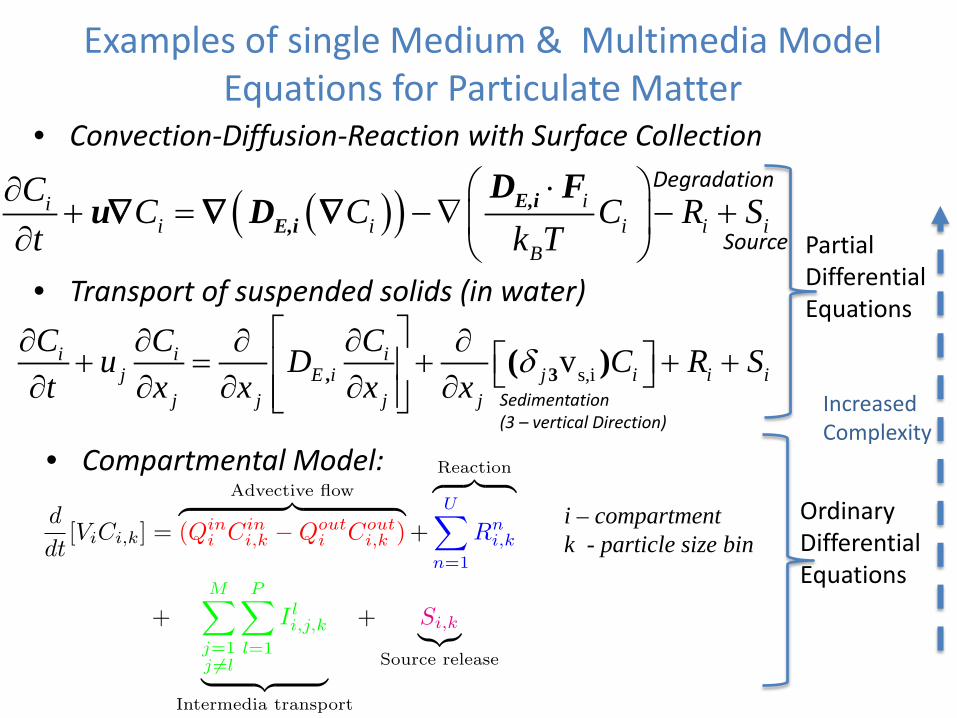
Examples of single Medium & Multimedia Model Equations for Particulate Matter
• Compartmental Model:
s,iv, 3( )i i ij E i j i i i
j j j j
C C Cu D C R St x x x x
δ ∂ ∂ ∂∂ ∂ + = + + + ∂ ∂ ∂ ∂ ∂
( )( ) iii i i i i
B
C C C C R St k T
⋅ ∂+ = − ∇ − + ∂
E,iE,i
D Fu D∇ ∇ ∇
• Convection-Diffusion-Reaction with Surface Collection
Partial Differential Equations
Ordinary Differential Equations
Increased Complexity
• Transport of suspended solids (in water)
Source
Degradation
Sedimentation (3 – vertical Direction)
i – compartment k - particle size bin
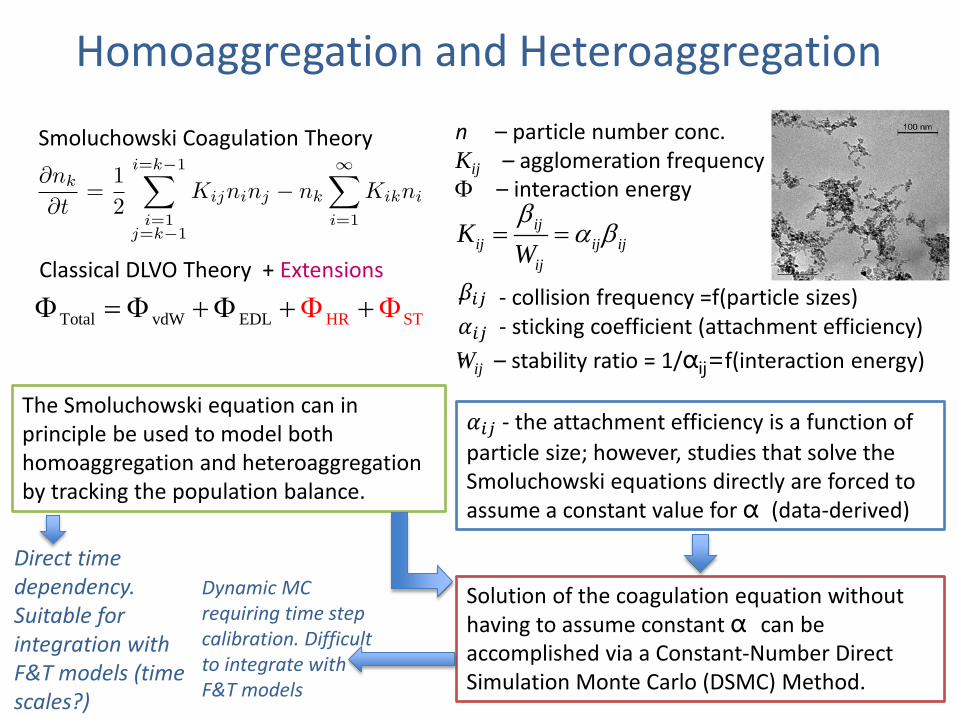
Homoaggregation and Heteroaggregation
Smoluchowski Coagulation Theory
Classical DLVO Theory + Extensions
Total vdW ED HRL STΦ = Φ + Φ +Φ Φ+
n – particle number conc. Kij – agglomeration frequency Φ – interaction energy
ijij ij ij
ij
KWβ
α β= =
- - collision frequency =f(particle sizes) 𝛼𝑖𝑖 - sticking coefficient (attachment efficiency) -
𝛽𝑖𝑖
Wij – stability ratio = 1/αij=f(interaction energy)
𝛼𝑖𝑖 - the attachment efficiency is a function of particle size; however, studies that solve the Smoluchowski equations directly are forced to assume a constant value for α (data-derived)
The Smoluchowski equation can in principle be used to model both homoaggregation and heteroaggregation by tracking the population balance.
Solution of the coagulation equation without having to assume constant α can be accomplished via a Constant-Number Direct Simulation Monte Carlo (DSMC) Method.
Direct time dependency. Suitable for integration with F&T models (time scales?)
Dynamic MC requiring time step calibration. Difficult to integrate with F&T models
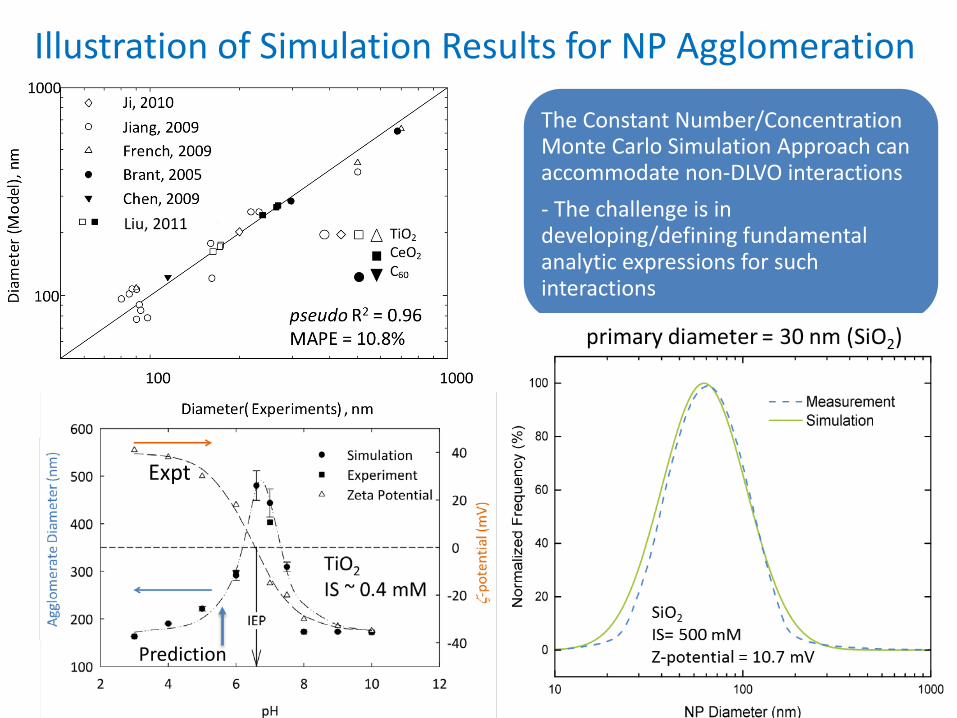
Illustration of Simulation Results for NP Agglomeration
The Constant Number/Concentration Monte Carlo Simulation Approach can accommodate non-DLVO interactions - The challenge is in developing/defining fundamental analytic expressions for such interactions
| |
Liu, 2011
Expt
Prediction
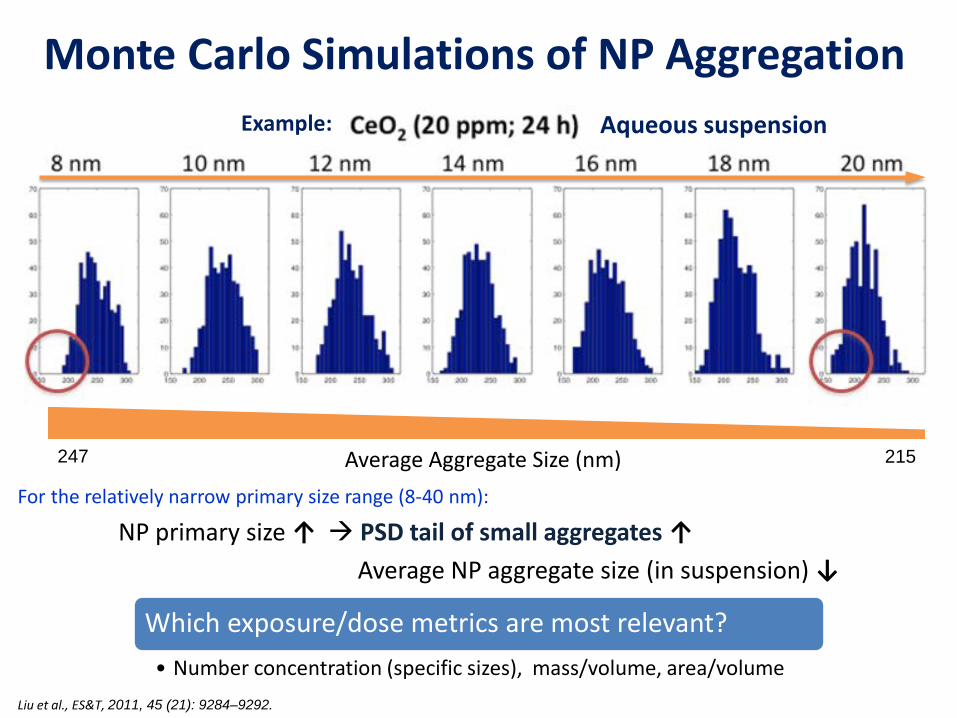
Monte Carlo Simulations of NP Aggregation
NP primary size ↑ PSD tail of small aggregates ↑ Average NP aggregate size (in suspension) ↓
Aqueous suspension
247 215 Average Aggregate Size (nm)
Liu et al., ES&T, 2011, 45 (21): 9284–9292.
Example:
For the relatively narrow primary size range (8-40 nm):
Which exposure/dose metrics are most relevant? • Number concentration (specific sizes), mass/volume, area/volume

Deterministic F&T Models and their Resource Requirements
• Spatial Models [C=C(x,t)]
• Hybrid Compartmental-Spatial Models [C=C(x,t) and C=C(t)]
• Compartmental Models
[C=C(t)]
Dynamic Models
[C=C(t)] Steady-State Models [C≠ C(t) ]
- Dependence of concentrations on position/location
- Site-specific scenarios

Deterministic F&T Models and their Resource Requirements
• Spatial Models [C=C(x,t)]
• Hybrid Compartmental-Spatial Models [C=C(x,t) and C=C(t)]
• Compartmental Models
[C=C(t)]
Dynamic Models
[C=C(t)] Steady-State Models [C≠ C(t) ]
- Spatially averaged concentrations (primarily regional scale)
- First tier analysis - Provide source input to media-
specific spatial models - Integrate with lifecycle analysis

Deterministic F&T Models and their Resource Requirements
• Spatial Models [C=C(x,t)]
• Hybrid Compartmental-Spatial Models [C=C(x,t) and C=C(t)]
• Compartmental Models
[C=C(t)]
Dynamic Models
[C=C(t)] Steady-State Models [C≠ C(t) ] Fundamental spatial transport models exist, but need to be adapted to account for NPs agglomeration, association with ambient matter and their potential unique physical, chemical and bio-transformations
Regional/global ( >1-10 km2 )
Regional/global/local ( >0.1 km2 )
No. Parameters Scale
Global/regional/local ( > 1-10 km2 )
Incr
easin
g N
umbe
r

Modeling the Environmental Distribution of Manufactured Nanomaterials (MNM)
MNM Fate & Transport
Model
Geography & Meteorology
MNM properties: (e.g., Particle size
distribution, reactivity, solubility)
Transport Processes
(Intermedia and within environmental media)
MNM Source Release Rates
MNM Environmental Distribution, Concentrations, intermedia transport rates

Compartmental Aquatic Model (NP Persistence)
USETox model adapted to NPs to estimate impact on aquatic environments • Accounts for PSD • Utilizes attachment efficiency • Assess persistence of NPs • Partially empirical • Requires calibration for specific NPs Box Model
Compartmental Residence Time (days)
Salieri, Righi, Pasteris and Olsen, Sci. Total Env., (2015), 505, 494-502
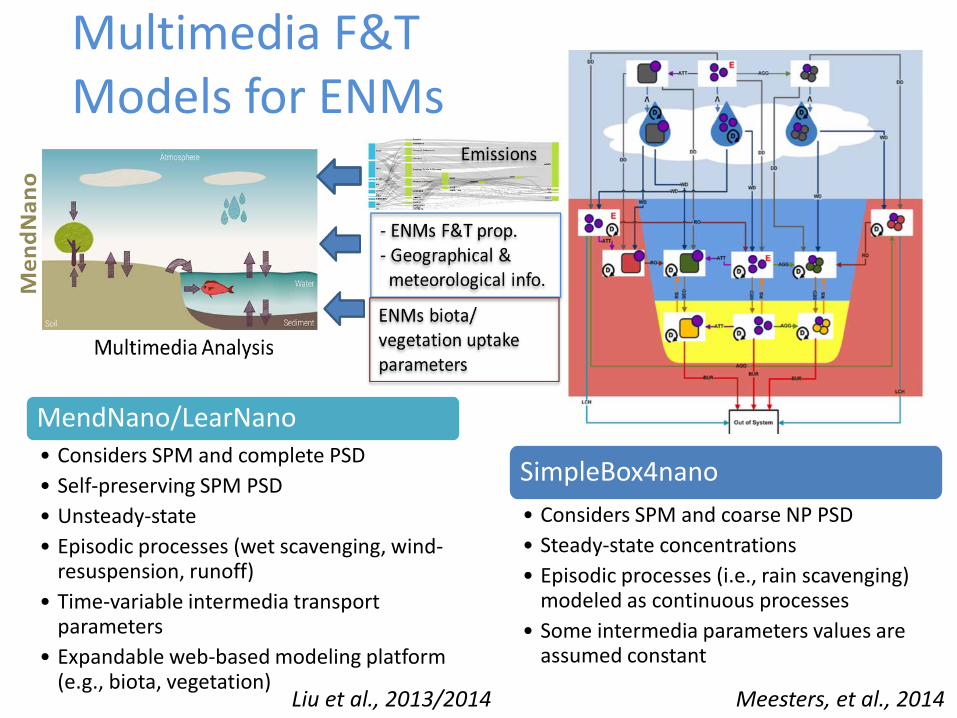
Multimedia F&T Models for ENMs
Meesters, et al., 2014
SimpleBox4nano • Considers SPM and coarse NP PSD • Steady-state concentrations • Episodic processes (i.e., rain scavenging)
modeled as continuous processes • Some intermedia parameters values are
assumed constant
MendNano/LearNano • Considers SPM and complete PSD • Self-preserving SPM PSD • Unsteady-state • Episodic processes (wet scavenging, wind-
resuspension, runoff) • Time-variable intermedia transport
parameters • Expandable web-based modeling platform
(e.g., biota, vegetation) Liu et al., 2013/2014

Comparison of MendNano Predictions with Field and Measurements of PAH Concentrations and PCB Fluxes
Intermedia transport fluxes of particle-bound PCBs in Lake Michigan
[PAHs]air Birmingham, UK
[BAP] in SoCAB
[BAP] Southeast Ohio
a) Ryan and Cohen, 1986; b) Harrison, et al., 1996; c) Yaffe, et al., 2001; d) Cohen and Cooter, 2002
Regional Average
Near Source
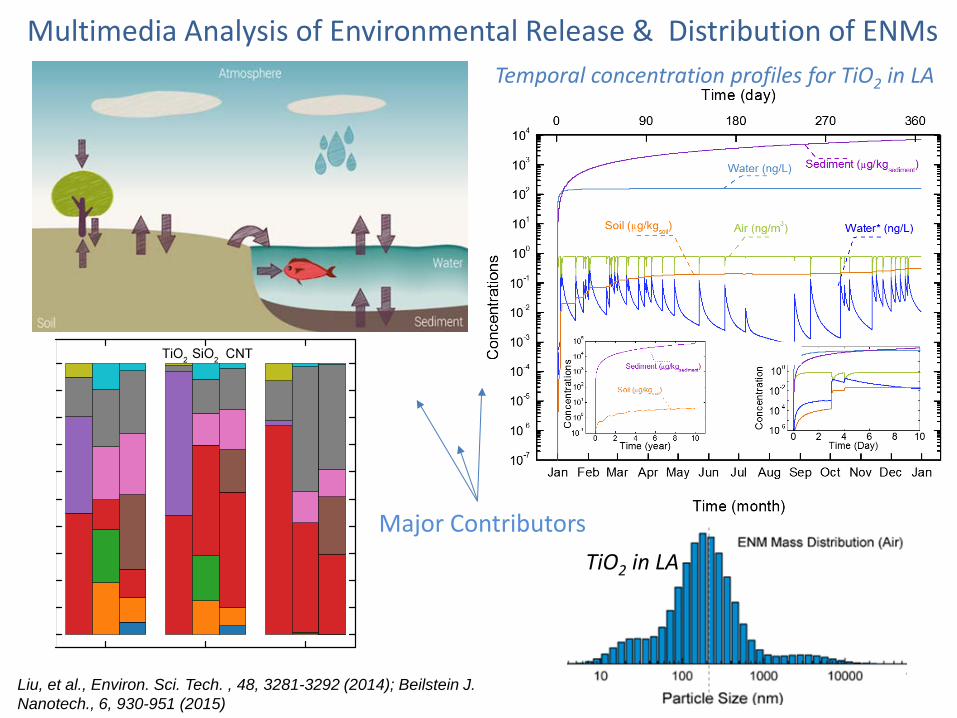
Multimedia Analysis of Environmental Release & Distribution of ENMs
Liu, et al., Environ. Sci. Tech. , 48, 3281-3292 (2014); Beilstein J. Nanotech., 6, 930-951 (2015)
Temporal concentration profiles for TiO2 in LA
TiO2 in LA Major Contributors

Multimedia Analysis of Environmental Release & Distribution of ENMs
Liu, et al., Environ. Sci. Tech. , 48, 3281-3292 (2014); Beilstein J. Nanotech., 6, 930-951 (2015)
Temporal concentration profiles for TiO2 in LA
TiO2 in LA
Simulations for a large number of NPs in various regions suggest that exposures concentrations are likely to be in the ranges of: - 0.0003 - 30 ng/m3 (air) - 0.0058 - 150 ng/L (water) - 0.0095 - 40 µg/kg (soil) - 0.0054 - 100 mg/kg (sediment)
Major Contributors
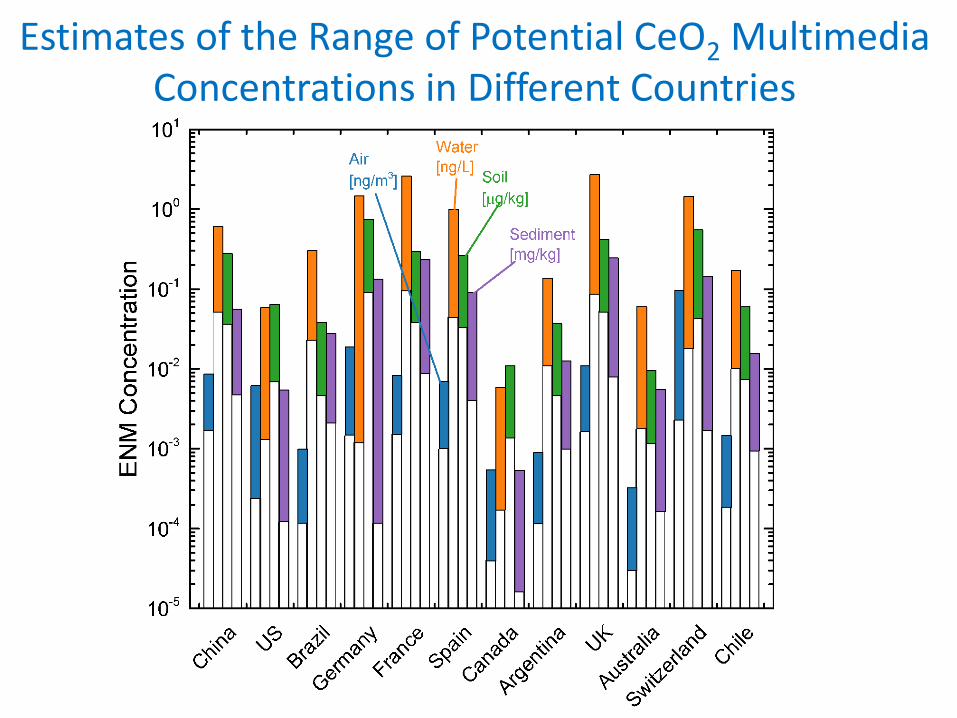
Estimates of the Range of Potential CeO2 Multimedia Concentrations in Different Countries

Estimates of the Range of Potential CeO2 Multimedia Concentrations in Different Countries
Upper limit ENM Exposure concentrations: • Air: < ~ 0.1 ng/m3
• Water: < ~ 3 ng/L • Soil: < ~ 0.8 µg/kg • Sediment: <~ 0.3 mg/kg
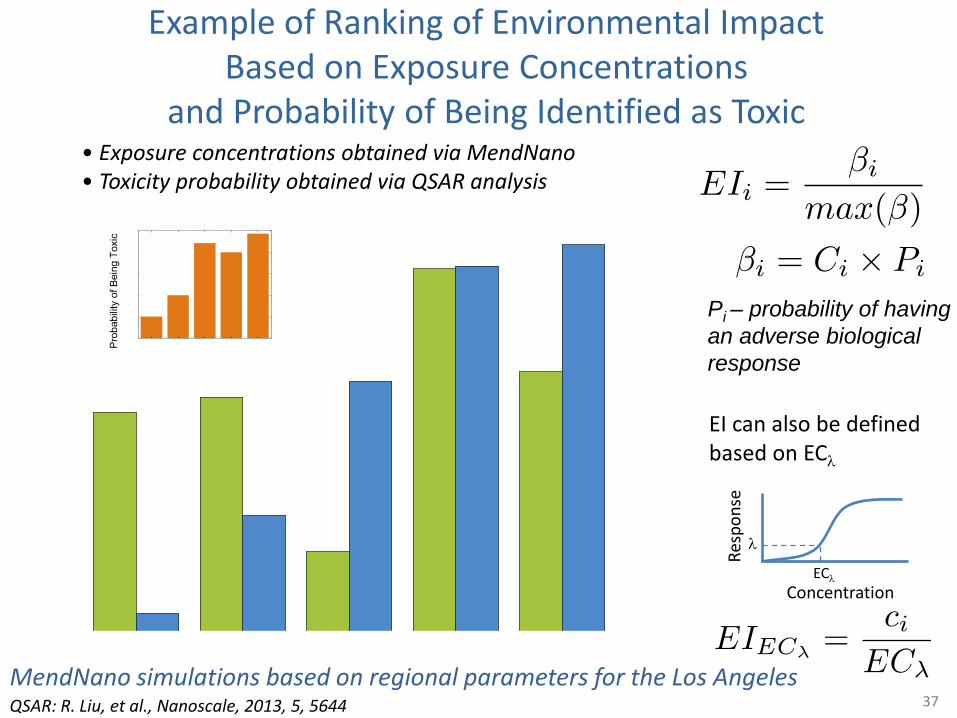
Example of Ranking of Environmental Impact Based on Exposure Concentrations
and Probability of Being Identified as Toxic
EI can also be defined based on ECλ
Concentration
Resp
onse
ECλ
λ
MendNano simulations based on regional parameters for the Los Angeles
Pi – probability of having an adverse biological response
• Exposure concentrations obtained via MendNano • Toxicity probability obtained via QSAR analysis
37 QSAR: R. Liu, et al., Nanoscale, 2013, 5, 5644

Selecting the Appropriate Fate & Transport Model What is the purpose of the analysis? e.g., regulatory compliance, priority settings, industrial, research, material design
What are the questions that need to be answered?
What is the required model resolution? • Spatial: Site-specific? Regional? • Temporal: Unsteady state? Steady state?
Episodic scenarios?
What is the required level of accuracy w.r.t estimated exposure concentrations?
Was the model validated? Calibrated?

Model Complexity Trade-Off Diagram In
crea
sed
Cost
Increased Model Complexity
Risk of improper system representation
Cost of obtaining a solution
Decisions Simple Complex
Incr
ease
d U
ncer
tain
ty

Model Validation Pyramid
Face validity
Comparison with other models
Applicability domain
Event validity
Comparison with data
Sensitivity analysis & statistical validation
Parameter validation & model sensitivity
Mechanistic/ empirical validity
Fundamental validity
Integrated model
Sub-modules
Module components
Units/ parameters

Categories of Models and Validations
Increased understanding
Incr
ease
d da
ta a
vaila
bilit
y Detailed Mechanistic/ Deterministic Models
Empirical (Data-driven) Models
Exploratory Models/ Theoretical Developments
Theoretical / Deterministic Models
Qualitative validation (component validation)
Quantitative validation Statistical validation
Conceptual validation (partial validation of mechanisms)
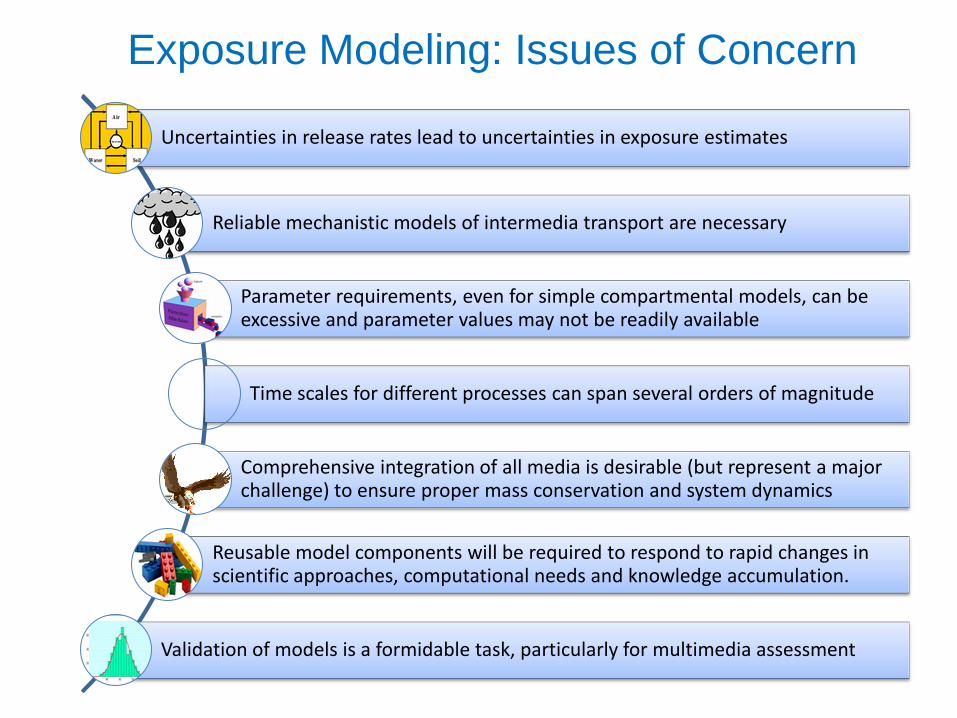
Exposure Modeling: Issues of Concern
Uncertainties in release rates lead to uncertainties in exposure estimates
Reliable mechanistic models of intermedia transport are necessary
Parameter requirements, even for simple compartmental models, can be excessive and parameter values may not be readily available
Time scales for different processes can span several orders of magnitude
Comprehensive integration of all media is desirable (but represent a major challenge) to ensure proper mass conservation and system dynamics
Reusable model components will be required to respond to rapid changes in scientific approaches, computational needs and knowledge accumulation.
Validation of models is a formidable task, particularly for multimedia assessment

Exposure Modeling: Issues of Concern
Are uncertainties in exposure estimates significant relative to uncertainties in toxicity information?

QUESTIONS?