Environmental monitoring at the former lead-zinc mine at ... · Title: Environmental monitoring at...
36
AU NATIONAL ENVIRONMENTAL RESEARCH INSTITUTE AARHUS UNIVERSITY NERI Technical Report no. 775 2010 ENVIRONMENTAL MONITORING AT THE FORMER LEAD-ZINC MINE IN MAARMORILIK, NORTHWEST GREENLAND, IN 2009
Transcript of Environmental monitoring at the former lead-zinc mine at ... · Title: Environmental monitoring at...

AUNATIONAL ENVIRONMENTAL RESEARCH INSTITUTEAARHUS UNIVERSITY
NERI Technical Report no. 775 2010
ENVIRONMENTAL MONITORING AT THE FORMER LEAD-ZINC MINE IN MAARMORILIK, NORTHWEST GREENLAND, IN 2009

[Blank page]

NATIONAL ENVIRONMENTAL RESEARCH INSTITUTEAARHUS UNIVERSITYAU
NERI Technical Report no. 775 2010
ENVIRONMENTAL MONITORING AT THE FORMER LEAD-ZINC MINE IN MAARMORILIK, NORTHWEST GREENLAND, IN 2009
Poul JohansenGert AsmundFrank RigétKasper JohansenHelene Schledermann

Data sheet
Series title and no.: NERI Technical Report No. 775
Title: Environmental monitoring at the former lead-zinc mine at Maarmorilik, Northwest Greenland, in 2009
Authors: Poul Johansen, Gert Asmund, Frank Rigét, Kasper Johansen & Helene Schledermann Department: Department of Arctic Environment Publisher: National Environmental Research Institute ©
Aarhus University- Denmark URL: http://www.neri.dk
Year of publication: February 2010 Editing completed: January 2010 Referee: Jens Søndergaard
Greenlandic translation: Kelly Berthelsen
Financial support: Bureau of Minerals and Petroleum, Government of Greenland
Please cite as: Johansen, P., Asmund, G., Rigét, F., Johansen, K. & Schledermann, H. 2010. Environmental monitoring at the former lead-zinc mine in Maarmorilik, Northwest Greenland, in 2009. National Environmental Research Institute, Aarhus University. 32 pp. – NERI Technical Report No. 775. http://www.dmu.dk/Pub/FR775.pdf
Reproduction permitted provided the source is explicitly acknowledged
Abstract: In 2009 environmental monitoring was carried out at the former lead-zinc mine which closed in 1990. Samples of lichens and blue mussels were analyzed. The study shows, that after mine closure an impact from the previous mining operation can still be seen. The pollution with dust on land seems to continue with no signs of a decrease, while the pollution in the sea is decreas-ing.
Keywords: Lead, zinc, mining, Black Angel, Greenland
Layout: NERI Graphics Group, Silkeborg
Cover photo: The fjord Affarlikassaaa with Maarmorilik in the background. Photo: Gert Asmund.
ISBN: 978-87-7073-164-5 ISSN (electronic): 1600-0048
Number of pages: 32
Internet version: The report is available in electronic format (pdf) at NERI's website http://www.dmu.dk/Pub/FR775.pdf

Contents
Summary 5
Eqikkaaneq 7
Resume 9
1 Introduction 11
2 Sampling 13
3 Analytical methods and quality control 16 3.1 Biological samples 16 3.2 Detection limits 16 3.3 Quality control 16
4 Results and discussion 19 4.1 Lichens 19 4.2 Blue mussel 23
5 Conclusion 28
6 References 29
Annex 1. Metal analyses of lichens in 2009 transplanted from Saatut in 2008 30
Annex 2. Metal concentration in transplanted blue mussels 2009 31
National Environmental Research Institute
NERI technical reports

[Blank page]

5
Summary
From 1973 to 1990 lead and zinc ore was mined at Maarmorilik in the re-gion of Uummannaq by the mining company Greenex A/S. The ore was primarily found in the mountain called “Black Angel”. It was mined at an altitude of about 600 metres above sea level and transported in cable cars across the Affarlikassaa fjord to a processing plant in Maarmorilik. The produced lead and a zinc concentrate was loaded on ships and transported in bulk to smelters in Europe.
During mining different sources of pollution were identified. Ore crush-ing and transport of concentrate created dust that was dispersed into the environment. Waste rock dumps were another source for dust but also for the release of lead and zinc to the aquatic environment (e.g. the sur-rounding fjords). The most important pollutant source, however, was the mine tailings that were discharged into the Affarlikassaa fjord and set-tled there. In addition, after mine closure, a waste rock dump was exca-vated and dumped into the Affarlikassaa Fjord on top of the tailings.
Since 1972, environmental studies have been conducted in the vicinity of the mine and the fjords around Maarmorilik by monitoring lead and zinc contents in seawater, sediments and biota (seaweed, mussels, fish, prawns and lichens). This report presents and assesses the results of the environmental studies conducted in 2009.
The lead and zinc dispersal with dust around Maarmorilik were moni-tored using the lichen Cetraria nivalis. It is a good indicator for dispersal of metals in the atmosphere, since it takes up water, nutrients and con-taminants via its surface. Lichens, transplanted in 2008 from a reference site to locations near Maarmorilik, showed increased levels of lead and zinc in 2009. Clearly elevated lead concentrations were found in lichens from sampling sites in Affarlikassaa, Qaamarujuk and at Qeqertanguit about 12 km west of Maarmorilik with levels between about 2 to 10 μg/g dry weight above background. Zinc concentrations were not elevated to as high levels as lead and were elevated only within a short distance from Maarmorilik. There is no indication that the dispersal of lead and zinc with dust has changed since 1996, when we introduced the lichen transplantation study to evaluate temporal changes of the dust pollution.
Blue mussels were used to monitor metal pollution in the marine envi-ronment since they take up and accumulate metals from seawater, sedi-ment and food particles. In 2008, blue mussels from an unaffected site were transplanted to 8 sites at different distances from Maarmorilik. These were sampled one year later in 2009. The lead content in trans-planted mussels was elevated in Affarlikassaa, Qaamarujuk and at Qeqertanguit. Zinc concentrations were elevated in a much smaller area and only close to Maarmorilik. After mine closure the lead contamina-tion in transplanted mussels has decreased significantly, on average by 5.5% per year, with decreases ranging from 2.2% to 8.6% dependent on locality.
6
As an overall conclusion it is observed, that after mine closure in 1990 an impact from the previous mining operation can still be seen in 2009. The pollution with dust on land seems to continue with no signs of a de-crease, while the pollution in the sea is decreasing.

7
Eqikkaaneq
Maarmorilimmi Uummannap eqqaaniittumi aatsitassarsioqatigiiffik Greenex A/S 1973-imiit 1990-imut aqerlussamik zinkissamillu qalluin-ermik ingerlataqarpoq. Aqerlussaq zinkissarlu annermik nassaasaavoq qaqqami Inngili Qernertumik taaguutilimmi. Qaqqami tassani aatsitas-saq 600 meterinik qatsissusilimmiit piiarneqarpoq Affarlikassaanullu si-laannakkut ikaartaassuit atorlugit Maarmorilimmut suliarinneqarfissaa-nut aqqussorneqartarluni. Aqerloq zinkilu akuiakkat umiarsuarnut usi-liussuunneqartarput Europamilu aatsiterivinnut ingerlanneqartarlutik.
Aatsitassarsiorfiup ingerlanerata nalaani mingutsitsineq qassiinik aal-laaveqarpoq. Akuiagassap aserorterneqarneratigut akuiakkallu angal-lanneqarneratigut avatangiisit pujoralatserneqartarput. Aserorternerlu-kuttaaq pujoralatsitsisuusarput, aammali aqerlumik zinikimillu imermut taratsumullu seerititsisarlutik. Mingutsitsinerpaajuppulli akuiarnerlukut ”tailings”-inik taaneqartartut Affarlikassaanut eqqarneqartartut imma-mullu kiviorartartut. Aatsitassarsiorfik matummat aserorternerlukut qal-lorneqarput Affarlikassaanilu akuiarnerlukut ”tailingit” qaavinut ilio-rarneqarlutik.
Kangerlunni Maarmorillup eqqaaniittuni avatangiisit 1972-imiilli misis-suiffigineqartarput taratsup, marraap, naasut uumassusillillu assigiinn-gitsut (qeqqussat, uillut, raajat, aalisakkat ujaqqallu naaneri qillinerit) misissuagassanik katersuiffigisarnerisigut. Nalunaarusiami matumani saqqummiunneqarput misissuinernit 2009-imi ingerlanneqartunit paasi-sat.
Aqerlup zinkillu aatsitassarsiorfimmiit pujoralatserinikkut siammarsi-manerat misissorneqartarpoq tamatuma eqqaani qillinerit (ujaqqat naa-neri) Cetraria nivalis aqerlumik zinkimillu akoqarnerinik misissuiffigiu-mallugit katersortarnerisigut misissoqqissaartarnerisigullu, taakkumi imeq, inuussutissat minguillu qaamikkut tigoorartarpaat. Qillinerit 2008-imi mingutsitaanngitsumiit Maarmorillup eqqaannut nuunneqartut 2009-imi aqerlumik zinkimillu akoqarnerulersimapput. Affarlikassaani, Qaamarujummi Qeqertannguanilu erseqqivissumik aqerlumik akoqaler-simapput, tassa akoqanngitsunut naleqqiullutik grammimut 2 aamma 10 mikrogrammit (panerlutik oqimaassusii) akornanni akoqalersimasara-mik. Zinkimik akui taama qaffasitsiginngillat Maarmorilimmullu qanit-tumi taamaallaat akoqarnerulersimallutik. Pujoralatsigut mingutsitsine-rup allanngoriartornera paasilluarumallugu 1996-imiit qillinernik nuus-sisalernermiit allanngorsimaneranik malunnartoqanngilaq.
Uillut ulluttagaaniittut immamiit taratsumik, uumassusilinnik sunillu mikisuaqqanik tigooraasaramik immap mingutsitaasimaneranik uuttui-nermut atorneqarsinnaapput. 2008-mi uillut sunnigaasimanngitsut su-miiffinnut arfineq-pingasunut Maarmorilimmiit assigiinngitsunik unga-sissulimmut nuussorneqarput. Taakku 2009-imi misiligutissanik tigoo-raavigineqarput. Uillut nuussat aqerlumik akui Affarlikassaani, Qaama-rujummi aammalu Qeqertannguani ukiup ataatsip ingerlanerani qaffa-riarsimapput. Zinkimik akuat sumiffimmi annikitsuaraannarmi taamaal-laallu Maarmorilimmut qanittuararsuarmi alleriarsimavoq. Uillut aqer-

8
lumik akoqassusiat aatsitassarsiorfiup matunerata kingorna appariarsi-maqaaq, ukiumut agguaqatigiissillugu 5,5%, tassa sumiinnerat apeqqu-taalluni 2,2%-imiit 8,6% allanngorarluni.
Tamakku tamaasa ataatsimut isigalugit paasinarpoq 2009-imi suli aatsi-tassarsiorfiusimasoq 1990-imi unissimasoq sunniusimasimasoq. Pujora-latserineq nunami suli takussaavoq allannguuteqarneranik malunnaate-qarani, imaanili mingutsitsineq annikilliartorsimalluni.

9
Resume
Fra 1973 til 1990 blev der brudt bly-zink malm ved Maarmorilik i Uum-mannaq regionen af mineselskabet Greenex A/S. Malmen fandtes ho-vedsagelig i det fjeld, som kaldes “Sorte Engel”. Den blev brudt i om-kring 600 meters højde og transporteret i en tovbane over fjorden Affar-likassaa til et opberedningsanlæg i Maarmorilik. Her blev der produceret et bly- og et zinkkoncentrat, som blev lastet på skibe og transporteret til smelteværker i Europa.
Mens minedriften fandt sted, blev der identificeret en række forure-ningskilder. Malmknusning og transport af koncentrater skabte støv, som blev spredt til omgivelserne. Såkaldte gråbjergsdumpe var også en støvkilde, men var også en kilde til forurening af fjorden. Den vigtigste forureningskilde var imidlertid affaldet fra opberedningen, såkaldt ”tai-lings”, der blev udledt til fjorden Affarlikassaa, hvor det bundfældede. Endnu en kilde var en gråbjergsdump, som efter minens lukning blev gravet op og dumpet i Affarlikassaa ovenpå den ”tailing”, som allerede lå der.
Der er siden 1972 udført miljøundersøgelser omkring minen og i fjorde-ne ved Maarmorilik ved at undersøge og overvåge bly- og zinkindholdet i havvand, sedimenter og en række organismer (tang, muslinger, rejer, fisk og lavplanter). Denne rapport viser resultaterne at de miljøundersø-gelser, som blev udført i 2009.
Bly- og zinkforureningen med støv omkring Maarmorilik blev overvåget ved hjælp af lavarten Cetraria nivalis. Den er en god indikator for spred-ning af metaller i atmosfæren, da den optager vand, næringsstoffer og kontaminanter fra sin overflade. Lavplanter, som i 2008 blev transplante-ret fra et referenceområde til flere områder ved Maarmorilik, havde i 2009 forhøjede bly- og zinkkoncentrationer. Der fandtes tydeligt forhøje-de blykoncentrationer i Affarlikassaa, Qaamarujuk og ved Qeqertanguit med niveauer mellem omkring 2 til 10 μg/g (tørvægt) over baggrunds-niveau. Zinkkoncentrationerne var ikke forhøjet i samme grad som for bly og kun indenfor kort afstand fra Maarmorilik. Der er ikke tegn på, at mængden af bly- og zinkspredt støv har ændret sig siden 1996, da vi ind-førte metoden med at transplantere lav for at kunne vurdere ændringer over tid af støvspredningen.
Blåmuslinger er anvendt til overvågning af metalforureningen i det ma-rine miljø, da de optager og akkumulerer metaller fra havvand, sediment og fødepartikler. I 2008 blev der transplanteret blåmuslinger fra et om-råde, som ikke er påvirket af minen, til 8 områder i forskellig afstand fra Maarmorilik. Prøver af disse muslinger blev indsamlet i 2009. Blyind-holdet i transplanterede muslinger var efter et år forhøjet i Affarlikassaa, Qaamarujuk og ved Qeqertanguit. Zinkindholdet var forhøjet i et meget mindre område og kun tæt ved Maarmorilik. Efter minens lukning er blyforureningen af muslingerne faldet væsentligt, i gennemsnit 5,5% pr år varierende fra 2,2% til 8,6% afhængigt af område.

10
Alt i alt kan det konkluderes, at der stadig i 2009 kan ses en påvirkning af den tidligere mineaktivitet, som ophørte i 1990. Støvforureningen på land ser ud til at fortsætte uden tegn på ændringer, mens forureningen i havet er faldende.

11
1 Introduction
From 1973 to 1990 zinc and lead ore was mined at Maarmorilik in Northwest Greenland in the inner part of a large fjord system. The clos-est community, Ukkussissat, is about 25 km to the west. The main town, Uummannaq, is about 80 km away from Maarmorilik (Figure 1.1).
The ore was primarily mined in the ”Black Angel” mountain at about 600 meters altitude and transported with cable cars across the Affarlikas-saa fjord to a flotation plant in Maarmorilik. Here zinc and lead concen-trates were produced, loaded into ships and transported in bulk to European smelting plants. The company Greenex A/S operated the mine.
Figure 1.1. Location of the Maarmorilik mine (Northwest Greenland) and nearby settle-ments.
Qeqertat
Maarmorilik
Qaarsut Saattut
Ikerasak
Uummannaq
Ukkusassat
0 10 20 km

12
During the operation of the mine, so-called tailings resulting from ore-processing were discharged into the Affarlikassaa fjord, where they set-tled. Several tons of lead and zinc were annually discharged as tailings into the fjord, leading to serious pollution of the marine environment. Other pollution sources were dispersal of dust due to ore crushing, han-dling of concentrates and from waste rock dumps left on the steep slopes of the mountains. These waste rock dumps contain several hundred thousand tons of rock with elevated concentrations of lead and zinc. One of the dumps, “The Old Waste Rock Dump”, was a particularly strong pollution source in the area. In the summer 1990, this dump was re-moved to the extent possible and the material dumped into the Affar-likassaa fjord on top of the tailings and on land in the former concentrate storage building.
The pollution from the mining operation was monitored while mining took place and continued after mine closure. The monitoring comprises regular (in most of the years annually) sampling and chemical analysis of seawater and biota (seaweed, mussels, fish, prawns and lichens) and with longer intervals marine sediments and the benthic fauna (Johansen et al. 2006, Josefson et al. 2008). The most recent results of the regular monitoring carried out in 2008 were published by Schiedek et al. (2009). The present report presents results from field work carried out in 2009.

13
2 Sampling
Sampling was carried out from 18-25 August 2009 with the assistance of local boat charter from Uummannaq and Ukkusissat. Gert Asmund and Jens Søndergaard from NERI and Aron Skade from Ukkussissat carried out the field work.
In 2008, lichens (Cetraria nivalis) were transplanted from Saatut, which is known to be unaffected by pollution from the mining operation, to dif-ferent monitoring stations in Affarlikassaa, Qaamarujuk, Perlerfiup Kangerlua, the islands Qeqertat, and inside the Maarmorilik area (Figure 1.1, 2.1 and Annex 1).
Figure 2.1. Sampling stations close to Maarmorilik (upper map) and further away (lower map). Numbers 1 and 3 refer to the seawater sampling stations. Letters (with and without number) indicate sampling stations for lichens, seaweed and blue mus-sels.
Qaamarujuk
Maarmorilik
Affarlikassaa
3
1
T1
T2
T3
T5
T6
T22T10
T15
T17
T25
T30
T29
T12Ø
T15A
T17C
T17BT17A
T12SV
0 1 2 km
N
Perlerfiup kangerlua
Qeqertanguit
L
F
G
V
T5
T38
T37
T36
T34
T33
T22T15
T25
T30T29
T17AT17
T12SV
0 2.5 5 km
N

14
In 2009, lichens from these stations (a total of 16) were sampled as well as from a reference site near Uummannaq (Annex 1). We have compiled this detailed description of the transplantation sites inside the Maar-morilik area (see also Figure 2.2):
• Locality 1: About 8 meters above the road along Affarlikassaa, about 70 meters from dolphin 1 towards Maarmorilik, 7 meters north of concrete pill.
• Locality 2: About 40 meters directly above new terminal of new cable-way.
• Locality 3: At a vertical marble wall at the road approximately at the site of the old ball mill, above the flotation plant.
• Locality 4: Just above and north of the flotation plant at a large stone (2x1x1 m).
• Locality 5: At a marble wall and a heap of roadstones to the right fur-ther along the road passing the flotation plant.
• Locality 6: At light no. 6 of the heliport.
Only fresh living lichens growing on dead organic matter were collected. Samples were kept in paper bags.
Blue mussels (Mytilus edulis), which had been transplanted in 2008 from Qeqertat (station L) were collected at 5 stations in the Affarlikassaa, Qaamarujuk, Perlerfiup Kangerlua fjords and at Qeqertat (Figure 1.1 and 2.1 and Annex 2). Blue mussels collected at each station were divided into two or three size classes according to their shell length: 4-5 cm, 5-6 cm etc. The adductors of the mussels were cut and the shells were
Figure 2.2. Sampling stations within Maarmorilik

15
opened. The mussels were allowed to drain before the soft parts were cut out with a stainless steel scalpel. The soft parts of each size group were pooled (number of specimens is seen in Annex 2) and then deep-frozen. New mussels from Qeqertat were transplanted to the fjords at Maar-morilik.

16
3 Analytical methods and quality control
3.1 Biological samples
At the laboratory of the Department of Arctic Environment at NERI (NERI-DAE), mussel samples were initially freeze-dried and then grounded in an agate mortar. The dry weight was determined by weigh-ing before and after freeze-drying.
The lichen samples were sorted in the laboratory, to remove all foreign material, and subsequently dried at 60ºC for 24 hours.
A 0.3 g sub sample of the dried samples was dissolved with 4 ml concen-trated Merck suprapure nitric acid and 4 ml MilliQ water in Teflon bombs under pressure in an Anton Paar Multiwawe 3000 Microwave Oven. After digestion, the samples were transferred to polyethylene bot-tles with MilliQ water and lead and zinc were measured in these solu-tions. Zinc concentrations were determined using flame AAS (Perkin Elmer AAnalyst 300 and lead concentrations were determined using graphite furnace AAS (Perkin Elmer AAnalyst 800).
3.2 Detection limits
The detection limit for a method is the concentration below which the uncertainty for the results obtained it too high. The detection limit de-pends on the method used, the pre-treatment and dilution of the sam-ples. The detection limit applied in this report is the concentration that gives an analytical signal that is 3 times the standard deviation of the blind value.
In biological samples the detection limits are 0.02 µg/g dry wt for lead and 0.8 µg/g dry wt for zinc.
3.3 Quality control
The analytical methods were checked by regularly analyzing the certi-fied reference materials Dorm-1, Dolt-3 and Tort-2.
The analytical methods were also checked independently, as NERI-DAE participates in the intercalibration program QUASIMEME organized by the European Union. In this program a sample with an unknown concen-tration of e.g. lead and zinc is analyzed by many laboratories. Based on the results, the organizers of QUASIMEME compute a so called “as-signed value” for the concentration of – in this case – lead and zinc in the sample. Figure 3.1 shows the result of NERI-DAE’s participation in QUASIMEME. In the figure, NERI-DAE’s results are shown as the rela-tive deviation from the “assigned value” plotted against the concentra-tion.

17
It is seen that for lead the uncertainty by NERI-DAE is about 25% for samples with concentrations higher than 0.05 µg/g wet weight. For bio-logical samples with concentrations lower than 0.02 µg/g wet weight, QUASIMEME only designated so called “indicative assigned values”. In these cases, NERI-DAE found lower concentrations than the “indicative assigned values”. For zinc the uncertainty by NERI-DAE is in almost all cases within 12.5% (Figure 3.1). The lines in Figure 3.1 represent the 95% confidence limits calculated as the sum-uncertainty of the detection limit and the relative uncertainty seen in the table below:
Finally, the analytical methods were checked by analyzing the same sample twice (same ID# but different nitric acid digestions).
In this study a lichen sample and a mussel sample were analysed twice with the results shown below:
Figure 3.1. Results for lead (up-per graph) and zinc (lower graph) from NERI-DAE’s participitation in the QUASIMEME laboratory study programme. The lines represent the 95% confidence limit (see text). Concentrations are on a wet weight bases except for Fucus that are on a dry weight basis.
1 10 100
Assigned value (µg/g wet weight)
Rel
ativ
dev
iatio
n (%
)R
elat
iv d
evia
tion
(%)
Fishmeat Mussels Fish liver Fucus Shrimp
Lead
Zinc
0
-100
-80
-60
-40
-20
20
40
60
80
100
0
-100
-80
-60
-40
-20
20
40
60
80
100
0.001 0.01 0.1 1 10
Zinc Lead
Constant error (detection limit), mg/kg dry weight 0.8 0.02
Proportional error (%) 12.5 25
Pb Pb Zn Zn
Mussel 9.070 9.044 218 207
Lichen 1.964 3.747 34.6 40.4

18
It is seen that for the homogenized sample (the mussel) the deviation be-tween the two samples is 5% for zinc and 4% for lead which is within the analytical uncertainty. But for lichen samples the two 0.3 gram samples analyzed had quite different lead concentrations, differing by almost a factor of 2. This probably is because the lichen samples have not been homogenized.
When a sample has been analyzed twice, we have used the average in further calculations.

19
4 Results and discussion
4.1 Lichens
Lichens are known to accumulate atmospheric pollutants and are abun-dant in the Arctic. The lack of roots, a large surface area and a long life span enable them to effectively bioaccumulate air contaminants (Bari et al. 2001). In many studies it has been shown that lichens are good indica-tors for various kinds of air pollution including those caused by mining activities (Naeth & Wilkinson, 2008).
The lichen species Cetraria nivalis is common in Greenland and thus suited as an indicator of metal pollution via the atmosphere. The species grows primarily on dead organic matter and takes up nutrients (and con-taminants) from its surface. Once accumulated in the lichens, metals are only released from the plants at a very slow rate – if at all.
At Maarmorilik, the dispersal of metals via the atmosphere has been monitored over many years by sampling lichens at a number of stations close to the mine and in the region to the west. To assess year to year variations of the air quality, lichens were collected at Saatut (Figure 1.1) and transplanted to different locations at Maarmorilik and further away in 2008. The lichens from Saatut had a lead concentration of 0.69 µg/g dry wt and a zinc concentration of 12.6 µg/g dry wt.
In 2009 – after one year of transplantation – lichens were collected again and analyzed for lead and zinc. The results are shown in Annex 1 and the spatial trends are illustrated in Figure 4.1, 4.2 and 4.3.

20
Figure 4.1. Lead concentrations (µg/g dry weight) in lichens (Cetraria nivalis) from sampling stations close to Maarmorilik (upper graph and further away (lower graph).
Perlerfiup kangerlua
Qeqertanguit
0 2.5 5 km
N
0.53
0.62
0.63
0.73
2.24
1.24 3.63
2.37
2.59
1.9723.72
160.99
Qaamarujuk
Maarmorilik
Affarlikassaa
0 1 2 km
N
2.37
3.63
2.53
7.34
2.59
1.97
23.72
29.4
114.89
160.99
21
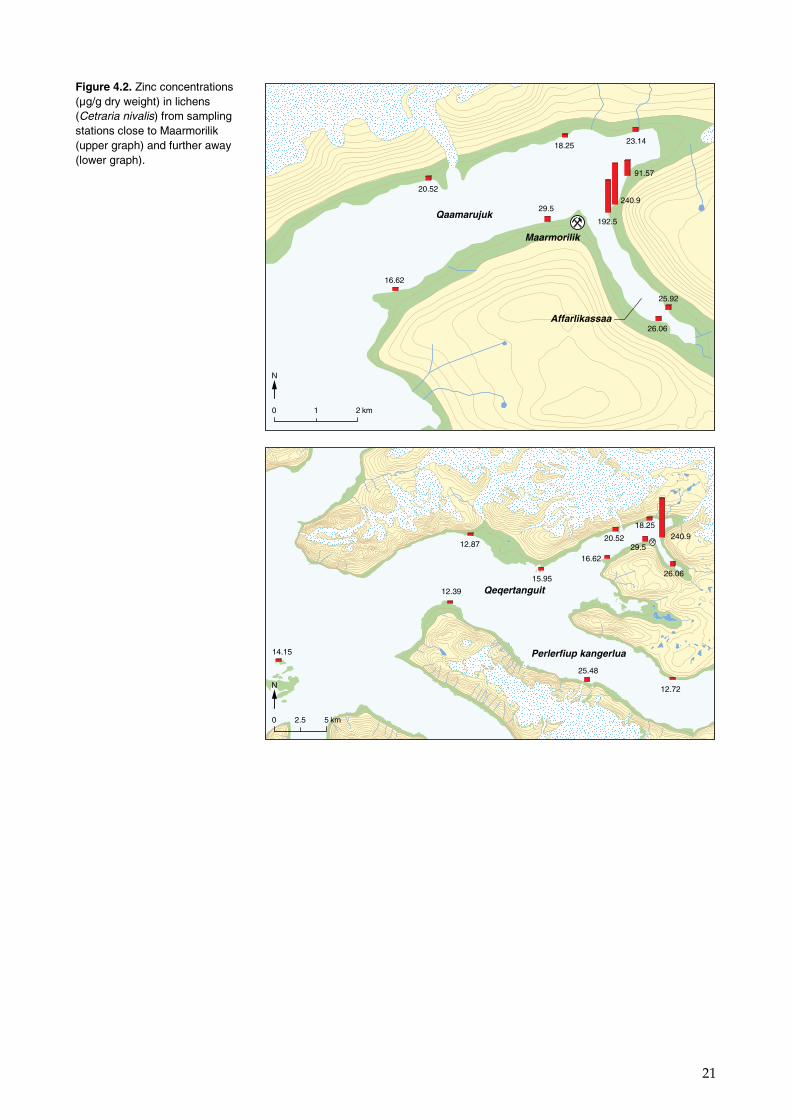
Figure 4.2. Zinc concentrations (µg/g dry weight) in lichens (Cetraria nivalis) from sampling stations close to Maarmorilik (upper graph) and further away (lower graph).
Perlerfiup kangerlua
Qeqertanguit
0 2.5 5 km
N
14.15
25.48
12.72
12.39
12.87
15.9526.06
18.25
16.62
20.5229.5
240.9
Qaamarujuk
Maarmorilik
Affarlikassaa
0 1 2 km
N
29.5
26.06
25.92
192.5
240.9
91.57
23.1418.25
16.62
20.52

22
4.1.1 Spatial trends
Clearly elevated lead concentrations were found in lichens from Affar-likassaa, Qaamarujuk and Qeqertanguit with levels between 2 to 1000 times higher than background level. The highest concentrations were found in Maarmorilik and in lichens sampled below the Black Angel Mountain (Figure 4.1 and 4.2). Remains of waste rock dumps with ele-vated lead and zinc concentrations are still found below this mountain. This indicates that a main source of dust dispersal is the waste rock dumps and their remains left on the slopes of the Black Angel Mountain. The high lead and zinc concentrations found within Maarmorilik (Figure
Figure 4.3. Lead (upper graph) and zinc concentrations (lower graph) in lichens (µg/g dry weight) transplanted in 2008 and sampled within the Maarmorilik area in 2009.
23
4.3) show that there are also dust sources left here. The dust probably comes from remains of ore and concentrate left at the mine site.
Zinc concentrations were not elevated as much as lead and only within a short distance (2-3 km) from Maarmorilik.
In the lichens collected at Saatut, on Qeqertat and in the inner part of Perlerfiup kangerlua concentrations are low and in the same range as found in other areas in Greenland unaffected by local sources. At refer-ence sites used to the monitor the impact of mining activities at Nalunaq, Seqi and Maarmorilik, concentrations between 0.3-1 µg/g lead and 9-18 µg/g zinc were found in Cetraria nivalis (Glahder et al. 2009, Asmund et al. 2009, Johansen et al. 2006). Interestingly, in the samples collected 2-3 km from Uummannaq the lead and zinc concentration appears elevated by a factor of about 2 compared to these background levels. This indi-cates that the town of Uummannaq is creating heavy metal pollution. A possible source is the waste incinerator in Uummannaq.
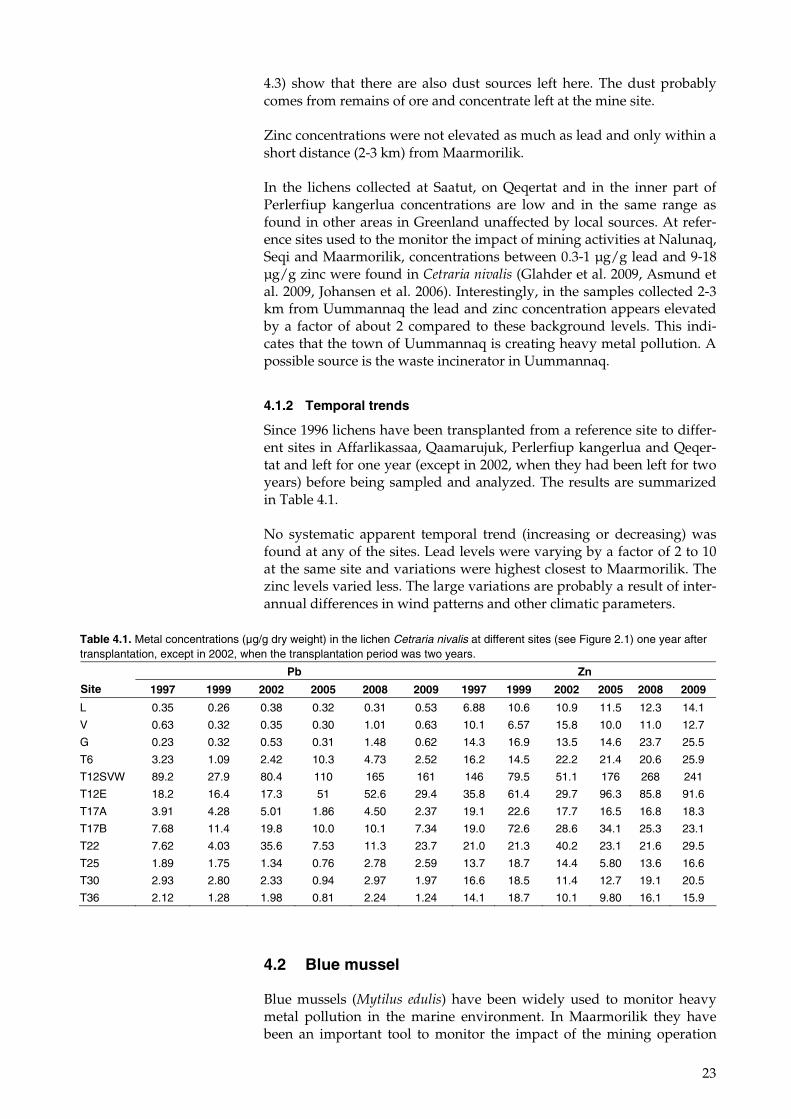
4.1.2 Temporal trends
Since 1996 lichens have been transplanted from a reference site to differ-ent sites in Affarlikassaa, Qaamarujuk, Perlerfiup kangerlua and Qeqer-tat and left for one year (except in 2002, when they had been left for two years) before being sampled and analyzed. The results are summarized in Table 4.1.
No systematic apparent temporal trend (increasing or decreasing) was found at any of the sites. Lead levels were varying by a factor of 2 to 10 at the same site and variations were highest closest to Maarmorilik. The zinc levels varied less. The large variations are probably a result of inter-annual differences in wind patterns and other climatic parameters.
4.2 Blue mussel
Blue mussels (Mytilus edulis) have been widely used to monitor heavy metal pollution in the marine environment. In Maarmorilik they have been an important tool to monitor the impact of the mining operation
Table 4.1. Metal concentrations (µg/g dry weight) in the lichen Cetraria nivalis at different sites (see Figure 2.1) one year after transplantation, except in 2002, when the transplantation period was two years.
Pb Zn
Site 1997 1999 2002 2005 2008 2009 1997 1999 2002 2005 2008 2009
L 0.35 0.26 0.38 0.32 0.31 0.53 6.88 10.6 10.9 11.5 12.3 14.1
V 0.63 0.32 0.35 0.30 1.01 0.63 10.1 6.57 15.8 10.0 11.0 12.7
G 0.23 0.32 0.53 0.31 1.48 0.62 14.3 16.9 13.5 14.6 23.7 25.5
T6 3.23 1.09 2.42 10.3 4.73 2.52 16.2 14.5 22.2 21.4 20.6 25.9
T12SVW 89.2 27.9 80.4 110 165 161 146 79.5 51.1 176 268 241
T12E 18.2 16.4 17.3 51 52.6 29.4 35.8 61.4 29.7 96.3 85.8 91.6
T17A 3.91 4.28 5.01 1.86 4.50 2.37 19.1 22.6 17.7 16.5 16.8 18.3
T17B 7.68 11.4 19.8 10.0 10.1 7.34 19.0 72.6 28.6 34.1 25.3 23.1
T22 7.62 4.03 35.6 7.53 11.3 23.7 21.0 21.3 40.2 23.1 21.6 29.5
T25 1.89 1.75 1.34 0.76 2.78 2.59 13.7 18.7 14.4 5.80 13.6 16.6
T30 2.93 2.80 2.33 0.94 2.97 1.97 16.6 18.5 11.4 12.7 19.1 20.5
T36 2.12 1.28 1.98 0.81 2.24 1.24 14.1 18.7 10.1 9.80 16.1 15.9

24
both during mining and after closure. The monitoring programme has involved sampling of both resident mussels and mussels transplanted from a site unaffected by the mining into the fjords at Maarmorilik.
Sampling of resident mussels, i.e. mussels that have lived all their life at the site at which they were sampled, is mainly conducted to evaluate the spatial extent of the area affected by pollution and to advice on the risk for human health of collecting and eating contaminated mussels.
Transplanting mussels and collecting them a year later allows assessing temporal trends of lead contamination. This method was introduced in Maarmorilik after it was observed that contaminated mussels did not re-lease lead at the same rate as the lead pollution in the surrounding water decreased. In previous studies it was observed that contaminated mus-sels after living 2-3 years in an uncontaminated area still contained about half of the lead content they had before (Riget et al. 1997). After that pe-riod they did not release lead at all. By transplanting mussels from a ref-erence site unaffected by the mine to the fjords at Maarmorilik and ana-lyzing them one year later it provides a measure for the intensity of the exposure for the period of one year.
In 2009, only mussels that had been transplanted in 2008 were collected and the lead and zinc concentrations were measured. The results are shown in Annex 2. Similar transplantation experiments have been per-formed regularly since 1991. In some cases the bodyweight was lower in the transplanted mussels after one year, resulting in increased lead con-centrations in the tissues. In order to compensate for this effect, the lead and zinc content has been estimated and normalized to a standard size, i.e. 6 cm shell length based on available data for length/weight relation-ship for each location (Riget et al. 1997). This relationship was for station L described as follows
W = 0.0101 x L2.54, R2 = 0.95 L: mean shell length of length group in cm W: mean soft tissue dry weight in g R2: coefficient of determination.
The results from calculating the lead content are shown in Table 4.2. Ta-ble 4.3 shows the lead content of the mussels that were transplanted. In most years, particularly in the beginning of the monitoring period, the lead content at Station L about 30 km from Maarmorilik is higher than at Schades Øer further west, indicating that Station L is affected.
Results for zinc have not been computed, as zinc in the transplanted mussels were elevated only locally and to much lower levels than for lead (Annex 2).

25
After settling for one year at the new locations, in 2009 the lead content in the transplanted mussels was clearly elevated, varying from 71.9 µg Pb below the Black Angel (Station T12SW) to 6.3 µg Pb at station T36 on Qeqertanguit, about 12 km west of Maarmorilik. The lead content in mussels sampled in Affarlikassaa and Qaamarujuk were between 10 and 18 µg. The lead content of mussels from Station L, which is their original location, was 1.7 µg Pb.
As seen in Table 4.2, lead levels have been elevated in all years since 1992 at all stations to which mussels have been transplanted. We have tested if there is a temporal trend in the period 1992-2009. Since the stations T12E and T12SW were not both included in all the years, we have com-bined data from station T12E and T12SW as there was no indication of a systematic difference in lead levels at these two stations. Before conduct-ing the time trend analysis we have also subtracted the lead content of the mussels being transplanted in order to evaluate the net uptake in one year.
The statistical temporal trend analyses followed the ICES (International Council for the Exploitation of the Sea) temporal trend assessment pro-cedure (Nicholson et al. 1995). The log-mean lead concentration is used as the annual index value. The total variation over time is partitioned into a linear and non-linear component. Linear regression analysis is ap-plied to describe the linear component, and a LOESS smoother (locally weighted quadratic least-squares regression smoothing) with a window width of 7 years is applied to describe the non-linear component. The linear and non-linear components are tested by means of an analysis of variance. The theory behind the use of smoothers in temporal trend analyses is described in detail by Fryer and Nicholson (1999). A signifi-cance level of 5% was applied. The results of the temporal trend analysis can be interpreted as follows:
Tabel 4.2. Mean lead content (μg Pb per mussel) in transplanted mussels at different monitoring locations (see Figure 2.1) around Maarmorilik. The lead content has been normalized to a mussel with 6 cm shell length.
Transpl. year 1991 1992 1993 1994 1995 1996 1998 2004 2007 2008
Sampling year 1992 1993 1994 1995 1996 1997 1999 2005 2008 2009
Station T5 21.5 28.6 20.0 27.7 21.9 12.2 9.05 10.3
T12E 188 170 187 79.3 151 94.8
T12SW 111 170 96.3 82.6 71.9
T17A 20.1 18.1 18.2 15.8 19.0 21.9 16.6 9.55 18.2
T17B 21.7 14.2 22.6 17.3 20.2 23.4 23.4
T22 18.7 12.2 17.9 14.6 20.0 14.8 11.3 9.45 9.82 13.2
T25 11.3 12.5 11.9 9.39 10.7 7.61 6.30 6.34
T30 14.7 9.88 10.4 7.71 12.8 6.79 8.05 7.44
T36 10.2 9.74 7.95 8.15 5.52 5.10 7.27 5.83 4.38 6.30
G 3.76 1.55 2.54 2.76
V 3.79 2.05 2.04 2.70
Tabel 4.3. Mean lead content (μg Pb) in mussels being transplanted to different monitoring locations (see Figure 2.1) around Maarmorilik. The lead content has been normalized to a mussel with 6 cm shell length. Schades Øer is located about 70 km northwest of Maarmorilik and about 50 km northwest of Station L.
Station 1991 1992 1993 1994 1995 1996 1998 2004 2007 2008
L 3.76 4.21 3.33 4.62 3.77 1.80 1.68
Schades Øer 0.55 1.03 0.86

26
• Both log-linear and non-linear trend components not significant: no temporal trend.
• Log-linear trend significant, non-linear trend not significant: log-linear trend (exponential trend)
• Both log-linear trend and non-linear trend significant: non-linear trend
• Log-linear trend not significant, non-linear trend significant: non-linear trend
The temporal trend analysis also gives the overall annual change esti-mated from the log-linear regression.
The results of the temporal trend analysis in transplanted mussels are shown in Table 4.4 and Figure 4.4. Over the entire monitoring period lead content in transplanted blue mussels has decreased at all stations. This decrease, ranging from 2.2 to 8.6% per year, is significant (p <0.05) for 4 out of 7 stations and can be described as a log-linear trend, meaning an exponential decrease. In average the annual decrease in lead concen-tration in transplanted mussels is 5.5%.
Table 4.4. Results of the temporal trend analyses of the increase of lead content in blue mussels one year after being transplanted to the station from station L. Significance at the 5% level is shown by “sign” and non-significance by “–“ for both the log-linear trend and the non-linear trend components. The overall annual change during the period is given.
Blue mussels Pb
Station/Year Log-linear
trend Non-linear
trend Annual change
T5, 1993-2005 sign - -8.0%
T12, 1992-2009 sign - -5.7%
T17A, 1992-2009 - - -2.2%
T22, 1992-2009 - - -2.7%
T25, 1992-2005 sign - -8.6%
T30, 1992-2005 - - -5.0%
T36, 1992-2009 sign - -6.1%

27
Tem
pora
l tre
nd o
f the
net
lead
con
tent
(µg
Pb
per
mus
sel)
5
10
15
20
25
80
120
160
10
15
20
6
8
12
16
20
4
6
8
10
4
6
8
10
12
1992 1995 1996 2000 2004 1992 1995 1996 2000 2004
4
6
8
10
12
2
4
6
8
10
T5
T17A
T25
T30
T12
T22
T30
T36
Figure 4.4. Temporal trend of the net lead content (µg Pb per mussel) in transplanted mussels. Points denote annual net con-tent. A solid line together with 95% confidence limits (dashed lines) is shown. A red line indicates a significant trend and a black line that the trend was not significant.

28
5 Conclusion
Lichens, transplanted in 2008 from a reference site to locations near Maarmorilik, showed increased levels of lead and zinc in 2009. Clearly elevated lead concentrations were found in lichens from sampling sites in Affarlikassaa, Qaamarujuk and at Qeqertanguit about 12 km west of Maarmorilik with levels between about 2 to 10 μg/g dry weight above background. Zinc concentrations were not elevated to as high levels as lead and were elevated only within a short distance from Maarmorilik. There is no indication that the dispersal of lead and zinc with dust has changed since 1996, when we introduced the lichen transplantation study to evaluate temporal changes of the dust pollution.
In 2008, blue mussels from an unaffected site were transplanted to 8 sites at different distances from Maarmorilik. These were sampled one year later in 2009. The lead content in transplanted mussels was elevated in Affarlikassaa, Qaamarujuk and at Qeqertanguit. Zinc concentrations were elevated in a much smaller area and only close to Maarmorilik. Af-ter mine closure the lead contamination in transplanted mussels has de-creased significantly, on average by 5.5% per year, with decreases rang-ing from 2.2% to 8.6% dependent on locality.
29
6 References
Asmund, G., Boertmann, D. & Johansen, P. 2009, Baseline and monitor-ing studies at Seqi olivine mine 2004 to 2007, National Environmental Research Institute, Aarhus University. 90 pp. - NERI Technical Report No. 715.
Bari, A., Rosso, A., Minciardi, M.R., Troiani, F. and Piervittori, R. 2001. Analysis of Heavy Metals in Atmospheric Particulates in Relation to Their Bioaccumulation in Explanted Pseudevernia furfuracea Thalli. En-vironmental Monitoring and Assessment 69: 205-220.
Fryer, R.J. & Nicholson, M.D. 1999. Using smoothers for comprehensive assessments of contaminant time series in marine biota. ICES Journal of Marine Science 56: 779-790.
Glahder, C.M., Asmund, G. & Riget, F. 2009. Environmental monitoring at the Nalunaq Gold Mine, South Greenland, 2008. National Environ-mental Research Institute, Aarhus University. 30 pp. – NERI Technical Report No. 698.
Josefson, A.B., Hansen, J.L., Asmund, G. & Johansen, P. 2008. Threshold response of benthic macrofauna integrity to metal contamination in West Greenland. Marine Pollution Bulletin 56: 1265-1274.
Johansen, P., Riget, F.F., Asmund, G., Josefson, A.B. & Hansen, J.L.S. 2006. Miljøundersøgelser ved Maarmorilik 2005. Danmarks Miljøunder-søgelser. - Faglig rapport fra DMU 605: 102 s. (elektronisk).
Naeth, M.A., Wilkinson, S.R. 2008. Lichens as Biomonitors of Air Quality around a Diamond Mine, Northwest Territories, Canada. Journal of En-vironmental Quality, 37, 1675-1684
Nicholson, M.D., Fryer, R.J. & Larsen, J.R. 1995. A Robust Method for Analysing Contaminant Trend Monitoring Data. Techniques in Marine Environmental Science. ICES.
Riget, F., Johansen, P. & Asmund, G. 1997: Uptake and Release of Lead and Zinc by Blue Mussels. Experience from Transplantation Experiments in Greenland. Mar. Poll. Bull. 34(10): 805-815.
Schiedek, D., Asmund, G., Johansen, P., Rigét, F., Johansen, K., Strand J., & Mølvig, S. 2009: Environmental monitoring at the former lead-zinc mine in Maarmorilik, Northwest Greenland, in 2008. National Environ-mental Research Institute, Aarhus University. 70. pp. – NERI Technical Report no. 737.
30
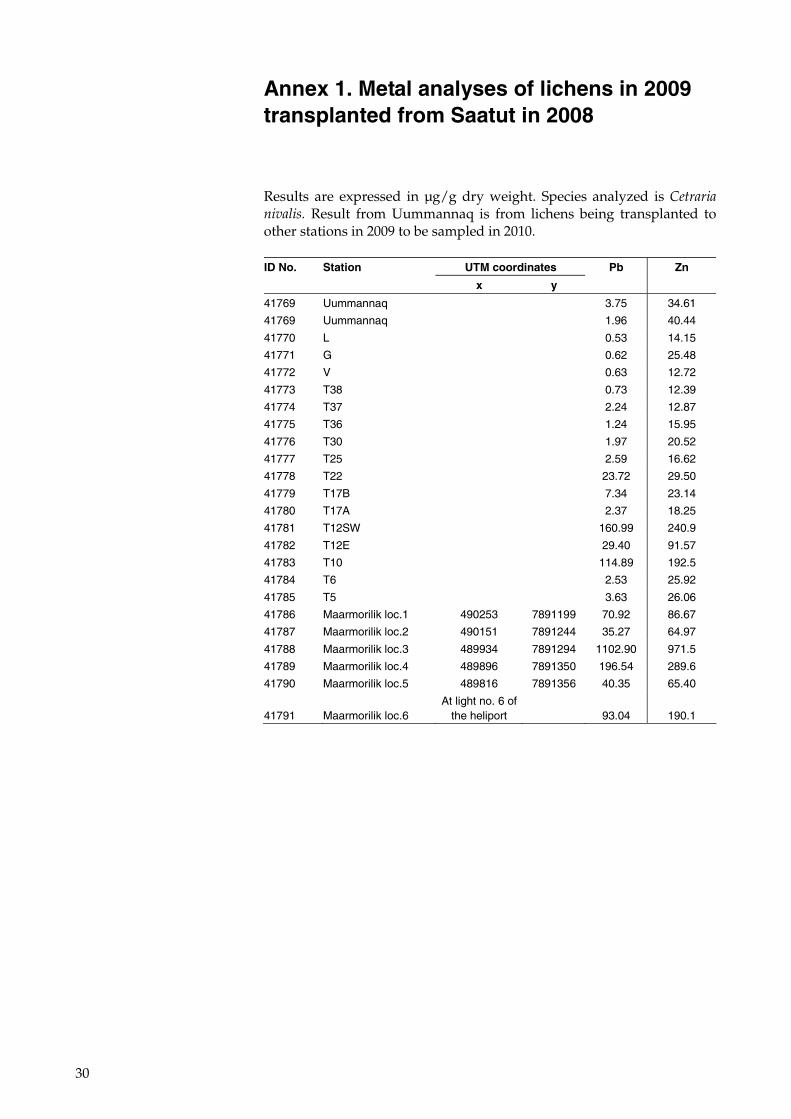
Annex 1. Metal analyses of lichens in 2009 transplanted from Saatut in 2008
Results are expressed in µg/g dry weight. Species analyzed is Cetraria nivalis. Result from Uummannaq is from lichens being transplanted to other stations in 2009 to be sampled in 2010.
ID No. Station UTM coordinates Pb Zn
x y
41769 Uummannaq 3.75 34.61
41769 Uummannaq 1.96 40.44
41770 L 0.53 14.15
41771 G 0.62 25.48
41772 V 0.63 12.72
41773 T38 0.73 12.39
41774 T37 2.24 12.87
41775 T36 1.24 15.95
41776 T30 1.97 20.52
41777 T25 2.59 16.62
41778 T22 23.72 29.50
41779 T17B 7.34 23.14
41780 T17A 2.37 18.25
41781 T12SW 160.99 240.9
41782 T12E 29.40 91.57
41783 T10 114.89 192.5
41784 T6 2.53 25.92
41785 T5 3.63 26.06
41786 Maarmorilik loc.1 490253 7891199 70.92 86.67
41787 Maarmorilik loc.2 490151 7891244 35.27 64.97
41788 Maarmorilik loc.3 489934 7891294 1102.90 971.5
41789 Maarmorilik loc.4 489896 7891350 196.54 289.6
41790 Maarmorilik loc.5 489816 7891356 40.35 65.40
41791 Maarmorilik loc.6 At light no. 6 of
the heliport 93.04 190.1

31
Annex 2. Metal concentration in trans-planted blue mussels 2009
Soft tissue was analyzed. Results are in µg/g dry weight. Results from station L are from mussels being transplanted to other stations in 2009 to be sampled in 2010.
ID No Station Size group Number of individuals
Mean length (cm)
Mean indi-vidual wet weight (g)
Dry wt %
Pb µg/g dry wt
Zn µg/g dry wt
41713 L 4-5 cm 16.83 1.64 143
41714 L 5-6 cm 14.85 3.15 151
41715 L 6-7 cm 14.80 2.82 138
41717 L 7-9 cm 13.45 5.16 179
41716 L 9-10 cm 12.25 4.34 238
41704 T36 4-5 cm 12 4.53 2.28 14.29 9.07 218
41704 T36 4-5 cm 12 4.53 2.28 14.29 9.45 208
41705 T36 5-6 cm 10 5.42 3.71 12.69 9.17 229
41701 T22 4-5 cm 15 4.51 2.27 13.65 20.67 286
41702 T22 5-6 cm 6 5.33 4.01 14.16 15.76 298
41703 T22 6-7 cm 4 6.58 6.98 14.18 14.82 287
41711 T5 4-5 cm 13 4.50 2.80 12.92 14.80 214
41712 T5 5-6 cm 11 5.42 4.46 11.72 15.46 274
41709 T12SW 4-5 cm 12 4.54 2.70 17.10 90.87 394
41710 T12SW 5-6 cm 8 5.51 5.39 14.03 70.35 245
41706 T17A 4-5 cm 17 4.52 2.49 14.09 23.0 276
41707 T17A 5-6 cm 5 5.43 5.22 14.29 17.8 209
41708 T17A 6-8 cm 3 6.76 8.91 13.63 22.4 315
National Environmental Research Institute, NERI, is a part of Aarhus University.
NERI undertakes research, monitoring and consultancy
within environment and nature.
At NERI’s website www.neri.dk you’ll fi nd information regarding ongoing research and development projects.
Furthermore the website contains a database of publications including scientifi c articles, reports, conference contributions etc. produced by NERI staff members.
National Environmental Research InstituteDanmarks Miljøundersøgelser
NERIDMU
Further information: www.neri.dk
National Environmental Research Institute Management Frederiksborgvej 399 Department of Arctic Environment PO Box 358 Department of Atmospheric Environ ment DK-4000 Roskilde Department of Environmental Chemistry and Microbiology Denmark Department of Marine Ecology Tel: +45 4630 1200 Department of Policy Analysis Fax: +45 4630 1114 National Environmental Research Institute Department of Freshwater Ecology Vejlsøvej 25 Department of Terrestrial Ecology PO Box 314 DK-8600 Silkeborg Denmark Tel: +45 8920 1400 Fax: +45 8920 1414
National Environmental Research Institute Department of Wildlife Ecology and Biodiversity Grenåvej 14, Kalø DK-8410 Rønde Denmark Tel: +45 8920 1700 Fax: +45 8920 1514

NERI Technical Reports
NERI’s website www.neri.dk contains a list of all published technical reports along with other NERI publications. All recent reports can be downloaded in electronic format (pdf) without charge. Some of the Danish reports include an English summary.
Nr./No. 2010
774 Kvælstofbelastningen ved udvalgte terrestriske habitatområder i Sønderborg kommune. Af Frohn, L. M., Skjøth, C. A., Becker, T., Geels, C. & Hertel, O. 30 s.
769 Biological baseline study in the Ramsar site “Heden” and the entire Jameson Land, East Greenland. By Glahder, C.M., Boertmann, D., Madsen, J., Tamstorf, M., Johansen, K., Hansen, J., Walsh, A., Jaspers, C. & Bjerrum, M. 86 pp.
768 Danish Emission Inventory for Solvent Use in Industries and Households. By Fauser, P. 47 pp.
767 Vandmiljø og Natur 2008. NOVANA. Tilstand og udvikling. Af Nordemann Jensen, P., Boutrup, S., Bijl, L. van der, Svendsen, L.M., Grant, R., Wiberg-Larsen, P., Jørgensen, T.B., Ellermann, T., Hjorth, M., Josefson, A.B., Bruus, M., Søgaard, B., Thorling, L. & Dahlgren. K. 106 s.
766 Arter 2008. NOVANA. Af Søgaard, B., Pihl, S., Wind, P., Laursen, K., Clausen, P., Andersen, P.N., Bregnballe, T., Petersen, I.K. & Teilmann, J. 118 s.
765 Terrestriske Naturtyper 2008. NOVANA. Af Bruus, M., Nielsen, K. E., Damgaard, C., Nygaard, B., Fredshavn, J. R. & Ejrnæs, R. 80 s.
764 Vandløb 2008. NOVANA. Af Wiberg-Larsen, P. (red.) 66 s.
763 Søer 2008. NOVANA. Af Jørgensen, T.B., Bjerring, R., Landkildehus, F., Søndergaard, M., Sortkjær, L. & Clausen, J. 46 s.
762 Landovervågningsoplande 2008. NOVANA. Af Grant, R., Blicher-Mathiesen, G., Pedersen, L.E., Jensen, P.G., Hansen, B. & Thorling, L. 128 s.
761 Atmosfærisk deposition 2008. NOVANA. Af Ellermann, T., Andersen, H.V., Bossi, R., Christensen, J., Kemp, K., Løfstrøm, P. & Monies, C. 74 s.
760 Marine områder 2008. NOVANA. Tilstand og udvikling i miljø- og naturkvaliteten. Af Hjorth, M. & Josefson, A.B. (red.) 136 s.
2009
759 Control of Pesticides 2008. Chemical Substances and Chemical Preparations. By Krongaard, T. 25 pp.
758 Oplandsmodellering af vand og kvælstof i umættet zone for oplandet til Højvads Rende. Af Grant, R., Mejlhede, P. & Blicher-Mathiesen, G. 74 s.
757 Ecology of Læsø Trindel – A reef impacted by extraction of boulders. By Dahl, K., Stenberg, C., Lundsteen, S., Støttrup, J., Dolmer, P., & Tendal, O.S. 48 pp.
755 Historisk udbredelse af ålegræs i danske kystområder. Af Krause-Jensen, D. & Rasmussen, M.B. 38 s.
754 Indicators for Danish Greenhouse Gas Emissions from 1990 to 2007. By Lyck, E., Nielsen, M., Nielsen, O.-K., Winther, M., Hoffmann, L. & Thomsen, M. 94 pp.
753 Environmental monitoring at the Seqi olivine mine 2008-2009. By Søndergaard, J., Schiedek, D. & Asmund, G. 48 pp.
751 Natur og Miljø 2009 – Del B: Fakta. Af Normander, B., Henriksen, C.I., Jensen, T.S., Sanderson, H., Henrichs, T., Larsen, L.E. & Pedersen, A.B. (red.) 170 s. (også tilgængelig i trykt udgave, DKK 200)
750 Natur og Miljø 2009 – Del A: Danmarks miljø under globale udfordringer. Af Normander, B., Jensen, T.S., Henrichs, T., Sanderson, H. & Pedersen, A.B. (red.) 94 s. (also available in print edition, DKK 150)
749 Thick-billed Murre studies in Disko Bay (Ritenbenk), West Greenland.By Mosbech, A., Merkel, F., Boertmann, D., Falk, K., Frederiksen, M., Johansen, K. & Sonne, C. 60 pp.
747 Bunddyr som indikatorer ved bedømmelse af økologisk kvalitet i danske søer.Af Wiberg-Larsen, P., Bjerring, R. & Clausen, J. 46 s.

ISBN: 978-87-7073-164-5ISSN: 1600-0048
ENVIRONMENTAL MONITORING AT THE FORMER LEAD-ZINC MINE IN MAARMORILIK, NORTHWEST GREENLAND, IN 2009
In 2009 environmental monitoring was carried out at the former lead-zinc mine which closed in 1990. Samples of lichens and blue mussels were analyzed. The study shows, that after mine closure an impact from the previous mining operation can still be seen. The pollution with dust on land seems to continue with no signs of a decrease, while the pollution in the sea is decreasing.