Environmental microbial diversity and anthropogenic impact ...
99
Environmental microbial diversity and anthropogenic impact on Lake Thingvallavatn basin Kjartan Guðmundsson Faculty of Life and Environmental Sciences University of Iceland
Transcript of Environmental microbial diversity and anthropogenic impact ...

Environmental microbial diversity and
anthropogenic impact on Lake Thingvallavatn basin
Kjartan Guðmundsson
Faculty of Life and Environmental Sciences
University of Iceland 2014

Environmental microbial diversity and
anthropogenic impact on Lake Thingvallavatn basin
Kjartan Guðmundsson
60 ECTS thesis submitted in partial fulfillment of a
Magister Scientiarum degree in Environmental Science and Natural
Resources
Advisor
Viggó Þór Marteinsson
Faculty Representative Guðmundur Óli Hreggviðsson
Faculty of Life and Environmental Sciences
School of Engineering and Natural Sciences University of Iceland
Reykjavik, May 2014
Environmental microbial diversity and anthropogenic impact on Lake Thingvallavatn basin
Environmental microbiology of Lake Thingvallavatn basin 60 ECTS thesis submitted in partial fulfillment of a Magister Scientiarum degree in Environmental Science and Natural Resources Copyright © 2014 Kjartan Guðmundsson All rights reserved Faculty of Life and Environmental Sciences School of Engineering and Natural Sciences University of Iceland Sturlugata 7 101, Reykjavik Iceland Telephone: 525 4000 Bibliographic information: Kjartan Guðmundsson, 2014, Environmental microbial diversity and anthropogenic impact on Lake Thingvallavatn basin, Master’s thesis, Faculty of Life and Environmental science, University of Iceland, pp. 97.
Printing: Háskólaprent Reykjavik, Iceland, May 2014

Yfirlýsing Höfundar
Hér með lýsi ég yfir að ritgerð þessi er samin af mér og hún hefur
hvorki að hluta né heild verið lögð fram til hærri prófgráðu.
_______________________________________________ Kjartan Guðmundsson kt. 200888-2439


Abstract
Lake Thingvallavatn is a unique groundwater dependent ecosystem. The water originates from glacier melt water and precipitation falling over the basin, located north of the lake. The basin stretches approximately 1300 km2, largely consisting of wilderness that reaches Langjökull and Thórisjökull glacier in the north. The objectives of the study were to investigate the diversity of microbial communities of Lake Thingvallavatn and two fissures in its basin by differentiating the patterns of phylogenic composition and to establish a microbiological baseline that will enhance the understanding of this unusual ecosystem. In addition, one of the objectives was to evaluate environmental risks of anthropocentric activity to the lake by measuring potential faecal contamination. The results of this study indicate that microbial diversity in Lake Thingvallavatn is not as homogenous as one might think. Cell count and microbial diversity range significantly between sampling locations, showing differences among Lake Thingvallavatn and groundwater fissures in its basin. Furthermore, seasonal variation occurs in the lake but less variation was observed between different depth intervals. Diversity indices were used to estimate biodiversity at the sampling stations. Silfra shows the greatest diversity of all sampling stations in this study, followed by Flosagjá and Lake Thingvallavatn. Lake Thingvallavatn does not seem to follow a global distribution in microbial diversity compared to other freshwater lakes. The reasons behind this might be that Lake Thingvallavatn is a sub-artic lake ecosystem characterized by extreme conditions with especially low and stable water temperature that originates from the lake basin. Sequencing Archaea from Lake Thingvallavatn ecosystem proofed very difficult but members of Crenarcheaota and Euryarcaeota were found. Results show that faecal contamination is present in the lake. One location within Thingvellir National Park came back positive for both E. coli and Enterococcus spp. According to the Thingvellir National Park authorities, 15.126 scuba divers and snorkelers visited Silfra from March of 2013 to March of 2014. No legislations exist in Iceland that oversees the import of scuba diving equipment, which increases the risk of introducing new species to vulnerable ecosystems in Iceland. The author of this paper suggests that legislation on imported scuba equipment should be implemented in Iceland.


Útdráttur
Þingvallavatn er einstakt grunnvatnsháð vistkerfi. Grunnvatnið á upptök sín í jökulvatni og rigningu sem fellur á vatnasviðið norðan við vatnið. Vatnasviðið nær yfir 1300 km2 svæði sem m.a. nær yfir ósnortin víðerni og tengir anga sína alla leið til Langjökuls og Þórisjökuls í norðri. Markmið rannsóknarinnar var að skoða örveruflóru Þingvallavatns og tveggja gjá við vatnið og byggja upp grunnþekkingu á örverum í þessu einstaka vistkerfi. Að auki var markmið rannsóknarinnar að kanna mannleg áhrif á vatnið með því að skoða hugsanlega saurmengun. Niðurstöður rannsóknarinnar benda til þess að örveruflóra Þingvallavatns er mjög breytileg. Frumutalningar og örverubreytileiki sveiflast mikið eftir sýnatökustöðum og sýna mun milli gjánna í vatnasviðinu og vatnsins sjálfs. Breytileiki á örveruflóru milli árstíða á sér einnig stað í vatninu en greindist ekki eins skýrt á milli mismunandi dýpta. Vísar fyrir heildarbreytileika voru notaðir til að áætla mun milli sýnatökustöðva. Silfra sýndi mestan breytileika en Flosagjá og Þingvallavatn fylgdu fast á eftir. Örveruflóra Þingvallavatns virðist ekki fylgja almennri dreifingu í samanburði við önnur ferskvatnsvistkerfi á heimsvísu. Ástæður þess geta verið að Þingvallavatn er staðsett rétt neðan við heimsskautabaug og einkennist af jaðarumhverfi (extreme environments) með lágu vatnshitastigi sem á upptök sín í vatnasviði. Mjög erfiðlega gekk að raðgreina fornbakteríur (Archaea) úr vistkerfi Þingvallavatns en þó greindust meðlimir Crenarcheaota og Euryarcaeota. Niðustöður sýna að saurmengun er til staðar í vatninu. Einn sýnatökustaður innan Þjóðgarðsins á Þingvöllum reyndist jákvæður fyrir bæði E. coli og Enterococcus spp. Samkvæmt upplýsingum frá Þjóðgarðinum á Þingvöllum heimsóttu 15.126 kafarar eða snorklarar Silfru frá Mars 2013 til mars 2014. Engar reglugerðir eru til á Íslandi sem hafa umsjón með innflutningi á köfunarbúnaði sem eykur hættuna á flutningi nýrra tegunda til viðkvæmra vatnsvistkerfa á borð við Þingvallavatn. Höfundur leggur til að reglugerð um notkun á innfluttum köfunarbúnaði verði gerð að lögum.


Til Kristínar Rutar


xi
Table of Contents
List of Figures .................................................................................................... xiii
List of Tables ...................................................................................................... xv
Abbreviations .................................................................................................... xvi
Acknowledgements ........................................................................................... xix
1 Introduction ................................................................................................. 21
1.1 Freshwater ecosystems .................................................................................. 21 1.1.1 Groundwater ecosystems .............................................................................. 24
1.2 Environmental microbes in freshwater ecosystems .................................... 26 1.2.1 Microbes in groundwater ecosystems ............................................................ 28 1.2.2 Prokaryotes .................................................................................................... 28 1.2.3 Methods to detect environmental microbes ................................................... 30
1.3 Previous studies of Lake Thingvallavatn ecosystem ................................... 31 1.3.1 Biodiversity of Lake Thingvallavatn: pelagic and benthic communities .......... 32 1.3.2 Geological makeup of Lake Thingvallavatn basin .......................................... 34 1.3.3 Chemical results from Lake Thingvallavatn´s research history ...................... 38
1.4 Objective of the study and research questions ............................................ 40
2 Materials and Methods ................................................................................ 43
2.1 Study sites and sampling ................................................................................ 43 2.1.1 Study sites...................................................................................................... 43 2.1.2 Sampling ........................................................................................................ 45
2.2 Cell count with flow cytometer ....................................................................... 48 2.3 Colonization Experiment ................................................................................. 48 2.4 16S rRNA gene diversity analysis .................................................................. 49 2.5 Faecal Pollution ............................................................................................... 52 2.6 Additional Data ................................................................................................. 52
3 Results ......................................................................................................... 53
3.1 Sample Characteristics ................................................................................... 53 3.1.1 On site measurements of physical and chemical characteristics ................... 53
3.2 Cell count analysis .......................................................................................... 56 3.2.1 Count of natural fluorescent cells ................................................................... 57 3.2.2 Cell count of DNA stained cells (SYBR Green) .............................................. 59
3.3 Total count of faecal bacteria ......................................................................... 61 3.4 Diversity Analysis by 16S rRNA gene sequencing ....................................... 63
3.4.1 Microbial diversity in Lake Thingvallavatn ...................................................... 63 3.4.2 Microbial diversity in Silfra, Flosagjá and Huldugjá ........................................ 68 3.4.3 Principal Coordinate Analysis (PCoA) by QIIME ............................................ 72 3.4.4 Comparing Shannon-Weiner and Chao1 diversity between sampling locations in Lake Thingvallavatn and fissures ........................................................................... 73 3.4.5 Sequence data analysis with SILVAngs ......................................................... 77
4 Discussion ................................................................................................... 83
4.1 Microbial diversity of Lake Thingvallavatn ecosystem ................................ 83 4.1.1 Unraveling the microbial diversity ..................................................................... 83
4.2 Management of Lake Thingvallavatn ecosystem .......................................... 86

xii
4.2.1 Anthropogenic activity and changes to Lake Thingvallavatn ecosystem ....... 86 4.3 Limitations of the study and further research .............................................. 88
5 Conclusions ................................................................................................. 91
References .......................................................................................................... 93
Appendix A .......................................................................................................... 97

xiii
List of Figures
Figure 1.1. The global water inventory ............................................................................................ 22 Figure 1.2. The hydrological cycle showing the movement of groundwater ................................... 24 Figure 1.3. Major types of groundwater organisms found in subsurface environments .................. 25 Figure 1.4. Universal phylogenic tree .............................................................................................. 27 Figure 1.5. Lake Thingvallavatn catchment area ............................................................................ 35 Figure 1.6. Lake Thingvallavatn groundwater inflow ....................................................................... 36 Figure 1.7. Difference in water temperature and pH ....................................................................... 39 Figure 2.1. Vallargjá, Flosagjá, Nikulásargjá (Peningjagjá) and Seiglugjá seen from above. Silfra is not seen in this picture ..................................................................................................................... 43 Figure 2.2 – Flosagjá seen from the north ...................................................................................... 44 Figure 2.3 – Huldugjá map .............................................................................................................. 45 Figure 2.4. Sampling locations in Lake Thingvallavatn ................................................................... 46 Figure 2.5. Sampling locations in Lake Thingvallavatn basin ......................................................... 47 Figure 2.7. Shannon-Weiner diversity index. .................................................................................. 51 Figure 2.8. Chao1 diversity index .................................................................................................... 51 Figure 3.1. Water temperature (°C) in May/June, June/July, August/September and October 2013 at Lake Thingvallavatn´s main sampling station. ............................................................................. 55 Figure 3.2. pH in May/June, June/July, August/September and October 2013 at Lake Thingvallavatn´s main sampling station. .......................................................................................... 55 Figure 3.3. Conductivity (μS/cm) in May/June, June/July, August/September and October 2013 at Lake Thingvallavatn´s main sampling station. ................................................................................. 56 Figure 3.4. Natural Fluorescent Gates (P1, P2, P3 and P5) from Lake Thingvallavatn in August of 2013 at depth 10m. .......................................................................................................................... 57 Figure 3.5. Total count of cells (log) in Lake Thingvallavatn surface in June/July (n=12), August/September (n=12), September/October (n=15) and October of 2013 (n=12). .................... 58 Figure 3.6. Total count of cell per mL (log) in Lake Thingvallavatn´s groundwater fissures (Silfra, Flosagjá and Huldugjá), Vellankatla input and Steingrímsstöð output. ........................................... 59 Figure 3.7. Total count of cells (log) in Lake Thingvallavatn at different depth intervals (1m, 5m, 10m, 25m and 35m) in May/June, June/July and October of 2013 after addition of SYBR Green dye. ................................................................................................................................................... 60 Figure 3.8. Total count of cells (log) in Lake Thingvallavatn surface in May/June, June/July, September/October and October of 2013 after addition of SYBR Green dye. ................................ 60 Figure 3.9. Total count of cells (log) in Lake Thingvallavatn´s groundwater fissures in May/June, June/July, August/September and October of 2013 after addition of SYBR Green dye.................. 61 Figure 3.10. Lake Thingvallavatn´s microbial diversity at phylum level from in June 2013 (n=5). .. 64 Figure 3.11. Lake Thingvallavatn´s microbial diversity at phylum level in July 2013 (n=5). ........... 65 Figure 3.12. Lake Thingvallavatn´s microbial diversity at phylum level in August 2013 (n=5). ....... 65 Figure 3.13. Microbial diversity of Steingrímsstöð output in October 2013 (n=1). .......................... 66 Figure 3.14. Environmental microbial diversity of Steingrímsstöð output in February 2014 (n=1). 67 Figure 3.15. Microbial diversity of Vellankatla lakebed spring in February 2014 (n=1). ................. 67 Figure 3.16. Environmental microbial diversity of Silfra (sample 1) in September of 2013 (n=1). .. 68 Figure 3.17. Environmental microbial diversity of Flosagjá (sample 1) in September of 2013 (n=1). .......................................................................................................................................................... 69 Figure 3.18. Environmental microbial diversity of Flosagjá (sample 2) in September of 2013 (n=1). .......................................................................................................................................................... 69 Figure 3.19. Environmental microbial diversity of Huldugjá in September of 2013 (n=1). .............. 70 Figure 3.20. Three families of Archaea identified in Silfra and Flosagjá in September 2013. ........ 71 Figure 3.21. Colonized bacteria in Flosagjá (location 1), Flosagjá (location 2) and Silfra over a six-week period (July-September of 2013). ........................................................................................... 72 Figure 3.22. Principal Coordinate Analysis ..................................................................................... 73 Figure 3.23. Shannon-Weiner diversity index from June, July and August of 2013 at Lake Thingvallavatn at five different depth intervals: 1m, 5m, 10m, 25m and 35m. ................................. 74
xiv
Figure 3.24. Chao1 diversity index of Lake Thingvallavatn at five different depth intervals: 1m, 5m, 10m, 25m and 35m. .......................................................................................................................... 74 Figure 3.25. Shannon-Weiner diversity index from groundwater fissures (Silfra, Flosagjá Huldugjá), colonization experiment (Silfra and Flosagjá), input and output. ..................................................... 76 Figure 3.26. Chao1 diversity index from groundwater fissures (Silfra, Flosagjá Huldugjá), colonization experiment (Silfra and Flosagjá), input and output. ..................................................... 77 Figure 3.27. SILVAngs pie chart. Microbial diversity at phylum level (left) with the largest phylum Proteobacteria (right) from Lake Thingvallavatn at 10m from August 2013. .................................... 78 Figure 3.28. Alpha (top left), Beta- (top right), Gamma- (bottom left) and Deltaproteobacteria (bottom right) from Lake Thingvallavatn at 10m in August 2013. ..................................................... 79 Figure 3.29. SYLVangs Fingerprint showing microbial diversity at phylum level of 26 samples retrieved from all sampling locations. ............................................................................................... 81

xv
List of Tables
Table 1.1. Groundwater tributaries of Lake Thingvallavatn basin ................................................... 38 Table 2.1.Wool supports in groundwater fissures. ........................................................................... 49 Table 2.2. PCR-amplification calibrated through trial and error used for all environmental microbial diversity analysis in the study. .......................................................................................................... 50 Table 2.3. PCR program calibrated through trial and error used for all environmental microbial diversity analysis in the study. .......................................................................................................... 50 Table 3.1. Water temperature, pH and conductivity measurements in Lake Thingvallavatn and Steingrímsstöð in June, July and August 2013 and February 2014. ............................................... 54 Table 3.2. E. coli. CFU from 15 locations along Lake Thingvallavatn shoreline. ............................ 62 Table 3.3. Enterococcus spp. CFU from 15 locations along Lake Thingvallavatn shoreline. ......... 63

xvi
Abbreviations
BLAST: Basic local alignment search tool
Cm3: Cubic centimeter
DNA: Deoxyribonucleic acid
DOC: Dissolved organic carbon
DRS: Direct runoff streams
DRL: Direct runoff lakes
E. Coli: Escherichia coli
FACS: Fluorescence-activated cell sorter
FISH: Fluorescence in situ hybridization
GDEs: Groundwater dependent ecosystem
Gl: Giga liter
GPS: Global Positioning System
H: hour
M: Molar
mL: Milliliter
mM: Millimol
m3/sec: Cubic meters per second
Ng/μl: Nanograms per microliter
L: Liter
UK: United Kingdom
USA: United States of America
UNESCO: United Nations Educational, Scientific and Cultural Organization
U/μl: Enzyme units per microliter
OM: Organic Matter
SFS: Spring fed streams

xvii
SFL: Spring fed lakes
TOC: Total organic carbon
Ton/km2: Ton per square kilometer
PCR: Polymerase chain reaction
PCoA: Principal Coordinate Analysis
QIIME: Quantitative insight into microbial ecology
U/μl: Enzyme units per microliter
μS/cm: micro Siemens per cm (Conductivity)
μl: microliter
°C: Degrees celcius


xix
Acknowledgements
I would like to thank my supervisor, Viggó Þór Marteinsson for giving me the opportunity to work on this project at Matís and for the guidance and support he has given me.
Special thanks go to Eyjólfur Reynisson, who was always willing to help me with my problems. He was responsible for majority of the data analysis and also helped with getting the samples ready for sequencing and cell count analysis.
The project would not have been possible without Haraldur Rafn Ingvason, Stefán Már Stefánsson, Finnur Ingimarsson and Hilmar M. Malmquist at The Natural History Museum of Kópavogur. They helped a lot with sampling and measurements of physical and chemical characteristics of the lake and for that I´m very grateful.
I would also like to thank other staff at Matís that helped me with various problems that came up. Special thanks go to Pauline Vannier, Hildur Arna Gunnarsdóttir, Alexandra María Klonowski, Margrét Geirsdóttir, Edda Olgudóttir, Sólveig Katrín Ólafsdóttir and Elísabet Eik Guðmundsdóttir.
At last, I would like to thank my girlfriend Kristín Rut Þórðardóttir and my parents, Edda Guðmundsdóttir and Guðmundur Víðir Helgason for their continued love and support over the years.


21
1 Introduction
In this thesis, the focus is on the environmental microbiology of Lake Thingvallavatn basin, an ecosystem of high importance, complexity and size. Diverse factors have shaped this intriguing landscape into existence and created a dynamic and unique place teaming with life. One of the most influential factors on Lake Thingvallavatn´s ecosystem is without a doubt its location. Situated on the Mid-Atlantic ridge where two continental plates are drifting apart and active volcano’s still exist, makes it an area of astonishing geological setting that embraces life and creates a playground for evolution of fauna and flora. Lake Thingvallavatn is the foreground of Thingvellir, an area of high cultural importance to all Icelanders. Althing, one of the world’s oldest parliaments, established on the banks of the lake in AD 930 was located at the heart of Thingvellir area for several hundred years. Lake Thingvallavatn has been closely linked to Icelandic history and been a popular travel destination for Icelanders and foreign guests alike. Thingvellir became Iceland´s first national park in 1928 and later a UNESCO world heritage site in 2004, listed as a cultural landscape. But why is it important to study Lake Thingvallavatn? Not only is it a remarkable area when it comes to cultural importance and natural phenomena of great international scientific interest. Few ecosystems produce as much pristine freshwater in Iceland as Lake Thingvallavatn basin does, making it a valuable natural resource. Protecting the lake and maintaining sustainable use of it´s resources is of key importance to preserve its integrity. Understanding Lake Thingvallavatn´s environmental microbial diversity is vital. It allows us to monitor changes occurring within the lake and enhances our understanding of the complex factors at play. Many studies have focused on the lake´s biology in the past but none has focused on the environmental microbial diversity. By studying the lake microbial diversity, we are investing in the lake´s future.
1.1 Freshwater ecosystems
Water is one of the earth´s most important natural resources. Without water, life would not be possible, as it is essential to the movement of biochemical cycles and controlling of climate through gravity, evaporation and condensation (vanLoon & Duffy, 2011; Vitousek, Mooney, Lubchenco, & Melillo, 1997). Water covers 71% of Earth´s surface and vast majority of it is found in seas and oceans (vanLoon & Duffy, 2011). Freshwater only makes up about 3% of the total global water resource, with more than two-thirds located in polar ice caps and alpine glaciers. Most of the remaining freshwater is found within the ground, referred to as groundwater (figure 1.1). Only 0.4% of earth´s freshwater is accessible as surface water, where lakes, rivers and wetlands make up the largest part followed by atmospheric water vapor and soil moisture (vanLoon & Duffy, 2011). Freshwater ecosystems are vital parts of the natural environment. They are rich in biodiversity and provide essential ecosystem goods and services to humans,

22
in economic, cultural, aesthetical, educational and scientific terms. Conservation and management of these ecosystems is critical to the interest of all humans, nations and governments (Dudgeon et al., 2006). Freshwater is unevenly distributed resource. In Iceland, it is an ample resource with over 600.000 m3 y-1 being available for each person but in other countries, it can be as little as 100 m3 y-1 (vanLoon & Duffy, 2011).
Figure 1.1. The global water inventory (vanLoon & Duffy, 2011).
River and lake ecosystems in Iceland
The hydrological cycle in Iceland is unusual for many parts. Precipitation remains high but evaporation is low, which has caused high numbers of ground- and surface waters to form (Hilmar J. Malmquist, 1998). Furthermore, a large proportion of area in Iceland lack surface run-offs compared to other countries in Europe, indicating richness in groundwater run-off (Umhverfisstofnun, 2013). The medium runoff per km2 in Iceland is roughly 55 L per second or 1,73 ton/ km2 of annual freshwater formed from precipitation, which are one of highest numbers recorded in Europe (Hilmar J. Malmquist, 1998; Sigurður R. Gíslason & Stefán Arnórsson, 1988). In Iceland, rivers and lakes can be classified by water origin, runoff characteristics and path of direction. The most basic classification is the distinction between fresh- and glacier water, determining water origin. Glacier rivers are found throughout Iceland and will not be classified further in this thesis. However, freshwaters come in many shapes and forms and here we divide them into two subgroups:

23
I. Spring fed streams (SFS) II. Direct runoff streams (DRS)
SFS originate in subterranean groundwater ecosystems found in areas with highly porous rock strata. Temperature and water flow are very stable, displaying high pH (8,5-9,0) and abundance in dissolved minerals (80-200 μS/cm). DRS are surface waters found in areas with low porosity and are characterized by fluctuating temperature, unstable water flow, low pH (7.0-7.5) and low levels of minerals (20-90 μS/cm). DRS are further separated into three groups; Typical DRS, Heath streams and Valley streams, depending on their characteristics and direction of flow (Hilmar J. Malmquist, 1998; Sigurður R. Gíslason & Stefán Arnórsson, 1988)
The main types of rivers and lake ecosystems found in Iceland.
1. Glacier water (Jökulvötn) 2. Fresh waters (Bergvötn)
a. Spring fed streams (Lindavötn) b. Direct runoff streams (Dragavötn)
i. Typical direct runoff streams (Dæmigerð dragavötn) ii. Heath streams (Heiðavötn) iii. Valley streams (Dalavötn)
The main rivers and streams in Iceland along with their branching tributaries have been estimated to be roughly 750 with a combined length of 14.000 km. DRS account for 85%, SFS 10% and glacier rivers 5%.
Lake classification
Lakes in Iceland display a wide range of physical settings, influenced by diverse bedrock geology and hydrology (Karst-Riddoch, Hilmar J. Malmquist, & Smol, 2009). Typical lake categories as quoted by Hilmar J. Malmquist (1998) and modified by the Ecological Survey of Iceland (ESIL):
I. Spring fed lakes (SFL) II. Plateau lakes
III. Direct run-off lakes (DRL) IV. Valley lakes V. Glacial lakes
VI. Coastal lakes
Plateau lakes and DRL are mostly found at elevations above 200 m a.s.l. with catchments of older bedrock origin on either barren highlands or vegetated heaths. However, SFL are found mostly in postglacial landscapes dominated by younger bedrock origin with catchments of highly porous rock strata. Characterized by stable water temperatures and nutrients, SFL mimic SFS in by being generally rich in dissolved nutrients and minerals. Valley lakes are large, deep and dilute lakes formed by narrow valleys. Glacial lakes are fed by glacier melt water and are highly sifted and opaque. Coastal lakes are saline and low elevation lakes formed by marine inputs (Karst-Riddoch et al., 2009). Lakes larger than 0.1km2 are estimated to be around 1850, covering about 1.5 % of Iceland (1300 km2). 17 lakes are larger than 10.1 km2 with combined size of 460 km2 (Hilmar J. Malmquist, 1998).

24
1.1.1 Groundwater ecosystems
Groundwater, traditionally defined as sub-surface water contained within a zone of saturation is the major freshwater store of the hydrological cycle that provides water for human consumption, agriculture, industry and many groundwater dependent ecosystems (Danielopol, Griebler, Gunatilaka, & Notenboom, 2003; Ehrlich, 1996; Kløve et al., 2013). Groundwater was once though to be an inexhaustible resource for human needs. However, increased use for human consumption and irrigation in past decades has threatened groundwater resources and led to lowering of groundwater in large parts of the world (Danielopol et al., 2003; Wada et al., 2010). The largest part of groundwater is derived from surface water whose origin is meteoritic precipitation such as rain and melted snow. Water infiltrates the earth´s surface, building an unsaturated layer and continues to flow underground through fissured or large voids of consolidated rocks or permeable rock strata. Finally, water exfiltrates either at the surface of the earth or into the marine domain (figure 1.2.). In the sub-surface, the flow of groundwater is driven by pressure gradients and gravity (Danielopol et al., 2003). The rate of infiltration of permeable strata depends not only on the surface water supply but also on the porosity of the permeable strata. Surface water slowly infiltrates permeable ground as long as it is not already saturated. As the water seeps into the ground it passes a zone of aeration or unsaturation referred to as the vadose zone to the zone of saturation lying over an impermeable rock strata (Ehrlich, 1996).
Figure 1.2. The hydrological cycle showing the movement of groundwater (Danielopol et al., 2003).

25
It has long been considered that most subterranean waters are large lifeless underground rivers and reservoirs containing pure water, filtered through “mechanical processes” by the soil (Griebler & Lueders, 2009; Hernan, Culver, & Salzman, 2001). However, recent investigation has disproved this popular assumption and increasing recognition is being given to groundwater ecosystems, both as habitat of vulnerable biotic life and as a provider of ecosystem services (Boulton, Fenwick, Hancock, & Harvey, 2008; Hernan et al., 2001). Daily (1997) defines ecosystem services as the conditions and processes by which natural ecosystems and their species sustain and fulfill human life. Groundwater ecosystem services include prevention of land subsidence, erosion and flood control, improvement of water quality as well as reception and bioremediation of wastes of human economic activity (Boulton et al., 2008; Hernan et al., 2001). Subterranean groundwater systems are open systems through which energy flows and matter is processed in different ways. Danielopol et al. (2003), describes three major building blocks of groundwater ecosystems: 1) The groundwater substratum, 2) The groundwater itself, and 3) living organisms. The geological substratum provides an environment for the groundwater to transfer energy and matter over areas inhabited by diverse micro-, meio- and macro-organisms (figure 1.3). The organisms also play a vital role in redistribution of organic matter and energy over areas, ranging from millimeters to meters (Danielopol et al., 2003; Ward et al., 1998). Chemical properties of the groundwater change due to physical, chemical and biological processes in the substratum during the moving of water (Danielopol et al., 2003).
Figure 1.3. Major types of groundwater organisms found in subsurface environments (Danielopol et al., 2003).

26
Groundwater dependent ecosystems
Groundwater dependent ecosystems (GDEs) include valuable ecosystems such as springs, wetlands, rivers, lakes and lagoons (Kløve et al., 2011). GDEs are defined as ecosystems for which current composition, structure and function are reliant on a supply of groundwater. However, GDEs are not yet fully understood as components of the natural environment although their contribution is vital to unique terrestrial and aquatic ecosystems. The ecosystem reliance on groundwater may be continuous, seasonal or occasional, depending on its structure (Kløve et al., 2011). The protection of GDEs and the services that they provide is highlighted by international agreements, e.g. the Ramsar convention on wetlands as well as regional legislations, e.g. The European Water Framework Directive. However in Iceland, no comprehensive legislations on soil and/or groundwater protection exist (Kjartan Guðmundsson, 2012). However, protections of predefined localities have been developed, including a legislation that aims to protect Lake Thingvallavatn basin (Althing, 2005). Gibert and Culver (2009), have pointed out that special environmental conditions of GDEs (stable conditions) favor the occurrence of highly specialized and regionally restricted species. Furthermore, the total species richness of the ecosystems, especially the occurrence of endemic species is closely related to the geological history of the locality (Kløve et al., 2011).
1.2 Environmental microbes in freshwater
ecosystems
The greatest diversity of living organism on planet earth is found within the microbes. They are ubiquitous and abundant life forms, often exposed to extreme conditions, such as frozen Antarctic regions, boiling hot springs and immense pressure. The diversity of microbial populations, only limited by extreme temperature (>121°C), extreme acidic or alkaline pH (<0.5 and >12.5) and water availability, indicates that microbes take advantage of almost any niche found in the environment. They live in an intensively competitive environment and must exploit any advantage that they can (Griebler & Lueders, 2009; Tortora, Funke, & Case, 2007). Microbes that colonize a given habitat may affect each other in number of different ways, e.g. competing for scarce nutrients, oxygen or space, and those organisms that cannot compete affectively are likely to be eliminated. Most bacteria, the largest group of microbes, are free-living and do not necessarily form specific associations with other organisms. There may also be relationships where microbes help each other, discouraging other competitors by producing toxic substances or inducing favorable conditions (Singleton, 1997). All living organisms are generally classified by cell type into three distinct domains, Eukaryotes, Bacteria and Archaea (figure 1.4). The discovery of the three cell types was based on the observations that ribosomes are not the same in all cells. In addition, the three domains differ in membrane lipid structures, RNA transfer molecules and their sensitivity to antibiotics (Tortora et al., 2007).

27
Figure 1.4. Universal phylogenic tree (Pace, 1997).
Today´s understanding of microbial diversity and distribution patterns is still in it´s early stages and exceedingly sparse, especially for groundwater ecosystems. However, some 30 years ago, there was a scientific consensus among microbiologists that distribution of active microbes were limited only to topsoil and rhizosphere environments of the earth´s crust (Griebler & Lueders, 2009). Today, we know that earth´s entire underground is colonized by microbes and these communities mostly consists of a Bacteria and Archaea along with Protozoa and Fungi. These microbe communities are active and responsible for various biochemical cycles that are important in turnover of energy and matter (Griebler & Lueders, 2009; Tortora et al., 2007). However, this key position held in essentially all biochemical cycles does not merely stem from the role of bacteria as the principal degraders but also from their biomass production and tropic coupling to eukaryote predators. By fuelling the food web, microbes have fundamental impact on elemental fluxes and water quality within ecosystem (Newton, Jones, Eiler, McMahon, & Bertilsson, 2011). Microbes and other life forms thrive very well in water. Whitman, Coleman, and Wiebe (1998) point out that numerous estimates of cell densities, volume and carbon indicate that microbes are abundant in both marine and freshwater. An average density estimate of fresh-water environments is believed to be around 106 cells/ml (Whitman et al., 1998). High densities of microbes in a body of water generally indicate high levels of nutrients being present. However, microbial populations of freshwater ecosystems tend to be affected mainly by the availability of oxygen and light. In retrospect, light is the more important resource because
28
photosynthetic algae are the main source of organic matter and hence energy. These organisms are the primary producers of freshwater ecosystems, supporting diverse populations of fish, and other aquatic life (Tortora et al., 2007).
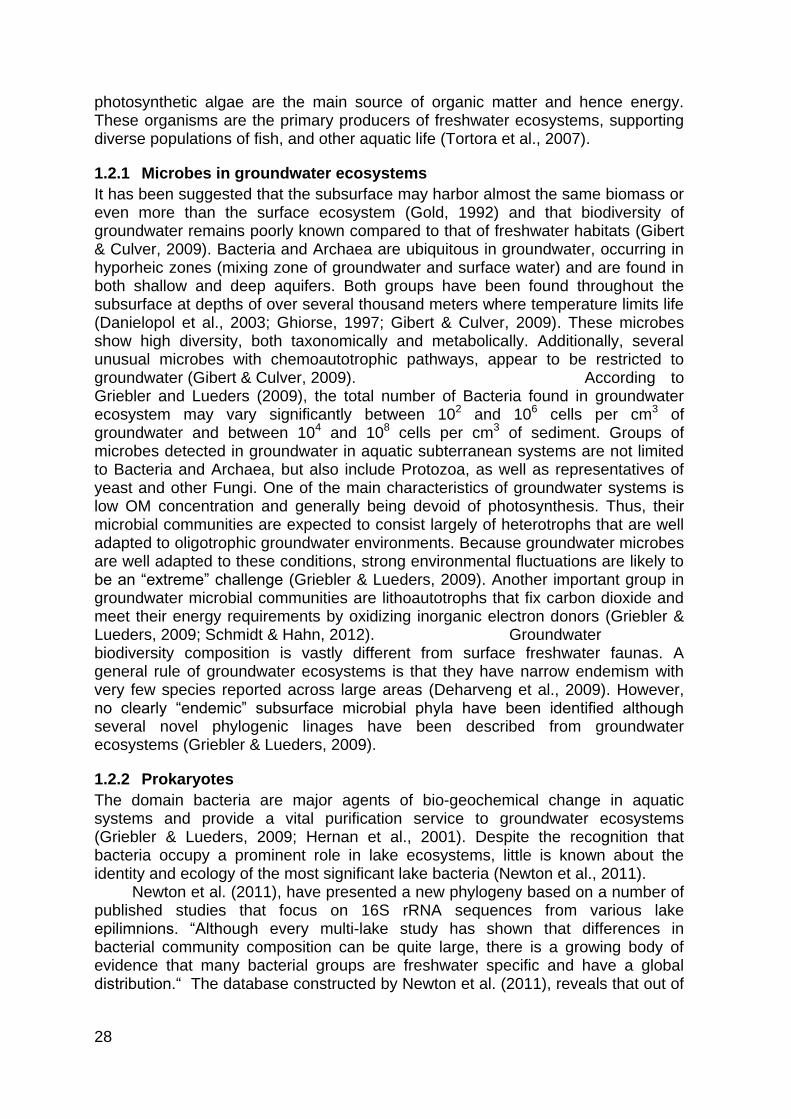
1.2.1 Microbes in groundwater ecosystems
It has been suggested that the subsurface may harbor almost the same biomass or even more than the surface ecosystem (Gold, 1992) and that biodiversity of groundwater remains poorly known compared to that of freshwater habitats (Gibert & Culver, 2009). Bacteria and Archaea are ubiquitous in groundwater, occurring in hyporheic zones (mixing zone of groundwater and surface water) and are found in both shallow and deep aquifers. Both groups have been found throughout the subsurface at depths of over several thousand meters where temperature limits life (Danielopol et al., 2003; Ghiorse, 1997; Gibert & Culver, 2009). These microbes show high diversity, both taxonomically and metabolically. Additionally, several unusual microbes with chemoautotrophic pathways, appear to be restricted to groundwater (Gibert & Culver, 2009). According to Griebler and Lueders (2009), the total number of Bacteria found in groundwater ecosystem may vary significantly between 102 and 106 cells per cm3 of groundwater and between 104 and 108 cells per cm3 of sediment. Groups of microbes detected in groundwater in aquatic subterranean systems are not limited to Bacteria and Archaea, but also include Protozoa, as well as representatives of yeast and other Fungi. One of the main characteristics of groundwater systems is low OM concentration and generally being devoid of photosynthesis. Thus, their microbial communities are expected to consist largely of heterotrophs that are well adapted to oligotrophic groundwater environments. Because groundwater microbes are well adapted to these conditions, strong environmental fluctuations are likely to be an “extreme” challenge (Griebler & Lueders, 2009). Another important group in groundwater microbial communities are lithoautotrophs that fix carbon dioxide and meet their energy requirements by oxidizing inorganic electron donors (Griebler & Lueders, 2009; Schmidt & Hahn, 2012). Groundwater biodiversity composition is vastly different from surface freshwater faunas. A general rule of groundwater ecosystems is that they have narrow endemism with very few species reported across large areas (Deharveng et al., 2009). However, no clearly “endemic” subsurface microbial phyla have been identified although several novel phylogenic linages have been described from groundwater ecosystems (Griebler & Lueders, 2009).
1.2.2 Prokaryotes
The domain bacteria are major agents of bio-geochemical change in aquatic systems and provide a vital purification service to groundwater ecosystems (Griebler & Lueders, 2009; Hernan et al., 2001). Despite the recognition that bacteria occupy a prominent role in lake ecosystems, little is known about the identity and ecology of the most significant lake bacteria (Newton et al., 2011). Newton et al. (2011), have presented a new phylogeny based on a number of published studies that focus on 16S rRNA sequences from various lake epilimnions. “Although every multi-lake study has shown that differences in bacterial community composition can be quite large, there is a growing body of evidence that many bacterial groups are freshwater specific and have a global distribution.“ The database constructed by Newton et al. (2011), reveals that out of
29
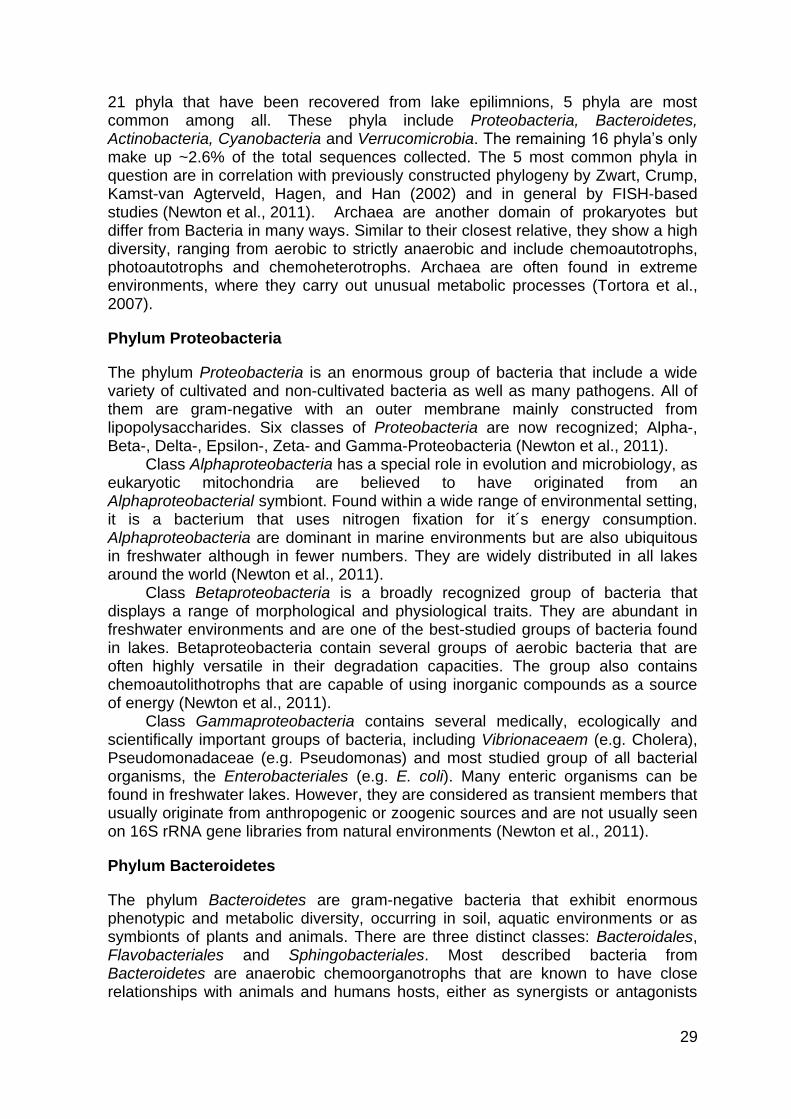
21 phyla that have been recovered from lake epilimnions, 5 phyla are most common among all. These phyla include Proteobacteria, Bacteroidetes, Actinobacteria, Cyanobacteria and Verrucomicrobia. The remaining 16 phyla’s only make up ~2.6% of the total sequences collected. The 5 most common phyla in question are in correlation with previously constructed phylogeny by Zwart, Crump, Kamst-van Agterveld, Hagen, and Han (2002) and in general by FISH-based studies (Newton et al., 2011). Archaea are another domain of prokaryotes but differ from Bacteria in many ways. Similar to their closest relative, they show a high diversity, ranging from aerobic to strictly anaerobic and include chemoautotrophs, photoautotrophs and chemoheterotrophs. Archaea are often found in extreme environments, where they carry out unusual metabolic processes (Tortora et al., 2007).
Phylum Proteobacteria
The phylum Proteobacteria is an enormous group of bacteria that include a wide variety of cultivated and non-cultivated bacteria as well as many pathogens. All of them are gram-negative with an outer membrane mainly constructed from lipopolysaccharides. Six classes of Proteobacteria are now recognized; Alpha-, Beta-, Delta-, Epsilon-, Zeta- and Gamma-Proteobacteria (Newton et al., 2011). Class Alphaproteobacteria has a special role in evolution and microbiology, as eukaryotic mitochondria are believed to have originated from an Alphaproteobacterial symbiont. Found within a wide range of environmental setting, it is a bacterium that uses nitrogen fixation for it´s energy consumption. Alphaproteobacteria are dominant in marine environments but are also ubiquitous in freshwater although in fewer numbers. They are widely distributed in all lakes around the world (Newton et al., 2011). Class Betaproteobacteria is a broadly recognized group of bacteria that displays a range of morphological and physiological traits. They are abundant in freshwater environments and are one of the best-studied groups of bacteria found in lakes. Betaproteobacteria contain several groups of aerobic bacteria that are often highly versatile in their degradation capacities. The group also contains chemoautolithotrophs that are capable of using inorganic compounds as a source of energy (Newton et al., 2011). Class Gammaproteobacteria contains several medically, ecologically and scientifically important groups of bacteria, including Vibrionaceaem (e.g. Cholera), Pseudomonadaceae (e.g. Pseudomonas) and most studied group of all bacterial organisms, the Enterobacteriales (e.g. E. coli). Many enteric organisms can be found in freshwater lakes. However, they are considered as transient members that usually originate from anthropogenic or zoogenic sources and are not usually seen on 16S rRNA gene libraries from natural environments (Newton et al., 2011).
Phylum Bacteroidetes
The phylum Bacteroidetes are gram-negative bacteria that exhibit enormous phenotypic and metabolic diversity, occurring in soil, aquatic environments or as symbionts of plants and animals. There are three distinct classes: Bacteroidales, Flavobacteriales and Sphingobacteriales. Most described bacteria from Bacteroidetes are anaerobic chemoorganotrophs that are known to have close relationships with animals and humans hosts, either as synergists or antagonists

30
(Newton et al., 2011). Bacteroidetes are also known to comprise large proportions of particle-associated bacteria in fresh-water lake epilimnions. They seem to play an important role when it comes to degradation of complex biopolymers. Bacteroidetes also seem to favor high concentrations of DOC (dissolved organic carbon) and are often abundant during periods of cyanobacterial blooms. Unlike other common freshwater bacteria, Bacteroidetes have to not exhibited any seasonal or lake-specific occurrences (Newton et al., 2011).
Phylum Actinobacteria
The phylum Actinobacteria are gram-positive bacteria that are characterized by high mol% of G + C DNA composition (51-70%). Actinobacteria are generally small in various forms (rod, coccus or solenoid) and are pigmented. 16S rRNA and FISH-based studies have revealed that Actinobacteria are ubiquitous and abundant in a variety of freshwater habitats, including lakes. In lake epilimnions, Actinobacteria are often the dominant phylum, sometimes contributing >50% of the bacteria. They have also been recorded in hypolimnions, but their abundance seems to decrease with depth and decreased oxygen levels. Furthermore, the abundance of Actinobacteria in lake epilimnions seems to be consistent across all lake types in all continents across the globe (Newton et al., 2011).
Phylum Cyanobacteria
Cyanobacteria are a phylum of bacteria that obtain their energy through oxygen photosynthesis with help from chlorophyll a and an assortment of phycobilins. However, some Cyanobacteria contain heterocysts and are dedicated solely to nitrogen fixation and play a key part in the nitrogen cycle. Many studies have been dedicated to understanding cyanobacterial blooms and their induction of toxin production in freshwaters. They include a vastly greater number of described species than for other freshwater lake bacterial phyla (Newton et al., 2011).
Phylum Verrucomicrobia
The phylum Verrucomicrobia have been identified from various environments: soils, lakes, oceans and as symbionts of animals. They do not seem particularly abundant in lakes, ranging between <1% and <6% of total clone recoveries but do however have a global distribution. Members of Verrucomicrobia have been observed in both epilimnions and hypolimnions, suggesting a variety of strategies among the group (Newton et al., 2011).
1.2.3 Methods to detect environmental microbes
During the last decades, ribosomal 16S rRNA-based detection methods have allowed studies of microbial diversity to move from a solely cultivation based perspective to one that includes uncultivated microbes. The application of these kind of molecular-phylogenic methods to study natural microbial ecosystems has resulted in the discovery of many unexpected evolutionary lineages (Olsen, Lane, Giovannoni, & Pace, 1986; Pace, 1997). Knowledge of microbes in the environment has mostly relied on studies of pure cultures in the laboratory. However, studies of several types of environments suggest that more than 99% of all microbes seen microscopically are non-cultivated by routine techniques (Pace,

31
1997). The simple morphology of most microbes provides only a few clues for their identification, since their physiological traits are often undistinguishable (Olsen et al., 1986). Before 16S rRNA gene sequencing, microbiologists were often impeded in their research since so many organisms could not be cultivated. Furthermore, it was impossible to know the evolutionary relationships connecting all of life. However, with the introduction of rapid nucleic acid sequencing and recombinant DNA methods, a much-needed phylogenic perspective was brought into microbiology. The analysis is based on nucleotide sequence comparison of ribosomal rRNA or their genes. This type of characterization of unknown organisms requires a reference collection (Olsen et al., 1986). Today, the most common tools to examine DNA and protein sequences is the Basic Local Alignment Search Tool, also referred to as BLAST (Altschul, Gish, Miller, Meyers, & Lipman, 1990). There are several reasons that make rRNAs an excellent choice for mapping phylogenic relationships. The rRNAs are key elements of protein-synthesising machinary within procaryotic and eukaryotic cell and are evolutionary homologus in all organisms. They are extremely well conserved in overall structure, constitute a significant component of cellular mass, provide sufficient sequence information for statistical analysis and seem to lack artifacts of lateral transfer between organisms. Ribosomal RNA genes are obtained by cloning DNA isolated from the enviroment. Before, rRNA can be analysed, it requires sorting from other DNA fragments. The quickest way to survey the constituents of environmental samples containing microbes, is the use of polymerase chain reaction (PCR). By taking advantage of the highly conserved nature of 16S rRNA, universal primers that bind to conserved sequences can be synthesized. These primers are then used with the PCR to amplifiy the DNA from the rRNA genes of all organisms present in the environmental sample. At that point, individual types of genes can be seprated by a cloning step and then sequenced (Pace, 1997). In this study, a high througput 454 sequencing (Roche, Basil, Switzerland) is used, a technology that allows a deep look into environmental diversity samples.
1.3 Previous studies of Lake Thingvallavatn
ecosystem
Lake Thingvallavatn and its water basin have been the primary focus of many scientists throughout the past decades. Pétur M. Jónasson (1992), has tracked the research history of Lake Thingvallavatn thoroughly and points out that it goes all the way back to the period of 1706-1711, when the Icelandic farm codex was established with information on the lake´s agriculture and fisheries. However, the most ancient evidence of the Thingvellir area is contained in the history of the settlement of Iceland, the establishment of Althing and introduction to Christianity in A.D 1000 (Pétur M. Jónasson, 1992). In 1992, a comprehensive book, Thingvellir by Pétur M. Jónasson, describing the various studies of Lake Thingvallavatn and its basin was first published. The book a first attempt to gather all the scientific data available about the area and construct an outline of Lake Thingvallavatn ecosystem and geographical setting. In 2011, the book was republished by Pétur M. Jónasson and Páll Hersteinsson, under the name: Thingvallavatn - A unique world evolving. The work was based on Pétur M.

32
Jónasson´s, “Thingvellir” but gave a more thorough overview of scientific data available and unique status of Lake Thingvallavatn. One of the first persons to describe natural observations at the lake was the Icelandic poet and naturalist Jónas Hallgrímsson. In 1840-41, his observations focused on the limnological characteristics of the water basin, describing the formation of Mt. Skjaldbreiður and how water sifts through the water basin to form the lake itself. He also made notes on brown trout and artic charr found within the ecosystem as well as measuring the low temperature in the fissures north of the lake (Pétur M. Jónasson, 1992). Since then, numerous scientific studies have focused on the lake within various fields, including geology, hydrology, benthic and pelagic fauna, phytoplankton, birds and mammals. Overall, scientific knowledge of Lake Thingvallavatn is very thorough and has come a long way since Jónas Hallgrímsson made his notes on the banks off the lake in the early 19th century. However, there are fields that we are just learning about now with emerging technology. They allow us to look closer and understand the complex relationships between different organisms in the lake.
1.3.1 Biodiversity of Lake Thingvallavatn: pelagic and benthic
communities
At first glance, Lake Thingvallavatn and its basin might not look to be very fertile. The lava shields around the lake are barren and the water in the lake is cold and deep. However, Lake Thingvallavatn is one of Iceland´s most valuable ecosystems in terms of biodiversity (Pétur M. Jónasson & Páll Hersteinsson, 2011). The lake is rich in vegetation, fish and invertebrates that organize themselves in diverse niches. This is line with an old saying in Iceland that states that water that flows from lava shields is fertile.
“Frjó eru vötn, er renna undan hraunum.” – Unknown author
Ecological monitoring of Lake Thingvallavatn
In 2007, a monitoring programme was launched to assess the ecological quality of the lake on the behalf of four institutes in Iceland; The Environment Agency of Iceland, Landsvirkjun, Reykjavik Energy and the Thingvellir National Park. The main goal of the monitoring programme is to promote conservation and sustainable use of the lake ecosystem. Lake Thingvallavatn displays a high conservation value on multiple levels, especially for its clear water, deep blue color as well as it´s unique flora and fauna. The monitoring programme´s goal is to provide essential information on the lake, helping to understand what factors influence the ecosystem and whether it is by natural or anthropogenic causes. By collecting continuous data over long periods of time, variations in the lake can be observed and mapped. The monitoring programme focuses on three main properties of the lake ecosystem;

33
I. Chemical and physical factors of the lake input and output. Observations are
carried out by Jarðvísindastofnun Íslands (Institute of Earth Sciences).
II. Biological, chemical and physical factors in the pelagic system of the lake.
Observations are carried out by Nattúrufræðistofa Kópavogs (Natural History
Museum of Kópavogur).
III. Biology of freshwater fish populations in the lake. Observations are carried out by
Veiðimálastofnun (Institute of Freshwater Fisheries) and Náttúrufræðistofnun
Íslands (Icelandic institute of Natural History)
(Hilmar J. Malmquist, Finnur Ingimarsson, Haraldur R. Yngvason, Stefán M. Stefánsson, & Þóra Hrafnsdóttir, 2012).
The Artic charr: four different morphs found within the lake
During the summer of 1902, Bjarni Sæmundsson, a renowned naturalist, made a number of observations on both limnological and biological properties of the lake. He made a series of temperature measurement, took notes on the invertebrate fauna and vegetation and became the first person to thoroughly study fish in the lake. From his detailed investigation on the lake´s pelagic community, he described three species of freshwater fish: Brown trout (Salmo trutta L.), Artic charr (Salvelinus alpinus L.) and Threespined stickleback (Gasterosteus aculeatus L.). Furthermore, Bjarni Sæmundsson described four different morphs of the Artic charr. Lake Thingvallavatn turned out to be the only lake in the world where this many different morphs of artic charr have formed sympatrially, giving it a special status among lakes worldwide (Pétur M. Jónasson, 1992; Sigurður S. Snorrason, Hilmar J. Malmquist, & Skúli Skúlason, 2011). Sigurður S. Snorrason et al. (2011) also note that the Artic charr´s variable phenotype and ecology are more distinct than seen anywhere else. Despite that Iceland is relatively species poor, it´s aquatic systems are not. “The main reason for this is that the inorganic environment in which organisms live is highly diverse and dynamic due to its recent volcanic nature.” (Sigurður S. Snorrason et al., 2011). Since this discovery, extensive research has been put forward in understanding the evolutionary relationship between the different morphs found in the lake.
The amphipod crustacean C. Thingvallensis
In the summer of 1998, a small white crustacean was caught in Lake Thingvallavatn. Upon further inspection, it turned out to be an amphipod that up to that point had only been found in oceans around Iceland but not in freshwater. A good number of these amphipods have now been caught and described as Crymostygius thingvallensis and Crangonyx islandicus and are both endemic species to Iceland (Bjarni K. Kristjánsson & Jörundur Svavarsson, 2011). Little is known about the ways of these small groundwater amphipods and their discovery has raised questions about how they colonized Iceland. A recent study found strong evidence that C. islandicus showed divergence from monophyletic and geographically isolated populations that could be traced back before the last ice age. This means that these amphipods could possible be the oldest species in Iceland (Kornobis, Snæbjörn Pálsson, Sidorov, Holsinger, & Bjarni K. Kristjánsson, 2011). Despite being mainly found in marine environments, amphipods thrive in

34
several types of freshwater. Many are found in lakes and open water but most are found in groundwater. Groundwater amphipods like C. thingvallensis and C. islandicus are adapted to oligotrophic environments that are devoid of light. Their diet likely consists of bacteria also living with in the rock strata (Bjarni K. Kristjánsson & Jörundur Svavarsson, 2011).
1.3.2 Geological makeup of Lake Thingvallavatn basin
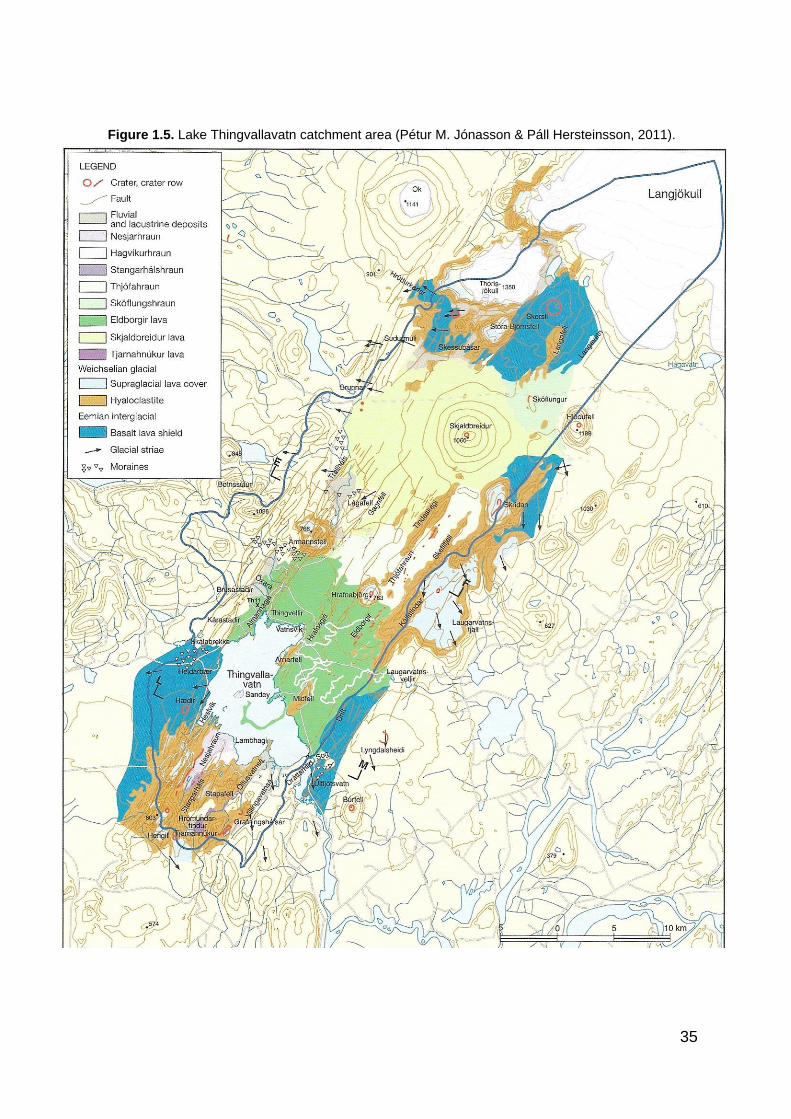
Lake Thingvallavatn´s includes Iceland´s Western Volcanic Zone with it´s volcano tectonic landscape, running parallel to the Eastern Volcanic Zone. These rift zones mark a plate boundary between two continental tectonic plates, the North American and the Eurasian. The Mid-Atlantic ridge is exposed at the surface of Thingvallavatn. More than half of the lake basin is made up of postglacial flows (figure 1.5), including a large section of the lake bottom. Both have been strongly affected by faulting of the landscape. These faults and open groundwater fissures strongly characterise the area at Lake Thingvallavatn and around its basin (Kristján Sæmundsson, 2011; Pétur M. Jónasson & Páll Hersteinsson, 2011).
35
Figure 1.5. Lake Thingvallavatn catchment area (Pétur M. Jónasson & Páll Hersteinsson, 2011).

36
Groundwater, water balance and retention time
Kristján Sæmundsson (1992), described the formation of Lake Thingvallavatn and defined the chief characteristics of different bedrock types found in the area. Lake Thingvallavatn basin is largely subterranean inflow of groundwater, covering roughly 1300 km2, an area 15 times larger than the lake itself (Kristján Sæmundsson, 2011). The basin consists mostly of wilderness and much of the lake is bordered by mountainous terrain that stretches 40km north towards Langjökull and Thorisjökull glacier forming a depression. Mt. Skjaldbreiður, a shield volcano rises from the depression between Lake Thingvallavatn and Langjökull glacier (Árni Snorrason, 2011). 90% of the lake is fed by lakebed springs that mainly enter from the northern shore, surface springs only account for around 10% (Hákon Aðalsteinsson, Pétur M. Jónasson, & Sigurjón Rist, 1992; Kristján Sæmundsson, 1992). Majority of the groundwater wells up from the lake floor, most of which originates in preciptation falling over the lake´s catchment zone and glacier melting draining underground from Langjökull and Thórisjökull ice caps (figure 1.6). Lake Thingvallavatn´s groundwater influent participates in a cycle of the type that generally governs Icelandic hydrology. Frequent rain over the lake catchment zone produces large amounts of water. Highly porous rock strata (lava shields, young hyaloclastites and dolerites) absorb the water and channel it underground, where it is united with glacier draining. The high permeability also facilitates near-horizontal flow within the strata, channeling the groundwater with help of the geological makeup of the area. Furthermore, fissure swarms enhance the permeability, allowing even better groundwater flow. It takes up to 600 years for the water to reach it´s destination after it is deposited in the basin (Freysteinn Sigurðsson & Guttormur Sigbjarnarson, 2011; Pétur M. Jónasson & Páll Hersteinsson, 2011).
Figure 1.6. Lake Thingvallavatn groundwater inflow (Pétur M. Jónasson & Páll Hersteinsson, 2011).
The lake´s inflow is controlled by an annual cycle with peaking during melts of late winter and early springs, during summer the flow diminishes but increases
37
again in the autumn. Annual variability in flow has been known to deviate between 10% and 20% from the long-term mean as the water balance is largely governed by the hydrologic budgets of the lake´s basin. This hydrologic budget or water balance of the lake is affected by factors such as precipitation and runoff from surface areas near the lake, precipitation and evaporation over the lake´s surface, and the seepage into underlying strata (Árni Snorrason, 2011). The ratio between the basin (1300 km2) and the lake (84 km2) is high, which makes the retention time short for a lake of this size. Water in the lake has avarage retention time of only 330 days and is drained by River sog that has an output of roughly 100 m3 per second. This is unusual compared to other lakes in the world that tend to how much longer retention times, e.g. Lake Esröm in Denmark has an avarage retention time of 18 years (Pétur M. Jónasson & Páll Hersteinsson, 2011). According to Kløve et al. (2011), geology and water retention time are two fundamental factors that control natural water chemistry.
Groundwater tributaries of Lake Thingvallavatn
Lake Thingvallavatn depends on the flow of groundwater from inland areas, stretching 40 km towards Langjökull glacier. With an output of roughly 100 m3/sec, the lake depends on enormous amounts of water from its basin fed by precipitation and glacier melt water. The flow of groundwater to Lake Thingvallavatn is separated by the geological makeup of the area, dividing it into five main groundwater streams (table 1.1). However, Almannagjá, Hrafnagjá and Miðfell streams deliver most of the groundwater to Lake Thingvallavatn (Árni Snorrason, 2011). Together, groundwater tributaries are responsible for 90% of all water entering the lake. Flosagjá, Huldugjá and Silfra all belong to the Almannagjá stream, which delivers 30 m3/s of groundwater to the lake. Vellankatla lakebed spring belongs to the Hrafnagjá stream, which delivers 20 m3/s to the lake. Miðfellsstraumur stream delivers 25 m3/s of water to the lake from the east but was included in the study. Proportion of glacier water is greater in Hrafnagjá stream, accounting up to half of all the water. On the other hand, Almannagjá stream delivers greater amount of water to the lake but glacier melt water only accounts for one third of the water (Freysteinn Sigurðsson & Guttormur Sigbjarnarson, 2011).

38
Groundwater tributary Origin Water temperature
°C
Volume input
(m3/s)
Glacier-water constitute
Almannagjá stream Þórisjökull and Skersli 3.0-3.2 30 1/3
Hrafnagjá stream Hlöðufellsjökull and Hlöðufell
2.7-2.9 20 1/2
Miðfell stream Skriða 4.0 25
Kaldá stream Klukkutindar and Kálfstindar
4.0 6
Laugardalur stream Skriða 3.5-4.0 10
Table 1.1. Groundwater tributaries of Lake Thingvallavatn basin (Freysteinn Sigurðsson & Guttormur Sigbjarnarson, 2011).
1.3.3 Chemical results from Lake Thingvallavatn´s research history
Water Temperature
Over a period of 41 years (1962-1994 and 2002-2011), Landsvirkjun measured water temperature in Lake Thingvallavatn´s output, Steingrímsstöð. The 2007-monitoring programme carried on these temperature measurements by using temperature loggers at the lake surface down to depths of 40m. Lake Thingvallavatn´s water temperature remains the same from mid November to mid June each year, averaging between 0-5°C. The coldest months are January through March, when water temperature usually remains under 1°C. From mid June, Lake Thingvallavatn begins to warm up as air temperature rises, reaching maximum water temperatures of 10-13°C from the surface down to 20m. In July and August, temperature remains stable for about six weeks, but as winter sets in, the lake slowly begins to cool down. Water temperature stratification can be formed late summer in Lake Thingvallavatn at 15-25m depths. The water temperature contrast of the stratification is controlled by air temperature and wind, causing the epilimnion (0-24m) to be significantly warmer (10-11°C) compared to the hypolimnion below 24m (7-8°C). A metalimnion can be formed at 20-24m when the stratification is at its strongest, causing water temperature to be 2-4°C colder than at the surface. The average water temperature on a year basis has measured 5.14 ± 0.108°C since 2000 (Hilmar J. Malmquist et al., 2012). Water temperature in the fissures of Lake Thingvallavatn basin has not been monitored as extensively as the water itself. Eydís Salome Eiríksdóttir and Sigurður Reynir Gíslason (2012) measured temperature in Silfra and Vellankatla input as part of the 2007- monitoring program and compared it to data from a large scale research project carried out from 1975-1991 (Jón S. Ólafsson, 1992). Two main groundwater tributaries, showing variations in temperature, feed the fissures in northern Lake Thingvallavatn basin. Silfra, Flosagjá and Huldugjá belong to the

39
Almannagjá stream, delivering a total of 30 m3/s of groundwater to the lake. Vellankatla input belongs to Hrafnagjá stream, delivering a total of 20 m3/s of groundwater to the lake (Freysteinn Sigurðsson & Guttormur Sigbjarnarson, 2011; Hilmar J. Malmquist et al., 2012). A slight contrast in water temperature can be observed between the groundwater tributaries. Over a period of five years (2007-2011), average water temperature measured 2.8 ± 0.02°C in Vellankatla (n=7) compared to 3.4 ± 0.02°C in Silfra (n=7) (Eydís Salome Eiríksdóttir & Sigurður Reynir Gíslason, 2012).
Conductivity, pH and dissolved oxygen
Measurements of conductivity, pH and dissolved oxygen were collected from the lake, input and output from 2007-2011 as part of the monitoring programme (Hilmar J. Malmquist et al., 2012). Little variation was observed in the lake itself throughout the year in conductivity and pH, although both these species are dependent on temperature. Conductivity measured very stable over the observed period, ranging from 71-78 μS/cm and pH averaged between 7,7-8,6. Concentrations of dissolved oxygen measured high in Lake Thingvallavatn, ranging from 10,8 – 15,9 mg O2/I (Hilmar J. Malmquist et al., 2012). Figure 3.1 shows the lake temperature and pH over a period of five years (2007-2011). Temperature measurements were made with temperature loggers down to depths of 40m. Hilmar J. Malmquist et al. (2012), point out that some stratification was formed in August 2007, 2010 and 2011. The stratification was also evident for pH and dissolved oxygen over the same period of time
Figure 1.7. Difference in water temperature and pH (Hilmar J. Malmquist et al., 2012).

40
1.4 Objective of the study and research
questions
In a way, microbes occupy a peculiar place in the human way of life. Most professionals largely ignore them and the public knows little other of microbes than disease and rot. Yet, the planet and its biospheres depends on the workings of the microbial world (Pace, 1997). Considerable research has been carried out on Lake Thingvallavatn and its basin, within various fields. However, the microbiology of the lake has never been studied before with reasons unknown. The objectives of the study were to investigate the diversity of microbial communities by studying the patterns of phylogenic composition of aquatic communities in Lake Thingvallavatn and the fissures in its basin. The study seeks to establish a microbiological baseline for the lake that will enhance the understanding of this unusual ecosystem and can be used for future investigations. In addition, one of the objectives was to estimate certain extent the environmental risks of anthropocentric activity to the lake by measuring fecal contamination.
Statement of objectives
1. To perform a microbiology diversity study of Lake Thingvallavatn.
2. To establish a microbiological baseline for Lake Thingvallavatn ecosystem.
3. To identify possible anthropogenic threats to Lake Thingvallavatn by
exploring fecal contamination in the lake.
Seven research questions are put forth in connection with the objectives of the study.
Research questions
1. Who are the dominant taxa of Bacteria and Archaea found in Lake
Thingvallavatn?
2. Is the microbial diversity in Lake Thingvallavatn similar to that found in
fissures/groundwater springs located in its basin?
3. What is the total number of bacteria in the lake and fissures/groundwater
springs at different sites and at different seasons?
4. Does the microbial numbers and diversity change in the lake with depth and
is there a seasonal difference?
5. Are the dominant bacterial taxa different in Silfra, Flosagjá, Huldugjá fissures
and Vellankatla lakebed spring?
6. Is faecal pollution present in Lake Thingvallavatn?
7. Does anthropogenic pressure effect microbial diversity?

41
Structure
In this thesis, an introduction chapter was provided about freshwater and groundwater systems. This was followed by a discussion about methods used to detect environmental microbes along with an overview of prokaryotes found in freshwater ecosystems. Furthermore, previous studies of Lake Thingvallavatn were presented with background information about the area. In the following chapter, materials and methods will be discussed with detailed information on sampling locations. Results are presented in chapter 3 and are divided into four sections: Sample characteristics, Cell count analysis, Total count of faecal bacteria and Environmental diversity by 16s rRNA gene sequencing. Finally, results and conclusions are explained in the discussion chapter.


43
2 Materials and Methods
2.1 Study sites and sampling
2.1.1 Study sites
Lake Thingvallavatn
Lake Thingvallavatn (64°10´N and 21°10´W) is one of Iceland´s largest, deepest and most well known natural lakes located on the North Atlantic rift zone. The maximum depth of this oligotrophic sub-arctic lake is 114m, making it the 3rd deepest natural freshwater in Iceland. Lake Thingvallavatn has a mean depth of 34m. The lake size is 84 km2 and it has an elevation of 100,5 m a.s.l.
Thingvellir faults
Most of the fissures in Lake Thingvallavatn´s basin lie parallel to each other and stretch southwest to northeast. Together these fissures form two major fault areas and are filled with water because they cut the groundwater layer, one in close proximity of Almannagjá and another one by Hrafnagjá. The landmass between the two fault areas, referred to as Thingvallahraun lava field has subsided and faulting has caused strong alteration of the landscape. The fissures in Thingvellir have many names, although many belong to the same main fissure, each section is given a specific name (figure 2.1)(Björn Th. Björnsson, 1994).
Figure 2.1. Vallargjá, Flosagjá, Nikulásargjá (Peningjagjá) and Seiglugjá seen from above. Silfra is not seen in this picture. (Björn Th. Björnsson, 1994).
44
Flosagjá
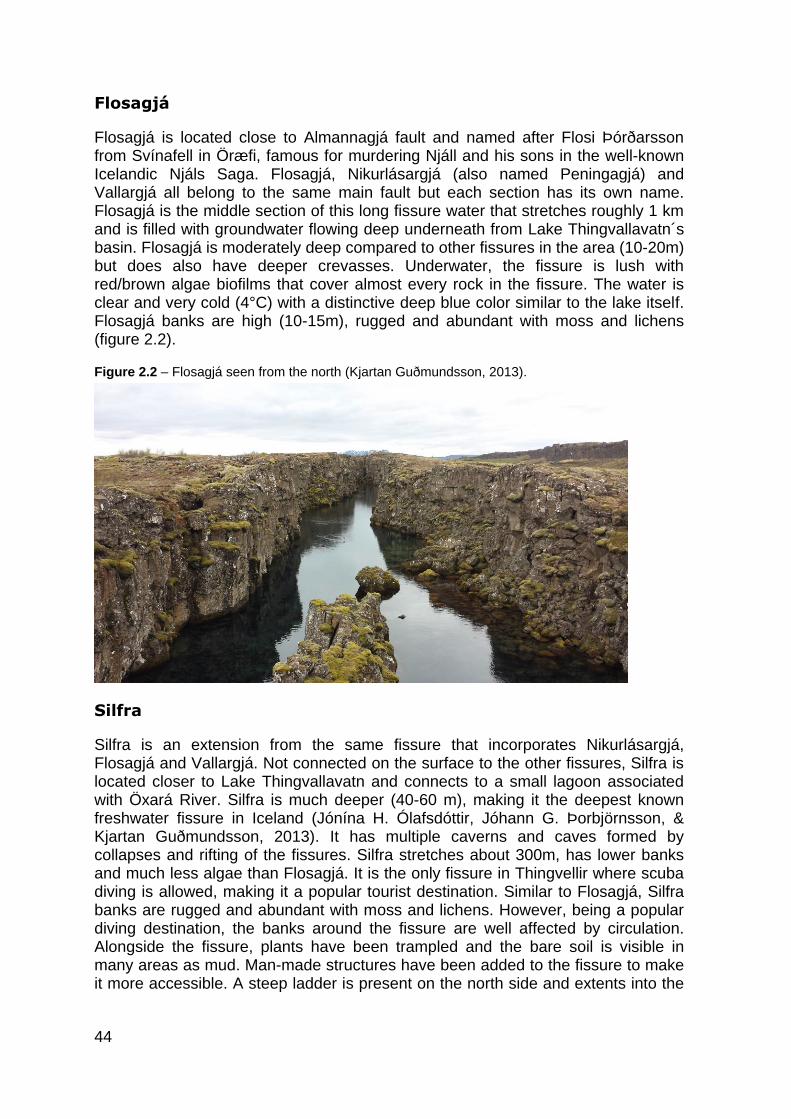
Flosagjá is located close to Almannagjá fault and named after Flosi Þórðarsson from Svínafell in Öræfi, famous for murdering Njáll and his sons in the well-known Icelandic Njáls Saga. Flosagjá, Nikurlásargjá (also named Peningagjá) and Vallargjá all belong to the same main fault but each section has its own name. Flosagjá is the middle section of this long fissure water that stretches roughly 1 km and is filled with groundwater flowing deep underneath from Lake Thingvallavatn´s basin. Flosagjá is moderately deep compared to other fissures in the area (10-20m) but does also have deeper crevasses. Underwater, the fissure is lush with red/brown algae biofilms that cover almost every rock in the fissure. The water is clear and very cold (4°C) with a distinctive deep blue color similar to the lake itself. Flosagjá banks are high (10-15m), rugged and abundant with moss and lichens (figure 2.2).
Figure 2.2 – Flosagjá seen from the north (Kjartan Guðmundsson, 2013).
Silfra
Silfra is an extension from the same fissure that incorporates Nikurlásargjá, Flosagjá and Vallargjá. Not connected on the surface to the other fissures, Silfra is located closer to Lake Thingvallavatn and connects to a small lagoon associated with Öxará River. Silfra is much deeper (40-60 m), making it the deepest known freshwater fissure in Iceland (Jónína H. Ólafsdóttir, Jóhann G. Þorbjörnsson, & Kjartan Guðmundsson, 2013). It has multiple caverns and caves formed by collapses and rifting of the fissures. Silfra stretches about 300m, has lower banks and much less algae than Flosagjá. It is the only fissure in Thingvellir where scuba diving is allowed, making it a popular tourist destination. Similar to Flosagjá, Silfra banks are rugged and abundant with moss and lichens. However, being a popular diving destination, the banks around the fissure are well affected by circulation. Alongside the fissure, plants have been trampled and the bare soil is visible in many areas as mud. Man-made structures have been added to the fissure to make it more accessible. A steep ladder is present on the north side and extents into the

45
water. On the south side, a similar structure was added to help divers get out of the water.
Huldugjá
Huldugjá (the hidden fissure) is a small underground fissure lying paralleled to Flosagjá, first described by Jónína H. Ólafsdóttir et al. (2013). It is a previously unknown fissure, named by the group that found it by accident while working on an exploration and mapping project focused on submersed fissures of Iceland. Huldugjá is accessible through a dry cave in two locations and requires a steep ladder to reach the water at the bottom after you enter the cave (figure 2.3). Diving equipment and knowledge of cave diving is needed to access the fissure below, which measures about 40m deep and 60m wide. No light is present in the fissure at any times. In August 2013, a number of cave amphipods (C. Islandicus) were discovered in the fissure (Jónína H. Ólafsdóttir et al., 2013), which gives reason to study the fissure further.
Figure 2.3 – Huldugjá map (Jónína H. Ólafsdóttir et al., 2013).
2.1.2 Sampling
Lake Thingvallavatn
Sampling in Lake Thingvallavatn took place in June, July, August, September and October of 2013 and February of 2014. In total, 23 SterivexTM filter samples were retrieved from the lake at three locations marked by GPS coordinates and roughly 60 samples for cell count (figure 2.5). A boat was needed to access the main sampling location in the middle of lake, where 20 samples were taken at different depth intervals (1m, 5m, 10m, 25m and 35m) in four trips (5 filters in each trip) at different seasons (June, July, August and October of 2013). Two samples were taken at Steingrímsstöð output (October of 2013 and February of 2014) where water exits the lake and one sample at Vellankatla lakebed spring (February of 2013) where water enters the lake. All filter samples were used for DNA extraction

46
and for each sample taken, a sample specific for cell counts in flow cytometry was also taken. Furthermore, 15 samples for viable cell counts were taken along the shoreline of the lake in September of 2013 to determine if fecal pollution was present in the lake (see chapter 2.5).
Figure 2.4. Sampling locations in Lake Thingvallavatn (Já.is, 2014).
Specialized sampling equipment was needed to retrieve water at different depth intervals (1m, 5m, 10m, 25m and 35m). A custom-built 10L water sampler (Hilmar J. Malmquist et al., 2012) was used at the main sampling station in the lake and Steingrímsstöð output. The instruments is open on both ends and dropped to the right depth and when pulled on, hatches on both ends close and prevent water from escaping. At Vellankatla lakebed spring, a bucket previously washed with 10% HCL was lowered down to capture water escaping from the spring. Water from all sampling stations was stored in 1L bottles and kept at 4°C. Once in the lab, water from the bottles was pressed through a SterivexTM filter and archived at -80°C until being further processed.
47
Fissures
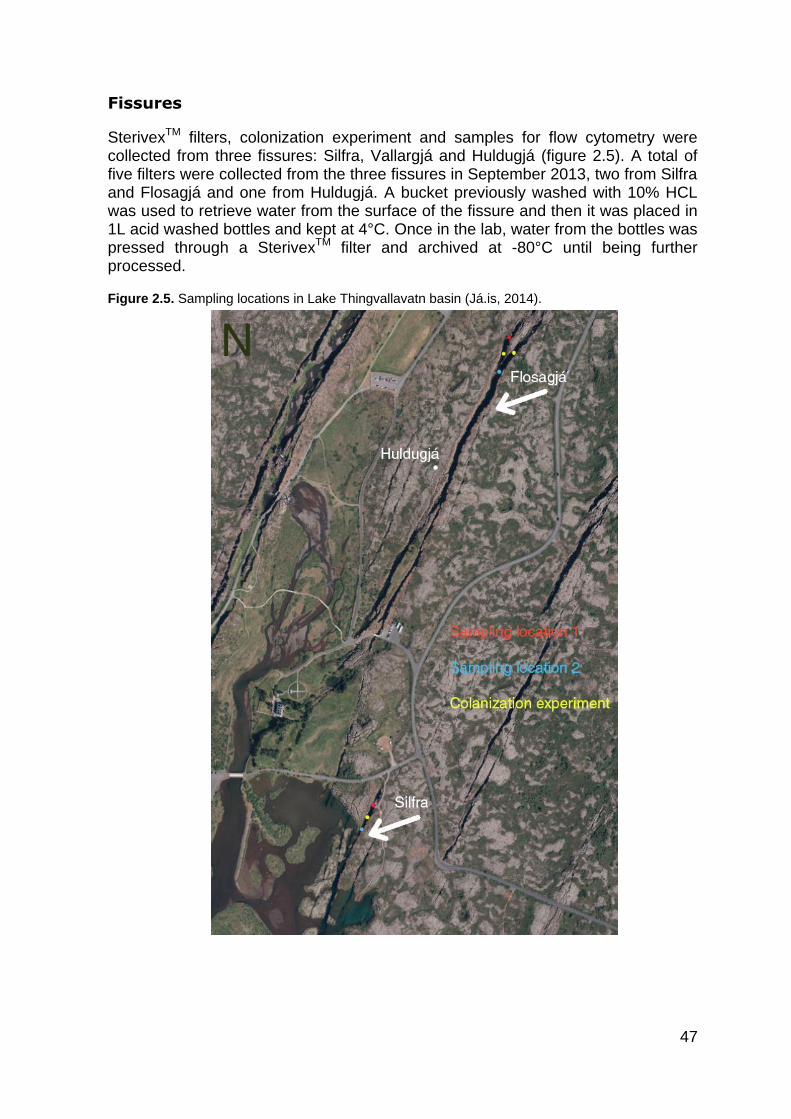
SterivexTM filters, colonization experiment and samples for flow cytometry were collected from three fissures: Silfra, Vallargjá and Huldugjá (figure 2.5). A total of five filters were collected from the three fissures in September 2013, two from Silfra and Flosagjá and one from Huldugjá. A bucket previously washed with 10% HCL was used to retrieve water from the surface of the fissure and then it was placed in 1L acid washed bottles and kept at 4°C. Once in the lab, water from the bottles was pressed through a SterivexTM filter and archived at -80°C until being further processed.
Figure 2.5. Sampling locations in Lake Thingvallavatn basin (Já.is, 2014).

48
2.2 Cell count with flow cytometer
A cell flow cytometer (BD FACSAriaTM) was used to determine cell count and results viewed using BD FACSDivaTM Software. 5 ml of water from each sample was fixed with 50 μl of 25% glutaraldehyd at sampling location and archived at -80°C for cell count. 300 μl and 600 μl of each sample were delivered at calibrated rate through the flow cytometer after the addition of 10 μl of CountbrightTM absolute counting beads (Invitrogen, Carlsbad, USA). The 300μl sample was mixed with 3 μl of 1/100 diluted SYBR Green and incubated at room temperature for 20 min. The 300μl sample was delivered through the flow cytometer for about 1 min and events recorded. The 600μl sample delivered through the flow cytometer for about 3-5 min, depending on number of events recorded. Forward– and right-angle light scattering and DNA fluorescence data were collected. Numbers of cells were then calculated using the formula:
A/B * C/D= concentrations of sample as cell per μl
A refers to number of cell events
B refers to number of bead events
C refers to assigned bead count of the lot (beads/50 μl)
D refers to the volume of sample (μl)
2.3 Colonization Experiment
Samples were collected from Silfra and Flosagjá fissures by using wool as support for the microbes. A sterile wool sock that was capable of absorbing and supporting microbes was placed in the fissures and kept there over a six-week period during the summer of 2013 (July-September). Wool support locations are marked by a yellow dot in figure 2.5. Initially, four wool supports were places in the fissures but only three were retrieved again, one from Silfra and two from Flosagjá (table 2.1). The wool supports were kept at different depths in the fissures. After retrieval, the wool supports were placed in a sterile plastic bag with water from the fissures. Once in the lab, contents of the bag were put in a BagMixer® (Interscience, Saint-Nom, France) to retrieve biological material. The wool support from Flosagjá had significantly more algae than the one from Silfra. Cells were centrifuged at 5000rpm for 20 min and collected. An Epicentre kit (Illumina, San Diego, USA) was used to retrieve DNA and then stored at -20°C until further use.

49
Fissure Depth Period
Silfra (sample 1) 26.7m Six weeks
Vallargjá (sample 1) 5m Six weeks
Silfra (sample 2) 10-15m Not retrieved
Vallargjá (sample 2) 10m Six weeks
Table 2.1.Wool supports in groundwater fissures.
2.4 16S rRNA gene diversity analysis
For the DNA extraction, 1L of water were collected in acid washed bottles in each sampling location. The samples were then filtered through a SterivexTM HV 0.45 μl pore size cellulose membrane filter (Millipore Corporation, Billerica, USA) back at the lab to capture the microbial diversity and archived at -80°C as soon as possible. DNA was extracted from SterivexTM filters by a modification of two previously published protocols (Murray et al., 1998; Somerville, Knight, Straube, & Colwell, 1989). Briefly, 1.6 ml of SET buffer (40 mM ethylenediamine tetraacetic acid, 50 mM Tris-HCl pH 9 and 0.75 M sucrose) and 180 μl of fresh lysozyme solution (990 μl sterile water, 9 mg lysozyme and 9 μl 1 M Tris-HCl pH 8) were added and the filter was incubated with rotation in a hybridization oven (Hybaid, Waltham, USA) at 37°C for 30 min. After the addition of 200 μl of 10% (w/v) SDS and 55 μl of fresh proteinase K solution (950 μl sterile water, 50 μl 1 M Tris-HCl pH 8 and 20 mg proteinase K) the filter was then incubated at 55°C for 2 hours with rotation. Lysates were withdrawn into 5-ml syringes, filters rinsed with 1 ml of SET buffer and the rinsed buffer combined with the lysate. Pooled lysates were added to 15-ml phase lock tubes (Eppendorf, Hamburg, Germany). Two phenol:chloroform:isoamyl alcohol (25:24:1) extractions and a single chloroform extraction were performed with a 2-ml addition of organic solvent to the same tube according to the manufacturer's instructions. Subsequently, the 2–3 ml of aqueous phase was decanted into a 25-ml centrifuge tube. 5 μl of a 20-g l-1 glycogen solution (Roche, Basel, Switzerland), 0.5 volumes of 7.5 M ammonium acetate and two volumes of 95% (v/v) ethanol were added to the tube. Precipitations were carried out overnight at -20°C. Samples were centrifuged at 48 000 g to pellet the nucleic acid, washed twice with 80% (v/v) ethanol, dried for 30 min at room temperature, and suspended in 200 μl of sterile water. DNA was quantified on a 1% (w/v) agarose gel. Extracted DNA was measured in NanoDropTM Spectrometer (Thermo Scientific, Waltham, USA) and diluted to 20 ng/μl before PCR amplification.

50
Primers and polymerase chain reaction (PCR)
VAMPS primers were used to amplify the v3 to v6 region of the 16S rRNA gene using `5-YCTACGGRNGGCWGCAG-3’ forward primer and `5-CGACRRCCATGCANCACCT-3’ reverse primer. Titanium adaptors A and B were attached to the forward and reverse primers respectively along with multiplex identifier (MID) adaptors recommended by Roche to be used in the FLX pyrosequencing (Sogin et al., 2006). The PCR was performed in a 25μl reaction volume (table 2.2) using a FastStartTM High Fidelity kit (Roche, Basel, Switzerland) with the following PCR program (table 2.3), calibrated through trial and error.
FastStartTM High fidelity polymerase chain reaction
2,5 μl High fidelity buffer
0,6 μl dNTP
0,1 μl MgCl2 (25mM)
0,65 μl Reverse primer
0,25 μl Enzyme blend (5 U/μl)
1,25 μl DMSO
15,95 μl dH2O
3,0 μl DNA template (20 ng/μl)
0,65 μl Forward primer
Total 25,0 μl
Table 2.2. PCR-amplification calibrated through trial and error used for all environmental microbial diversity analysis in the study.
PCR program 95°C 03:00
95°C 00:40 54°C 00:40 x35
72°C 00:30 72°C 07:00 4°C Forever
Table 2.3. PCR program calibrated through trial and error used for all environmental microbial diversity analysis in the study.
Preparation of samples
Agarose gel electrophoreses was used to separate the mixed population of DNA on a 1% agarose gel. 16S rRNA DNA was dissected from the gel and stored at -22°C until further treatment. IllustraTM GFX PCR DNA and gel band purification kit (GE Healthcare, Little Chalfont, United Kingdom) was used to separate the gel from the
sample and then dispersed in 20 μl dH2O. This was followed by a Quant-iTTM
PicoGreen dsDNA Assay Kit (Thermo Fischer, Waltham, USA) that was used to determine the samples concentration. When the relative concentration of each sample had been determined with the help of a Victor2 1420 multilabel counter

51
(Perkin-Elmer, Waltham, USA), the samples were diluted to 108 copies of DNA per
μl. After the recovery of a PCR product from the DNA the rest of the workflow prior
to sequencing was done according to manufacturer instructions for FLX amplicon sequencing using the GS Titanium SV emPCR Lib-A kit (Roche, Madison, WI).
16S rRNA pyrosequencing and data analysis by QIIME and SILVAngs processing
Pyrosequencing 70-100 nucleotides of the v6 variables region of the 16s gene was performed with a 454 GS-FLX (Roche, Basel, Switzerland) on all filter and colonization samples in two separate runs (December 2013 and March 2014). Elísbet Eik Guðmundsdóttir, a specialist at Matís Ohf, performed both of the 454 sequencing runs. Sequences were analyzed and viewed using the program QIIME (Quantitative insights Into Microbial Ecology). SILVAngs data analysis service package was used as a complementary pipeline to QIIME (Quast et al., 2013). It creates hierarchical data that can be explored with pie charts and “fingerprint” figures. QIIME (Caporaso et al., 2010) was primarily used and aligned sequences with 97% similarities to produce a dataset for further analysis. The program was also used to produce Chao1 and Shannon-Weiner diversity indices along with a Principal coordinate analysis (PCoA). Diversity indices are mathematical functions used to quantitatively evaluate how many different species are found within a dataset, by combining richness and evenness in a single measure. Species richness is defined as the number of observed species in a community while evenness refers to the measure of homogeneity of abundances in a sample or community. The Shannon-Weiner (figure 2.7) and Chao1 diversity indices (figure 2.8) were used to evaluate species richness within Lake Thingvallavatn´s ecosystem. Chao1 indicates species richness with an added correction factor and its particularly useful for data sets skewed towards the low abundance classes, as is likely the case with microbes. (Hughes, Hellmann, Ricketts, & Bohannan, 2001).
Figure 2.7. Shannon-Weiner diversity index. H is the Shannon diversity index. S is the total number of species in the community (richness). Pi is the proportion of S made up of the ith species (Shannon & Weaver, 1963).
Figure 2.8. Chao1 diversity index. Sobs is the number of observed species, n1 is the highest number of singletons (species captured once), n2 is the number of doubletons (species captured twice) (Hughes et al., 2001).

52
2.5 Faecal Pollution
Samples to determine fecal pollution in Lake Thingvallavatn were collected on one occasion in September 2013. A total of 15 samples were collected from different locations along the lakes shoreline in 100m sterile phase lock tubes (Sarstedt, Numbrech, Germany). In addition 15 samples were retrieved at same locations to determine cell count. All samples were kept at 4°C and analyzed within 24 hours in the lab.
Enterococci spp.
Specified volumes of water samples were filtered through a cellulose membrane filter, pore size 0.45 µm (Millipore Corporation, Billerica, USA). The filters were placed onto solid Slanetz and Bartley medium (Oxoid CM 0377) and incubated at 37°C for 48 h. Typical colonies were counted and confirmation done by transferring the membrane onto a preheated plate of Bile-Aesculin agar (Oxoid CM 0888) and incubated at 44°C for 2 h. Intestinal enterococci hydrolyse aesculin and form a black ferric compound which diffuses into the medium.
E.coli
Specified volumes of water samples were filtered through a cellulose membrane filter, pore size 0.45 µm (Millipore Corporation, Billerica, USA). The filters were placed onto solid mFC agar medium (Difco 267720) and incubated at 44°C for 18 h. Typical colonies were counted and confirmation done by testing of lactose fermentation and gas production in Lactose broth (Oxoid CM 0137). Lactose positive colonies from the faecal coliform incubation were tested for indole production by using Kovacs reagent.
2.6 Additional Data
At the beginning of this study it was clear that additional data was needed to support the environmental microbial analysis. Neither the funding nor the timeframe of the project allowed for any chemical measurements. However, Lake Thingvallavatn has been extensively studied throughout the past decades and a wealth of data has been published and was available to be used in this thesis. Most of the data used originates from the ongoing 2007-monitoring programme being carried out by the Environmental Agency of Iceland, Landsvirkjun, Reykjavík Energy and Thingvellir National Park and collected from The Natural History Museum of Kópavogur (Hilmar J. Malmquist et al., 2012) and the Institute of Earth Sciences, University of Iceland (Eydís Salome Eiríksdóttir & Sigurður Reynir Gíslason, 2012). Data collected by Jón S. Ólafsson (1992), and temperature measurements that were acquired by Landsvirkjun, over a period of 40 years in Lake Thingvallavatn were also used. All of the data used in this study that originates before 2013 is summarized by Hilmar J. Malmquist et al. (2012). New unpublished measurements of physical and chemical characteristics were collected by The Natural History Museum of Kópavogur in joint sampling trips with this study during the summer and winter of 2013 and 2014.

53
3 Results
The objective of this study was to identify the environmental microbial diversity of Lake Thingvallavatn and fissures in its basin; Silfra, Flosagjá and Huldugjá. Multiple samples were taken from the lake, input, output and fissures to reflect bacteria and archaea communities within the ecosystem. The 2007-monitoring program was responsible for wide scale environmental monitoring of Lake Thingvallavatn ecosystem, including physical and chemical characteristics. Microbes found in Lake Thingvallavatn are directly linked to many of these factors and play a vital role in the ecosystem, especially in turnover of energy and matter. Environmental measurements from the 2007- monitoring programme are presented in chapter 3.1. Bacterial load and total count of faecal bacteria are presented in chapter 3.2 and 3.3. Finally, the environmental microbial diversity by 16s rRNA gene sequencing will be presented in chapter 3.4.
3.1 Sample Characteristics
3.1.1 On site measurements of physical and chemical characteristics
Temperature, pH and conductivity measurement were carried out by The Natural History Museum of Kópavogur in joint sampling trips with this study in May/June, June/July, August/September, October 2013 and February 2014. Measurements were made at Lake Thingvallavatn´s main sampling station and at the lake output (Table 3.1). Water temperature measurements for 2013 at Lake Thingvallavatn at different depth intervals is presented in figure 3.1. Measurements of pH and conductivity is presented in figure 3.2 and 3.3. No stratification in temperature or pH was observed over the observed period. However, rapid shift in conductivity in August/September and October were observed between depth intervals.

54
Date Depth (m) Temperature (°C)
Conductivity (μS/cm)
pH
28/05/2013 1 4,20 71,20 7,94
5 4,10 71,10 7,98
10 4,20 71,10 8,13
25 4,10 71,20 8,05
35 4,10 71,00 8,05
Steingrímsstöð output 4,20 72,40 8,37
03/07/2013 1 7,60 70,30 7,91
5 7,50 70,30 7,97
10 7,40 70,30 7,92
25 7,30 70,40 7,92
35 7,30 70,40 7,91
Steingrímsstöð output 8,10 71,40 8,21
28/08/2013 1 9,60 74,10 7,71
5 9,80 74,40 7,99
10 9,70 74,20 7,87
25 9,70 73,60 7,82
35 9,30 74,30 7,80
Steingrímsstöð output 9,50 75,00 7,74
15/10/2013 1 7,20 74,90 7,69
5 7,20 74,80 7,70
10 7,20 74,70 7,69
25 7,10 74,10 7,70
35 7,10 74,20 7,71
Steingrímsstöð output 7,30 75,30 8,17
10/02/2014 Steingrímsstöð output 0,70 75,20 8,05
Table 3.1. Water temperature, pH and conductivity measurements in Lake Thingvallavatn and Steingrímsstöð in June, July and August 2013 and February 2014.

55
Figure 3.1. Water temperature (°C) in May/June, June/July, August/September and October 2013 at Lake Thingvallavatn´s main sampling station.
Figure 3.2. pH in May/June, June/July, August/September and October 2013 at Lake Thingvallavatn´s main sampling station.
0
5
10
15
20
25
30
35
40
2 4 6 8 10 12
De
pth
(m
)
Temperature (°C)
May/June
June/July
August/September
October
0
5
10
15
20
25
30
35
40
7 7,5 8 8,5 9
De
pth
(m
)
pH
May/June
June/July
August/September
October
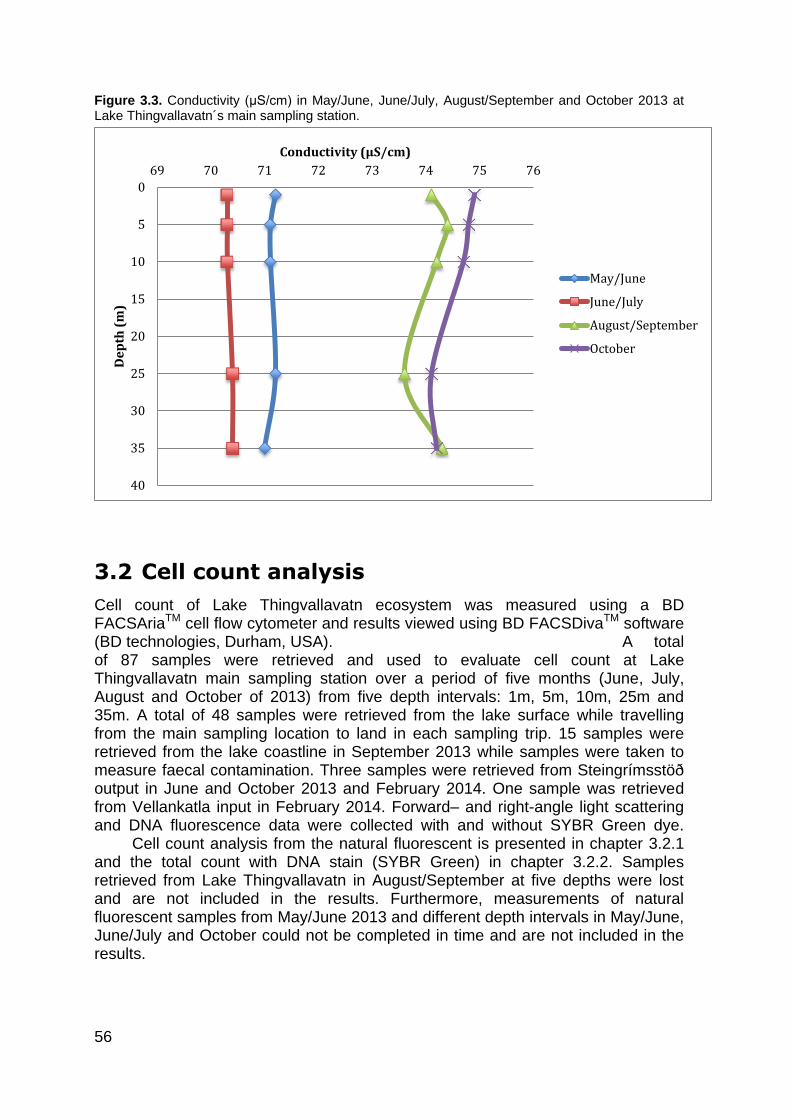
56
Figure 3.3. Conductivity (μS/cm) in May/June, June/July, August/September and October 2013 at Lake Thingvallavatn´s main sampling station.
3.2 Cell count analysis
Cell count of Lake Thingvallavatn ecosystem was measured using a BD FACSAriaTM cell flow cytometer and results viewed using BD FACSDivaTM software (BD technologies, Durham, USA). A total of 87 samples were retrieved and used to evaluate cell count at Lake Thingvallavatn main sampling station over a period of five months (June, July, August and October of 2013) from five depth intervals: 1m, 5m, 10m, 25m and 35m. A total of 48 samples were retrieved from the lake surface while travelling from the main sampling location to land in each sampling trip. 15 samples were retrieved from the lake coastline in September 2013 while samples were taken to measure faecal contamination. Three samples were retrieved from Steingrímsstöð output in June and October 2013 and February 2014. One sample was retrieved from Vellankatla input in February 2014. Forward– and right-angle light scattering and DNA fluorescence data were collected with and without SYBR Green dye. Cell count analysis from the natural fluorescent is presented in chapter 3.2.1 and the total count with DNA stain (SYBR Green) in chapter 3.2.2. Samples retrieved from Lake Thingvallavatn in August/September at five depths were lost and are not included in the results. Furthermore, measurements of natural fluorescent samples from May/June 2013 and different depth intervals in May/June, June/July and October could not be completed in time and are not included in the results.
0
5
10
15
20
25
30
35
40
69 70 71 72 73 74 75 76
De
pth
(m
)
Conductivity (μS/cm)
May/June
June/July
August/September
October

57
3.2.1 Count of natural fluorescent cells
Natural Fluorescent was measured in Lake Thingvallavatn´s surface. Figure 3.4 shows distinct groups of fluorescent phytoplankton and microbes that were detected. Gates were used to group different sized microbes in each sample, Gate P1 was defined as Cyanobacteria, P2 with Nano-Eukaryotes, P5 with Pico-Eukaryotes and P3 was CountbrightTM or absolute counting beads.
Figure 3.4. Natural Fluorescent Gates (P1, P2, P3 and P5) from Lake Thingvallavatn in August of 2013 at depth 10m.
Cell count of fluorescent surface samples
Natural fluorescent was measured in surface samples and is given as averages for each month as cell per mL (log) of each group (figure 3.5). The surface samples from June/July, August/September and October of 2013 were retrieved when travelling from the main sampling station in Lake Thingvallavatn to land at fixed GPS locations. In addition, surface samples from September/October were collected from the lake´s coastline and are included for comparison.

58
Figure 3.5. Total count of cells (log) in Lake Thingvallavatn surface in June/July (n=12), August/September (n=12), September/October (n=15) and October of 2013 (n=12).
*Samples from Lake Thingvallavatn´s shoreline in September/October 2013.
Pico-Eukaryotes represent the most dominant group in the lake´s surface samples. Cyanobacteria were found in slightly lower numbers, followed by Nano-Eukaryotes. Numbers of Pico-Eukaryotes and Cyanobacteria seem to increase as the numbers of Nano-Eukaryotes become less abundant in August/September with rising temperature of the lake. As the temperature drops in October, Nano-Eukaryotes increase in numbers again and Pico-Eukaryotes and Cyanobacteria become less abundant.
Cell count of fluorescent samples from the lake at different depth intervals and fissures
Natural fluorescence was measured in Lake Thingvallavatn´s fissures, input and output and is given as cells per mL (log) for each group (figure 3.6). In comparison with the lake, the fissures show significantly lower numbers of both Cyanobacteria and Pico-Eukaryotes. Nano-Eukaryotes are non-existing at all in the fissures. The lake output shows similar numbers to the surface samples. No Eukaryotic cells were detected at all in Vellankatla lake input. Huldugjá shows the highest abundance of Cyanobacteria and Pico-Eukaryotes of all fissures, possibly indicating sample error as it is devoid of light. Silfra and Flosagjá show similar abundance for all samples.
0
1
2
3
4
5
6
Ce
lls
pe
r m
L (
Lo
g)
Cyanobacteria
Pico-Eukaryotes
Nano-Eukaryotes

59
Figure 3.6. Total count of cell per mL (log) in Lake Thingvallavatn´s groundwater fissures (Silfra, Flosagjá and Huldugjá), Vellankatla input and Steingrímsstöð output.
3.2.2 Cell count of DNA stained cells (SYBR Green)
A SYBR Green dye was added to the samples to measure total count of all cells per mL (log). Figure 3.7 shows the total count of cells detected in Lake Thingvallavatn at different depth intervals in May/June, June/July and October. May/June shows the highest amount (106) of cells for all depth intervals than other months. June/July shows the lowest abundance of the three months, cell numbers increase with depth, dropping slightly at 25m and increase again at 35m. In October, the total amount of cells increases from June/July and shows highest abundance at 10m and 35m.
0
0,5
1
1,5
2
2,5
3
3,5
4
4,5
Ce
lls
pe
r m
L (
Lo
g)
Cyanobacteria
Pico-Eukaryotes
Nano-Eukaryotes
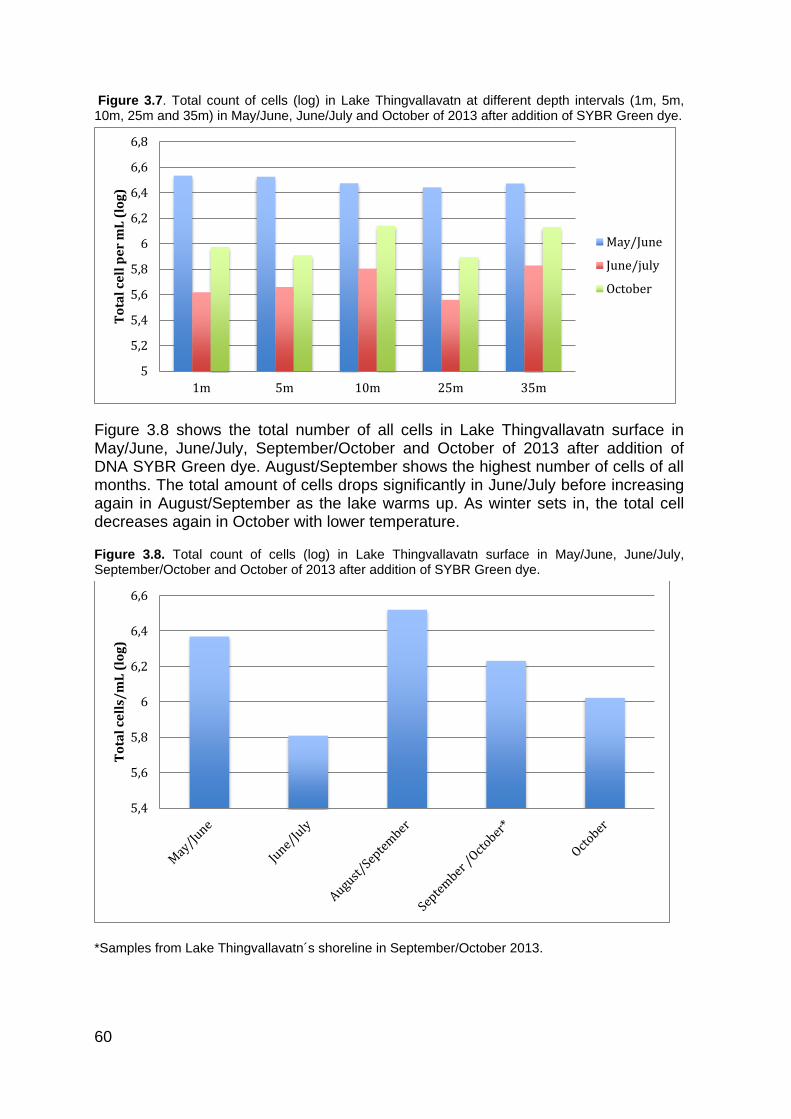
60
Figure 3.7. Total count of cells (log) in Lake Thingvallavatn at different depth intervals (1m, 5m, 10m, 25m and 35m) in May/June, June/July and October of 2013 after addition of SYBR Green dye.
Figure 3.8 shows the total number of all cells in Lake Thingvallavatn surface in May/June, June/July, September/October and October of 2013 after addition of DNA SYBR Green dye. August/September shows the highest number of cells of all months. The total amount of cells drops significantly in June/July before increasing again in August/September as the lake warms up. As winter sets in, the total cell decreases again in October with lower temperature.
Figure 3.8. Total count of cells (log) in Lake Thingvallavatn surface in May/June, June/July, September/October and October of 2013 after addition of SYBR Green dye.
*Samples from Lake Thingvallavatn´s shoreline in September/October 2013.
5
5,2
5,4
5,6
5,8
6
6,2
6,4
6,6
6,8
1m 5m 10m 25m 35m
To
tal
cell
pe
r m
L (
log
)
May/June
June/july
October
5,4
5,6
5,8
6
6,2
6,4
6,6
To
tal
cell
s/m
L (
log
)

61
Figure 3.9 shows total amount of cells in the lake´s fissures in May/June, June/July, August/September and October of 2013 after addition of SYBR Green dye. As with the natural fluorescence, the lake output shows similar numbers to the lake surface samples. The amount of cells in the fissures appears to be lower than in the lake itself. Huldugjá shows higher levels than the other of fissures that remain relatively stable in cell densities.
Figure 3.9. Total count of cells (log) in Lake Thingvallavatn´s groundwater fissures in May/June, June/July, August/September and October of 2013 after addition of SYBR Green dye.
3.3 Total count of faecal bacteria
Screening for faecal bacteria, E. coli and Enterococcus spp. was carried out on 24.09.2013 at 15 locations along Lake Thingvallavatn´s shoreline. The aim was to take random samples from around the lake to determine if any anthropogenic or zoogenic sources were polluting the lake with faecal substances. Appendix A includes GPS coordinates from sampling locations.
3
3,5
4
4,5
5
5,5
6
6,5
To
tal
cell
s p
er
mL
(lo
g)
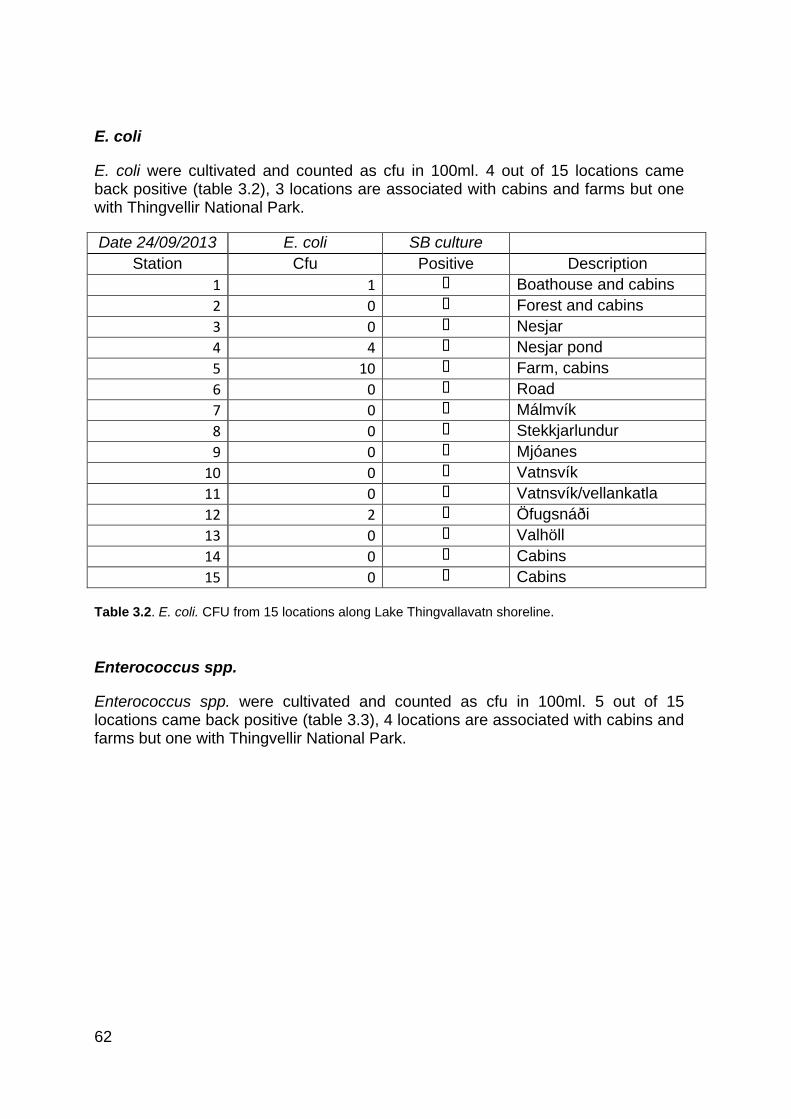
62
E. coli
E. coli were cultivated and counted as cfu in 100ml. 4 out of 15 locations came back positive (table 3.2), 3 locations are associated with cabins and farms but one with Thingvellir National Park.
Date 24/09/2013 E. coli SB culture
Station Cfu Positive Description
1 1 Boathouse and cabins
2 0 Forest and cabins
3 0 Nesjar
4 4 Nesjar pond
5 10 Farm, cabins
6 0 Road
7 0 Málmvík
8 0 Stekkjarlundur
9 0 Mjóanes
10 0 Vatnsvík
11 0 Vatnsvík/vellankatla
12 2 Öfugsnáði
13 0 Valhöll
14 0 Cabins
15 0 Cabins
Table 3.2. E. coli. CFU from 15 locations along Lake Thingvallavatn shoreline.
Enterococcus spp.
Enterococcus spp. were cultivated and counted as cfu in 100ml. 5 out of 15 locations came back positive (table 3.3), 4 locations are associated with cabins and farms but one with Thingvellir National Park.
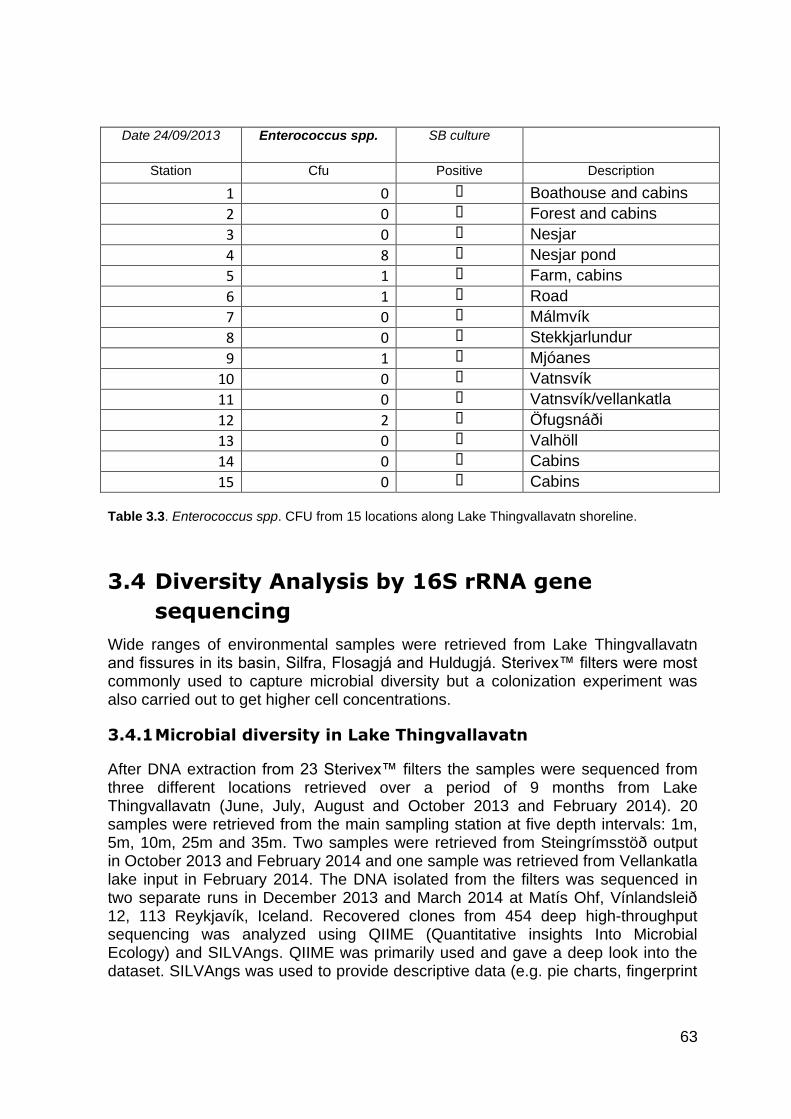
63
Date 24/09/2013 Enterococcus spp. SB culture
Station Cfu Positive Description
1 0 Boathouse and cabins
2 0 Forest and cabins
3 0 Nesjar
4 8 Nesjar pond
5 1 Farm, cabins
6 1 Road
7 0 Málmvík
8 0 Stekkjarlundur
9 1 Mjóanes
10 0 Vatnsvík
11 0 Vatnsvík/vellankatla
12 2 Öfugsnáði
13 0 Valhöll
14 0 Cabins
15 0 Cabins
Table 3.3. Enterococcus spp. CFU from 15 locations along Lake Thingvallavatn shoreline.
3.4 Diversity Analysis by 16S rRNA gene
sequencing
Wide ranges of environmental samples were retrieved from Lake Thingvallavatn and fissures in its basin, Silfra, Flosagjá and Huldugjá. Sterivex™ filters were most commonly used to capture microbial diversity but a colonization experiment was also carried out to get higher cell concentrations.
3.4.1 Microbial diversity in Lake Thingvallavatn
After DNA extraction from 23 Sterivex™ filters the samples were sequenced from three different locations retrieved over a period of 9 months from Lake Thingvallavatn (June, July, August and October 2013 and February 2014). 20 samples were retrieved from the main sampling station at five depth intervals: 1m, 5m, 10m, 25m and 35m. Two samples were retrieved from Steingrímsstöð output in October 2013 and February 2014 and one sample was retrieved from Vellankatla lake input in February 2014. The DNA isolated from the filters was sequenced in two separate runs in December 2013 and March 2014 at Matís Ohf, Vínlandsleið 12, 113 Reykjavík, Iceland. Recovered clones from 454 deep high-throughput sequencing was analyzed using QIIME (Quantitative insights Into Microbial Ecology) and SILVAngs. QIIME was primarily used and gave a deep look into the dataset. SILVAngs was used to provide descriptive data (e.g. pie charts, fingerprint

64
charts). Chloroplast was removed from the QIIME dataset but not from the SILVAngs dataset.
Sequencing results based on different bacteria phyla
Bacteria phyla shown as averages from depths intervals 1m, 5m, 10m, 25m, and 35m from three different months (June, July and August) are displayed in figures 3.10, 3.11 and 3.12. Unfortunately, data from October could not be used as the sequencing failed for all samples. All retrieved samples from Lake Thingvallavatn´s main sampling station in June, July and August 2013 from different depth intervals showed significantly high proportions of Proteobacteria. In June, the ratio of Proteobacteria ranged from approximately 25% to 90%, compared to 55% to 85% in July and August of the total bacteria phyla retrieved. Bacteroidetes measured significantly higher in June than in July and August. Other notable phyla of bacteria recovered include Actinobacteria, OD1, Verrucomicrobia, Elusimicrobia, Cyanobacteria, Chlamydiae, Planctomycetes, Firmicutes and Chloroflexi. The PCR primers used in the study also picked Archaea, mainly members of the phylum of Euryarcaeota and Crenarcheaota.
Figure 3.10. Lake Thingvallavatn´s microbial diversity at phylum level from in June 2013 (n=5).
Proteobacteria 65,04%
Bacteroidetes 19,90%
Acidobacteria 3,24%
Crenarchaeota 1,72%
Actinobacteria 1,69%
Firmicutes 1,62%
Planctomycetes 1,57%
Euryarchaeota 1,13%
OD1 1,04% Other >1%
3,05%

65
Figure 3.11. Lake Thingvallavatn´s microbial diversity at phylum level in July 2013 (n=5).
Figure 3.12. Lake Thingvallavatn´s microbial diversity at phylum level in August 2013 (n=5).
Proteobacteria 72,86%
OD1 4,49%
Crenarchaeota 1,24%
Verrucomicrobia 3,72%
Bacteroidetes 5,19%
Actinobacteria 2,07%
Planctomycetes 1,46%
Firmicutes 1,50%
Chlamydiae 1,12%
Chloroflexi 1,11% Other >1%
5.24%
Proteobacteria 63,17%
Bacteroidetes 6,52%
Actinobacteria 2,08%
OD1 5,58%
Verrucomicrobia 2,69%
Firmicutes 2,33%
Planctomycetes 2,07%
Elusimicrobia 3,80%
Chlamydiae 2,39%
Cyanobacteria 1,21%
Chloroflexi 1,25%
OP3 1,13%
TM7 1,13%
GN02 1,38% Other >1%
3.26%

66
Bacteria phyla from Vellankatla Input and Steingrímsstöð output in October 2013 and February 2014 are presented in figures 3.13, 3.14 and 3.15. In October, Steingrímsstöð output shows similar diversity to the lake in June, July and August with high proportion of Proteobacteria, making up more than 2/3 of the sample. Other phyla´s include Verrucomicrobia, Actinobacteria, Bacteroidetes, Elusimicrobia, OD1 and OD3 that are all also commonly found at other times of the year in similar abundance. However, in February when water temperature is normally under 1°C, abundance of Proteobacteria is low. Verrucomicrobia, Actinobacteria, Cyanobacteria, Bacteroidetes and Planctomycetes all proportionally more abundant than in October. Levels of Proteobacteria in Vellankatla lakebed spring in February are high (40%) and the remainder of the sample is highly diversified with multiple different phyla.
Figure 3.13. Microbial diversity of Steingrímsstöð output in October 2013 (n=1).
Proteobacteria 68,09%
Verrucomicrobia 5,84%
Actinobacteria 1,11%
Bacteroidetes 9,00%
Elusimicrobia 5,02%
OD1 2,47%
OP3 1,61%
Other >1% 6,85%
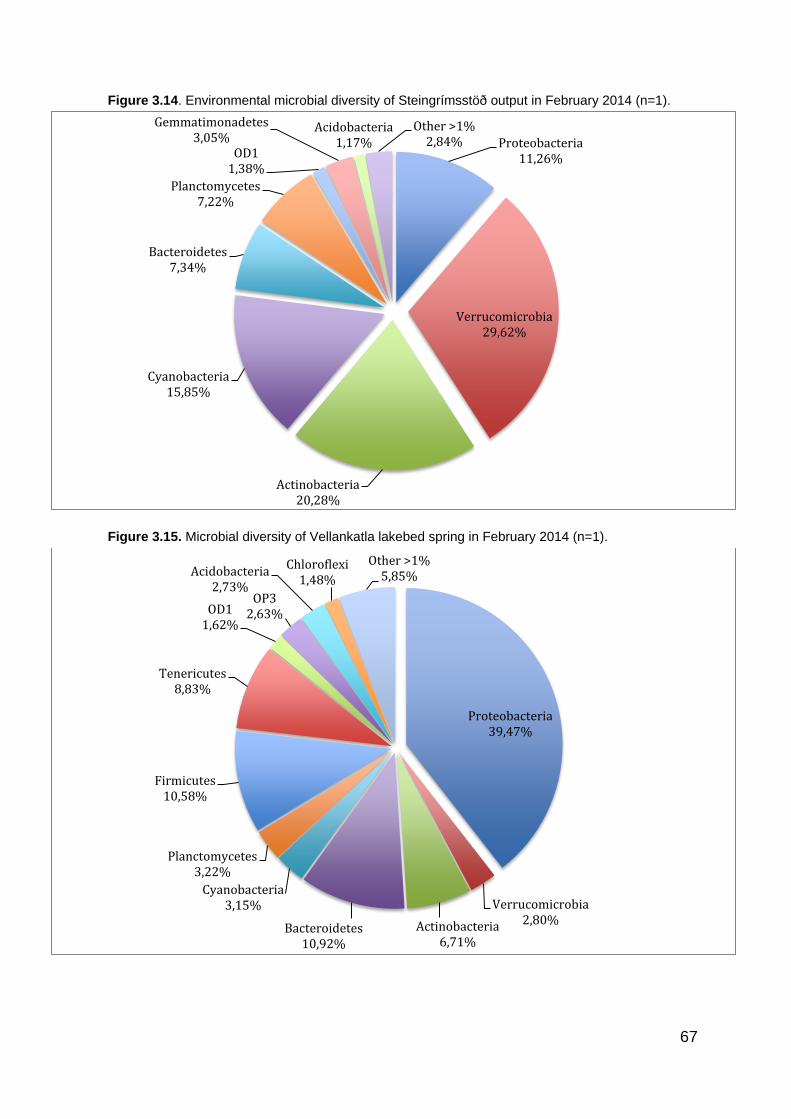
67
Figure 3.14. Environmental microbial diversity of Steingrímsstöð output in February 2014 (n=1).
Figure 3.15. Microbial diversity of Vellankatla lakebed spring in February 2014 (n=1).
Proteobacteria 11,26%
Verrucomicrobia 29,62%
Actinobacteria 20,28%
Cyanobacteria 15,85%
Bacteroidetes 7,34%
Planctomycetes 7,22%
OD1 1,38%
Gemmatimonadetes 3,05%
Acidobacteria 1,17%
Other >1% 2,84%
Proteobacteria 39,47%
Verrucomicrobia 2,80% Actinobacteria
6,71% Bacteroidetes
10,92%
Cyanobacteria 3,15%
Planctomycetes 3,22%
Firmicutes 10,58%
Tenericutes 8,83%
OD1 1,62%
OP3 2,63%
Acidobacteria 2,73%
Chloroflexi 1,48%
Other >1% 5,85%
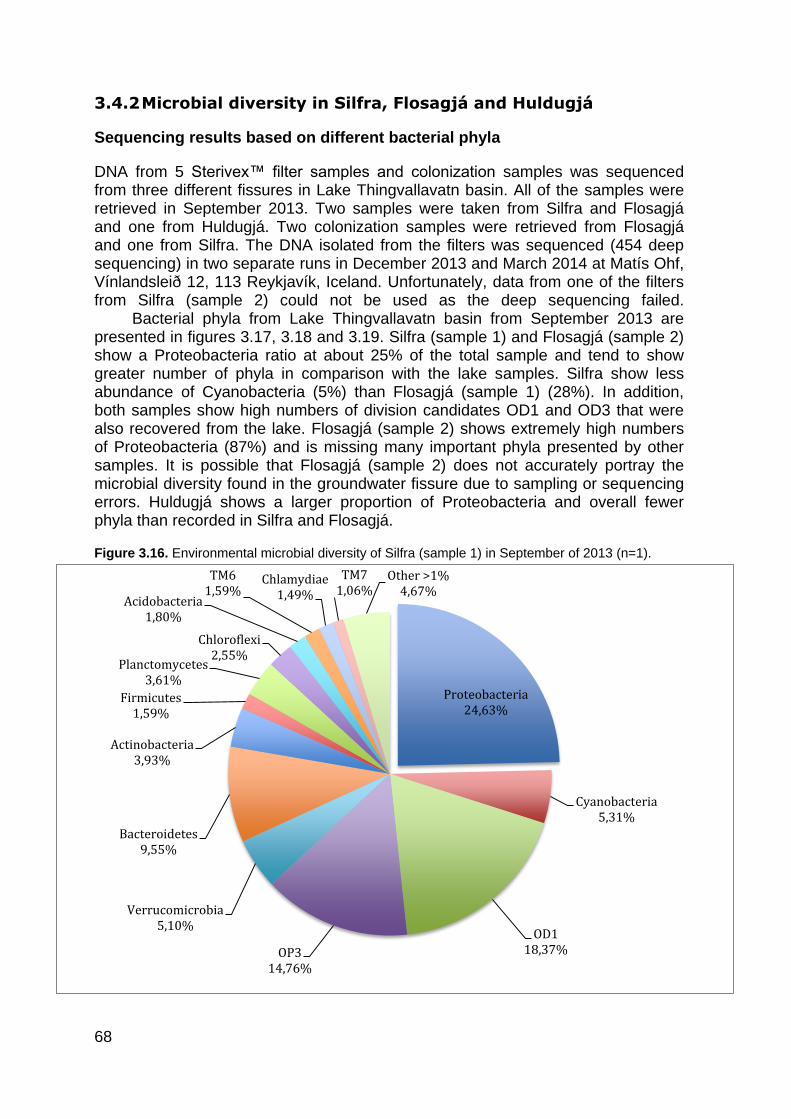
68
3.4.2 Microbial diversity in Silfra, Flosagjá and Huldugjá
Sequencing results based on different bacterial phyla
DNA from 5 Sterivex™ filter samples and colonization samples was sequenced from three different fissures in Lake Thingvallavatn basin. All of the samples were retrieved in September 2013. Two samples were taken from Silfra and Flosagjá and one from Huldugjá. Two colonization samples were retrieved from Flosagjá and one from Silfra. The DNA isolated from the filters was sequenced (454 deep sequencing) in two separate runs in December 2013 and March 2014 at Matís Ohf, Vínlandsleið 12, 113 Reykjavík, Iceland. Unfortunately, data from one of the filters from Silfra (sample 2) could not be used as the deep sequencing failed. Bacterial phyla from Lake Thingvallavatn basin from September 2013 are presented in figures 3.17, 3.18 and 3.19. Silfra (sample 1) and Flosagjá (sample 2) show a Proteobacteria ratio at about 25% of the total sample and tend to show greater number of phyla in comparison with the lake samples. Silfra show less abundance of Cyanobacteria (5%) than Flosagjá (sample 1) (28%). In addition, both samples show high numbers of division candidates OD1 and OD3 that were also recovered from the lake. Flosagjá (sample 2) shows extremely high numbers of Proteobacteria (87%) and is missing many important phyla presented by other samples. It is possible that Flosagjá (sample 2) does not accurately portray the microbial diversity found in the groundwater fissure due to sampling or sequencing errors. Huldugjá shows a larger proportion of Proteobacteria and overall fewer phyla than recorded in Silfra and Flosagjá.
Figure 3.16. Environmental microbial diversity of Silfra (sample 1) in September of 2013 (n=1).
Proteobacteria 24,63%
Cyanobacteria 5,31%
OD1 18,37% OP3
14,76%
Verrucomicrobia 5,10%
Bacteroidetes 9,55%
Actinobacteria 3,93%
Firmicutes 1,59%
Planctomycetes 3,61%
Chloroflexi 2,55%
Acidobacteria 1,80%
TM6 1,59%
Chlamydiae 1,49%
TM7 1,06%
Other >1% 4,67%

69
Figure 3.17. Environmental microbial diversity of Flosagjá (sample 1) in September of 2013 (n=1).
Figure 3.18. Environmental microbial diversity of Flosagjá (sample 2) in September of 2013 (n=1).
Proteobacteria 87,21%
Bacteroidetes 3,97%
OD1 2,50%
Firmicutes 1,03%
Other >1% 5,29%
Proteobacteria 24,12%
Cyanobacteria 28,10%
Bacteroidetes 19,21%
OD1 8,23%
OP3 4,02%
Actinobacteria 2,60%
Verrucomicrobia 2,18%
Acidobacteria 1,84%
Planctomycetes 1,80%
Other >1% 7,90%
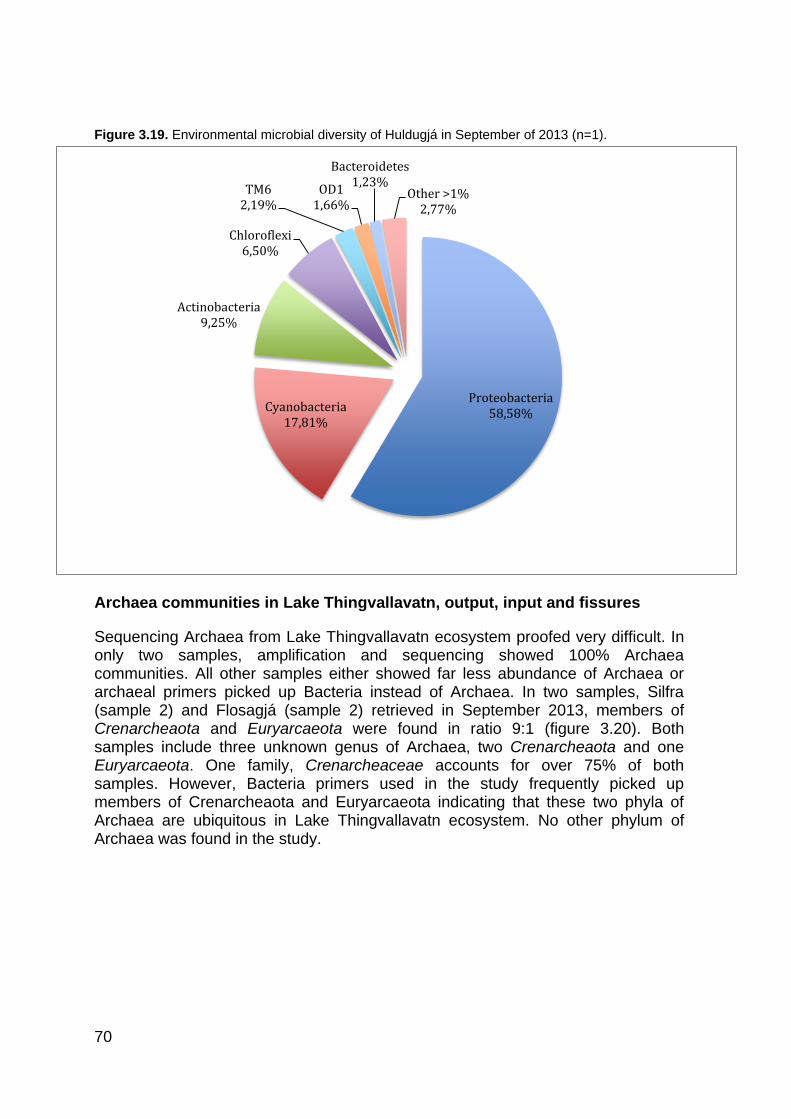
70
Figure 3.19. Environmental microbial diversity of Huldugjá in September of 2013 (n=1).
Archaea communities in Lake Thingvallavatn, output, input and fissures
Sequencing Archaea from Lake Thingvallavatn ecosystem proofed very difficult. In only two samples, amplification and sequencing showed 100% Archaea communities. All other samples either showed far less abundance of Archaea or archaeal primers picked up Bacteria instead of Archaea. In two samples, Silfra (sample 2) and Flosagjá (sample 2) retrieved in September 2013, members of Crenarcheaota and Euryarcaeota were found in ratio 9:1 (figure 3.20). Both samples include three unknown genus of Archaea, two Crenarcheaota and one Euryarcaeota. One family, Crenarcheaceae accounts for over 75% of both samples. However, Bacteria primers used in the study frequently picked up members of Crenarcheaota and Euryarcaeota indicating that these two phyla of Archaea are ubiquitous in Lake Thingvallavatn ecosystem. No other phylum of Archaea was found in the study.
Proteobacteria 58,58% Cyanobacteria
17,81%
Actinobacteria 9,25%
Chloroflexi 6,50%
TM6 2,19%
OD1 1,66%
Bacteroidetes 1,23%
Other >1% 2,77%

71
Figure 3.20. Three families of Archaea identified in Silfra and Flosagjá in September 2013.
Colonization experiment in Silfra and Flosagjá
Wool support was used for a colonization experiment in Flosagjá and Silfra over a six-week period (July- September of 2013). Originally, four wool supports were placed in the fissure but only three were retrieved again, one from Silfra and two from Flosagjá (see table 2.1). All three samples ranged significantly in bacterial composition. The four most common phyla were Proteobacteria, Firmicutes, Cyanobacteria and Bacteroidetes. Flosagjá (location 1) showed highest number of Firmicutes, followed by Proteobacteria. Flosagjá (location 2) showed high numbers of Proteobacteria and Cyanobacteria but lacked Firmicutes in contrast with Flosagjá (location 1). Silfra showed high numbers of Proteobacteria (88%) followed by Bacteroidetes. Overall, the colonization experiment shows less microbial diversity than recorded with the filters and only tends to show the most dominant groups found.
8%
77%
8% 6% 9%
75%
11% 5%
0%
10%
20%
30%
40%
50%
60%
70%
80%
90%
(Crenarchaeota)Cenarchaeales
(Unknown familyand genus)
(Crenarchaeota)Cenarchaeaceae
(Unknown genus)
(Euryarchaeota)Family WCHD3-02(unknown genus)
Other >3%
Flosagjá
Silfra

72
Figure 3.21. Colonized bacteria in Flosagjá (location 1), Flosagjá (location 2) and Silfra over a six-week period (July-September of 2013).
3.4.3 Principal Coordinate Analysis (PCoA) by QIIME
Principal Coordinate analysis is a statistical procedure commonly used to compare groups of samples based on phylogenic distance metrics. QIIME was used in the study to differentiate between samples based on the microbial diversity plotted in a 3D dimension (figure 3.22). Samples that did not have more than 150 sequences were excluded. Samples that group closely together show similarities when it comes to their microbial diversity. Overall, the samples on the PCoA plotted for Lake Thingvallavatn ecosystem show a large difference in microbial diversity. Samples from the lake at different depth intervals grouped together, with an exception to 1m and 25m retrieved in July 2013. The fissures in the picture tend to group together, although Huldugjá (H.10.09.2013) and Flosagjá sample 2 (V.10.09.2013) show difference from others. The input and output from February show difference form other samples (blue). 25m from August 2013 show a slight deviation from other depth intervals.
0,00%
20,00%
40,00%
60,00%
80,00%
100,00%
Proteobacteria Firmicutes Cyanobacteria Bacteroidetes Other >1%
Flosagjá (location 1) Flosagjá (location 2) Silfra Total

73
Figure 3.22. Principal Coordinate Analysis
3.4.4 Comparing Shannon-Weiner and Chao1 diversity between sampling locations in Lake Thingvallavatn and fissures
Lake Thingvallavatn
Shannon-Weiner and Chao1 indices from Lake Thingvallavatn were calculated from samples with QIIME and are presented in figures 3.24 and 3.25. Sequencing of one sample retrieved from June 2013 (10m) failed and is not included in the data. Data is compiled from 247 sequences per samples. The Shannon-Weiner diversity index from Lake Thingvallavatn at five different depth intervals shows the highest numbers in August followed by July and June of 2013. Hence, the biodiversity seems to peek at the end of the summer when the water temperature is also at its highest. In June, the diversity index shows less fluctuation between months, although sample from 10m is missing. In July, the diversity index is slightly larger for 5m and 35m than June and seems to keep up with August. However, it drops at depths 1m and 25m, possible indicating sampling

74
error, as the temperature remained relatively stable at all depths in July. Furthermore, this corresponds the deviation observed in the PCoA graph. In August, the diversity index is high for all depths but drops a bit at 25m.
Figure 3.23. Shannon-Weiner diversity index from June, July and August of 2013 at Lake Thingvallavatn at five different depth intervals: 1m, 5m, 10m, 25m and 35m.
Figure 3.24. Chao1 diversity index of Lake Thingvallavatn at five different depth intervals: 1m, 5m, 10m, 25m and 35m.
0
1.000
2.000
3.000
4.000
5.000
6.000
7.000
8.000
1m 5m 10m 25m 35m
Sh
an
no
n-W
ein
er
av
era
ge
06.06.2013 03.07.2013 28.08.2013
0
100.000
200.000
300.000
400.000
500.000
600.000
700.000
800.000
900.000
1m 5m 10m 25m 35m
Ch
ao
1 a
ve
rag
e
06.06.2013 03.07.2013 28.08.2013

75
In comparisons with the Shannon-Weiner, Chao1 shows more contrast between samples with larger variations. This is perhaps because chao1 includes a correlations factor that favors low abundant classes, which is often the case with microbes. For Lake Thingvallavatn, the Chao1 diversity index shows highest numbers for July and August of 2013. The numbers are somewhat consistent for depths of 5m, 10m and 35m but depths of 1m and 25m show significant deviation. June shows significantly lower numbers for all months than July and August.
Groundwater fissures, colonization experiment, input and output
Shannon-Weiner and Chao1 indices from Lake Thingvallavatn´s basin, input and output were calculated from samples using QIIME and are presented in figures 3.25 and 3.26. The Shannon Diversity index from the lake´s basin shows that the groundwater fissures vary considerably in biodiversity. Silfra (filter) shows the highest numbers of all, followed by Flosagjá (filter) and Vellankatla (filer). Samples from the colonization experiment show highest numbers from Silfra. Huldugjá measures slightly lower than the lake output in October 2013, but shows much lower numbers than Silfra and Flosagjá.
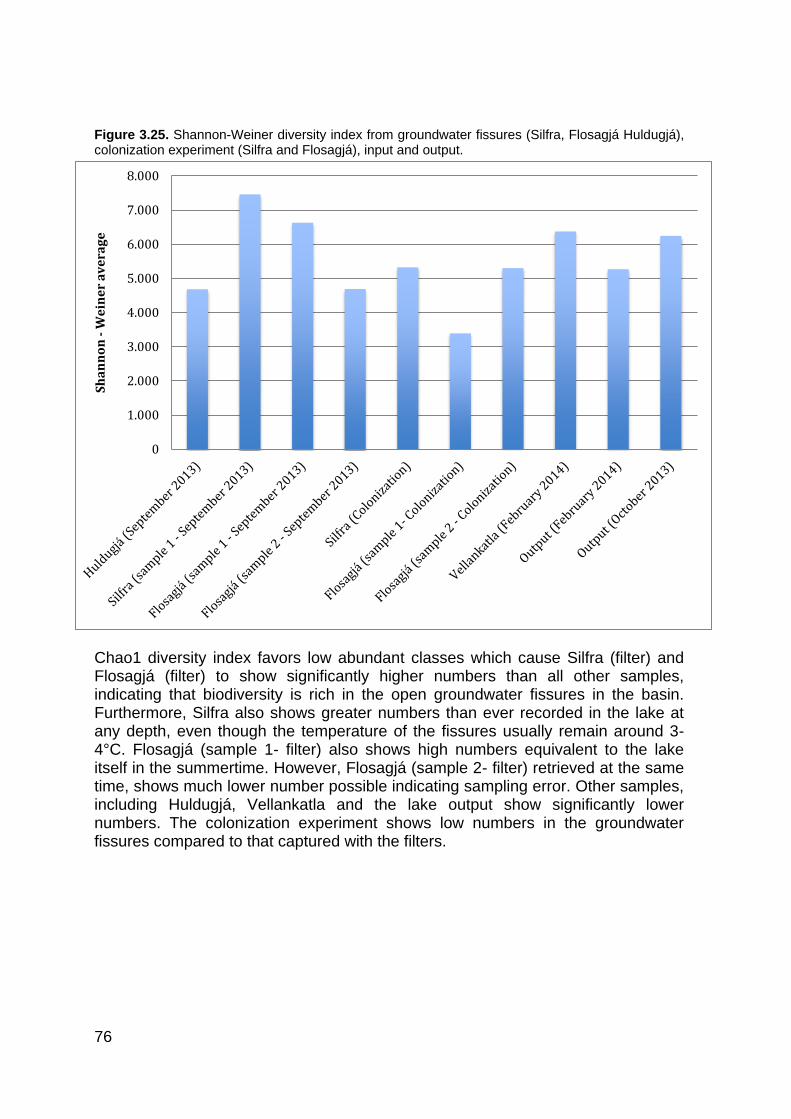
76
Figure 3.25. Shannon-Weiner diversity index from groundwater fissures (Silfra, Flosagjá Huldugjá), colonization experiment (Silfra and Flosagjá), input and output.
Chao1 diversity index favors low abundant classes which cause Silfra (filter) and Flosagjá (filter) to show significantly higher numbers than all other samples, indicating that biodiversity is rich in the open groundwater fissures in the basin. Furthermore, Silfra also shows greater numbers than ever recorded in the lake at any depth, even though the temperature of the fissures usually remain around 3-4°C. Flosagjá (sample 1- filter) also shows high numbers equivalent to the lake itself in the summertime. However, Flosagjá (sample 2- filter) retrieved at the same time, shows much lower number possible indicating sampling error. Other samples, including Huldugjá, Vellankatla and the lake output show significantly lower numbers. The colonization experiment shows low numbers in the groundwater fissures compared to that captured with the filters.
0
1.000
2.000
3.000
4.000
5.000
6.000
7.000
8.000
Sh
an
no
n -
We
ine
r a
ve
rag
e

77
Figure 3.26. Chao1 diversity index from groundwater fissures (Silfra, Flosagjá Huldugjá), colonization experiment (Silfra and Flosagjá), input and output.
3.4.5 Sequence data analysis with SILVAngs
SILVAngs data analysis service package was used as a complementary pipeline to QIIME. It creates hierarchical data that can be explored with pie charts and “fingerprint” figures. A sample from Lake Thingvallavatn at depth 10m retrieved in August 2013 (28.8.2013) was picked from the dataset to be presented as a pie chart using SILVAngs software (figure 3.27, top). Phylum level was chosen to give an overview of the microbial diversity found in the lake. The largest phylum identified was Proteobacteria that accounted for approximately 67% of the sample. Other notable phyla included OD1 (6%), Bacteroidetes (5%), Actinobacteria (3%), Chlamydiales (3%) and Planctomycetes (3%). 5% of the sample had no relatives. A closer look at the Proteobacteria (figure 3.27, bottom) that makes up almost 2/3 of the sample, revealed that Beta- (35%), Alpha- (32%), Gamma- (26%) and Deltaproteobacteria (6%) were the most dominant classes.
0
200.000
400.000
600.000
800.000
1.000.000
1.200.000
Ch
ao
1 a
ve
rag
e

78
Figure 3.27. SILVAngs pie chart. Microbial diversity at phylum level (top) with the largest phylum Proteobacteria (bottom) from Lake Thingvallavatn at 10m from August 2013.

79
Figure 3.28 shows order level of Alpha-, Beta-, Gamma- and Deltaproteobacteria found within Proteobacteria in the same sample as above. The most notable orders within Alphaproteobacteria include Sphingomonadales, Rhizobiales, Ricksettsiales, Rhodospirillales and Caulobacteriales. One genus, DB1-14 accounts for 6% of the total Alphaproteobacteria. Order level within Betaproteobacteria mostly consists of Burkholderiales but also include Niesseriaceae, Hot Creek 32 and Hydrogenophilaceae. Orders within Gammaproteobacteria include Legionellales, Pseudomonadales, Xanthomonadales and Aeromonadaeceae. Orders within Deltaproteobacteria include Myxococcales and Bdellovibrionales.
Figure 3.28. Alpha (top left), Beta- (top right), Gamma- (bottom left) and Deltaproteobacteria (bottom right) from Lake Thingvallavatn at 10m in August 2013.
80
SILVAangs Fingerprint
SILVAngs Fingerprint analysis is particularly useful for identifying how microbial diversity ranges within a dataset. Figure 3.29 shows microbial diversity at phylum level from 26 samples from all sampling locations. Phyla are given a sign (rectangle, dot or triangle) depending on their number of sequences and a size factor for sequence abundance estimate (OTUs). A color is used to indicate how common a phylum is within a sample. Sequencing of samples at all depths from Thingvallavatn in October 2013 and Silfra in September 2013 (S.10.09.2013) failed but are included in the picture but should be ignored. Samples from the lake (06.06.2013, 03.07.2013 and 28.8.2013) show highest connection to Proteobacteria followed by Cyanobacteria. However, chloroplast (e.g. Streptophyta) from eukaryotes has not been removed from the data, which might cause higher number of Cyanobacteria to appear on the chart than were found. Samples from June/July and August/September appear to show higher biodiversity than samples from May/June, corresponding to the diversity indices presented in chapter 3.4.4. The groundwater fissures of Lake Thingvallavatn (Flosagjá and Huldugjá) seem to show less abundance of phyla.

81
Figure 3.29. SYLVangs Fingerprint showing microbial diversity at phylum level of 26 samples retrieved from all sampling locations.


83
4 Discussion
4.1 Microbial diversity of Lake Thingvallavatn
ecosystem
Lake Thingvallavatn can be classified as a groundwater-dependent ecosystem, mostly relying on groundwater as its primary input. The water originates from glacier melt water and precipitation falling over its basin, located north of the lake. The basin stretches approximately 1300 km2, largely consisting of wilderness that reaches Langjökull and Thórisjökull glacier in the north. The open groundwater fissures located in Lake Thingvallavatn´s basin, one of the areas of interest in this study, can be seen as a transition zone (an ecotone) between the lake and the groundwater basin. Water flows southbound from the basin towards the lake and some of it surfaces in the open groundwater fissures, which were created by subsidence and other geological factors. The groundwater continues to flow through the fissures and finally arrives to the lake. However, most of the groundwater travels underground and enters the lake through lakebed springs (Freysteinn Sigurðsson & Guttormur Sigbjarnarson, 2011). Eydís Salome Eiríksdóttir and Sigurður Reynir Gíslason (2012), note how stable the conditions are in Lake Thingvallavatn´s groundwater due to the young porous lava shields in the lake´s basin. The groundwater is characterized by being highly stable in temperature, pH and dissolved minerals. The only exception is nitrogen that shows higher levels possible due to airborne pollution (Hilmar J. Malmquist et al., 2012) or perhaps from faecal contamination. Almannagjá and Hrafnagjá stream are two of the three main groundwater tributaries of Lake Thingvallavatn. These two main streams measure low in water temperature (2-4°C), which corresponds to the fact that glacier meltwater constitutes one third to half of the groundwater (Freysteinn Sigurðsson & Guttormur Sigbjarnarson, 2011). This suggests that the microbial communities in Lake Thingvallavatn are directly influenced by Langjökull and Thórisjökull glacier, located 40km away. Lake Thingvallavatn and its basin could be regarded as extreme environments for all life forms due to its temperature. After the groundwater arrives at the lake it is mixed with the approximately 3000 Gl of water that occupies Lake Thingvallavatn and finally exits the lake at Steingrímsstöð output about 330 days after in entered.
4.1.1 Unraveling the microbial diversity
Advanced technology based on ribosomal DNA-based methods was used to get a deep insight into Lake Thingvallavatn´s microbial diversity. Data in the study was derived from high throughput 454/Roche deep pyro-sequencing. Furthermore, a cell count analysis was performed with flow cytometry, viable cell count analysis and total count of faecal bacteria were performed. All this data was accompanied by measurements of chemical and physical characteristics provided by The Natural History Museum of Kópavogur.
84
Overall, Lake Thingvallavatn and its basin show a high diversity of bacteria at phylum level and sample data is not as homogenous as one might expect. Ratios of bacteria phyla fluctuates greatly between samples recovered from the same area at the same time. However, some trend can be observed between samples. Proteobacteria proofed to be the major phylum in almost all samples, often ranging between 25-90% of the total bacteria recovered. Other notable phyla included members of Bacteroidetes, Actinobacteria, Verrucomicrobia, Cyanobacteria, Firmicutes, Chloroflexi and Candidate divisions (OD1, OD3, TM6 and TM7) proved especially abundant among all sample. Sequencing Archaea from Lake Thingvallavatn ecosystem proofed very difficult. Perhaps because the primers used in the study were not specific enough to pick up Archaea. However, three unknown genus of Archaea, two Crenarcheaota and one Euryarcaeota were found in Silfra and Flosagjá. Bacteria primers used in the study also frequently picked up members of Crenarcheaota and Euryarcaeota in other samples, indicating that these two phyla of Archaea are ubiquitous in Lake Thingvallavatn ecosystem. No other phylum of Archaea was found.
Lake Thingvallavatn
Newton et al. (2011) have pointed out that there is growing body of evidence that many bacterial groups are freshwater specific and have a global distribution. The database constructed by Newton et al. (2011), reveals that out of 21 phyla that have been recovered from lake epilimnions, 5 phyla are most common among all. These phyla include Proteobacteria, Bacteroidetes, Actinobacteria, Cyanobacteria and Verrucomicrobia. The remaining 16 phyla’s only make up ~2.6% of the total sequences collected. The 5 most common phyla in question are in correlation with previously constructed phylogeny by Zwart et al. (2002) and in general by FISH-based studies (Newton et al., 2011). However, Lake Thingvallavatn does not seem to followed this global distribution proposed by Newton et al. (2011). Although these phyla are all present in the ecosystem, Proteobacteria is the only phyla that show dominance among all samples recovered. All other phyla are either present in similar abundances to many other notable phyla or are non-existing at all in the samples. The reasons behind this might be that Lake Thingvallavatn is a sub-artic lake ecosystem characterized by extreme conditions with especially low and stable water temperature that originates from the lake basin. Microbial diversity seems to differ somewhat between the lake and the groundwater fissures in the basin. One of the research questions of the study aimed at answering this question. The cell count analysis showed that there were greater amounts of microbes present in the lake (106) compared to the groundwater fissures (104) on average. The PCoA graph (chapter 3.4.3) shows that the fissures seem to deviate somewhat from the microbial diversity present in the lake. While samples from the lake at different depth intervals tend to group together, the fissures don’t show the same patterns. Furthermore, the SILVAngs Fingerprint diagram (chapter 3.4.4) seems to give the impression that the diversity is somewhat lower in the fissures with fewer phyla reported across. However, when looking at the comparison between diversity indices, it becomes evident that microbial diversity is in fact greater in the fissures that in the lake despite the observed differences in cell count. However, the SILVAngs graphs do accurately describe the dominance observed in levels of Proteobacteria in the lake. Levels of

85
Proteobacteria seem lower in the Silfra and Flosagjá (figure 3.16 and 3.18) if we exclude data from Flosagjá (sample 2) (figure 3.17), which might not represent the fissures accurately, perhaps because of sampling or sequencing errors. Chao1 diversity index that favors low abundance organisms shows the highest diversity index levels in Silfra and one of the highest levels for Flosagjá (sample 1) (figure 3.26). It is hard to explain why there seems to be higher biodiversity in the fissures than the lake. Perhaps the extreme environments of these fissures affect competition in a way that it allows heterotrophs or other bacteria that are well adapted to nutrient poor groundwater environments to thrive better. Overall, there is evidence that microbial diversity in the groundwater fissures differs to that found in the lake and that there seems to be higher biodiversity in the former. One of the focal points in the study was to determine if the microbial diversity in the lake changes with depth and whether there is a seasonal difference. Figures 3.10, 3.11 and 3.12 show the average microbial diversity from different depths at phylum level captured from the Lake Thingvallavatn´s main sampling station in June, July and August of 2013. Unfortunately, samples from October were lost as the sequencing failed. All retrieved samples from different depth intervals showed significantly high proportions of Proteobacteria. Bacteroidetes measured considerably higher in June than in July and August. Other notable phyla include Actinobacteria, Division Candidate OD1, Verrucomicrobia, Elusimicrobia, Cyanobacteria, Chlamydiae, Planctomycetes, Firmicutes and Chloroflexi. Figures 3.23 and 3.24 show diversity indices for Lake Thingvallavatn at different depth intervals and seasons. Biodiversity seems to peek in August when temperature is at its highest. July shows equivalent numbers to August at 5m, 10m and 35m but drops significantly at 1m and 25m depths. On the PCoA graph (figure 3.23), 1m and 25m depths in July show a large deviation from all other samples in July and August that cluster closely together. June shows the lowest biodiversity in comparison with July and August if data from 1m and 25m are excluded. Furthermore, July also showed significantly lower cell densities at the surface. These results are hard to explain and need further investigation. It is possible that weather conditions might have influenced the microbial diversity but it does not explain why the lake shows differences between depth intervals (1m and 25m) and why the PCoA graphs shows such a large deviation from other samples. Overall, there seems to be considerable deviations between sampling locations at different seasons in Lake Thingvallavatn. This suggests that in temperature, pH and conductivity cause shift in cell abundance and microbial diversity. Less variation was observed between different depth intervals in the lake. No stratification was observed in Lake Thingvallavatn during the sampling period. If this study was repeated when stratification took place in the lake, it is likely that more variations would be observed between depth intervals.
Groundwater fissures and Vellankatla lakebed spring
There is evidence that the lake and groundwater fissures have different microbial diversities and biodiversity seems to be greater in the fissures. There is also evidence that the groundwater fissures show differences in microbial diversity. Although Lake Thingvallavatn basin is characterized by having highly stable conditions, different groundwater tributaries flowing into the lake show a slight dissimilarity in temperature and dissolved minerals. Vellankatla lakebed spring, a

86
part of the Hrafnagjá stream has higher proportion of glacier water than Silfra, Flosagjá and Huldugjá that belong to the Almannagjá stream, and therefore measures lower in water temperature (Freysteinn Sigurðsson & Guttormur Sigbjarnarson, 2011). Furthermore, groundwater flowing through Silfra and Flosagjá emerges at the surface and therefore could not be classified completely as a groundwater system as is the case with Vellankatla lakebed spring and Huldugjá. The fissures in the Almannagjá stream also showed diverse attributes that could affect microbial diversity described earlier in this study. The most common phyla recovered from Silfra and Flosagjá included Proteobacteria, Cyanobacteria, Division Candidates (OD1, OD3), Actinobacteria and Verrucomicrobia. However, Flosagjá shows greater abundance of Cyanobacteria possibly because the fissure is richer in algae and more open to sunlight. In Huldugjá, the most common phyla include Proteobacteria, Cyanobacteria, Actinobacteria, Chloroflexi and Division Candidate TM7. In comparison with the other fissures, Huldugjá shows far less abundance of Division Candidates (OD1, OD3), Verrucomicrobia and Bacteroidetes. Vellankatla lakebed spring shows high levels of Proteobacteria followed by Verrucomicrobia, Actinobacteria, Bacteroidetes, Firmicutes and Tenericutes. Therefore we conclude that Silfra and Flosagjá show the highest resemblance and overall, the fissures do in fact show different microbial diversities. The PCoA graph (figure 3.22) confirms these results.
4.2 Management of Lake Thingvallavatn
ecosystem
Lake Thingvallavatn is subject to several acts and regulations that aim to protect and promote sensible conducts of the lake ecosystem. These include act 47/2004 on the Thingvellir National Park (reg. no. 848/2005) and act 85/2005 on the protection of Lake Thingvallavatn and catchment (reg. no. 650/2006) (Hilmar J. Malmquist et al., 2012). Furthermore, Thingvellir National Park has been included in the World Heritage List and has obtained international recognition as a conservation area, in result of it´s unique cultural landscape (Althing, 2005). Act 47/2004 on Thingvellir National Park (reg. no. 848/2005) states “Thingvellir shall be the protected sacred area for all Icelanders” and within the national park, all activity that alters the landscape or pollutes water or groundwater is strictly forbidden and subject to law. It also marks the park´s boundary that only includes the north side of the lake and a fraction of its basin. However, act 85/2005 on the protection of Lake Thingvallavatn includes all of the lake and basin and has the sole purpose of protecting the natural environment against anthropogenic influence such as groundwater contamination.
4.2.1 Anthropogenic activity and changes to Lake Thingvallavatn
ecosystem
Lake Thingvallavatn has undergone significant changes in the past 3-4 decades (Hilmar J. Malmquist et al., 2012). Temperature observations carried out by Landsvirkjun over a period of 41 years and later continued by the 2007 Monitoring programme (1962-1994, 2002-2011), strongly suggest that Lake Thingvallavatn´s water temperature is changing. The medium annual temperature of the lake has
87
risen over the observed period and temperature now measures higher for all months of the year except March and April. Furthermore, this change in temperature on an annual basis seems to follow changes in annual air temperatures in Iceland (Hilmar J. Malmquist et al., 2012). These observed changes to annual temperature are in line with the shifts in ice cover witnessed in the last 15 years. Ice cover is now forms less frequently and happens later with fewer days of lasting ice cover. In the winter of 2002/03 and 2005/06, no ice cover formed due to a warming of the climate in Iceland, which had not happened since the 1920´s (Einar Sveinbjörnsson, 2009; Hilmar J. Malmquist et al., 2012). Evidence in this study suggests that abundance and diversity of bacteria are highly affected by temperature in Lake Thingvallavatn. The Environmental agency of Iceland (Umhverfisstofnun) lists Lake Thingvallavatn status as “uncertain” in a newly published report on freshwater areas (Umhverfisstofnun, 2013). The report focused on defining all freshwater areas in Iceland and estimating anthropogenic threat towards them. According to the report, there is evidence of increased levels of phytoplankton in the lake and possibly increased levels of nitrogen. Furthermore, there is also uncertainty involving increased levels of dissolved minerals and temperature stress from affluent water originating at Nesjavellir power plant (Umhverfisstofnun, 2013)
Faecal pollution in Lake Thingvallavatn
Results of this study indicate that faecal pollution is present in Lake Thingvallavatn. 5 out of 15 locations along the lake shoreline came back positive for E. coli or Enterococcus spp or both (table 3.1 and 3.2), 4 locations are associated with cabins and farms but one with Thingvellir National Park. Both bacteria are indicators of faecal pollution from anthropogenic or zoogenic sources. Öfugsnáði in Thingvellir National Park came back positive for both E. coli and Enterococcus spp., raising questions whether sewage from tourism is polluting the lake. Other areas are likely affected by cabins and/or farms located in and around Lake Thingvallavatn. One sample collected in close proximity to a farm south of Nesjar shows high levels of both E. coli and Enterococcus spp. More than 600 cabins are located along Lake Thingvallavatn´s shorelines. Although few houses are located north of the lake in its basin, many cabins are placed in close proximity to the national park, to the west (Kárastaðir) and east (Gjábakki). According to regulation reg. no. 650/2006, sewage that is created in and around Lake Thingvallavatn, shall go through primary and secondary treatment. These are the strictest regulations for any area is Iceland due to the special status of Lake Thingvallavatn. As of today, no cabin around the lake fulfills the requirements of reg. no. 650/2006, when it comes to sewage treatment (Svavar Hávarðsson, 2014). This poses serious threat to the biodiversity of Lake Thingvallavatn ecosystems and could affect health standards for drinking water in the area. More scans for faecal pollution will be necessary to determine if faecal pollution is a permanent threat to Lake Thingvallavatn and where the majority of the pollution is coming. Furthermore, Norovirus scans would also be a good indicator of pollution and could prove useful.

88
Tourism and scuba diving in Thingvellir National Park
For the past decades, Thingvellir National Park has been a popular travel destination for Icelanders and foreign guests alike. Since 2000, the total number of tourists in Iceland has tripled, reaching 807.000 people in 2013. 72% of all visiting tourists in 2013 came to Thingvellir National Park. These numbers are expected to grow significantly in the coming years (The Icelandic Tourist Board, 2014). The high number of visitors could increase faecal pollution in Lake Thingvallavatn if proper infrastructure is not installed. In recent years, scuba diving and snorkeling in Silfra has become increasingly popular. The fissure is known for it´s crystal clear conditions and unique geologic formations. According to records given to the author of this study from Thingvellir National park authorities, 15.126 scuba divers and/or snorkelers visited Silfra from March of 2013 to March of 2014 (Kristján Á. E. Sæmundsson, 2014). This corresponds to more than 40 visits every day of the year. No hard evidence was found in the study that suggested that anthropogenic pressure was influencing microbial diversity in Silfra. However, Silfra was found to show the highest biodiversity of all sampling locations in this study. It is not known whether the high number of visitors at Silfra is a contributing factor to these results or whether it is having negative affect on the ecosystem. Further studies will be needed to conclude if anthropogenic pressure is affecting Silfra and/or other fissures in Lake Thingvallavatn´s basin. In addition, no legislations exist in Iceland that oversees the import of scuba diving equipment, while strict legislation applies to import of various fishing gear and sporting equipment for horses (Matvælastofnun, 2009). Used scuba equipment can be brought to Iceland from abroad and used in marine and freshwater ecosystems without being decontaminated first. This increases the risk of introducing new species to vulnerable ecosystems in Iceland. The author of this paper suggests that legislation on imported scuba equipment should be implemented in Iceland.
4.3 Limitations of the study and further research
This study is the first of it´s kind and involved with setting a baseline for the environmental microbial diversity of Lake Thingvallavatn´s ecosystem. At the beginning of the project it was clear that compromises would be necessary because the size of the project was simply to big for a 60 ECTS thesis. Sampling would have to be limited due to lack of funding and short timeframe but broad enough to capture the diversity found within the ecosystem and explain seasonal variations of the microbial communities. There were no prior studies that gave a reference to what microbes could be found in the ecosystem. High throughput 16s rRNA sequencing was chosen as the primary tool in determining environmental microbial diversity. Filters were used to capture microbes from the sampling locations and proved a good method in comparison with the colonization experiment. However, many samples were lost, especially due to difficulties in PCR amplification and sequencing. Samples from October 2013 retrieved from different depth intervals and a few others could not be used as the sequencing failed and produced no data. Other samples were simply misplaced and never to be seen again. Originally, this project was only supposed to focus on Lake Thingvallavatn

89
but was later merged with another study focused on identifying the microbial diversity of the fissures in Lake Thingvallavatn basin. In retrospect, this project can be seen as a prelude to a much bigger task of understanding the interrelating factors in the whole ecosystem. Time series based on annual measurements will be needed to shed light on how the microbial diversity fluctuates as different weather conditions affect the lake ecosystem.


91
5 Conclusions
The results of this study indicate that microbial diversity in Lake Thingvallavatn is not as homogenous as one might expect. Cell count and microbial diversity range significantly among sampling locations, showing differences among Lake Thingvallavatn and groundwater fissures in its basin. Furthermore, seasonal variation occurs in the lake but less variation was observed between different depth intervals. Diversity indices were used to estimate biodiversity at the sampling stations. Silfra shows the greatest diversity of all sampling stations in this study, followed by Flosagjá and Lake Thingvallavatn. Proteobacteria represents the most dominant bacteria phylum in Lake Thingvallavatn ecosystem. Newton et al. (2011) have pointed out that there is growing body of evidence that many bacterial groups are freshwater specific and have a global distribution. However, Lake Thingvallavatn does not seem to follow this global distribution, as Proteobacteria is the only phyla that show dominance among all samples recovered. All other phyla are either present in similar abundances to many other notable phyla or are non-existing at all in the samples. The reasons behind this might be that Lake Thingvallavatn is a sub-artic lake ecosystem characterized by extreme conditions with especially low and stable water temperature that originates from the lake basin. The cell count analysis showed that there were greater amounts of microbes present in the lake (106) compared to the groundwater fissures (104) on average. Sequencing Archaea from Lake Thingvallavatn ecosystem proofed very difficult. However, members of Crenarcheaota and Euryarcaeota were found. Bacteria primers used in the study frequently picked up members of Crenarcheaota and Euryarcaeota in the lake ecosystem, indicating that these two phyla of Archaea are ubiquitous in Lake Thingvallavatn ecosystem. Results of this study indicate that faecal pollution is present in Lake Thingvallavatn. 5 out of 15 locations along the lake shoreline came back positive for E. coli or Enterococcus spp. or both (table 3.1 and 3.2), 4 locations are associated with cabins and farms but one with Thingvellir National Park. In recent years, scuba diving and snorkeling in Silfra has become increasingly popular. 15.126 scuba divers and/or snorkelers visited Silfra from March of 2013 to March of 2014. No legislations exist in Iceland that oversees the import of scuba diving equipment, which increases the risk of introducing microbes to vulnerable ecosystems in Iceland. The author of this paper suggests that legislation on imported scuba equipment should be implemented in Iceland.

93
References
Althing. (2005). Regulation on the Thingvellir National Park, its protection and
management. Reykjavík.
Altschul, S. F., Gish, W., Miller, W., Meyers, E. W., & Lipman, D. J. (1990). Basic Local
Alignment Search Tool. Journal of Molecular Biology, 215(3), 403-410.
Árni Snorrason. (2011). Groundwater inflow. In P. M. Jónasson & P. Hersteinsson (Eds.),
Thingvallavatn: A unique world evolving. Reykjavík: Opna.
Bjarni K. Kristjánsson, & Jörundur Svavarsson. (2011). Amphipods: Thingvallavatn´s
elusive cave dweller. In P. M. Jónasson & P. Hersteinsson (Eds.), Thingvallavatn:
A unique world evolving. Reykjavík: Opna.
Björn Th. Björnsson. (1994). Þingvellir. Reykjavík: Mál og Menning.
Boulton, A. J., Fenwick, G. D., Hancock, P. J., & Harvey, M. S. (2008). Biodiversity,
functional roles and ecosystem services of groundwater invertebrates. Invertebrate
Systematics, 22. doi: 10.1071/IS07024
Caporaso, J., Kuczynski, J., Stombaugh, J., Bittinger, K., Bushman, F., Costello, E., . . .
Knight, R. (2010). QIIME allows analysis of high-throughput community
sequencing data. Nature methods, 7(5), 335-336. doi: 10.1038/NMETH.F.303
Daily, G. C. (1997). Nature´s Services: Societal Dependance on Natural Ecosystems.
Washington: Island Press.
Danielopol, D. L., Griebler, C., Gunatilaka, A., & Notenboom, J. (2003). Present state and
future prospects for groundwater ecosystems. Environmental Conservation, 30. doi:
10.1017/S0376892903000109
Deharveng, L., Stoch, F., Gibert, J., Bedos, A., Galassi, D., Zagmajster, M., . . .
Marmonier, P. (2009). Groundwater biodiversity in Europe. Freshwater Biology,
54. doi: 10.1111/j.1365-2427.2008.01972.x
Dudgeon, D., Arthington, A., Gessner, M., Kawabata, Z.-I., Knowler, D., Lévêque, C., . . .
Sullivan, C. (2006). Freshwater biodiversity: importance, threats, status and
conservation challenges. Biological reviews of the Cambridge Philosophical
Society, 81(2), 163-182. doi: 10.1017/S1464793105006950
Ehrlich, H. L. (1996). Geomicrobiology (3 ed.). New York: Marcel Dekker, Inc.
Einar Sveinbjörnsson. (2009). Vetrarís á Þingvallavatni - gagnlegur veðurfarsmælir.
Nattúrufræðingurinn, 78(1-2), 66-76.
Eydís Salome Eiríksdóttir, & Sigurður Reynir Gíslason. (2012). Efnasamsetning
Þingvallavatns 2007-2011: University of Iceland.
Freysteinn Sigurðsson, & Guttormur Sigbjarnarson. (2011). Catchment area: Groundwater
inflow. In P. Hersteinsson & P. M. Jónasson (Eds.), Thingvallavatn: A unique
world evolving. Reykjavik: Opna.
Ghiorse, W. (1997). Subterranean life. Science, 275(5301), 789-790.
Gibert, J., & Culver, D. C. (2009). Assessing and conserving groundwater biodiversity: an
introduction. Freshwater Biology, 54. doi: 10.1111/j.1365-2427.2009.02202.x
Gold, T. (1992). The deep, hot biosphere. Proceedings of the National Academy of
Sciences of the United States of America, 89(13), 6045-6049.
Griebler, C., & Lueders, T. (2009). Microbial biodiversity in groundwater ecosystems.
Freshwater Biology, 54. doi: 10.1111/j.1365-2427.2008.02013.x

94
Hákon Aðalsteinsson, Pétur M. Jónasson, & Sigurjón Rist. (1992). Physical characteristics
of Thingvallavatn, Iceland. In P. M. Jónasson (Ed.), Thingvallavatn (pp. 121-135).
Copenhagen: Oikos.
Hernan, J. S., Culver, D. C., & Salzman, J. (2001). Groundwater Ecosystems and the
Service of Water Purification. Stanford Environmental Law Journal, 20(479), 479-
495.
Hilmar J. Malmquist. (1998). Ár og vötn á Íslandi: Vistfræði og votlendistengsl. In J. S.
Ólafsson (Ed.), Íslensk Votlendi: Vernd og Nýting. Reykjavik: Háskólaútgáfan.
Hilmar J. Malmquist, Finnur Ingimarsson, Haraldur R. Yngvason, Stefán M. Stefánsson, &
Þóra Hrafnsdóttir. (2012). Vöktun á lífríki og vatnsgæðum Þingvallavatns:Yfirlit
yfir fyrstu fimm vöktunarárin 2007-2011 og samanburður við eldri gögn.
Kópavogur: Náttúrufræðistofa Kópavogs.
Hughes, J., Hellmann, J., Ricketts, T., & Bohannan, B. (2001). Counting the uncountable:
statistical approaches to estimating microbial diversity. Applied and environmental
microbiology, 67(10), 4399-4406. doi: 10.1128/AEM.67.10.4399-4406.2001
Já.is. (2014). Kort af Þingvallavatni. Retrieved 19.05.2014
Jón S. Ólafsson. (1992). Chemical characteristics and trace elements of Thingvallavatn. In
P. M. Jónasson (Ed.), Thingvallavatn (pp. 151-161). Copenhagen: Oikos.
Jónína H. Ólafsdóttir, Jóhann G. Þorbjörnsson, & Kjartan Guðmundsson. (2013).
Submersed fissures of Iceland: Exploration and mapping: Nýsköpunarsjóður
Námsmanna.
Karst-Riddoch, T. L., Hilmar J. Malmquist, & Smol, J. P. (2009). Relationships between
freshwater sedimentary diatoms and environmental variables in Subarctic Icelandic
lakes. Fundamental and Applied Limnology / Archiv für Hydrobiologie, 175. doi:
10.1127/1863-9135/2009/0175-0001
Kjartan Guðmundsson. (2012). Soil and Groundwater Contamination in Iceland: A
Comparetive Overview of the Legal Framework in the Nordic Countries.
University of Iceland.
Kjartan Guðmundsson. (2013). Flosagjá (Vol. 2.8 mb).
Kløve, B., Ala-aho, P., Bertrand, G., Boukalova, Z., Ertürk, A., Goldscheider, N., . . . A,
W. (2011). Groundwater dependent ecosystems. Part I: Hydroecological status and
trends. Environmental Science & Policy, 14. doi: 10.1016/j.envsci.2011.04.002
Kløve, B., Ala-Aho, P., Bertrand, G., Gurdak, J., J., Kupfersberger, H., Kværner, J., . . .
Pulido-Velazquez, M. (2013). Climate change impacts on groundwater and
dependent ecosystems. Journal of Hydrology(0).
Kornobis, E., Snæbjörn Pálsson, Sidorov, D., Holsinger, J., & Bjarni K. Kristjánsson.
(2011). Molecular taxonomy and phylogenetic affinities of two groundwater
amphipods, Crangonyx islandicus and Crymostygius thingvallensis, endemic to
Iceland. Molecular phylogenetics and evolution, 58(3), 527-539. doi:
10.1016/j.ympev.2010.12.010
Kristján Á. E. Sæmundsson (2014). [Tölur um fjölda kafara og snorklara í SIlfru 2013-
2014].
Kristján Sæmundsson. (1992). Geology of Thingvallavatn area. In P. M. Jónasson (Ed.),
Thingvallavatn. Copenhagen: Oikos.
Kristján Sæmundsson. (2011). Thingvallavatn catchment - geology. In P. M. Jónasson & P.
Hersteinsson (Eds.), Thingvallavatn: A unique world evolving (pp. 48-70).
Reykjavík: Vaka.
Matvælastofnun. (2009). Ferðamenn. http://www.mast.is/dyraheilbrigdi /smitvarnir/ferdamenn/. Retrieved 15.05., 2014

95
Murray, A., Preston, C., Massana, R., Taylor, L., Blakis, A., Wu, K., & DeLong, E. (1998).
Seasonal and spatial variability of bacterial and archaeal assemblages in the coastal
waters near Anvers Island, Antarctica. Applied and environmental microbiology,
64(7), 2585-2595.
Newton, R. J., Jones, S. E., Eiler, A., McMahon, K. D., & Bertilsson, S. (2011). A Guide
to the Natural History of Freshwater Lake Bacteria. Microbiology and Molecular
Biology Reviews, 75. doi: 10.1128/MMBR.00028-10
Olsen, G. J., Lane, D. J., Giovannoni, S. J., & Pace, N. R. (1986). Microbial ecology and
evolution: A RIBOSOMAL RNA APPROACH. Annual Reviews of Microbiology,
40, 337-365.
Pace, N. R. (1997). A Molecular View of Microbial Diversity and the Biosphere. Science,
276. doi: 10.1126/science.276.5313.734
Pétur M. Jónasson. (1992). Thingvallavatn research history. In P. M. Jónasson (Ed.),
Thingvallavtn. Copenhagen: Oikos.
Pétur M. Jónasson, & Páll Hersteinsson (Eds.). (2011). Thingvallavatn: A unique world
evolving. Reykjavík: Opna.
Quast, C., Pruesse, E., Yilmaz, P., Gerken, J., Schweer, T., Yarza, P., . . . Glockner, F. O.
(2013). The SILVA ribosomal RNA gene database project: improved data
processing and web-based tools. Nucleic Acids Res, 41(Database issue), D590-596.
doi: 10.1093/nar/gks1219
Schmidt, S. I., & Hahn, H. J. (2012). What is groundwater and what does this mean to
fauna? – An opinion. Limnologica - Ecology and Management of Inland Waters,
42. doi: 10.1016/j.limno.2011.08.002
Shannon, C. E., & Weaver, W. (1963). The Mathematical Theory of Communication.
Illinois, USA: University of Illinois Press.
Sigurður R. Gíslason, & Stefán Arnórsson. (1988). Efnafræði árvatns á íslandi og hraði
efnarofs. Nattúrufræðingurinn, 58(4), 183-197.
Sigurður S. Snorrason, Hilmar J. Malmquist, & Skúli Skúlason. (2011). Life in the lake:
The artic charr. In P. Hersteinsson & P. M. Jónasson (Eds.), Thingvallavatn: A
unique world evolving. Reykjavik: Opna.
Singleton, P. (1997). Bacteria in Biology, Biotechnology and Medicine (4 ed.). England:
Wiley.
Sogin, M., Morrison, H., Huber, J., Mark Welch, D., Huse, S., Neal, P., . . . Herndl, G.
(2006). Microbial diversity in the deep sea and the underexplored "rare biosphere".
Proceedings of the National Academy of Sciences of the United States of America,
103(32), 12115-12120. doi: 10.1073/pnas.0605127103
Somerville, C., Knight, I., Straube, W., & Colwell, R. (1989). Simple, rapid method for
direct isolation of nucleic acids from aquatic environments. Applied and
environmental microbiology, 55(3), 548-554.
Svavar Hávarðsson. (2014, 16.05.2014). Fráveitu allra sumarhúsa við Þingvallavatn
ábótavant. Visir.is.
The Icelandic Tourist Board. (2014). Ferðaþjónusta á Íslandi í tölum - Apríl 2014.
Tortora, G., Funke, B., & Case, C. (2007). Microbiology: an introduction.
Umhverfisstofnun. (2013). Stöðuskýrsla fyrir vatnasvæði Íslands: Skipting vatns í
vatnshlot og mat á helsta álagi af starfsemi manna á vatn. In J. B. Weisshappel
(Ed.): Umhverfisstofnun.
vanLoon, G. W., & Duffy, S. J. (2011). Environmental Chemistry (3 ed.): Oxford
University Press.

96
Vitousek, P. M., Mooney, H. A., Lubchenco, J., & Melillo, J. M. (1997). Human
domination of Earth's ecosystems. Science, 277(5325), 494-499.
Wada, Y., van Beek, L., P, H. , van Kempen, C., M., Reckman, J., W, T, M., Vasak, S., &
Bierkens, M., F, P. . (2010). Global depletion of groundwater resources.
Geophysical Research Letters, 37. doi: 10.1029/2010GL044571
Ward, J. V., Bretschko, G., Brunke, M., Danielopol, D., Gibert, J., Gonser, T., & Hildrew,
A. G. (1998). The boundaries of river systems: the metazoan perspective.
Freshwater Biology, 40. doi: 10.1046/j.1365-2427.1998.00368.x
Whitman, W., Coleman, D., & Wiebe, W. (1998). Prokaryotes: the unseen majority.
Proceedings of the National Academy of Sciences of the United States of America,
95(12), 6578-6583. doi: 10.1073/pnas.95.12.6578
Zwart, G., Crump, B. C., Kamst-van Agterveld, M. P., Hagen, F., & Han, S.-K. (2002).
Typical freshwater bacteria: an analysis of available 16S rRNA gene sequences
from plankton of lakes and rivers. Aquatic microbial ecology, 28(2), 141-155.

97
Appendix A
Faecal sampling locations along Lake Thingvallavatn shoreline (GPS coordinates)
Location N W
1 64°11.259 21°13.597
2 64°11.126 21°13.820
3 64°10.236 21°14.024
4 64°09.327 21°14.228
5 64°09.403 21°13.412
6 64°07.451 21°09.878
7 64°08.276 21°01.448
8 64°09.236 21°02.857
9 64°11.199 21°05.223
10 64°14.172 21°02.687
11 64°14.658 21°04.147
12 64°15.379 21°06.890
13 64°15.334 21°07.421
14 64°14.016 21°09.391
15 64°13.985 21°09.445