Environmental Management Experiment...
20
Environmental Management Experiment 14 Membrane methods in wastewater treatment Theoretical material Opracowała: dr Elżbieta Megiel
Transcript of Environmental Management Experiment...

Environmental Management
Experiment 14
Membrane methods in wastewater
treatment
Theoretical material
Opracowała: dr Elżbieta Megiel

1. Classification of membrane methods.
There are many ways of division of membrane methods but the most often used is
based on the membrane structure thus on the basis of driving force of this
process.(Table 1) Microfiltration (MF), ultrafiltration (UF), nanofiltration (NF) and
reverse osmosis (RO) are classified as pressure driven processes are commonly used in
liquid mixtures separation. (Table 2)
The separation of components in membrane techniques is based on selectivity of
the membrane. The solution/mixture called as Feed is passed over the surface of
specific semipermeable membrane at a pressure which called transmembrane pressure
TMP. The permeating liquid is collected as the product usually it is purified water and
concentrated feed is obtained which is called Retentate. (Figure 1)
Figure 1. Flow diagram for membrane techniques.
Table 1
Driving forces in membrane methods
Pressure difference
P
Concentration
difference C
Temperature
difference T
Electric potential
difference E
Microfiltration
(MF)
Pervaporation (PV) Thermo-osmosis
(TO)
Electrodialysis
(ED)
Ultrafiltration (UF)
Gas separation
(GS)
Membrane
distillation (MD)
Electro-osmosis
(EO)
Nanofiltration (NF)
Dialysis (D) Membrane
electrolysis (ME)
Reverse osmosis
(RO)
Diffusion Dialysis
(DD)
Feed RETENTATE
PERMEATE

The applied transmembrane pressure (TMP) depends on the kind of technique from
0.05-0.5 MPa in the microfiltration to 1-10 MPa in the reverse osmosis. (see Table 2).
Membrane methods are environmentally friendly however yield of these methods is
relatively low which was illustrated on Figure 1 in the form of a thin arrow for
permeate flow. Table 2 shows what kind of materials can be removed from water with
using pressure driven membrane methods. Bacteria and large viruses can be removed
with using microfiltration, colloids, proteins with using ultrafiltration, organics
compounds and divalent ions with using nanofiltration and completely desalination of
water is possible with using reverse osmosis.
Table 2
Pressure driven membrane processes.
Technique Pore size in
membrane [m]
TMP [MPa] Types of materials
removed
MF 1 – 0.01 0.05 – 0.5 Bacteria, yeasts
clay, large viruses,
suspended solids
UF 0.01 – 0.001 0.1 - 0.7 Proteins, viruses,
fats, sillica, colloids
NF 10-3
– 10-4
(1 nm) 0.3 – 2.4 Pesticides, sugars,
herbicides,
multivalent ions
RO < 10-4
1.5 – 7.0 Monovalent ions
2. Membrane classification.
The membrane is usually defined as selective barrier which separates two phases with
different concentration of components. There are different methods of classifying of
membranes based on their origin, morphology, structure, electric charge.
a) Origin (Figure 2)
Biological membrane made up of bilayers of phospholipids and synthetic: organic
(made up of polymers) and inorganic (made up of ceramic, carbon, glass or stainless
steel).

Figure 2. Types of membrane on the basis of their sources.
Polymers which are the most commonly used for obtaining of membranes are following:
cellulose acetate, polysulfone, polyethersulfone, polyethylene, polyamides. Polymeric
membranes are relatively cheap and easy for preparation, however are not well resistant for
temperature and their physical properties worsening in relatively short time (aging of
polymers phenomena). The inorganic membranes are resistant for high temperature, stable but
usually characterized by brittleness, additionally capital cost for the systems with inorganic
membrane is higher in comparison with system with polymeric membrane.
b) Morphology (Figure 3)
Homogeneous membrane The separation of components is related to their transport
rates within phase of membrane. The components differ in relative diffusion rates and
solubility in membrane. Homogeneous membranes are used in reverse osmosis and
nanofiltration.
Porous membrane retains particles larger than pore size. This type of membrane is
used in microfiltration, ultrafiltration and dialysis.

Figure 3. The models of membranes.
c) Structure
Symmetric membrane are rarely used. Typically asymmetric membranes are
used on industrial scale. This type of membrane consists of two of layers, each
with different structures and permeabilities has a relatively dense, extremely
thin surface layer (i.e. the "skin", also called the permselective layer) supported
on an open, much thicker porous substructure. (Figure 4)
Figure 4. Cross-sectional microscopic picture (SEM) of asymmetric
membrane.
Homogeneous membrane Porous membrane
Selective
layer
Support

d) Charge
The synthetic membranes can be neutral or charged. An ion-exchange membranes
have electric charge which is positive or negative. The function of ion-exchange
membranes is determined from the species of the charge of the ion-exchange groups
fixed in the membranes and their distribution:
1. Cation exchange membranes, in which cation exchange groups (negatively
charged) exist and cations selectively permeate through the membranes.
2. Anion exchange membranes, in which anion exchange groups (positively
charged) exist and anions selectively permeate through the membranes.
3. Amphoteric ion exchange membranes, in which both cation and anion exchange
groups exist at random throughout the membranes.
4. Bipolar ion-exchange membranes which have a cation exchange membrane
layer and anion exchange membrane layer (bilayer membranes).
5. Mosaic ion exchange membranes, in which domains having cation exchange
groups exist over cross-sections of the membranes and domains of anion exchange
groups also exist. An insulator may exist around the respective domains.
Typical cation-exchange group are following SO3H, COOH, AsO3H and typical anion-
exchange group are NR3+, NR2H
+, NH3
+. However, sulfonic acid and carboxylic acid
groups are mainly used as cation exchange groups, and quaternary ammonium groups
such as benzyl trimethylammonium groups and N-methyl pyridinium groups are
mainly used as anion exchange groups in practical ion-exchange membranes.
Degree of the ions retain by ion-exchange membranes:
3. Membrane formation methods.
• For ceramic membranes a post-synthetic coking treatment method can be used in
which first impregnating is performed for example with 1,3,5-triisopropylobenzene,
next calcining in temperature above melting point usually > 5000C and after this rapid
cooling causes crystallites appear with microscopic pores (with size > 1 m in
diameter).

• ·For polymeric membranes mechanical stretch method can be used. Polymer foil is
mechanical stretched in perpendicular directions and pores with size > 0.02 m in
diameter are obtained.
• Radiation with alpha particles (0.03m pores with size 12 m)
• Phase inversion Loeb – Sourirajan method) - the most often used. Phase inversion (
refers to a process during which a homogeneous, polymer solution is converted into
two phases, i.e. a solid polymer rich phase forming the rigid membrane structure and a
polymer lean phase representing the liquid filled pores. Phase inversion can be
induced by changing the thermodynamic properties of the system, e.g. by changing
temperature or composition. Phase separation mechanisms can generally be
subdivided in three main categories depending on the parameters that induce
demixing. By changing the temperature at the interface of the polymer solution
(temperature induced phase separation or TIPS), by reaction which causes phase
separation (reaction induced phase separation) (RIPS) and by diffusion induced phase
separation (DIPS) with using addition of non-solvent to homogenous solution of
polymer.
• Solution coated composite membranes preparation method based on coating of
microporous membrane (support) thin layer of dense non-porous membrane made
from other polymer (composite membranes) by immersion of the porous membrane in
solution of polymer and next evaporation of solvent.
Depending on the chosen method of membrane formation shape, size and distribution of pores
can differ very significantly. (Figure 5)
Figure 5. Cross-sectional picture of membranes formed with using methods a) phase
inversion, b) mechanical stretch, c) radiation with alpha particles.

4. Selected parameters characterizing membrane process
• a) flux of permeate (yield)
JV [m3 s
-1m
2], JN [mol s
-1m
2]
Flux of permeate is volume determined in cubic meters of solution or number of moles
of major component which can permeate across the membrane per seconds per square
meter of membrane surface
b) effectivity of separation
Retention factor:
R = (CF – Cp) / CF
Where: CF –concentration of feed, Cp – concentration of permeate
c) Molecular weight cut off (MWCO) the lowest molecular weight of solute (usually
given in Daltons) which is in 90% retained by the membrane or the molecular weight
of the molecule that is 90% retained by the membrane determined with using
polyglycols as standards.
5. Membrane modules.
Membrane module this is device in which the membrane is installed. Membrane
modules must meet such requirements as their production costs, their packing density,
energy consumption, and especially the control of concentration polarization and
membrane fouling. A large number of different module types are described in the
literature. But, on a large industrial scale mainly six basic types are used today. (Table
3)
a) The cartridge membrane module (Figure 6)
The feed solution enters the filter from the housing side and the product is collected in
a center tube which is sealed against the housing by an O-ring.

Figure 6. Scheme of cartridge filter unit
b) The plate-and-frame membrane module (Figure 7)
The design of this type of module is similar to the conventional filter press. The membranes,
porous membrane support plates, and spacers forming the feed flow channel are clamped
together and stacked between two endplates and placed in a housing.
Figure 7. Scheme of a plate-and-frame membrane module

The feed solution is pressurized in the housing and forced across the surface of the
membrane. The permeate is leaving the module through the permeate channel to a permeate
collection manifold which in circular devices is central tube.
c) The spiral-wound module. (Figure 8)
The feed flow channel spacer, the membrane, and the porous membrane support form
an envelope which is rolled around a perforated central collection tube and inserted
into an outer tubular pressure shell. The feed solution passes in axial direction through
the feed channel across the membrane surface. The filtrate is moves along the
permeate channel and is collected in a perforated tube in the center of the roll.
Figure 8. Scheme of a spiral-wound membrane module
The spiral-wound module provides a relatively large membrane area per unit volume.
The major application of the spiral-wound module is in reverse osmosis sea and
brackish water desalination. But it is also extensively used in ultrafiltration and gas
separation.
d) The tubular membrane module. (Figure 9)
The tubular membrane module consists of membrane tubes placed into plastic pipes. The
pressurized feed solution flows down the tube bore and the permeate is collected on the outer
side of the porous support pipe.

Figure 9. Scheme of the tubular membrane module.
The main advantage of the tubular module is that concentration polarization effects and
membrane fouling can be easily controlled. The disadvantage of the tubular module design is
the low surface area, that can be installed in a given unit volume, and the very high costs.
Therefore, tubular membrane modules are generally only applied in applications where feed
solutions with high solid content, and high viscosity have to be treated and other module
concepts fail due to membrane fouling.
e) The capillary membrane module. (Figure 10)
This module consists of a large number of membrane capillaries with an inner diameter of 0.2
to 3 mm arranged in parallel as a bundle in a shell tube. The feed solution is passed down the
center of the membrane capillary and the filtrate, which permeates the capillary wall, is
collected in the shell tube.

Figure 10. . Scheme of a capillary membrane module.
The capillary membrane module provides a high membrane area per module volume.
The production costs are relatively low and concentration polarization and membrane
fouling can be effectively controlled. The main disadvantage of the capillary
membrane module is the required low operating pressure.
f) The hollow fiber membrane module. (Figure 11)
In hollow fiber membranes, the selective layer is on the outside of the fibers, which are
installed as a bundle of several thousand fibers in a half loop with the free ends. The
filtrate passes through the fiber walls and flows up the bore to the open end of the
fibers.
Figure 11. Scheme of a hollow fiber module.

The hollow fiber membrane module has the highest packing density of all module
types. Unfortunately its production is rather cost effective and control of concentration
polarization and membrane fouling is difficult. The modules do not tolerate any
particles, macromolecules or other materials that may easily precipitated at the
membrane surface.
Table 3
Commercially available membrane modules, there costs and major applications.
Membrane
module
Membrane area
per unit volume
(m2
m-3
)
Membrane
costs
Control of
concentration
polarization
Application
Filter cartridge
module
800 -1000 low Very poor Dead-end MF
Plate-and-frame
module
400 - 800 medium good MF, UF, RO,
D,
ED
Spiral-wound
module
800 - 1200 low good UF, RO, GS
Tubular module
20 - 100 very high very good MF, UF, RO
Capillary
module
600 - 1200 low very good UF, MF, D,
SLM
Hollow fiber
module
2000 - 5000 very low very poor RO, GS
6. Types of continuous flows used in membrane modules. (Figure 12)
a) co-current flow: flow pattern through a membrane module in which the fluids on
the upstream and the downstream sides of the membrane move parallel to the
membrane surface and in the same directions
b) completely-mixed (perfectly-mixed) flow flow through a membrane module in
which fluids on both the upstream and downstream sides of the membrane are
individually well-mixed

c) counter-current flow: flow through a membrane module in which the fluids on the
upstream and downstream sides of the membrane move parallel to the membrane
surface but in opposite directions
d) dead-end flow: flow through a membrane module in which the only outlet for
upstream fluid is through the membrane
e) cross flow: flow through a membrane module in which the fluid on the upstream side
of the membrane moves parallel to the membrane surface and the fluid on the
downstream side of the membrane moves away from the membrane in the direction
normal to the membrane surface
Figure 12. Types of continuous flows in membrane modules.
7. Transport equation in membrane processes.
a) The Hagen-Poiseuille equation can be applied to demonstrate the flow of permeate
through the membranes. The use of this equation depends on the shapes and sizes
of the pores.
For cylindrical pores:
x
PrJ
8
2
(1)
Where:
J – the solvent flux
P – pressure difference (TMP)
x – thickness of membrane
- tortuosity
- viscosity
r – the pore radius
-surface porosity
According to this equation flux is proportional to TMP and inversely proportional to
the thickness.
This transport equation very well describes pressure driven techniques.
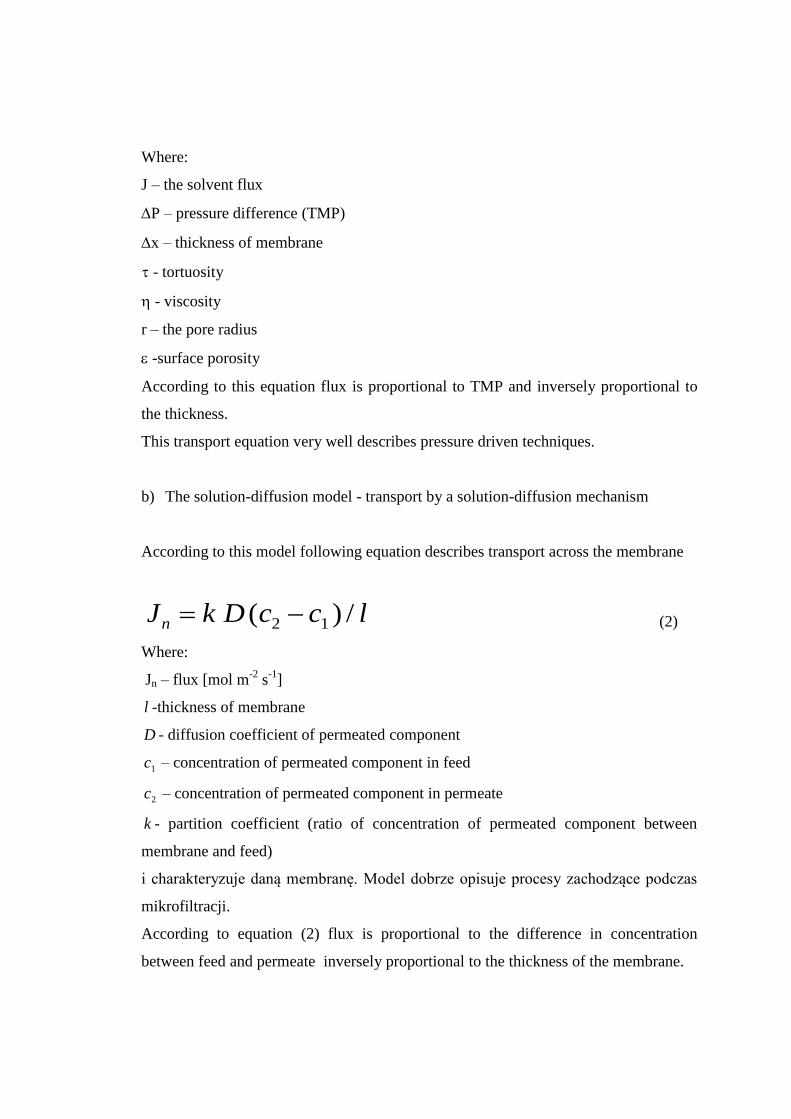
b) The solution-diffusion model - transport by a solution-diffusion mechanism
According to this model following equation describes transport across the membrane
J k D c c ln ( ) /2 1 (2)
Where:
Jn – flux [mol m-2
s-1
]
l -thickness of membrane
D - diffusion coefficient of permeated component
c1 – concentration of permeated component in feed
c2 – concentration of permeated component in permeate
k - partition coefficient (ratio of concentration of permeated component between
membrane and feed)
i charakteryzuje daną membranę. Model dobrze opisuje procesy zachodzące podczas
mikrofiltracji.
According to equation (2) flux is proportional to the difference in concentration
between feed and permeate inversely proportional to the thickness of the membrane.
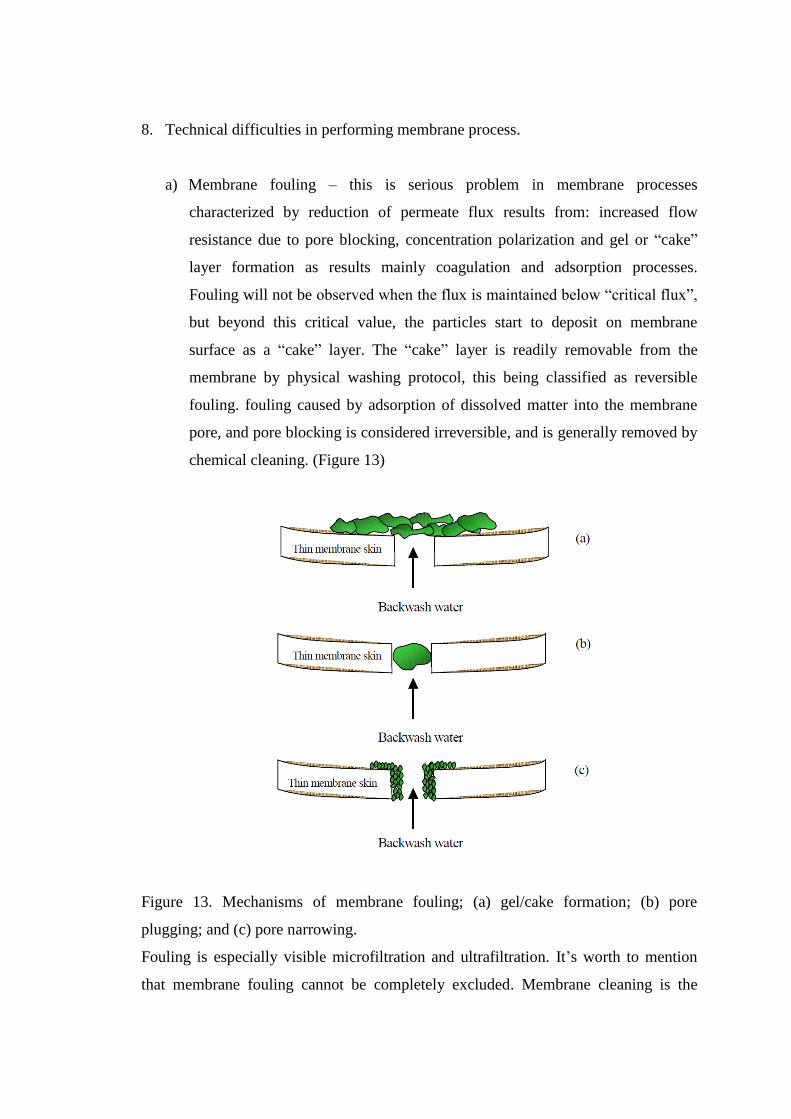
8. Technical difficulties in performing membrane process.
a) Membrane fouling – this is serious problem in membrane processes
characterized by reduction of permeate flux results from: increased flow
resistance due to pore blocking, concentration polarization and gel or “cake”
layer formation as results mainly coagulation and adsorption processes.
Fouling will not be observed when the flux is maintained below “critical flux”,
but beyond this critical value, the particles start to deposit on membrane
surface as a “cake” layer. The “cake” layer is readily removable from the
membrane by physical washing protocol, this being classified as reversible
fouling. fouling caused by adsorption of dissolved matter into the membrane
pore, and pore blocking is considered irreversible, and is generally removed by
chemical cleaning. (Figure 13)
Figure 13. Mechanisms of membrane fouling; (a) gel/cake formation; (b) pore
plugging; and (c) pore narrowing.
Fouling is especially visible microfiltration and ultrafiltration. It’s worth to mention
that membrane fouling cannot be completely excluded. Membrane cleaning is the

major method of fouling reduction. The type of cleaning depends on the type of
fouling and type of the membranes.
b) Concentration polarisation – formation of the layer of solution immediately
adjacent to the membrane surface becomes depleted in the permeating solute
on the feed side of the membrane and enriched in this component on the
permeate side, which reduces the permeating components concentration
difference across the membrane, thereby lowering the flux and the membrane
selectivity. The application of cross-flow continuous flows in membrane
modules allows reduce this phenomenon but it is not possible to exclude this
phenomenon completely.
c) Deformation of pores under influence of pressure in pressure driven
techniques.
9. The selected application of membrane processes in environmental protection.
a) Microfiltration (MF) and Ultrafiltration (UF) in removal of pathogens instead
of water chlorination
• Membranes for MF have pores 1.0-0.01m, for UF 0.01-0.001 m
• The pressure TMP for MF < 3 bars, UF < 10 bars
b) Nanofiltration can be used in water softening process instead classical lime-
soda method. Table 4 shows comparison of two methods in water softening.
c) Removing of toxic or unwanted divalent ions (ions with 2 or more charges),
such as lead, iron, nickel, mercury (II) from water
Cut-off 500 Da TMP = 5 -30 bar

Table 4
The effectiveness of Nanofiltration in softening of water - comparison with lime– soda
method.
d) Reverse osmosis in desalination of water and ultrapure water preparation
instead evaporation methods.
Figure 14 illustrates differences between osmosis and reverse osmosis.
Figure 14. The mechanism of osmosis and reverse osmosis.

e) Series of membrane filtration in water treatment processes. (Figure 15)
Figure. 15. Series of membrane methods in water treatment processes.
f) Microfiltration, Ultrafiltration, Dialysis in wastewater treatment. (Figure 16)
Figure 16. Membrane bioreator with membrane module for Microfiltration in
installation for wastewater treatment with active sludge.
MF

Opracowano w oparciu o następujące pozycje literaturowe:
1. A. Selecki, R. Gawroński; Podstawy projektowania wybranych procesów
rozdzielania mieszanin, WNT, 1998
2 R. Rautenbach; Procesy membranowe; WNT , 1996
3. Praca zbiorowa pr. A. Narębskiej; Membrany i membranowe techniki
rozdziału; Tempus Projekt JEN-04720PL, 1997
4. M. Bodzek, J. Bohdziewicz, K. Konieczny; Techniki membranowe w ochronie
środowiska,; Wyd. Politechniki Śląskiej, Gliwice 1997.