Environmental Initiatives - Sharp · PDF fileEnvironmental Initiatives > ... and the Sharp...
27
SHARP SUSTAINABILITY REPORT 2017 29 Environmental Initiatives > Environmental Policy .............................................................................................. P.30 > Environmental Sustainability Management ........................................................... P.31 > Product Development ............................................................................................. P.39 > Product Manufacture ............................................................................................... P.43 > Logistics .................................................................................................................... P.51 > Recycling .................................................................................................................. P.52 > Biodiversity Protection / Communication with Local Communities ..................... P.55
Transcript of Environmental Initiatives - Sharp · PDF fileEnvironmental Initiatives > ... and the Sharp...

SHARP SUSTAINABILITY REPORT 2017
29
Environmental Initiatives
> Environmental Policy .............................................................................................. P.30
> Environmental Sustainability Management ........................................................... P.31
> Product Development ............................................................................................. P.39
> Product Manufacture ............................................................................................... P.43
> Logistics .................................................................................................................... P.51
> Recycling .................................................................................................................. P.52
> Biodiversity Protection / Communication with Local Communities ..................... P.55

SHARP SUSTAINABILITY REPORT 2017
Increasing Green Shared Value
In fiscal 2016, Sharp’s positive impact (i.e., avoided GHG emissions)was equivalent to 24.8 million tons CO2, while the company’snegative impact (i.e., GHG emissions) was 24.43 million tons CO2. Asa result, the GSV index (the ratio of positive impact to negativeimpact) was 1.02 (i.e., 24.8 million tons CO2 divided by 24.43 milliontons CO2).
Sharp will continue to develop energy-saving and energy-creatingproducts and work for their widespread use, while pushing forwardwith more efficient use of energy in its business activities.
Achievements for Fiscal 2016
Sharp places the fulfillment of society’s needs regarding environmental matters in close alignment with its strategy for businessgrowth, with a view to achieving success in both areas. Sharp defines the value thus created as “Green Shared Value” and it hasestablished an environmental policy of increasing this value.
In an effort to foster a low-carbon society—a key environmental goal for all—Sharp is controlling its greenhouse gas (GHG)emissions in conformity with the GHG Protocol Corporate Value Chain (Scope 3) Standard. This covers emissions not only inproduct manufacture, but also throughout the entire supply chain, from materials procurement to product use.
With a view to increasing Green Shared Value, Sharp is furthering its environmental initiatives by striving always to make thepositive impact of its avoidance of GHG emissions—achieved through customer use of energy-creating and energy-saving Sharpproducts—more than balance out the negative impact of GHG emissions from its business activities.
Specific actions include developing green products and devices, green procurement, saving energy, reducing waste, and reusingand recycling on an ongoing, proactive basis.
Environmental Initiatives: Environmental Policy
30
Avoided GHG Emissions (Positive Impact) Thousand tons CO2
Energy-saving products 16,610
Solar power generation 8,190
Total 24,800
GHG Emissions (Negative Impact) Thousand tons CO2
Materials Procurement 2,140
Product manufacture 1,130
Logistics 120
Product use 21,030
Disposal, recycling 10
Total 24,430
■ Breakdown of Avoided GHG Emissions and GHGEmissions
温室効果ガス削減貢献量 温室効果ガス排出量
Goal
Course
Efforts toIncrease avoided emissions
Efforts to Reduceemissions
Amount of emissions
Amount of avoided emissions
■ Avoided GHG Emissions and GHG Emissions (Conceptual Image)
CourseGoal

SHARP SUSTAINABILITY REPORT 2017
Putting Environmental Sustainability Management into Practice
In accordance with internal environmental conservation guidelines established in line with Sharp’s Basic EnvironmentalPhilosophy, the Sharp Group Charter of Corporate Behavior, and the Sharp Code of Conduct, Sharp is pursuing environmentalconsciousness across all of its business activities.
Promoting Environmental Sustainability Management
Sharp Corporation has set up the Quality and EnvironmentalPromotion Group as an organization to decide on andpromote environmental policies and other important itemsfor the entire Sharp Group. Critical policies, strategies, andmeasures relating to environmental sustainabilitymanagement are referred to the Group-Wide Conference.With the approval of corporate executives, these initiativesare thoroughly communicated across the entire SharpGroup via the basic environmental policy meetings. Thisinformation is then shared with relevant parties at the siteswhere Sharp’s manufacturing takes place (for example, theproduct design and manufacturing departments).
Sharp also holds joint environmental manager meetings andproduct/plant environmental manager meetings. At thesemeetings, participants review and discuss environmentalsolutions and the progress being made on each of theenvironmental measures being taken at each departmentand base. In this way, Sharp has a system in place to putenvironmental sustainability management into practiceacross its entire organization.
Promoting an Environmental Management System
Sharp has been operating an environmental managementsystem (based on ISO 14001) worldwide since 1995. Thepurpose of this system is to strengthen environmentalsustainability management and improve the environmentalawareness of employees.
ISO 14001 was revised in fiscal 2015. It now requirescompanies to further their efforts with a more strategicperspective—for example, by integrating theirenvironmental activities with business activities. In responseto the revision, Sharp is operating a more effectiveenvironmental management system that matches theparticular needs of each plant and office.
Region Number of Bases
Japan 12
Americas 5
Europe 11
China 6
ASEAN, Middle East, Oceania 13
Total 47
■ ISO 14001-Certified Bases (As of March 31, 2017)
31
Environmental Initiatives: Environmental Sustainability Management
Creating an Environmentally Conscious Company with Sincerity and Creativity
Basic Environmental Philosophy
The Sharp Group Charter of Corporate Behavior
The Sharp Group will make efforts to further contribute to global environmentalconservation by strengthening our development of proprietary technologies forprotecting the global environment, and by carrying out business activities in anenvironmentally conscious manner.
The Sharp Code of Conduct
Contribution to Conservation of the Global Environment1. To Conserve the Environment2. To Develop Environmentally Conscious Products and Services, and Conduct
Our Business Operations in an Environmentally Conscious Manner
Contribution to Conservation of the Global Environment

SHARP SUSTAINABILITY REPORT 2017
Promoting Environmental Education
Sharp aims to foster environmental awareness among its employees byconducting basic environmental training for general employees. It alsoprovides specialized training, covering such matters as environmental lawsand regulations and chemical substance management to improveemployees’ environmental knowledge and foster their awareness ofcompliance issues. In addition, Sharp has reformed its existingenvironmental education system, enriching the educational content andexpanding education methods.
Sharp will continue to promote environmental education according to thework content and work roles of employees under this new environmentaleducation system.
Product and Plant Audits
Environmental Performance Data Management System
To support environmental sustainability management, Sharp has established a system for managing data on Sharp’senvironmental performance. With high levels of precision and speed, this system compiles data on the environmental burdencaused by Sharp’s business activities via energy consumption, waste generation, and water usage, for example. This system is inoperation at all Sharp bases worldwide.
By collecting this data, Sharp is able to effectively grasp the current state of its environmental sustainability management,identify problems, and formulate measures.
Sharp regularly carries out a Green Product/Green Device Audit aimed mainly at ensuring compliance in product development.The company checks compliance with the environmental laws and regulations of each country and the reflection ofenvironmentally friendly design in products, such as energy efficiency, resource savings, and recyclability.
Sharp conducts environmental safety operation audits at its plants, aimed at ensuring compliance and operational safety inenvironmental safety work. The company checks the operation of environmental safety work in each field, such as pollutionprevention, waste disposal, and emergency response, as well as the status of compliance with environmental laws andregulations. In fiscal 2016, Sharp reflected the requirements of the EICC* international standard for electronics industry supplychains in its audit guidelines.
Training on environmentally friendly products (Katsuragi Plant)
* EICC: Electronic Industry Citizenship Coalition. Established in 2004 by electronic device manufacturers such as Hewlett Packard Enterprise, IBM Corp., and Dell Inc., it creates standards forsocial, environmental, and ethical issues in the electronic industry’s supply chain.
32
Environmental Initiatives: Environmental Sustainability Management

SHARP SUSTAINABILITY REPORT 2017
Sharp gathers data to gain an overview of the burden its business activities place on the environment. Measured items include theconsumption of energy and materials in business activities, the emissions of greenhouse gases, and the generation of waste. Sharpthen uses these values to reduce its environmental burden. The calculation standards for each item are listed on the following page.
*1 TJ (Tera joule) = 1012 Joules *2 Amount of solar power generated; amount of green power certificates purchased. *3 Total weight of product shipments and waste, etc. (estimate). *4 Amountrecycled through closed-loop plastic material recycling technology. *5 In Japan. *6 Annual energy used and amount of CO2 emitted by products in the 13 major categories sold in the reporting year(estimate). *7 Total weight of products in the 13 major categories sold in the reporting year and packaging materials used (estimate).
640
Material Balance
2,46037,457 3,757
INPUTS
Energy consumed 16,558TJ*1
Electricity 1,440 million kWh(Electricity purchased) 1,427 million kWh(Alternative energy*2) 13 million kWh
City gas 24 million m3
LPG 6,275 tons
Heavy oil, kerosene, gas oil, gasoline
1,416 kl
Hot water, cold water, steam 1,102 TJ
PFCs purchased 767 tons
Water resources consumed 23 million m3
New water 8 million m3
(Industrial-use water) 4 million m3
(Tap water) 3 million m3
(Groundwater) 1 million m3
Water reused 15 million m3
Chemical substances (PRTR) handled 9,119 tons
Materials consumed 632 thousand tons*3
(Recycle plastic*4) 1 thousand tons
OUTPUTS
GHG emissions 1,016 thousand tons CO2
CO2 943 thousand tons CO2Gases other than CO2 (converted into amounts of CO2
73 thousand tons CO2
(HFC) 3 thousand tons CO2(PFC) 31 thousand tons CO2(SF6) 31 thousand tons CO2(NF3) 8 thousand tons CO2(HCFC) 0.2 thousand tons CO2
Drainage 5 million m3
(Public water areas) 3.5 million m3
(Sewerage) 1.8 million m3
Chemical substances (PRTR) released and transferred
494 tons
Atmosphere*5 NOx emissions 66 tonsSOx emissions 2 tons
Water areas*5 COD (chemical oxygen demand) 4 tonsNitrogen pollutant load 21 tonsPhosphorous pollutant load 2 tons
Product shipments*7 565 thousand tons
Waste, etc. 67 thousand tons(Landfill disposal) 1 thousand tons
Energy consumed (vehicle fuel)*5 246 TJ CO2 emissions*5 17 thousand tons CO2
CO2 emissions*6 2,460 thousand tons CO2Energy consumed (Electricity)*6
37,457 TJ (3,757 million kWh)
Disposal after recycling*5 7 thousand tons
RECYCLE
Amount recycled*5
Home appliances (4 kinds) 49 thousand tons
Copiers/MFPs 3 thousand tons
PCs 15 tons
Amount of closed-loopmaterial recycling of plastic 1 thousand tons
Product development
Recy
cled
into
new
pro
duct
s, re
used
as n
ew p
arts
, cl
osed
-loop
mat
eria
l rec
yclin
g, e
tc.
Oth
er u
ses
■ Material Balance in Business Activities (Fiscal 2016)
33
Product manufacture
Logistics
Product use
Disposal, recycling
Environmental Initiatives: Environmental Sustainability Management

SHARP SUSTAINABILITY REPORT 2017
The environmental performance data are calculated based on the following boundary and calculation standards.
< Period Covered, Coverage >Please refer to the editorial policy.
*1 LCD TVs, air conditioners, refrigerators, washing machines, air purifiers, microwave ovens, LED lights, Blu-ray Disc recorders, facsimiles, mobile phones, LCD monitors, copiers/MFPs, solarcells
*2 TVs (CRT TVs, flat-panel TVs), air conditioners, refrigerators/freezers, washing machines/dryers
Boundary of Environmental Performance Data, Calculation Standards for Environmental Performance Indicators
Environmental Performance Indicators Unit Calculation Method
INPUTS
Product manufacture
Energy consumed TJ
Calculated based on the Act on the Rational Use of Energy(Energy Conservation Act) and the Japanese Ministry of theEnvironment’s Greenhouse Gas Emission Calculation andReporting Manual
Water resources consumed Million m3 Consumption and recycled use of industrial-use water, tap
water, and groundwater
PFCs purchased Tons HFCs, PFCs, sulfur hexafluoride (SF6), nitrogen trifluoride (NF3),and HCFCs purchased annually
Chemical substances (PRTR) handled Tons
Among the substances covered under the PRTR Law, the totalamount of substances handled annually at each plant inquantities of 500 kg or more
Materials consumed Thousand tons
Total weight of products in the 13 major categories*1 sold in thereporting year (estimate), plus waste, etc. generated
Logistics Energy consumed TJ Revised ton-km method
Product use Energy consumed TJ(million kWh)
Estimate of annual energy used by products in the 13 majorcategories*1 sold in the reporting year. Calculation based oneach product’s annual energy consumption rate (using a heatinput per unit of 9.97 MJ/kWh).
Disposal, recycling
Home appliance (4 kinds)*2
Thousand tons Amount of used home appliances (4 kinds) recycled
Copiers/MFPs Thousand tons Amount of recycled copiers and MFPs
PCs Tons Amount of recycled PCs
Closed-loop plastic material recycling Tons Amount of recycled plastic used, which was produced through
closed-loop material recycling
■ Calculation Standards for Environmental Performance Indicators
34
Environmental Initiatives: Environmental Sustainability Management

SHARP SUSTAINABILITY REPORT 2017
Environmental Performance Indicators Unit Calculation Method
OUTPUTS
Product manufacture
Greenhouse gas emissions
Thousand tons CO2
• CO2 emissions from purchased electricityJapan:Using CO2 emission coefficient (adjusted) published by Japan’sElectric Power Council for a Low Carbon Society (ELCS)Overseas:Using GHG Protocol Calculation Tools (GHG emissions frompurchased electricity)
• CO2 emissions from consumed fuelUsing emission coefficient published in the Ministry of theEnvironment’s Greenhouse Gas Emission Calculation andReporting Manual
• Greenhouse gases other than CO2Using global warming potential published in the 4th AssessmentReport by the Intergovernmental Panel on Climate Change(IPCC)
Drainage Million m3 Annual drainage into public water areas and sewer system
Chemical substances (PRTR) released and transferred
TonsAmong the substances covered under the PRTR Law, the totalamount of substances (handled annually at one or more plant inquantities of 500 kg or more) that were released and transferred
NOx emissions Tons Annual emissions
SOx emissions Tons Annual emissions
COD (chemical oxygen demand) Tons Drainage into public water areas
Nitrogen pollutant load Tons Drainage into public water areas
Phosphorous pollutant load Tons Drainage into public water areas
Waste, etc. Thousand tons
Industrial waste + general office waste + valuable resources recovered
Final landfill disposal Thousand tons
Final landfill disposal of industrial waste + final landfill disposal of general office waste
Product shipments Thousand tons
Total weight of products in the 13 major categories* sold in the reporting year, plus packaging material used (estimate)
Logistics CO2 emissions Thousandtons CO2
Revised ton-km method
Product use CO2 emissions Thousand tons CO2
Amount of CO2 emitted by products in the 13 major categories*sold in the reporting year, based on their energy consumption (estimate)
Disposal, recycling
Disposal after recycling Tons
[Weight of 4 kinds of home appliances, PCs, and copiers/MFPs collected] – [Weight recycled into new products or materials, or reused]
* LCD TVs, air conditioners, refrigerators, washing machines, air purifiers, microwave ovens, LED lights, Blu-ray Disc recorders, facsimiles, mobile phones, LCD monitors, copiers/MFPs, solar cells
35
Environmental Initiatives: Environmental Sustainability Management

SHARP SUSTAINABILITY REPORT 2017
Greenhouse Gas Emissions Based on the GHG Protocol Initiative
Sharp calculates greenhouse gas emissions based on the GHG Protocol*1 and then works to limit those emissions resulting fromcustomer use of Sharp products and from Sharp’s business activities, including those in the supply chain.
*2 LCD TVs, air conditioners, refrigerators, washing machines, air purifiers, microwave ovens, LED lights, Blu-ray Disc recorders, facsimiles, mobile phones, LCD monitors, copiers/MFPs, solar cells*3 Annual power consumption of each product × number of units sold × product life × CO2 emission coefficient*4 TVs (CRT TVs, flat-panel TVs), air conditioners, refrigerators/freezers, washing machines/dryers
*1 The GHG Protocol is an international standard for calculating greenhouse gas (GHG) emissions. It was jointly established by the World Business Council for Sustainable Development (WBCSD),a coalition of the world’s leading companies, and the World Resources Institute (WRI), a United States-based think tank.
■ Greenhouse Gas Emissions by Scope 1/2/3 Categories Based on the GHG Protocol Initiative (Fiscal 2016)
ScopeEmissions(Thousand tons CO2)
Notes
Scope 1 (direct GHG emissions from business activities) 149 Emissions from combustion of fuel, etc.
Scope 2 (indirect GHG emissions from energy usage in business activities) 867 Emissions from the use of electricity
Scope 3 (indirect GHG emissions from areas outside the scope of business activities) 27,797
Calculated for categories such as procurement,employee commuting and business trips, shippingand distribution, and product usage
■ Greenhouse Gas Emissions by Scope 3 Category Based on the GHG Protocol Initiative (Fiscal 2016)
Classification CategoryEmissions (Thousand tons CO2)
Notes
Upstream
Purchased goods and services 2,840CO2 emissions from the manufacture of materialsprocured for products in the 13 major categories*2 thatthe Sharp Group sold in the reporting year
Fuel- and energy-related activities not included in scope 1 or 2 90 CO2 emissions from transmission losses of electricity
purchased by the Sharp Group
Upstream transportation and distribution 20 CO2 emissions from transportation and distribution of
materials procured by the Sharp Group
Sharp
Business travel 10 CO2 emissions from business travel by all employees ofSharp Corporation
Employee commuting 20 CO2 emissions from commuting by all employees ofSharp Corporation
Leased assets - Included in scope 1 and 2 CO2 emissions
Downstream
Waste generated in operations 5 CO2 emissions from waste disposal and treatment by theSharp Group
Processing of sold products 200 CO2 emissions from processing at destination of SharpGroup products
Downstream transportation and distribution 160 CO2 emissions from transportation and distribution of
products manufactured by the Sharp Group
Use of sold products 24,450Lifetime CO2 emissions*3 from the use of products in the13 major categories*2 that the Sharp Group sold in thereporting year
End-of-life treatment of sold products 2 CO2 emissions from recycling 4 types of appliances*4 thatSharp Corporation sold in Japan
Total 27,797
36
Environmental Initiatives: Environmental Sustainability Management
SHARP SUSTAINABILITY REPORT 2017
Environmental Accounting
Sharp uses environmental accounting to provide a quantitative assessment of the costs and benefits of its environmentalconservation activities and applies the results to environmental sustainability management.
Environmental Conservation Costs
In fiscal 2016, Sharp’s environmental conservation investment was approximately 0.8 billion yen, and environmentalconservation expenditures were approximately 22.8 billion yen. Costs associated with “Planning and Design (research anddevelopment)” made up a large percentage of these figures.
Explanation of Terminology
< Environmental Conservation Costs >Overhead costs, personnel expenses, and investment associated with environmental conservation activities, in addition toattendant depreciation.
Sites Covered
The Sharp Group in Japan
Period Covered
April 1, 2016 to March 31, 2017
Referenced Guidelines
Environmental Accounting Guidelines 2005 published by the Ministry of the Environment, Japan
37
Environmental Initiatives: Environmental Sustainability Management

SHARP SUSTAINABILITY REPORT 2017
Environmental Accounting
Classification*1 Main Activities
Environmental Conservation Costs
(Unit: ¥ million) Environmental Conservation Effects
Investment Expenses
Environmental Sustainability Management (management activities/social responsibility)
• Promote environmental sustainability management
• Operate environmental management system
• Environmental education• Social contribution activities
27 2,535
Promote environmental sustainability management
Number of ISO 14001-certified sites
Environmental social contributionsNumber of employees who attended SGC*2
activities (total)
47 sites
18,000 persons
Planning and Design (research and development)
• R&D on solar power systems• Promote closed-loop
recycling of plastic materials• R&D on environmental
related technologies
680 8,705
Supply environmentally conscious products• Number of Super Green Products• CO2 emissions reduced by solar power systems*3
• CO2 emissions reduced by energy-saving products*4
52 models8 million tons CO2
17 million tons CO2
Man
ufac
turin
g
Reduce GHG emissions (global environmental conservation)
• Introduce PFC abatement systems
• Install solar power systems• Energy-saving equipment
54 2,552
electricity and fuel consumption• CO2 emissions reduced• PFC emissions reduced
Energy costs reduced by controlling electricity and fuel consumption
26,000 tons CO21,000 tons CO2
590 million yen
Minimize and recycle waste (recycle resources)
• Reduce waste discharge• Recycle waste into valuable
resources• Recycle water
2 5,185
Waste recycled or sent for appropriate disposal• Waste recycled• Recycled and reused water
Economic benefits from recycling waste into valuable resources and using recycled water
47,000 tons15 million m3
901 million yen
Prevent pollution (prevent pollution)
• Install scrubbers• Install exhaust gas treatment
systems61 3,737
• Observe environmental laws and regulations• Prevent air/water pollution and noise/vibration• Promote risk management• Chemical substances properly managed and their discharge reduced• Reduce risk of soil contamination
Recycling/Logistics (upstream/downstream)
• Collect used products• Promote proper recycling of
used products0 41
Collection, recycling, and proper disposal of used products• Used home appliances (4 kinds) recycled• Used copiers/MFPs recycled• Used PCs recycled
Environmental burden during distribution reduced• Rate of modal shift• Percentage of low-pollution vehicles
49,000 tons3,000 tons
15 tons
24.5%99.9%
Total 824 22,755
*1 Parentheses indicate category based on the Environmental Accounting Guidelines, Ministry of the Environment.*2 A joint labor-management volunteer organization.*3 Amount reduced by solar power systems sold in the reporting year, assuming that they will be in operation for the next 20 years.*4 Amount reduced by products in the four major categories (LCD TVs, air conditioners, refrigerators, copiers/MFPs) sold in the reporting year, assuming that they will be used for the next 10
years.
38
Environmental Initiatives: Environmental Sustainability Management
SHARP SUSTAINABILITY REPORT 2017
Developing Environmentally Conscious Products and Devices
Sharp calls its environmentally conscious productsGreen Products (GP). The GP Guidelines, whichdefine development and design criteria in line withseven concepts, have been in use at all productdesign departments since fiscal 1998.
In developing products, Sharp sets specificobjectives according to the GP Standard Sheet,which is formulated based on the GP Guidelines. Inthe trial manufacture and mass production stages,it determines how well the actual product has metthese objectives, with those achieving thestandards being awarded GP status.
The content of the GP Standard Sheet—thebenchmark for development objectives—is revisedeach year in order to constantly improve theenvironmental performance of Sharp products.
Developing Green Products
Developing Super Green Products
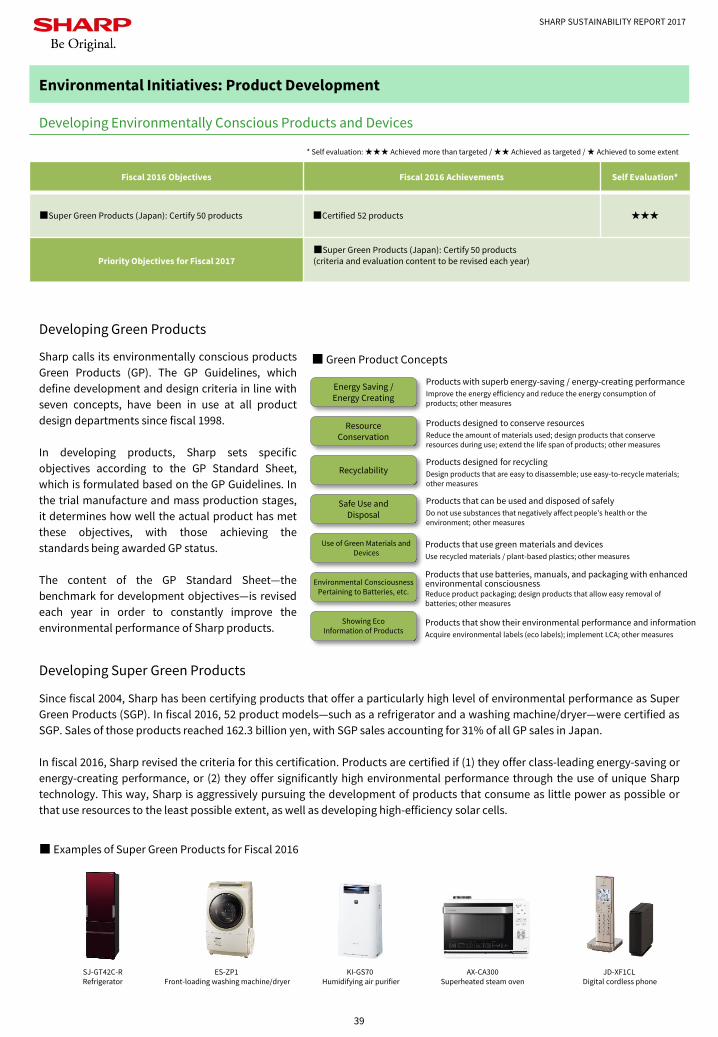
Since fiscal 2004, Sharp has been certifying products that offer a particularly high level of environmental performance as SuperGreen Products (SGP). In fiscal 2016, 52 product models—such as a refrigerator and a washing machine/dryer—were certified asSGP. Sales of those products reached 162.3 billion yen, with SGP sales accounting for 31% of all GP sales in Japan.
In fiscal 2016, Sharp revised the criteria for this certification. Products are certified if (1) they offer class-leading energy-saving orenergy-creating performance, or (2) they offer significantly high environmental performance through the use of unique Sharptechnology. This way, Sharp is aggressively pursuing the development of products that consume as little power as possible orthat use resources to the least possible extent, as well as developing high-efficiency solar cells.
Fiscal 2016 Objectives Fiscal 2016 Achievements Self Evaluation*
■Super Green Products (Japan): Certify 50 products ■Certified 52 products ★★★
Priority Objectives for Fiscal 2017■Super Green Products (Japan): Certify 50 products (criteria and evaluation content to be revised each year)
SJ-GT42C-R Refrigerator
JD-XF1CL Digital cordless phone
KI-GS70 Humidifying air purifier
ES-ZP1 Front-loading washing machine/dryer
AX-CA300Superheated steam oven
■ Examples of Super Green Products for Fiscal 2016
■ Green Product Concepts
Products with superb energy-saving / energy-creating performanceImprove the energy efficiency and reduce the energy consumption of products; other measures
Products designed to conserve resourcesReduce the amount of materials used; design products that conserve resources during use; extend the life span of products; other measures
Products designed for recyclingDesign products that are easy to disassemble; use easy-to-recycle materials; other measures
Products that can be used and disposed of safelyDo not use substances that negatively affect people’s health or the environment; other measures
Products that use green materials and devicesUse recycled materials / plant-based plastics; other measures
Products that use batteries, manuals, and packaging with enhanced environmental consciousnessReduce product packaging; design products that allow easy removal of batteries; other measures
Products that show their environmental performance and informationAcquire environmental labels (eco labels); implement LCA; other measures
Energy Saving / Energy Creating
Resource Conservation
Recyclability
Safe Use and Disposal
Use of Green Materials and Devices
Environmental ConsciousnessPertaining to Batteries, etc.
Showing Eco Information of Products
39
Environmental Initiatives: Product Development
* Self evaluation: ★★★ Achieved more than targeted / ★★ Achieved as targeted / ★ Achieved to some extent
SHARP SUSTAINABILITY REPORT 2017
Sharp calls its environmentally consciousdevices Green Devices (GD). To define guidelinesfor development and design based on sevenconcepts, Sharp established the GD Guidelines,which it began applying at all device designdepartments in fiscal 2004.
Sharp sets specific objectives according to theGD Standard Sheet, and it determines how wellthe actual device has met these objectives, withthose achieving the standards being named GD.
In fiscal 2013, Sharp revamped the GD assessmentsystem by adding new criteria concerning forward-looking initiatives that take customer demands intoconsideration. The degree to which these criteriaare satisfied is represented in points called GDChallenge Points. The assessment criteria arerevised every year so that Sharp can continuouslyraise the environmental performance of itsproducts such as LCD modules and sensors.
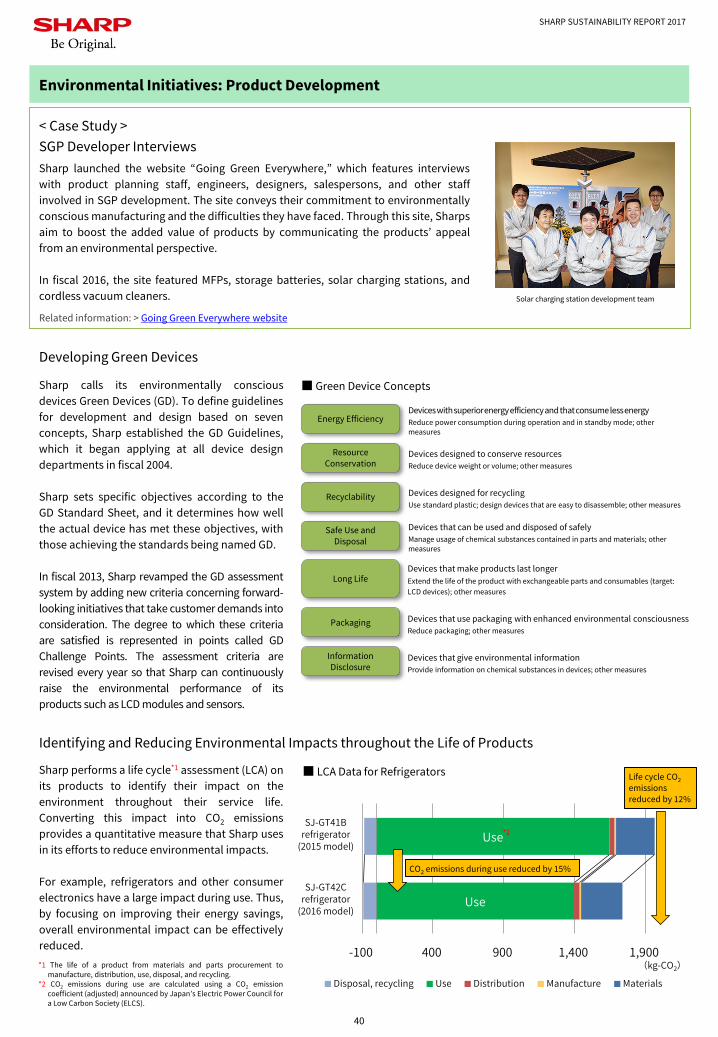
Sharp performs a life cycle*1 assessment (LCA) onits products to identify their impact on theenvironment throughout their service life.Converting this impact into CO2 emissionsprovides a quantitative measure that Sharp usesin its efforts to reduce environmental impacts.
For example, refrigerators and other consumerelectronics have a large impact during use. Thus,by focusing on improving their energy savings,overall environmental impact can be effectivelyreduced.
Developing Green Devices
Identifying and Reducing Environmental Impacts throughout the Life of Products
*1 The life of a product from materials and parts procurement tomanufacture, distribution, use, disposal, and recycling.
*2 CO2 emissions during use are calculated using a CO2 emissioncoefficient (adjusted) announced by Japan’s Electric Power Council fora Low Carbon Society (ELCS).
Sharp launched the website “Going Green Everywhere,” which features interviewswith product planning staff, engineers, designers, salespersons, and other staffinvolved in SGP development. The site conveys their commitment to environmentallyconscious manufacturing and the difficulties they have faced. Through this site, Sharpsaim to boost the added value of products by communicating the products’ appealfrom an environmental perspective.
In fiscal 2016, the site featured MFPs, storage batteries, solar charging stations, andcordless vacuum cleaners.
SGP Developer Interviews< Case Study >
■ Green Device Concepts
Devices with superior energy efficiency and that consume less energyReduce power consumption during operation and in standby mode; other measures
Devices designed to conserve resourcesReduce device weight or volume; other measures
Devices designed for recyclingUse standard plastic; design devices that are easy to disassemble; other measures
Devices that can be used and disposed of safelyManage usage of chemical substances contained in parts and materials; other measures
Devices that make products last longerExtend the life of the product with exchangeable parts and consumables (target: LCD devices); other measures
Devices that use packaging with enhanced environmental consciousnessReduce packaging; other measures
Devices that give environmental informationProvide information on chemical substances in devices; other measures
Energy Efficiency
Resource Conservation
Recyclability
Safe Use and Disposal
Long Life
Packaging
InformationDisclosure
Solar charging station development team
Use
Use
-100 400 900 1,400 1,900
SJ-GT41B refrigerator
(2015 model)
SJ-GT42C refrigerator
(2016 model)
(kg-CO2)
Disposal, recycling Use Distribution Manufacture Materials
■ LCA Data for Refrigerators
CO2 emissions during use reduced by 15%
Life cycle CO2emissions reduced by 12%
*2
40
Environmental Initiatives: Product Development
Related information: > Going Green Everywhere website

SHARP SUSTAINABILITY REPORT 2017
Sharp operates a product environmental assessment system to ensure compliance with environmental laws and regulations aswell as to promote environmentally conscious product design. This system allows Sharp to keep a database of GP and GDdevelopment know-how and design data from all Sharp design and development bases. The database is used to raise designstandards as well as to standardize in-house life cycle assessments (LCA). This way, the system is contributing to the creation ofenvironmentally conscious Sharp products and devices. In fiscal 2016, Sharp strengthened the function for checking products’compliance with environmental laws and regulations.
Product Environmental Assessment System
■ System Flow
Product planning Design, engineering sample Assessment Confirmation,
approvalConfirmation,
utilization
Product planning department
Engineering department
Quality control department Head office
Sales departments, product divisions, sales
companies, others
Product Environmental Assessment System
Data input
Data referral
Data input
Data confirmation/assessment
Data confirmation (input)
Electric appliances contain a variety of chemicals. Countries around the world have enacted laws and regulations that bringthese chemicals under control. In the EU, for example, the RoHS directive*2 restricts the use of specified chemicals in products,while REACH regulations*3 require companies to convey and disclose information on chemicals used throughout the supplychain. Countries such as Japan and China also have laws requiring companies to disclose information on certain chemicalscontained in products.
Sharp has its own standards for managing chemicals contained in parts and materials used for its products to ensure the safetyof products during use and to reduce the environmental impact at the time of disposal. Based on these standards—which arestricter than voluntary industry standards or standards stipulated by laws and regulations—Sharp introduced its originalChemical-Product Assessment (C-PA) system to evaluate the safety of chemicals in the product development and design stages.
Sharp also established an IT system to manage information on chemicals contained in materials, so that it can appropriatelymanage chemicals in the supply chain. Through this system, Sharp cooperates with suppliers to collect data on chemicalscontained in products. Sharp is continuing to expand the database. In fiscal 2016, Sharp upgraded the system to accommodatechemSHERPA*4, a new scheme for sharing information on chemicals contained in products.
Sharp promotes green procurement to reduce environmental impact throughout the entire supply chain. In itscomprehensive material-procurement process, Sharp not only considers quality, cost, and delivery times, it also addsenvironmental consciousness to the selection criteria. In fiscal 2000, Sharp issued the first edition of the GreenProcurement Guidelines. In fiscal 2005, contracts with Sharp’s suppliers were amended to require compliance with theGreen Procurement Guidelines. In fiscal 2011, Sharp revised the guidelines to include biodiversity protection as anevaluation item. In fiscal 2015, Sharp revised the guideline content again, to be in compliance with the EICC Code ofConduct*1. In doing so, Sharp integrated its green procurement survey and CSR procurement survey, which wereconducted separately, into a single CSR/green procurement survey. Sharp and its suppliers are thus continuing theirefforts to reduce environmental impacts.
Managing Chemical Substances in Products
*2 An EU directive on the “Restriction on the use of certain Hazardous Substances.” RoHS restricts the use of lead, mercury, cadmium, hexavalent chromium, polybrominated biphenyl (PBB),and polybrominated diphenyl ether (PBDE) in electrical and electronic equipment entering the EU market after July 1, 2006. After July 22, 2019, the use of four additional substances will berestricted: bis(2-ethylhexyl) phthalate (DEHP), butyl benzyl phthalate (BBP), dibutyl phthalate (DBP), and diisobutyl phthalate (DIBP).
*3 REACH (Registration, Evaluation, Authorization, and Restriction of Chemicals) is a set of EU regulations covering chemicals produced in and imported into the EU. (Took effect in 2007.)*4 A scheme for sharing information on chemicals contained in products, developed under the initiative of the Japanese Ministry of Economy, Trade, and Industry. Conforms to IEC 62474, an
international standard for the electrical and electronics industry on material declaration.
Reducing Environmental Impact in the Supply Chain
*1 Code of conduct established by the EICC (Electronic Industry Citizenship Coalition, an influential international organization) to promote CSR throughout the supply chain. The Code is madeup of five sections: labor, health and safety, the environment, ethics, and management systems.
41
Environmental Initiatives: Product Development
Data referral Data referral

SHARP SUSTAINABILITY REPORT 2017
Since first embarking on solar cell development in 1959, Sharp has been working for more than half a century to develop andspread the use of solar power systems. Sharp is a global total energy solutions provider, involved in the development andproduction of solar cells, system design, construction and maintenance of power plants, and management as an IPP(independent power producer). It also provides energy management systems utilizing storage batteries.
In January 2017, Mongolia’s first-ever*1 mega solar power plant*2 went into commercial operation in Darkhan, located about 230km north of the country’s capital, Ulaanbaatar, and a completion ceremony was held. Solar modules (10 MW each) supplyrenewable energy on an approximately 290,000 m2 site (equivalent to about 40 soccer grounds). The power generated isequivalent to reducing greenhouse gas emissions of approximately 15,000 tons of CO2 per year. This project was selected for theFinancing Program for JCM Model Projects*3 run by the Japanese Ministry of the Environment, and it will also contribute to theachievement of Japan’s greenhouse gas emission reduction targets. At the completion ceremony, Sharp’s engineers werehonored for their contribution to the development of the energy industry in Mongolia.
Sharp has also contributed to the improvement of the energy situation in Mongolia in other ways. Efforts include engaging in asolar power electrification project for a non-electrified village in 2003.
Construction of a Mega Solar Power Plant (Mongolia)< Case Study >
Mega solar power plant in Darkhan, Mongolia
*1 As of January 19, 2017; based on Sharp research.*2 A joint project between Shigemitsu Shoji Co., Ltd., local company Solar Power International LLC, and Sharp.*3 A program for implementing CO2 reduction projects that utilize Japan’s superior technologies in developing countries. The program measures, reports on, and verifies the projects’
greenhouse gas emission reduction effects. Based on the premise that the calculated amount of emission reductions will be counted as a reduction in Japan’s emissions through the joint crediting mechanism, businesses are provided with facility subsidies of up to one-half of the initial investment cost.
42
Environmental Initiatives: Product Development
Construction completion ceremony
Award and medal presented to Sharp

SHARP SUSTAINABILITY REPORT 2017
Curbing Greenhouse Gas Emissions
Sharp is taking active measures to curb greenhouse gas (GHG) emissions resulting from its business activities in an effort tocontribute to the realization of a low-carbon society. The Sharp Group’s GHG emissions in fiscal 2016 decreased by 8.9% (down98,000 tons CO2) compared to the previous fiscal year. However, due to a decrease in production volume, the improvement rateof energy intensity was 11%, compared to the baseline year of 2012.
Each Sharp plant is strengthening efforts involving all equipment and systems—ranging from production lines to utility systemsfor supplying electricity, gas, and water—to boost energy efficiency and reduce GHG emissions. In particular, at the LCD andelectronic component plants, the production, engineering, and environmental departments work together to reduceconsumption of base-load energy. Efforts include installing inverters*1 and optimizing the air conditioning in clean rooms*2.Going forward, Sharp will pursue further energy-saving measures and boost production efficiency in line with its businessexpansion.
Sharp Group Activities to Control Greenhouse Gas Emissions
Fiscal 2016 Objectives Fiscal 2016 Achievements Self Evaluation*
■Energy intensity: Improve by 25% (baseline year: fiscal 2012) ■Improved by 11% (baseline year: fiscal 2012) ★
Priority Objectives for Fiscal 2017 ■Energy intensity: Improve by 20% (baseline year: fiscal 2012)
1,191 1,146 1,181 1,021 943
136 165 12693
73
0200400600800
1,0001,2001,400
2012 2013 2014 2015 2016
(Thousand tons CO2)
(Fiscal year)CO2 emissions from energy sources PFCs emissions
■ Amount of GHG Emissions
100 82
75 77 89
0
20
40
60
80
100
120
2012 2013 2014 2015 2016
(%)
(Fiscal year)
■ Energy Intensity (Baseline Year: Fiscal 2012)
*1 A device to control the number of motor rotations.*2 A room where the temperature, humidity, and cleanliness are kept at controlled levels.*3 HFCs, PFCs, sulfur hexafluoride (SF6), nitrogen trifluoride (NF3), HCFCs
1,327 1,311 1,3071,114
1,016
Japan79%
China14%
Asia6%
North and South America1% Europe
0%
■ GHG Emissions by Region (Fiscal 2016)
*3
43
Environmental Initiatives: Product Manufacture
CO2 emissions from energy sources
* Self evaluation: ★★★ Achieved more than targeted / ★★ Achieved as targeted / ★ Achieved to some extent

SHARP SUSTAINABILITY REPORT 2017
Clean room
Outdoor-air processing unit
Clean roomOutdoor-air
processing unit
The Kameyama Plant (Kameyama, Mie Prefecture) manufactures LCDswith various functions and sizes for use in smartphones, tablets, and TVs.In order to maintain the state of the clean rooms*1 necessary for theproduction of LCDs, air conditioned by the outdoor-air processing units isfed in by blowers. In fiscal 2016, installing inverters*2 on the blowers andreducing electricity usage resulted in an annual reduction ofapproximately 1,000 tons of CO2.
Reducing Air-Conditioner Power Consumption (Kameyama Plant)< Case Study >
*1 A room where the temperature, humidity, and cleanliness are kept at controlled levels.*2 A device to control the number of motor rotations.
Outdoor-air processing units on the rooftop of the plant
Outside air
Blower
< Before improvement >The rotation speed of the blower motor is kept constant and air volume is adjusted with a damper (on/off valve).
Damper
< After improvement >The inverter lowers the motor rotation speed to adjust air volume, reducing the power consumption of the blower.
Outside air
Blower
Inverter installation
The rotation speed of the
motor is constant
Motor rotation speed down
44
Environmental Initiatives: Product Manufacture

SHARP SUSTAINABILITY REPORT 2017
Minimizing and Recycling Waste
Sharp has been working to reduce waste and to recycle as much of it as possible in an effort to contribute to building a resource-recycling society. In fiscal 2016, the amount of waste, etc. generated by the Sharp Group decreased by 9% (down 6,000 tons)compared to the previous fiscal year, but the final landfill disposal rate was 1.6%. Meanwhile, as a result of ongoing efforts torecycle solid and liquid waste and to recover valuable resources, in fiscal 2016 Sharp production plants in Japan achieved a finallandfill disposal rate of 0.002%. This marks zero discharge to landfill* for the 16th consecutive year, starting from fiscal 2001.Going forward, Sharp will strengthen waste reduction efforts at overseas bases and work to reduce the final landfill disposal rateon a global scale.
Fiscal 2016 Objectives Fiscal 2016 Achievements Self Evaluation*
■Final landfill disposal rate of 1.0% or less ■Final landfill disposal rate of 1.6% ★
Priority Objectives for Fiscal 2017 ■Final landfill disposal rate of 1.3%
Curbing the Amount of Waste, etc. Generated by the Sharp Group
* Sharp defines “zero discharge to landfill” as a final landfill disposal rate of less than 0.5%. Final landfill disposal rate (%) = Amount of landfill disposal ÷ amount of waste, etc. generated × 100.
115 102 98
73 67
0
30
60
90
120
2012 2013 2014 2015 2016
(Thousand tons)
(Fiscal year)
■ Amount of Waste, etc.
1.8 2.3
1.2 1.0 1.6
0.0
1.0
2.0
3.0
4.0
2012 2013 2014 2015 2016
(%)
(Fiscal year)
■ Final Landfill Disposal Rate
Japan75%
Asia13%
China9%
Europe2%
North and South America
1%
■ Waste, etc. by Region (Fiscal 2016)
45
Environmental Initiatives: Product Manufacture
* Self evaluation: ★★★ Achieved more than targeted / ★★ Achieved as targeted / ★ Achieved to some extent

SHARP SUSTAINABILITY REPORT 2017
Appropriate Storage and Management of PCB Wastes
In Japan, Sharp properly stores and manages waste PCB (polychlorinated biphenyls) in accordance with the Act on SpecialMeasures Concerning Promotion of Proper Treatment of PCB Wastes. Sharp is on track to finish treating PCB waste to make itharmless by the legally set March 31, 2027 deadline.
At the Tochigi Plant (Yaita, Tochigi Prefecture), Sharp is working on resource recycling by converting the styrene foam dischargedfrom the LCD TV production process into a valuable resource. In the past, the styrene foam used as packaging material forpurchased components was disposed of as industrial waste. However, Sharp has succeeded in turning it into a valuable resourceby introducing a special machine that melts the styrene foam into a small mass of polystyrene. As a result, in fiscal 2016, about95% of the waste styrene foam was turned into a valuable resource, allowing Sharp to save on waste disposal costs. Reducing thevolume of styrene foam also saves storage space and improves transportation efficiency.
Converting Styrene Foam into a Valuable Resource (Tochigi Plant)< Case Study >
Large quantities of styrene foam Melted and solidified Turned into valuable polystyrene
46
Environmental Initiatives: Product Manufacture

SHARP SUSTAINABILITY REPORT 2017
Sharp Group Reducing the Amount of New Water Used and Using More Recycled Water
Sharp is striving to make effective use of water resources by reducing the amount of new water (i.e., water from the water supplysystem) it uses and by increasing the use of recycled water. The volume of new water used by the Sharp Group in fiscal 2016decreased by 11% (down 1 million m3) compared to the previous fiscal year. However, due to a decrease in production volume,the improvement rate of water intensity was 9%, compared to the baseline year of 2012.
The Kameyama Plant (Kameyama, Mie Prefecture, Japan) and the Mie Plant (Taki District, Mie Prefecture, Japan) require a largeamount of water in the production process for LCDs. At both plants, Sharp has adopted a closed-loop water recycling system thatrecovers and reuses nearly 100% of the water discharged from the production process. Through measures such as this, the SharpGroup is maintaining a recycling rate* of at least 60%. Looking ahead, Sharp will pursue further water-use efficiency and boostproduction efficiency in accordance with business expansion.
Effectively Using Water Resources
Fiscal 2016 Objectives Fiscal 2016 Achievements Self Evaluation*
■Water intensity: Improve by 22% (baseline year: fiscal 2012) ■Water intensity: Improved by 9% (baseline year: fiscal 2012) ★
Priority Objectives for Fiscal 2017 ■Water intensity: Improve by 20% (baseline year: fiscal 2012)
* Recycling rate = Amount recycled ÷ (amount of new water + amount recycled)
10 10 10 9 8
0
3
6
9
12
2012 2013 2014 2015 2016
(Million m3)
(Fiscal year)
■ Volume of New Water Used
100 82 78 83
91
0
30
60
90
120
2012 2013 2014 2015 2016
(%)
(Fiscal year)
■ Water Intensity (Baseline Year: Fiscal 2012)
Japan79%
China15%
Asia6%
North and South America0% Europe
0%
■ New Water Used by Region (Fiscal 2016)
62 63 65 63 65
0
20
40
60
80
2012 2013 2014 2015 2016
(%)
(Fiscal Year)
■ Water Recycling Rate
47
Environmental Initiatives: Product Manufacture
* Self evaluation: ★★★ Achieved more than targeted / ★★ Achieved as targeted / ★ Achieved to some extent

SHARP SUSTAINABILITY REPORT 2017
Closed-Loop Water Recycling System< Case Study >
The Mie Plant (Taki District, Mie Prefecture) has adopted a closed-loop water recycling system to repeatedly recycle the largeamount of water used for the production of LCDs. The water discharged from the production process contains chemicals thatmust not be released from the plant untreated. All of this water is collected and goes through steps such as biofiltration (thenatural decomposition of chemicals using microorganisms) and filter filtration, before being purified with dedicated equipment.The resulting water is used repeatedly in production.
Production process
Large amounts of water are used to wash chemicals off LCDs
Effluent treatment
Microorganisms growing in tanks decompose the chemicals
The water goes through filters and is then purified using dedicated equipment
Filtration/pure water production
■ Closed-Loop Water Recycling Flow
EffluentPure water
Recycled water
48
Environmental Initiatives: Product Manufacture

SHARP SUSTAINABILITY REPORT 2017
Sharp meticulously controls chemical substances used at its plants. When introducing new chemical substances and newhandling equipment, Sharp uses its own process assessment system*1 to evaluate the hazardousness of these substances andestablish safety measures. To ensure employees’ safety and to minimize the environmental impact, employees handling thesesubstances go through regular education and drills. They are also given regular health checks. Sharp also monitors and reportsthe release and transfer of chemical substances covered by the Japanese PRTR Act*2. Of these PRTR chemicals, 16 were handledin Japan and nine overseas*3 in quantities of 500 kg or more by one or more plants during fiscal 2016.
Effective Management of Chemical Substances and Risk Management
*1 An in-house system for preliminarily assessing and confirming the safety, environmental load, and other factors of chemical substances and their handling equipment.*2 PRTR: Pollutant Release and Transfer Register. A system that mandates the collection and dissemination of information, such as the amount of harmful chemicals discharged and transferred.*3 Sharp defines target substances based on laws in Japan.
49
PRTRNo. Chemical Amount
Handled
Amount Discharged Amount Transferred Amount Consumed
Amount RemovedInto
Atmosphere
Into Public Water Areas
Into Sewerage
Into Waste, etc.
Contained in Products Recycled
20 2-Aminoethanol 3,883,934 503 174 0 119,905 0 3,101,383 661,969
44 Indium and its compounds 12,451 0 0 0 3,362 374 8,715 0
71 Ferric chloride 103,941 0 0 0 0 0 76,222 27,719
232 N, N-dimethyl formamide 5,934 0 0 0 0 0 0 5,934
272 Copper salts (water-soluble, except complex salts) 5,255 0 0 0 5,013 0 0 242
332 Arsenic and its inorganic compounds 583 0 0 0 558 15 10 0
343 Pyrocatechol 1,214 0 0 0 1,214 0 0 0
368 4-tert-butylphenol 1,081 19 0 0 1,062 0 0 0
374 Hydrogen fluoride and its water-soluble salts 498,873 306 0 0 317,445 0 113,037 68,085
401 1,2,4-benzenetricarboxylic 1,2-anhydride 668 0 0 0 35 633 0 0
405 Boron compounds 1,521 101 0 0 927 493 0 0
407 Polyoxyethylene alkyl ether 900 0 27 0 0 0 0 873
412 Manganese and its compounds 23,677 0 0 0 0 23,565 112 0
438 Methylnaphthalene 11,130 56 0 0 0 1,993 0 9,081
448 Methylenebis (4,1-phenylene) diisocyanate 448,321 0 0 0 0 448,321 0 0
453 Molybdenum and its compounds 11,652 0 0 0 2,381 350 8,921 0
Total 5,011,135 985 201 0 451,902 475,744 3,308,400 773,903
■ PRTR Data for Japan (Fiscal 2016)
■ Overseas PRTR Data (Fiscal 2016)
PRTRNo. Chemical Amount
Handled
Amount Discharged Amount Transferred Amount Consumed
Amount RemovedInto
Atmosphere
Into Public Water Areas
Into Sewerage
Into Waste, etc.
Contained in Products Recycled
31 Antimony and its compounds 3,908 0 0 0 39 2,602 1,267 0
104 Chlorodifluoromethane 56,045 190 0 0 0 55,855 0 0
291 1,3,5-tris (2,3-epoxypropyl)-1,3,5- triazine-2,4,6 (1H,3H,5H)-trione 3,921 0 0 0 39 2,611 1,271 0
300 Toluene 5,440 5,440 0 0 0 0 0 0
355 Bis (2-ethylhexyl) phthalate 15,740 0 0 0 14,790 0 950 0
384 1-bromopropane 1,883 0 0 0 19 955 909 0
392 N-hexane 1,139 1,139 0 0 0 0 0 0
413 Phthalic anhydride 2,614 0 0 0 26 1,740 848 0
448 Methylenebis (4,1-phenylene) diisocyanate 4,017,093 0 0 0 19,570 3,997,523 0 0
合計 4,107,783 6,769 0 0 34,483 4,061,286 5,245 0
(kg)
(kg)
Environmental Initiatives: Product Manufacture

SHARP SUSTAINABILITY REPORT 2017
Managing Environmental Load into Air and Water Areas
Sharp properly manages pollutants that affect air and water quality by establishing voluntary standards that are stricter thanthose set forth in laws and regulations and stricter than those agreed upon with local communities.
114 128
118 106
66
0
40
80
120
160
2012 2013 2014 2015 2016
(Tons)
(Fiscal year)
■ NOx Emissions
Atmospheric Emissions in Japan
2.5 2.5 2.6 2.5 1.9
0
1
2
3
4
2012 2013 2014 2015 2016
(Tons)
(Fiscal year)
■ SOx Emissions
Emissions into Water Areas in Japan
7.3
6.0 5.1 5.0
4.3
0
2
4
6
8
2012 2013 2014 2015 2016
(Tons)
(Fiscal year)
■ COD (Chemical Oxygen Demand)
31 27
22 22 21
0
10
20
30
40
2012 2013 2014 2015 2016
(Tons)
(Fiscal year)
0.8 1.0 1.3 1.4
2.1
0
1
2
3
4
2012 2013 2014 2015 2016
(Tons)
(Fiscal year)
■ Nitrogen Pollutant Load ■ Phosphorous Pollutant Load
Sharp Yonago Corporation (Yonago, Tottori Prefecture) collects and analyzes plantwastewater four times a year in the presence of local city officials. The results areshared with local residents and used to confirm the plant’s operational status. This alsoprovides Sharp the opportunity to foster good relations with the local community.
Analyzing Plant Wastewater Samples (Sharp Yonago Corporation)< Case Study >
Wastewater sampling at the plant
50
Risk Management of Soil and Groundwater Pollution
Sharp set in-house standards in 1999 to minimize the risk of environmental pollution and accidents caused by chemicalsubstances. It also strives to prevent such incidents from occurring by taking multi-layered leakage prevention measures atfacilities that handle chemical substances. For plants where chlorine solvent contamination was found in the past, Sharpregularly notifies local government authorities and residents of the cleanup progress.
Environmental Initiatives: Product Manufacture

SHARP SUSTAINABILITY REPORT 2017
Reducing the Environmental Impact of Logistics in Japan
Sharp observes a rule set forth in the Japanese Act on the Rational Use of Energy (Energy Conservation Act) that requiresspecified shippers to reduce energy intensity by 1% or greater per year. All Sharp Group companies in Japan are working toreduce the environmental impact and costs associated with logistics by improving transport and load efficiencies and by shiftingto environmentally friendly modes of transport (modal shift)*1.
In fiscal 2016, Sharp Group greenhouse gas (GHG) emissions from shipping activities in Japan were 17 thousand tons (down 14%from the previous fiscal year). For Sharp Corporation, energy intensity was improved by an average of 6.5% for the most recentfive years (fiscal 2012 to 2016). Sharp is steadily shifting from conventional trucking to more environmentally friendly modes oftransport, such as shipping (non-international coastal trading vessels) and rail (Japan Railways containers). And, by unloadingimported goods at harbors chosen for their proximity to their main sales locations, Sharp is reducing re-transport betweendistribution centers. These efforts enable Sharp to reduce the environmental impact of its distribution activities.
For shipment of mobile phones, Sharp has been certified with an Eco Rail Mark*2 by the Ministry of Land, Infrastructure,Transport, and Tourism and the Railway Freight Association.
Reducing the Environmental Impact of International Logistics
Sharp has a wide range of initiatives to reduce the amount of GHGs that are emitted as a result of international shipping. Thecompany is reducing airfreight volume as it switches to environmentally friendly modes of transport, and it is also improvingload efficiency. Further, it is reviewing shipping routes and switching to harbors that are closer to the final destinations forproducts. Sharp is also switching to suppliers located closer to its factories.
In fiscal 2016, GHG emissions from international transport by Sharp were 139 thousand tons, up 4% over the previous fiscal year.
Reducing Logistics-Related Environmental Impact
Fiscal 2016 Objectives Fiscal 2016 Achievements Self Evaluation*
■Energy intensity: Improve by average of 1% each year (average for fiscal 2012 to 2016)
■Energy intensity: Improved by average of 6.5% each year (average for fiscal 2012 to 2016)
★★★
Priority Objectives for Fiscal 2017 ■Energy intensity: Improve by average of 1% each year (average for fiscal 2013 to 2017)
*1 To shift freight transport from conventional trucking to more environmentally friendly modes of transport, such as rail and shipping.*2 Products or companies that use a certain amount of rail transport for freight are given Eco Rail Mark certification. The mark is used on items such as product packaging and brochures to
inform the public that a company uses environmentally friendly modes of transport.
29 32
24 19 17
0
10
20
30
40
2012 2013 2014 2015 2016
(Thousand tons CO2)
(Fiscal year)
■ GHG Emissions from Freight Shipments (Japan)
Eco Rail Mark on mobile phone packaging
51
Environmental Initiatives: Logistics
* Self evaluation: ★★★ Achieved more than targeted / ★★ Achieved as targeted / ★ Achieved to some extent

SHARP SUSTAINABILITY REPORT 2017
Recycling 4 Kinds of Home Appliances in Japan (Air Conditioners, TVs, Refrigerators, and Washing Machines)
As a member of the B Group*1 for home appliance recycling, Sharp has constructed—and is operating—a highly efficient recyclingsystem consisting of 19 recycling plants in Japan. In fiscal 2016, Sharp collected 1.493 million units (up 4% over the previousfiscal year) of the four types of appliances covered by the Home Appliance Recycling Act. The processed and recycled weightamounted to 49,000 tons (up 2% over the previous fiscal year). For all four appliance types, the B Group’s rate of recyclingexceeded the legally stipulated levels.
Expanding the Recycling of Used Products
Fiscal 2016 Objectives Fiscal 2016 Achievements Self Evaluation*
■Construct high-efficiency recycling line to deal with an increase in flat-panel TVs sent to recycling
■Installed advanced shredding/sorting system and developed new dismantling method ★★★
Priority Objectives for Fiscal 2017 ■Improve and expand high-efficiency recycling line for flat-panel TVs; raise value of collected materials
*1 The B Group consists of Sharp Corporation, Sony Corporation, Hitachi Appliances, Inc., Fujitsu General Ltd., Mitsubishi Electric Corporation, and other companies.
■ Sharp Corporation’s Recycling Results for 4 Home Appliance Types (Fiscal 2016)
Unit Air Conditioners CRT TVs Flat-Panel TVs Refrigerators/
Freezers
Washing Machines/
DryersTotal
Units collected from designated collection sites Thousand units 218 159 407 355 354 1,493
Processed and recycled units Thousand units 214 161 405 357 349 1,486
Processed and recycled weight Tons 8,808 3,941 7,940 21,821 13,080 55,590
Recycled weight Tons 8,354 2,997 7,211 17,751 12,288 48,601
Recycling rate % 94 76 90 81 93 -
Legally required recycling rate % 80 55 74 70 82 -
Effectively Using Resources and Improving Recycling Efficiency at the Recycling Plant
Sharp and Kansai Recycling Systems Co., Ltd.*2 are joining forces to make effectiveuse of resources and to improve recycling efficiency. With the 2020 Tokyo Olympicscoming up, growing demand is expected for replacement TVs. There is expected to bean accompanying increase in used flat-panel TVs being sent to recycling plants. Infiscal 2016, Kansai Recycling Systems installed an advanced shredding/sorting system.It also developed a new dismantling method for flat-panel TVs, in which the TV isdismantled from the front and the dismantling procedure from the back can beomitted. As a result, Kansai Recycling Systems was able to shorten dismantling timeby about 30%.*2 A consumer electronics recycling company established in Japan with joint investment from Sharp, Mitsubishi Materials
Corporation, and four other companies.Shredder for flat-panel TVs
Reusing and Recycling Copiers and MFPs in Japan
Sharp is reusing and recycling copiers and MFPs collected both through Sharp distribution channels and throughcommon industry channels. In fiscal 2016, approximately 26,000 used copiers and MFPs were collected for eitherreuse or recycling. The company is also collecting used toner cartridges and remanufacturing them to the samequality standard of new products, thus assuring that customers will always get the same high quality. Sharp designsits toner cartridges for easy reuse and recycling. This ensures durability and reduces the amount of time needed toreprocess used cartridges.
52
Environmental Initiatives: Recycling
* Self evaluation: ★★★ Achieved more than targeted / ★★ Achieved as targeted / ★ Achieved to some extent

SHARP SUSTAINABILITY REPORT 2017
Expanding Closed-Loop Plastic Material Recycling Technology
Sharp and Kansai Recycling Systems Co., Ltd.*2 jointlydeveloped closed-loop plastic material recyclingtechnology. This technology enables the repeatedrecovery of plastic from used consumer electronicsproducts as well as the reuse of that plastic in parts ofnew consumer electronics products for the Japanesemarket. This technology has been in practical use sincefiscal 2001.
The development of new technologies has enabledSharp to increase the volume of recyclable plastic yearafter year. These technologies include the following:
(1) a technology for recovering high-purity PP (polypropylene) from mixed plastic parts and parts that contain metal;
(2) a technology for improving the properties of recovered PP and PC+ABS*3 materials so that their quality is on a par with that of new materials;
(3) a technology that gives materials added value by imparting properties such as flame retardancy, weather resistance, and an antibacterial property, with the aim of expanding applications for recycled plastic;
(4) a quality-control technology for ensuring optimal quality.
Thanks to the development and introduction of thesetechnologies that integrate everything from recovery toquality control, Sharp has been able to establishclosed-loop material recycling to produce high-graderecycled plastic.
Environmental Technologies That Contribute to a Sustainable, Recycling-Based Society
Fiscal 2016 Objectives Fiscal 2016 Achievements Self Evaluation*
■Develop technology for the practical application of recycled plastic materials (flame-retardant HIPS*1)
■Imparted flame retardancy to recycled plastic materials (flame-retardant HIPS); established and put into practical use a formula for its repeated recycling• Material certified for UL94• Adopted for refrigerator terminal box
★★★
Priority Objectives for Fiscal 2017 ■Practical application of recycled plastic material (recovered composite PP)
*1 High-impact polystyrene (general-purpose polystyrene [GPPS] given impact resistance by adding rubber).
■ Recycling Plastic Recovered from the 4 Types of Home Appliances
*2 A consumer electronics recycling company established in Japan with joint investment from Sharp, Mitsubishi Materials Corporation, and four other companies.*3 A polymer alloy of polycarbonate and acrylonitrile, butadiene, and styrene (a resin given new properties as a result of mixing in several types of polymers).*4 Blending multiple types of resins and uniformly dispersing them into each other.*5 A resin given new properties as a result of mixing in several types of resins.
Dismantling by hand Coarse shredding
PP recovery
Make different resins compatible with one another*4, improve physical properties and durability
Flame retardancy, weather resistance, etc., pigmentation (to make foreign particles hard to see), polymer-alloy*5
Evaluate the amount of foreign particles mixed in, remaining life, etc.
Used home appliances (4 types)
Mixed plasticSingle-ingredient materials (product in parentheses indicates material source)
PP (washing machine)
GPPS (refrigerator)
HIPS (TV) PC+ABS (TV)
(1) High-purity PP separation
(2) Formula for improving properties (mix with additives)
(3) Formula for imparting new properties (mix with additives, blend resins)
(4) Quality control
Recycled plastic
53
Environmental Initiatives: Recycling
* Self evaluation: ★★★ Achieved more than targeted / ★★ Achieved as targeted / ★ Achieved to some extent

SHARP SUSTAINABILITY REPORT 2017
With rising demand for replacement TVs in the lead up to the Tokyo Olympics in 2020, the volume of used flat-panel TVsrecovered is expected to increase sharply. In order to make effective use of recovered materials, in fiscal 2016, Sharp developeda new recycled-plastic material. Sharp took flame-retardant high-impact polystyrene (HIPS) recovered from flat-panel TVs, whichhas high shock resistance and flame retardancy, and mixed it at an optimal ratio with general-purpose polystyrene (GPPS)recovered from refrigerators, which has high transparency, high rigidity, and good formability. Sharp then used its proprietaryprocessing technology to create a plastic that features the advantages of both materials. This new plastic material retains itsphysical properties and flame retardancy even when recycled five times. It has been certified for UL94 V0, a flame retardancystandard of the Underwriters Laboratories, a global safety standards certification body.
Because this recycled plastic material can be used over and over again, it is used in washing machines and refrigerators in Japan,which are items subject to the Home Appliance Recycling Act. Sharp will continue to develop new technologies based on thistechnology and pursue the effective utilization of limited resources.
Developing New Recycled-Plastic Material
■ Application Example of Flame-Retardant HIPS Recycled Plastic ■ Amount of Recycled Plastic Used (Cumulative)
SJ-GT42C-R refrigerator
Flame-retardant HIPS used for theterminal box on the back of therefrigerator
9 11
13 14 15
0
5
10
15
20
2012 2013 2014 2015 2016
(Thousand tons)
(Fiscal year)
54
Environmental Initiatives: Recycling

SHARP SUSTAINABILITY REPORT 2017
While Sharp’s business activities impact biodiversity, thecompany also benefits from the resources that biodiversityprovides. That is why the Sharp Group is carrying out amultifaceted approach in which it protects biodiversitythrough business activities and social action programs atworldwide bases.
Based on the Sharp Group Policy on the Sustainable Supportof Biodiversity, Sharp formulated the Sharp BiodiversityInitiative in fiscal 2009. The Initiative describes biodiversity inan easy-to-understand manner, and it outlines concretemeasures for business activities and social action programsthat take biodiversity into account.
Protecting Biodiversity
Communicating with Local CommunitiesSharp is committed to communicating with local communities through plant tours, planning of and participation in events, andproviding environmental education. The Nara Plant (Yamato-koriyama, Nara Prefecture) joined forces with the Koriyama Castle RuinsCherry Blossom Preservation Society, which was established for the purpose of protecting the cherry blossoms around the former siteof the Koriyama Castle, and helped clean up the area. This site has been designated as one of Japan’s top 100 cherry blossom spots.Meanwhile, Sharp (Phils.) Corporation, a production subsidiary in the Philippines, provided environmental education for elementaryschool students in the area. SPC employees gave lectures on environmental issues, including climate change.
Cleanup activities by the Koriyama Castle Ruins Cherry Blossom Preservation Society
Environmental education conducted by SPC
Preserving Biodiversity in Cooperation with the Local Community (Mie Plant)< Case Study >
*2 A pond for regulating the influx of rainwater into rivers.*3 Cleanup activities of the Sanagawa River, launched in 2004 as part of the Mie Plant’s local community contribution activities, spread throughout the
local community and were inaugurated as a community-led initiative in 2008.*4 The general category prize recognizes quality social capital that creates the charm and unique characteristics of a region and the relevant activities.
Releasing fish into the Sanagawa River
At the Mie Plant (Taki District, Mie Prefecture), Sharp is promoting efforts to conserve biodiversityin cooperation with the local community. The Sanagawa River, which flows close to the plant wasonce home to many forms of life, but in recent years, their numbers have declined due toenvironmental changes and other factors. Therefore, Sharp has been engaged in an initiative toprotect and breed the fish species that live in the river. The fish are bred in a regulating reservoir*2
on the plant grounds and then released into the river, in collaboration with a local organizationcalled the Association for the Beautification of the Sanagawa River*3. In fiscal 2016, about 1,300fish, including tamoroko, carp, and freshwater prawn, were released into the river. The activitiesof the Association for the Beautification of the Sanagawa River, including this initiative, wereselected for a prize in the general category of the 31st Handmade Hometown Awards*4, sponsoredby the Ministry of Land, Infrastructure, Transport, and Tourism.
■ Sharp’s Efforts for Protecting Biodiversity
Multifaceted approach
Direct conservation activitiesSharp Forests, cleanup, etc.
Foster biodiversity-minded employeesSharp Green Club*1 activities, etc.
Educate the general publicParticipate in environmental events, hold
environmental education, etc.
Efforts throughout the value chain
ProcurementProcure environmentally conscious parts and materials
DevelopmentDevelop environmentally conscious products and devices
ManufacturingReduce the amount of greenhouse gases and waste generated in factories
SalesReduce the amount of greenhouse gases and waste generated in offices
LogisticsShift modes of transportation to reduce CO2 emissions
Business activities
*1 A joint Sharp labor-management volunteer organization
55
Environmental Initiatives: Biodiversity Protection / Communication with Local Communities
Biodiversity Protection through Business and Social Action Programs
Social action programs