ENVIRONMENTAL IMPACTS OF ACTIVE AND DECOMMISSIONED ...
171
i ENVIRONMENTAL IMPACTS OF ACTIVE AND DECOMMISSIONED LANDFILL SITES IN THE ACCRA METROPOLIS: A CASE STUDY OF THE PANTANG AND MALLAM LANDFILL SITES BY REBECCA ANNORBAH (10396436) THIS THESIS IS SUBMITTED TO THE UNIVERSITY OF GHANA, LEGON IN PARTIAL FULFILMENT OF THE REQUIREMENT FOR THE AWARD OF MPHIL ENVIRONMENTAL SCIENCE DEGREE JUNE 2014 University of Ghana http://ugspace.ug.edu.gh
Transcript of ENVIRONMENTAL IMPACTS OF ACTIVE AND DECOMMISSIONED ...
i
ENVIRONMENTAL IMPACTS OF ACTIVE AND DECOMMISSIONED
LANDFILL SITES IN THE ACCRA METROPOLIS: A CASE STUDY OF
THE PANTANG AND MALLAM LANDFILL SITES
BY
REBECCA ANNORBAH
(10396436)
THIS THESIS IS SUBMITTED TO THE UNIVERSITY OF GHANA,
LEGON IN PARTIAL FULFILMENT OF THE REQUIREMENT FOR
THE AWARD OF MPHIL ENVIRONMENTAL SCIENCE DEGREE
JUNE 2014
University of Ghana http://ugspace.ug.edu.gh
ii
DECLARATION
This is to certify that this thesis is the result of research undertaken by Rebecca Annorbah
towards the award of Mphil Environmental Science Degree in the Institute of
Environment and Sanitation Studies, Department of Science, University of Ghana.
Signature…………………………….. ……...………………….
RebeccaAnnorbah Date
(Student)
Signature…………………………….. ……...………………….
Prof. F. K Nyame Date
(Supervisor)
Signature…………………………….. ……...………………….
Dr. Adelina Mensah Date
(Co - Supervisor)
University of Ghana http://ugspace.ug.edu.gh
iii
ABSTRACT
The study investigated the impacts of the Pantang and Mallam landfill sites in the Greater
Accra Region on the surrounding environment. The Pantang landfill site is an active site
that still receives waste of all kinds from various parts of Accra. The Mallam landfill, on
the other hand, was decommissioned over a decade ago. Samples of leachate from the
two landfill sites and air in the vicinity of the respective sites were taken over a period of
three months and analysed. Soil samples were also taken from locations upslope and
down slope of the Pantang landfill site and ground water was sampled from two wells,
one about 30 metres from the Pantang landfill and the other about 150 metres away from
the Pantang landfill site. The leachate, air, soil and groundwater samples were analysed in
the laboratory for their physical and chemical constituents. Leachate, air, soil and
groundwater samples from the Pantang landfill were coded PL, PA, PS and PG,
respectively, and leachate and air from the Mallam landfill were coded M1L, MA.
The pH of leachate from Pantang landfill ranged from 8.00-8.9 pH units (mean 8.35). The
highest pH of leachate from the Pantang landfill was measured in March and the least in
April. The turbidity of leachate from the Pantang landfill ranged from 93-309 NTU
(mean 213.97). The highest turbidity of leachate from the Pantang landfill was measured
in March and the least in February. The PM10 in air sampled from the vicinity of the
Pantang landfill a ranged from 250.00 - 680.56 ug/m3 (mean 527.78). The highest PM10
of air sampled from the vicinity of the Pantang landfill was recorded in April and the
least in March. The TSP in air sampled from the vicinity of the Pantang landfill a ranged
from ranged from 291.67 - 875.00 ug/m3 (mean 665.56). The highest TSP of air sampled
from the vicinity of the Pantang landfill was recorded in April and the least in March.
University of Ghana http://ugspace.ug.edu.gh

iv
The pH of soil sampled from the vicinity of the Pantang landfill ranged from 8.07 - 8.97
pH units (mean of 8.51) and the soil organic matter content from 4.243- 10.659 mg/kg
(mean 7.523 mg/kg). The highest pH of soil sampled from the vicinity of the Pantang
landfill was measured in February and the least in March. The highest soil organic matter
content was measured in March and the least also in March but at different sampling
locations. The pH of groundwater sampled from the Pantang landfill ranged of 6.84-7.4
pH units (mean 7.180) for well one and 7.56-8.6 (mean 8.06) for well two. The turbidity
of groundwater sampled from the Pantang landfill ranged from 3.1- 4.6NTU (mean 4.0)
for well one and 31.4-35 (mean 33.70) for well two.
The pH of the leachate sampled from the Mallam landfill ranged from 8.15 -8.90 (mean
8.39). The highest pH of the leachate sampled from the Mallam landfill was measured in
February and the least in March. The turbidity of the leachate sampled from the Mallam
landfill ranged from 194 – 127 NTU (mean 152). The highest turbidity of the leachate
sampled from the Mallam landfill was measured in March and the least in February and
April. The PM10 of the air sampled from the vicinity of the Mallam landfill ranged from
13.89 - 27.78 (mean 23.15). The highest PM10 of the air sampled from the vicinity of the
Mallam landfill was recorded in April and the least in March. The TSP of the air sampled
from the vicinity of the Mallam landfill ranged from ranged from 27.78 - 41.67 ug/m3
(mean 37.04). The highest TSP of the air sampled from the vicinity of the Mallam landfill
was recorded in April and the least in March. The assessments from the study showed
that leachates from both landfills are polluted and may be impacting on the surrounding
environment possibly especially on the soil and groundwater system.
University of Ghana http://ugspace.ug.edu.gh

v
DEDICATION
I dedicate this thesis to the glory of the Lord and to my family.
University of Ghana http://ugspace.ug.edu.gh

vi
ACKNOWLEDGEMENT
My sincere thanks first and foremost go to the Lord Almighty. My thanks also go to my
supervisors Prof. F. K. Nyame and Dr. Adelina Mensah. I also express my gratitude to
“Carnegie Next Generation of Academics in Africa Project (CNGAA), University of
Ghana, Legon.” for granting me financial assistance. I also express my utmost gratitude
to Environmental Protection Agency for granting me access to their laboratory and
monitoring equipments.
University of Ghana http://ugspace.ug.edu.gh

vii
TABLE OF CONTENTS
CONTENTS PAGE
DECLARATION………………………………………………………………………… ii
ABSTRACT……………………………………………………………………................. iii
DEDICATION…………………………………………………………………………… v
ACKNOWLEDGEMENT………………………………………………………………. vi
TABLE OF CONTENTS………………………………………………………................. vii
LIST OF FIGURES……………………………………………………………………..... xiii
LIST OF TABLES……………………………………………………………………...... xv
APPENDICES…………………………………………………………………………… xvi
CHAPTER ONE………………………………………………………………………… 1
INTRODUCTION………………………………………………………………………. 1
1.1. Background…………………………………………………………………………. 1
1.2. Problem statement…………………………………………………………................. 5
1.3. Broad and specific objectives ……………………………………………………… 6
CHAPTER TWO………………………………………………………………………… 7
LITERATURE REVIEW………………………………………………………………… 7
2.1. Definitions of waste and Classification of Waste…………………………………… 7
2.2. Municipal Solid Waste Management………………………………………................ 8
2.2.1. Waste sorting and storage………………………………………………………… 9
2.2.2. Waste collection, handling and transportation…………………………………… 9
2.2.3. Waste Processing and disposal…………………………………………………… 10
2.3. Waste Degradation…………………………………………………………………… 13
2.3.1 Initial adjustment, transition and acid formation…………………………................ 13
2.3.2. Methane fermentation and Maturation…………………………………………..... 14
2.4. Leachate and Landfill Gas Production…………………………………………........ 15
University of Ghana http://ugspace.ug.edu.gh
viii
2.4.1. Factors that influence Leachate and Landfill Gas Production……………............... 15
2.4.2. Leachate composition and characteristics………………………………………..... 16
2.4.3. Landfill leachate and Gas Generation Stages……………………………................ 21
2.4.4. Leachate treatment techniques…………………………………………………...... 23
2.5. Landfill Sites………………………………………………………………………… 25
2.5.1. Landfill Site Selection, Design and Operation…………………………………… 26
2.5.2. Landfill Site Operation and Decommissioning…………………………………… 28
2.6. Environmental Problems Associated with Landfills………………………………… 29
CHAPTER THREE…………………………………………………………………….... 34
MATERIALS AND METHODS………………………………………………………… 34
3.1. Study sites…………………………………………………………………………… 34
3.1.1. Demographic characteristics, climate and vegetation……………………………… 35
3.1.2. Soil and Agricultural Land use…………………………………………………… 36
3.1.3. Relief and Drainage……………………………………………………………… 38
3.1.4. Waste Management………………………………………………………………… 39
3.2. Reconnaissance survey……………………………………………………………… 39
3.3. Sampling and Analytical Methods…………………………………………………… 42
3.3.1. Leachate and groundwater………………………………………………………… 42
3.3.2. Air………………………………………………………………………………… 48
3.3.3 Soil……………………………………………………………………………….... 50
3.3.4. Pollution Indexes………………………………………………………………… 53
CHAPTER FOUR ……………………………………………………………………… 57
RESULTS AND DISCUSSION………………………………………………………… 57
4.1. LEACHATE……………………………………………………………………….... 57
4.1.1. pH…………………………………………………………………………………. 57
University of Ghana http://ugspace.ug.edu.gh
ix
4.1.2. Dissolved Oxygen (DO)…………………………………………………………… 58
4.1.3. Total suspended solids (TSS)……………………………………………................. 59
4.1.4. Turbidity (Tur) …………………………………………………………………… 60
4.1.5. Electrical conductivity (EC)……………………………………………………… 61
4.1.6. Total dissolved solids (TDS)……………………………………………………… 62
4.1.7. Biological oxygen demand (BOD)………………………………………………… 64
4.1.8. Chemical oxygen demand (COD)………………………………………………… 65
4.1.9. Nitrate (NO3)……………………………………………………………………… 66
4.1.10. Nitrite (NO2)……………………………………………………………..……… 67
4.1.11. Ammonia (NH3)………………………………………………………………… 68
4.1.12. Total Phosphorus (TP)…………………………………………………………… 69
4.1.13. Sulphate (SO4)…………………………………………………………………… 70
4.1.14. Sulphite (SO3)…………………………………………………………………… 71
4.1.15. Zinc (Zn)………………………………………………………………………… 72
4.1.16. Copper (Cu)……………………………………………………………………… 73
4.1.17. Chromium (Cr)…………………………………………………………..……… 74
4.1.18. Lead (Pb)………………………………………………………………………… 76
4.1.19. Manganese (Mn)………………………………………………………………… 77
4.1.20. Iron (Fe)………………………………………………………………………… 78
4.1.21. Cadmium (Cd) …………………………………………………………..……… 79
4.1.22. Nickel (Ni)………………………………………………………………..……… 80
4.1.23. Leachate Pollution Indexes……………………………………………………… 81
4.2. AIR………………………………………………………………………….………. 82
4.2.1. Particulate matter (PM10)………………………………………………….……… 82
4.2.2. Total suspended solids (TSP)……………………………………………...……… 83
University of Ghana http://ugspace.ug.edu.gh
x
4.2.3. Carbon monoxide (CO)…………………………………………………………… 85
4.2.4. Ammonia (NH3)…………………………………………………………..……… 85
4.2.5. Sulphur dioxide (SO2)…………………………………………………….……… 86
4.2.6. Zinc (Zn)…………………………………………………………………..……… 87
4.2.7. Nickel (Ni)………………………………………………………………………… 88
4.2.8. Copper (Cu)……………………………………………………………………… 88
4.2.9. Manganese (Mn)………………………………………………………….……… 89
4.2.10. Chromium (Cr)…………………………………………………………………… 89
4.2.11. Cadmium (Cd) …………………………………………………………………… 90
4.2.12. Lead (Pb)………………………………………………………………………… 91
4.2.13. Iron (Fe)………………………………………………………………….……… 92
4.2.14 Air Quality Index………………………………………………………………… 93
4.3 Soil…………………………………………………………………………..………. 94
4.3.1. pH………………………………………………………………………….……… 94
4.3.2. Percentage Organic carbon (%OC)………………………………………..……… 94
4.3.3. Percentage Organic matter (%OM)………………………………………..……… 95
4.3.4. Electrical conductivity (EC)……………………………………………….……… 95
4.3.5. Nitrate (NO3)……………………………………………………………………… 96
4.3.6. Ammonia (NH3)…………………………………………………………..……… 97
4.3.7. Manganese (Mn)…………………………………………………………..…….. 97
4.3.8. Copper (Cu)………………………………………………………………..……… 98
4.3.9. Zinc (Zn)…………………………………………………………………..……… 99
4.3.10. Iron (Fe)………………………………………………………………….……… 99
4.3.11. Chromium (Cr)…………………………………………………………..……… 99
4.3.12. Lead (Pb)………………………………………………………………………… 100
University of Ghana http://ugspace.ug.edu.gh
xi
4.3.13. Cadmium (Cd)…………………………………………………………………… 101
4.3.14. Nickel (Ni)……………………………………………………………….……… 101
4.3.15. Contamination Factor and Pollution Load Index………………………...……… 102
4.4. GROUNDWATER………………………………………………………………… 104
4.4.1. pH………………………………………………………………………………… 104
4.4.2. Total suspended solids (TSS)……………………………………………………… 105
4.4.3. Turbidity (Tur)…………………………………………………………………… 106
4.4.4. Electrical conductivity (EC)……………………………………………………… 107
4.4.5. Total dissolved solids (TDS)……………………………………………………… 108
4.4.6. Biological oxygen demand (BOD)……………………………………….……… 109
4.4.7. Chemical oxygen demand (COD)………………………………………………… 109
4.4.8. Dissolved oxygen (DO)…………………………………………………………… 111
4.4.9. Nitrate (NO3)……………………………………………………………..………… 111
4.4.10. Nitrite (NO2)……………………………………………………………………… 113
4.4.11. Ammonia (NH3)………………………………………………………………… 113
4.4.12. Total phosphorus (TP)…………………………………………………………… 114
4.4.13. Sulphate (SO4)…………………………………………………………………… 114
4.4.14. Sulphite (SO3)…………………………………………………………………… 116
4.4.15. Zinc (Zn)………………………………………………………………………… 116
4.4.16. Copper (Cu)……………………………………………………………………… 117
4.4.17. Chromium (Cr)…………………………………………………………..……… 117
4.4.18. Manganese (Mn)…………………………………………………………………. 118
4.4.19. Iron (Fe)………………………………………………………………….……… 119
4.4.20. Cadmium (Cd)…………………………………………………………………… 119
4.4.21. Nickel (Ni)……………………………………………………………….……… 120
University of Ghana http://ugspace.ug.edu.gh

xii
4.4.22. Kerndoff Contamination Factor………………………………………….……… 124
4.5. CORRELATION ANALYSIS OF PARAMETERS……………………….……….. 125
CHAPTER FIVE…………………………………………………………………………. 127
CONCLUSION AND RECOMMENDATIONS……………………………….……….. 127
5.1. CONCLUSION……………………………………………………………..……….. 127
5.2. RECOMMENDATIONS……………………………………………………………. 129
REFERENCE……………………………………………………………………………. 130
APPENDICES…………………………………………………………………..……….. 142
LIST OF ABBREVIATIONS AND ACRONYMS……………………………..………. 155
University of Ghana http://ugspace.ug.edu.gh
xiii
LIST OF FIGURES
Figure 3.1: Research locations at the Pantang landfill. 40
Figure 3.2: Research locations at the Mallam landfill. 41
Figure 4.1: Plot of DO for leachate from the Pantang and Mallam landfill sites. 59
Figure 4.2: Plot of total dissolved solid (TDS) for leachate from the Pantang and Mallam
landfill sites.
63
Figure 4.3: Plot of chemical oxygen demand (COD) for leachate from the Pantang and
Mallam landfill sites.
66
Figure 4.4: Plot of Ammonia (NH3) for leachate from the Pantang and Mallam landfill sites. 69
Figure 4.5: Plot of Sulphite (SO3) for leachate from the Pantang and Mallam landfill sites. 72
Figure 4.6: Plot of Chromium (Cr) for leachate from the Pantang and Mallam landfill sites. 75
Figure 4.7: Plot of Cadmium (Cd) for leachate from the Pantang and Mallam landfill sites. 80
Figure 4.8: Plot of Particulate matter (PM10) and Total suspended particles (TSP) for air
sampled from the Pant.ang and Mallam landfill sites.
84
Figure 4.9: Plot of Sulphur dioxide (SO2) and Zinc (Zn) for air sampled from the Pantang
and Mallam landfill sites.
87
Figure 4.10: Plot of Manganese (Mn) and Chromium (Cr) for air sampled from the Pantang
and Mallam landfill sites.
90
Figure 4.11: plot of Cadmium (Cd) and Lead (Pb) for air sampled from the Pantang and
Mallam landfill sites.
92
Figure 4.12: Plot of Percentage organic matter (%OM) and Electrical conductivity (EC) for
soil sampled from the Pantang landfill sites.
96
Figure 4.13: Plot of Manganese (Mn) and Copper (Cu) for soil sampled from the Pantang
landfill site.
98
Figure 4.14: Plot of Chromium (Cr) and Lead (Pb)) for soil sampled from the Pantang
landfill site.
100
Figure 4.15: Plot of Total suspended solids (TSS) and Turbidity (Tur) for groundwater 107
University of Ghana http://ugspace.ug.edu.gh
xiv
sampled from the wells (PG1) and (PG2) located close to the Pantang landfill site.
Figure 4.16: Plot of Biological oxygen demand (BOD) and Chemical oxygen demand
(COD) for groundwater sampled from the wells (PG1) and (PG2) located close to the
Pantang landfill site.
110
Figure 4.17: Plot of Dissolved oxygen (DO) and Nitrate (NO3) for groundwater sampled
from the wells (PG1) and (PG2) located close to the Pantang landfill site.
112
Figure 4.18: Plot of Total phosphorus (TP) and Sulphate (SO4) for groundwater sampled
from the wells (PG1) and (PG2) located close to the Pantang landfill site.
115
Figure 4.19: Plot of Copper (Cu) and Chromium (Cr) for groundwater sampled from the
wells (PG1) and (PG2) located close to the Pantang landfill site.
118
Figure 4.20: Plot of Cadmium (Cd) and Nickel (Ni) for groundwater sampled from the wells
(PG1) and (PG2) located close to the Pantang landfill site.
120
University of Ghana http://ugspace.ug.edu.gh

xv
LIST OF TABLES
Table 4.1: LPI for leachates from the Pantang and Mallam landfill sites. 82
Table 4.2: Air Quality Index for the Pantang and Mallam sites. 93
Table 4.3: Basic statistical analysis of parameters determined on soil from the Pantang
landfill site.
102
Table 4.4: Contamination Factor and Pollution Load Index on soil from the Pantang
landfill site.
103
Tables 4.5: Basic statistical analysis of parameters determined on groundwater sampled
from the Pantang landfill site.
122
Tables 4.6: Monthly results obtained for groundwater sampled from the wells (PG1) and
(PG2) located close to the Pantang landfill site.
123
Table 4.7: Kerndoff Contamination Factor for PG1. 124
University of Ghana http://ugspace.ug.edu.gh
xvi
APPENDICES
APPENDIX 1: Research locations on the Pantang and Mallam landfill sites. 142
APPENDIX 2: Basic statistical analysis of parameters determined on leachate
sampled from the Pantang and Mallam landfill sites.
144
APPENDIX 3: Concentration of parameters for leachate sampled from the Pantang
landfill site during the sampling period.
145
APPENDIX 4: Concentration of parameters for leachate sampled from the Mallam
landfill site during the sampling period.
146
APPENDIX 5: Basic statistical analysis of parameters determined on air sampled
from the Pantang and Mallam landfill sites
147
APPENDIX 6: Concentration of parameters for air sampled from the Pantang and
Mallam landfill sites during the sampling period.
148
APPENDIX 7: Concentration of parameters for soil sampled from the Pantang landfill
site during the sampling period.
149
APPENDIX 8: Correlation matrix for leachate where the bottom is the correlation
coefficient for Pantang leachate (PL) and the top is the correlation coefficient for
Mallam leachate (ML).
150
APPENDIX 9: Correlation matrix for air where the bottom is the correlation
coefficient for Pantang air and the top is the correlation coefficient for Mallam air.
151
APPENDIX 10: Correlation coefficients for soil parameters determined at the Pantang
landfill.
152
APPENDIX 11: correlation coefficient for groundwater where the bottom is the
correlation coefficient for PG1and the top is the correlation coefficient for PG2.
153
APPENDIX 12: Photos of research site. 154
University of Ghana http://ugspace.ug.edu.gh

1
CHAPTER ONE
INTRODUCTION
1.1. Background
Population growth, industrialization, economic development and increased consumption
have led to increase in world waste generation. As of July 2013, world population was
estimated to be 7.149 billion (United States Census Bureau, 2013). The population of the
world is estimated to increase to 8.3 billion in 2025 and 10.9 billion by 2050 (UN, 2012).
The world generated a total of 1.3 billion tonnes of waste in 2010 and this is expected to
increase to approximately 2.2 billion tonnes per year by 2025 in response to population
growth. The increase in world waste to approximately 2.2 billion tonnes per year by 2025
would mean an increase in per capita waste generation rate from 1.2 to 1.42 kg per person
per day in the next fifteen years. Accra, the capital town of Ghana had a population of
1,695,136 million in 2000 (Ghana Statistical Services, 2012).
In a time span of ten years, this increased to a population of 1,848,614 million (Ghana
Statistical Services, 2012). This population growth has been accompanied by very little
improvement in waste management and sanitation facilities. The implications are that
more people are exposed to health hazards and diseases associated with poor sanitation
conditions. Ghana generates thirteen thousand tonnes of waste daily, with Accra alone
contributing two thousand five hundred (2,500) tonnes to that total. Out of the two
thousand five hundred (2,500) tonnes of waste Accra generates per day, an average of
1,250 tonnes is collected daily and hauled to Pantang dump site and Tema landfill site
(Accra Metropolitan Assembly, 2013). Four hundred (400) tonnes of waste is left
University of Ghana http://ugspace.ug.edu.gh
2
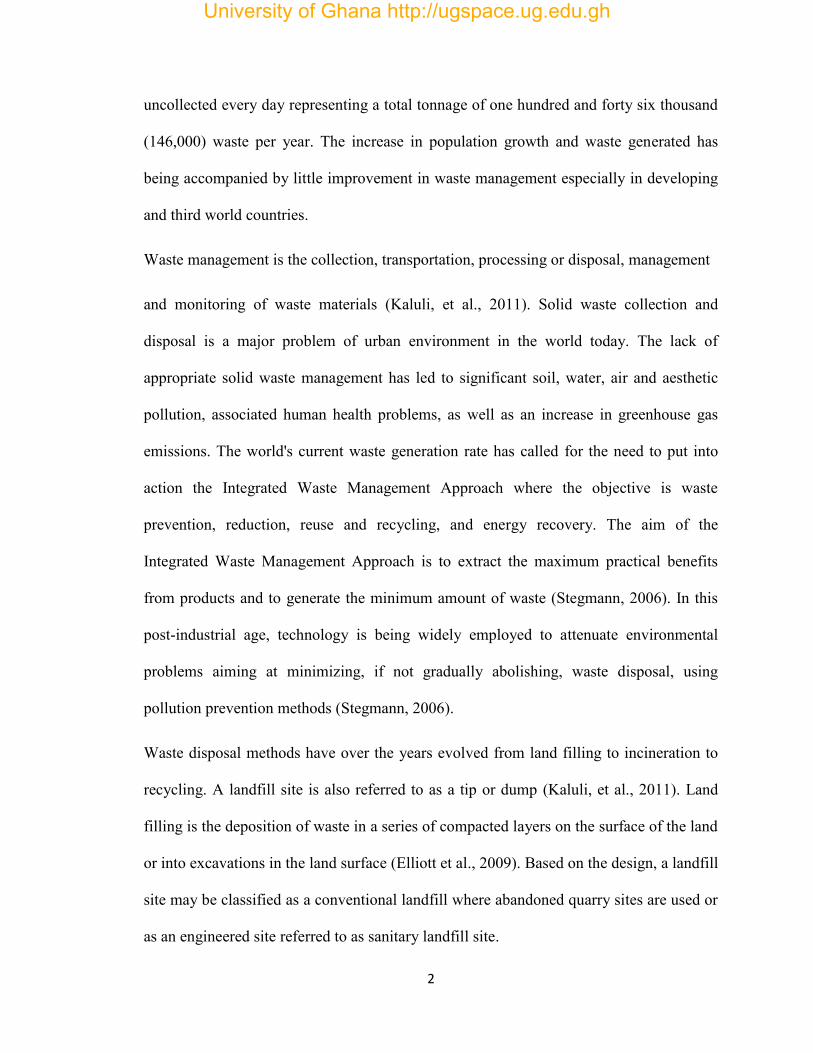
uncollected every day representing a total tonnage of one hundred and forty six thousand
(146,000) waste per year. The increase in population growth and waste generated has
being accompanied by little improvement in waste management especially in developing
and third world countries.
Waste management is the collection, transportation, processing or disposal, management
and monitoring of waste materials (Kaluli, et al., 2011). Solid waste collection and
disposal is a major problem of urban environment in the world today. The lack of
appropriate solid waste management has led to significant soil, water, air and aesthetic
pollution, associated human health problems, as well as an increase in greenhouse gas
emissions. The world's current waste generation rate has called for the need to put into
action the Integrated Waste Management Approach where the objective is waste
prevention, reduction, reuse and recycling, and energy recovery. The aim of the
Integrated Waste Management Approach is to extract the maximum practical benefits
from products and to generate the minimum amount of waste (Stegmann, 2006). In this
post-industrial age, technology is being widely employed to attenuate environmental
problems aiming at minimizing, if not gradually abolishing, waste disposal, using
pollution prevention methods (Stegmann, 2006).
Waste disposal methods have over the years evolved from land filling to incineration to
recycling. A landfill site is also referred to as a tip or dump (Kaluli, et al., 2011). Land
filling is the deposition of waste in a series of compacted layers on the surface of the land
or into excavations in the land surface (Elliott et al., 2009). Based on the design, a landfill
site may be classified as a conventional landfill where abandoned quarry sites are used or
as an engineered site referred to as sanitary landfill site.
University of Ghana http://ugspace.ug.edu.gh
3
It may also be classified as hazardous, non- hazardous and inert landfill sites based on the
toxicity of the waste it receives (Elliott et al., 2009). Historically land filling is the most
common and oldest method of organized waste disposal and remains so in many places
around the world including Ghana (Elliott et al., 2009). The amount of municipal solid
waste generated in the U.S. and which was disposed of in 1,908 landfills in 2011 was
reported to be 53.6% (U.S.EPA, 2013). England had forty four percent (44%) of its 68
million tonnes of waste produced in 2002/2003 being land filled (U.S.EPA, 2013). India
and China landfills seventy to eighty percent (70-80%) of the waste they generate.
Canada landfills eighty percent of its waste (U.S.EPA, 2013). Developing countries like
Senegal, Mali, Ghana and Nigeria still have most of their waste ending up in open dump
systems unlike the US, Canada and England that have their waste being sent to sanitary
landfills.
Land filling in most developing countries including Ghana as a waste management option
has been nothing more than uncontrolled dumping and discharge into riverbeds, marshy
lands, wetlands and old quarry sites. Land filling as a method of waste disposal has its
advantages and disadvantages. The advantages are that well planned landfills can be
monitored and reclaimed, waste going into it can be processed to remove all recyclable
materials before tipping and methane produced by decomposing organic materials
captured (Elliott et al., 2009). The disadvantage is that compared to modern and current
waste management methods, land filling as a means of waste management still remains
the method most likely to pose environmental and health threats.
University of Ghana http://ugspace.ug.edu.gh
4
Air Pollution, ground and surface water pollution, soil pollution and loose waste are the
main challenges of landfills around the globe (Afzal et al., 2000). Degradation of the
organic component of waste by microbial activities releases leachate and gases into the
environment. Landfills especially those lacking liners, leachate and gas monitoring
systems have their surrounding environs being often heavily polluted. Landfills may have
the leachate and gases emanating from them polluting surface and ground water bodies
and air respectively.
The gaseous substances emitted during the biodegradation of the organic component in
waste pollute the ambient air in the vicinity of landfills. Methane which is produced by
anaerobic decomposition is a major land fill gas which is a more potent greenhouse gas
than carbon dioxide. The flaring of gases especially methane, carbon dioxide and sulphur
compounds from landfills have the possibility of reducing ambient air quality and also
enhancing greenhouse effects (U.S.EPA, 2013).
In the US, landfills are the third largest source of anthropogenic methane (U.S.EPA,
2013). According to Lee and Jones, (1991) approximately seventy five percent (75%) of
the estimated 75,000 sanitary landfills in the United States pollute adjacent groundwater
with leachate. Soil pollution may also be observed as leachate migrates through the soil
to join ground water. Soil pollution may be observed as acidification, loss of soil fertility,
loss of soil flora and fauna and reduced microbial activity caused by the deposition of
chemical contaminants. Loss of general aesthetics through littering and choking of gutters
results in reduced property value. Poorly covered landfill waste gets exposed and attracts
vectors and disease carrying vermin of all type.
University of Ghana http://ugspace.ug.edu.gh
5
1.2. Problem statement
Many Metropolitan, Municipal and District Assemblies in Ghana face huge challenges on
the management of waste, especially of waste disposal. In Accra, for example, the
Metropolitan Assembly has had serious conflicts with residents and communities within
areas intended or earmarked for waste disposal (Accra Metropolitan Assembly, 2013).
Many residents confront the Assembly and often vehemently prevent dumping of waste
near their areas of residence due to the perception of adverse environmental impacts on
land, soil, air and water especially when dumping is close to residential areas.
Areas surrounding or close to active or abandoned landfill sites have also been
encroached upon and many now serve as residential areas for some low to middle income
dwellers. Two such landfills in the Accra Metropolis are the Mallam landfill site which
was decommissioned in May 2001 and the Pantang landfill site which at present is the
only active landfill in Accra (Accra Metropolitan Assembly, 2013).
Several studies have been undertaken to assess the impact of landfills on the environment
in Ghana. Osei et al. (2011) assessed and evaluated the extent of contamination of the
surrounding environment by leachate from the Oblogo landfill. Nyame et al. (2012)
studied the decommissioned Mallam landfill site to assess the hydrochemistry of leachate
from the site. Akiti et al. (2012) studied the possible impact of the percolation of leachate
from the Oblogo landfill on unsaturated zone water quality.
Most of these studies did not, however, compare likely impacts of decommissioned or
abandoned landfills with active or existing landfills that still receive huge volumes of
mostly heterogeneous waste. Since factors such as the age, waste stream, climate, rate of
University of Ghana http://ugspace.ug.edu.gh
6
dumping and degradation of landfill material could potentially influence its
environmental impacts, a study that involves both an existing or active landfill and a
decommissioned or abandoned landfill could help provide invaluable information for the
management of landfills in a rapidly urbanizing city such as Accra. This study was
therefore undertaken to acquire data in order to assess the environmental impacts of the
active Pantang landfill and decommissioned Mallam landfill sites in the Accra
metropolis.
1.3. Broad and specific objectives
The broad objective of the study was to assess the impacts of the active Pantang landfill
and decommissioned Mallam landfill sites on the environment by determining the
physico-chemical properties of leachate, soil, groundwater and air sampled from the
Pantang landfill and leachate and air sampled from the Mallam landfill.
To achieve the above broad objective, the following specific objectives were addressed:
i. determining the composition of leachates generated at the research sites.
ii. assessing the quality of the ambient air, soil and groundwater at the sites.
iii. comparing the possible extents of pollution at or around the two landfill sites.
University of Ghana http://ugspace.ug.edu.gh
7
CHAPTER TWO
LITERATURE REVIEW
2.1. Definitions of waste and classification of waste
Waste refers to any material that is of no further use to the owner use in terms of his/her
own purposes of production, transformation or consumption and for that reason is
discarded (Taylor and Allen, 2013). The United Nations Environment Programme
according to the Basel Convention defined waste as substances or objects which are
disposed of or are intended to be disposed of.
The type of waste generated has evolved over the years with development of technology.
Waste generated in recent times has high components of less biodegradable materials
with the introduction of rubbers and plastics. Wastes generated by humans range from
relatively innocuous substances such as food and paper waste to toxic substances such as
paint, batteries, asbestos, healthcare waste, sewage sludge derived from wastewater
treatment and radioactive waste in the form of spent nuclear fuel rods. Waste generated
by human activities can be classified into commercial and non-hazardous industrial
wastes, hazardous (toxic) industrial wastes, construction and demolition waste and
municipal solid waste based on its origin and risk to human and environmental health
(Taylor and Allen, 2013). Waste can also be classified based on its nature and state as
solid, liquid and gaseous; and based on the type, waste is classified as organic and
inorganic (Taylor and Allen, 2013).
Municipal Solid Waste refers to trash or garbage created when everyday items are used
and discarded by the public (US.EPA, 2013). The UN Conference on Environment and
University of Ghana http://ugspace.ug.edu.gh
8
Development; defines municipal solid waste to includes all domestic and non-hazardous
waste such as commercial or institutional waste, street sweeping and construction debris.
According to the European Union (1999), municipal solid waste refers to waste from
households as well as other waste which because of its nature and composition is similar
to waste from households.
Municipal solid waste consist mostly of household or domestic waste, sanitation waste
and demolition debris collected by or on behalf of municipal authorities and disposed
through the waste management system. The sources of municipal solid waste include
homes, offices, municipalities, markets, institutions and industries that generate non-
hazardous waste (Thomas and Hoomwey, 1999). The amount of Municipal Solid Waste
generated and its composition is influenced by urbanization, changing lifestyle and food
habits.
2.2. Municipal solid waste management
Waste Management may be defined as the discipline associated with the control of
generation, storage, collection, transfer and transport, processing and disposal of solid
waste in a manner that is in accordance with the best principles of public health,
economics, engineering, conservation, aesthetics and environmental consideration
(Kumar et al., 2002). Waste management also includes all administrative, financial, legal,
planning and engineering functions involved in the spectrum of solutions to problems of
solid waste (Tchobanaglous et al., 1997). Waste management is undertaken to reduce
waste effect on health, the environment and its aesthetics. Waste management involves
University of Ghana http://ugspace.ug.edu.gh
9
waste sorting and storage, collection, handling and transportation, processing and
disposal.
2.2.1. Waste sorting and storage
Waste sorting involves the separation of waste into various components such as organic
and inorganic materials or ferrous and non-ferrous metals. Sorting may be at the
household, community bin, transfer station or centralized sorting facility, processing site
or the Landfill site. In Ghana, waste sorting is not properly incorporated in the waste
management stream. It is only in recent times that individuals have made the collections
of plastic water sachets as their work. The plastic water sachets are sold to industries to
produce plastic chairs, dust pans, waste bins etc. Sorting operations can be carried out
manually, semi-mechanised or fully mechanised (Benneh et al., 1993).
Waste storage is the temporal holding of waste at the household or community before
final disposal. Open ground storage was very common in the past. Wastes are now stored
in waste bins of various sizes. The waste bins may be made of plastic or metal. Storage of
wastes is done at the source, community level and transfer stations (Benneh et al., 1993).
2.2.2. Waste collection, handling and transportation
Waste collection involves gathering solid waste and recycling materials and transferring
them to either a processing or disposal site. Domestic waste collection services are often
provided by local government authorities, or by private companies in the industry
(Benneh et al., 1993). In Accra, waste collection is the responsibilities of the Accra
University of Ghana http://ugspace.ug.edu.gh
10
Metropolitan Assembly. Through public private partnership, companies such as
Zoomlion, Asadu, etc collect waste on behalf of the Accra Metropolitan Assembly
Waste collection methods include:
i. Community bins where waste containers are placed at specific points where
members of a community carry their waste to.
ii. Door-to-Door Collection where waste is placed at the doorstep at a set day/time
when the waste collector arrives.
iii. Block collection where the collection vehicles arrive at a particular place or a set
day and time to collect waste from the households. Households bring their waste
containers and empty directly into the vehicle.
iv. Curbside collection where the homeowner is responsible for placing the
containers to be emptied at the curb on the collection day and for returning the
empty containers to their storage location until the next collection
(Tchobanoglous et al., 1993)
v. Waste handling and transportation involves the transfer of wastes from smaller
collection vehicles to larger transport vehicles and, the subsequent transport of the
wastes over long distances, to a processing or disposal site.
2.2.3. Waste processing and disposal
Solid waste processing reduces the amount of material requiring disposal and, in some
cases produces a useful product. Waste processing may be done at the source of waste
generation or at a waste processing plant away from the source. The primary goal is to
University of Ghana http://ugspace.ug.edu.gh
11
achieve maximum recovery of waste materials. Waste processing techniques include the
following:
Recycling and reuse which is a practice where materials destined for disposal are
collected, reused, reprocessed or remanufactured. The materials from which the items are
made can be reprocessed into new products. The most common consumer products
recycled include aluminium, copper, polyethylene and glass.
Composting of waste is the biological process of decomposition where organic waste is
acted upon by bacteria under controlled ventilation, temperature and moisture (Kumar et
al., 2002). The resulting humus is used for agricultural or landscaping purposes and the
methane gas generated is captured and used for generating electricity and heat.
Energy recovery is where waste can be processed to recover the energy in it. This can be
done through biochemical conversion where organic matter is decomposed by microbial
bacteria action to release energy or by thermo- chemical conversion where organic matter
is decomposed by heat. The potential of recovery of energy from waste is determined by
the quantity of waste, and the physical and chemical characteristic of the waste. The
physical characteristics considered are the size of the waste constituents, waste density
and moisture content. Smaller sized waste constituents aid in faster decomposition of the
waste. Waste of high density reflects a high proportion of biodegradable organic matter
and moisture. High moisture content causes biodegradable waste fraction to decompose
more rapidly than in dry conditions.
The bio-chemical conversion process is based on the enzymatic decomposition of organic
matter by microbial action to produce methane gas. It is preferred for wastes having high
percentage of organic biodegradable matter and high level of moisture content, which
University of Ghana http://ugspace.ug.edu.gh

12
aids microbial activity. Biogasification also called biomethanisation is a bio-chemical
conversion process of decomposing biomass with anaerobic bacteria to produce biogas.
This process produces biogas containing approximately 60:40 mixtures of methane
(CH4), and carbon dioxide (CO2) and simultaneously generating an enriched sludge
fertilizer- with an energy content of 22.5 MJ/m3. Anaerobic digestion of the organic
fraction of municipal solid waste offers the advantage of both a net energy gain by
producing methane as well as the production of a fertilizer from the residuals (Edelman et
al., 2000).
Incineration is one of the most effective means of dealing with many wastes, which
reduces their harmful potential, and often convert them to energy form (Tchobanoglous et
al., 2002). Incineration is a thermo-chemical conversion that involves the controlled
burning of waste in a purposely built facility. It involves the process of direct burning of
wastes in the presence of excess air at the temperatures of about 800°C and above (above
(Knox, 2005). The process sterilizes and stabilises the waste. Incineration reduces the
volume of waste to less than a quarter of the original and the combustible material is
converted into ash and carbon dioxide (Kumar et al., 2002). About 65-80 % of the energy
content of the organic matter is recovered as heat energy and utilised either for direct
thermal applications, or for producing power.
Pyrolysis also referred to as destructive distillation or carbonisation is the thermal
decomposition of organic matter at high temperature of about 900°C in an inert
environment. Pyrolysis produces a pyroligenous liquid having high heat value and is a
feasible substitute for industrial fuel oil.
University of Ghana http://ugspace.ug.edu.gh

13
Gasification is the thermal decomposition of organic matter at high temperatures in the
presence of limited amounts of air producing a mixture of combustible and
noncombustible gas (carbon monoxide, hydrogen and carbon dioxide). Waste disposal
takes two forms, which are non-engineered landfill disposal and sanitary landfill disposal.
Non-engineered disposal is the most common method of disposal in low-income
countries, which have no control, or with only slight or moderate controls.
2.3. Waste degradation
Waste degradation is the breakdown of the organic component of waste by microbial
organisms especially bacteria. The degradation of the organic component of waste
undergoes the following phases.
2.3.1. Initial adjustment, transition and acid formation phase
This phase is associated with initial placement of solid waste and accumulation of
moisture within the landfill. An initial lag time is observed until sufficient moisture
develops and supports an active microbial community (Tapas, 2014).
In the transition phase, the field capacity is exceeded, and a transformation from an
aerobic to anaerobic environment occurs. This is evidenced by the depletion of oxygen
trapped within the landfill media. A reducing condition is established with shifting of
electron acceptors from oxygen to nitrates and sulphates, and the displacement of oxygen
by carbon dioxide. By the end of this phase, measurable concentrations of chemical
University of Ghana http://ugspace.ug.edu.gh
14
oxygen demand (COD) and volatile organic acids (VOA) can be detected in the leachate
(Tapas, 2014).
The third phase is the acid formation stage where the organic materials are acted upon.
Microbial conversion of the biodegradable organic content results in the production of
intermediate VOAs at high concentrations throughout this phase. It is characterized by
reduced pH and metal mobilization (Tapas, 2014).
2.3.2. Methane fermentation and maturation
In this phase, intermediate acids are consumed by methanogenic bacteria and converted
into methane and carbon dioxide. Sulphates and nitrates are reduced to sulphides and
ammonia, respectively. The pH value is elevated and this supports the growth of
methanogenic bacteria. The pH at this phase is controlled by the bicarbonate buffering
system. Heavy metals are removed by complexation and precipitation at this stage
(Tapas, 2014).
This is the final state of landfill stabilization. At this stage, nutrients and available
substrate become limited, and the biological activity shifts to relative dormancy. Gas
production drops dramatically and leachate strength stays steady at much lower
concentrations. Reappearance of oxygen and oxidized species is observed slowly (Tapas,
2014). The slow degradation of resistant organic fractions continues with the production
of humic like substances.
The progress towards final stabilization of landfill solid waste depends on the physical,
chemical and biological factors within the landfill environment, the age and
University of Ghana http://ugspace.ug.edu.gh
15
characteristics of land filled waste, the operational and management controls applied, and
the site-specific external conditions. Environmental conditions which impact significantly
on biodegradation in landfills include pH, temperature, nutrients, absence of toxins,
moisture content, particle size and oxidation-reduction potential.
2.4. Leachate and landfill gas production
Leachate formation occurs when soluble components are dissolved out of solid waste
material by percolating water. Landfill leachate is a potentially polluting liquid, which
unless returned to the environment in a carefully controlled manner may cause harmful
effects on groundwater and surface water surrounding the landfill site. The generation of
leachate is caused principally by precipitation percolating through waste deposited in a
landfill resulting in the extraction of the water-soluble compounds and particulate matter
of the waste (Henry and Heinke, 1996). Leachate may also carry insoluble liquids (such
as oils) and small particles in the form of suspended solids. Depending on the waste
types, further contaminants may be introduced as a result of biodegradation of the wastes.
Leachate from a landfill varies widely in composition depending on the age of the landfill
and the type of waste it contains (Henry and Heinke, 1996).
2.4.1. Factors that influence leachate and landfill gas production
The quality and quantity of leachate and landfill gas produced is related to factors such as
waste type and composition, local climate (precipitation, humidity, and temperature), age
of landfill, degree of waste compaction, method of land filling moisture content and type
University of Ghana http://ugspace.ug.edu.gh
16
of bacteria. The quality of leachate is determined primarily by the composition and
solubility of the waste constituents. The climate has also a great influence on leachate
production because it affects the input of precipitation (P) and losses through evaporation
(EV). Finally, leachate production depends on the nature of the waste itself, namely its
water content and its degree of compaction. The production is generally greater whenever
the waste is less compacted, since compaction reduces filtration rate. The composition of
landfill leachates also varies greatly depending on the age of the landfill (Welander et al.,
1997). In young landfills, containing large amounts of biodegradable organic matter, a
rapid anaerobic fermentation takes place, resulting in volatile fatty acids (VFA) as the
main fermentation products. Acid fermentation is enhanced by a high moisture content or
water content in the solid waste (Wang et al., 2003).
2.4.2. Leachate composition and characteristics
Leachate composition varies relative to the site construction and operational practice, age
of the dumpsite, amount of precipitation and; the quantity and type of wastes disposed
(Campbell, 1993). Landfill leachate is a water-based solution consisting of water,
organic, inorganic and bacterial compounds together with solid. The organic compounds
include alcohols, acids, aldehydes, short chain sugars. The organic content of leachates is
often measured through analyses of parameters such as COD, BOD (biochemical oxygen
demand) and TOC and dissolved organic carbon (Thomas et al., 2009).. Inorganic
compounds in landfill leachate include salts (e.g., sodium and chloride), and an
abundance of common anions and cations (e.g., bicarbonate and sulfate).
University of Ghana http://ugspace.ug.edu.gh
17
Landfill leachate also contains dissolved heavy metals (e.g. Fe, Mn, Pb, Ni, Cu, Hg)
(Welander et al., 1997). The biotoxicity of leachate is generally determined based on its
physico-chemical properties, with ammonia, chemical oxygen demand (COD), and heavy
metals being identified as the major contributors (Thomas et al., 2009).
The physical, chemical and biological characteristics of leachate are discussed below:
The colour of leachate is orange brown or dark brown (Bertazzoli and Pelegrini, 2002).
The chroma is around 2000 to 4000. Leachate is associated with a malodorous smell, due
mainly to the presence of organic acids which result from the decomposition of organic
matter in the waste (Williams, 2004). The dark color and malodor disappear slowly with
increasing age of landfill. Change in colour and smell is also related to the nature of
precipitation and the quantity and quality of the waste.
Leachate is generally found to have pH between 4.5 and 9 (Christensen et al., 2001).The
pH of leachate at the early stage of formation has a pH lower than 6.5, making the
leachate acidic and this is due to high concentration of volatile fatty acids (VFAs)
(Bohdziewicz and Kwarciak, 2008). As time progresses and the landfill ages; the pH
rises up to pH higher than 7.5, making the leachate alkaline (Abbas et al., 2009). The pH
of the leachate is also affected by the nature of precipitation and the quantity and quality
of waste.
BOD and COD of leachate is a measure of the oxygen demand of the leachate. In the
initial acidogenic biodegradation stage, the leachate is characterized by high BOD5 and
COD. Young landfill leachate is characterized by high BOD5 (4000–13,000 mg/L) and
COD (30,000–60,000 mg/L) (Foo and Hameed, 2009). According to Tatsi et al. (2003),
University of Ghana http://ugspace.ug.edu.gh
18
young leachate may have BOD5 as high as 81,000 mg/L. A decrease in BOD5 and COD
is often reported with the increase in age of the landfill. As the organic and inorganic
components of the waste decrease, oxygen demand for microbial activity also decreases.
The BOD is at its maximum concentration from 6 months to 2.5 years. Finally, the BOD
index begins to reduce from3-6 years and reaches a steady concentration from 6-15 years
(Svenolof, 1992). For stabilized leachates, COD generally ranges between 5000–20,000
mg/l (Li and Zhao, 2002).
The concentration of TOC is normally in the range 265-2800mg/l. The BOD/ TOC reflect
the oxidation of organic carbon in leachate. The value of BOD and TOC is high in the
initial stages of landfills. The oxidation of organic carbon in leachate reduces with
landfill age hence BOD and TOC values are reduced (Svenolof, 1992).
TDS consists mainly of inorganic salts and dissolved organics. The amount of TDS
reflects the extent of mineralization and a higher TDS concentration can change the
physical and chemical characteristics of the receiving water (Al-Yaqout and Hamoda,
2003). Changes in TDS value of leachate relate to the age of the landfill. In the initial
stages of landfills, the concentration of TDS is high and contains sodium, calcium,
chloride, sulphate and iron. As the landfill ages, the concentration of inorganic matter
reduces.
Suspended solid refers to solid matter in the leachate. It consists of organic matter,
inorganic matter, clay and microorganism. Leachate from landfills normally contains
only small amounts of suspended solids. Leachate has high concentration of salts. The
predominant salt in leachate is chloride (100-4000mg/l) and phosphate (91600mg/l),
which are more serious when the rainfall is less (Tyre and Michele, 1997).
University of Ghana http://ugspace.ug.edu.gh
19
Nitrogen and Phosphorus are the main components of the inorganic pollutant in leachate.
The concentrations of Nitrogen (N) and Phosphorus (P) are high when the land filling is
in progress. However, when the landfill is closed, P reduces slowly and N increase
because of the decomposition of waste under the anaerobic condition (Tyre and Michele,
1997).
The concentration of ammonia nitrogen increases with the increase in age of the landfill
which is due to hydrolysis and fermentation of nitrogenous fractions of biodegradable
refuse substrates (Abbas et al., 2009). The concentration of ammonia nitrogen increases
with land filling. According to Li and Zhao (2002) ammonia nitrogen in stabilized
leachate might range between 3000–5000 mg/L. Ammonia nitrogen is ranked as a major
toxicant to living organisms, as established by various toxicity analyses using bioassays
and various test organisms such as Salmo gairdnieri and Oncorhynchus nerka
(Kurniawann et al., 2006).The main component of ammonia nitrogen is ammonia.
Ammonia is considered as a major long-term pollutant because of its stability under
anaerobic conditions. The mean concentration of ammonia in leachate ranges between
500–1500 mg/L after a period of 3–8 years of waste placement and continues to be within
this range over 50 years (Kulikowska and Klimiuk, 2008). Higher concentrations of
ammonia are also known to enhance algal growth, promote eutrophication due to
decreased dissolved oxygen (Kurniawann et al., 2006). Due to its toxicity, it can also
disrupt biological leachate treatment operations (Deng and Englehardt, 2007).
In general, the concentration of heavy metals in landfill leachate is fairly low
(Christensen et al., 2001). Concentration of heavy metals in a landfill is generally higher
at earlier stages because of higher metal solubility as a result of low pH caused by
University of Ghana http://ugspace.ug.edu.gh

20
production of organic acids (Kulikowska and Klimiuk, 2008). As a result of decreased
pH at later stages, a decrease in metal solubility occurs resulting in rapid decrease in the
concentration of heavy metals except lead because lead is known to produce very heavy
complex with humic acids (Harmsen, 1983). A lower concentration of Cd (0.006 mg/L),
Ni (0.13mg/L), Zn (0.61 mg/L), Cu (0.07mg/L), Pb (0.07 mg/L), and Cr (0.08 mg/L)
were found in 106 Danish landfills by Kjeldsen and Christophersen (2001). The high
dissolved organic carbon (DOC) concentration in leachate renders the metals non-toxic
because only the free metals are known to exhibit toxicity (Vigneault and Campbell,
2005., Koukal et al., 2003).
However, the solubility and mobility of metals may increase in the presence of natural
and synthetic complexing ligands such as EDTA and humic substances (Williamson and
Owen, 2006). Further, colloids have great affinity for heavy metals and a significant but
highly variable fraction of heavy metals is associated with colloidal matter Christensen et
al., (2001) and; Jensen and Christensen (1999) found that10–60% of Ni, 30–100% Cu
and 0–95% Zn were constituted in colloidal fractions. The solubility of the metals can
also increase because of the reducing condition of the leachate which changes the ionic
state of the metals (i.e., Cr (VI)→Cr (III), and As (V) → As (III) ( Williamson, and
Owen, 2006., Sierra-Alvarez et al., 2005., Halim et al., 2004., Li, et al., 2007). The
amount of heavy metals in leachate is related to the industrial level of the community and
how much industrial waste is land filled. Domestic waste has low levels of heavy metals
compared to industrial waste. Industrial waste accounts for most part of heavy metals in
leachate.
University of Ghana http://ugspace.ug.edu.gh
21
2.4.3. Landfill leachate and gas generation stages
Mechanisms regulating mass transfer from wastes to leaching water, from which leachate
originates, can be divided into two groups; namely aerobic and anaerobic digestions.
Waste deposited in landfills is not inert thus containing organically degradable materials.
Percolating rainwater provides a medium in which the waste, particularly the organics,
can undergo degradation by micro-organisms, primarily bacteria into simpler substances
(Salem et al., 2007). Leachate produced in the early stages of decomposition of waste is
typically generated under aerobic conditions. Initially, organic matter, in the form of
proteins, carbohydrates and fats, is decomposed under aerobic conditions (i.e. oxidised),
through a series of hydrolysis reactions, to form carbon dioxide and water together with
nitrates and sulphates via a number of intermediate products such as amino acids, fatty
acids and glycerol (Salem et al., 2007).
Such oxidation reactions are exothermic, causing temperatures in the landfill become
elevated to as high as 80–90oC. This heat is retained and enhances the subsequent stages
of gas and leachate production. Carbon dioxide is released as a gas or is dissolved in
water to form carbonic acid which subsequently dissociates to yield the bicarbonate anion
(HCO3-) at near neutral pH (Taylor and Allen, 2013). Aerobic decomposition of organic
matter depletes the waste deposit of oxygen as buried waste in the landfill or refuse dump
becomes compacted and circulation of air is inhibited.
As oxygen becomes depleted, it is replaced as the oxidising agent by in succession,
nitrate (NO3-), manganese (as MnO2), iron as Fe(OH)3 and sulphate (SO4
2-) (Taylor and
Allen, 2013). The solubility of metals in the leachate is enhanced through complexation
by dissolved organic matter In general, the aerobic stage is short, no substantial volumes
University of Ghana http://ugspace.ug.edu.gh
22
of leachate are produced, and aerobic conditions are rapidly replaced by anaerobic
conditions.
The main stages of anaerobic digestion are (i) acetogenic (acid) fermentation, (ii)
intermediate anaerobiosis, and (iii) methanogenic fermentation, all three of which can be
operating simultaneously in different parts of the landfill. Acetogenic fermentation brings
about a decrease in leachate pH, high concentrations of volatile acids, high concentrations
of soluble degradable organic compounds and considerable concentrations of inorganic
ions (e.g. Cl-, SO42-, Ca2+, Mg2+, and Na+). As the redox potential drops, sulphate is
slowly reduced; generating sulphides, which may precipitate iron, manganese and heavy
metals that were dissolved by the acid fermentation stage (Taylor and Allen, 2013).
Decrease in pH is due to production of volatile fatty acids (VFAs) and to high partial
pressures of carbon dioxide (CO2), whilst the increased concentrations of anions and
cations results from leaching (lixiviation) of easily soluble organic material present in the
waste mass. Breakdown of organic materials reduces the redox potential to lesser than
330mV, which allows the next stage of the process to become initiated.
Leachate from this phase is characterised by high values of biochemical oxygen demand
(BOD) commonly greater than 10,000 mg/L, high BOD5/COD (biochemical oxygen
demand /chemical oxygen demand) ratios commonly greater than 0.7, acidic pH values
typically 5-6 and ammonia (NH3) due to hydrolysis, and fermentation in particular of
proteins.
Intermediate anaerobiosis commences with a gradual increase in the methane (CH4)
concentration in the gas, coupled with a decrease in H2, CO2 and volatile fatty acids.
Conversion of the volatile fatty acids leads to an increase in pH values and to alkalinity,
University of Ghana http://ugspace.ug.edu.gh
23
with a consequent decrease in the solubility of calcium, iron manganese and the heavy
metals, which are probably precipitated as sulphides. Ammonia is released but is not
converted to nitrate in such an anaerobic environment.
Methanogenic fermentation is the final stage in the degradation of organic wastes (Taylor
and Allen, 2013). It operates within the extremely limited pH range of 6-8 making the
leachate produced neutral or slightly alkaline. At this stage in the degradation process, the
composition of leachate is characterised by low concentrations of volatile acids and total
dissolved solids (TDS), indicating that solubilisation of the majority of organic
components is almost complete, although waste stabilisation will continue for several
decades. The biogas being produced at this stage has a methane content of generally
greater than 50 per cent. Leachate produced at this stage is characterised by relatively low
BOD values, and low ratios of BOD/COD. As biodegradation near completion, aerobic
conditions may return, and leachates will eventually cease to be hazardous to the
environment.
2.4.4. Leachate treatment techniques
The techniques of leachate treatment can be divided into biological, physical and
chemical methods. Leachate treatment techniques include aerobic biological treatment,
anaerobic biological treatment, spray irrigation to land, reed bed treatment, ammonia
stripping, reverse osmosis and ozonation (Abdulhussain, et al., 2009).
The biological leachate treatment method is grouped into aerobic and anaerobic
technique. The advantage of anaerobic process is that it allows heavy metals to be
University of Ghana http://ugspace.ug.edu.gh
24
removed from the leachate by precipitation as carbonates (Callander and Barford, 1983).
The anaerobic treatment system includes the complex organic compounds that are
transferred to CH4 and CO2, and also produces excess sludge that does not need so much
management. The energy consumption of anaerobic process is lower than aerobic
processes.
However, the high NH4+N concentration within the leachate is often not completely
reduced through the anaerobic process (Callander and Barford, 1983). Aerobic biological
processes have been identified as the most successful and reliable treatment for the
landfill leachate (Robinson, 1995). This treatment readily reduces the high organic
loading present in leachates during the early stages of waste decomposition and also
nitrifies high concentrations of ammoniacal-nitrogen (Tattersall, 2004). The aerobic
processes can be carried out over a wide range of temperatures and also the rate of
degradation is higher in the aerobic process than in the anaerobic processes. The success
aerobic leachate treatment is greater with the use of non-attached growth processes in
aerated lagoons or tanks.
Aeration encourages the formation and growth of suspended biological flocs, which
break down and metabolise the polluting components of the leachate. The efficiency of
the method is connected with the stabilization of the landfill. The aerobic process or
anaerobic process should be used together with physical pre-treatment to improve the
efficiency of the biological treatment. Leachates continue to contain many pollutants such
as heavy metals and some persistent organic compounds after bio-degradation. These
compounds are only removed through the physical and chemical processes of leachate
treatment. The aim of physical and chemical treatment is to remove heavy metal ions and
University of Ghana http://ugspace.ug.edu.gh

25
NH3-N (ammonia nitrogen). Methods like ammonia stripping, spray irrigation to land,
reed bed treatment, ammonia stripping, reverse osmosis and ozonation belong to the
physical and chemical treatment and, they could be used as pre-treatments to help the
biological treatment process (Abdulhussain, et al., 2009).
2.5. Landfill sites
A landfill site is a facility for the disposal of solid waste by burial. It is the oldest form of
waste disposal. A landfill site is also referred to as a tip or dump (Zurbrugg et al., 2003).
Land filling is pre-dominantly used in low income countries due to its economic
advantages (Elliott et al., 2009).The disadvantages of landfills are that, landfills and their
surrounding areas are often heavily polluted. This leads to water, air and soil pollution
through the spread of dangerous chemicals into the water table or into waterways
(Akaeze, 2001).
Landfills without gas collection systems can also enhance the chances of global warming
by releasing methane a greenhouse gas into the atmosphere. Landfill sites are classified
as engineered and conventional landfill sites. Engineered landfill sites are also referred to
as sanitary landfills. Sanitary landfills are specially built landfills, which reduces the
harmful effects of dumping. A sanitary landfill is a disposal site designed, constructed,
operated and maintained to minimize potential environmental impact of deposited waste.
Engineered landfills have appropriate liners for groundwater protection, sumps for
leachate collection, leachate treatment system, groundwater monitoring wells, Landfill
gas collection systems and appropriate final cover design.
University of Ghana http://ugspace.ug.edu.gh
26
The conventional land filling method involves the use of abandoned quarry sites and
open grounds as dump sites. Open ground dumping also occurs in low lying marshy areas
leading to the destruction of wetlands. Conventional land filling has the lowest initial
capital investment and operating cost (Elliott et al., 2009). Conventional land filling sites
are unplanned. There is also no control over waste inputs and pollution emissions.
Conventional land filling leads to the contamination of surface and groundwater, loss of
environmental aesthetics and property value; and also serve as breeding places of vermin
and disease vectors.
In the Accra Metropolis, no engineered landfill site has been set up. The Accra
Metropolitan Assembly has always made use of pits created as a result of quarry
activities. The Oblogo and Mallam landfills are examples of this practice. The Pantang
landfill is also located on a marshy ground which would have served as a wet land for
flood control. These sites where selected for dumping without leachate treatment facility;
groundwater monitory plan or landfill gas monitory plan.
The Accra Metropolitan Assembly and EPA only relied on the underground bed rock to
protect the underground water regime.
2.5.1. Landfill site selection, design and operation
Selection of land for landfill site construction is a major problem because public
acceptance is often lacking. In many cases local societies revolt against landfill
placement in their community and this may be attributed to the Not-In-My-Backyard
Syndrome (NIMBY). For landfill, site selection to be efficient, serious environmental
University of Ghana http://ugspace.ug.edu.gh

27
threats and nuisance as well as lack of social acceptance associated with them should be
adequately considered. Economically, the cost of construction, operation and
maintenance, waste transport and the cost of impacts alleviation must be known (Dooley,
1993).
Other factors that are considered are location - landfills are to be located at distances
from residential areas, industrial units, archaeological sites, airports, military
establishments, forest or reforested areas, protected areas or areas of ecological
importance, environmental criteria- landfills are to be sited away from flood plains and
wet lands to prevent contamination of the underground water system, social criteria-under
this criteria authorities are to consider issues relating to social acceptance, residential
pressure, property status, farming and animal-raising activity, use of groundwater by
residents and current aesthetic status.
Hydro-geological criteria that should also be considered are those relating to aquifer
characteristics that is the depth and top soil and subsoil conditions. The site should be
away from groundwater recharge areas. The site should have a deep water table to
prevent leakage of leachate into ground water. Soil of site should have a low permeability
and thick impermeable subsoil layer. Functional criteria concerns the availability of cover
material, transportation networks and accessibility, and climatic conditions including
rainfall height, intensity and frequency (Kent et al., 2003)
Landfill designing entails the use of liners, leachate collection, treatment and disposal
system, ground water monitoring wells and landfill gas collection systems. Liners are
provided in a landfill to protect ground water and underline soil from leachate releases.
Clay or synthetic liners are used to line the sides and bottom to prevent leachate seepage.
University of Ghana http://ugspace.ug.edu.gh

28
The leachate collection and removal system is usually located on top of the liners to
remove leachate for treatment and disposal. Ground water monitoring wells are
constructed to collect ground water for testing in the laboratory for contamination level
assessment. Gas collection systems are built to monitor landfill gas migration, odour, and
air quality
2.5.2. Landfill site operation and decommissioning
Operation of the landfill involves covering waste frequently after compaction by heavy
duty vehicles with soil or other materials to control odour, blowing litter, fire, disease
vectors, and scavenging. During the operation, ground and surface water monitoring to
access water contamination is carried out to establish corrective actions.
Decommissioning refers to steps beyond closure of a waste disposal site which have been
taken to minimize and monitor potential adverse environmental impacts. Poorly
decommissioned landfill sites tend to violate sustainability principles by passing along to
future generations significant environmental problems. Landfill site decommissioning
entails closure and Post closure activities.
Landfill closure is done when a landfill reaches its capacity to receive any more waste.
Landfill closure is done to ensure long term protection of the environment. This involves
the installation of a final cover. Land fill closure involves capping and grading where
landfill site is covered with a layer of clay and graded to positive drainage. Post Closure
which is the long term care of the closed landfill is necessary to minimize environmental
impact. Post closure steps include maintenance of the integrity and effectiveness of the
University of Ghana http://ugspace.ug.edu.gh
29
final cover, regrading of cover material after settling of waste, revegetation, leachate
collection and treatment, landfill gas migration monitoring, surface and ground water
quality monitoring, odour and vermin control and improvement of general aesthetics.
2.6. Environmental problems associated with landfills
Poorly covered landfill waste gets exposed and attracts disease carrying vermin of all
types. Vermin and insects pests are attracted to the landfill by the ready availability of
food (Afzal et al., 2000). They breed, multiply and move from the landfill to spread
diseases. Invertebrates found in this habitat include members of the phyla Nematoda (flat
worms), Annelida (segmented worms), and Arthropoda (including isopods, insects and
arachnids such as spiders, harvestmen and mites). Many of these contribute to the
decomposition processes. Among the insects, these can include crickets and
grasshoppers.
Flies are a group of specific concern as they act as disease vectors and their population
growth is also encouraged by the heat generated through decomposition. Birds including
members of the gull and crow families are also quite common. The principal vermin
species associated with landfills which are problematic are flies, wild birds (especially
gulls and members of the crow family) and rodents (Afzal et al., 2000). Vermin have the
ability to carry disease vectors (bacteria, viruses, fungi) and chemical contaminants out of
the site, either directly or through the spread of litter. Potentially, pathogenic bacteria are
primarily hazards for site operators (Eduljee, 1995). Distributed litter can also find
University of Ghana http://ugspace.ug.edu.gh
30
themselves been carried away from the site in breeze causing visual and physical hazards
such as fire, choking of domestic animals, blockage of drains and watercourses.
Ground and surface water pollution from leachates is one of the key environmental
problems of landfills. Unlined and poorly managed landfills are assumed to cause
pollution through leachate seepage into ground and surface waters (Afzal et al., 2000).
The seepage tends to increase the nutrient loads affecting the trophic status of water
bodies and resources leading to eutrophication. Acidification from leachate increases the
potential for solubilising trace metals from trace metal ores in the water (Harsem, 1983).
Landfill gases produced as a result of organic matter degradation by anaerobic bacteria
includes methane, carbon dioxide, volatile organic compounds, oxides of sulphur and
nitrogen and other non-methane organic compounds (Gendebien et al., 1992). These
gaseous pollutants have significant effects on plants, animals and the entire ecosystem.
Some air pollutants do not always disperse effectively and may remain together at quite
high concentrations, causing unexpected damage some distance from the source.
The methane and carbon dioxide components are green house gases (GHG) contributing
to global warming. Methane, carbon monoxide and carbon dioxide all act as greenhouse
gases of global significance, with methane being by far the most active but carbon
dioxide being produced in the greatest quantities (Krupa, 1997). Both methane and
carbon monoxide react with hydroxyl radicals and oxygen in the atmosphere to generate
carbon dioxide within a period of days to a few years (Clarke 1986., O’Neill, 1993.,
Wellburn, 1994., Yunus et al., 1996). Small amounts of methane are also consumed
through absorption by soils. Methane is also inflammable and explosive causing fires on
landfill sites (Gendebien et al., 1992). The volatile organic compounds and non-methane
University of Ghana http://ugspace.ug.edu.gh
31
organic compounds are the component characterized as toxic to the environment and as
such to human health. Volatile organic compounds particularly esters; organosulphur,
hydrogen sulphide and ammonia cause odour emissions on landfills (Yunus and Iqbal,
1996).
The acidic gaseous constituents (HCl, SOx, NOx and HF) are all of global significance
since they contribute to the acid rain phenomenon and its secondary effects on the
acidification of soils and ecosystems (Gendebien et al., 1992). Ammonia is a secondary
acidifying agent following its atmospheric oxidation to nitric acid. These acidic
constituents are all potentially noxious. They have similar general effects on plants,
causing loss of stomata control, a reduction in photosynthesis, enzyme inhibition,
changes in synthetic pathways, and depressed growth and yields (Gendebien et al., 1992).
Ammonia is also liberated in leachate (Yunus and Iqbal, 1996). When leachate is exposed
to air, the ammonia volatilises and contributes to potential problems of acid rain.
Ammonia generated from leachate within landfills migrates through the soil horizons
where it is nitrified (oxidised) to nitrite and nitrate and subsequently causes
eutrophication problems. Nitrous oxide (N2O) is also a greenhouse gas. Nitrogen dioxide
participates in the formation photochemical smog. NO2 is also a plant growth retardant
and can cause decreases in agricultural yields. Oxides of sulphur (SO2 and SO3) mainly
enter plants through the stomatal pores. Low concentrations may increase photosynthetic
rates in the short term, but higher exposure decreases photosynthesis and ultimate yield
(Yunus and Iqbal, 1996).
All green plant species are adversely affected by dust deposition, which limits
photosynthesis by reducing sunlight and carbon dioxide penetration to leaves. This is
University of Ghana http://ugspace.ug.edu.gh
32
alleviated by rainfall, but some dusts can form a permanent foliar crust, which is
particularly problematic for evergreen foliage, which has a long replacement cycle. Air
pollution may lead to respiratory tract infections, nervous system diseases and eye
irritation in humans.
Land filling also affects soil quality through the creation of physical pressure within the
soil resulting in reduced soil stability and drainage. The movement of heavy machinery
during general waste management operations leads to excessive compaction of the top
and sub soils. Soils found close to landfills can become contaminated with a range of
substances, including acidifying agents, metals, organic pollutants and pathogenic
microorganisms.
Contamination can arise through direct migration from landfills, through water pollution
or by indirect deposition from air. The deposition of chemical contaminants including
metals, the wet deposition of gases, and the seepage of gases from landfills can all
suppress microbial activity throughout the soil ecosystem ecosystem (Finnecy & Pearce,
1986). Soil acidification is caused by sulphur dioxide, oxides of nitrogen and ammonia.
These gases are either deposited directly onto the soil (dry deposition) or washed out of
the air by rain (wet deposition).
Soil acidification can slow down soil processes and populations of soil microorganisms
may change with a shift towards acid-tolerant species. Acidification alters the solubility
and mobility of a number of soil minerals. Soil acidification tends to favour the release of
various forms of aluminium that may damage plants by affecting plant roots and
mycorrhizae (root /fungal relationships).The supply of nutrients within the soil is
governed by cycles that depend on the activities of soil organisms ranging from bacteria
University of Ghana http://ugspace.ug.edu.gh
33
and fungi (micro-flora) to small invertebrates (micro-fauna) and earthworms. The actions
of all these organisms are affected by physical and chemical disturbance of the soil
during waste management operations. Also, essential root activities can be adversely
affected by changes in soil pH and lateral seepage of leachate or gaseous contaminants
such as methane or hydrogen sulphide (Finnecy & Pearce, 1986).
University of Ghana http://ugspace.ug.edu.gh
34
CHAPTER THREE
STUDY SITE, MATERIALS AND METHODS
3.1. Study sites
The study sites were the decommissioned landfill site at Mallam and the active landfill
site at Pantang, Abloradjei. The decommissioned landfill site is an old disused quarry pit.
It was used as a landfill site between July1991and May 2001 under the management of
the Accra Metropolitan Assembly. The total land area of the decommissioned landfill site
is 16.06 acres with an average depth of 20.06 m (Accra Metropolitan Assembly, 2013).
The estimated amount of waste that was deposited was 2,698,570 metric tons at a density
of 1.045 tons/ m3 (Accra Metropolitan Assembly, 2013). The entire surface of the
decommissioned landfill site was covered with gravels but with time erosion has washed
some away. The Pantang landfill is sited on a marshy ground. The bottom and sides of
the Mallam and Pantang landfills are not lined. The sites also lack leachate collection and
gas monitoring systems. The compaction method for the Mallam landfill site was the
vehicular method (bulldozer) and this same method is being used on the Pantang landfill
site, with soils as the cover material for both sites.
The Pantang Active landfill site is located in the Ga East Municipal Assembly which is
located at the northern part of the Greater Accra Region and covers a land Area of 166 sq
km. It is bordered on the west by the Ga West Municipal Assembly, on the east by the
Adentan Municipal Assembly, the south by Accra Metropolitan Assembly and the north
by the Akwapim South District Assembly (Ga East Municipal Assembly, 2012). The
decommissioned landfill site at Mallam is located in the Ga South Municipal Assembly
University of Ghana http://ugspace.ug.edu.gh

35
formerly Weija Municipal Assembly. It lies within latitude 5o 48 North 5o 29 North and
Latitude 0o8’ West and 0o30’ West. The Ga south municipality shares boundaries with the
Accra Metropolitan to the South-East, Akwapim South to the North-East, Ga West to the
East, West Akim to the North, Awutu-Effutu Senya to the West, Gomoa to the South-
West and the Gulf of Guinea to the South. It occupies a land area of approximately 517.2
sq km with about 362 communities (Ga South Municipal Assembly, 2012).
3.1.1. Demographic characteristics, climate and vegetation
The Ga East Municipality’s population after the 2010 National Population and Housing
Census was at 259,668. The municipality has about 65 settlements with Abokobi, a well
known Presbyterian community as the capital (Ga East Municipal Assembly, 2012).
According to the 2010 National Population and Housing Census, the population of the Ga
South Municipal Assembly was estimated at 485,643. Gbawe is the Administrative
capital of the Ga South Municipal assembly (Ga South Municipal Assembly, 2012).
The Ga East Municipality is located in the savannah agro-ecological zone. The Ga East
Municipality also has a bi-modal rainfall pattern with the average annual temperature
ranging between 25.1ºC in August and 28.4ºC in February and March. February and
March are normally the hottest months. The Municipality has two main vegetations
namely shrub lands and grassland. The shrub lands occur mostly in the western outskirts
and in the north towards the Aburi hills and consist of dense cluster of small trees and
shrubs that grow to an average height of about five meters. The grassland which occurred
University of Ghana http://ugspace.ug.edu.gh

36
to the southern parts of the district has now been encroached upon by human activities
including settlements (Ga East Municipal Assembly, 2012).
The Ga South Municipality lies wholly in the coastal savanna agro-ecological zone with
secondary forest in the hinterlands where rainfall is high. The rainfall pattern is bi-modal
with an annual mean varying between 790 mm on the coast to about 1270 mm in the
extreme north. The first rainy season begins in May and ends in mid-July while the
second begins in mid-August and ends in October. Rainfall is usually characterized by
thick cloudy conditions and high intensive storms. The annual average temperature
ranges between 25.1ºC in August and 28.4ºC in February and March are the hottest
months. It has a relative humidity of about 75% with an average duration figures of about
94% and 69% at 6:00 and 15:00 respectively (Ga South Municipal Assembly.2012).
3.1.2. Soil and agricultural land use
The land area of the Ga South Municipality is underlined by shallow rocky soils and is
extensively developed on the steep slopes of the Weija hills as well as basic gneiss
inselbergs. On the Weija hills, the soils are mainly pale and sandy with bushy quartzite
occurring to the surface in most places. These soils are rich in sand stone and lime stone
that are good source of material for the construction industry. The red earth is usually
developed in old and thoroughly weathered parent materials. They are typically loamy in
texture near the surface becoming more clay below. The red soils are porous and well
drained and support road development and also provide ample moisture storage at depth
for deep rooting plants. Nutrients supplies are concentrated in the humus top soil.
University of Ghana http://ugspace.ug.edu.gh
37
The main type of soil in this area is the Coastal Savannah Ochrosols. The coastal sands
are pale yellow in colour and without humus or organic matter. These soils are suitable
for coconut and shallots cultivation. On the Akwapim range, the soils are mainly pale and
sandy with brushy quartzite occurring to the surface in most places. These soils are rich
in sandstone and limestone that are good source of material for the construction industry.
The land is mostly owned by families who have the sole responsibility to lease or sell out
right (Ga South Municipal Assembly, 2012). The Ga East Municipality is made up of a
number of soil types located at various parts of the municipality. The Fete Consociation
type of soil is located at Gonten, Abokobi, Bobomase, Akporman, Adenkrebi, and
Kponkpo. The Fete Consociation type of soil is very shallow, excessively well drained,
pale coloured sandy loam contains small pieces of rock on steep slopes. The soil is
suitable for permanent forestry. The Nyigbenya, Hatso Complex Association type of soil
is located at Oshiyie, Frafraha, Agbogba, Haatso, Kwabenya, Taifa, and Dome. The
Nyigbenya, Hatso Complex Association type of soil is well drained, red, sandy clay loam
to clay with abundant rough stone concretions and quartz gravels. The soil is suitable for
permanent forestry. The Oyarifa-Manfe Complex Association type of soil is located at
Ayimensah, Manmomon, Adoteiman, Otinibi, and Oyarifa. The Oyarifa-Manfe Complex
Association type of soil is deep, orange brown to bright red, sandy clay loam containing
abundant ironstone concretions and gravels. The soil is suitable for maize, yam, cassava,
groundnut, sweet potato, vegetables, etc. The Danfa-Dome Association type of soil is
located from Danfa to Dome.
The Danfa-Dome Association type of soil is red well drained concretionary clay;
yellowish brown with lime concretions; deep black, calcareous cracking clays. The soil is
University of Ghana http://ugspace.ug.edu.gh
38
suitable for irrigated rice, cotton, sugarcane, vegetables. The Fete Bediesi Complex
Association type of soil is located at Taboadidi, Berekuso, Sesemi, and Ayim. The Fete
Bediesi Complex Association type of soil Consist of yellow brown and alluvial sand; red,
well drained sandy clay loam. The soil is good for forestry, maize, cassava, yams,
pineapple, cowpea, soyabean, sisal, sunflower and tree crops like cashew, mongo, citrus,
teak, etc. (Ga East Municipal Assembly, 2012). Land in the District is owned by chiefs,
clan or family heads who hold them in trust for their subjects. However, land could also
be acquired through direct purchase, rented, leasehold and share cropping.
3.1.3. Relief and drainage
The land area of Ga south consists of gentle slopes interspersed with plains in most parts
and generally undulating at less than 76m above sea level. The slopes are mostly formed
over the clay soils of the Dahomeyan gneiss with alluvial areas surrounding the low lying
coastal lagoons. The Akwapim range and the Weija hills rise steeply above the western
edge. The crest of the Akwapim range lies generally at 300m southwards. This line of
hills continues through to the Weija hills with the highest point reaching 192m near
Weija.
There are two main rivers namely, the Densu and Ponpon River, which drain the
Municipality. The larger of the two is the Densu which drains down from the Eastern
region through the western portion of the Municipality to Weija where it enters the sea. It
is the source of water supply for over half of the entire population of Accra Metropolis.
Other water bodies mostly tributaries of the Adaiso, Doblo, Ntafafa and the Ponpon
rivers (Ga South Municipal Assembly, 2012)
University of Ghana http://ugspace.ug.edu.gh
39
3.1.4. Waste management
The four landfill sites in the Ga South Municipality are the Oblogo, Mallam (State
Construction Corporation), Mallam Number One and Mallam Number Two landfill sites.
Until they were reclaimed, the sites, which served as dumping sites for refuse from all
parts of Accra for years, emitted overpowering stench which became a nuisance and
posed health challenges to adjoining communities. The rehabilitation of the landfill sites
was carried out as part of the Accra Metropolitan Assembly’s (AMA’s) solid waste
management component of the Government of Ghana and the World Bank urban
environmental sanitation project, phase two.
The World Bank released $1.4 million to Ghana for the capping of the four landfill sites,
which cover 158 acres, by Zoomlion and Malson Company Limited. Capping of these
sites, especially Mallam One and Two has been washed away over the years through
erosion by rain water. Peripheral drains to carry leachates were poorly constructed. The
drains are shallow, narrow and lack covers.
Currently the Pantang landfill site in the Ga East Municipality is the only active land fill
in Accra and it receives solid waste brought from neighboring Assemblies- Adenta
Municipal, Accra Metropolitan and Ga West Municipal. Concerns have been raised by
the communities living close to the landfill over environmental and health risks posed by
the landfill (Ga East Municipal Assembly, 2012).
3.2. Reconnaissance survey
Visits were made to the Mallam and Pantang research areas to determine the most
appropriate sampling protocol and survey strategies to use. The research locations for the
University of Ghana http://ugspace.ug.edu.gh

40
Pantang landfill site (Figure 3.1) were coded as follows: PL for leachate, PA for air
samples, PS for soil and PG for groundwater samples. The research locations for the
Mallam landfill site (Figure 3.2) were coded as follows: M1L for leachate and MA for air
samples.
Figure 3.1: Research locations at the Pantang landfill.
University of Ghana http://ugspace.ug.edu.gh
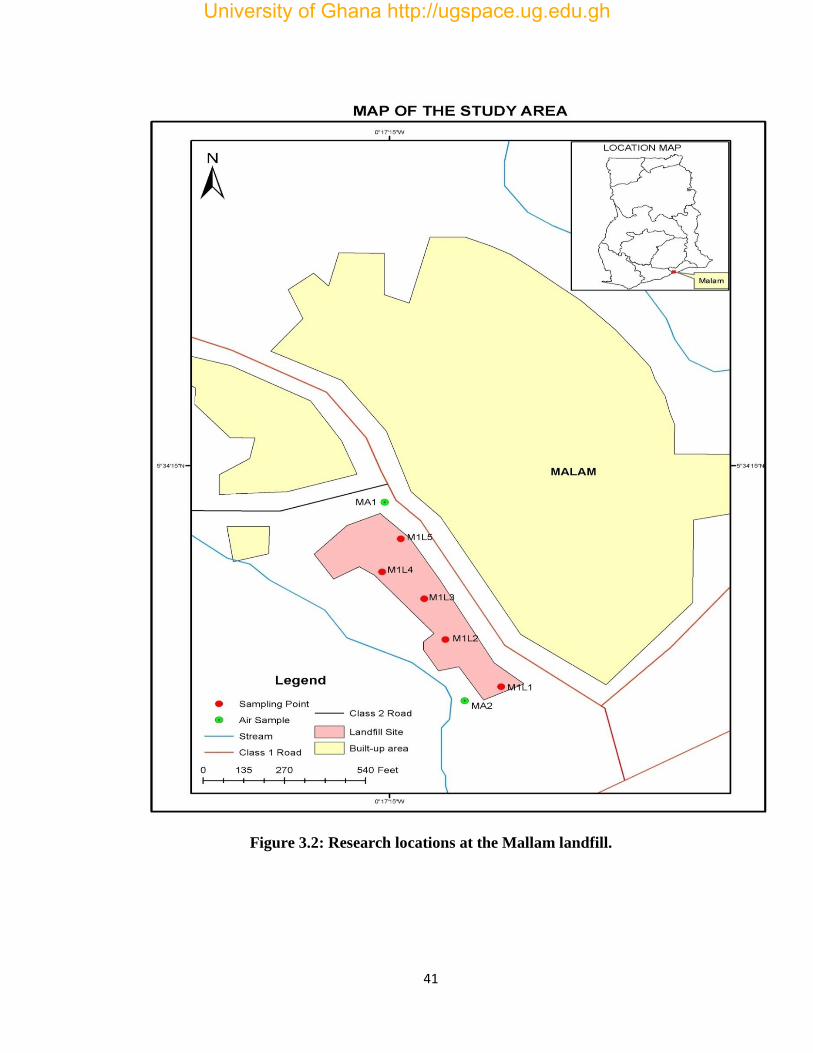
41
Figure 3.2: Research locations at the Mallam landfill.
University of Ghana http://ugspace.ug.edu.gh
42
3.3. Sampling and analytical methods
3.3.1. Leachate and groundwater
Leachate from each of the study areas was sampled up slope and down slope of the
landfill sites. Leachate from the Pantang landfill site was sampled from five research
locations coded PL1, PL2, PL3, PL4 and PL5. Leachate from the Mallam landfill site was
sampled from five research locations coded M1L1, M1L2, M1L3, M1L4 and M1L5.
Groundwater samples were collected from two wells, one very close to the landfill site
coded PG2 and the other about 150 metres away from landfill site coded PG1.
Samples of leachates and groundwater for ex-situ analysis in the laboratory were
collected into 1.5-liter polyethylene and 500ml PVC bottles. The bottles were previously
cleaned by washing in non-ionic detergent, rinsed with tap water and finally rinsed with
de-ionized water prior to usage. During sampling, the bottles were rinsed 2-3 times with
leachate and groundwater being collected. Samples were filtered to remove all residues
and the bottles filled to the brim. Samples in the 500ml PVC bottles for metal analysis
were acidified with 2ml of concentrated nitric acid (HNO3) to adjust the pH to less than
two, to arrest microbial activities and prevent loss of the metals by precipitation and
absorption. Samples were stored in ice chest at a temperature lower than 4.0oC and
transported to the laboratory. Samples that were not analyzed immediately were stored in
a refrigerator.
All the laboratory analyses to determine the levels of pollutants in the leachate and
groundwater, unless otherwise stated, were carried out following standard methods of the
American Public Health Association (APHA). Analyses determined physical, chemical,
University of Ghana http://ugspace.ug.edu.gh

43
oxygen demand and heavy metals parameters. With the exception of heavy metals which
were determined in the Ecological laboratory of the University of Ghana, all other
parameters were measured in the laboratory of the Environmental Protection Agency.
The physical parameters determined on the leachate and groundwater were pH, electrical
conductivity, total dissolved solids, total suspended solids and turbidity. The pH,
electrical conductivity and total dissolved solids were measure in-situ. The pH was
determined using the Wagtech Potalab pH meter that employs the electro-chemistry
technique. The electrical conductivity (EC) and total dissolved solids (TDS) were
measured using the Wagtech Potalab conductivity/TDS meter that employs the
electrochemistry technique. The total suspended solid (TSS) of the samples was
determined using the Wagtech Potalab Photometer. The turbidity (TUR) of the samples
was determined using a portable turbidimeter (Wagtech Potalab turbidimeter) which uses
the Nephelometric principle.
The oxygen demand parameters determined for the leachate and groundwater were
Dissolved Oxygen, Biological Oxygen Demand and Chemical Oxygen Demand. The
Dissolved Oxygen (DO) was measured in-situ for with the DO metre (Wagtech system of
probes) that employs the Electrochemistry Technique.
Biological Oxygen Demand (BOD) measures the amount of oxygen consumed by
microorganisms in decomposing organic matter in water. Respirometry technique was
used to measure the amount of oxygen consumed by these organisms during a specified
period of time (5 days at 20oC). The BOD bottle was filled with the sample and incubated
for 5 days at 20oC. Dissolved oxygen was measured initially and after incubation, and the
University of Ghana http://ugspace.ug.edu.gh
44
BOD was computed from the difference between the initial and final DO (Equation1)
(APHA, 1995).
Calculation: BOD5 _mg/l = [ (d1 - d2) / P ] Equation1
Where;
d1= initial DO of sample, mg/l
d2= DO of sample after 5 days incubation at 200 C, mg/l
p=decimal volumetric fraction of sample used
Chemical Oxygen Demand (COD) is a measure of the amount of oxygen in water
consumed for chemical oxidation of pollutants. The COD content of the leachate and
groundwater was determined using the Wagtech COD test which is a colour absorbance
or transmittance technique. Two ml of the leachate and groundwater were measured into
two test tubes respectively. The COD nutrient was added, shaken vigorously and heated
for 2 hours. The solution was cooled and the COD of the sample was measured using the
Wagtech Potalab Photometer, which was earlier blanked using the COD nutrient.
The nutrients parameters determined on the leacahte and groundwater were sulphate
(SO4), sulphite (SO3), Total phosphorus (TP), nitrate (NO3), nitrite (NO2) and ammonia
(NH3).
The sulphate content of the leachate and groundwater was determined using the Wagtech
sulphate test which is a colour absorbance or transmittance technique. It is based on a
single tablet reagent containing barium chloride in a slightly acidic formation. The
barium salts react with sulphate to form insoluble barium sulphate which is turbid. The
degree of turbidity is proportional to the sulphate concentration and measured using the
University of Ghana http://ugspace.ug.edu.gh
45
photometer. Two test tubes were filled with leachate and groundwater samples
respectively to the 10ml mark. One sulphate turb tablet was added, crushed and mixed to
dissolve. A cloudy solution was formed indicating the presence of sulphate. The solution
was allowed to stand for five minutes then mixed again to ensure uniformity. Phot 32 was
selected on the photometer. Photometer reading was taken and displayed as mg/l SO4.
The Total phosphorus concentrations of the leachate and groundwater samples were
determined using the palintest tubetests total phosphorus/12 test which is a simple two
stage procedure based on a colour absorbance or transmittance technique. The sample is
first digested with acid persulphate to break down polyphosphates and organic
phosphorus compounds and convert them to orthophosphate. The resulting
orthophosphate together with the original present in the sample is then determined by
reaction with ammonium molybdate and ascorbic acid to form the intensely colored
molybdenum blue complex. In this way, the Total phosphorus content of the sample can
be determined.
A catalyst is incorporated to ensure complete and rapid colour development and an
inhibitor to prevent interference from silica. The intensity of the colour produced in the
test is proportional to the total phosphorus concentration and is measured using the
photometer. Procedure for total phosphorus determination in the laboratory: Tubetest
heater was turned on, control set to 100-1050C (212-221) and allowed to heat up to
temperature. The cap of two tubetest total phosphorus/ 12 tubes were removed and 2.0ml
of leachate and groundwater samples added respectively using a pipette. Two digest ox
tablets were added, crushed and mixed to dissolve. The cap was tightly replaced and tube
inverted gently to mix. The tube was labeled and placed in the tubetests heater and
University of Ghana http://ugspace.ug.edu.gh
46
digested for one hour. The tube was carefully removed, transferred to a test tube rack and
allowed to cool to room temperature.
The cap was carefully removed from the cooled tube and 2.0ml of phosneut solution was
added using a pipette. One tubetests phos NO.1 tablet was added, crushed and mixed to
dissolve. One tubetests phos NO.2 tablet was also added, crushed and mixed to dissolve.
The Tube was capped and gently inverted several times to mix. Tube with content was
allowed to stand for 10 minutes to allow colour development. Phot 92 was selected on the
photometer. Tubetest tube containing deionised water only was used to set the blank on
the photometer. Photometer reading was taken and displayed as mg/l P.
The Nitrite concentrations of the leachate and groundwater samples were determined
using the Wagtech Nitricol method which is a colour absorbance or transmittance
technique. Two test tubes were filled with leachate and groundwater samples respectively
to the 10ml mark. One niticol tablet was added, crushed and mixed to dissolve. The
solution was allowed to stand for 10 minutes to allow full colour development. Phot 64
was selected on photometer and result displayed as mg/lNO3.
The sulphite concentrations of the leachate and groundwater samples were determined
using the Wagtech sulphitest method based on a colorimetric procedure involving the
reduction of an indicator dye. Two test tubes were filled with leachate and groundwater
samples respectively to the 10ml mark. One sulphitest NO1 tablet was added, crushed
and mixed to dissolve. One sulphitest NO2 tablet was added to solution in tube, crushed
and mixed to dissolve. Tube was capped immediately. The solution was allowed to stand
for two minutes to allow full colour reduction to take place. Phot 34 was selected on the
photometer and photometer reading taken. The result was displayed as mg/lSO3.
University of Ghana http://ugspace.ug.edu.gh
47
The ammonia concentrations of the leachate and groundwater samples were determined
using the Wagtech Ammonia test based on an Indophenol method. Two test tubes were
filled with leachate and groundwater samples respectively to the 10ml mark. One
ammonia NO.1 tablet and one ammonia NO.2 tablet were added, crushed and mixed to
dissolve. The solution was allowed to stand for ten minutes to allow colour development.
Phot 4 was selected on the photometer and photometer reading taken. The result was
displayed as mg/l.
The nitrate concentrations of the leachate and groundwater samples were determined
using the Wagtech Nitrate test which is a colour absorbance or transmittance technique.
Twenty ml each of the leachate and groundwater was taken. One spoon of nitratest
powder was added to the sample and swirled to mix. One nitratest tablet was added to the
mixed sample, shake to dissolved and allowed to stand for 3mins. 10ml of the solution
was decanted into a covert and one nitricol tablet added, crushed and allowed to stand for
10mins. Phot 24 was selected on the photometer and photometer reading taken. The
result was displayed as mg/l.
The heavy metals determined on the leacahte and groundwater samples were Chromium
(Cr), Lead(Pb), Cadmium(Cd), Iron (Fe), Copper(Cu), Nickel(Ni), Manganese(Mn) and
Zinc(Zn). Hundred ml each of leachate and groundwater samples was transferred into
Pyrex beakers containing 10ml of aqua regia and 1 ml of perchloric acid. The solution
was then incubated at 80°C in a water bath, allowed to cool and filtered. The filtrates
were transferred to 100ml volumetric flasks and diluted to the mark with distilled water
and analyzed for heavy metals using Atomic Absorption Spectrophotometry.
University of Ghana http://ugspace.ug.edu.gh

48
3.3.2. Air
The particulate matter parameters determined for air were particulate matter (PM10) and
total suspended particles (TSP). The particulate matter was sampled using a MiniVol
Sampler set to a flow rate of 5.0L/min at the designated site. Samples were taken at a
minimum height of 5 meters above the ground level to prevent the collection of ground
level dust temporarily made airborne. The sampler was oriented in the direction of wind
flow. Pumped air was siphoned through a filter paper, mounted in a sampling unit and
sampling undertaken for 24 hours. The filter paper was stabilised before and after
sampling in a desicator. The filter paper was pre-weighed and post-weighed before and
after sampling. Starting time was noted. Initial and final elapse times were noted, and the
difference should be 24hrs to indicate sampling has taken place.
For total suspended particle sampling, the impactor was removed from the filter holder
assembly (head) and for PM10 sampling the impactor was placed in the filter holder
assembly. Selected filter was removed from the labeled petrislide. The filter cassette was
open with the cassette separator. With the forceps, the filter was placed in the filter
cassette, cassette placed in the filter holder (head), labeled and kept in plastic bags.
Samplers were carefully transported to the field. Sampler was placed firmly on a level
surface with the intake upward and at least 30cm from any obstacle. Inlet tube
compression nuts were loosened and inlet tube extended to the maximum height and nut
retightened. Filter holder with impactor for Pm sampling and filter holder without
impactor for TSP sampling were attached to the top of two separate sampler inlet tubes
and tightened. Sampler case was opened and turned on, flow rate; start time and initial
elapse time were noted. Sampler was set to auto mode and case closed.
University of Ghana http://ugspace.ug.edu.gh
49
After sampling final elapse time was noted, head was removed and Inlet tube
compression nuts loosened and Inlet tube pushed back in. In the lab, head was unscrewed
and cassette removed. Petrislide with ID which matches ID on head was located and
using the cassette separator the top half of the cassette was removed, exposed filters were
removed from the cassette and placed in its original petrislide. The exposed filters
conditioned in the desicator for 48 hr to minimize the effect of moisture on the filters
after taking air samples and weighed afterwards.
The amount of the PM10 and TSP was estimated by taking the difference in the weight of
the filter paper before and after air sampling by gravimetric estimation. The results were
expressed as micrograms of PM10 per cubic meter of air and micrograms of TSP per
cubic meter of air. To express the amount of PM10 and TSP in mg/m3, the mass of the
PM10 and TSP in micrograms is divided by the product of the flow rate set and the
sampling duration (Equation 2).
PM10 or TSP (ug/m3) = (mass sampled (ug) ( (Flow Rate (m3/min) x sampling duration (mins) ) Equation 2
The heavy metals determined for the air sampled were Chromium (Cr), Lead(Pb),
Cadmium(Cd), Iron (Fe), Copper(Cu), Nickel(Ni), Manganese(Mn) and Zinc(Zn).
Exposed filter papers were composited and acid digested using aqua regia (1:3 HNO3 and
HCl) for total metal ion extraction. After digestion, the extract was filtered and diluted
with distilled water.
The diluted extract was used to quantify heavy metals using atomic absorption
spectrophotometer (Model AAnalyst 800, Perkin–Elmer, USA).The gases sampled were
University of Ghana http://ugspace.ug.edu.gh
50
the carbon monoxide, nitrogen dioxide, ammonia and sulphur dioxide. The Accuro gas
detector pump and the Drager tube were used for gas sampling. The appropriate Dradger
tube for the gas concern was selected. Both tips of tube were opened with Drager tube
opener. Drager tube with both ends opened was inserted into the Accuro pump with
arrow facing pump. Pump was held with end- of-stroke indicator and stroke counter
facing user. Pump was squeezed until it stopped. Pump was released after squeezing until
bellows were fully expanded.
Pump was squeezed again when the end-of-stroke indicator appeared. It was repeated
until the number of stokes for concerned tube was reached. The entire length of
discoloration in the tube was read by matching the color developed with the color
comparison chart and noting the nearest corresponding matching value and recording in
parts per million (PPM). Used tube was removed and pump was flushed with clean air.
The number of strokes for CO was five and measuring time 150 seconds. The number of
strokes for SO2 was ten and measuring time 3 minutes. The number of strokes for
Ammonia was ten and measuring time one Minute. The gaseous sample in PPM was
converted to ug/m3 using the formula below (Equation 3):
Gaseous concentration (ug/m3) = field reading (ppm) x cf x f x1000 (Equation 3)
Where f is atmospheric pressure correction and cf is conversion factor
3.3.3. Soil
Soil samples were taken from the Pantang landfill site only. A control site was selected
away from the landfill site. The landfill site was divided into five research sections. The
University of Ghana http://ugspace.ug.edu.gh
51
first section was coded PS1, the second PS2, the third PS3, the forth PS4 and the fifth
PS5. In each section, three research locations were identified and surface soils taken by
the hand auger at a depth of 0-15 cm.
The sampling points in the first section (PS1) were coded P1S1, P2S1 and P3S1and those
of the second section (PS2) were coded P1S2, P2S2 and P3S2. P1S3, P2S3 and P3S3
were the sampling points of the third section (PS3) and those of the forth section (PS4)
were coded P1S4, P2S4 and P3S4. The fifth section (PS5) had it sampling points being
coded P1S5, P2S5 and P3S5. The cores of soil sampled with the auger from the three
points in each section were mixed thoroughly for a composite sample. The composite soil
for each section was transferred into plastic bags and labeled PS1, PS2, PS3, PS4 and
PS5. The soil samples were transported to the laboratory, dried at room temperature,
ground and sieved through a sieve with a 2 mm mesh.
The parameters determined for soil samples were pH, electrical conductivity, percentage
organic carbon (%OC), percentage organic matter (%OM), Ammonia, Nitrate and metals
(Cd, Mn, Pb, Fe, Cu, Cr, Ni and Zn). To determine pH and electrical conductivity, 10
grams of the soil sample was weighed into an extraction cup. Ten ml of distilled water
was dispensed into the cup with soil and allowed to stand for fifteen minutes. Solution
was shaken on the mechanical shaker for thirty minutes at one hundred and fifty
revolutions per minute and allowed to stand for ten minutes. The solution was filtered
and the pH and EC were determined on the filtrate using a pH/EC multimeter.
Organic carbon was determined by the wet oxidation method (Walkley-Black method).
Procedure- 0.100g of the soil sample weighed into 250mls conical flask and 10mls of
1.0m K2C2O7 solution was added. Twenty milliliters (mls) of concentrated H2SO4 was
University of Ghana http://ugspace.ug.edu.gh
52
also added. Solution was vigorously swirled for 1 minute and allowed to stand for 30
minutes. Two hundred milliliters (mls) of distilled water, 10ml H3PO4 and 1.0mls of
barium diphenylamine sulphonate indicator were added to the solution in the conical
flask and stirred. Solution in the conical flask was titrated against FeSO4 until a green
coloration indicating the end point was formed. The ferrous sulphate solution was
standardized by titrating against 10ml of 1m K2C2O7 solution. Organic carbon percentage
was calculated using Equation 4 below.
% OC = (2.394 (3.4-T×0.0333) ) / (Weight of soil) Equation 4
%OC value was multiplied by 1.724 to obtain the % organic matter.
To determine Ammonia and Nitrate, Ten grams of the soil samples was weighed,
transferred into a plastic shaking bottle. Fifty milliliters (mls) of 2M KCL extraction
solution was added, corked and content shake for one hour. After shaking, the sample
was allowed to stand for 30 minutes. The sample was filtered into Buchner funnels using
filter papers Whatman NO. 42. A steam distillation apparatus was set up using NH3 free
distilled water. Filtrate was steamed through the apparatus for 30 minutes and 50ml
distillate collected and titrated with 0.01 HCL.
The heavy metals Cd, Mn, Pb, Fe, Cu, Cr, Ni and Zn were analysed using the Atomic
Absorption Spectrophotometer (AAS). Dried homogenized powdered soil sample
weighing 0.5g was taken and digested in a Teflon beaker with a mixture of HNO3, HClO4
and HF in the ratio 4:1:4 respectively. The mixture was placed on a hot plate for three
hours at 85ºC, the digest was filtered into 100mlstandard flask and made up to mark with
deionized water. The resultant solution was analysed for the interested heavy metals
using the Atomic Absorption Spectrophotometer.
University of Ghana http://ugspace.ug.edu.gh
53
3.3.4. Pollution indexes
The pollution indexes of leachate, air and soil were determined on the Mallam and
Pantang landfill sites. The leachate pollution was determined using the Leachate
Pollution Index (LPI) by Kumar and Alappat (2003). Air pollution was determined using
the Air Quality Index formula by Rao and Rao (1989). Soil pollution was measured using
the Pollution load index by Tomlinson et al (1980). Leachate migration was assessed
using the formula by Kerndorff et al. (1992).
The LPI developed by Kumar and Alappat (2003) was used determine the extent of
pollution by leachate generated on the Pantang and Mallam landfill sites. LPI
determination was focused on the following pollutants for the two sites: Chromium, Iron,
Total Dissolved Solids, Biochemical Oxygen Demand, Chemical Oxygen Demand,
Copper, Nickel, Zinc, and Lead. The LPI value represents the level of leachate
contamination potential of a given landfill at a given time and ranges from 5 to 100.
It is an increasing scale index, where a higher value indicates a poor environmental
condition. The LPI was determined firstly by testing for the concentration of pollutants in
the leachate by analytical procedures. The concentrations of the pollutants were noted as
Ci. The pre-determined variable weight factors which constants are indicating the
importance of each pollutant variable to the overall leachate pollution was noted. The
Variable weight factors of the pollutants were noted Wi.
The pollutants and their variable weight factors are as follows pH: 0.055, chromium:
0.064, iron 0.045. Total Dissolved Solids: 0.050; Biochemical Oxygen Demand: 0.061;
Chemical Oxygen Demand: 0.062; Copper: 0.050; Nickel: 0.052; Zinc: 0.056; Lead:
0.063. the ‘p' values or sub-index values for all the parameters were computed from the
University of Ghana http://ugspace.ug.edu.gh

54
sub-index curves based on the concentration of the leachate pollutants obtained during
the tests.
The ‘p’ values were obtained by locating the concentration of the leachate pollutant on
the horizontal axis of the sub index curve for the pollutant in question and the leachate
pollution sub-index value was noted where it intersects the curve. The ‘p' values or sub-
index values for the parameters were noted as Pi. The ‘p’ values obtained above for all
the parameters are multiplied by their respective weights assigned to each parameter. The
equation below was used to calculate the LPI since the concentrations of only nine
parameters were used (Equation 5).
LPI= (ΣWiPi) ÷ (ΣWi) Equation 5
The Air Quality Index (AQI) was calculated by the formula given by Rao and Rao
(1989). The Air Quality Index (AQI) is a measure of the ratio of the pollutant
concentration in ambient air to the national standards of the pollutants (Equation 6).
API=1/n (P Cith/NSCith +…+ PCnth/NSCnth) x100 Equation 6
where,
PCith is the pollutant concentration of the ith pollutant,
NSCith is the National Standard concentration value of the ith pollutant,
PCnth is the pollutant concentration of the nth pollutant,
NSCnth is the National Standard Concentration value of the nth pollutant
n is the number of pollutant determined. For this study, the Air Quality Index (AQI) was
calculated using only the PM10 and TSP concentrations and calculated as (Equation 7).
University of Ghana http://ugspace.ug.edu.gh

55
API=1/2 (PM10 C/ PM10NSC) + (TSP C/ TSP NSC) x100 Equation 7
The Air Quality Index (AQI) scale is divided into five categories as follows (0-25) Clean
air, (26-50) Light air pollution, (51-75) moderate air pollution, (76-100) heavy air
pollution and (Above 100) severe air pollution.
The Pollution Load Index by Tomlinson et al. (1980) was used to determine the extent of
soil pollution. To obtain the Pollution Load Index (PLI) the concentration Factors (CF)
was first computed by dividing the concentration of the metals obtained for the soil
sampled (C metal) by the world average concentrations (C background value) for the
metals reported for shale by Turekian and Wedepohl (1961).
CF = (C metal) / (C background value) Equation 8
The PLI was calculated by obtaining the n-root from the n-CFs' that were obtained for all
the metals (Equation 9).
PLI=n√(CF1xCF2xCF3x…x CFn) Equation 9
Where,
CF = contamination factor,
n = number of metals C metal = metal concentration in polluted sediments
C Background value = background value of that metal.
The PLI value of > 1 is polluted, whereas <1 indicates no pollution Harikumar et al.,
2009).
The Kerndorff Formula was used to assess leachate migration by analysing the
concentrations of parameters in groundwater down-gradient from the landfill and the
University of Ghana http://ugspace.ug.edu.gh
56
concentrations in groundwater sampled sufficiently where it is not influenced by the
landfill derived contaminants. The well coded PG1 on the Pantang landfill was used for
this analysis since it is located down slope of the landfill site.
The impact on groundwater by the leachate migrating from the landfill was determined
using the Kerndorff contamination factor which represents the ratio of the measured
concentration in the groundwater down gradient of the landfill to the concentration in the
uncontaminated groundwater up-gradient of the site. A ratio value greater than 1.0 means
the parameter is leaking from the site and a ratio of 1.0 or lower indicates that the
parameter in not leaking; thus, the greater the leakage event, the greater the Kerndorff
contamination factor.
University of Ghana http://ugspace.ug.edu.gh

57
CHAPTER FOUR
RESULTS AND DISCUSSION
4.1. LEACHATE
4.1.1. pH
Leachate is generally found to have pH value of between 4.5- 9 (Christensen et al., 2001).
The pH of the leachate from the Pantang landfill ranged from 8.00-8.9 with a mean of
8.345 pH units and standard deviation of 0.263 (Appendix 2). The leachate from the
research location (coded PL4) on the Pantang landfill recorded the highest pH value of
8.9 in March and the research location (coded PL3) recorded the lowest pH of 8.0 in
April (Appendix 3). The pH of the leachate from the Mallam landfill ranged from 8.15 -
8.90 with a mean of 8.388 and standard deviation of 0.224.
The leachate from the research location coded M1L4 on the Mallam landfill recorded the
highest pH of 8.90 in February and M1L2 recorded the lowest pH of 8.15 in March
(Appendix 4). pH of the leachate from the Pantang and Mallam landfills lies within the
EPA guideline value of 6-9 (Appendix 2). Adeolu (2011) also recorded a pH value of 8.1.
Kulikowska and klimiuk (2008) and Tatsi and Zouboulis (2002) reported a range of pH
7.46–8.61 and 7.3–8.8 respectively, from old landfill sites.
The alkaline nature of the leachate from the Pantang and Mallam landfill sites is typical
of leachate from aged landfill sites (Aluko et al., 2003; Abbas et al., 2009). Precipitation
and the quantity and quality of waste may have also affected the pH recorded. The high
alkalinity may be a result of high organic strength of the leachate. Osei et al (2011) also
University of Ghana http://ugspace.ug.edu.gh

58
reported a pH range of 7.52 – 8.5 at the Oblogo dumpsite. Akiti (2012) reported a similar
pH range of 8.4 – 8.6 at the Oblogo landfill site. The high pH is an indication that the
waste decomposition is at the methanogenic phase. The sampling points PL5 and PL3;
and M1L4 showed decreasing trend with sampling period and the other sampling points
exhibited fluctuating trend with time. An analysis of variance for pH showed an
insignificant difference (P=0.636, P > 0.05) between recorded values.
4.1.2. Dissolved oxygen (DO)
DO of the leachate from the Pantang landfill ranged from 1-3.7 with a mean of 2.226 and
standard deviation of 0.894 (Appendix 2). The leachate from the research location (coded
PL3) on the Pantang landfill recorded the highest DO of 3.7 in February and the research
location (coded PL5) recorded the lowest value of 1.0 in February and April (Appendix 3,
Figure 4.1). DO of the leachate from the Mallam landfill ranged from 0.941 to 3.6 with a
mean of 2.184 mg/l and standard deviation of 0.822 (Appendix 2). The leachate from the
research location (coded M1L1) on the Mallam landfill recorded the highest DO of 3.6 in
April and the research location (coded M1L2) recorded the lowest of 0.941 in March
(Appendix 4, Figure 4.1). The DO for the leachate from the Pantang landfill showed
decreasing trend for PL1 and PL3 which indicates an increase in organic materials with
time thus causing the depletion in oxygen level as a result of decomposition, the
remaining sampling points showed fluctuating trend with time.
University of Ghana http://ugspace.ug.edu.gh
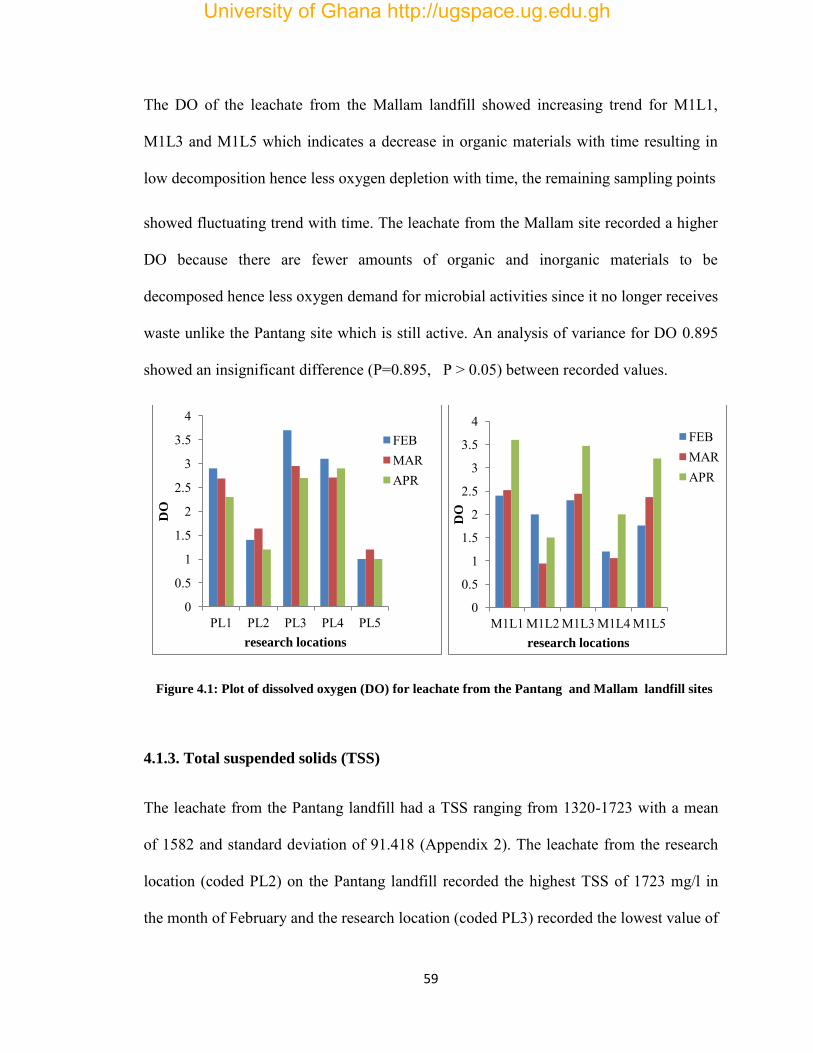
59
The DO of the leachate from the Mallam landfill showed increasing trend for M1L1,
M1L3 and M1L5 which indicates a decrease in organic materials with time resulting in
low decomposition hence less oxygen depletion with time, the remaining sampling points
showed fluctuating trend with time. The leachate from the Mallam site recorded a higher
DO because there are fewer amounts of organic and inorganic materials to be
decomposed hence less oxygen demand for microbial activities since it no longer receives
waste unlike the Pantang site which is still active. An analysis of variance for DO 0.895
showed an insignificant difference (P=0.895, P > 0.05) between recorded values.
Figure 4.1: Plot of dissolved oxygen (DO) for leachate from the Pantang and Mallam landfill sites
4.1.3. Total suspended solids (TSS)
The leachate from the Pantang landfill had a TSS ranging from 1320-1723 with a mean
of 1582 and standard deviation of 91.418 (Appendix 2). The leachate from the research
location (coded PL2) on the Pantang landfill recorded the highest TSS of 1723 mg/l in
the month of February and the research location (coded PL3) recorded the lowest value of
0
0.5
1
1.5
2
2.5
3
3.5
4
PL1 PL2 PL3 PL4 PL5
DO
research locations
FEB MAR APR
0
0.5
1
1.5
2
2.5
3
3.5
4
M1L1 M1L2 M1L3 M1L4 M1L5
DO
research locations
FEB MAR APR
University of Ghana http://ugspace.ug.edu.gh

60
320 mg/l in February (Appendix 3). TSS of the leachate from the Mallam landfill ranged
from 209-391 mg/l with a mean of 266.467 mg/l and standard deviation of 49.492
(Appendix 2). The leachate coded M1L5 from the Mallam landfill recorded the highest
Total Suspended Solids (TSS) of 391mg/l in March and M1L2 recorded the lowest of 209
mg/l in February (Appendix 4). The TSS measured for the leachates from the Pantang
and Mallam landfills were above the EPA guideline of 50mg/l for effluent discharge into
the environment (Appendix 2). The high TSS concentration indicates the presence of
large amounts of organic and inorganic materials in the leachate.
The research locations (coded PL5) and (coded M1L3) exhibited increasing trend with
time; the other points showed fluctuating trend across the sampling period and this may
be due to uneven distribution of organic and inorganic substances across the sampling
points. The leachate from the Mallam landfill recorded a lower TSS concentration
compared to that of Pantang because of aging. An analysis of variance for TSS showed a
significant difference (P=0.000 P< 0.05) between recorded values.
4.1.4. Turbidity (Tur)
The turbidity of the leachate from the Pantang landfill ranged from 93-309 with a mean
of 213.973 and standard deviation of 85.581 (Appendix 2). The leachate from the
research location (coded PL4) on the Pantang landfill recorded the highest turbidity of
309 NTU in the march and the research location (coded PL3) recorded the lowest of 93
NTU in February (Appendix 3). Turbidity of the leachate from the Mallam landfill
ranged from 127-194 NTU with a mean of 152.507 and standard deviation of 18.771
University of Ghana http://ugspace.ug.edu.gh
61
(Appendix 2). The research location coded M1L2 from the Mallam landfill recorded the
highest turbidity of 194 NTU in March and M1L5 recorded the lowest of 127 NTU in
February and April (Appendix 4).
The turbidity of the leachate from the Pantang and Mallam landfills were above the EPA
guideline value of 75 NTU for effluent discharge into the environment (Appendix 2).
Osei et al (2011) reported a turbidity of 750 – 1490 NTU at the Oblogo dumpsite. The
high turbidity may be due to the presence of dissolved organic substances. The high
turbidity recorded for the leachate from Pantang in March may be due to rainfall which
dissolved organic and inorganic materials into the leachate and also caused a disturbance
in the leachate column leading to suspension of materials in solution. The leachate from
the Mallam landfill recorded a lower turbidity compared to that of Pantang because of
aging. An analysis of variance for turbidity showed a significant difference (P=0.011
P< 0.05) between recorded values.
4.1.5. Electrical conductivity (EC)
EC of the leachate from the Pantang landfill ranged from 50163-74830 with a mean of
63463 and standard deviation of 8543.705 (Appendix 2). The leachate from the research
location (coded PL3) on the Pantang landfill recorded the highest EC of 74830S/cm in
April and the research location (coded PL3) recorded the lowest 50163S/cm in March
(Appendix 3). The EC of the leachate from the Mallam landfill ranged from 10150 –
36490 with a mean of 19232.267S/cm and standard deviation (9066.951) (Appendix 2).
The leachate from the research location (coded M1L1) on the Mallam landfill recorded
University of Ghana http://ugspace.ug.edu.gh
62
the highest electrical conductivity (EC) of 36490S/cm in March and the research
location M1L1 recorded the lowest of 10150S/cm February (Appendix 4).
The electrical conductivity of the leachates from the Pantang and Mallam landfills were
above the EPA guideline value of 1500S/cm for effluent discharge into the environment
(Appendix 2). Adeolu et al. (2011) recorded an EC value of 12400. Nyame et al. (2012)
reported a value of 7960 – 24890 at Oblogo. The high EC indicates the presence of
dissolved materials in the leachate.
The leachate from the Mallam landfill recorded a lower electrical conductivity compared
to that of Pantang because of aging. The leacahte sampling points for Pantang showed
fluctuating trend with time indicating uneven distribution of dissolved materials in time
and space. The research locations coded M1L2, M1L3 and M1L4 showed decreasing
trend with time and this may be due to increasing age. An analysis of variance for EC
showed a significant difference (P=0.000 P< 0.05) between recorded values
4.1.6. Total dissolved solids (TDS)
TDS of the leachate from the Pantang landfill ranged from 20134-48141 with a mean of
32923.933 and standard deviation of 7274.217 (Appendix 2). The leachate from the
research location (coded PL1) on the Pantang landfill recorded the highest TDS of
48141mg/l in March and the research location (coded PL5) recorded the lowest
20134mg/l in February (Appendix 3, Figure 4.2). The TDS of the leachate from the
Mallam landfill ranged from 1649-4325 mg/l with a mean of 3135.667 mg/l and standard
deviation of 990.548 (Appendix 2). The leachate from the research location (coded
University of Ghana http://ugspace.ug.edu.gh
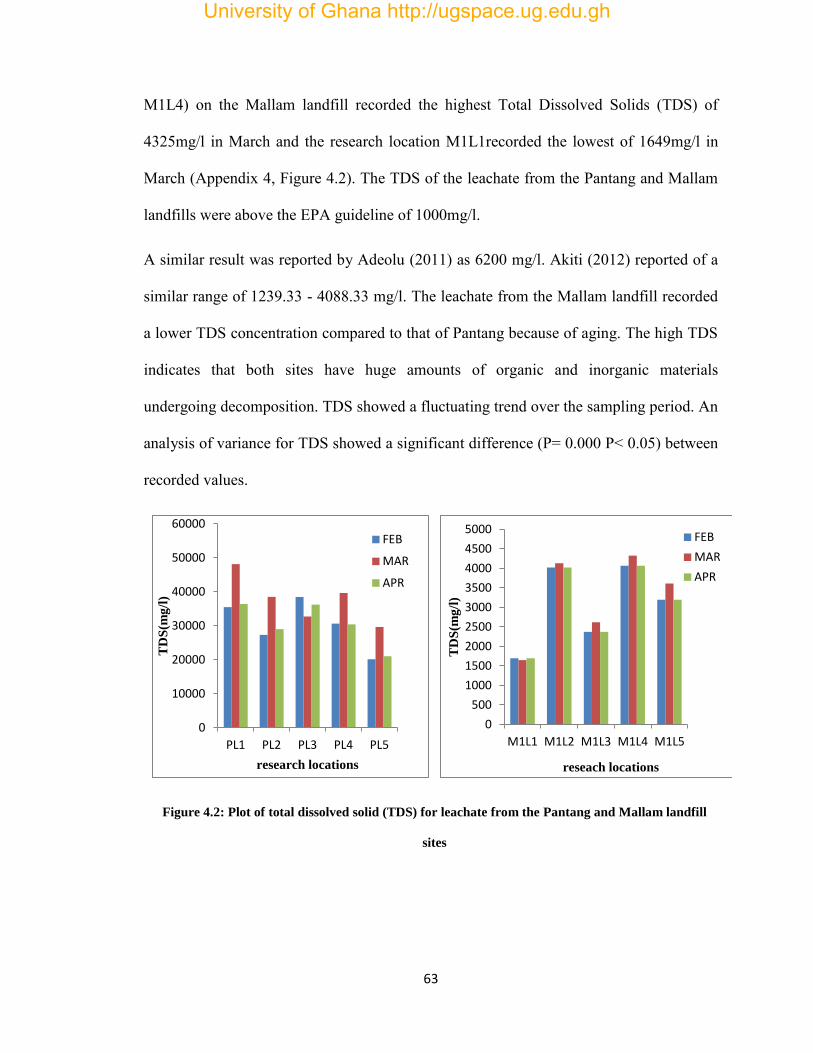
63
M1L4) on the Mallam landfill recorded the highest Total Dissolved Solids (TDS) of
4325mg/l in March and the research location M1L1recorded the lowest of 1649mg/l in
March (Appendix 4, Figure 4.2). The TDS of the leachate from the Pantang and Mallam
landfills were above the EPA guideline of 1000mg/l.
A similar result was reported by Adeolu (2011) as 6200 mg/l. Akiti (2012) reported of a
similar range of 1239.33 - 4088.33 mg/l. The leachate from the Mallam landfill recorded
a lower TDS concentration compared to that of Pantang because of aging. The high TDS
indicates that both sites have huge amounts of organic and inorganic materials
undergoing decomposition. TDS showed a fluctuating trend over the sampling period. An
analysis of variance for TDS showed a significant difference (P= 0.000 P< 0.05) between
recorded values.
Figure 4.2: Plot of total dissolved solid (TDS) for leachate from the Pantang and Mallam landfill
sites
0
10000
20000
30000
40000
50000
60000
PL1 PL2 PL3 PL4 PL5
TD
S(m
g/l
)
research locations
FEB
MAR
APR
0
500
1000
1500
2000
2500
3000
3500
4000
4500
5000
M1L1 M1L2 M1L3 M1L4 M1L5
TD
S(m
g/l
)
reseach locations
FEB
MAR
APR
University of Ghana http://ugspace.ug.edu.gh

64
4.1.7. Biological oxygen demand (BOD)
The BOD of Pantang leachate ranged from 124-293 with a mean of 192.133 and standard
deviation of 51.017 (Appendix 2). The leachate from the research location (coded PL5)
on the Pantang landfill recorded the highest BOD of 293mg/l February and the research
location coded PL3 recorded the lowest 124mg/l in February (Appendix 3). The BOD of
the leachate from the Mallam landfill ranged from 123 – 207 with a mean of 160.6 mg/l
and standard deviation of 28.623 (Appendix 2). The leachate from the research location
(coded M1L2) on the Mallam landfill recorded the highest Biological Oxygen Demand
(BOD) of 207mg/l in April and the research location coded M1L1 recorded the lowest
123 mg/l in April (Appendix 4). The BOD of the leachate from the Pantang and Mallam
landfills were above the EPA guideline of 50mg/l which indicates the high organic
strength of the leachate. The leachate from the Mallam landfill recorded a lower BOD
because of aging.
A BOD of 152.10 was reported by Osei et al (2011) also reported a BOD of 66.7 – 100.
The leachate from the Pantang landfill recorded a higher BOD over that of Mallam
because it is still an active site whilst the Mallam is not. The concentration of BOD of the
leachate from the Pantang landfill increased across the research locations from (PL1) to
(PL4) with time and decreased at PL5 with time. For leachate from the Mallam site, the
concentration of BOD decreased at the research locations (M1L1), (M1L3) and (M1L5);
and increased at (M1L2) and (M1l4). An analysis of variance for BOD showed a
significant difference (P=0.046 P< 0.05) between recorded values.
University of Ghana http://ugspace.ug.edu.gh
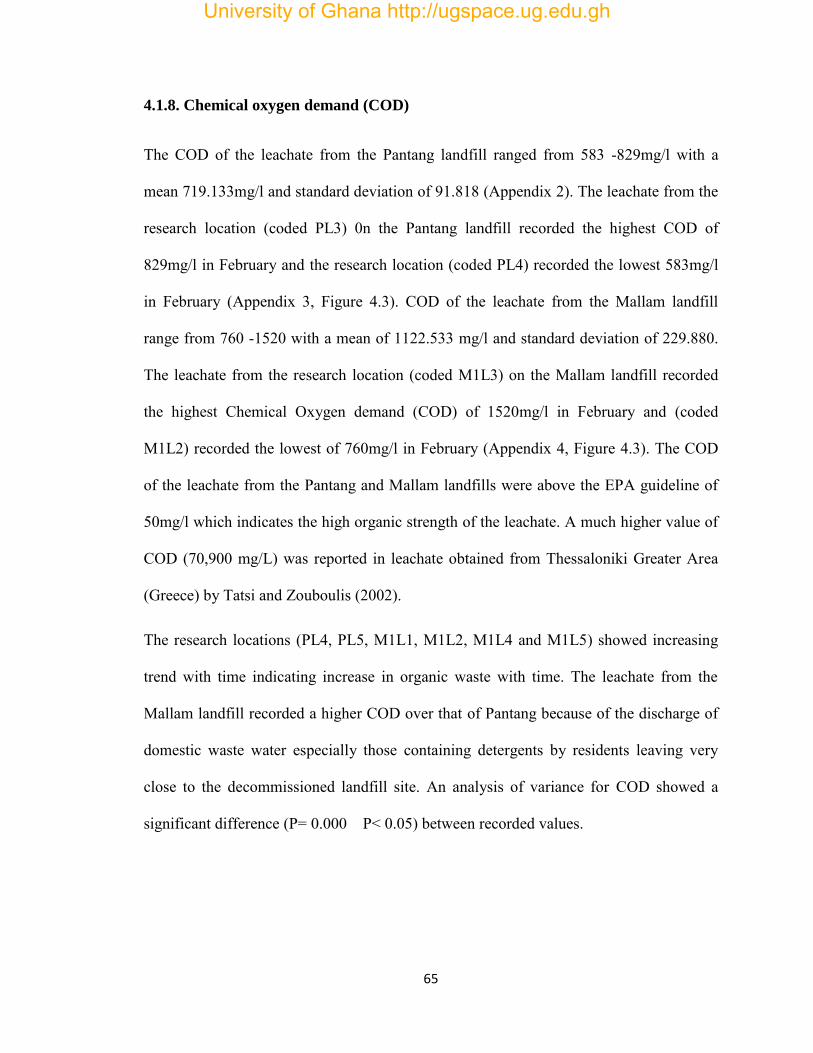
65
4.1.8. Chemical oxygen demand (COD)
The COD of the leachate from the Pantang landfill ranged from 583 -829mg/l with a
mean 719.133mg/l and standard deviation of 91.818 (Appendix 2). The leachate from the
research location (coded PL3) 0n the Pantang landfill recorded the highest COD of
829mg/l in February and the research location (coded PL4) recorded the lowest 583mg/l
in February (Appendix 3, Figure 4.3). COD of the leachate from the Mallam landfill
range from 760 -1520 with a mean of 1122.533 mg/l and standard deviation of 229.880.
The leachate from the research location (coded M1L3) on the Mallam landfill recorded
the highest Chemical Oxygen demand (COD) of 1520mg/l in February and (coded
M1L2) recorded the lowest of 760mg/l in February (Appendix 4, Figure 4.3). The COD
of the leachate from the Pantang and Mallam landfills were above the EPA guideline of
50mg/l which indicates the high organic strength of the leachate. A much higher value of
COD (70,900 mg/L) was reported in leachate obtained from Thessaloniki Greater Area
(Greece) by Tatsi and Zouboulis (2002).
The research locations (PL4, PL5, M1L1, M1L2, M1L4 and M1L5) showed increasing
trend with time indicating increase in organic waste with time. The leachate from the
Mallam landfill recorded a higher COD over that of Pantang because of the discharge of
domestic waste water especially those containing detergents by residents leaving very
close to the decommissioned landfill site. An analysis of variance for COD showed a
significant difference (P= 0.000 P< 0.05) between recorded values.
University of Ghana http://ugspace.ug.edu.gh
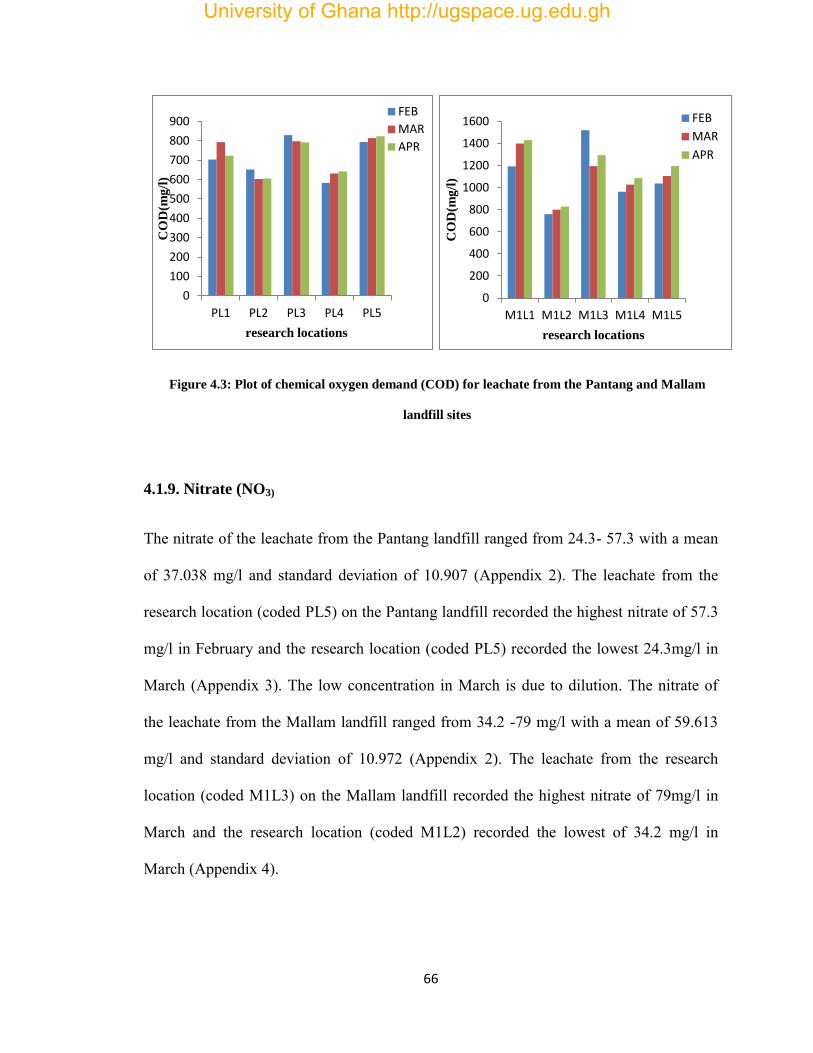
66
Figure 4.3: Plot of chemical oxygen demand (COD) for leachate from the Pantang and Mallam
landfill sites
4.1.9. Nitrate (NO3)
The nitrate of the leachate from the Pantang landfill ranged from 24.3- 57.3 with a mean
of 37.038 mg/l and standard deviation of 10.907 (Appendix 2). The leachate from the
research location (coded PL5) on the Pantang landfill recorded the highest nitrate of 57.3
mg/l in February and the research location (coded PL5) recorded the lowest 24.3mg/l in
March (Appendix 3). The low concentration in March is due to dilution. The nitrate of
the leachate from the Mallam landfill ranged from 34.2 -79 mg/l with a mean of 59.613
mg/l and standard deviation of 10.972 (Appendix 2). The leachate from the research
location (coded M1L3) on the Mallam landfill recorded the highest nitrate of 79mg/l in
March and the research location (coded M1L2) recorded the lowest of 34.2 mg/l in
March (Appendix 4).
0
100
200
300
400
500
600
700
800
900
PL1 PL2 PL3 PL4 PL5
CO
D(m
g/l
)
research locations
FEB
MAR
APR
0
200
400
600
800
1000
1200
1400
1600
M1L1 M1L2 M1L3 M1L4 M1L5
CO
D(m
g/l
)
research locations
FEB
MAR
APR
University of Ghana http://ugspace.ug.edu.gh

67
For leachate from Pantang, with the exception of nitrate concentration measured on the
sampling point PL5 in February and April, all the other nitrate concentrations were below
the EPA guideline of 50mg/l. for leachate from the Mallam landfill site, with the
exception of nitrate concentrations measured at M1L2 in march and M1L3 in February,
all the other sampling points recorded a concentration above the EPA guideline value.
The leachate from the Mallam landfill recorded a higher nitrate over that of Pantang
because of the discharge of domestic waste water especially those containing detergents
by residents leaving very close to the decommissioned landfill site. An analysis of
variance for nitrate showed a significant difference (P= 0.000 P< 0.05) between recorded
values.
4.1.10. Nitrite (NO2)
The nitrite of the leachate from the Pantang landfill ranged from 2.95-6.90 with a mean
of 4.741 and standard deviation of 1.165 (Appendix 2). The leachate from the research
location (coded PL2) on the Pantang landfill recorded the highest nitrite of 6.9 mg/l in
April and the research location (coded PL5) recorded the lowest 2.95 mg/l in February
(Appendix 3). The nitrite of the leachate from the Mallam landfill ranged from 0.745 -
2.847 mg/l with a mean of 1.602 mg/l and standard deviation of 0.632.
The leachate from the research location (coded M1L3) on the Mallam landfill recorded
the highest nitrite of 2.847 mg/l in March and research the location (coded M1L2)
recorded the lowest 0.745 mg/l in April (Appendix 4). The leachate from the Mallam
landfill recorded a lower nitrite concentration compared to that of Pantang because of
University of Ghana http://ugspace.ug.edu.gh
68
aging An analysis of variance for nitrite showed a significant difference (P= 0.000 P<
0.05) between recorded values.
4.1.11. Ammonia (NH3)
NH3 of the leachate from the Pantang landfill ranged from 2.5-5.10 with a mean of 3.831
and standard deviation of 0.797 (Appendix 2). The leachate from the research location
(coded PL3) on the Pantang landfill recorded the highest ammonia of 5.10 mg/l in
February and the research location (coded PL2) recorded the lowest 2.5 mg/l in April
(Appendix 3, Figure 4.4). The ammonia of the leachate from the Mallam landfill ranged
from 0.58 -1.93 with a mean of 1.169 mg/l and standard deviation of 0.406. The leachate
from the research location (coded M1L4) on the Mallam landfill recorded the highest
ammonia of 1.93 mg/l in February and the research location (coded M1L1) recorded the
lowest 0.58 mg/l in February (Appendix 4, Figure 4.4). The concentration of NH3 of the
leachate from the Pantang and Mallam landfill were higher than the EPA guideline of
1.0mg/l. Adeolu (2011) reported a similar value of 4.5.
The high NH3 concentration may be due to the deamination of amino acids during the
decomposition of organic materials in the waste. The leachate from the Mallam landfill
recorded a lower ammonia concentration compared to that of Pantang because of aging
and also because it has been decommissioned since ammonia concentration increase with
land filling. Ammonia showed a fluctuating trend over the sampling points and this may
be due to uneven distribution of organic substances across the sampling points with the
exception of PL3, PL4, M1L4 and M1L5 which exhibited decreasing trend with time
which may be due to reduction in organic materials with time; and M1L1 and M1L5
University of Ghana http://ugspace.ug.edu.gh
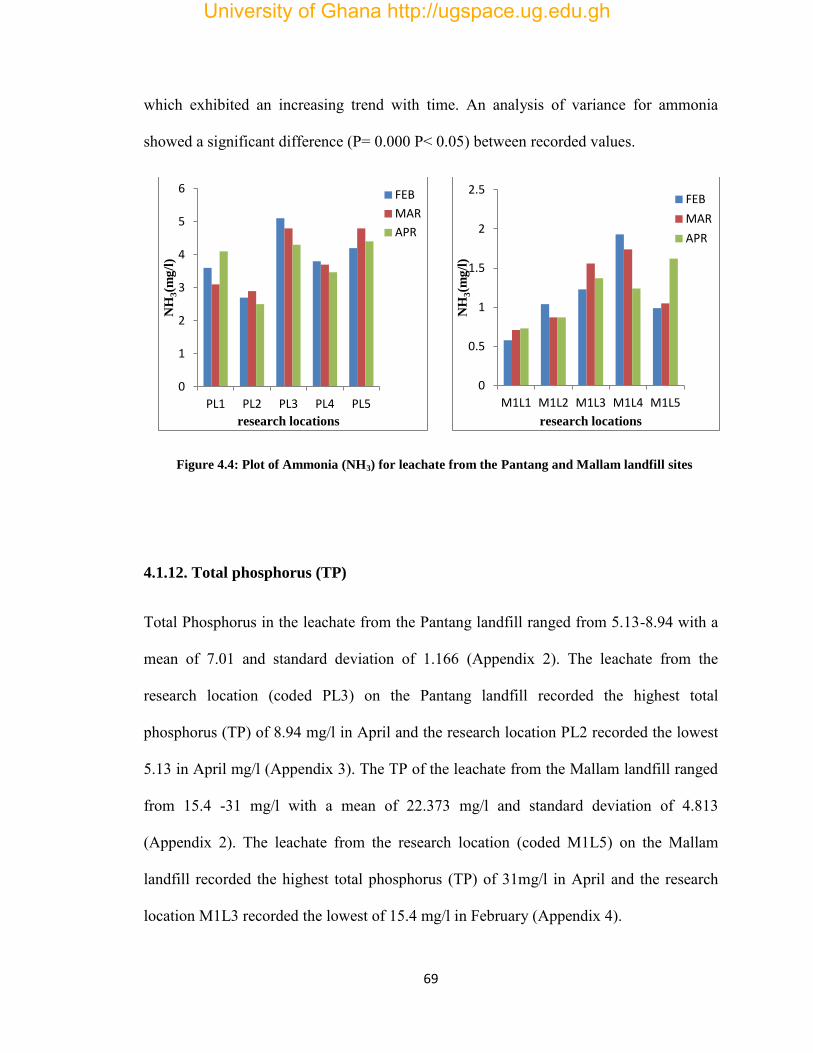
69
which exhibited an increasing trend with time. An analysis of variance for ammonia
showed a significant difference (P= 0.000 P< 0.05) between recorded values.
Figure 4.4: Plot of Ammonia (NH3) for leachate from the Pantang and Mallam landfill sites
4.1.12. Total phosphorus (TP)
Total Phosphorus in the leachate from the Pantang landfill ranged from 5.13-8.94 with a
mean of 7.01 and standard deviation of 1.166 (Appendix 2). The leachate from the
research location (coded PL3) on the Pantang landfill recorded the highest total
phosphorus (TP) of 8.94 mg/l in April and the research location PL2 recorded the lowest
5.13 in April mg/l (Appendix 3). The TP of the leachate from the Mallam landfill ranged
from 15.4 -31 mg/l with a mean of 22.373 mg/l and standard deviation of 4.813
(Appendix 2). The leachate from the research location (coded M1L5) on the Mallam
landfill recorded the highest total phosphorus (TP) of 31mg/l in April and the research
location M1L3 recorded the lowest of 15.4 mg/l in February (Appendix 4).
0
1
2
3
4
5
6
PL1 PL2 PL3 PL4 PL5
NH
3(m
g/l
)
research locations
FEB
MAR
APR
0
0.5
1
1.5
2
2.5
M1L1 M1L2 M1L3 M1L4 M1L5
NH
3(m
g/l
)
research locations
FEB
MAR
APR
University of Ghana http://ugspace.ug.edu.gh

70
The total phosphorus of the leachate from the Pantang and Mallam landfills were above
the EPA guideline of 2.0 mg/l and this may be due to the presence of organic materials
and detergent cans on the landfill site. The concentration of TP showed a fluctuating
trend over the sampling period for both landfills. The leachate from the Mallam landfill
recorded a higher TP over that of Pantang because of the discharge of domestic waste
water especially those containing detergents by residents leaving very close to the
decommissioned landfill site. An analysis of variance for total phosphorus showed a
significant difference (P= 0.000 P< 0.05) between recorded values.
4.1.13. Sulphate (SO4)
Sulphate of the leachate from the Pantang landfill ranged from 989-1982 with a mean of
1451.933 and standard deviation of 376.906 (Appendix 2). The leachate from the
research location (coded PL1) on the Pantang landfill recorded the highest sulphate of
1982mg/l in February and the research location (coded PL4) recorded the lowest 989mg/l
in February (Appendix 3). Sulphate of the leachate from the Mallam landfill ranged from
108 - 290 with a mean of 210.533 mg/l and standard deviation of 53.235. The leachate
from the research location (coded M1L2) on the Mallam landfill recorded the highest
sulphate of 290mg/l in March and the research location (coded M1L1) recorded the
lowest 108 mg/l march (Appendix 4). The concentration of SO4 of the leachate from the
Pantang landfill exceeded the EPA guideline value of 200mg/l for effluent discharge into
the environment.
University of Ghana http://ugspace.ug.edu.gh
71
For leachate from the Pantang landfill SO4 showed a fluctuating trend over the research
locations (coded PL2, PL3, and PL4) and this may be due to uneven distribution of
organic substances across the sampling points. The sampling points PL1 and PL5
exhibited decreasing and increasing trend respectively. For the leacahte from the Mallam
landfill, SO4 showed fluctuating trend over the research locations M1L1 and M1L2;
M1L3 showed a decreasing trend whilst M1L4 and M1L5 showed increasing trend with
time. The leachate from the Mallam landfill recorded a lower sulphate concentration
compared to that of Pantang because of aging An analysis of variance for sulphate
showed a significant difference (P=0.000 P< 0.05) between recorded values.
4.1.14. Sulphite (SO3)
Sulphite of the leachate from the Pantang landfill varied from 39-77 mg/l with a mean of
58.16 mg/l and standard deviation of 11.104 (Appendix 2). The leachate from the
research location (coded PL3) on the Pantang landfill recorded the highest sulphite of
77mg/l in April and the research location (coded PL5) recorded the lowest 39 mg/l in
February (Appendix 3, Figure 4.5). Sulphite of the leachate from the Mallam landfill
ranged from 4.30 -8.70 with a mean of 7.434 mg/l and standard deviation of 1.195.
The leachate from the research location (coded M1L1) on the Mallam landfill recorded
the highest sulphite of 8.70 mg/l in April and the research location (coded M1L1)
recorded the lowest 4.30 mg/l February (Appendix 4, Figure 4.5). The leachate from the
Mallam landfill recorded a lower sulphite concentration compared to that of Pantang
University of Ghana http://ugspace.ug.edu.gh

72
because of aging. An analysis of variance for sulphite showed a significant difference (P=
0.000 P< 0.05) between recorded values.
Figure 4.5: Plot of Sulphite (SO3) for leachate from the Pantang and Mallam landfill sites
4.1.15. Zinc (Zn)
Zinc concentration of leachate from the Pantang landfill ranged from 10.43-23.01 mg/l
with a mean of 15.692 mg/l and standard deviation of 3.988 (Appendix 2). The leachate
from the research location (coded PL2) on the Pantang landfill recorded the highest Zn of
23.01 mg/l in March and the research location (coded PL5) recorded the lowest
concentration of 10.43mg/l in April (Appendix 3). The Zn of the leachate from the
Mallam landfill ranged from 0.145 - 0.984 with a mean of 0.549 and standard deviation
of 0.237 (Appendix 2). The leachate from the research location (coded M1L1) on the
Mallam landfill recorded the highest Zn of 0.984 mg/l in April and the research location
0
10
20
30
40
50
60
70
80
90
PL1 PL2 PL3 PL4 PL5
SO
3(m
g/l
)
research locations
FEB
MAR
APR
0
1
2
3
4
5
6
7
8
9
10
M1L1 M1L2 M1L3 M1L4 M1L5 S
O3(m
g/l
)
research locations
FEB
MAR
APR
University of Ghana http://ugspace.ug.edu.gh
73
(coded M1L2) recorded the lowest 0.145 mg/l in March (Appendix 4). The zinc
concentration of the leachate from the Pantang landfill was above the EPA guideline of
5mg/l.
Adeolu (2011) recorded a zinc value of 9.0. The presence of zinc in the leachate is an
indication that the landfill receives waste that contains batteries, solders, paints,
pigments, alloys, fluorescent tubes and lamps. It also indicates the burning of tyres at the
site. The Zn concentration of the leachate from the Mallam landfill was below the EPA
guideline value of 5.0mg/l. With the exception of PL4, M1L1, M1L3 and M1L5, the
other research locations exhibited fluctuating trend with time. The leachate from the
Mallam landfill recorded a lower Zn concentration compared to that of Pantang because
of aging. An analysis of variance for Zn showed a significant difference (P= 0.000 P<
0.05) between recorded values.
4.1.16. Copper (Cu)
Copper concentration of leachate from the Pantang landfill ranged from 1.317-2.61 with a
mean of 1.978 and standard deviation of 0.461 (Appendix 2). The leachate from the
research location (coded PL5) on the Pantang landfill recorded the highest Cu of 2.61
mg/l in April and the research location (coded PL1) recorded the lowest 1.317mg/l in
April (Appendix 3). The Cu of the leachate from the Mallam landfill ranged from 0.120 -
0.345 with a mean of 0.224 and standard deviation of 0.064.The leachate from the
research location (coded M1L3) on the Mallam landfill recorded the highest Cu of 0.345
University of Ghana http://ugspace.ug.edu.gh

74
mg/l in February and the research location (coded M1L1) recorded the lowest 0.120 mg/l
February (Appendix 4).
The Cu concentration of the leachate from the Mallam landfill was below the EPA
guideline value of 2.5. The concentration of Copper showed an increasing trend across
the research locations M1L1 to M1L5 in February for leachate from Mallam landfill
(Appendix 4). Copper concentration of the leachate from the Pantang landfill showed a
fluctuating trend across the sampling points and this may be due to uneven distribution of
copper contained substances across the sampling points. . The leachate from the Mallam
landfill recorded a lower Cu concentration compared to that of Pantang because of aging.
An analysis of variance for Cu showed a significant difference (P= 0.000 P< 0.05)
between recorded values.
4.1.17. Chromium (Cr)
Chromium of the leachate from the Pantang landfill ranged from 2.73- 5.99 with a mean
of 4.386 and standard deviation of 1.143 (Appendix 2). The leachate from the research
location (coded PL1) on the Pantang landfill recorded the highest Cr of 5.99 mg/l in
February and the research location (coded PL2) recorded the lowest 2.73 mg/l in
February (Appendix 3, Figure 4.6). The Cr of the leachate from the Mallam landfill
ranged from 0.073 - 0.474 with a mean 0.241 and standard deviation of 1.165.
The leachate from the research location (coded M1L1) on the Mallam landfill recorded
the highest Cr of 0.474 mg/l in April and the research location coded M1L5 recorded the
lowest 0.073 mg/l April (Appendix 4, Figure 4.6). The mean for the concentrations of
chromium in the leachate from the Pantang landfill was above the EPA guideline of 0.5
University of Ghana http://ugspace.ug.edu.gh

75
mg/l and this indicates that the landfill receives waste that contains stainless steel,
batteries, solders, paints, pigments, alloys, cement, paper, rubber, fluorescent tubes and
lamps. Akiti (2012) reported a range of 0.05 – 0.23 mg/l.
Nyame et al. (2012) reported a range of 2.05 – 18 mg/l for leachate from the Oblogo
landfill site. The mean concentration of chromium of the leachate from the Mallam
landfill were above the EPA guideline value of 0.5 mg/l and this indicates that the landfill
had received waste that contained stainless steel, batteries, solders, paints, pigments,
alloys, cement, paper, rubber, fluorescent tubes and lamps before it closure. The
concentration of chromium for both sites showed a fluctuating trend across the sampling
points and this may be due to uneven distribution of chromium contained substances
across the sampling points. The leachate from the Mallam landfill recorded a lower Cr
concentration compared to that of Pantang because of aging. An analysis of variance for
Cr showed a significant difference (P= 0.000 P< 0.05) between recorded values.
Figure 4.6: Plot of Chromium (Cr) for leachate from the Pantang and Mallam landfill sites
0
1
2
3
4
5
6
7
PL1 PL2 PL3 PL4 PL5
Cr(
mg
/l)
research locations
FEB
MAR
APR
0
0.05
0.1
0.15
0.2
0.25
0.3
0.35
0.4
0.45
0.5
M1L1 M1L2 M1L3 M1L4 M1L5
Cr(
mg
/l)
research locations
FEB
MAR
APR
University of Ghana http://ugspace.ug.edu.gh
76
4.1.18. Lead (Pb)
The leachate sampled from Pantang had a lead concentration ranging from 0.267-0.952
with a mean of 0.609 and standard deviation of 0.200 (Appendix 2).The leachate from the
research location (coded PL1) on the Pantang landfill recorded the highest Pb of 0.952
mg/l February and the research location (coded PL4) recorded the lowest 0.267 mg/l in
March (Appendix 3).
The Pb of the leachate from the Mallam landfill ranged from 0.094 - 0.343 with a mean
of 0.186 mg/l and standard deviation of 0.075 (Appendix 2).The leachate from the
research location (coded M1L5) on the Mallam landfill recorded the highest Pb of 0.343
mg/l in April and the research location (coded M1L2) recorded the lowest of 0.094 mg/l
February. The Lead content of the leachate from the Pantang landfill was higher than the
EPA guideline of 0.1.
Said (2012) reported a lead value of 1.55. Aluko et al (2002) reported a mean
concentration of lead from1.34-1.639 mg/L. The presence of lead indicates the disposal
of lead batteries, chemicals for photograph processing, paints, plastics and lead based
paints and pipes at the landfill. For leachate from the Mallam landfill site, all the
sampling points recorded a high lead concentration with time with the exception of M1L2
which recorded a lower concentration in February and April. The leachate from the
Mallam landfill recorded a lower Pb concentration compared to that of Pantang because
of aging. An analysis of variance for Pb showed a significant difference (P= 0.000 P<
0.05) between recorded values.
University of Ghana http://ugspace.ug.edu.gh
77
4.1.19. Manganese (Mn)
Manganese of the leachate from the Pantang landfill ranged from 1.359 -4.51 with a
mean of 2.267 and standard deviation of 1.066 (Appendix 2). The leachate from the
research location (coded PL5) on the Pantang landfill recorded the highest Mn of 4.51
mg/l in March and the research location coded PL1 recorded the lowest 1.359 mg/l in
February (Appendix 3). The Mn of the leachate from the Mallam landfill ranged from
0.110 - 0.793 with a mean of 0.353 and standard deviation of 0.231 (Appendix 2). The
leachate from the research location (coded M1L3) on the Mallam landfill recorded the
highest Mn of 0.793 mg/l April and the research location coded M1L2 recorded the
lowest 0.110 mg/l in March (Appendix 4). The Mn concentration of the leachate from the
Pantang landfill was above the EPA guideline of 2.5mg/l. The presence of Mn indicates
the disposal of lead batteries, chemicals for photograph processing and paints at the
landfill.
The Mn concentration was below the EPA guideline value of 2.5 (Appendix 2). The
leachate from the Mallam landfill recorded a lower Mn concentration compared to that of
Pantang landfill because of aging. For the leachate from the Mallam landfill, Mn showed
a fluctuating trend across the sampling points with time and this may be due to uneven
distribution of Mn containing substances across the sampling points. For leachate from
the Pantang landfill, the sampling points PL1, PL and PL4 exhibited increasing trend
with time. An analysis of variance for Mn showed a significant difference (P= 0.000 P<
0.05) between recorded values
University of Ghana http://ugspace.ug.edu.gh

78
4.1.20. Iron (Fe)
Iron of the leachate from the Pantang landfill ranged from 29.5 -58.3 with an average of
43.19 and standard deviation of 9.070 (Appendix 2). The leachate from the research
location (PL3) on the Pantang landfill recorded the highest Fe of 58.3 mg/l in February
and the research location coded PL5 recorded the lowest 29.5 mg/l in February
(Appendix 3). The Fe of the leachate from the Mallam landfill ranged from 11.62 -18.97
with a mean of 15.734 mg/l and standard deviation of 2.588 (Appendix 2).
The leachate from the research location (coded M1L4) on the Mallam landfill recorded
the highest Fe of 18.97 mg/l in April and the research location coded M1L2 recorded the
lowest of 11.62 mg/l February (Appendix 4). The concentrations of Fe showed a
fluctuating trend with time across the sampling points of both landfills and this may be
due to uneven distribution of Fe containing substances across the sampling points.
The leachate from the Mallam landfill recorded a lower Fe concentration compared to
that of Pantang because of aging. The high level of Fe in leachate indicates that iron/steel
scrap was damped at the site. The oxidation of ferrous Fe to ferric Fe and the foundation
of Ferric hydroxide colloids and complexes with humic substances are responsible for the
dull colour of leachate (Chu et al 1994). Fe level of 70.62 mg/L was reported by Mor
(2006). A mean value of 73.60 was reported by Said (2012). An analysis of variance for
Fe showed a significant difference (P= 0.000 P< 0.05) between recorded values.
University of Ghana http://ugspace.ug.edu.gh
79
4.1.21. Cadmium (Cd)
Cd of the leachate from the Pantang landfill ranged from 0.019-0.099 with a mean of
0.077 and standard deviation of 0.020 (Appendix 2). The leachate from the research
location (coded PL5) on the Pantang landfill recorded the highest Cd of 0.099 mg/l in
April and the research location coded PL1 recorded the lowest 0.019 mg/l march
(Appendix 3, Figure 4.7). The Cd of the leachate from the Mallam landfill ranged from
0.014 - 0.097 with a mean of 0.054 and standard deviation of 0.027 (Appendix 2). The
leachate from the research location (coded M1L4) on the Mallam landfill recorded the
highest Cd of 0.097 mg/l in February and the research location coded M1L2 recorded the
lowest 0.014 mg/l in April (Appendix 4, Figure 4.7).
The concentrations of Cd of the leachate from the Pantang and Mallam landfills were
observed to be below the EPA guideline of 0.1.with the exception of PL2, M1L2and
M1L4 which showed decreasing trend with time ,all the other sampling points for the two
landfills exhibited a showed fluctuating trend across the sampling points with time. Azim
(2011) observed a similar level of 0.0056mg/l. The leachate from the Mallam landfill
recorded a lower Cd concentration compared to that of Pantang because of aging. An
analysis of variance for Cd showed a significant difference (P=0.012 P< 0.05) between
recorded values.
University of Ghana http://ugspace.ug.edu.gh
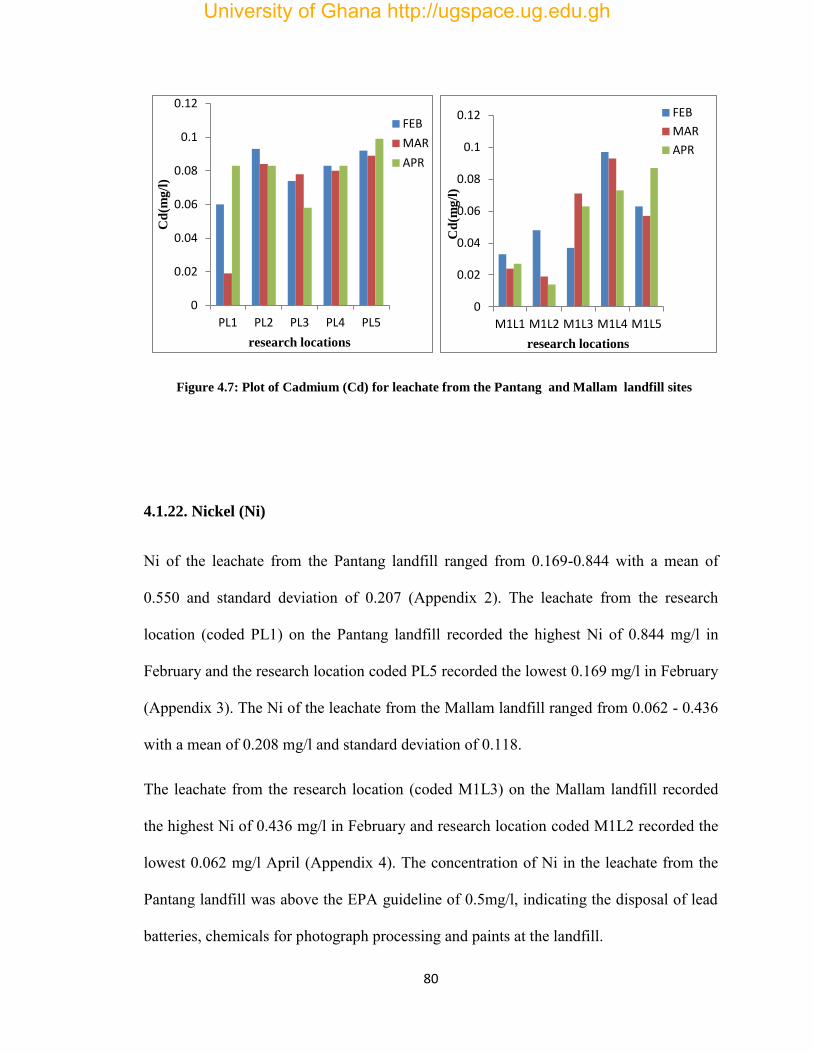
80
Figure 4.7: Plot of Cadmium (Cd) for leachate from the Pantang and Mallam landfill sites
4.1.22. Nickel (Ni)
Ni of the leachate from the Pantang landfill ranged from 0.169-0.844 with a mean of
0.550 and standard deviation of 0.207 (Appendix 2). The leachate from the research
location (coded PL1) on the Pantang landfill recorded the highest Ni of 0.844 mg/l in
February and the research location coded PL5 recorded the lowest 0.169 mg/l in February
(Appendix 3). The Ni of the leachate from the Mallam landfill ranged from 0.062 - 0.436
with a mean of 0.208 mg/l and standard deviation of 0.118.
The leachate from the research location (coded M1L3) on the Mallam landfill recorded
the highest Ni of 0.436 mg/l in February and research location coded M1L2 recorded the
lowest 0.062 mg/l April (Appendix 4). The concentration of Ni in the leachate from the
Pantang landfill was above the EPA guideline of 0.5mg/l, indicating the disposal of lead
batteries, chemicals for photograph processing and paints at the landfill.
0
0.02
0.04
0.06
0.08
0.1
0.12
PL1 PL2 PL3 PL4 PL5
Cd
(mg
/l)
research locations
FEB
MAR
APR
0
0.02
0.04
0.06
0.08
0.1
0.12
M1L1 M1L2 M1L3 M1L4 M1L5
Cd
(mg
/l)
research locations
FEB
MAR
APR
University of Ghana http://ugspace.ug.edu.gh
81
The concentration of Ni in the leachate from the Mallam landfill was below the EPA
guideline. The leachate from the Mallam landfill recorded a lower sulphite concentration
compared to that of Pantang because of aging. An analysis of variance for Ni showed a
significant difference (P= 0.000 P< 0.05) between recorded values.
4.1.23. Leachate pollution indexes (LPI)
The comparison of LPI values for the two landfill sites shows that Pantang leachate (PL)
has the highest LPI value of 18.573, whilst Mallam leachate (ML) has the lowest LPI
value of 4.799. The high LPI recorded by PL may be due to the fact that the landfill is
still operational and is receiving domestic and industrial wastes. Kumar and Alappat
(2005) calculated LPI values for two active landfill sites and reported higher LPI (36.4
and 39) than PL (18.573). Kumar and Alappat (2005) calculated LPI value for a closed
landfill site and reported higher LPI (15.97) than ML (4.799). The lower LPI value for
ML suggests that the landfill leachate is stabilized. Comparing the LPI of both sites to the
LPI pollution scale which is 5-100, the leachate from the Mallam dump site had a LPI of
4.799 which is lower than 5 and for that one can say that the leachate is unpolluted and
will not pollute the underground water system. The leachate from the Pantang dumpsite
may be said to be polluted since the LPI which was 18.573 fell within the LPI pollution
scale and leachate may pollute the underground water system.
University of Ghana http://ugspace.ug.edu.gh

82
Table 4.1: LPI for leachates from the Pantang and Mallam landfill sites.
Pantang leachate Mallam leachate
parameters (Wi) conc (Ci) (Pi) (Wi. Pi) Conc (ML)
(Ci)
(ML)
(Pi)
(ML)Aggregation
(Wi. Pi)
pH 0.055 8.35 4.97 0.273 8.39 4.99 0.274
TDS(mg/l) 0.050 32923.93 79.02 3.951 3135.7 7.53 0.377
BOD(mg/l) 0.061 192.13 3.95 0.241 160.6 3.29 0.201
COD(mg/l) 0.062 719.13 2.62 0.162 1122.5 4.11 0.255
Zn(mg/l) 0.056 15.69 25.5 1.428 0.241 0.392 0.022
Cu(mg/l) 0.050 1.98 17.24 0.862 0.224 1.95 0.098
Cr(mg/l) 0.064 4.39 25.46 1.629 0.524 3.04 0.195
Pb(mg/l) 0.063 0.609 10.99 0.692 0.186 13.19 0.831
Fe(mg/l) 0.045 43.2 2.6 0.117 15.73 0.948 0.043
Ni(mg/l) 0.052 0.550 19.41 1.009 0.208 7.34 0.382
Total 0.558 10.364 2.678
LPI Value
18.573 4.799
4.2. AIR
4.2.1. Particulate matter (PM10)
The PM10 of the air sampled from the Pantang landfill ranged from 250.00- 680.56 with a
mean of 527.78 and standard deviation of 240.965 (Appendix 5). The highest PM10 of
680.56 for air sampled from the Pantang landfill was recorded in the month of April and
the least 250.00 in March (Appendix 6, Figure 4.8). The PM10 of the air sampled from the
Mallam landfill ranged from 13.89 - 27.78 with a mean of 23.15 and standard deviation
of 8.019 (Appendix 5). The highest PM10 of 27.78 for air sampled from the Mallam
University of Ghana http://ugspace.ug.edu.gh

83
landfill was recorded in the month of April and the least 13.89 in March (Appendix 6,
Figure 4.8).
The PM10 concentration of the air sampled from the Pantang landfill were above the EPA
and WHO guidelines. The high PM10 concentration may be due to the regular combustion
of the waste on the landfill, exhaust of buldozers working on the landfill and dust created
as the waste are pushed and compacted. The PM10 concentration of the air from the
Mallam landfill was below the EPA and WHO guidelines.
The Mallam landfill recorded a low PM10 concentration because the landfill has been
decommissioned and all activities including burning and compaction is absence. The
PM10 of both Pantang and Mallam landfills showed a fluctuating trend over sampling
period. The low PM10 recorded in March may be due to the rainfall that was experience
on both sites before and on the day of sampling which might have cleared the atmosphere
of any suspended materials. An analysis of variance for PM10 showed a significant
difference (P=0.22, P< 0.05) between recorded values.
4.2.2. Total suspended particles (TSP)
The TSP concentration of the air sampled from the Pantang landfill ranged from 291.67 -
875.00 with a mean of 665.56 standard deviation of 324.576 (Appendix 5). The highest
TSP of 875.00 for air sampled from the Pantang landfill was recorded in the month of
April and the least 291.67 in March (Appendix 6, Figure 4.8). The TSP concentration of
the air sampled from the Mallam landfill ranged from 27.78 - 41.67 with a mean of 37.04
standard deviation of 8.019395 (Appendix 5). The highest TSP concentration of 41.67 for
air sampled from the Mallam landfill was recorded in the month of April and the least
University of Ghana http://ugspace.ug.edu.gh
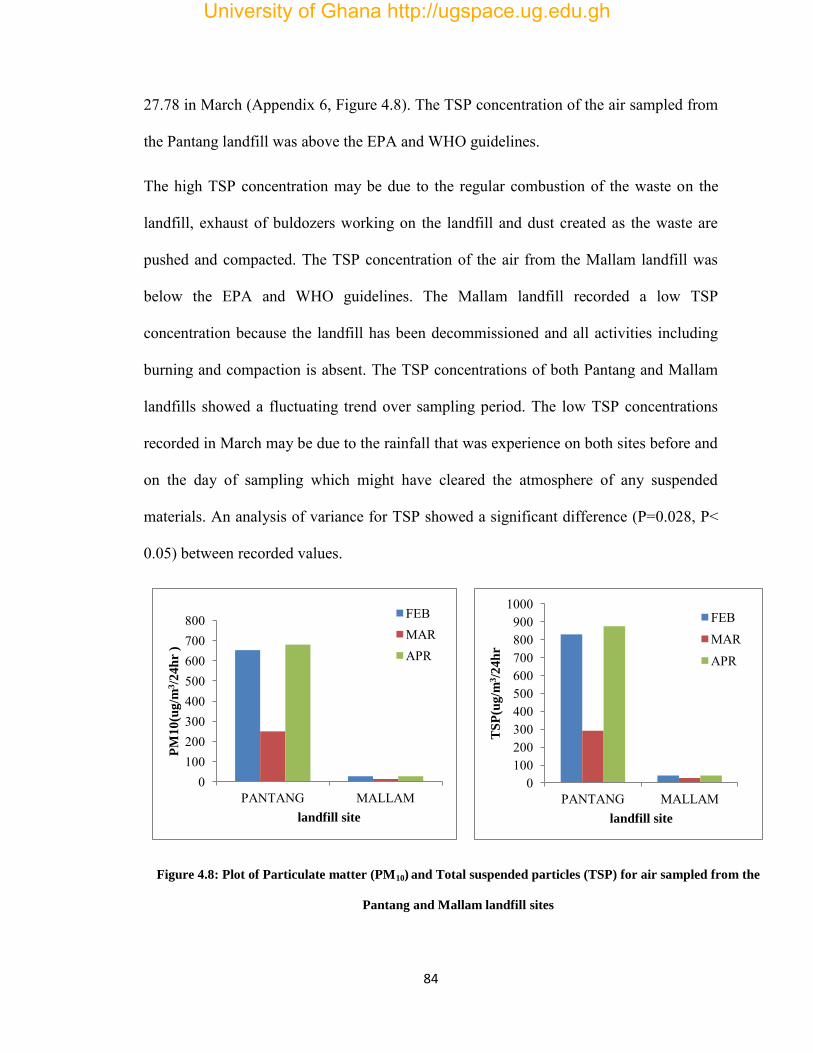
84
27.78 in March (Appendix 6, Figure 4.8). The TSP concentration of the air sampled from
the Pantang landfill was above the EPA and WHO guidelines.
The high TSP concentration may be due to the regular combustion of the waste on the
landfill, exhaust of buldozers working on the landfill and dust created as the waste are
pushed and compacted. The TSP concentration of the air from the Mallam landfill was
below the EPA and WHO guidelines. The Mallam landfill recorded a low TSP
concentration because the landfill has been decommissioned and all activities including
burning and compaction is absent. The TSP concentrations of both Pantang and Mallam
landfills showed a fluctuating trend over sampling period. The low TSP concentrations
recorded in March may be due to the rainfall that was experience on both sites before and
on the day of sampling which might have cleared the atmosphere of any suspended
materials. An analysis of variance for TSP showed a significant difference (P=0.028, P<
0.05) between recorded values.
Figure 4.8: Plot of Particulate matter (PM10) and Total suspended particles (TSP) for air sampled from the
Pantang and Mallam landfill sites
0 100 200 300 400 500 600 700 800
PANTANG MALLAM
PM
10
(ug
/m3/2
4h
r )
landfill site
FEB MAR APR
0 100 200 300 400 500 600 700 800 900
1000
PANTANG MALLAM
TS
P(u
g/m
3/2
4h
r
landfill site
FEB MAR APR
University of Ghana http://ugspace.ug.edu.gh
85
4.2.3. Carbon monoxide (CO)
The CO concentration of the air sampled from the Pantang landfill ranged from 11000.0 -
20000.0, with a mean of 16433.3 standard deviation of 4781.562 (Appendix 5). The
highest CO of 20,000 for air sampled from the Pantang landfill was recorded in the
month of February and the least 11000 in March (Appendix 6). CO was not detected in
air sampled from the Mallam landfill. The CO concentration of the air sampled from the
Pantang landfill was above the EPA and WHO guidelines.
The high CO may be due to regular combustion of the waste on the landfill site, as the
Pantang landfill seems to be on fire most of the time. CO was not detected in the air
sampled from the Mallam landfill. The low CO concentrations recorded in March may be
due to the rainfall that was experience on both sites before and on the day of sampling
which might have cleared the atmosphere of any suspended materials. An analysis of
variance for CO showed a significant difference (P=0.004, P< 0.05) between recorded
values.
4.2.4. Ammonia (NH3)
The NH3 concentration of the air sampled from the Pantang landfill ranged from 6390-
12070, with a mean of 9797 and standard deviation of 3005.007 (Appendix 5). The
highest NH3 of 12,070 for air sampled from the Pantang landfill was recorded in the
month of February and the least 6390 in March (Appendix 6). The NH3 concentration of
the air sampled from the Mallam landfill ranged from 4970.00 -8520.00, with a mean of
6657.67 and standard deviation of 1781.433786 (Appendix 5).
University of Ghana http://ugspace.ug.edu.gh

86
The highest NH3 of 8520 for air sampled from Mallam was recorded in the month of
February and the least 4970 in March (Appendix 6). The low NH3 concentrations
recorded in March may be due to the rainfall that was experience on both sites before and
on the day of sampling which might have cleared the atmosphere of any suspended
materials. An analysis of variance for NH3 showed an insignificant difference (P=0.195,
P > 0.05) between recorded values.
4.2.5. Sulphur dioxide (SO2)
The SO2 concentration of the air sampled from the Pantang landfill ranged from 34060.0 -
41920.0 with a mean of 38603.3 and standard deviation of 4071.048 (Appendix 5). The
highest SO2 of 41920 for air sampled from the Pantang landfill was recorded in the month
of February and the least 34060 in March. The SO2concentration of the air sampled from
the Mallam landfill ranged from 44540 - 49780 with a mean of 47236.67 and standard
deviation of 2623.36 (Appendix 5).
The highest SO2 concentration of 49780 for the air sampled from the Mallam landfill was
recorded in the month of February and the least 44540 in March (Appendix 6, Figure
4.9). The SO2 concentrations of the air sampled from the Pantang and Mallam landfills
were above the EPA and WHO guidelines. The high SO2 may be due to the anaerobic
decomposition of the organic component of the waste disposed. The low SO2
concentrations recorded in March may be due to the rainfall that was experience on both
sites before and on the day of sampling which might have cleared the atmosphere of any
suspended materials. An analysis of variance for SO2 showed a significant difference
(P=0.003, P< 0.05) between recorded values
University of Ghana http://ugspace.ug.edu.gh

87
4.2.6. Zinc (Zn)
The Zn concentration of the air sampled from the Pantang landfill ranged from 0.051 -
0.154, with a mean of 0.089 and standard deviation of 0.057 (Appendix 5). The highest
Zn of 0.154 for air sampled from the Pantang landfill was recorded in the month of
March and the least 0.051 in February (Appendix 6, Figure 4.9). The Zn concentration of
the air sampled from the Mallam landfill ranged from 0.298 -0.359, with a mean of 0.334
and standard deviation of 0.032130 (Appendix 5). The highest Zn concentration of 0.359
for air sampled from Mallam was recorded in the month of April and the least 0.298 in
February (Appendix 6, Figure 4.9). An analysis of variance for Zn showed an
insignificant difference (P=0.612, P > 0.05) between recorded values.
Figure 4.9: Plot of Sulphur dioxide (SO2) and Zinc (Zn) for air sampled from the Pantang and
Mallam landfill sites
41920
49780
0
10000
20000
30000
40000
50000
60000
PANTANG MALLAM
SO
2(u
g/m
3/h
r)
landfill site
FEB
MAR
APR
0
0.05
0.1
0.15
0.2
0.25
0.3
0.35
0.4
PANTANG MALLAM
Zn
(ug
/m3/2
4h
r)
landfill site
FEB MAR APR
University of Ghana http://ugspace.ug.edu.gh

88
4.2.7. Nickel (Ni)
The Ni concentration of the air sampled from the Pantang landfill ranged from0.048-
0.053 with a mean of 0.051 and standard deviation of 0.003 (Appendix 5). The highest Ni
of 0.053 for air sampled from the Pantang landfill was recorded in the month of March
and the least 0.048 in February (Appendix 6). The Ni concentration of the air sampled
from the Mallam landfill ranged from 0.006 -0.103 with a mean of 0.068 and standard
deviation of 0.054 (Appendix 5).
The highest Ni concentration of 0.103 for air sampled from the Mallam landfill was
recorded in the month of March and the least 0.006 in February (Appendix 6). The Ni
concentrations of the air sampled from the Pantang and Mallam landfills were below the
WHO guideline. An analysis of variance for Ni showed an insignificant difference
(P=0.783, P > 0.05) between recorded values.
4.2.8. Copper (Cu)
The Cu concentration of the air sampled from the Pantang landfill ranged from 0.005 -
0.092, with a mean of 0.038 and standard deviation of 0.047 (Appendix 5). The highest
Cu concentration of 0.092 for air sampled from the Pantang landfill was recorded in the
month of April and the least 0.005 in March (Appendix 6). The Cu concentration of the
air sampled from the Mallam landfill ranged from 0.020 -0.043, with a mean of 0.0293
and standard deviation of 0.012 (Appendix 5).
The highest Cu concentration of 0.043 for air sampled from Mallam was recorded in the
month of April and the least 0.020 in March (Appendix 6). The low Cu concentrations
recorded in March may be due to the rainfall that was experience on both sites before and
University of Ghana http://ugspace.ug.edu.gh

89
on the day of sampling which might have cleared the atmosphere of any suspended
materials. An analysis of variance for Cu showed an insignificant difference (P=0.481, P
> 0.05) between recorded values.
4.2.9. Manganese (Mn)
The Mn concentration of the air sampled from the Pantang landfill ranged from 0.009 -
0.052, with a mean of 0.035 and standard deviation of 0.023 (Appendix 5). The highest
Mn of 0.052 for air sampled from the Pantang landfill was recorded in the month of
February and the least 0.009 in March (Appendix 6, Figure 4.10).
The Mn concentration of the air sampled from the Mallam landfill ranged from 0.035-
0.059, with a mean of 0.047 and standard deviation of 0.012 (Appendix 5). The highest
Mn concentration of 0.059 for air sampled from Mallam was recorded in the month of
March and the least 0.035 in April (Appendix 6, Figure 4.10). The Mn concentrations of
the air sampled from the Pantang landfill and Mallam landfills were below the WHO
guideline. An analysis of variance for Mn showed an insignificant difference (P=0.875,
P > 0.05) between recorded values.
4.2.10. Chromium (Cr)
The Cr concentration of the air sampled from the Pantang landfill ranged from 0.045 -
0.194, with a mean of 0.125 and standard deviation of 0.102 (Appendix 5). The highest
Cr concentration of 0.194 for air sampled from the Pantang landfill was recorded in the
month of February and the least 0.045 in March (Appendix 6, Figure 4.10). The Cr
University of Ghana http://ugspace.ug.edu.gh
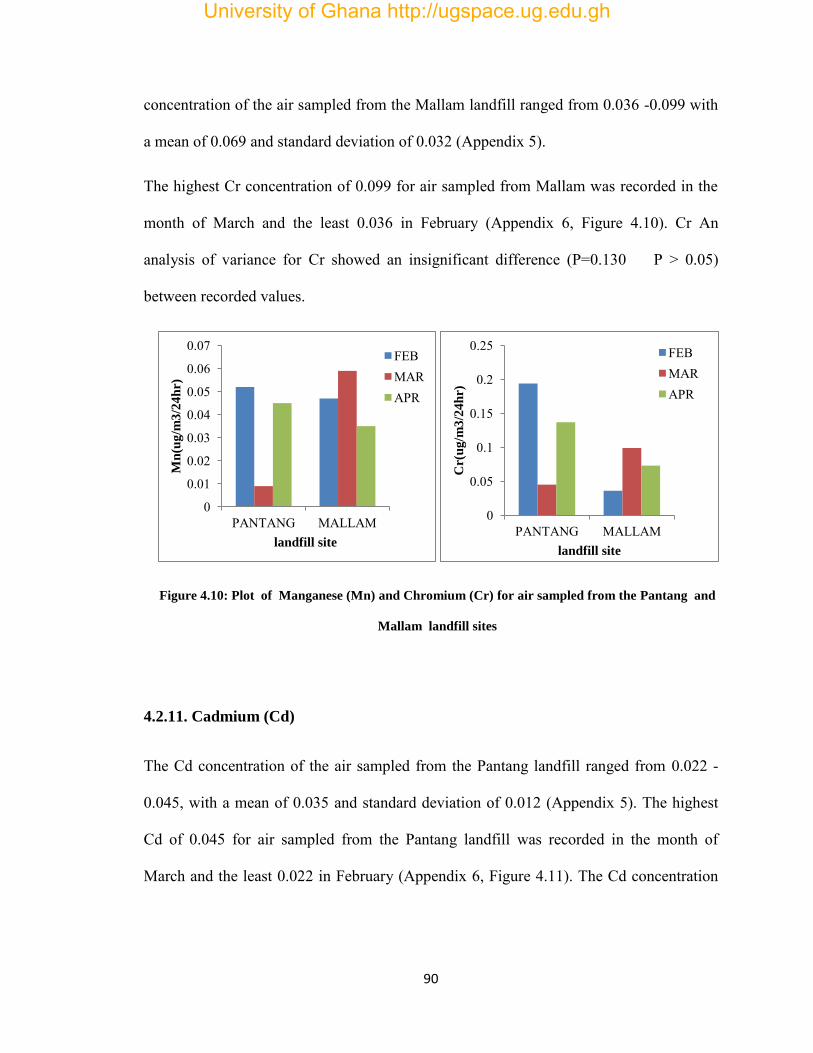
90
concentration of the air sampled from the Mallam landfill ranged from 0.036 -0.099 with
a mean of 0.069 and standard deviation of 0.032 (Appendix 5).
The highest Cr concentration of 0.099 for air sampled from Mallam was recorded in the
month of March and the least 0.036 in February (Appendix 6, Figure 4.10). Cr An
analysis of variance for Cr showed an insignificant difference (P=0.130 P > 0.05)
between recorded values.
Figure 4.10: Plot of Manganese (Mn) and Chromium (Cr) for air sampled from the Pantang and
Mallam landfill sites
4.2.11. Cadmium (Cd)
The Cd concentration of the air sampled from the Pantang landfill ranged from 0.022 -
0.045, with a mean of 0.035 and standard deviation of 0.012 (Appendix 5). The highest
Cd of 0.045 for air sampled from the Pantang landfill was recorded in the month of
March and the least 0.022 in February (Appendix 6, Figure 4.11). The Cd concentration
0
0.01
0.02
0.03
0.04
0.05
0.06
0.07
PANTANG MALLAM
Mn
(ug
/m3
/24
hr)
landfill site
FEB MAR APR
0
0.05
0.1
0.15
0.2
0.25
PANTANG MALLAM
Cr(
ug
/m3
/24
hr)
landfill site
FEB MAR APR
University of Ghana http://ugspace.ug.edu.gh

91
of the air sampled from the Mallam landfill ranged from 0.005 -0.028, with a mean of
0.017 and standard deviation of 0.012 (Appendix 5).
The highest Cd concentration of 0.028 for air sampled from Mallam was recorded in the
month of March and the least 0.005 in February (Appendix 6, Figure 4.11). The Cd
concentrations of the air sampled from the Pantang and Mallam landfills were below the
WHO guideline. An analysis of variance for Cd showed a significant difference
(P=0.000P< 0.05) between recorded value.
4.2.12. Lead (Pb)
The Pb concentration of the air sampled from the Pantang landfill ranged from 73.73 -
86.53 with a mean of 79.89 and standard deviation of 6.413 (Appendix 5). The highest Pb
of 86.53 for air sampled from the Pantang landfill was recorded in the month of April and
the least 73.73 in February. The Pb concentration of the air sampled from the Mallam
landfill ranged from 21.90 - 29.50, with a mean of 25.63 and standard deviation of 3.802
(Appendix 5). The highest Pb of 29.50 for air sampled from Mallam was recorded in the
month of March and the least 21.90 in February (Appendix 6, Figure 4.11).
The Pb of the air sampled from the Pantang landfill was above the EPA and WHO
guidelines and this indicate the presence and combustion of materials such as lead
batteries, chemicals for photograph processing, paints, plastics, paper etc. The Pb of the
air from the Mallam landfill was above the EPA and WHO guidelines and this may be
due to vehicular movement in the landfill vicinity. An analysis of variance for Pb showed
an insignificant difference (P=0.076, P > 0.05) between recorded values.
University of Ghana http://ugspace.ug.edu.gh

92
Figure 4.11: Plot of Cadmium (Cd) and Lead (Pb) for air sampled from the Pantang and Mallam
landfill sites
4.2.13. Iron (Fe)
The Fe concentration of the air sampled from the Pantang landfill ranged from1.308 -
3.830, with a mean of 2.503 and standard deviation of 1.266 (Appendix 5). The highest
Fe of 3.830 for air sampled from the Pantang landfill was recorded in the month of
February and the least 1.308 in March. The Fe concentration of the air sampled from the
Mallam landfill ranged from 0.472 -0.909, with a mean of 0.735 and standard deviation
of 0.232 (Appendix 5). The highest Fe of 0.909 for air sampled from Mallam was
recorded in the month of February and the least 0.472 in March.
The low Fe concentrations recorded in March may be due to the rainfall that was
experience on both sites before and on the day of sampling which might have cleared the
0 0.005
0.01 0.015
0.02 0.025
0.03 0.035
0.04 0.045
0.05
PANTANG MALLAM
Cd
(ng
/m3
/yr)
landfill site
FEB
MAR
APR
0 10 20 30 40 50 60 70 80 90
100
PANTANG MALLAM
Pb
(ug
/m3
/yr)
landfill site
FEB
MAR
APR
University of Ghana http://ugspace.ug.edu.gh
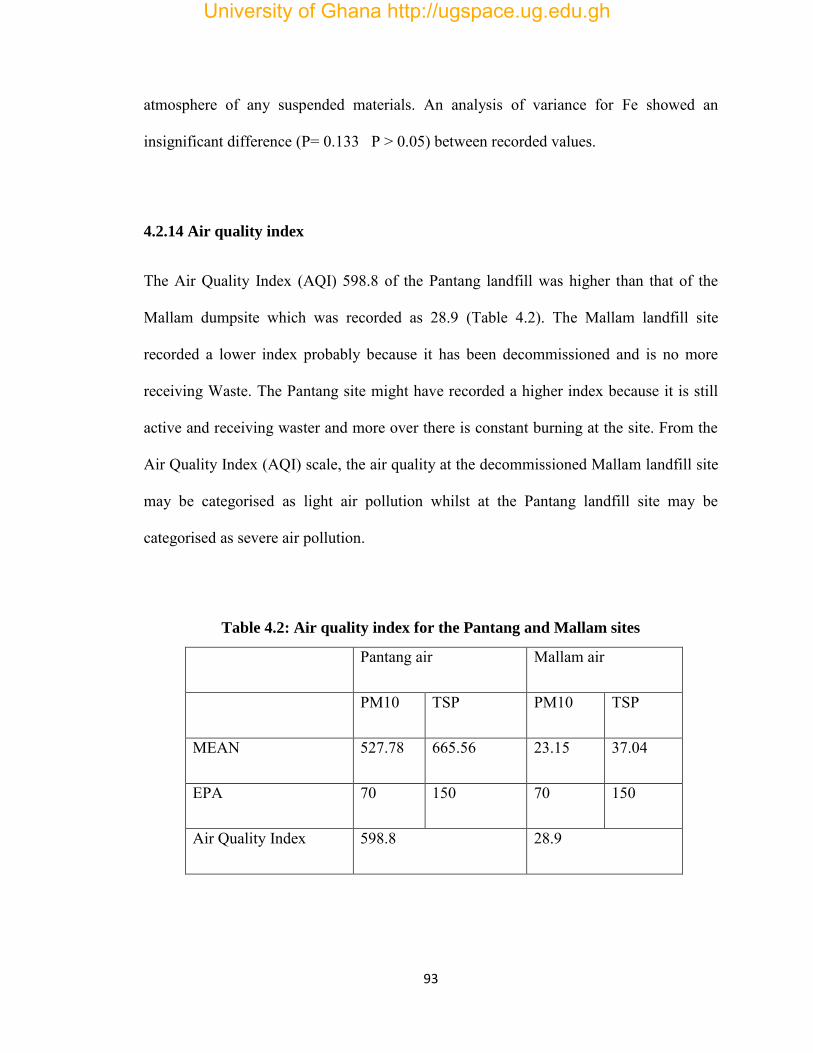
93
atmosphere of any suspended materials. An analysis of variance for Fe showed an
insignificant difference (P= 0.133 P > 0.05) between recorded values.
4.2.14 Air quality index
The Air Quality Index (AQI) 598.8 of the Pantang landfill was higher than that of the
Mallam dumpsite which was recorded as 28.9 (Table 4.2). The Mallam landfill site
recorded a lower index probably because it has been decommissioned and is no more
receiving Waste. The Pantang site might have recorded a higher index because it is still
active and receiving waster and more over there is constant burning at the site. From the
Air Quality Index (AQI) scale, the air quality at the decommissioned Mallam landfill site
may be categorised as light air pollution whilst at the Pantang landfill site may be
categorised as severe air pollution.
Table 4.2: Air quality index for the Pantang and Mallam sites
Pantang air Mallam air
PM10 TSP PM10 TSP
MEAN 527.78 665.56 23.15 37.04
EPA 70 150 70 150
Air Quality Index 598.8 28.9
University of Ghana http://ugspace.ug.edu.gh
94
4.3. Soil
4.3.1. pH
The pH ranged from 8.97 to 8.07 with a mean of 8.55 and standard deviation of 0.26
(Table 4.3). The research section (coded PS1) on the Pantang landfill recorded the
highest pH of 8.97 pH units in February and the research section (coded PS2) on the
Pantang landfill recorded the lowest pH of 8.07 in March (Appendix 7). The pH obtained
of the soil was higher than that of the control site and this might be due to the flow of the
high pH leachate on the soil surface and percolation through the soil. With the exception
of the research section (coded PS3) which showed an increasing trend with time
throughout the sampling period, all the other sampling points exhibited fluctuating trends
over time.
4.3.2. Percentage organic carbon (%OC)
Organic carbon ranged from 2.46- 6.18 % with a mean of 4.75%and standard deviation of
1.26 (Table 4.3). The research section (coded PS5) on the Pantang landfill recorded the
highest percentage organic carbon (%OC) of 6.18% in March and the research section
(coded PS1) on the Pantang landfill recorded the lowest percentage organic carbon
(%OC) of 2.46 in March (Appendix 7). The organic carbon content of the soil was higher
than that of the control site and this may be due to the organic materials in the waste
dumped at the landfill. The concentration of organic carbon for all the sampling sections
showed a fluctuating trend indicating that the amount and rate of decomposition of
organic waste varied from one sampling section to the other and with time.
University of Ghana http://ugspace.ug.edu.gh
95
4.3.3. Percentage organic matter (%OM)
Organic matter varied from 4.24 -10.66 mg/kg with a mean of 7.52 mg/kg and standard
deviation of 2.28 (Table 4.3). The research section (coded PS3) on the Pantang landfill
recorded the highest organic matter content of 10.66mg/kg in March. The lowest organic
matter content was measured at the research section (coded PS1) on the Pantang landfill
with a value of 4.24 mg/kg in March (Figure 4.12). The organic matter content of the soil
was higher than that of the control site and this may be due to the organic materials in the
waste dumped at the landfill.
The organic matter concentrations showed a fluctuating trend for all the sampling points
throughout the sampling period indicating that the amount and rate of decomposition of
organic waste varied in the site. There was an increasing trend in February across the
sampling sections with research location PS1- PS4 and decreasing trend from PS4 -PS5
and also in March, there was also an increasing trend from PS1-PS3 and decreasing trend
from PS3-PS5.
4.3.4. Electrical conductivity (EC)
EC ranged from 710-1650 S/cm with a mean of 1169.07 S/cm and standard deviation
of 304.15 (Table 4.3). The research section (coded PS1) on the Pantang landfill recorded
the highest EC of 1650 S/cm in the month of February which may be due to the high
nitrate content at that section because of low rainfall and PS3 measured the lowest EC of
710 S/cm in April (Figure 4.12).
University of Ghana http://ugspace.ug.edu.gh
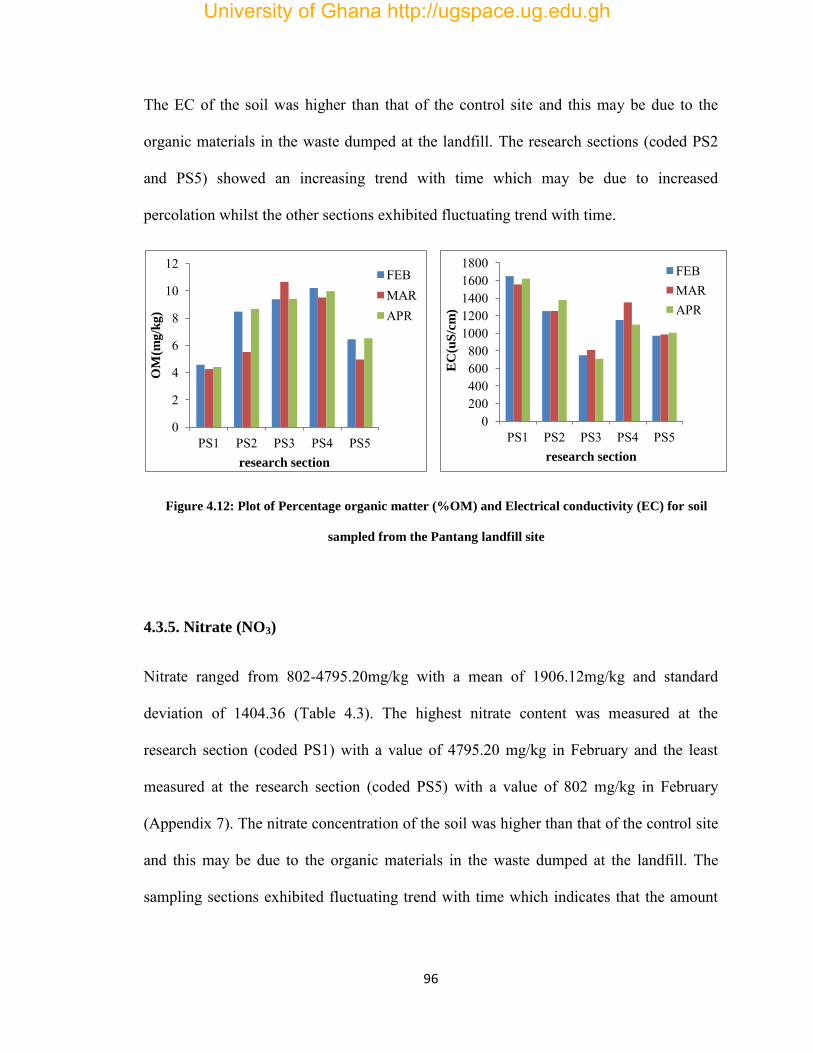
96
The EC of the soil was higher than that of the control site and this may be due to the
organic materials in the waste dumped at the landfill. The research sections (coded PS2
and PS5) showed an increasing trend with time which may be due to increased
percolation whilst the other sections exhibited fluctuating trend with time.
Figure 4.12: Plot of Percentage organic matter (%OM) and Electrical conductivity (EC) for soil
sampled from the Pantang landfill site
4.3.5. Nitrate (NO3)
Nitrate ranged from 802-4795.20mg/kg with a mean of 1906.12mg/kg and standard
deviation of 1404.36 (Table 4.3). The highest nitrate content was measured at the
research section (coded PS1) with a value of 4795.20 mg/kg in February and the least
measured at the research section (coded PS5) with a value of 802 mg/kg in February
(Appendix 7). The nitrate concentration of the soil was higher than that of the control site
and this may be due to the organic materials in the waste dumped at the landfill. The
sampling sections exhibited fluctuating trend with time which indicates that the amount
0
2
4
6
8
10
12
PS1 PS2 PS3 PS4 PS5
OM
(mg
/kg
)
research section
FEB MAR APR
0 200 400 600 800
1000 1200 1400 1600 1800
PS1 PS2 PS3 PS4 PS5 E
C(u
S/c
m)
research section
FEB MAR APR
University of Ghana http://ugspace.ug.edu.gh

97
and rate of decomposition of organic waste varied from one sampling section to the other
and with time.
4.3.6. Ammonia (NH3)
Ammonia ranged from 491.20-932 mg/kg with a mean 736.11mg/kg and standard
deviation of 148.168 (Table 4.3). The research section (coded PS1) on the Pantang
landfill recorded the highest ammonia concentration of 932 mg/kg in March and the least
at PS4 measured 491.20 mg/kg in March (Appendix 7). The Ammonia concentration of
the soil was higher than that of the control site and this may be due to the organic
materials in the waste dumped at the landfill. The sampling sections exhibited fluctuating
trend with time which indicates that the amount and rate of decomposition of organic
waste varied from one sampling section to the other and with time with the exception of
PS2 which exhibited a decreasing trend.
4.3.7. Manganese (Mn)
The Manganese ranged from 199.30 to 1693 mg/kg with a mean of 651.40 and standard
deviation of 506.11 (Table 4.3). The highest manganese content was measured at the
research section (coded PS3) with a value of 1693 mg/kg in April and PS2 recorded the
least Manganese content with a value of 199.30 mg/kg in April (Appendix 7, Figure
4.13). Generally, PS3 has the highest Mn content which may be due to increased amount
of Mn containing substances at the section. All sections showed fluctuating trend with
time except PS1 which exhibited an increasing trend. The Manganese content of the soil
University of Ghana http://ugspace.ug.edu.gh
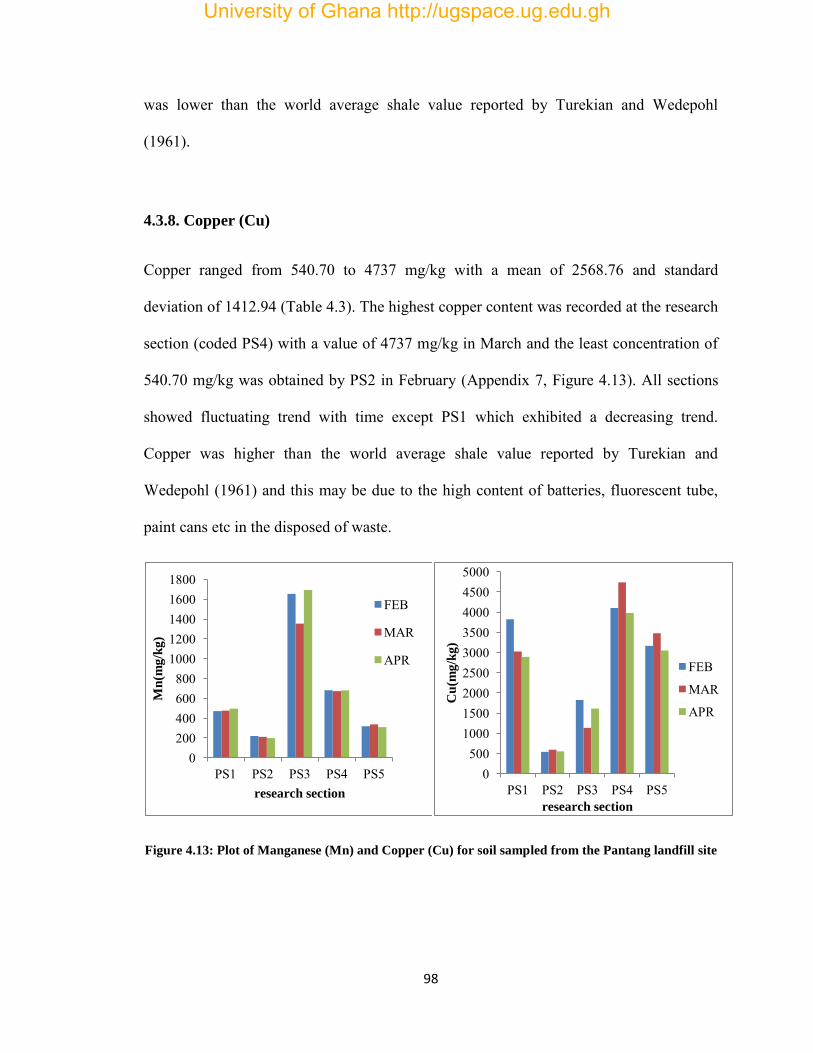
98
was lower than the world average shale value reported by Turekian and Wedepohl
(1961).
4.3.8. Copper (Cu)
Copper ranged from 540.70 to 4737 mg/kg with a mean of 2568.76 and standard
deviation of 1412.94 (Table 4.3). The highest copper content was recorded at the research
section (coded PS4) with a value of 4737 mg/kg in March and the least concentration of
540.70 mg/kg was obtained by PS2 in February (Appendix 7, Figure 4.13). All sections
showed fluctuating trend with time except PS1 which exhibited a decreasing trend.
Copper was higher than the world average shale value reported by Turekian and
Wedepohl (1961) and this may be due to the high content of batteries, fluorescent tube,
paint cans etc in the disposed of waste.
Figure 4.13: Plot of Manganese (Mn) and Copper (Cu) for soil sampled from the Pantang landfill site
0 200 400 600 800
1000 1200 1400 1600 1800
PS1 PS2 PS3 PS4 PS5
Mn
(mg
/kg
)
research section
FEB
MAR
APR
0 500
1000 1500 2000 2500 3000 3500 4000 4500 5000
PS1 PS2 PS3 PS4 PS5
Cu
(mg
/kg
)
research section
FEB
MAR
APR
University of Ghana http://ugspace.ug.edu.gh
99
4.3.9. Zinc (Zn)
Zinc ranged from 581 to 3141 mg/kg with a mean of 2332.87 and standard deviation of
809.74 (Table 4.3). The highest zinc concentration of 3141 mg/kg was recorded by the
soil sampled at the research section (coded PS4) in the month of April and the least at
PS5 with a value of 581 mg/kg in the month of April (Appendix 7). Zinc was higher than
the world average shale value reported by Turekian and Wedepohl (1961) and this may
be due to the high content of batteries, fluorescent tube, paint cans etc in the disposed of
waste. All sections showed fluctuating trend with time except PS4 which exhibited an
increasing trend.
4.3.10. Iron (Fe)
Iron ranged from 3136 to 5945 mg/kg with a mean of4552.07and standard deviation
of917.88 (Table 4.3). The research section (coded PS3) had the highest Iron content of
5945mg/l in March and the section PS5 recorded the lowest concentration of 3136 mg/kg
in March (Appendix 7). Iron was lower than the world average shale value reported by
Turekian and Wedepohl (1961). All sections showed fluctuating trend with time.
4.3.11. Chromium (Cr)
Chromium ranged from 28.3 to 91.1mg/kg with a mean of 58.394 and standard deviation
of21.474 (Table 4.3). The highest chromium content was measured at the research
section (coded PS3) with a value of 91.1 mg/kg in February and the least at PS2 with a
University of Ghana http://ugspace.ug.edu.gh
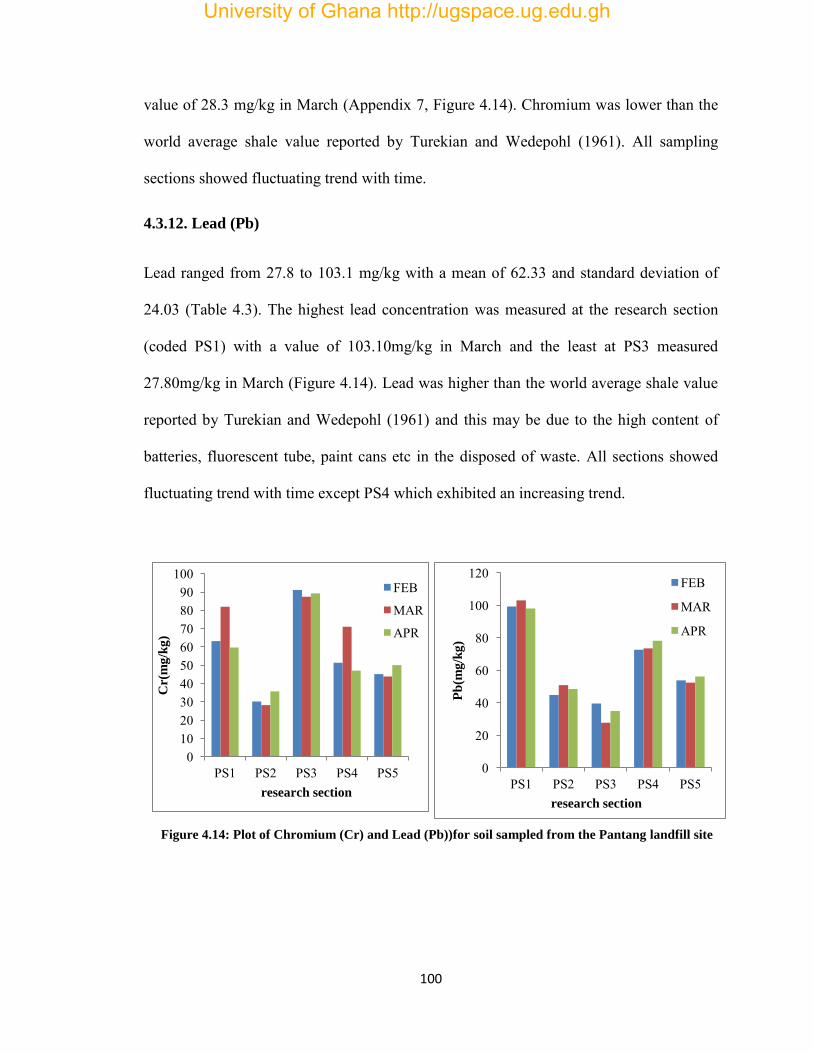
100
value of 28.3 mg/kg in March (Appendix 7, Figure 4.14). Chromium was lower than the
world average shale value reported by Turekian and Wedepohl (1961). All sampling
sections showed fluctuating trend with time.
4.3.12. Lead (Pb)
Lead ranged from 27.8 to 103.1 mg/kg with a mean of 62.33 and standard deviation of
24.03 (Table 4.3). The highest lead concentration was measured at the research section
(coded PS1) with a value of 103.10mg/kg in March and the least at PS3 measured
27.80mg/kg in March (Figure 4.14). Lead was higher than the world average shale value
reported by Turekian and Wedepohl (1961) and this may be due to the high content of
batteries, fluorescent tube, paint cans etc in the disposed of waste. All sections showed
fluctuating trend with time except PS4 which exhibited an increasing trend.
Figure 4.14: Plot of Chromium (Cr) and Lead (Pb))for soil sampled from the Pantang landfill site
0 10 20 30 40 50 60 70 80 90
100
PS1 PS2 PS3 PS4 PS5
Cr(
mg
/kg
)
research section
FEB
MAR
APR
0
20
40
60
80
100
120
PS1 PS2 PS3 PS4 PS5
Pb
(mg
/kg
)
research section
FEB
MAR
APR
University of Ghana http://ugspace.ug.edu.gh

101
4.3.13. Cadmium (Cd)
Cadmium ranged from 3.50 to 13.10 mg/kg with a mean of 8.24 and standard deviation
of 2.86 (Table 4.3). The research section (coded PS4) on the Pantang landfill recorded the
lowest cadmium concentration of 3.50 mg/kg march and PS3 measured the highest
concentration of 13.10 mg/kg in March (Appendix 7). Cadmium was higher than the
world average shale value reported by Turekian and Wedepohl (1961) and this may be
due to the high content of batteries, fluorescent tube, paint cans etc in the disposed waste.
All sampling sections showed fluctuating trend with time
4.3.14. Nickel (Ni)
Nickel varied from 4.5 to21.3 mg/kg with a mean of 14.29 and standard deviation of
5.095 (Table 4.3). The research section (coded PS4) on the Pantang landfill recorded the
highest nickel content of 21.3 mg/kg in April and PS2 measured the least value of 4.5
mg/kg April (Appendix 7). Nickel was lower than the world average shale value reported
by Turekian and Wedepohl (1961). All sampling sections showed fluctuating trend with
time.
University of Ghana http://ugspace.ug.edu.gh
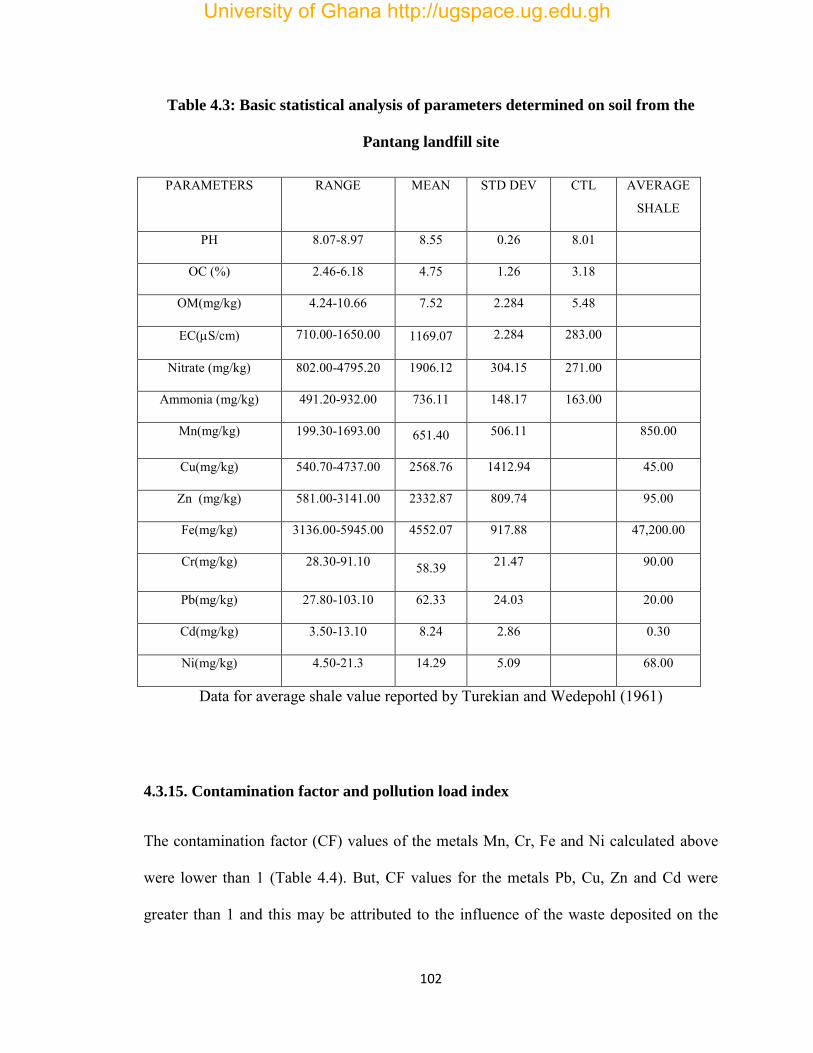
102
Table 4.3: Basic statistical analysis of parameters determined on soil from the
Pantang landfill site
PARAMETERS RANGE MEAN STD DEV CTL AVERAGE
SHALE
PH 8.07-8.97 8.55 0.26 8.01
OC (%) 2.46-6.18 4.75 1.26 3.18
OM(mg/kg) 4.24-10.66 7.52 2.284 5.48
EC(S/cm) 710.00-1650.00 1169.07 2.284 283.00
Nitrate (mg/kg) 802.00-4795.20 1906.12 304.15 271.00
Ammonia (mg/kg) 491.20-932.00 736.11 148.17 163.00
Mn(mg/kg) 199.30-1693.00 651.40 506.11 850.00
Cu(mg/kg) 540.70-4737.00 2568.76 1412.94 45.00
Zn (mg/kg) 581.00-3141.00 2332.87 809.74 95.00
Fe(mg/kg) 3136.00-5945.00 4552.07 917.88 47,200.00
Cr(mg/kg) 28.30-91.10 58.39 21.47 90.00
Pb(mg/kg) 27.80-103.10 62.33 24.03 20.00
Cd(mg/kg) 3.50-13.10 8.24 2.86 0.30
Ni(mg/kg) 4.50-21.3 14.29 5.09 68.00
Data for average shale value reported by Turekian and Wedepohl (1961)
4.3.15. Contamination factor and pollution load index
The contamination factor (CF) values of the metals Mn, Cr, Fe and Ni calculated above
were lower than 1 (Table 4.4). But, CF values for the metals Pb, Cu, Zn and Cd were
greater than 1 and this may be attributed to the influence of the waste deposited on the
University of Ghana http://ugspace.ug.edu.gh
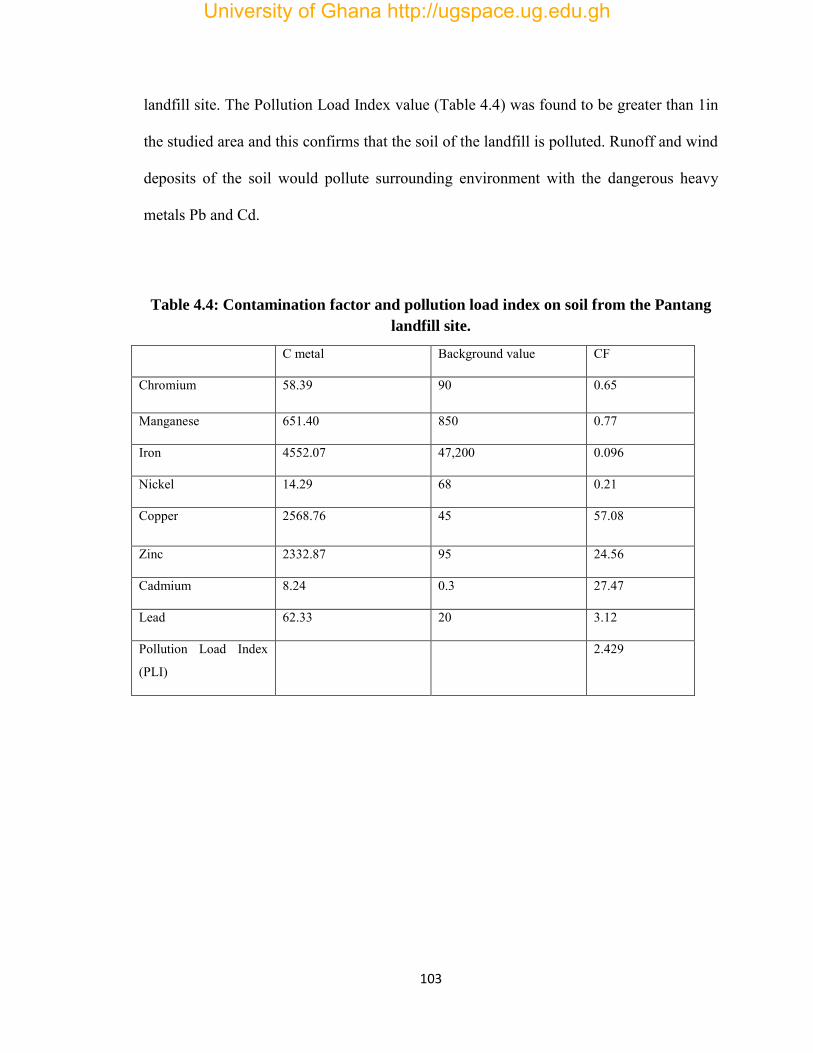
103
landfill site. The Pollution Load Index value (Table 4.4) was found to be greater than 1in
the studied area and this confirms that the soil of the landfill is polluted. Runoff and wind
deposits of the soil would pollute surrounding environment with the dangerous heavy
metals Pb and Cd.
Table 4.4: Contamination factor and pollution load index on soil from the Pantang
landfill site.
C metal Background value CF
Chromium 58.39 90 0.65
Manganese 651.40 850 0.77
Iron 4552.07 47,200 0.096
Nickel 14.29 68 0.21
Copper 2568.76 45 57.08
Zinc 2332.87 95 24.56
Cadmium 8.24 0.3 27.47
Lead 62.33 20 3.12
Pollution Load Index
(PLI)
2.429
University of Ghana http://ugspace.ug.edu.gh
104
4.4. GROUNDWATER
4.4.1. pH
The pH of groundwater sampled from the well coded PG1 ranged from 6.84-7.4 pH units
with a mean of 7.180 pH units and standard deviation of 0.299 (Table 4.5). The highest
pH of 7.40 for the research location (coded PG1) on the Pantang landfill was recorded in
the month of April and the least 6.84 in the month of March (Tables 4.6). pH of
groundwater sampled from the well coded PG2 ranged from 7.56-8.6 pH units with a
mean of 8.060 pH units and standard deviation of 0.521 (Table 4.5). The highest pH of
8.6 for the research location (coded PG2) on the Pantang landfill was recorded in the
month of April and the least 7.56 in the month of March (Tables 4.6).
The pH of PG1 fell within the WHO guideline of 6.5-8.5 for drinking water. Mor et al
(2006) reported a pH range of 6.75 -7.56 for groundwater in wells located near a landfill
at Malang, Indonesia. Mor et al (2006) reported a pH range of 7.02-7.15. Addo et al
(2013) reported a pH ranged of 4.9 to 7.6 with a mean value of 6.1 pH units in
groundwater from open-wells in the vicinity of a cement factory at Akporkloe,
Southeastern Ghana. Tay and Kortatsi (2007) reported pH range of 4.37–7.40 in the
Densu Basin. Nkansah and Ephraim (2009) reported a mean of 6.0 in the Bosomtwi-
Atwima-Kwanwoma District. Tay (2008) reported 5.4-7.06 pH range with a mean of 6.42
pH unit in the same geographical area.
Groundwater with pH lower than 6.5 is considered acidic for human use. The mean pH
of PG2 was in the WHO guideline for drinking water. The low pH for both wells in
March may be due to rainfall which leached out dissolved organic matter thus lowering
University of Ghana http://ugspace.ug.edu.gh

105
the acidity of the water. Both wells exhibited a fluctuating trend with sampling period.
The high pH at PG2 compared to PG1 may be due to it closeness to the landfill which
allows the seepage of leachate into the groundwater.
4.4.2. Total suspended solids (TSS)
The total suspended solids (TSS) of groundwater sampled at PG1 was in the range of 4.7-
5.0 mg/l with a mean of 4.867mg/land standard deviation of 0.153 (Table 4.5). The TSS
fell within the WHO guideline. The highest TSS of 5.0mg/l for the research location
(coded PG1) on the Pantang landfill was recorded in the month of March and the least
4.7mg/l in the month of February (Tables 4.6, Figure 4.15). TSS measured at the research
location (coded PG2) on the Pantang landfill was in the range of 60.2-67mg/l with a
mean of 63.067mg/l and standard deviation of 3.523. The highest TSS of 67mg/l for PG2
was recorded in the month of March and the least 60.2mg/l in the month of February. The
TSS recorded for PG1 fell within the WHO guideline of 5 mg/l.
The low TSS in the groundwater PG1 may be due to the filtration of any suspended
material by the soil interface which serves as a natural filter. The high TSS recorded in
March (Tables 4.6, Figure 4.15) for both wells may be attributed to rainfall which caused
a disturbance in the water thus making substances in the water to be suspended. Both
wells exhibited a fluctuating trend with sampling period. The high TSS at PG2 compared
to PG1 may be due to it closeness to the landfill which allows the seepage of leachate
into the groundwater. Addo et al. (2013) reported a TSS ranged of 10.0 – 141.0 mg/L
University of Ghana http://ugspace.ug.edu.gh

106
with a mean of 46.2 mg/L in groundwater from open-wells in the vicinity of a cement
factory at Akporkloe, Southeastern Ghana.
4.4.3. Turbidity (Tur)
The turbidity of groundwater sampled from the research location (coded PG1) ranged
from 3.1 - 4.6 NTU with a mean of 4.00 NTU and standard deviation of 0.794 (Table
4.5). The highest turbidity of 4.6 NTU for the research location (coded PG1) on the
Pantang landfill was recorded in the month of March and the least 3.1 NTU in the month
of February (Tables 4.6, Figure 4.15). Turbidity of the research location (coded PG2) on
the Pantang landfill ranged from 31.4-35 NTU with a mean of 33.700 NTU and standard
deviation of 1.997. The highest turbidity of 35NTU for PG2 was recorded in the month of
March and the least 31.4 NTU in the month of February. The well PG1 recorded turbidity
values below the WHO guideline value of 5 NTU whilst PG2 recorded a value above the
WHO guideline.
The high turbidity recorded in March (Tables 4.6, Figure 4.15) for both wells may be due
to the high TSS recorded for that month. Addo et al. (2013) reported a turbidity range of
11.1 to 198.0 NTU with a mean of 57.96 NTU in groundwater from open-wells in the
vicinity of a cement factory at Akporkloe, Southeastern Ghana. Schafer et al. (2010)
found turbidities in the range of 2–266 NTU in most borehole water throughout Ghana.
The high turbidity recorded may be due to the presence of large particle of OM and
dissolved solids. The high turbidity at PG2 may be due to it closeness to the landfill
University of Ghana http://ugspace.ug.edu.gh
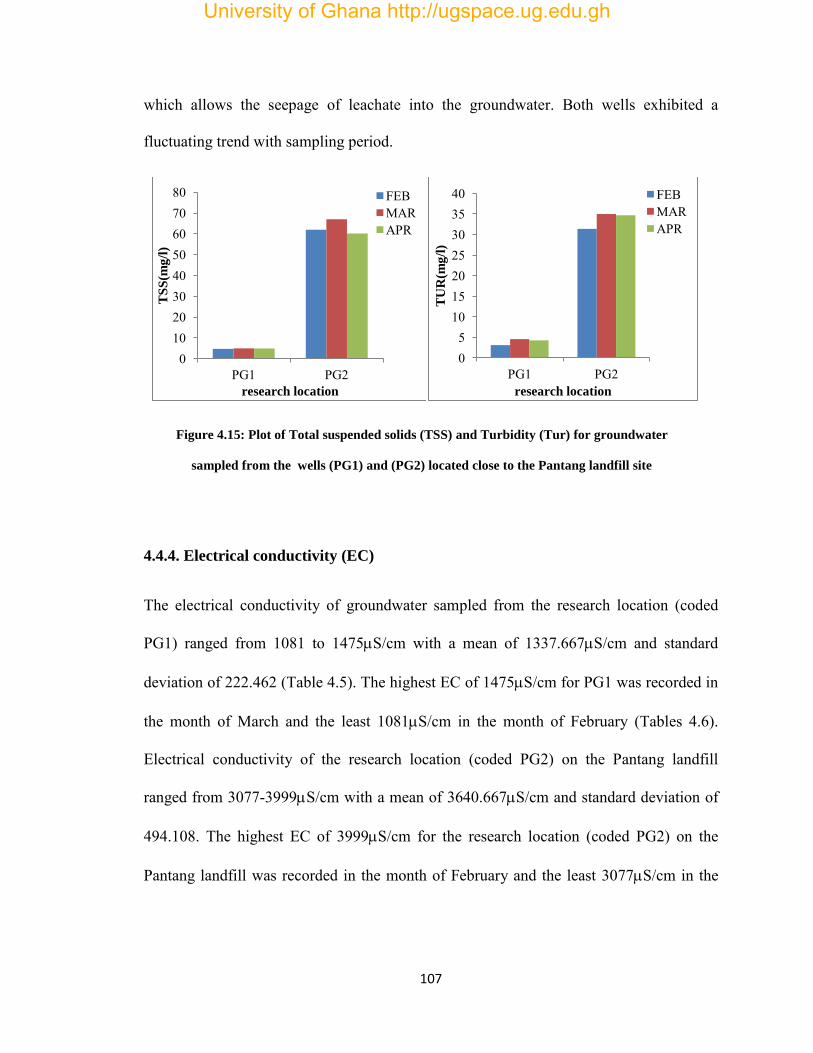
107
which allows the seepage of leachate into the groundwater. Both wells exhibited a
fluctuating trend with sampling period.
Figure 4.15: Plot of Total suspended solids (TSS) and Turbidity (Tur) for groundwater
sampled from the wells (PG1) and (PG2) located close to the Pantang landfill site
4.4.4. Electrical conductivity (EC)
The electrical conductivity of groundwater sampled from the research location (coded
PG1) ranged from 1081 to 1475S/cm with a mean of 1337.667S/cm and standard
deviation of 222.462 (Table 4.5). The highest EC of 1475S/cm for PG1 was recorded in
the month of March and the least 1081S/cm in the month of February (Tables 4.6).
Electrical conductivity of the research location (coded PG2) on the Pantang landfill
ranged from 3077-3999S/cm with a mean of 3640.667S/cm and standard deviation of
494.108. The highest EC of 3999S/cm for the research location (coded PG2) on the
Pantang landfill was recorded in the month of February and the least 3077S/cm in the
0 10 20 30 40 50 60 70 80
PG1 PG2
TS
S(m
g/l
)
research location
FEB MAR APR
0 5
10 15 20 25 30 35 40
PG1 PG2
TU
R(m
g/l
)
research location
FEB MAR APR
University of Ghana http://ugspace.ug.edu.gh

108
month of March. The Electrical conductivity for both wells exceeded the WHO guideline
limit. Mor et al (2006) reported of an electrical conductivity range of 617-3620S/cm.
Addo et al (2013) reported conductivity ranged of 377- 12,228 μS/cm with a mean value
of 2969 μS/cm in groundwater from open-wells in the vicinity of a cement factory at
Akporkloe, Southeastern Ghana. The high electrical conductivity recorded may be
attributed to the relatively high salt content dissolved in the water. For PG1 March
recorded, the highest EC which is a reflection of the high TDS and TSS recorded in that
month. The high EC at PG2 may be due to it closeness to the landfill making it more
likely to receive pollutants. Both wells exhibited a fluctuating trend with sampling period.
4.4.5. Total dissolved solids (TDS)
The total dissolved solids (TDS) of groundwater sampled from the research location
(coded PG1) ranged from 1140-1648 mg/l with a mean of 1379 mg/l and standard
deviation of 255.325 (Table 4.5) for PG1. The highest TDS of 1648mg/l for the research
location (coded PG1) on the Pantang landfill was recorded in the month of March and the
least 1140mg/l in the month of February (Tables 4.6). TDS of the research location
(coded PG2) ranged from 1998-2560mg/l with a mean of 2310.667 mg/l and standard
deviation of 286.303. The highest TDS of 2560mg/l for PG2 was recorded in the month
of February and the least 1998mg/l in the month of March.
The TDS for both wells exceeded the WHO guideline limit and this may be attributed to
the seepage of leachate into the groundwater. The high TDS at PG2 may be due to it
closeness to the landfill. Both wells exhibited a fluctuating trend with sampling period.
University of Ghana http://ugspace.ug.edu.gh
109
Mor et al (2006) reported a trend were TDS recorded a range of 302-2208 mg/l. Adeolu
et al (2011) also measured a TDS range of 160-5310 mg/l. Addo et al (2013) reported a
TDS range of 187 to 8990 mg/L with a mean level of 1883 mg/L in groundwater from
open-wells in the vicinity of a cement factory at Akporkloe, Southeastern Ghana.
4.4.6. Biological oxygen demand (BOD)
The Biological oxygen demand (BOD) of groundwater sampled from the research
location (coded PG1) ranged from 51-88.7 mg/l with a mean of 67.567 mg/l and standard
deviation of 19.260 (Table 4.5). The highest BOD of 88.7 mg/l for PG1 on the Pantang
landfill was recorded in the month of March and the least 51 mg/l in the month of April
(Tables 4.6, Figure 4.16). BOD of PG2 ranged from 98-112mg/l with a mean of 106.333
mg/l and standard deviation of 7.371.
The highest BOD of 112 mg/l for PG2 was recorded in the month of April and the least
98 mg/l in the month of March (Tables 4.6, Figure 4.16). The BOD for both wells fell
below the WHO guideline limit and this may be attributed to the seepage of leachate into
the groundwater. Both wells exhibited a fluctuating trend with sampling period. The high
BOD at the research location (coded PG2) may be due to it closeness to the landfill thus
making it to receive more pollutants compared to PG1.
4.4.7. Chemical oxygen demand (COD)
The Chemical oxygen demand (COD) of groundwater sampled from the research
location (coded PG1) ranged from 102-106 mg/l with a mean of 104.333 mg/l and
University of Ghana http://ugspace.ug.edu.gh
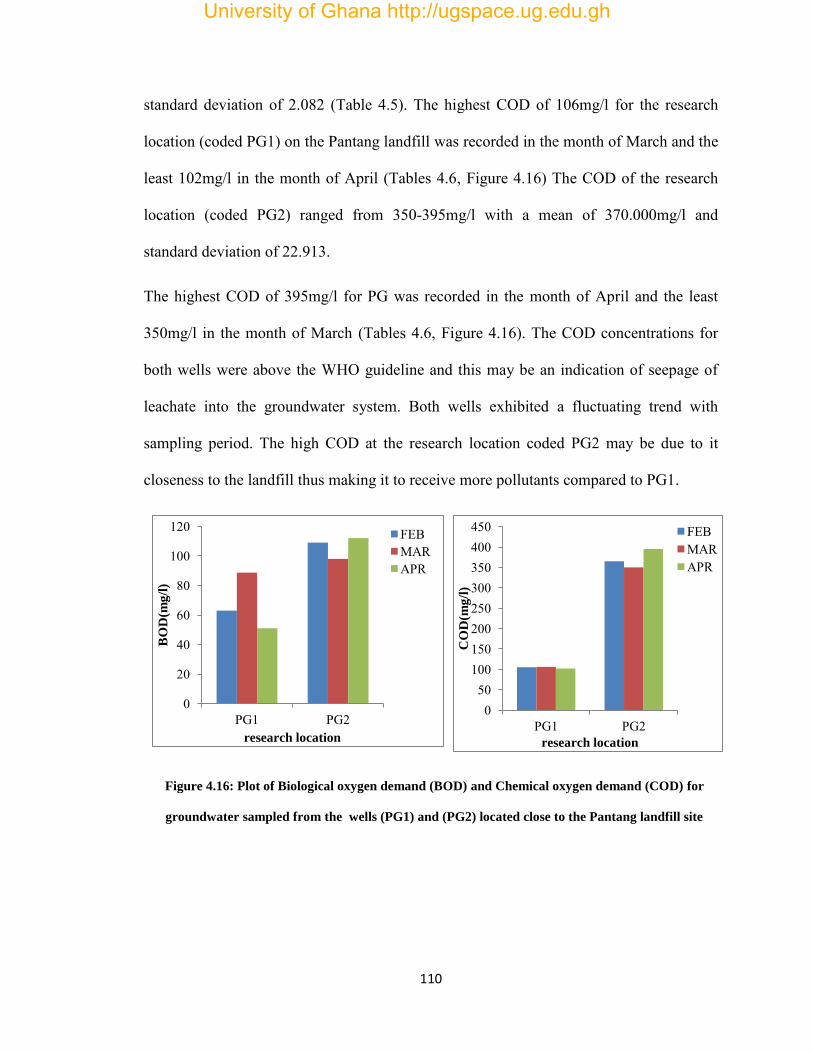
110
standard deviation of 2.082 (Table 4.5). The highest COD of 106mg/l for the research
location (coded PG1) on the Pantang landfill was recorded in the month of March and the
least 102mg/l in the month of April (Tables 4.6, Figure 4.16) The COD of the research
location (coded PG2) ranged from 350-395mg/l with a mean of 370.000mg/l and
standard deviation of 22.913.
The highest COD of 395mg/l for PG was recorded in the month of April and the least
350mg/l in the month of March (Tables 4.6, Figure 4.16). The COD concentrations for
both wells were above the WHO guideline and this may be an indication of seepage of
leachate into the groundwater system. Both wells exhibited a fluctuating trend with
sampling period. The high COD at the research location coded PG2 may be due to it
closeness to the landfill thus making it to receive more pollutants compared to PG1.
Figure 4.16: Plot of Biological oxygen demand (BOD) and Chemical oxygen demand (COD) for
groundwater sampled from the wells (PG1) and (PG2) located close to the Pantang landfill site
0
20
40
60
80
100
120
PG1 PG2
BO
D(m
g/l
)
research location
FEB MAR APR
0 50
100 150 200 250 300 350 400 450
PG1 PG2
CO
D(m
g/l
)
research location
FEB MAR APR
University of Ghana http://ugspace.ug.edu.gh
111
4.4.8. Dissolved oxygen (DO)
The Dissolved oxygen (DO) of groundwater sampled from the research location (coded
PG1) ranged from 3.3 -3.5 mg/l with a mean of 3.423 mg/l and standard deviation of
0.108 (Table 4.5). The highest DO of 3.50mg/l for PG1 was recorded in the month of
April and the least 3.30mg/l in the month of March (Tables 4.6, Figure 4.17). DO of PG2
ranged from 2.7-2.81mg/l with a mean of 2.753mg/l and standard deviation of 0.055. The
highest DO of 2.81mg/l for the research location (coded PG2) on the Pantang landfill was
recorded in the month of March and the least 2.7mg/l in the month of April (Tables 4.6,
Figure 4.17).
The DO concentrations for both wells were below the WHO guideline and this may be an
indication of seepage of leachate into the groundwater system which tends to use the
oxygen in the groundwater for decomposition. Compared to PG1,PG2 recorded a much
lower DO indicating that it has higher organic content which may be due to it closeness
to the landfill. Both wells exhibited a fluctuating trend with sampling period. Efe et al
(2005) reported a range of 3.42-6.84 mg/l for open well water in Delta State, Nigeria.
Addo et al (2013) reported a DO range of 4.30 and 5.70 with a mean of 5.06 in
groundwater from open-wells in the vicinity of a cement factory at Akporkloe,
Southeastern Ghana.
4.4.9. Nitrate (NO3)
The nitrate concentration of groundwater sampled from the research location (coded
PG1) ranged from 1.00-1.88 mg/l with a mean of 1.523 mg/l and standard deviation of
University of Ghana http://ugspace.ug.edu.gh
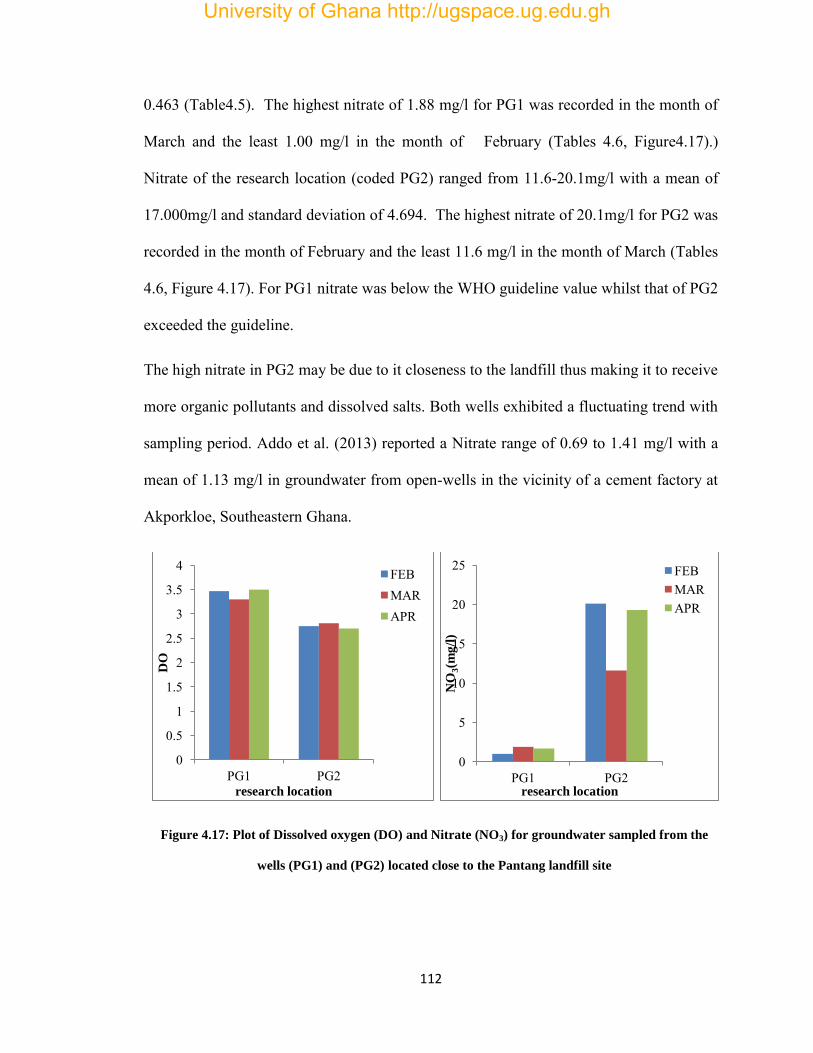
112
0.463 (Table4.5). The highest nitrate of 1.88 mg/l for PG1 was recorded in the month of
March and the least 1.00 mg/l in the month of February (Tables 4.6, Figure4.17).)
Nitrate of the research location (coded PG2) ranged from 11.6-20.1mg/l with a mean of
17.000mg/l and standard deviation of 4.694. The highest nitrate of 20.1mg/l for PG2 was
recorded in the month of February and the least 11.6 mg/l in the month of March (Tables
4.6, Figure 4.17). For PG1 nitrate was below the WHO guideline value whilst that of PG2
exceeded the guideline.
The high nitrate in PG2 may be due to it closeness to the landfill thus making it to receive
more organic pollutants and dissolved salts. Both wells exhibited a fluctuating trend with
sampling period. Addo et al. (2013) reported a Nitrate range of 0.69 to 1.41 mg/l with a
mean of 1.13 mg/l in groundwater from open-wells in the vicinity of a cement factory at
Akporkloe, Southeastern Ghana.
Figure 4.17: Plot of Dissolved oxygen (DO) and Nitrate (NO3) for groundwater sampled from the
wells (PG1) and (PG2) located close to the Pantang landfill site
0
0.5
1
1.5
2
2.5
3
3.5
4
PG1 PG2
DO
research location
FEB MAR APR
0
5
10
15
20
25
PG1 PG2
NO
3(m
g/l
)
research location
FEB MAR APR
University of Ghana http://ugspace.ug.edu.gh
113
4.4.10. Nitrite (NO2)
The nitrite concentration of groundwater sampled from the research location (coded PG1)
ranged from 0.019-0.026 mg/l with a mean of 3.423 mg/l and standard deviation of 0.004
(Table 4.5). The highest nitrite of 0.026 mg/l for PG1 was recorded in the month of
March and the least 0.019mg/l in the month of February (Tables 4.6). Nitrite of the
research location (coded PG2) ranged from 0.375-0.44mg/l with a mean of 0.415mg/l and
standard deviation of 0.035. The highest nitrite of 0.44 mg/l for PG2 was recorded in the
month of March and the least 0.375mg/l in the month of February (Tables 4.6).
The Nitrite concentrations for both wells were below the WHO guideline. The high nitrite
in PG2 may be due to it closeness to the landfill thus making it to receive more organic
pollutants and dissolved salts. Both wells exhibited a fluctuating trend with sampling
period. Mor et al. (2006) reported a nitrite range of 0- 0.56 mg/l.
4.4.11. Ammonia (NH3)
The ammonia concentration of groundwater sampled from the research location (coded
PG1) ranged from 0.01-0.014 mg/l with a mean of 3.423 mg/l and standard deviation of
0.002 (Table 4.5). The highest ammonia of 0.014mg/l for PG1 was recorded in the
month of February and the least 0.010mg/l in the month of March (Tables 4.6). Ammonia
of the research location (coded PG2) ranged from 0.016-0.32 mg/l with a mean of
0.145mg/l and standard deviation of 0.157.
The highest ammonia of 0.32 mg/l for PG2 was recorded in the month of March and the
least 0.016mg/l in the month of February (Tables 4.6). Both wells exhibited a fluctuating
University of Ghana http://ugspace.ug.edu.gh
114
trend with sampling period. The Ammonia concentrations for both wells were below the
WHO guideline. The high Ammonia in PG2 may be due to it closeness to the landfill
thus making it to receive more organic pollutants and dissolved salts.
4.4.12. Total phosphorus (TP)
The total phosphorus concentration of groundwater sampled from the research location
(coded PG1) ranged from 0.3 – 0.39 mg/l with a mean of 0.353 mg/l and standard
deviation of 0.047 (Table 4.5). The highest TP of 0.39 was recorded in the month of
February and the least 0.30 in the month of March (Tables 4.6, Figure 4.18). Total
phosphorus measured at the research location (coded PG2) on the Pantang landfill ranged
from 2.4-3mg/l with a mean of 2.780mg/l and standard deviation of 0.330.The highest TP
of 3.00 was recorded in the month of February and the least 2.4 in the month of March
(Tables 4.6, Figure 4.18).
Both wells exhibited a fluctuating trend with sampling period. TP is an indication of
anthropogenic biological pollution. Most natural waters record phosphorus levels of
0.005-0.020 mg/l (Addo et al., 2011). Addo et al. (2013) reported a PO4-P range of 0.001
and 0.024 mg/l with a mean concentration of 0.007 mg/L in groundwater from open-
wells in the vicinity of a cement factory at Akporkloe, Southeastern Ghana.
4.4.13. Sulphate (SO4)
The Sulphate concentration of groundwater sampled from the research location (coded
PG1) ranged from 15-22.5 mg/l with a mean of 19.667 mg/l and standard deviation of
University of Ghana http://ugspace.ug.edu.gh

115
4.072 (Table 4.5) .The highest sulphates of 22.5mg/l was recorded in the month of
February and the least 15.0mg/l in the month of March (Tables 4.6, Figure 4.18). The
concentration of Sulphate of the research location (coded PG2) ranged from 53-65mg/l
with a mean of 60.767mg/l and standard deviation of 6.735. The highest sulphate of
65mg/l was recorded in the month of February and the least 53mg/l in the month of
March (Tables 4.6, Figure 4.18). The concentrations of sulphate for both wells were
below the WHO guideline.
The high sulphate in PG2 may be due to it closeness to the landfill thus making it to
receive more organic pollutants and dissolved salts. Both wells exhibited a fluctuating
trend with sampling period. Mor et al. (2006) reported a result ranging from12-1096
mg/l. Addo et al. (2013) reported a sulphate range of 22.84mg/l to a high of 998.65mg/l
with a mean of 233.47mg/l in groundwater from open-wells in the vicinity of a cement
factory at Akporkloe, Southeastern Ghana.
Figure 4.18: Plot of Total phosphorus (TP) and Sulphate (SO4) for groundwater sampled from the
wells (PG1) and (PG2) located close to the Pantang landfill site
0
0.5
1
1.5
2
2.5
3
3.5
PG1 PG2
TP
(mg
/l)
research location
FEB MAR APR
0
10
20
30
40
50
60
70
PG1 PG2
SO
4(m
g/l
)
research location
FEB MAR APR
University of Ghana http://ugspace.ug.edu.gh
116
4.4.14. Sulphite (SO3)
The Sulphite concentration of groundwater sampled from the research location (coded
PG1) ranged from 2.90-3.20 mg/l with a mean of 3.03 mg/l and standard deviation of
0.153 (Table 4.5). The highest sulphite of 3.2mg/l was recorded in the month of April and
the least 2.9mg/l in the month of February (Tables 4.6). Sulphite of the research location
(coded PG2) on the Pantang landfill ranged from 32-36mg/l with a mean of 34.367mg/l
and standard deviation of 2.098. The highest sulphite of 36mg/l was recorded in the
month of March and the least 32mg/l in the month of February (Tables 4.6). Both wells
exhibited a fluctuating trend with sampling period.
The high Sulphite contents of PG2 may be due to the high degree of seepage of leachate
into the groundwater. Generally, the entire nutrient loads (TP, SO4 andSO3) for both
wells were below the WHO guidelines and this means organic pollution by leachate is
quite low and this may be due to the natural filtration, absorption and adsorption of the
nutrients unto the soil interface and the natural geology of the area.
4.4.15. Zinc (Zn)
The Zn concentration of groundwater sampled from the research location (coded PG1)
ranged from 0.013-0.015 mg/l with a mean of 0.014 and standard deviation of 0.001
(Table 4.5). The highest Zn of 0.015mg/l for PG1 was recorded in the month of March
and April; and the least 0.013mg/l in the month of February (Tables 4.6). Concentration
of Zn measured at the research location (coded PG2) on the Pantang landfill ranged from
0.049-0.142mg/l with a mean of 0.110 and standard deviation of 0.053. The highest Zn of
University of Ghana http://ugspace.ug.edu.gh
117
0.142mg/l for PG2 was recorded in the month of February and the least 0.049mg/l in the
month of March (Tables 4.6). Both wells exhibited a fluctuating trend with sampling
period.
4.4.16. Copper (Cu)
The Cu concentration of groundwater sampled from the research location (coded PG1)
ranged from 0.017 – 0.025mg/l with a mean of 0.022mg/l and standard deviation of 0.004
(Table 4.5). The highest Cu of 0.025mg/l for PG1 was recorded in the month April and
the least 0.017mg/l in the month of March (Tables 4.6, Figure 4.19). The concentration of
Cu for the research location (coded PG2) on the Pantang landfill ranged from 1.135-
1.216mg/l with a mean of 1.188 mg/l and standard deviation of 0.046. The highest Cu of
0.025mg/l for PG2 was recorded in the month April and the least 0.017mg/l in the month
of March (Tables 4.6, Figure 4.19). Both wells exhibited a fluctuating trend in
concentration with sampling period.
4.4.17. Chromium (Cr)
The Cr concentration of groundwater sampled from the research location (coded PG1)
ranged from 0.186 -0.196 mg/l with a mean of 0.192 mg/l and standard deviation of
0.006 (Table 4.5). The highest Cr of 0.196mg/l for PG1 was recorded in the month April
and the least 0.186mg/l in the month of February (Tables 4.6, Figure 4.19). The
concentration of Cr measured at the research location (coded PG2) ranged from 0.101-
0.132mg/l with a mean of 0.119mg/l and standard deviation of 0.016. The highest Cr of
University of Ghana http://ugspace.ug.edu.gh
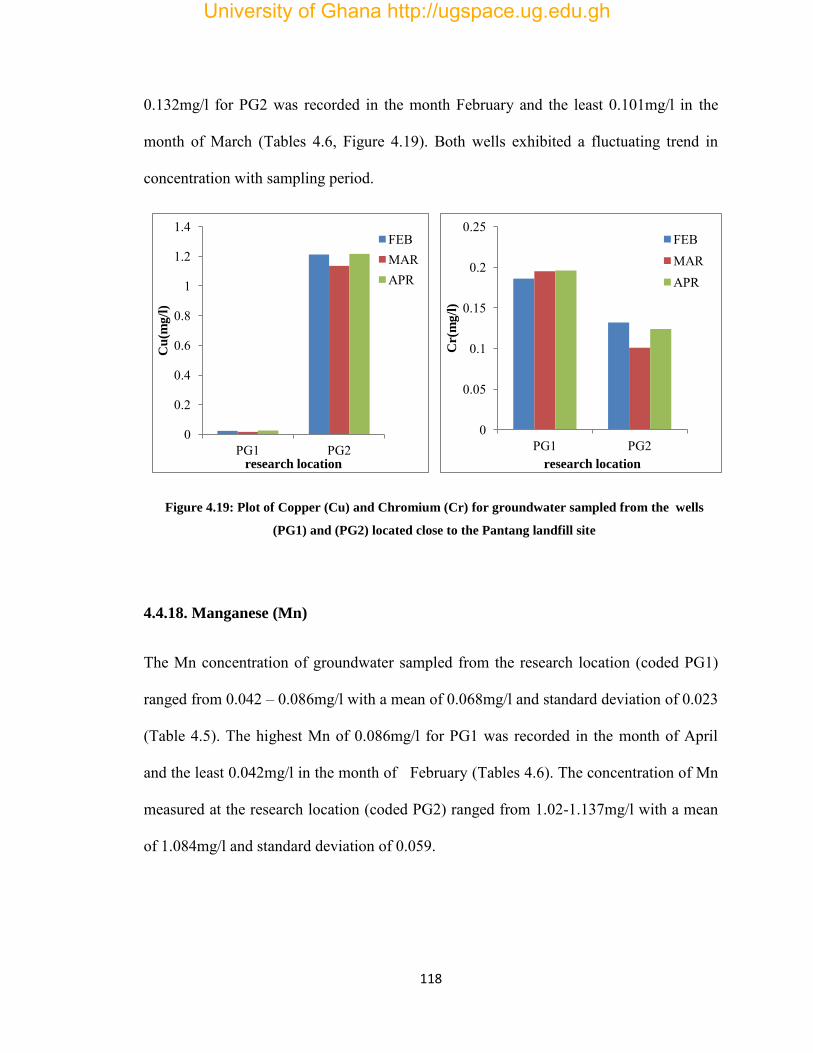
118
0.132mg/l for PG2 was recorded in the month February and the least 0.101mg/l in the
month of March (Tables 4.6, Figure 4.19). Both wells exhibited a fluctuating trend in
concentration with sampling period.
Figure 4.19: Plot of Copper (Cu) and Chromium (Cr) for groundwater sampled from the wells
(PG1) and (PG2) located close to the Pantang landfill site
4.4.18. Manganese (Mn)
The Mn concentration of groundwater sampled from the research location (coded PG1)
ranged from 0.042 – 0.086mg/l with a mean of 0.068mg/l and standard deviation of 0.023
(Table 4.5). The highest Mn of 0.086mg/l for PG1 was recorded in the month of April
and the least 0.042mg/l in the month of February (Tables 4.6). The concentration of Mn
measured at the research location (coded PG2) ranged from 1.02-1.137mg/l with a mean
of 1.084mg/l and standard deviation of 0.059.
0
0.2
0.4
0.6
0.8
1
1.2
1.4
PG1 PG2
Cu
(mg
/l)
research location
FEB MAR APR
0
0.05
0.1
0.15
0.2
0.25
PG1 PG2 C
r(m
g/l
) research location
FEB MAR APR
University of Ghana http://ugspace.ug.edu.gh

119
The highest Mn of 1.137mg/l for PG2 was recorded in the month of February and the
least 1.02mg/l in the month of March (Tables 4.6). Both wells exhibited a fluctuating
trend in concentration with sampling period.
4.4.19. Iron (Fe)
The Fe concentration of groundwater sampled from the research location (coded PG1)
ranged from 0.053 – 0.073 mg/l with a mean of 0.066 mg/l and standard deviation of
0.011 (Table 4.5). The highest Fe of 0.073mg/l for PG1 was recorded in the month of
April and the least 0.053mg/l in the month of February (Tables 4.6). The concentration of
Fe measured at the research location (coded PG2) ranged from 4.501-7.83mg/l with a
mean of 6.240mg/l and standard deviation of 1.670. The highest Fe of 7.83mg/l for PG2
was recorded in the month of February and the least 4.501mg/l in the month of March
(Tables 4.6). Both wells exhibited a fluctuating trend in concentration with sampling
period.
4.4.20. Cadmium (Cd)
The Cd concentration of groundwater sampled from the research location (coded PG1)
ranged from 0.007 mg/l and 0.036 mg/l with an average of 0.024 mg/l and standard
deviation of 0.015 (Table 4.5). The highest Cd of 0.036mg/l for PG1 was recorded in the
month of February and the least 0.007mg/l in the month of March (Tables 4.6, Figure
4.20). The concentration of Cd measured at the research location (coded PG2) ranged
from 0.022-0.042mg/l with an average of 0.034mg/l and standard deviation of 0.011. The
highest Cd of 0.042mg/l for PG2 was recorded in the month of April and the least
University of Ghana http://ugspace.ug.edu.gh
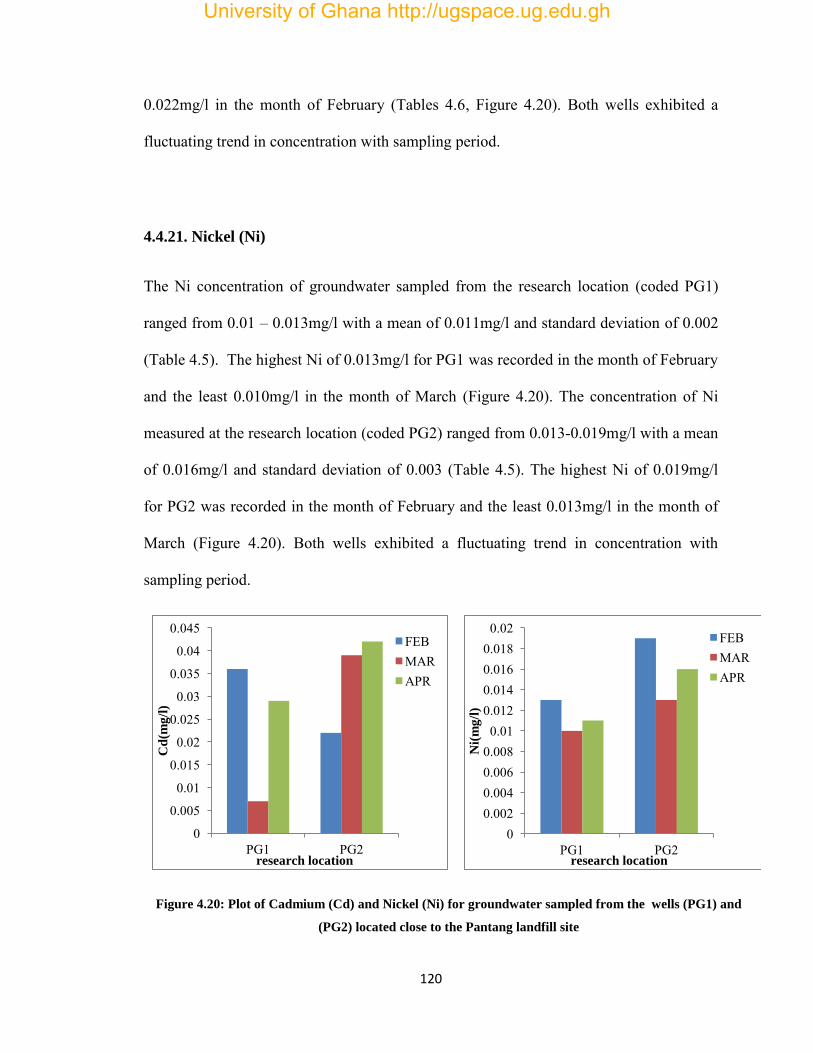
120
0.022mg/l in the month of February (Tables 4.6, Figure 4.20). Both wells exhibited a
fluctuating trend in concentration with sampling period.
4.4.21. Nickel (Ni)
The Ni concentration of groundwater sampled from the research location (coded PG1)
ranged from 0.01 – 0.013mg/l with a mean of 0.011mg/l and standard deviation of 0.002
(Table 4.5). The highest Ni of 0.013mg/l for PG1 was recorded in the month of February
and the least 0.010mg/l in the month of March (Figure 4.20). The concentration of Ni
measured at the research location (coded PG2) ranged from 0.013-0.019mg/l with a mean
of 0.016mg/l and standard deviation of 0.003 (Table 4.5). The highest Ni of 0.019mg/l
for PG2 was recorded in the month of February and the least 0.013mg/l in the month of
March (Figure 4.20). Both wells exhibited a fluctuating trend in concentration with
sampling period.
Figure 4.20: Plot of Cadmium (Cd) and Nickel (Ni) for groundwater sampled from the wells (PG1) and
(PG2) located close to the Pantang landfill site
0
0.005
0.01
0.015
0.02
0.025
0.03
0.035
0.04
0.045
PG1 PG2
Cd
(mg
/l)
research location
FEB MAR APR
0 0.002 0.004 0.006 0.008
0.01 0.012 0.014 0.016 0.018
0.02
PG1 PG2
Ni(
mg
/l)
research location
FEB MAR APR
University of Ghana http://ugspace.ug.edu.gh
121
The Zn, Cr and Cd concentrations of both wells were above the WHO guideline. The
high Zn concentration in PG2 may be due to it closeness to the landfill thus making it to
receive more organic pollutants, dissolved salts and ions.
The Cu, Mn, Fe and Ni concentrations of both wells were below the WHO guideline.
This likely indicates that these metals may be absorbed by the soil strata or by the organic
matter in soil. Metals remain in the waste or at the waste–rock interface as a result of
redox controlled precipitation reactions (Yanful et al., 1988).
Further, the metal mobility is also controlled by physical sorptive mechanisms and
landfills have an inherent in situ capacity for minimizing the mobility of toxic heavy
metals (Pohland et al., 1993). This fixing of heavy metals reduces the risk of direct toxic
effects due to ingestion of leachate contaminated groundwater. Both wells exhibited a
fluctuating trend in concentration with sampling period.
University of Ghana http://ugspace.ug.edu.gh
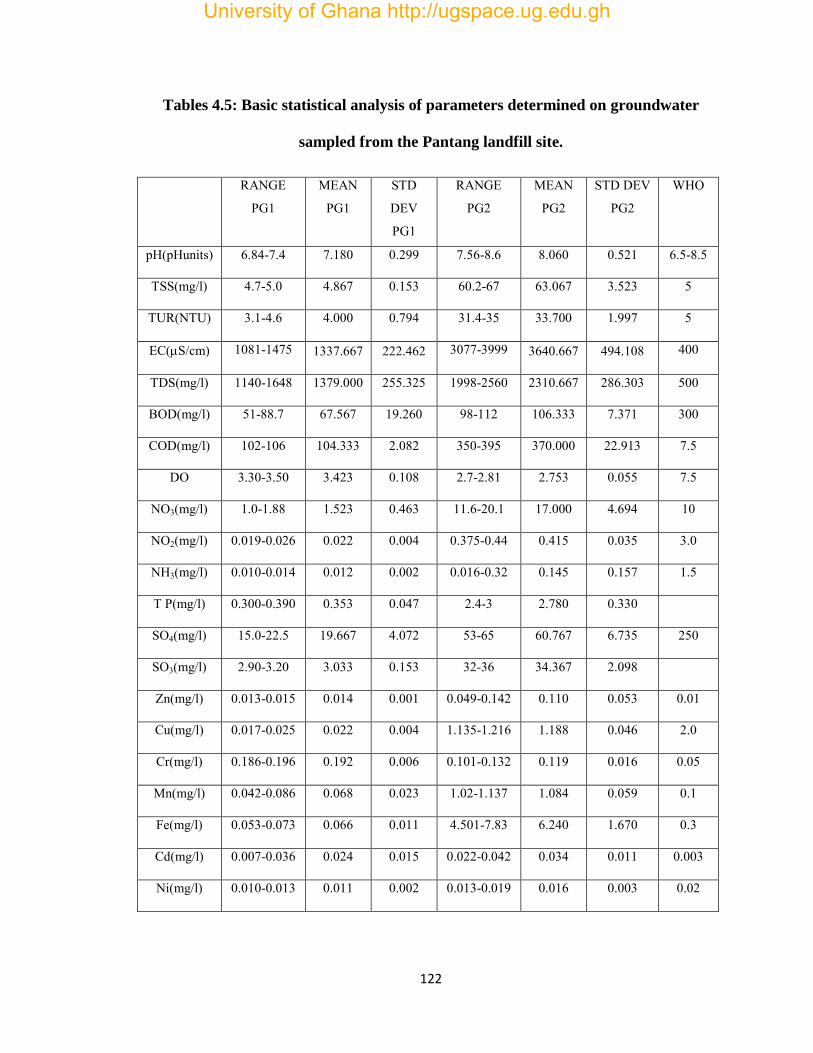
122
Tables 4.5: Basic statistical analysis of parameters determined on groundwater
sampled from the Pantang landfill site.
RANGE
PG1
MEAN
PG1
STD
DEV
PG1
RANGE
PG2
MEAN
PG2
STD DEV
PG2
WHO
pH(pHunits) 6.84-7.4 7.180 0.299 7.56-8.6 8.060 0.521 6.5-8.5
TSS(mg/l) 4.7-5.0 4.867 0.153 60.2-67 63.067 3.523 5
TUR(NTU) 3.1-4.6 4.000 0.794 31.4-35 33.700 1.997 5
EC(S/cm) 1081-1475 1337.667 222.462 3077-3999 3640.667 494.108 400
TDS(mg/l) 1140-1648 1379.000 255.325 1998-2560 2310.667 286.303 500
BOD(mg/l) 51-88.7 67.567 19.260 98-112 106.333 7.371 300
COD(mg/l) 102-106 104.333 2.082 350-395 370.000 22.913 7.5
DO 3.30-3.50 3.423 0.108 2.7-2.81 2.753 0.055 7.5
NO3(mg/l) 1.0-1.88 1.523 0.463 11.6-20.1 17.000 4.694 10
NO2(mg/l) 0.019-0.026 0.022 0.004 0.375-0.44 0.415 0.035 3.0
NH3(mg/l) 0.010-0.014 0.012 0.002 0.016-0.32 0.145 0.157 1.5
T P(mg/l) 0.300-0.390 0.353 0.047 2.4-3 2.780 0.330
SO4(mg/l) 15.0-22.5 19.667 4.072 53-65 60.767 6.735 250
SO3(mg/l) 2.90-3.20 3.033 0.153 32-36 34.367 2.098
Zn(mg/l) 0.013-0.015 0.014 0.001 0.049-0.142 0.110 0.053 0.01
Cu(mg/l) 0.017-0.025 0.022 0.004 1.135-1.216 1.188 0.046 2.0
Cr(mg/l) 0.186-0.196 0.192 0.006 0.101-0.132 0.119 0.016 0.05
Mn(mg/l) 0.042-0.086 0.068 0.023 1.02-1.137 1.084 0.059 0.1
Fe(mg/l) 0.053-0.073 0.066 0.011 4.501-7.83 6.240 1.670 0.3
Cd(mg/l) 0.007-0.036 0.024 0.015 0.022-0.042 0.034 0.011 0.003
Ni(mg/l) 0.010-0.013 0.011 0.002 0.013-0.019 0.016 0.003 0.02
University of Ghana http://ugspace.ug.edu.gh
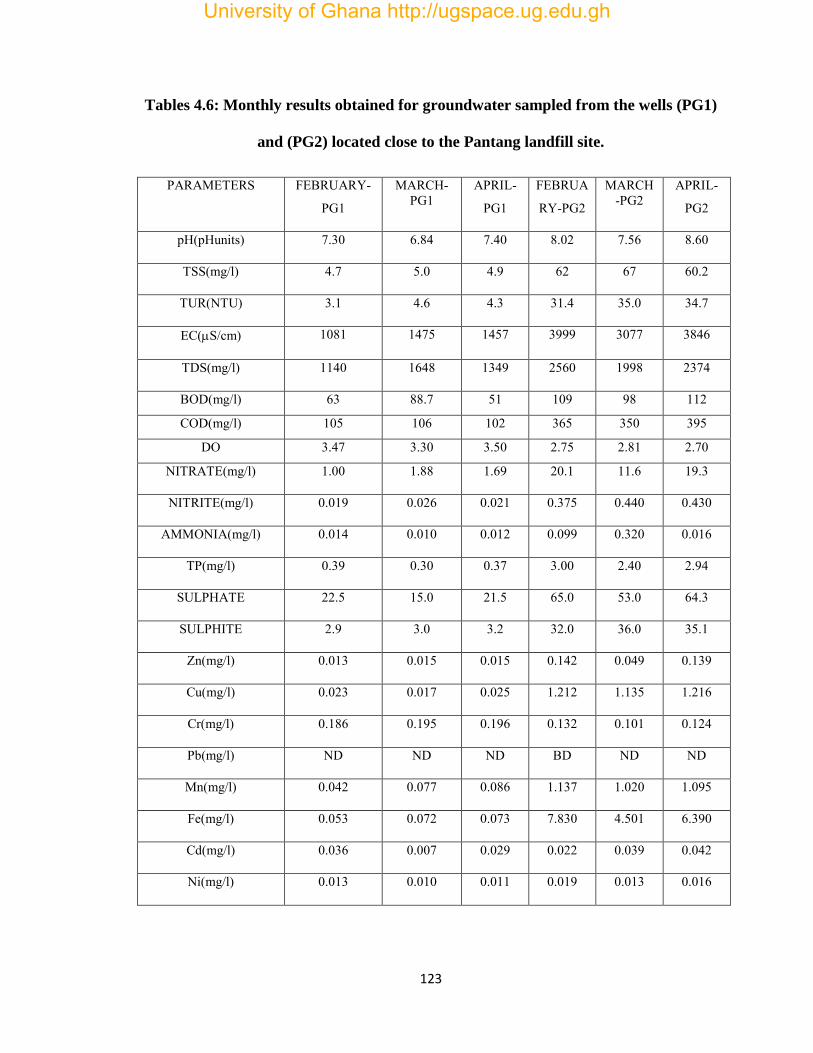
123
Tables 4.6: Monthly results obtained for groundwater sampled from the wells (PG1)
and (PG2) located close to the Pantang landfill site.
PARAMETERS FEBRUARY-
PG1
MARCH-PG1
APRIL-
PG1
FEBRUA
RY-PG2
MARCH-PG2
APRIL-
PG2
pH(pHunits) 7.30 6.84 7.40 8.02 7.56 8.60
TSS(mg/l) 4.7 5.0 4.9 62 67 60.2
TUR(NTU) 3.1 4.6 4.3 31.4 35.0 34.7
EC(S/cm) 1081 1475 1457 3999 3077 3846
TDS(mg/l) 1140 1648 1349 2560 1998 2374
BOD(mg/l) 63 88.7 51 109 98 112
COD(mg/l) 105 106 102 365 350 395
DO 3.47 3.30 3.50 2.75 2.81 2.70
NITRATE(mg/l) 1.00 1.88 1.69 20.1 11.6 19.3
NITRITE(mg/l) 0.019 0.026 0.021 0.375 0.440 0.430
AMMONIA(mg/l) 0.014 0.010 0.012 0.099 0.320 0.016
TP(mg/l) 0.39 0.30 0.37 3.00 2.40 2.94
SULPHATE 22.5 15.0 21.5 65.0 53.0 64.3
SULPHITE 2.9 3.0 3.2 32.0 36.0 35.1
Zn(mg/l) 0.013 0.015 0.015 0.142 0.049 0.139
Cu(mg/l) 0.023 0.017 0.025 1.212 1.135 1.216
Cr(mg/l) 0.186 0.195 0.196 0.132 0.101 0.124
Pb(mg/l) ND ND ND BD ND ND
Mn(mg/l) 0.042 0.077 0.086 1.137 1.020 1.095
Fe(mg/l) 0.053 0.072 0.073 7.830 4.501 6.390
Cd(mg/l) 0.036 0.007 0.029 0.022 0.039 0.042
Ni(mg/l) 0.013 0.010 0.011 0.019 0.013 0.016
University of Ghana http://ugspace.ug.edu.gh

124
4.4.22. Kerndoff Contamination Factor
The Kerndorff Contamination Factors for Cd, Mn, Cr, TP, Cu, NH3, SO3, Fe, SO4, Ni,
and NO3 were all above 1.0 and this indicates that these parameters might be leaking into
the ground water system (Table 4.7). NO2 and Zn recorded lower Kerndorff
Contamination Factors and this means these parameters may not be leaking. Cd had the
highest Kerndorff Contamination Factors of 12 and the lowest factor 0.108 was recorded
by Zn. The pollutants were ranked in the reducing migration order as
Cd>Mn>Cr>TP>Cu>NH3>SO3>Fe>SO4>Ni>NO3>NO2>Zn.
Table 4.7: Kerndoff Contamination Factor for PG1
Parameters Polluted
water(Ai)
Control water
(Bi)
KC factors(Ai)÷ (Bi)
Cd(mg/l) 0.024 0.002 12
Mn(mg/l) 0.068 0.012 5.667
Cr(mg/l) 0.192 0.038 5.053
TP(mg/l) 0.353 0.073 4.836
Cu(mg/l) 0.022 0.005 4.4
NH3(mg/l) 0.012 0.003 4.00
SO3 3.03 1.2 2.525
Fe(mg/l) 0.066 0.030 2.200
SO4 19.7 10.10 1.950
Ni(mg/l) 0.011 0.006 1.833
NO3(mg/l) 1.52 1.1 1.382
NO2(mg/l) 0.022 0.042 0.524
Zn(mg/l) 0.014 0.120 0.117
University of Ghana http://ugspace.ug.edu.gh
125
4.5. CORRELATION ANALYSIS OF PARAMETERS
Turbidity of PL had a strong positive correlation with TSS and this implies that there is a
close association between the two parameters. This may also mean that TSS and turbidity
are from a common source. The TDS of ML had a strong positive correlation with
turbidity. The NO3 of PL had a strong negative correlation with DO. The TP of ML had a
negative correlation with turbidity, (Appendix 8). SO4 of PL had a strong positive
correlation with TP. The Cu of ML had a positive correlation with NO3 (Appendix 8). Zn
of PL had a negative correlation with TP.
The TSP of the air sampled from the Pantang landfill has a strong positive correlation
with PM10 (Appendix 9). NH3 of the air sampled from the Mallam landfill has a strong
positive correlation with PM10 and TSP and this implies that there is a close association
between the two parameters. The SO2 of the air sampled from the Pantang landfill has a
strong positive correlation with TSP and NH3. Zn of the air sampled from the Mallam
landfill has a strong negative correlation with NH3 and SO2, (Appendix 9). The Ni of the
air sampled from the Pantang landfill has a strong negative correlation with PM10, TSP,
and SO2.
Cu of the air sampled from the Mallam landfill has a strong positive correlation with
PM10, TSP and this implies that there is a close association between the parameters. The
Mn of the air sampled from the Pantang landfill has a strong positive correlation with
NH3 and SO2; and negative correlation with Ni. Cr of the air sampled from the Mallam
landfill has a strong positive correlation with Zn and Ni. The Cd of the air sampled from
the Pantang landfill has a negative correlation with SO2, Mn and Cr (Appendix 9). Pb of
University of Ghana http://ugspace.ug.edu.gh
126
the air sampled from the Mallam landfill has a strong positive correlation with Mn, Cr
and Cd.
OM showed a strong positive correlation with OC. EC showed a strong negative
correlation with OC and OM. NO3showed a strong negative correlation with OC and
OM; and strongly positive correlation with EC. Mn showed a strong positive correlation
with pH, OC and OM; and a strong negative correlation with EC (Appendix 10). Cu
showed a positive correlation with pH and negative correlation with NH3. Zn correlated
positively with EC and NO3 (Appendix 10). Fe showed a strong positive correlation with
OC, OM, Mn and Zn; and this implies that there is a close association between the
parameters. Cr correlated positively with pH, Fe and Mn. Pb correlated positively with
EC, Cu and NO3; and negatively with OC and OM. Cd showed only negative correlation
with EC, Cu, Zn and Pb; and NO3 (Appendix 10). Ni correlated positively with pH, Pb
and Cu; and negatively with Cd.
Turbidity of PG1 had a strong positive correlation with TSS and negative correlation with
pH (Appendix 11). NO3 of PG1 had a strong positive correlation with EC, TDS and
negative correlation with pH and DO (Appendix 11). The TP of PG2 had a strong
positive correlation with NO3 and negative correlation with TSS (Appendix 11). Cr of
PG1 had a strong positive correlation with TSS, EC, TDS and NO3 and this implies that
there is a close association between the two parameters; and negative correlation
withNH3 TP and SO4. The Cd of PG2 had a strong positive correlation with turbidity,
NO2, and SO3; and negative correlation with EC, TDS and Cr (Appendix 11).
University of Ghana http://ugspace.ug.edu.gh
127
CHAPTERFIVE
CONCLUSION AND RECOMMENDATIONS
5.1. CONCLUSION
The leachate from the Pantang landfill recorded higher concentration values compared to
the Mallam landfill. This may be due to the fact that the Pantang landfill is active while
the Mallam site has been closed for more than a decade now. For the Pantang landfill,
with the exception of pH, Cu, Cr, Mn, Cd and Ni, all the other parameters measured
recorded concentrations above the EPA guideline for effluent discharge into the
environment. The Pantang landfill recorded higher concentrations in the pollutants
compared to Mallam because of the input of waste and also because the Mallam site no
longer receives waste. The concentration of pollutants exhibited a lower trend in March
probably due to the rainfall experienced in that month during sampling which might have
led to dilution. With the exception of pH, Zn, Cr, Ni. Mn, Cu and Cd all the other
parameters determined on the leachate from the Mallam landfill, recorded concentrations
above the EPA guideline for effluent discharge into the environment. The low metals
concentrations in the leachates from both sites may be due to sorption, complexation and
precipitation.
The analysis of the air sampled from the landfills revealed that air sampled from the
Pantang landfill is releasing huge amounts of PM10 and TSP into the environment
compared to the Mallam landfill. The PM10 and TSP of the Pantang landfill was above
the EPA and WHO guidelines whilst that of Mallam was within the guideline. The high
PM10 and TSP of the Pantang landfill may be attributed to the regular combustion of
University of Ghana http://ugspace.ug.edu.gh
128
waste on it. With the exception of Ni, Mn and Cd all the parameters determined for air
sampled from the Pantang landfill had their concentrations above EPA and WHO
guideline values. The air sampled from the Mallam landfill had all the parameters
determined being below the EPA and WHO guideline values with the exception of SO2
and Pb which were above the guideline. Rainfall affected the trend in the concentrations
of PM10 and TSP sampled on both sites. Rainfall in March during sampling led to lower
concentrations in air parameters determined for both sites.
The physical and nutrient parameters determined for the soil sampled from the vicinity of
the Pantang landfill recorded higher vales compared to values obtained for the control
site. This may be due to the presence of large amounts of organic matter on and around
the landfill. For the metals determined for the soil, with the exception of Cu, Zn and Cd
all other metals were lower than their World average shale values and this may be due to
processes sorption, complexation and precipitation. The well on the Pantang landfill
coded PG2 recorded higher pollutant concentrations compared to the well PG1 and this
may be due to it closeness to the landfill. For PG1 with the exception of the TSS, EC,
TDS, Zn, Cr, Mn and Cd which recorded concentration values above the WHO guideline
,all other parameters had lower concentrations and this may be due to it distance away
from the landfill which allows more interaction of pollutants with the soil interface
leading to their adsorption hence the low concentrations. For the well PG2 with the
exception of BOD, NO2, NH3 Cu and Ni which recorded lower values, all other
parameters had concentrations above the WHO guidelines for drinking water quality.
University of Ghana http://ugspace.ug.edu.gh
129
The pollution indexes calculated revealed that both the Pantang and Mallam landfills are
sources of pollution. The LPI for the Pantang landfill was 18.573 and that of Mallam was
4.799. The AQI calculated for the Pantang landfill was 598.8 and Mallam 28.9.
The implication of data obtained is that the Pantang and Mallam landfills are impacting
negatively on the air, soil and water in their vicinity and this confirms the school of
thought that landfills impact negatively on their environment.
5.2. RECOMMENDATIONS
Selection of sites for land filling should be done in a manner that would result in the
protection of the integrity of the environment. The EPA must ensure the implementation
of regulations governing landfill construction, ownership and operation. The EPA must
also work to enforce the' no burning policy' to minimize burning and reduce the smoke
that is emitted into the air at the Pantang landfill site.
There is the need for the government to put up a sanitary landfill for the Accra metropolis
and put an end to the reliance on abandoned quarry site and marshy areas for waste
disposal. There is also the need for AMA to reinforce the capping system at the Mallam
landfill site and also reconstruct drains with covers to carry leachates from the landfill
away from the community.
University of Ghana http://ugspace.ug.edu.gh
130
REFERENCES
Abbas, A., Jingsong, G. Ping, L. Z. Ya, P. Y. and Al-Rekabi, W. S. (2009).
Review on landfill leachate treatments. Journal of Applied Sciences Research, 5
(5), 534–545.
Abdulhussain, A., Jingsong, G., Ping, L.Z., Ying, Y.P., and Wisaam, S. A. (2009).
Review on Landfill Leachate Treatments. American Journal of Applied Sciences 6
(4): 672-684.
Accra Metropolitan Assembly, Waste Management Department (2013).
Addo, M. A., Darko, E. O., Gordon, C. Nyarko, B. J. B., and Gbadago, J. K.
(2011).Heavy Metal Concentrations in Road Deposited Dust at Ketu-South
District, Ghana. Intionational Journal of Science and Technology, 2 (1), 28-39.
Addo, M. A., Darko, E.O., Gordon, C., B. and Nyarko J. B. (2013). Water quality
analysis and human health risk assessment of groundwater from open-wells in the
vicinity of a cement factory at Akporkloe, Southeastern Ghana. e-Journal of
Science & Technology.
Aderemi Adeolu O., Oriaku Ada V., Adewumi Gbenga A., and Otitoloju
Adebayo A. (2011) Assessment of groundwater contamination by leachate near a
municipal solid waste landfill.
Afzal, S., Ahmad, I., Younas, M., Zahid, M.D., Khan, M.H.A., Ijaz., A. and Ali.,
K. (2000). Study of water quality of Hudiara drain, India-Pakistan. Environment
International, 26.87-96.
University of Ghana http://ugspace.ug.edu.gh

131
Akaeze, C.S (2001). Elemental Composition of Soil in Some Dumpsites.
Electronic Journal of Environmental and Food Chemistry. (1579-433), 1351.
Akiti, S., Dzifa Denutsui, T.T., Osae, A.O., Tutu, S., Blankson-Arthur, J.E.,
Ayivor, F.N., Adu-Kwame and C. Egbi. (2012). Leachate Characterization and
Assessment of Unsaturated Zone Pollution near Municipal Solid Waste Landfill
Site at Oblogo, Accra-Ghana. Research Journal of Environmental and Earth
Sciences 4(1), 134-141.
Aluko, O.O., Sridhar, M.K.C., and Ooluwande, P.A. (2003). Characterization of
leachates from a municipal solid waste landfill site in Ibadan, Nigeria. J. Environ.
Health Res., 2(1).
Al-Yaqout, A. F., and Hamoda, M. F. Evaluation of landfill leachate in arid
climate-a case study. Environment International, 29(5), 593–600.
Azim, M., Mahabubur R., Riaz, H. K. and Kamal, A.T.M.M (2011)
Characteristics of leachate generated at landfill sites and probable risks of surface
and groundwater pollution in the surrounding areas: a case study of matuail
landfill site, Dhaka. Journal of Bangladesh Academy of Sciences, 35(2), 153-160.
Benneh, G., Songsore, J., and Nabila, J.S. (1993): Environmental Problems and
the Urban Household in the Greater Accra Metropolitan Area, Ghana.
Bertazzoli, R., and Pelegrini, R. (2002). Photoelectrochemical discoloration and
degradation of organic pollutants in aqueous solutions. Quimica Nova.
University of Ghana http://ugspace.ug.edu.gh
132
Bohdziewicz, J., and Kwarciak, A. (2008). The application of hybrid system
UASB reactor-RO in landfill leachate treatment. Desalination, 222(1–3), 128–
134.
Callander, J., and Barford, P. (1983). Precipitation, chelation and the availability
of metals as nutrients in anaerobic digestion. Biotechnol.Bioeng. 25: 351368
Campbell, D.J.V. (1993). Environmental Management of Landfill sites. J.I.
W.E.M, 2 (7), 170-173.
Christensen, T. H. Kjeldsen, P., and Bjerg, P. L. Biogeochemistry of landfill
leachate plumes. Applied Geochemistry, 16(7-8), 659–718.
Chu, L. M., Cheung, K. C., and M. H. Wong. (1994). Variations in the chemical
properties of landfill leachate. Environ. Manage, 18, 105-117.
Clarke, A.G. (1986). Understanding our environment. Royal Society of Chemistry:
London, 71-118.
Deng, Y., and Englehardt, J. D. Electrochemical oxidation for landfill leachate
treatment. Waste Management, 27 (3), 380–388.
Dooley, F.J., Dean A., Bangsund, F., Leistritz, L., and William R. (1993).
Estimating Optimal Landfill Sizes and Locations in North Dakota.
Edelmann, W., Schleiss, K., and Joss, A. (2000). Ecological, energetic and
economic comparison of anaerobic digestion with different competing
technologies to treat biogenic waste. Water Sci. Technol. 41(263-273), 949.
University of Ghana http://ugspace.ug.edu.gh
133
Eduljee, G.H. (1995) Emissions to the atmosphere. The Royal Society of
Chemistry: Cambridge, UK, (69), 69-89.
Efe, S. I., Ogban, F. E., Horsfall, M. Jnr. Akporhonor, E. E. (2005). Seasonal
variations of physico-chemical characteristics in water resources quality in
Western Niger Delta Region, Nigeria. J. Appl. Sci. Environ. Mgt, 9 (1), 191 – 195.
Elliott, P., Richardson, S., Abellan, J.J., Thomson, A., de Hoogh, C., Jarup, L.,
and Briggs, D.J. (2009). Geographic density of landfill sites and risk of congenital
anomalies in England. Occup. Environ. Med. 66, 81–89.
EU. (1999). Council Directive on the landfilling of waste
Finnecy, E.E., and Pearce, K.W. (1986). Land contamination and reclamation.
Royal Society of Chemistry: London, 172-225.
Foo, K. Y., and Hameed, B. H. (2009). An overview of landfill leachate treatment
via activated carbon adsorption process. Journal of Hazardous Materials, 171(1–
3), 54–60.
Ga East Municipal Assembly. (2012)
Ga South Municipal Assembly. (2012)
Gendebien, A., Pauwels, M., and Ledrut-Damanet, M.-J. (1992) Landfill gas from
environment to energy.
Ghana Statistical Services. (2012). 2010 Population and Housing Census (PHC).
Halim, C. E., Scott, J. A., Natawardaya, H., Amal, R. Beydoun, D., and Low, G.
(2004). Comparison between acetic acid and landfill leachates for the leaching of
University of Ghana http://ugspace.ug.edu.gh
134
Ph(II), Cd(II), As(V), and Cr(VI) from clementitious wastes. Environmental
Science and Technology, 38(14), 3977–3983.
Harikumar, P. S. Nasir, U. P., and Mujeebu Rahma, M. P. (2009). Distribution of
heavy metals in the core sediments of a tropical wetland system. International
Journal. Environmental Science Technology, 6(2), 225-232.
Harmsen, J. (1983). Identification of organic compounds in leachate from a waste
tip. Water Research, 17(6), 699–705.
Henry, J and Heinke, G. (1996). Environmental Science and Engineering.
Prentice Hall, Yorkshire, 6(2),44 -46
Jensen, D. L., and Christensen, T. H. (1999). Colloidal and dissolved metals in
leachates from four Danish landfills. Water Research, 33, (9), 2139–2147.
Jones, D. L. Williamson, K. L., and Owen, A. G. (2006). Phytoremediation of
landfill leachate. Waste Management, 26(8), 825–837.
Kaluli, W., Mwangi, H. M., and Sira, F. N. (2011). Sustainable solid waste
management strategies in Juja, Kenya
Kerndorff, H., Schleyer, R., Milde, G., and Plumb Jr. (1992). Geochemistry of
groundwater pollutants at German waste disposal sites. In: S. Lesage and R.
Jackson (Eds.), Groundwater contamination and analysis at hazardous waste sites.
Environmental Science and Pollution Control Series, 4, 245-271.
Kjeldsen, P., and Christophersen, M. (n.d) Composition of leachate from old
landfills in Denmark. Waste Management and Research, 19(3), 249–256.
University of Ghana http://ugspace.ug.edu.gh
135
Koukal, B., Gu´eguen, C., Pardos M.,and Dominik, J. (2003). Influence of humic
substances on the toxic effects of cadmium and zinc to the green alga
Pseudokirchneriella subcapitata. Chemosphere, 53(8), 953–961.
Krupa, S.V. (1997) Air pollution, people, and plants: An introduction. APS Press:
Minnesota.
Kulikowska, D., and Klimiuk, E. (2008).The effect of landfill age on municipal
leachate composition. Bioresource Technology, 99(13), 5981–5985.
Kumar, D., and Alappat, B. J. (2005). Evaluating leachate contamination potential
of landfill sites using leachate pollution index. Clean Technologies and
Environmental Policy, 7(3), 190–197.
Kumar, D., and Alappat, B.J. (2003). A technique to quantify landfill leachate
pollution. Ninth International Landfill Symposium, paper no. 400, pp. 241– 242.
CISA, St Margherita di Pula, Cagliari, Italy.
Kumar. S. R, Chanakya A.N., and Ramachandria, T.V. (2002). Feasible solid
waste management.
Kurniawan, T. A. Lo, W.H., and Chan, G. Y. S. (2006). Physicochemical
treatments for removal of recalcitrant contaminants from landfill leachate. Journal
of Hazardous Materials, 129(1–3), 80–100.
Lee, G.F., and Jones, R.A. (1991). Landfills and groundwater quality. CES
Technical Report 85, Bangalore. McGraw-Hill Handbooks.
University of Ghana http://ugspace.ug.edu.gh
136
Li, X. Z., and Zhao, Q. L. (2002). Map precipitation from landfill leachate and
seawater bittern waste. Environmental Technology, 23(9), 989–1000.
Li, Y. Low, G. K.C. Scott, J. A., and Amal, R. (2007). Microbial reduction of
hexavalent chromium by landfill leachate. Journal of Hazardous Materials,
142(1-2), 153–159.
Mor, S., Ravindra, K., Dahiya, R.P. and Chandra, A. (2006). Leachate
Characterization and assessment of groundwater pollution near municipal solid
waste landfill site. Environ. Monit. Assess. 4: 325-334.
Nkansah, M. A., and Ephraim, J.H. (2009). Physicochemical Studies of water
from selected boreholes in the Bosomtwi-Atwima-Kwanwoma District of
Ghana. Pacific J. Sci. & Tech. 643-648.
Nyame, F. K., Tigme, J., Kutu, J. M., and Armah, T. K. (2012). Environmental
Implications of the Discharge of Municipal Landfill Leachate into the Densu
River and Surrounding Ramsar Wetland in the Accra Metropolis, Ghana. Journal
0f water resources and protection, 4, 622-633.
http://dx.doi.org/10.4236/jwarp.2012.48072.
O’Neill, P. (1993). Environmental chemistry (2nd Ed.). Chapman and Hall:
London.
Osei, J., Osae, S.K., Fianko, J.R., Adomako, D., Laar, C., Anim, A.K., Ganyaglo,
S.Y., Nyarku, M., and Nyarko, E.S. (2011). The Impact of Oblogo Landfill Site in
Accra- Ghana on the Surrounding Environment.Research Journal of
Environmental and Earth Sciences, 3(6) 633-636.
University of Ghana http://ugspace.ug.edu.gh
137
Pohland, F. G., Cross, W. H. and Gould, J. P. (1993). Metal speciation and
mobility as influenced by landfill disposal practices. In: Metals in Groundwater
(edited by Allen, H. E., Perdue, E. M. and Brown, D. S.). Lewis Publishers, Boca
Raton, 411-429.
Rao, M.N., and Rao, H.V.N. (1989). Air Pollution Indices: Air Pollution, pp.
271–272. Tata McGraw–Hill Publishing Ltd., New Delhi.
Robinson, H. (1995). The UK leading the way in leachate treatment, Institute of
Waste Management (IWM), Annual Conference Proceedings, Torbay, IWM,
Northampton.
Sa’id, M.D., Olarewaju, G.O., and Ayodele, J.T. (2012). Trace metal
concentrations in leachates from open dumpsites in Lokoja, Kogi State, Nigeria.
Journal of Pure and Applied Sciences, 5(2), 143 – 147.
doi.org/10.4314/bajopas.v5i2.28
Salem, Z. Hamouri, K. Djemaa, R., and Allia, K. (2007). Evaluation of landfill
leachate pollution and treatment.
Schafer, A.I., Rossiter, H.M.A., Owusu, P.A., Richard, B.S., and Awuah, E.
(2010). Developing country water supplies: physico-chemical water quality in
Ghana. Desalination 251:193–203.
Sierra-Alvarez, R., Field, J. A., and Cortinas I. (2005). Anaerobic microbial
mobilization and biotransformation of arsenate adsorbed onto activated alumina.
Water Research, 39(1), 199–209.
Stegmann, R. (2006). Proceedings from Sardinia 95, Fifth International Landfill.
University of Ghana http://ugspace.ug.edu.gh
138
Svenolof, R. (1992). Environmental management handbook: The holistic
approach from problem to strategies. Published by IOS Press, 1992. ISBN
9051990626, 9789051990621
Tapas, D. (2014). Management Model of Municipal Solid Waste Landfill
Bioreactor. International Journal of Scientific Engineering and
Technology,3(1),36-39
Tatsi, A. A., and Zouboulis, A. I. (2002).A field investigation of the quantity and
quality of leachate from a municipal solid waste landfill in a Mediterranean
climate (Thessaloniki, Greece). Advances in Environmental Research, 6(3), 207–
219.
Tatsi, A. A., Zouboulis, A. I., Matis, K. A., and Samaras, P. (2003). Coagulation-
flocculation pretreatment of sanitary landfill leachates. Chemosphere, 53(7), 737–
744.
Tattersall, S. (2004).Evaluating the performance and cost implications of the
leachate treatment system at Arden Quarry Landfill Site.
Tay, C. K. (2008). “Chemical characteristics of groundwater in the Akatsi and
Ketu Districts of the Volta Region, Ghana”. CSIR-Water Research Institute, P.
O. Box AH 38, Achimota-Accra, Ghana.
Tay, C., and Kortatsi, B. (2007). Groundwater quality studies. a case study of
Densu Basin, Ghana. West Africa J Appl Ecol 12:81–99.
Taylor, R., and Allen, A. (2013). Waste Disposal and Landfill: Information
Needs. pp. 1-8.
University of Ghana http://ugspace.ug.edu.gh
139
Tchnobanoglous, G., and Kreith, F. (2002). Handbook of Solid Waste
Management, 2nd edition.
Tchobanaglous, G., Theisen, H., and Eliassen, R. (1997). Solid wastes:
Engineering principles and management issues. McGraw Hill publications, New
York, USA.
Tchobanoglous, G., Thiesen, H., and Vigil, S. (1993). Integrated solid waste
management
The Environmental Protection Agency Act. (1994). ACT 490.
Thomas, D.J.L., Tyrrel, S.F., Smith, R., and Farrow, S. (2009). Bioassays for the
evaluation of landfill leachate toxicity. J. Toxicol. Environ. Health B 12, 83–105.
Thomas, L., and Hoomwey, D. (1999) Solid Waste Management in Asia.
Tomlinson, D. L., Wilson, J.G., Harris, C.R., and Jeffney, D.W. (1980). Problems
in the assessment of heavy metal levels in estuaries and the formation of a
pollution index. Helgol. Wiss. Meeresunters, 33,566-572.
Turekian, K.K., and Wedepohl, K. H. (1961). Distribution of the elements in
some major units of the earth’s crust. American Geology Soc. Bulletin, 72,
175−182.
Tyre, B., and Michele, D. (1997). Site characterization and Design of
42/45Onsite Septic Systems.
U.N. Conference on Environment and development (UNCED). (1992). Rio
Declaration. U.N. Doc. A/CONF. 151/26 (Vol. I).
University of Ghana http://ugspace.ug.edu.gh

140
U.N. Conference on Environment and Development.(1992). AGENDA 21.
U.N. Conference on the Human Environment. (1972). Stockholm Declaration.
U.S Census Bureau. (2013).World Population clock Projection
U.S. Environmental Protection Agency. (2013). Inventory of U.S. Greenhouse
Gas Emissions and Sinks: 1990-2011 in Oklahoma. Ground Water Monitoring &
Remediation, 32(1): 120-130.
U.S. Environmental Protection Agency. (2013). Municipal Solid Waste
Generation, Recycling, and Disposal in the United States: Facts and Figures for
2011.
UN. (2012). World Population Prospects, the 2012 Revision
United Nations Conference on Environment and Development. (1992).
Environmentally sound management of Solid Wastes and Sewage-related Issues.
United Nations Environment Programme. (1989). Basel Convention on the
control of trans-boundary movements of hazardous wastes and their disposal.
US Environmental Protection Agency. (2013). Non-hazardous Waste. Retrieved
from www.epa.gov/epawaste/nonhaz/municipal/index.
Vigneault, B., and Campbell, P. G. C. (2005). Uptake of cadmium by freshwater
green algae: effects of pH and aquatic humic substances. Journal of Phycology,
41(1), 55–61.
University of Ghana http://ugspace.ug.edu.gh
141
Wang, F., Smith, D.W., and El-Din, M.G. (2003). Application of advanced
oxidation methods for landfill leachate treatment, J. Environ. Eng. Sci. 2, 413–
427.
Welander, U. Henryson, T., and Welander, T. (1997). Nitrification of landfill
leachate using suspended-carrier biofilm technology, Water Res. 31
Wellburn, A. (1994). Air pollution and climate change: The biological impact.
(2nd Ed.) Pearson/Longman: Harlow, UK.
Williams, T. (2004). Waste treatment and disposal (Second edition). John Wiley
& Sons, Ltd.1–22.2351–2355.
Yanful, E. K., Quigley, R. M. and Nesbitt, H. W. (1988). Heavy metal migration
at a landfill site, Sarnia, Ontario, Canada - 2: metal partitioning and geotechnical
implications. Applied Geochemistry 3, 623-629.
Yunus, M., and Iqbal, M. (1996). Plant response to air pollution. J. Wiley:
Chichester.
Zurbrugg, C., Sandec., and Eawag. (2003). Solid Waste Management in
Developing countries.
University of Ghana http://ugspace.ug.edu.gh

142
APPENDICES
APPENDIX 1: Research locations on the Pantang and Mallam landfill sites
Research locations(Codes) GPS location
North West
PLI 5o42'80 0o11'36
PL2 5o42'12 0o11'33
PL3 5o42'17 0o11'29
PL4 5o42'20 0o11'27
PL5 5o42'25 0o11'25
M1L1 5o568 0o286
M1L2 5o569 0o287
M1L3 5o569 0o287
M1L4 5o570 0o288
M1L5 5o570 0o287
PA1 5o42'22 0o11'42
PA2 5o42'14 0o11'28
MA1 5o570 0o288
MA2 5o568 W 0o287
P1S1 5o42'14 0o11'40
P2S1 5o42'10 0o11'39
P3S1 5o42'61 0o11'37
P1S2 5o42'16 0o11'37
P2S2 5o42'13 0o11'36
University of Ghana http://ugspace.ug.edu.gh
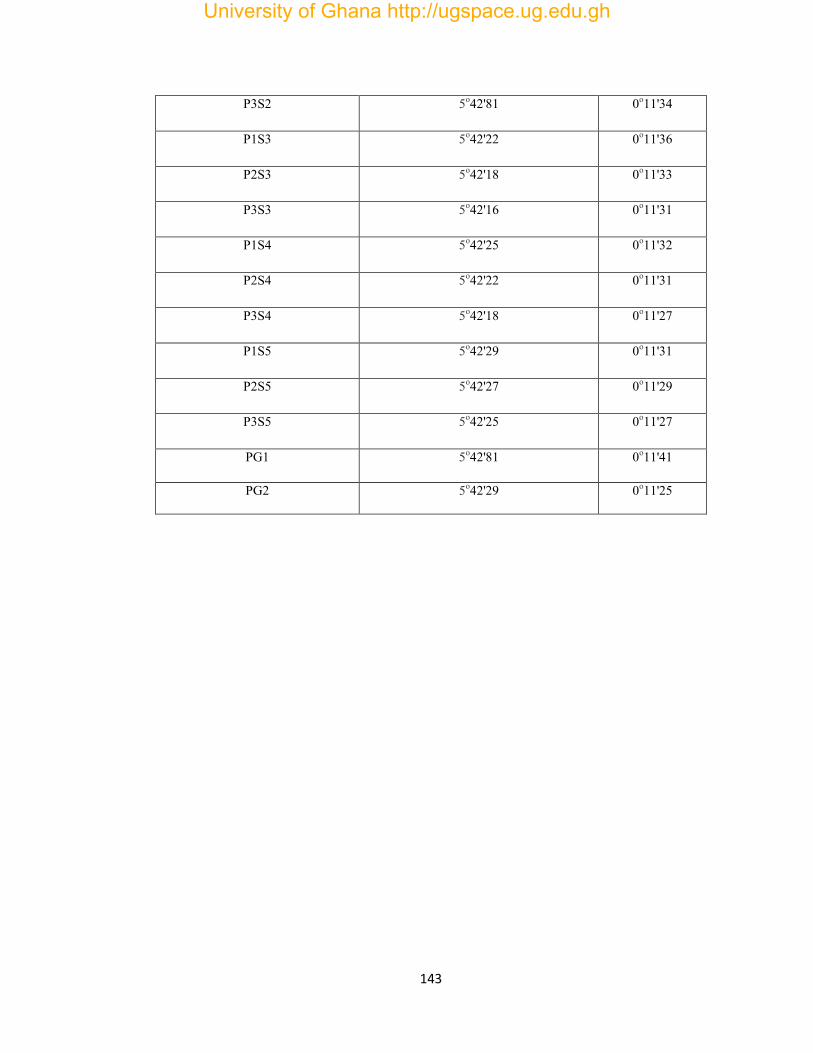
143
P3S2 5o42'81 0o11'34
P1S3 5o42'22 0o11'36
P2S3 5o42'18 0o11'33
P3S3 5o42'16 0o11'31
P1S4 5o42'25 0o11'32
P2S4 5o42'22 0o11'31
P3S4 5o42'18 0o11'27
P1S5 5o42'29 0o11'31
P2S5 5o42'27 0o11'29
P3S5 5o42'25 0o11'27
PG1 5o42'81 0o11'41
PG2 5o42'29 0o11'25
University of Ghana http://ugspace.ug.edu.gh

144
APPENDIX 2: Basic statistical analysis of parameters determined on leachate
sampled from the Pantang and Mallam landfill sites
RANGE-PL MEAN-PL STD. DEV-PL
RANGE-ML MEAN-
ML
STD. DEV-ML EPA(G)
PH 8.00-8.90 8.345 0.263 8.15-8.90 8.388 0.224 6 – 9
DO 1.00-3.70 2.226 0.894 0.941-3.600 2.184 0.822
TSS(mg/l) 1320-1723 1582 91.418 209.0-391.0 266.467 49.492 50
TUR(NTU) 93-309 213.973 85.581 127.0-194.0 152.507 18.771 75
EC(S/cm) 50163-74830 63463.6 8543.705 10150-36490 19232.267 9066.951 1500
TDS(mg/l) 20134-48141 32923.933 7274.217 1649.0-4325.0 3135.667 990.548 1000
BOD(mg/l) 124.00-293.00 192.133 51.017 123-207 160.6 28.623 50
COD(mg/l) 583.00-829.00 719.133 91.818 760-1520 1122.533 229.880 250
NO3(mg/l) 24.3-57.3 37.038 10.907 34.2-79 59.613 10.972 50
NO2(mg/l) 2.95-6.90 4.741 1.165 0.7502.850 1.602 0.632
NH3(mg/l) 2.50-5.10 3.831 0.797 0.58-1.93 1.169 0.406 1.0
TP(mg/l) 5.13-8.94 7.010 1.166 15.4-31.0 22.373 4.813 2.0
SO4(mg/l) 989.0-1982.0 1451.933 376.906 108-290 210.533 53.235 200
SO3(mg/l) 39.0-77.0 58.160 11.104 4.30-8.70 7.434 1.195
Zn(mg/l) 10.43-23.01 15.692 3.988 0.145-0.984 0.549 0.237 5.0
Cr(mg/l) 2.73O-5.99 4.386 1.143 0.073-0.471 0.241 1.165 0.5
Pd(mg/l) 0.267-0.952 0.609 0.200 0.094-0.343 0.186 0.075 0.1
Mn(mg/l) 1.359-4.510 2.267 1.066 0.110-0.793 0.353 0.231 2.5
Fe(mg/l) 29.5-58.3 43.190 9.070 11.62-18.97 15.734 2.588
Cd(mg/l) 0.019-0.099 0.077 0.020 0.014-0.097 0.054 0.027 <0.1
Ni(mg/l) 0.169-0.844 0.550 0.207 0.062-0.436 0.208 0.118 0.5
University of Ghana http://ugspace.ug.edu.gh
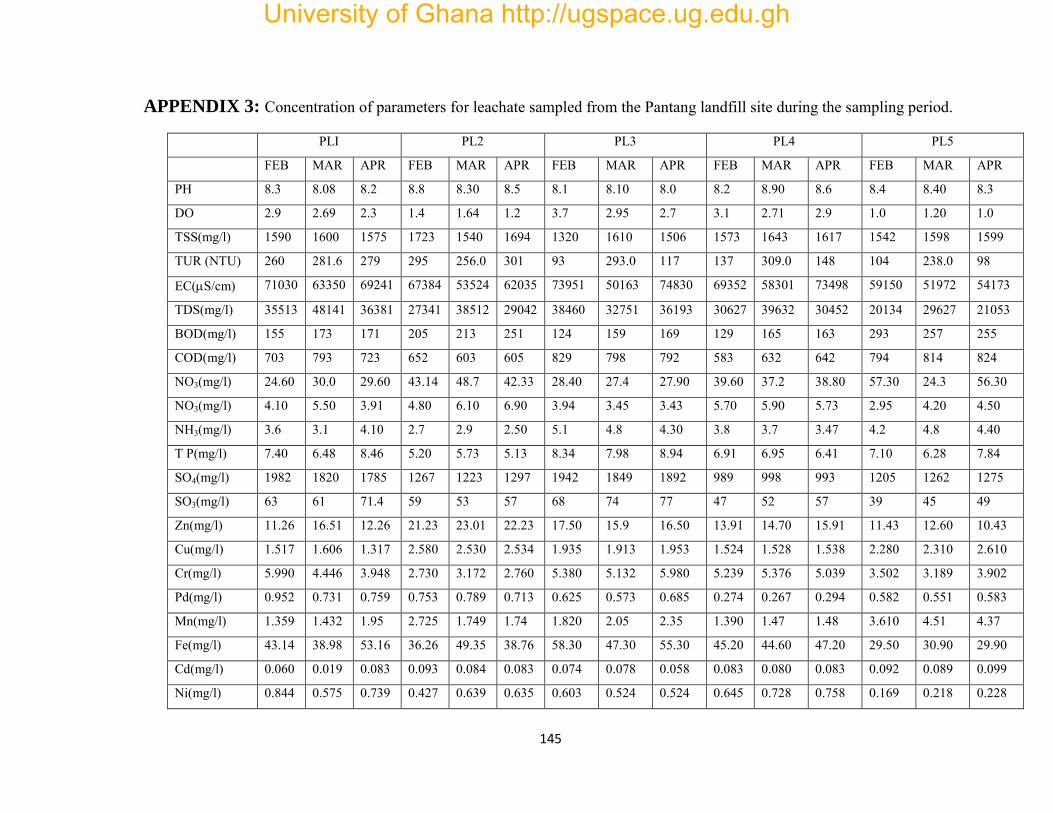
145
APPENDIX 3: Concentration of parameters for leachate sampled from the Pantang landfill site during the sampling period.
PLI PL2 PL3 PL4 PL5
FEB MAR APR FEB MAR APR FEB MAR APR FEB MAR APR FEB MAR APR
PH 8.3 8.08 8.2 8.8 8.30 8.5 8.1 8.10 8.0 8.2 8.90 8.6 8.4 8.40 8.3
DO 2.9 2.69 2.3 1.4 1.64 1.2 3.7 2.95 2.7 3.1 2.71 2.9 1.0 1.20 1.0
TSS(mg/l) 1590 1600 1575 1723 1540 1694 1320 1610 1506 1573 1643 1617 1542 1598 1599
TUR (NTU) 260 281.6 279 295 256.0 301 93 293.0 117 137 309.0 148 104 238.0 98
EC(S/cm) 71030 63350 69241 67384 53524 62035 73951 50163 74830 69352 58301 73498 59150 51972 54173
TDS(mg/l) 35513 48141 36381 27341 38512 29042 38460 32751 36193 30627 39632 30452 20134 29627 21053
BOD(mg/l) 155 173 171 205 213 251 124 159 169 129 165 163 293 257 255
COD(mg/l) 703 793 723 652 603 605 829 798 792 583 632 642 794 814 824
NO3(mg/l) 24.60 30.0 29.60 43.14 48.7 42.33 28.40 27.4 27.90 39.60 37.2 38.80 57.30 24.3 56.30
NO3(mg/l) 4.10 5.50 3.91 4.80 6.10 6.90 3.94 3.45 3.43 5.70 5.90 5.73 2.95 4.20 4.50
NH3(mg/l) 3.6 3.1 4.10 2.7 2.9 2.50 5.1 4.8 4.30 3.8 3.7 3.47 4.2 4.8 4.40
T P(mg/l) 7.40 6.48 8.46 5.20 5.73 5.13 8.34 7.98 8.94 6.91 6.95 6.41 7.10 6.28 7.84
SO4(mg/l) 1982 1820 1785 1267 1223 1297 1942 1849 1892 989 998 993 1205 1262 1275
SO3(mg/l) 63 61 71.4 59 53 57 68 74 77 47 52 57 39 45 49
Zn(mg/l) 11.26 16.51 12.26 21.23 23.01 22.23 17.50 15.9 16.50 13.91 14.70 15.91 11.43 12.60 10.43
Cu(mg/l) 1.517 1.606 1.317 2.580 2.530 2.534 1.935 1.913 1.953 1.524 1.528 1.538 2.280 2.310 2.610
Cr(mg/l) 5.990 4.446 3.948 2.730 3.172 2.760 5.380 5.132 5.980 5.239 5.376 5.039 3.502 3.189 3.902
Pd(mg/l) 0.952 0.731 0.759 0.753 0.789 0.713 0.625 0.573 0.685 0.274 0.267 0.294 0.582 0.551 0.583
Mn(mg/l) 1.359 1.432 1.95 2.725 1.749 1.74 1.820 2.05 2.35 1.390 1.47 1.48 3.610 4.51 4.37
Fe(mg/l) 43.14 38.98 53.16 36.26 49.35 38.76 58.30 47.30 55.30 45.20 44.60 47.20 29.50 30.90 29.90
Cd(mg/l) 0.060 0.019 0.083 0.093 0.084 0.083 0.074 0.078 0.058 0.083 0.080 0.083 0.092 0.089 0.099
Ni(mg/l) 0.844 0.575 0.739 0.427 0.639 0.635 0.603 0.524 0.524 0.645 0.728 0.758 0.169 0.218 0.228
University of Ghana http://ugspace.ug.edu.gh
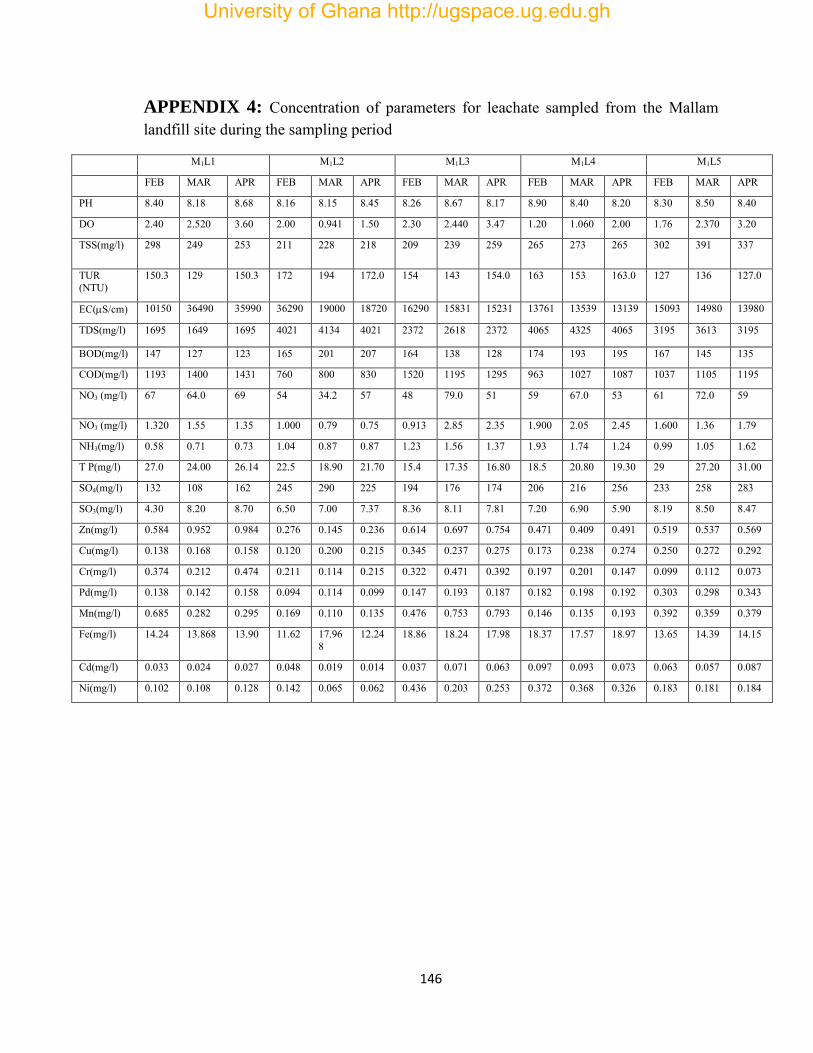
146
APPENDIX 4: Concentration of parameters for leachate sampled from the Mallam landfill site during the sampling period
M1L1 M1L2 M1L3 M1L4 M1L5
FEB MAR APR FEB MAR APR FEB MAR APR FEB MAR APR FEB MAR APR
PH 8.40 8.18 8.68 8.16 8.15 8.45 8.26 8.67 8.17 8.90 8.40 8.20 8.30 8.50 8.40
DO 2.40 2.520 3.60 2.00 0.941 1.50 2.30 2.440 3.47 1.20 1.060 2.00 1.76 2.370 3.20
TSS(mg/l) 298 249 253 211 228 218 209 239 259 265 273 265 302 391 337
TUR (NTU)
150.3 129 150.3 172 194 172.0 154 143 154.0 163 153 163.0 127 136 127.0
EC(S/cm) 10150 36490 35990 36290 19000 18720 16290 15831 15231 13761 13539 13139 15093 14980 13980
TDS(mg/l) 1695 1649 1695 4021 4134 4021 2372 2618 2372 4065 4325 4065 3195 3613 3195
BOD(mg/l) 147 127 123 165 201 207 164 138 128 174 193 195 167 145 135
COD(mg/l) 1193 1400 1431 760 800 830 1520 1195 1295 963 1027 1087 1037 1105 1195
NO3 (mg/l) 67 64.0 69 54 34.2 57 48 79.0 51 59 67.0 53 61 72.0 59
NO3 (mg/l) 1.320 1.55 1.35 1.000 0.79 0.75 0.913 2.85 2.35 1.900 2.05 2.45 1.600 1.36 1.79
NH3(mg/l) 0.58 0.71 0.73 1.04 0.87 0.87 1.23 1.56 1.37 1.93 1.74 1.24 0.99 1.05 1.62
T P(mg/l) 27.0 24.00 26.14 22.5 18.90 21.70 15.4 17.35 16.80 18.5 20.80 19.30 29 27.20 31.00
SO4(mg/l) 132 108 162 245 290 225 194 176 174 206 216 256 233 258 283
SO3(mg/l) 4.30 8.20 8.70 6.50 7.00 7.37 8.36 8.11 7.81 7.20 6.90 5.90 8.19 8.50 8.47
Zn(mg/l) 0.584 0.952 0.984 0.276 0.145 0.236 0.614 0.697 0.754 0.471 0.409 0.491 0.519 0.537 0.569
Cu(mg/l) 0.138 0.168 0.158 0.120 0.200 0.215 0.345 0.237 0.275 0.173 0.238 0.274 0.250 0.272 0.292
Cr(mg/l) 0.374 0.212 0.474 0.211 0.114 0.215 0.322 0.471 0.392 0.197 0.201 0.147 0.099 0.112 0.073
Pd(mg/l) 0.138 0.142 0.158 0.094 0.114 0.099 0.147 0.193 0.187 0.182 0.198 0.192 0.303 0.298 0.343
Mn(mg/l) 0.685 0.282 0.295 0.169 0.110 0.135 0.476 0.753 0.793 0.146 0.135 0.193 0.392 0.359 0.379
Fe(mg/l) 14.24 13.868 13.90 11.62 17.968
12.24 18.86 18.24 17.98 18.37 17.57 18.97 13.65 14.39 14.15
Cd(mg/l) 0.033 0.024 0.027 0.048 0.019 0.014 0.037 0.071 0.063 0.097 0.093 0.073 0.063 0.057 0.087
Ni(mg/l) 0.102 0.108 0.128 0.142 0.065 0.062 0.436 0.203 0.253 0.372 0.368 0.326 0.183 0.181 0.184
University of Ghana http://ugspace.ug.edu.gh
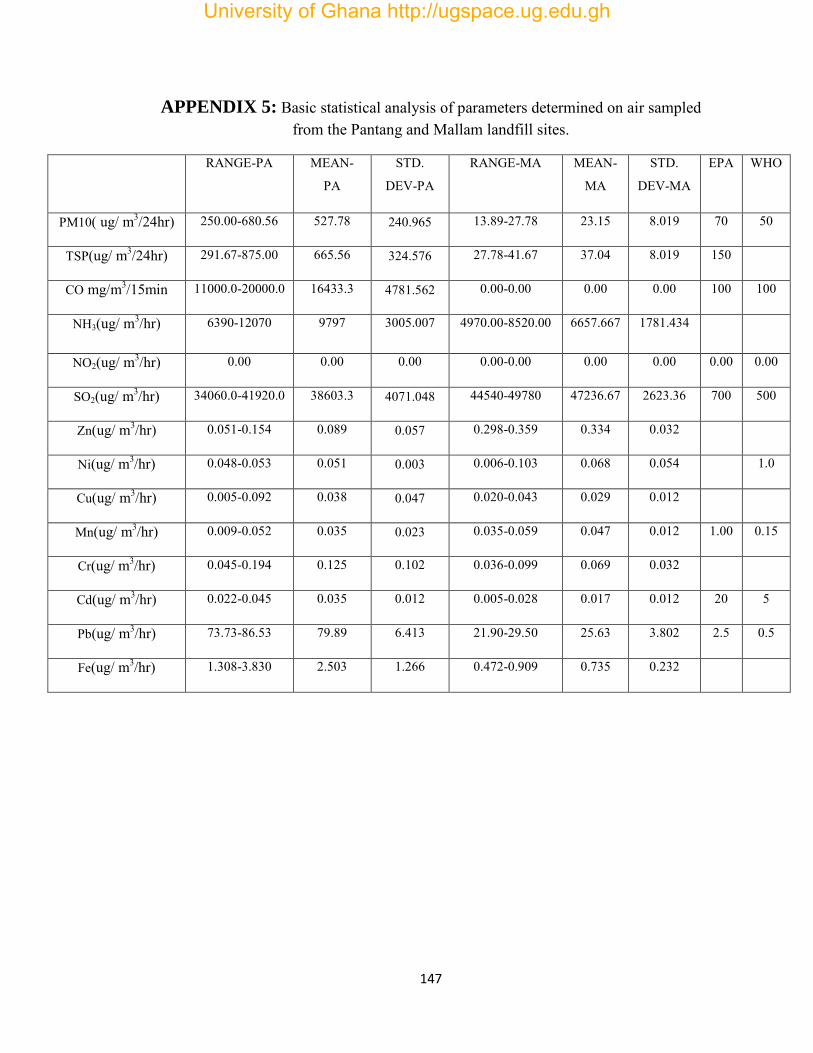
147
APPENDIX 5: Basic statistical analysis of parameters determined on air sampled from the Pantang and Mallam landfill sites.
RANGE-PA MEAN-
PA
STD.
DEV-PA
RANGE-MA MEAN-
MA
STD.
DEV-MA
EPA WHO
PM10( ug/ m3/24hr) 250.00-680.56 527.78 240.965 13.89-27.78 23.15 8.019 70 50
TSP(ug/ m3/24hr) 291.67-875.00 665.56 324.576 27.78-41.67 37.04 8.019 150
CO mg/m3/15min 11000.0-20000.0 16433.3 4781.562 0.00-0.00 0.00 0.00 100 100
NH3(ug/ m3/hr) 6390-12070 9797 3005.007 4970.00-8520.00 6657.667 1781.434
NO2(ug/ m3/hr) 0.00 0.00 0.00 0.00-0.00 0.00 0.00 0.00 0.00
SO2(ug/ m3/hr) 34060.0-41920.0 38603.3 4071.048 44540-49780 47236.67 2623.36 700 500
Zn(ug/ m3/hr) 0.051-0.154 0.089 0.057 0.298-0.359 0.334 0.032
Ni(ug/ m3/hr) 0.048-0.053 0.051 0.003 0.006-0.103 0.068 0.054 1.0
Cu(ug/ m3/hr) 0.005-0.092 0.038 0.047 0.020-0.043 0.029 0.012
Mn(ug/ m3/hr) 0.009-0.052 0.035 0.023 0.035-0.059 0.047 0.012 1.00 0.15
Cr(ug/ m3/hr) 0.045-0.194 0.125 0.102 0.036-0.099 0.069 0.032
Cd(ug/ m3/hr) 0.022-0.045 0.035 0.012 0.005-0.028 0.017 0.012 20 5
Pb(ug/ m3/hr) 73.73-86.53 79.89 6.413 21.90-29.50 25.63 3.802 2.5 0.5
Fe(ug/ m3/hr) 1.308-3.830 2.503 1.266 0.472-0.909 0.735 0.232
University of Ghana http://ugspace.ug.edu.gh
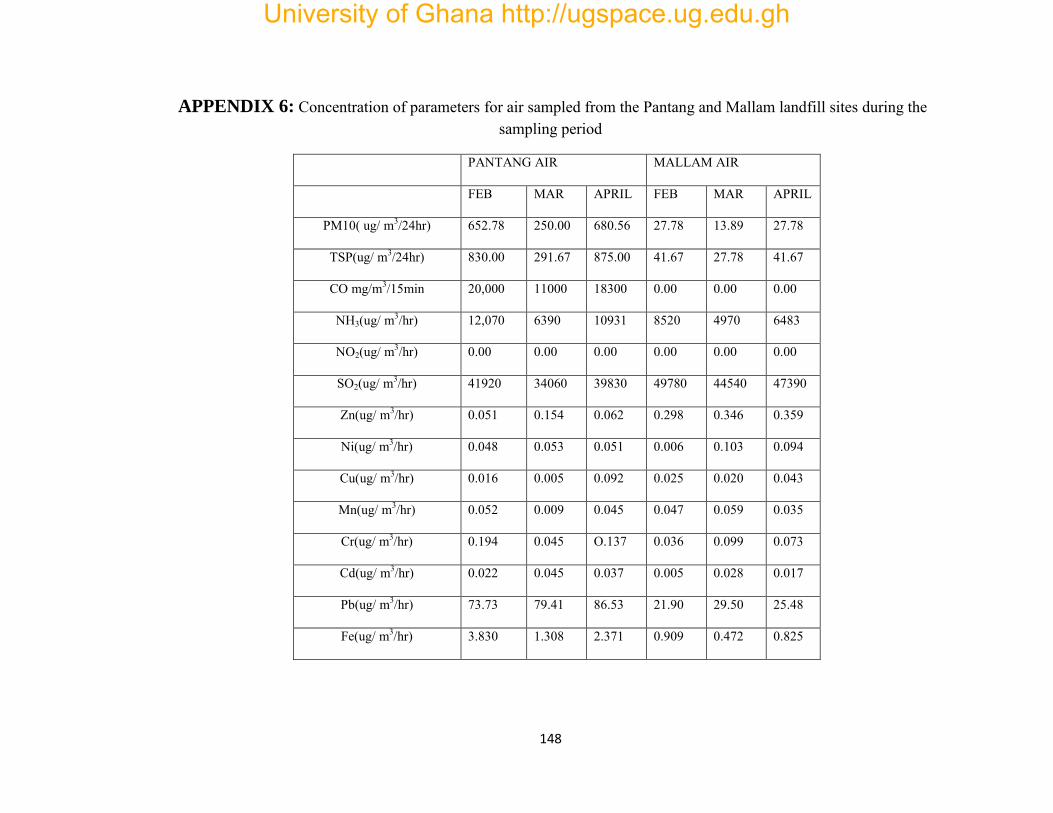
148
APPENDIX 6: Concentration of parameters for air sampled from the Pantang and Mallam landfill sites during the sampling period
PANTANG AIR MALLAM AIR
FEB MAR APRIL FEB MAR APRIL
PM10( ug/ m3/24hr) 652.78 250.00 680.56 27.78 13.89 27.78
TSP(ug/ m3/24hr) 830.00 291.67 875.00 41.67 27.78 41.67
CO mg/m3/15min 20,000 11000 18300 0.00 0.00 0.00
NH3(ug/ m3/hr) 12,070 6390 10931 8520 4970 6483
NO2(ug/ m3/hr) 0.00 0.00 0.00 0.00 0.00 0.00
SO2(ug/ m3/hr) 41920 34060 39830 49780 44540 47390
Zn(ug/ m3/hr) 0.051 0.154 0.062 0.298 0.346 0.359
Ni(ug/ m3/hr) 0.048 0.053 0.051 0.006 0.103 0.094
Cu(ug/ m3/hr) 0.016 0.005 0.092 0.025 0.020 0.043
Mn(ug/ m3/hr) 0.052 0.009 0.045 0.047 0.059 0.035
Cr(ug/ m3/hr) 0.194 0.045 O.137 0.036 0.099 0.073
Cd(ug/ m3/hr) 0.022 0.045 0.037 0.005 0.028 0.017
Pb(ug/ m3/hr) 73.73 79.41 86.53 21.90 29.50 25.48
Fe(ug/ m3/hr) 3.830 1.308 2.371 0.909 0.472 0.825
University of Ghana http://ugspace.ug.edu.gh
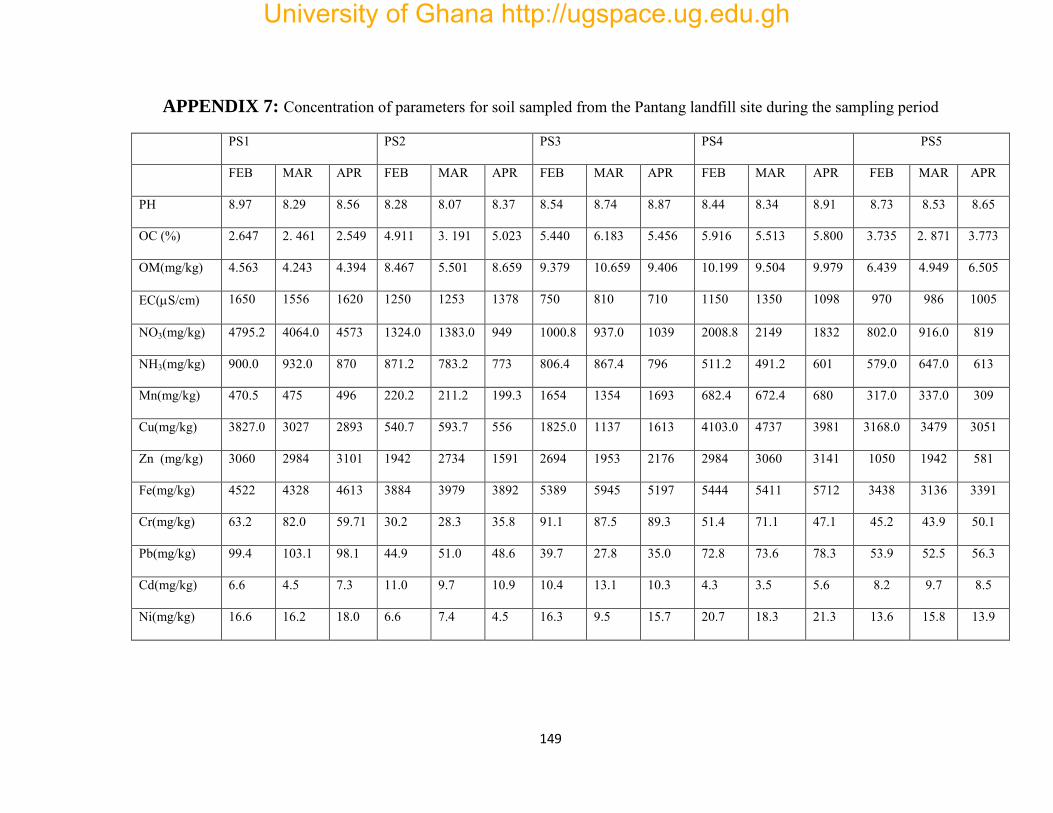
149
APPENDIX 7: Concentration of parameters for soil sampled from the Pantang landfill site during the sampling period
PS1 PS2 PS3 PS4 PS5
FEB MAR APR FEB MAR APR FEB MAR APR FEB MAR APR FEB MAR APR
PH 8.97 8.29 8.56 8.28 8.07 8.37 8.54 8.74 8.87 8.44 8.34 8.91 8.73 8.53 8.65
OC (%) 2.647 2. 461 2.549 4.911 3. 191 5.023 5.440 6.183 5.456 5.916 5.513 5.800 3.735 2. 871 3.773
OM(mg/kg) 4.563 4.243 4.394 8.467 5.501 8.659 9.379 10.659 9.406 10.199 9.504 9.979 6.439 4.949 6.505
EC(S/cm) 1650 1556 1620 1250 1253 1378 750 810 710 1150 1350 1098 970 986 1005
NO3(mg/kg) 4795.2 4064.0 4573 1324.0 1383.0 949 1000.8 937.0 1039 2008.8 2149 1832 802.0 916.0 819
NH3(mg/kg) 900.0 932.0 870 871.2 783.2 773 806.4 867.4 796 511.2 491.2 601 579.0 647.0 613
Mn(mg/kg) 470.5 475 496 220.2 211.2 199.3 1654 1354 1693 682.4 672.4 680 317.0 337.0 309
Cu(mg/kg) 3827.0 3027 2893 540.7 593.7 556 1825.0 1137 1613 4103.0 4737 3981 3168.0 3479 3051
Zn (mg/kg) 3060 2984 3101 1942 2734 1591 2694 1953 2176 2984 3060 3141 1050 1942 581
Fe(mg/kg) 4522 4328 4613 3884 3979 3892 5389 5945 5197 5444 5411 5712 3438 3136 3391
Cr(mg/kg) 63.2 82.0 59.71 30.2 28.3 35.8 91.1 87.5 89.3 51.4 71.1 47.1 45.2 43.9 50.1
Pb(mg/kg) 99.4 103.1 98.1 44.9 51.0 48.6 39.7 27.8 35.0 72.8 73.6 78.3 53.9 52.5 56.3
Cd(mg/kg) 6.6 4.5 7.3 11.0 9.7 10.9 10.4 13.1 10.3 4.3 3.5 5.6 8.2 9.7 8.5
Ni(mg/kg) 16.6 16.2 18.0 6.6 7.4 4.5 16.3 9.5 15.7 20.7 18.3 21.3 13.6 15.8 13.9
University of Ghana http://ugspace.ug.edu.gh
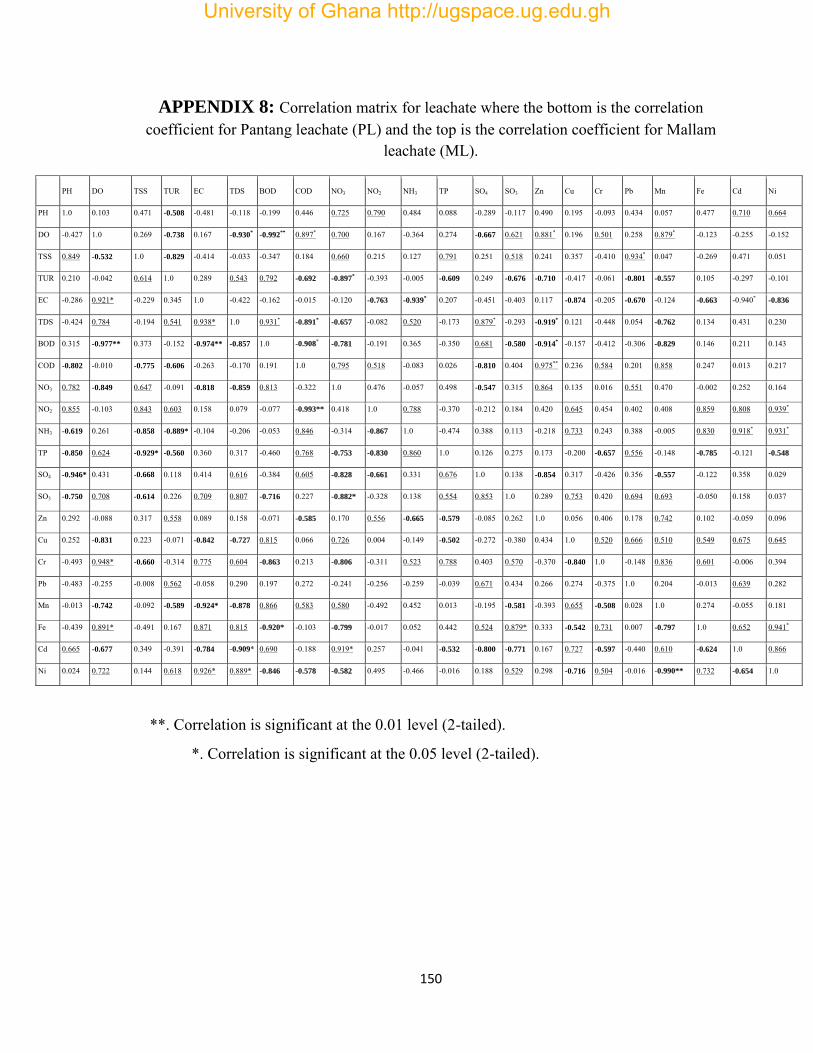
150
APPENDIX 8: Correlation matrix for leachate where the bottom is the correlation coefficient for Pantang leachate (PL) and the top is the correlation coefficient for Mallam
leachate (ML).
PH DO TSS TUR EC TDS BOD COD NO3 NO2 NH3 TP SO4 SO3 Zn Cu Cr Pb Mn Fe Cd Ni
PH 1.0 0.103 0.471 -0.508 -0.481 -0.118 -0.199 0.446 0.725 0.790 0.484 0.088 -0.289 -0.117 0.490 0.195 -0.093 0.434 0.057 0.477 0.710 0.664
DO -0.427 1.0 0.269 -0.738 0.167 -0.930* -0.992** 0.897* 0.700 0.167 -0.364 0.274 -0.667 0.621 0.881* 0.196 0.501 0.258 0.879* -0.123 -0.255 -0.152
TSS 0.849 -0.532 1.0 -0.829 -0.414 -0.033 -0.347 0.184 0.660 0.215 0.127 0.791 0.251 0.518 0.241 0.357 -0.410 0.934* 0.047 -0.269 0.471 0.051
TUR 0.210 -0.042 0.614 1.0 0.289 0.543 0.792 -0.692 -0.897* -0.393 -0.005 -0.609 0.249 -0.676 -0.710 -0.417 -0.061 -0.801 -0.557 0.105 -0.297 -0.101
EC -0.286 0.921* -0.229 0.345 1.0 -0.422 -0.162 -0.015 -0.120 -0.763 -0.939* 0.207 -0.451 -0.403 0.117 -0.874 -0.205 -0.670 -0.124 -0.663 -0.940* -0.836
TDS -0.424 0.784 -0.194 0.541 0.938* 1.0 0.931* -0.891* -0.657 -0.082 0.520 -0.173 0.879* -0.293 -0.919* 0.121 -0.448 0.054 -0.762 0.134 0.431 0.230
BOD 0.315 -0.977** 0.373 -0.152 -0.974** -0.857 1.0 -0.908* -0.781 -0.191 0.365 -0.350 0.681 -0.580 -0.914* -0.157 -0.412 -0.306 -0.829 0.146 0.211 0.143
COD -0.802 -0.010 -0.775 -0.606 -0.263 -0.170 0.191 1.0 0.795 0.518 -0.083 0.026 -0.810 0.404 0.975** 0.236 0.584 0.201 0.858 0.247 0.013 0.217
NO3 0.782 -0.849 0.647 -0.091 -0.818 -0.859 0.813 -0.322 1.0 0.476 -0.057 0.498 -0.547 0.315 0.864 0.135 0.016 0.551 0.470 -0.002 0.252 0.164
NO2 0.855 -0.103 0.843 0.603 0.158 0.079 -0.077 -0.993** 0.418 1.0 0.788 -0.370 -0.212 0.184 0.420 0.645 0.454 0.402 0.408 0.859 0.808 0.939*
NH3 -0.619 0.261 -0.858 -0.889* -0.104 -0.206 -0.053 0.846 -0.314 -0.867 1.0 -0.474 0.388 0.113 -0.218 0.733 0.243 0.388 -0.005 0.830 0.918* 0.931*
TP -0.850 0.624 -0.929* -0.560 0.360 0.317 -0.460 0.768 -0.753 -0.830 0.860 1.0 0.126 0.275 0.173 -0.200 -0.657 0.556 -0.148 -0.785 -0.121 -0.548
SO4 -0.946* 0.431 -0.668 0.118 0.414 0.616 -0.384 0.605 -0.828 -0.661 0.331 0.676 1.0 0.138 -0.854 0.317 -0.426 0.356 -0.557 -0.122 0.358 0.029
SO3 -0.750 0.708 -0.614 0.226 0.709 0.807 -0.716 0.227 -0.882* -0.328 0.138 0.554 0.853 1.0 0.289 0.753 0.420 0.694 0.693 -0.050 0.158 0.037
Zn 0.292 -0.088 0.317 0.558 0.089 0.158 -0.071 -0.585 0.170 0.556 -0.665 -0.579 -0.085 0.262 1.0 0.056 0.406 0.178 0.742 0.102 -0.059 0.096
Cu 0.252 -0.831 0.223 -0.071 -0.842 -0.727 0.815 0.066 0.726 0.004 -0.149 -0.502 -0.272 -0.380 0.434 1.0 0.520 0.666 0.510 0.549 0.675 0.645
Cr -0.493 0.948* -0.660 -0.314 0.775 0.604 -0.863 0.213 -0.806 -0.311 0.523 0.788 0.403 0.570 -0.370 -0.840 1.0 -0.148 0.836 0.601 -0.006 0.394
Pb -0.483 -0.255 -0.008 0.562 -0.058 0.290 0.197 0.272 -0.241 -0.256 -0.259 -0.039 0.671 0.434 0.266 0.274 -0.375 1.0 0.204 -0.013 0.639 0.282
Mn -0.013 -0.742 -0.092 -0.589 -0.924* -0.878 0.866 0.583 0.580 -0.492 0.452 0.013 -0.195 -0.581 -0.393 0.655 -0.508 0.028 1.0 0.274 -0.055 0.181
Fe -0.439 0.891* -0.491 0.167 0.871 0.815 -0.920* -0.103 -0.799 -0.017 0.052 0.442 0.524 0.879* 0.333 -0.542 0.731 0.007 -0.797 1.0 0.652 0.941*
Cd 0.665 -0.677 0.349 -0.391 -0.784 -0.909* 0.690 -0.188 0.919* 0.257 -0.041 -0.532 -0.800 -0.771 0.167 0.727 -0.597 -0.440 0.610 -0.624 1.0 0.866
Ni 0.024 0.722 0.144 0.618 0.926* 0.889* -0.846 -0.578 -0.582 0.495 -0.466 -0.016 0.188 0.529 0.298 -0.716 0.504 -0.016 -0.990** 0.732 -0.654 1.0
**. Correlation is significant at the 0.01 level (2-tailed).
*. Correlation is significant at the 0.05 level (2-tailed).
University of Ghana http://ugspace.ug.edu.gh
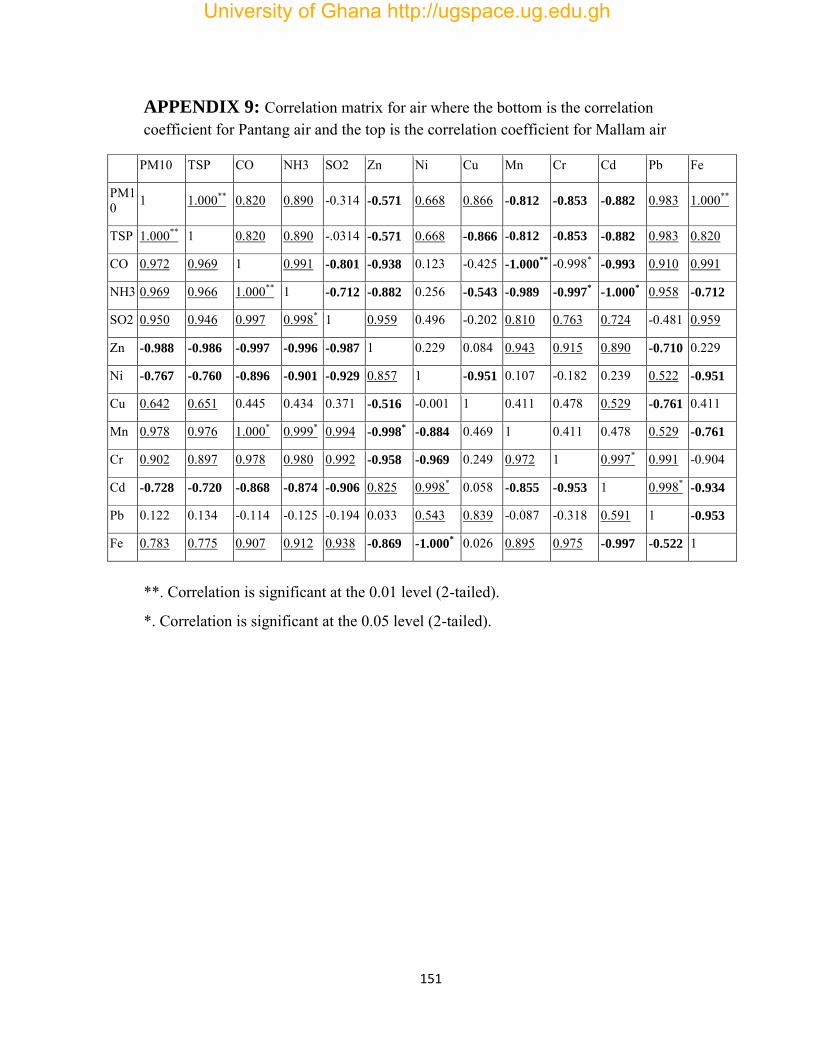
151
APPENDIX 9: Correlation matrix for air where the bottom is the correlation coefficient for Pantang air and the top is the correlation coefficient for Mallam air
PM10 TSP CO NH3 SO2 Zn Ni Cu Mn Cr Cd Pb Fe
PM10 1 1.000** 0.820 0.890 -0.314 -0.571 0.668 0.866 -0.812 -0.853 -0.882 0.983 1.000**
TSP 1.000** 1 0.820 0.890 -.0314 -0.571 0.668 -0.866 -0.812 -0.853 -0.882 0.983 0.820
CO 0.972 0.969 1 0.991 -0.801 -0.938 0.123 -0.425 -1.000**
-0.998* -0.993 0.910 0.991
NH3 0.969 0.966 1.000** 1 -0.712 -0.882 0.256 -0.543 -0.989 -0.997* -1.000
* 0.958 -0.712
SO2 0.950 0.946 0.997 0.998* 1 0.959 0.496 -0.202 0.810 0.763 0.724 -0.481 0.959
Zn -0.988 -0.986 -0.997 -0.996 -0.987 1 0.229 0.084 0.943 0.915 0.890 -0.710 0.229
Ni -0.767 -0.760 -0.896 -0.901 -0.929 0.857 1 -0.951 0.107 -0.182 0.239 0.522 -0.951
Cu 0.642 0.651 0.445 0.434 0.371 -0.516 -0.001 1 0.411 0.478 0.529 -0.761 0.411
Mn 0.978 0.976 1.000* 0.999* 0.994 -0.998* -0.884 0.469 1 0.411 0.478 0.529 -0.761
Cr 0.902 0.897 0.978 0.980 0.992 -0.958 -0.969 0.249 0.972 1 0.997* 0.991 -0.904
Cd -0.728 -0.720 -0.868 -0.874 -0.906 0.825 0.998* 0.058 -0.855 -0.953 1 0.998* -0.934
Pb 0.122 0.134 -0.114 -0.125 -0.194 0.033 0.543 0.839 -0.087 -0.318 0.591 1 -0.953
Fe 0.783 0.775 0.907 0.912 0.938 -0.869 -1.000* 0.026 0.895 0.975 -0.997 -0.522 1
**. Correlation is significant at the 0.01 level (2-tailed).
*. Correlation is significant at the 0.05 level (2-tailed).
University of Ghana http://ugspace.ug.edu.gh

152
APPENDIX 10: Correlation coefficients for soil parameters determined at the Pantang landfill
PH OC OM EC NO3 NH3 Mn Cu Zn Fe Cr Pb Cd Ni
PH 1.0
OC -0.051 1.0
OM 0.083 0.983** 1.0
EC -0.363 -0.643 -0.602 1.0
NO3 0.162 -0.676 -0.568 0.836 1.0
NH3 -0.149 -0.399 -0.445 0.311 0.436 1.0
Mn 0.646 0.509 0.564 -0.642 -0.190 0.163 1.0
Cu 0.585 -0.237 -0.081 0.213 0.393 -0.596 -0.112 1.0
Zn 0.157 0.031 0.163 0.539 0.715 0.184 0.196 0.328 1.0
Fe 0.467 0.575 0.692 -0.200 0.135 -0.029 0.761 0.183 0.717 1.0
Cr 0.823 0.098 0.200 -0.341 0.214 0.310 0.892* 0.133 0.355 0.691 1.0
Pb 0.139 -0.663 -0.542 0.857 0.921* 0.076 -0.412 0.647 0.634 0.018 -0.017 1.0
Cd -0.254 0.249 0.098 -0.573 -0.617 0.431 0.301 -0.881* -0.626 -0.239 0.051 -0.841 1.0
Ni 0.784 -0.088 0.092 0.075 0.423 -0.435 0.250 0.925* 0.499 0.499 0.479 0.564 -0.790 1.0
**. Correlation is significant at the 0.01 level (2-tailed).
*. Correlation is significant at the 0.05 level (2-tailed).
University of Ghana http://ugspace.ug.edu.gh

153
APPENDIX 11: correlation coefficient for groundwater where the bottom is the correlation coefficient for PG1and the top is the correlation coefficient for PG2
pH TSS TUR EC TDS BOD COD DO NO3 NO2 NH3 TP SO4 SO3 Zn Cu Cr Mn Fe Cd Ni
Ph 1.0 -0.945 -0.009 0.735 0.605 0.927 0.992 -0.993 0.780 -0.077 -0.948 0.777 0.801 -0.149 0.815 0.854 0.666 0.580 0.510 0.205 0.441
TSS -0.636 1.0 -0.916 -0.831 -0.999* -0.898 0.977 -0.942 0.397 1.000** -0.940 -0.952 0.463 -0.959 -0.977 -0.873 -0.814 -0.762 0.125 -0.710 -0.916
TUR -0.519 0.990 1.0 -0.685 -0.801 -0.384 0.115 0.127 -0.632 0.998* 0.325 -0.636 -0.606 0.990 -0.587 -0.527 -0.751 -0.820 -0.865 0.977 -0.901
EC -0.386 0.957 0.989 1.0 0.985 0.936 0.645 -0.810 0.998* -0.733 -0.912 0.998* 0.995 -0.780 0.992 0.980 0.995 0.979 0.958 -0.514 0.933
TDS -0.831 0.958 0.907 0.834 1.0 0.860 0.502 -0.965 0.958 -0.840 -0.826 0.971 0.961 -0.877 0.955 0.931 0.997 1.000* 0.993 -0.656 0.981
BOD -0.989 0.514 0.387 0.245 0.740 1.0 0.873 -0.971 0.697 -0.446 -0.998* 0.957 0.967 -0.510 0.973 0.987 0.898 0.843 0.796 -0.178 0.746
COD -0.804 0.052 -0.091 -0.238 0.338 0.883 1.0 -0.971 0.697 0.047 -0.902 0.693 0.721 -0.026 0.737 0.784 0.569 0.475 0.400 0.324 0.327
DO 1.000* -0.658 -0.543 -0.412 -0.847 -0.984 -0.787 1.0 -0.849 0.195 0.979 -0.846 -0.866 0.265 -0.878 -0.910 -0.750 -0.672 -0.608 -0.087 -0.545
NO3 -0.533 0.992 1.000* 0.986 0.914 0.402 -0.074 -0.557 1.0 -0.683 0-.938 1.000** 0.999* -0.735 0.998* 0.992 0.986 0.962 0.936 -0.452 0.905
NO2 -0.901 0.908 0.839 0.748 0.990 0.827 0.466 -0.913 0.847 1.0 0.389 -0.687 -0.659 0.997* -0.641 -0.584 -0.794 -0.857 -0.897 0.960 -0.929
NH3 0.770 -0.982 -0.945 -0.886 -0.995 -0.667 -0.240 0.788 -0.950 -0.971 1.0 0-.937 -0.949 0.455 -0.957 -0.975 -0.869 -0.808 -0.756 0.117 -0.703
TP 0.928 -0.877 -0.800 -0.701 -0.978 -0.863 -0.525 0.938 -0.810 -0.998* 0.952 1.0 0.999* -.738 0.998* 0.991 0.987 0.963 0.938 -0.457 0.908
SO4 0.958 -0.831 -0.743 -0.634 -0.956 -0.905 -0.600 0.966 -0.753 -0.988 0.921 0.996 1.0 -.712 1.000* 0.995 0.980 0.952 0.923 -0.422 0.891
SO3 0.351 0.500 0.619 0.729 0.229 -0.485 -0.839 0.324 0.606 0.091 -0.327 -0.023 0.067 1.0 -0.695 -0.641 -0.837 -0.892 -0.927 0.937 -0.953
Zn -0.348 0.945 0.982 0.999* 0.811 0.205 -0.277 -0.375 0.979 0.721 -0.866 -0.672 -0.603 0.756 1.0 0.997* 0.975 0.945 0.914 -0.401 0.880
Cu 0.997* -0.577 -0.454 -0.316 -0.787 -0.997* -0.846 0.995 -0.469 -0.866 0.721 0.898 0.934 0.419 -0.277 1.0 0.957 0.919 0.882 -0.334 0.843
Cr -0.261 0.911 0.961 0.991 0.754 0.116 -0.363 -0.289 0.956 0.655 -0.817 -0.602 -0.528 0.812 0.996 -0.189 1.0 0.994 0.981 -0.593 0.963
Mn -0.160 0.864 0.927 0.972 0.682 0.012 -0.458 -0.188 0.920 0.573 -0.753 -0.516 -0.437 0.868 0.981 -0.086 0.995 1.0 0.996 -0.679 0.987
Fe -0.306 0.929 0.973 0.996 0.784 0.162 -0.320 -0.333 0.969 0.689 -0.843 -0.638 -0.567 0.784 0.999* -0.234 0.999* 0.989 1.0 -0.738 0.997*
Cd 0.920 -0.887 -0.812 -0.716 -0.982 -0.852 -0.508 0.931 -0.821 -0.999* 0.958 1.000* 0.994 -0.043 -0.687 0.889 -0.618 -0.533 -0.654 1.0 -0.788
Ni 0.636 -1.000** -0.990 -0.957 -0.958 -0.514 -0.052 0.658 -0.992 -0.908 0.982 0.877 0.831 -0.500 -0.945 0.577 -0.911 -0.864 -0.929 0.887 1.0
**. Correlation is significant at the 0.01 level (2-tailed).
*. Correlation is significant at the 0.05 level (2-tailed).
University of Ghana http://ugspace.ug.edu.gh
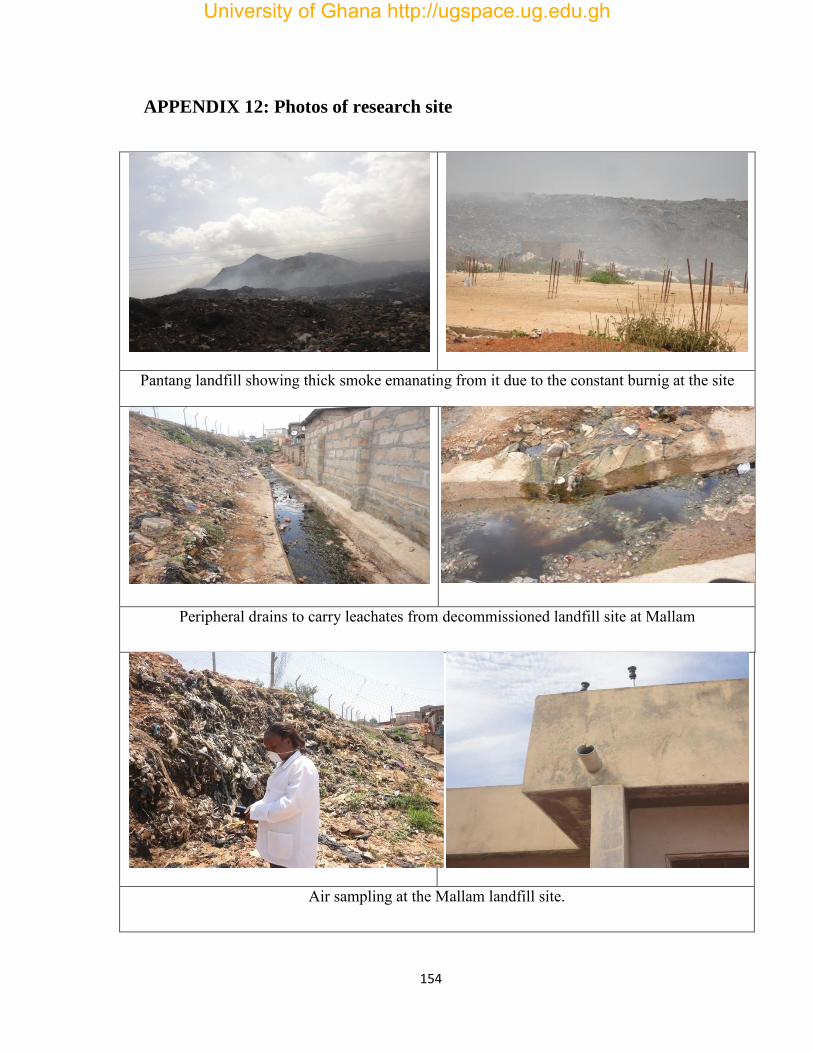
154
APPENDIX 12: Photos of research site
Pantang landfill showing thick smoke emanating from it due to the constant burnig at the site
Peripheral drains to carry leachates from decommissioned landfill site at Mallam
Air sampling at the Mallam landfill site.
University of Ghana http://ugspace.ug.edu.gh
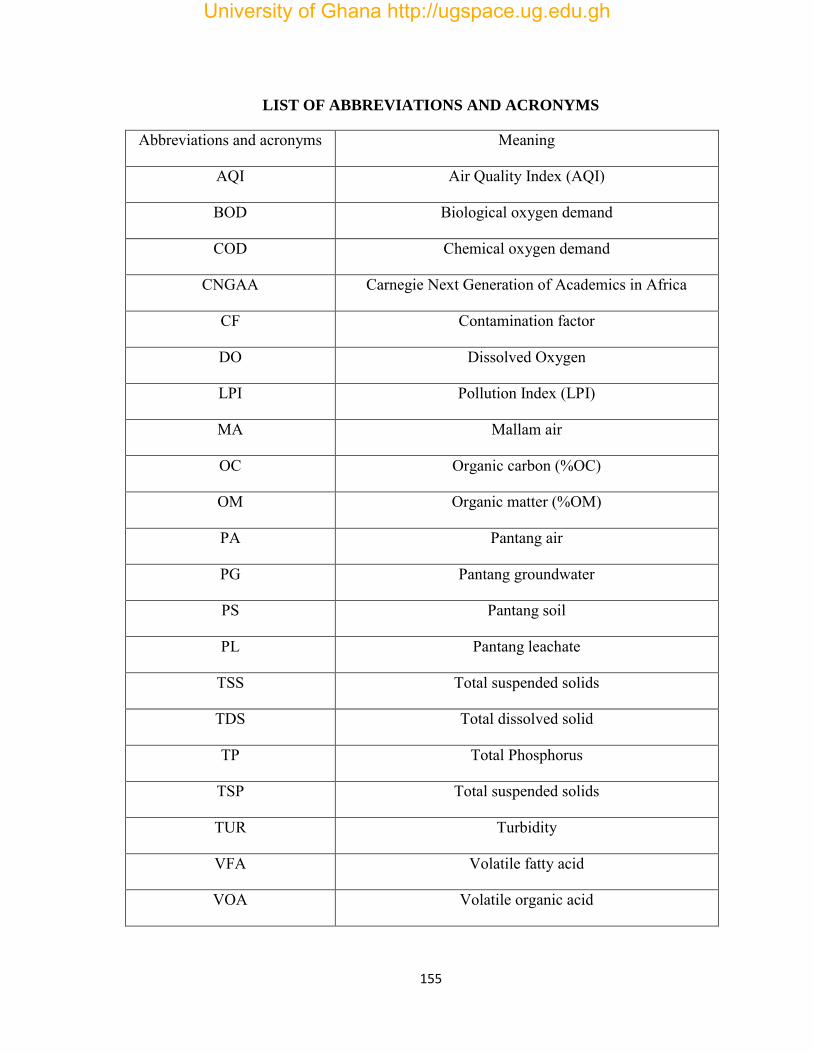
155
LIST OF ABBREVIATIONS AND ACRONYMS
Abbreviations and acronyms Meaning
AQI Air Quality Index (AQI)
BOD Biological oxygen demand
COD Chemical oxygen demand
CNGAA Carnegie Next Generation of Academics in Africa
CF Contamination factor
DO Dissolved Oxygen
LPI Pollution Index (LPI)
MA Mallam air
OC Organic carbon (%OC)
OM Organic matter (%OM)
PA Pantang air
PG Pantang groundwater
PS Pantang soil
PL Pantang leachate
TSS Total suspended solids
TDS Total dissolved solid
TP Total Phosphorus
TSP Total suspended solids
TUR Turbidity
VFA Volatile fatty acid
VOA Volatile organic acid
University of Ghana http://ugspace.ug.edu.gh