Environmental Impact of Water and Sanitation Issues · 1 Environmental Impact of Water and...
17
1 Environmental Impact of Water and Sanitation Issues Prasanta Kumar Mohapatra Project Engineer, Orissa Water Supply & Sewerage Board Waterworks Road, Puri-752 002, Orissa, India, E-mail: [email protected] Abstract Puri is a small coastal town of Orissa in India on the Bay of Bengal. The town is famous for Lord Shree Jagannath temple built in 12 th century A.D. Over the years, floating population has been increasing. Tourism is the biggest industry and contributes to economic growth of the town. The environmental degradation is visible. Puri town is bestowed with groundwater aquifers. Intrusion of saline water in few wells occurs due to over pumping. The water table is high. Disposal of household liquid waste through septic tank and soak pit in sandy underground formation led to pollution of groundwater. Estimate suggests 60% of solid wastes generated are collected and treated in a compost plant. The waste is not segregated at source, collection mechanism in the narrow streets are inefficient. Leachate is not monitored. Lack of public awareness and participation contribute to management problem. Detailed groundwater quality monitoring revealed travel of nitrate plume from a dump site towards the water well field. The geo-hydrological investigation coupled with groundwater modelling study provided information on aquifer potential. The study also revealed that impacts on groundwater source are linked due to the particular geography and location of the town. The town is implementing a well designed sewerage system to deal with sanitation and pollution. Key Words: Puri town, sanitation, sewerage system, environmental impact, groundwater pollution, modelling 1. Introduction Towns and cities in developing countries are under environmental stress. The urban areas have grown over past decades owing to migration, increase in trade, tourism, and commerce activities. The floating population is often more than the resident urban population. Cities are under pressure to provide basic amenities to the citizen such as adequate drinking water and sanitation facilities. The water supply and sanitation systems in these cities are typically characterized by following issues: Raw water is transported from distant source as existing sources are exhausted orpolluted. Energy use in raw water transport is rising. More treatment steps are required and more chemicals are used to produce potable water from polluted sources. Surface water source such as a river is exploited to such an extent that it can not meet ecological flow demand at down stream reach. Wastewateris discharged untreated due to lack or inadequate treatment capacity thereby polluting groundwater and eutrophying surface water body. Management of solid waste has become an environmental challenge. In coastal cities,there is threat of sea water intrusion in groundwater aquifers in addition to above concerns. In near future, this situation will be further complicated with climate change effects of sea level rise, flooding and pollution (IPCC, AR4, WGIII, 2007). In other words, coastal cities are faced with resource depletion, increased energy consumption, water pollution, eutrophication and waste generation. The objective of this paper is to explore the interaction of environmental issues relating to drinking water supply, sanitation and solid waste systemsin Puri town as a case study. The paper assesses existing systems, presents their environmental indicators and brings out the environmental issues. The impact of existing systems on environment has been investigated through field study and modelling.
Transcript of Environmental Impact of Water and Sanitation Issues · 1 Environmental Impact of Water and...
1
Environmental Impact of Water and Sanitation Issues
Prasanta Kumar MohapatraProject Engineer, Orissa Water Supply & Sewerage Board
Waterworks Road, Puri-752 002, Orissa, India, E-mail: [email protected]
AbstractPuri is a small coastal town of Orissa in India on the Bay of Bengal. The town is famous for Lord Shree Jagannath temple built in 12th century A.D. Over the years, floating population has been increasing. Tourism is the biggest industryand contributes to economic growth of the town. The environmental degradation is visible. Puri town is bestowed with groundwater aquifers. Intrusion of saline water in few wells occurs due to over pumping. The water table is high. Disposal of household liquid waste through septic tank and soak pit in sandy underground formation led to pollution of groundwater. Estimate suggests 60% of solid wastes generated are collected and treated in a compost plant. The waste is not segregated at source, collection mechanism in the narrow streets are inefficient. Leachate is not monitored. Lack of public awareness and participation contribute to management problem. Detailed groundwater quality monitoring revealed travel of nitrate plume from a dump site towards the water well field. The geo-hydrological investigationcoupled with groundwater modelling study provided information on aquifer potential. The study also revealed that impacts on groundwater source are linked due to the particular geography and location of the town. The town is implementing a well designed sewerage system to deal with sanitation and pollution.
Key Words: Puri town, sanitation, sewerage system, environmental impact, groundwater pollution, modelling
1. IntroductionTowns and cities in developing countries are under environmental stress. The urban areas have grown over past decades owing to migration, increase in trade, tourism, and commerce activities. The floating population is often more than the resident urban population. Cities are under pressure to provide basic amenities to the citizen such as adequate drinking water and sanitation facilities. The water supply and sanitation systems in these cities are typically characterized by following issues:
Raw water is transported from distant source as existing sources are exhausted or polluted. Energy use in raw water transport is rising.
More treatment steps are required and more chemicals are used to produce potable water from polluted sources.
Surface water source such as a river is exploited to such an extent that it can not meet ecological flow demand at down stream reach.
Wastewater is discharged untreated due to lack or inadequate treatment capacity thereby polluting groundwater and eutrophying surface water body.
Management of solid waste has become an environmental challenge.
In coastal cities, there is threat of sea water intrusion in groundwater aquifers in addition to above concerns. In near future, this situation will be further complicated with climate change effects of sea level rise, flooding and pollution (IPCC, AR4, WGIII, 2007). In other words, coastal cities are faced with resource depletion, increased energy consumption, water pollution, eutrophication and waste generation.
The objective of this paper is to explore the interaction of environmental issues relating to drinking water supply, sanitation and solid waste systems in Puri town as a case study. The paper assesses existing systems, presents their environmental indicators and brings out the environmental issues. The impact of existing systems on environment has been investigated through field study and modelling.
2
Water and sanitation systems are assessed through a set of performance indicators. Recently, environmental sustainable indicators have been advocated to assess the environmental performance and sustainability of these systems. An environmental sustainable indicator is a parameter based on a data set of system in service. The indicators are selected in such a way that they reflect important aspects of system, relate to a functional unit and facilitate comparison (Lundin, 1999). If data iscollected as a time series for at least 20 years or more, the indicators can be evaluated against environmental sustainability to predict trends and potential problems (Lundin et. al., 2002). In urban water and sanitation system, indicators suggested are raw water withdrawal, drinking water consumption, chemical use, energy use, wastewater production, performance of treatment plant,nutrients released to water body, recycling of nutrients, access to drinking water and sanitationprovision, water quality etc. (Morrison et. al., 2001; Sahely et. al., 2005). A snap shot of indicators ofexisting water and sanitation system in Puri town is given in this paper.
Water supply and sanitation systems can impact environment in many ways. Studies have shown that energy and chemicals consumption in production of potable water cause global environmental impact (Mohapatra et. al., 2002; Tapia et. al., 2008; Vince et. al., 2008). These studies have been done under the framework of life cycle analysis of urban drinking water supply system. Over pumping of groundwater has caused subsidence of land and saline ingress in many coastal aquifers. Infiltration of wastewater into aquifer increases nitrate concentrations in groundwater beyond permissible value.Discharge of sewage into sea causes microbial pollution of beach water. While greenhouse gasesemitted from solid waste landfill site have global warming effect, leachate causes groundwater pollution.
In this paper, firstly, the study area is described focusing on the drivers of growth. Secondly, an analysis of current situation and issues of water supply, sanitation and solid waste system are presented. Thirdly, environmental effects of these issues are discussed followed by an assessment of groundwater quality and hydraulic modelling study. Finally, salient features of an underground sewerage project presently ongoing are described and outcome stated.
1.1 Description of study area and growth driversPuri town is located between 190 47' and 190 50' North latitudes and 850 48' and 850 52' East longitudeson the shore of Bay of Bengal. It is 65 Km away from Bhubaneswar, the administrative capital of Orissa State. The town is connected by broad gauge railway line to most parts of the country. The townis very old with history dating back to 3rd century B.C. Puri got prominence when the ruling kings builtShree Jagannath temple. The present temple was built in 12th century AD. Puri was declared a town on 19 January 1865 and a Municipality on 1 April 1881. Present day town within Municipality limits spreads over 16.26 Sq.Km land. Puri is considered a holy place. The present (2008) population is estimated to be 186,000. The town’s resident population is growing exponentially since 1941 and has not stabilized yet though land available is restricted (Figure 1a). Devotees and tourists come to Puri all round the year. They offer prayer, enjoy the pristine beauty of sea and relax. Over the years, floating population is increasing. Average number of tourists visiting the town per day is 15,000. On festival days and New Year day, the floating population increases to 500,000. Estimates suggest people visiting Puri on Car festival day, a festival celebrated each year on a pre specified day, reaches a peak of 1.0 million. Visitors during car festival recorded in 1841, 1892 and 1901 were 112,000; 200,000 and over 300,000 respectively. In year 2008, on Car festival day held on 4th July 2008, about 800,000 people visited Puri. It is projected that in year 2015 on this festival day, the town must be ready to accommodate 2.5 million guests. The coast line of the town is about 6.59 Km long. Many star hotels

3
have been constructed in recent years by private entrepreneurs along the beach boosting tourism(Figure 1b).
Figure 1: (a) Growth of resident population (left); (b) Growth of hotels in Puri town (right)
The climate of Puri in summer is warm and humid with average maximum and minimum temperatures of 37.50C and 270C respectively. The climate in winter is cool and pleasant with average maximum and minimum temperatures of 28.2 and 15.20C respectively. About 74% of the rainfall is received during monsoon season from June to September. Maximum precipitation occurs in July. On an average, there are 71 rainy days in a year. Annual precipitation in Puri is about 1520 mm. Puri experiences cyclonic depressions and storms originating in the Bay of Bengal.
The population living in peri-urban area often called slum constitute about 25% of town population. A slum is characterized by poor housing quality with lack of access to basic amenities. About 33,768 persons live in 6753 houses in 46 slum pockets (2001 census). A majority and highly populated slums exist near the sea shore. Traditional occupation of these slum residents are fishing in sea.
From the foregoing description, it can be summarized that Puri is a vibrant town with temple and sea beach being main drivers of population and economic growth. The town is witnessing phenomenal increase of resident and tourist population. The pleasant weather, traditional rituals and numerous festivals contribute to seasonal peak in tourism. Tourism and related activities provide employment to people. The town’s slum population is a cause of major concern as far as development is concerned. As resident and tourist population are increasing at fast rate, there is bound to be pressure on the existing infrastructure to provide urban basic services commensurate with town’s status as a major tourist hub.
2. Existing water supply, sanitation and solid waste management systems
2.1 Water supply system: current situation and issuesThe water supply system through network of pipelines in the town started in 1934. The responsibility for plan, design, execution, operation and maintenance of water supply system in the town and other
0
20,000
40,000
60,000
80,000
100,000
120,000
140,000
160,000
180,00019
01
1911
1921
1931
1941
1951
1961
1971
1981
1991
2001
Year
Pop
ulat
ion
(Num
bers
)
0
200
400
600
800
1000
1200
1400
1997 1998 1999 2000 2001 2002 2003 2004 2005
Year
Number of Hotels Number of roomsX10
4
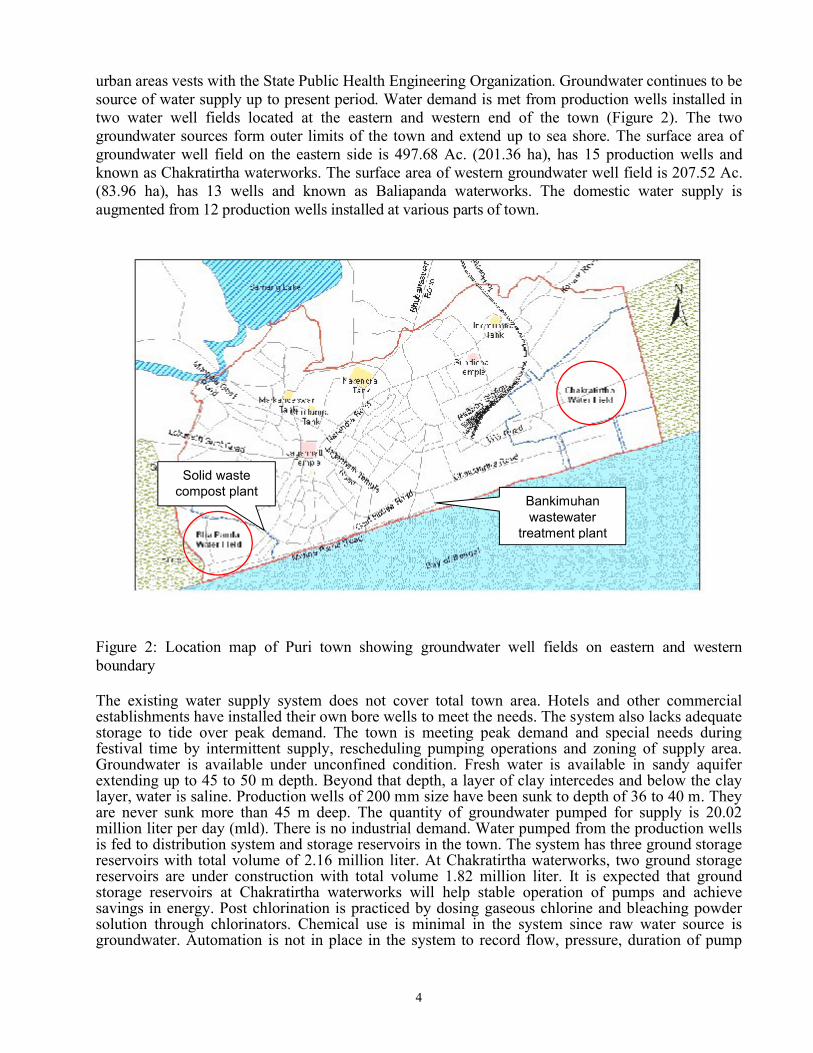
urban areas vests with the State Public Health Engineering Organization. Groundwater continues to be source of water supply up to present period. Water demand is met from production wells installed in two water well fields located at the eastern and western end of the town (Figure 2). The two groundwater sources form outer limits of the town and extend up to sea shore. The surface area of groundwater well field on the eastern side is 497.68 Ac. (201.36 ha), has 15 production wells and known as Chakratirtha waterworks. The surface area of western groundwater well field is 207.52 Ac.(83.96 ha), has 13 wells and known as Baliapanda waterworks. The domestic water supply is augmented from 12 production wells installed at various parts of town.
Figure 2: Location map of Puri town showing groundwater well fields on eastern and western boundary
The existing water supply system does not cover total town area. Hotels and other commercial establishments have installed their own bore wells to meet the needs. The system also lacks adequate storage to tide over peak demand. The town is meeting peak demand and special needs during festival time by intermittent supply, rescheduling pumping operations and zoning of supply area.Groundwater is available under unconfined condition. Fresh water is available in sandy aquifer extending up to 45 to 50 m depth. Beyond that depth, a layer of clay intercedes and below the clay layer, water is saline. Production wells of 200 mm size have been sunk to depth of 36 to 40 m. They are never sunk more than 45 m deep. The quantity of groundwater pumped for supply is 20.02 million liter per day (mld). There is no industrial demand. Water pumped from the production wells is fed to distribution system and storage reservoirs in the town. The system has three ground storage reservoirs with total volume of 2.16 million liter. At Chakratirtha waterworks, two ground storage reservoirs are under construction with total volume 1.82 million liter. It is expected that ground storage reservoirs at Chakratirtha waterworks will help stable operation of pumps and achieve savings in energy. Post chlorination is practiced by dosing gaseous chlorine and bleaching powder solution through chlorinators. Chemical use is minimal in the system since raw water source is groundwater. Automation is not in place in the system to record flow, pressure, duration of pump
Bankimuhanwastewater
treatment plant
Solid waste compost plant
5
operation, water levels in production wells etc. Flow is not metered. A detailed project report is in process of implementation under the “Jawaharlal Nehru National Urban Renewal Mission” of Government of India for augmentation of water supply source, storage, distribution network etc. in Puri town (ASCI, 2008).
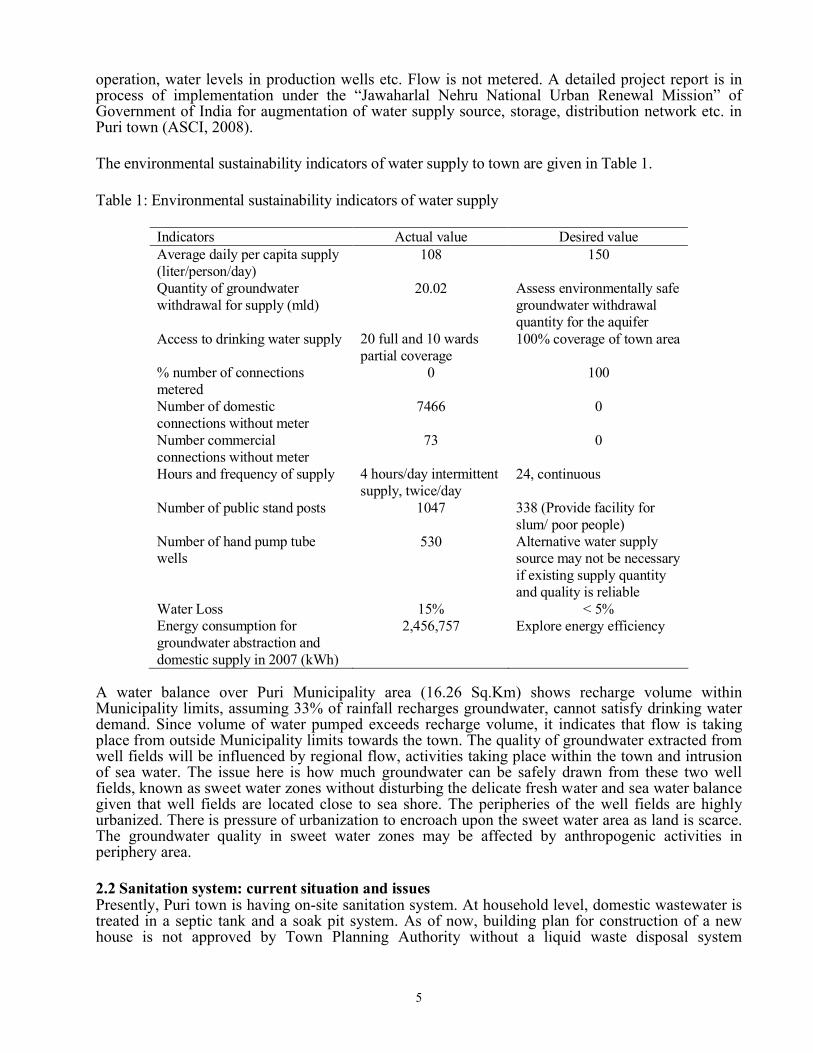
The environmental sustainability indicators of water supply to town are given in Table 1.
Table 1: Environmental sustainability indicators of water supply
Indicators Actual value Desired valueAverage daily per capita supply (liter/person/day)
108 150
Quantity of groundwater withdrawal for supply (mld)
20.02 Assess environmentally safe groundwater withdrawal quantity for the aquifer
Access to drinking water supply 20 full and 10 wards partial coverage
100% coverage of town area
% number of connections metered
0 100
Number of domestic connections without meter
7466 0
Number commercial connections without meter
73 0
Hours and frequency of supply 4 hours/day intermittent supply, twice/day
24, continuous
Number of public stand posts 1047 338 (Provide facility for slum/ poor people)
Number of hand pump tube wells
530 Alternative water supply source may not be necessary if existing supply quantity and quality is reliable
Water Loss 15% < 5%Energy consumption for groundwater abstraction and domestic supply in 2007 (kWh)
2,456,757 Explore energy efficiency
A water balance over Puri Municipality area (16.26 Sq.Km) shows recharge volume within Municipality limits, assuming 33% of rainfall recharges groundwater, cannot satisfy drinking water demand. Since volume of water pumped exceeds recharge volume, it indicates that flow is taking place from outside Municipality limits towards the town. The quality of groundwater extracted fromwell fields will be influenced by regional flow, activities taking place within the town and intrusion of sea water. The issue here is how much groundwater can be safely drawn from these two well fields, known as sweet water zones without disturbing the delicate fresh water and sea water balance given that well fields are located close to sea shore. The peripheries of the well fields are highly urbanized. There is pressure of urbanization to encroach upon the sweet water area as land is scarce. The groundwater quality in sweet water zones may be affected by anthropogenic activities in periphery area.
2.2 Sanitation system: current situation and issuesPresently, Puri town is having on-site sanitation system. At household level, domestic wastewater is treated in a septic tank and a soak pit system. As of now, building plan for construction of a new house is not approved by Town Planning Authority without a liquid waste disposal system
6
comprising of septic tank and soak pit. Black wastewater from toilet flows to a septic tank. Septic tank and soak pit are usually constructed at back yard of a house. Gray wastewater from bath and kitchen, overflow from septic tanks and soak pits are channeled to nearby road side storm water drain. In densely populated area, with little space, houses having pit latrines are connected to drain. People avail of services of Municipality sludge suction truck for periodical emptying of septic tanks.Slum people are serviced through community toilets. Some houses have pit latrines. The wastewaterfrom community toilet is treated in septic tank soak pit system. The drainage network of Puri comprises tertiary drains in streets and three main drains flowing towards Bankimuhan, a place near sea shore (Figure 2). The storm water drainage network functions as combined system conveying both rain water and wastewater. A drain is designed as an open channel with open top to facilitate cleaning by manual labour. The dry weather flow in a drain is wastewater generated at household.Entire town is not covered by drainage network.
Potable water supplied to households for various domestic needs is transformed to wastewater as it leaves the house. The wastewater BOD5 concentration in main drains exceeds 130 ppm (NEERI, 1995). A wastewater treatment system was constructed in 1996 at Bankimuhan with zero effluent discharge to sea. It was designed with three stabilization ponds in series with detention time of 3.5days and average flow of 7 mld. The ponds were constructed by widening of gravity open channeland lining side walls. The flow in combined storm water/wastewater drain system from urban catchments till last stabilisation pond is by gravity. At the third pond, treated effluent is pumped to a plantation area with high evapo-transpiration and to a forest, 5 Km away from Bankimuhan.
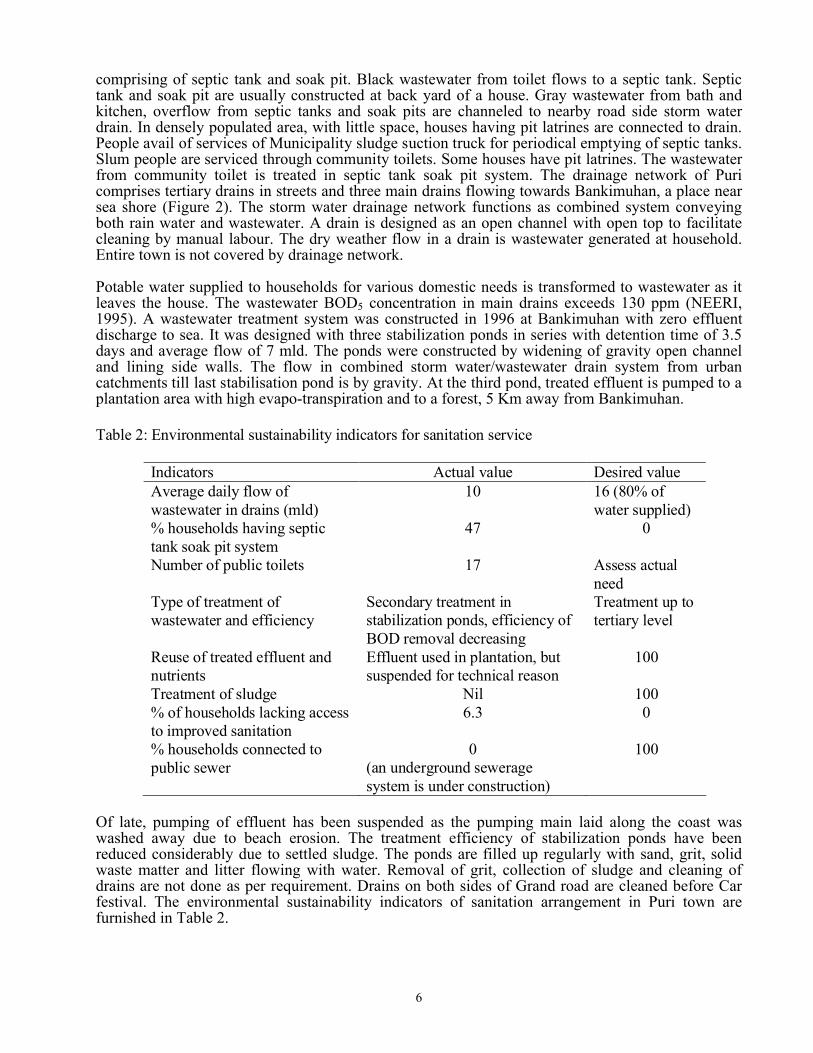
Table 2: Environmental sustainability indicators for sanitation service
Indicators Actual value Desired valueAverage daily flow of wastewater in drains (mld)
10 16 (80% of water supplied)
% households having septic tank soak pit system
47 0
Number of public toilets 17 Assess actual need
Type of treatment of wastewater and efficiency
Secondary treatment in stabilization ponds, efficiency of BOD removal decreasing
Treatment up to tertiary level
Reuse of treated effluent and nutrients
Effluent used in plantation, but suspended for technical reason
100
Treatment of sludge Nil 100% of households lacking access to improved sanitation
6.3 0
% households connected to public sewer
0(an underground sewerage system is under construction)
100
Of late, pumping of effluent has been suspended as the pumping main laid along the coast was washed away due to beach erosion. The treatment efficiency of stabilization ponds have beenreduced considerably due to settled sludge. The ponds are filled up regularly with sand, grit, solid waste matter and litter flowing with water. Removal of grit, collection of sludge and cleaning of drains are not done as per requirement. Drains on both sides of Grand road are cleaned before Car festival. The environmental sustainability indicators of sanitation arrangement in Puri town are furnished in Table 2.

7
The Municipality has overall responsibility for sanitation. It is the beginning of journey in sanitation ladder. The indicator for households lacking access to sanitation shows that only 6.3% households lack access to any kind of facility. These households are in slum. Pit latrine is also considered an improved sanitation facility. Slum area with community toilet facility is considered having access to improved sanitation. About 31.4% of urban non-slum households have such system in their premises. It must be realized that wastewater from pit latrines, soak pits and open channel drains infiltrate in sandy soil. Ground water pollution due to wastewater infiltration can not be ruled out asgroundwater table is high in many areas of the town. The major sanitation challenges can be outlined as follows:
Reduction of efficiency of Bankimuhan wastewater treatment plant has occurred with time. Dumping of household garbage and solid wastes into drain are a problem. Water logging in rainy season causes malfunctioning of soak pits and unsanitary condition. Infiltration of wastewater from septic tanks and soak pits may contaminate groundwater. Poor hygienic practice by slum population and lack of access to sanitation are a concern as
they defecate in open and inside drains. Existing public amenities for pilgrims and tourists are inadequate and inaccessible. Deterioration in water quality of ponds used for bathing, recreation and religious ritual.
2.3 Solid waste management system: current situation and issuesMunicipal solid waste (MSW) generation in a town is influenced by socio-economic condition, culture and attitudes of its people. Currently, solid waste generation in Puri town can be classified into 4 source categories, namely, waste from households, waste from hotels and restaurants, waste generated in Shree Jagannath temple and waste generated from institutions/markets. There are other categories of waste such as waste generated from hospital, i.e., bio-medical waste, waste from road sweeping (sand, dust, polythene, litter etc.), waste from periodically cleaning of drains (grit, organic matter, polythene etc.), waste from construction and demolition of buildings etc.
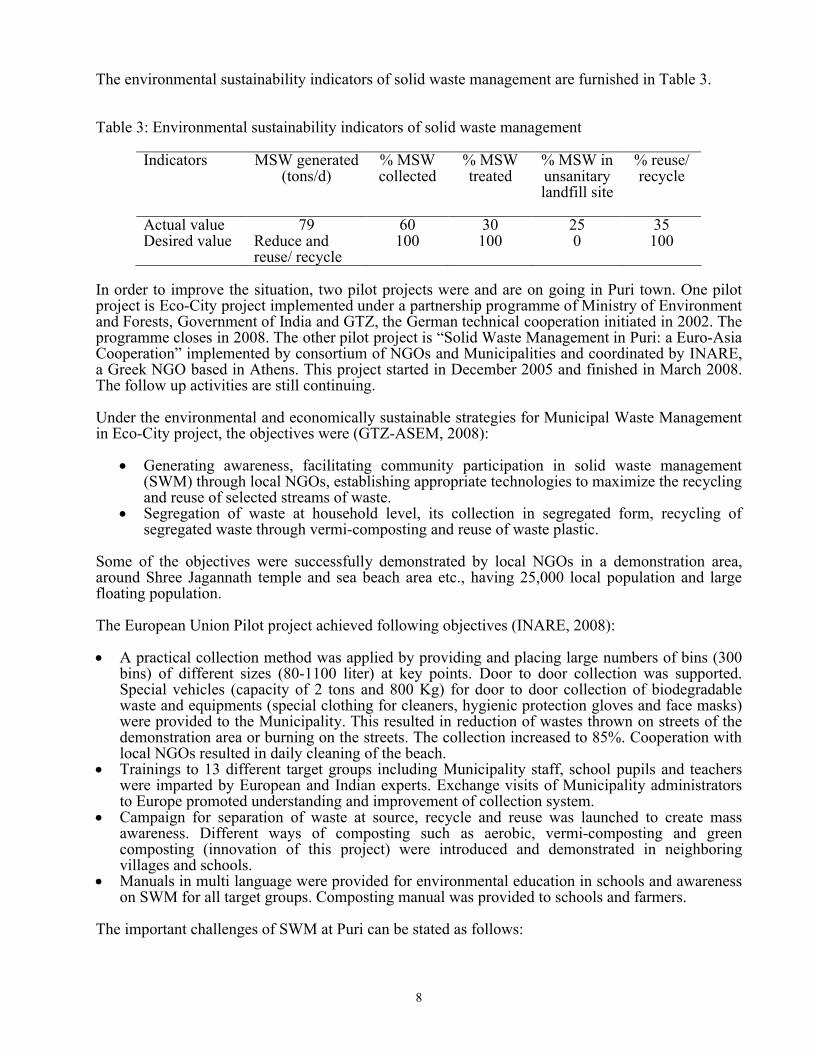
The existing solid waste management system has problems at collection, segregation, storage, transport, processing and disposal. The town produces a wide variety of organic and inorganic waste. Organic waste is generated in residential areas, restaurants and hotels, temple, vegetable market etc. The temple organic waste comprises mostly flowers, food waste and coconut shells. The inorganic material constitutes broken earthen pots used for cooking and other rituals. The temple generates ash which is the product of burning wood for cooking various food items for ritual and devotees. The MSW of Puri is all mixed up without segregation at source. As far as composition of MSW is concerned, 59% by volume is inorganic matter and rest is organic matter. The density of waste is 426 Kg/cum and moisture content is 38%. The total MSW generated in Puri town is 79 tons/d. During annual cleaning of drains 1115 tons of sludge is generated. The Shree Jagannath temple generates 1.23 tons of waste each day. During festive occasions, this quantity shoots up to 3.5 tons/d. Through initiative of small private enterprises, rag pickers collect 5.76 tons of plastic, broken glass and polyethylene items daily for recycling. Studies show that in the existing collection system, only 60% of waste is collected. The rest finds its way to street and vacant land (Samantasinghara, 2008).
Waste is transferred by trucks and tractors to an aerobic compost plant for processing. The compost plant was set up in 1998 at Baliapanda, bordering sweet water zone, under Indo-Norwegian development cooperation. It occupies 2 ha land with capacity to treat 100 tons/d. The plant is operating successfully on lease given by the Municipality to a private entrepreneur. The waste from compost plant, comprising mostly plastic and polyethylene matter, is land filled near the plant. The Municipality is planning to construct a new sanitary landfill site away from town to bury these waste by-products. Disposal of MSW at unsanitary landfill site is common practice. There exist several unsanitary landfill sites throughout the town. The age of these sites varies from few months to more than 20 years.
8
The environmental sustainability indicators of solid waste management are furnished in Table 3.
Table 3: Environmental sustainability indicators of solid waste management
Indicators MSW generated(tons/d)
% MSW collected
% MSW treated
% MSW in unsanitary landfill site
% reuse/recycle
Actual value 79 60 30 25 35Desired value Reduce and
reuse/ recycle100 100 0 100
In order to improve the situation, two pilot projects were and are on going in Puri town. One pilot project is Eco-City project implemented under a partnership programme of Ministry of Environment and Forests, Government of India and GTZ, the German technical cooperation initiated in 2002. The programme closes in 2008. The other pilot project is “Solid Waste Management in Puri: a Euro-Asia Cooperation” implemented by consortium of NGOs and Municipalities and coordinated by INARE, a Greek NGO based in Athens. This project started in December 2005 and finished in March 2008. The follow up activities are still continuing.
Under the environmental and economically sustainable strategies for Municipal Waste Management in Eco-City project, the objectives were (GTZ-ASEM, 2008):
Generating awareness, facilitating community participation in solid waste management(SWM) through local NGOs, establishing appropriate technologies to maximize the recycling and reuse of selected streams of waste.
Segregation of waste at household level, its collection in segregated form, recycling of segregated waste through vermi-composting and reuse of waste plastic.
Some of the objectives were successfully demonstrated by local NGOs in a demonstration area,around Shree Jagannath temple and sea beach area etc., having 25,000 local population and large floating population.
The European Union Pilot project achieved following objectives (INARE, 2008):
A practical collection method was applied by providing and placing large numbers of bins (300 bins) of different sizes (80-1100 liter) at key points. Door to door collection was supported. Special vehicles (capacity of 2 tons and 800 Kg) for door to door collection of biodegradable waste and equipments (special clothing for cleaners, hygienic protection gloves and face masks) were provided to the Municipality. This resulted in reduction of wastes thrown on streets of the demonstration area or burning on the streets. The collection increased to 85%. Cooperation with local NGOs resulted in daily cleaning of the beach.
Trainings to 13 different target groups including Municipality staff, school pupils and teachers were imparted by European and Indian experts. Exchange visits of Municipality administrators to Europe promoted understanding and improvement of collection system.
Campaign for separation of waste at source, recycle and reuse was launched to create mass awareness. Different ways of composting such as aerobic, vermi-composting and green composting (innovation of this project) were introduced and demonstrated in neighboring villages and schools.
Manuals in multi language were provided for environmental education in schools and awareness on SWM for all target groups. Composting manual was provided to schools and farmers.
The important challenges of SWM at Puri can be stated as follows:
9
Non-segregation of various types of waste at source and possible recycling. Development of innovative segregated waste collection system as most streets are narrow. Creating continuous public awareness and encouraging their participation to keep temple
neighbourhood, sea beach and town clean. Closure of unsanitary dump sites and their remediation.
A detailed project report is in process under the Jawaharlal Nehru National Urban Renewal Mission of Government of India for efficient solid waste management at Puri town.
3. Assessment of Environmental ImpactIt is seen that in the current situation, issues relating to sanitation and solid waste management in Puri town described in preceding sections adversely impact groundwater quality. Other potential impact on groundwater quality is sea water intrusion, which may occur if quantity of groundwater withdrawn is more than safe quantity. Over pumping may occur if exact potential of aquifer is not known. Pollution of beach is another negative effect if untreated or partially treated wastewater is discharged to sea.
The results of groundwater quality assessment and flow modelling to assess safe quantity of withdrawal in Puri town are described in subsequent sections.
3.1 Groundwater quality assessmentFrom the data on existing bore wells and geophysical investigations, it is seen that fresh groundwater in Puri town is available in unconfined aquifer. The water level inside the well corresponds to groundwater table. Sampling and testing was done during August 2006 (sampling within Municipality limit excluding water fields), November 2006 (sampling from two well fields, sampling points within Municipality limit and in surrounding villages) and June 2007 (sampling from two well fields and points within Municipality limit). Water samples were analyzed for physical, chemical and bacteriological parameters. Standard procedure was used for analyzing the samples for all parameters. Testing was done for 18 samples in August 2006, 84 samples in November 2006 and 53 samples in June 2007. Tests were conducted for 17 physico-chemical and 2 bacteriological parameters. GPS was used for location of sampling sites and ArcGIS 9.1 was used for spatial analysis of water quality parameters (NEERI, 2008).
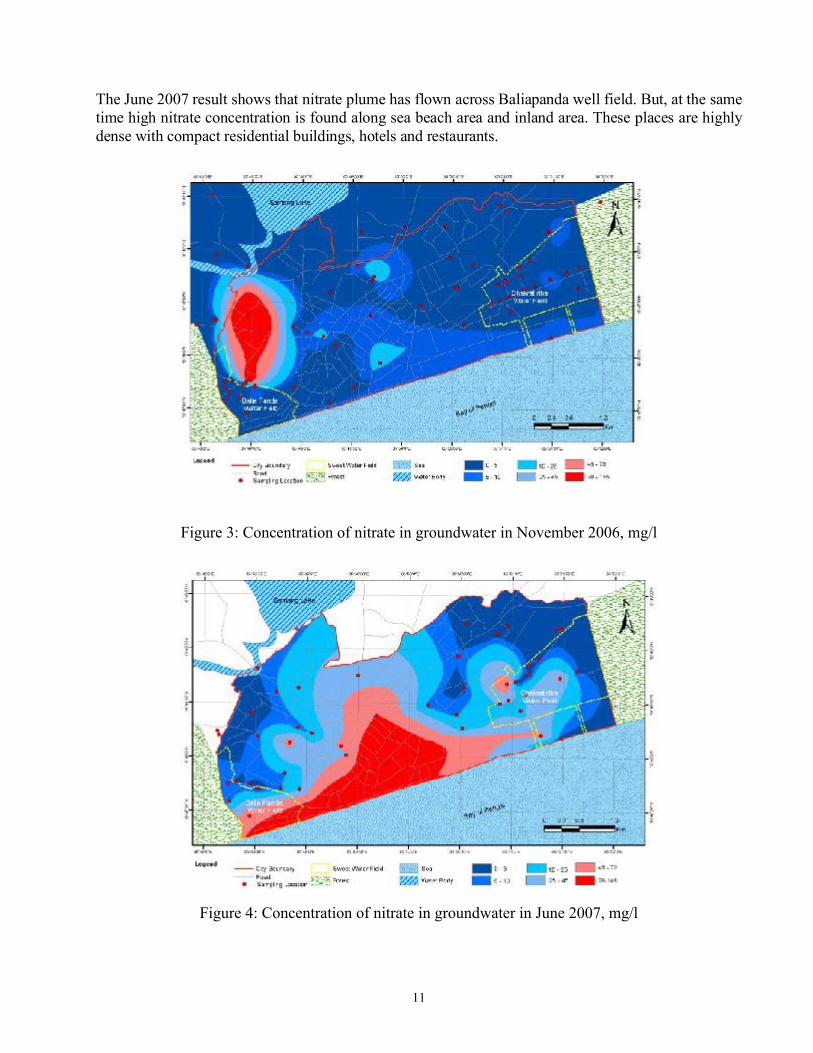
Results of selected groundwater quality parameters in post monsoon season (November 2006) and in summer season (June 2007) are given in Table 4 and Table 5 respectively. From these two tables, it is observed that nitrate concentration is high in two waterworks where groundwater production well field are concentrated. Nitrate concentration is also high in hand pump tube wells located inside the town which are used by people to supplement water needs due to intermittent water supply. The spatial distribution of nitrate in groundwater of Puri town in November 2006 and June 2007 sampling becomes clear in Figure 3 and Figure 4.
It is seen that nitrate concentration in groundwater in many areas exceeds 45 mg/l, permissible limit as per Bureau of Indian Standard for potable water (50 mg/l, as per WHO Standard). The spatial distribution in post rainy season (November 2006) is different from summer season (June 2007, before the onset of monsoon rain). The source of nitrate plume traveling towards Baliapanda water field in November 2006 sampling could be attributable to presence of an old unsanitary solid waste dump sitenearby. Leachate from the dump site infiltrates with rain occurring during July to October. The plume travels with groundwater flow in the direction of sea.
10
Table 4: Groundwater quality during November 2006
Chakratirtha Waterworks Baliapanda Waterworks Town Hand Pump Tube Wells
Accepted limit*
Parameter
Min Max Avg Min Max Avg Min Max Avg Min MaxpH 6.67 8.64 7.4 6.83 8.08 7.49 6.69 8.27 7.29 6.5 8.5TDS (mg/l)
87.0 370.2 227.12 84.0 619.2 250.15 87.0 1572.0 611.57 500 2000
Total hardnessas CaCO3
(mg/l)
76.0 263.2 167.05 12.0 200.0 100.92 52.0 480.0 221.98 300 600
Alkalinity (mg/l)
40.0 148.0 74.75 42.0 200.0 117.82 48.0 432.0 181.33 200 600
Na (mg/l) 2.8 48.2 28.51 5.8 27.0 18.65 6.8 167.8 34.65 - -K (mg/l) 3.5 26.0 7.13 2.7 26.0 10.25 3.4 121.0 39.73 - -Ca (mg/l) 0.0 63.52 27.15 9.6 48.0 24.36 6.4 76.8 34.51 75 200CO3
(mg/l)24.0 88.8 43.05 16.8 60.0 39.68 28.8 129.6 65.77 - -
NO3
(mg/l)0.35 9.71 2.05 0.19 102.0 10.64 0.23 155.0 11.33 45 45
Cl (mg/l) 14.0 56.0 38.07 22.0 110.0 58.18 16.0 464.0 138.29 250 1000F (mg/l) 0.04 1.84 0.26 0.04 0.85 0.18 0.04 1.75 0.51 1.0 1.5Fe (mg/l) 0.15 0.32 0.25 0.17 0.98 0.54 0.8 1.1 0.95 0.3 1.0Min=Minimum, Max=Maximum, Avg=Average, * Accepted limits given in the table are as per Bureau of Indian Standard (BIS) 10500: 1991. As per the Standard, values of parameter for drinking water should be less than minimum limit. Maximum limit can be permissible in absence of an alternative source.
Table 5: Groundwater quality during June 2007
Chakratirtha Waterworks Baliapanda Waterworks Town Hand Pump Tube Wells
Accepted value
Parameter
Min Max Avg Min Max Avg Min Max Avg Min MaxpH 7.44 7.88 7.60 6.71 7.44 7.06 6.85 8.17 7.56 6.5 8.5TDS (mg/l)
55.2 345.6 215.04 78.6 372 198.1 93.0 2208 504.8 500 2000
Total hardness(mg/l)
52.0 164.0 114.4 40.0 180.0 101.33 24.0 520.0 162.07 300 600
Alkalinity (mg/l)
12.0 148.0 90.0 20.0 200.0 93.33 52.0 288.0 151.11 200 600
Na (mg/l) 0.1 865.0 111.47 6.3 43.7 29.0 25.6 1145.0 217.31 - -K (mg/l) 2.0 11.1 5.9 2.8 11.5 6.2 3.2 335.0 68.08 - -Ca (mg/l) 9.6 22.4 15.52 6.4 27.2 16.27 6.4 54.4 14.76 75 200CO3
(mg/l)7.2 88.8 54.0 12.0 120.0 56.0 31.2 172.8 90.67 - -
NO3
(mg/l)0.91 49.28 15.76 1.38 61.11 14.36 1.99 147.85 30.53 45 45
Cl (mg/l) 27.5 82.5 51.5 37.5 60.0 48.75 22.5 1122.5 147.59 250 1000F (mg/l) 0.06 0.138 0.09 0.086 0.305 0.16 0.046 2.04 0.43 1.0 1.5Fe (mg/l) 0.18 1.69 0.79 0.12 1.21 0.62 0.04 3.47 1.52 0.3 1.0
11
The June 2007 result shows that nitrate plume has flown across Baliapanda well field. But, at the same time high nitrate concentration is found along sea beach area and inland area. These places are highly dense with compact residential buildings, hotels and restaurants.
Figure 3: Concentration of nitrate in groundwater in November 2006, mg/l
Figure 4: Concentration of nitrate in groundwater in June 2007, mg/l

12
Increased concentration of nitrate along the beach and inland areas of Puri town may be attributable to infiltration of wastewater from soak pits, septic tanks and leaking drains etc. into groundwater.Sanitation facilities in these areas are on site, mostly septic tank and soak pit system. Owing to sandy ground formation, infiltration rate is very high. After monsoon season, i.e., from November onwards, water table gradually lowers i.e., depth to water table from ground surface increases. Wastewater infiltrating underground can not be diluted and dispersed.
Figure 5: (a) Concentration of iron in November 2006, mg/l (left), and (b) Concentration of iron in June 2007, mg/l (right)
Another water quality parameter of interest from drinking water point of view is iron. In Figure 5,spatial distribution of iron in groundwater after monsoon (i.e., in November 2006) and in summer season (i.e., in June 2007) are given. The concentration of iron (Fe) is found to be more in summer than after monsoon period. The concentration of Na, K and Cl ions also exhibit considerable variations in samples of November 2006 compared to June 2007. The decrease in Fe concentration in November 2006 samples may be explained as effect of dilution by rainfall recharge during monsoon season. Interestingly, iron concentration in two water fields is comparatively less than habitat areas in June 2007 sampling. The presence of iron in Puri groundwater needs to be understood from groundwater recharge catchment and regional flow direction. Geologically, the catchment can be broadly divided into three distinct zones. First is littoral tract, the sandy stretch along sea coast. The second zone adjoins the first zone and is called the plain alluvial tract. The third zone adjoining the alluvial tract is laterite zone. The laterite zone is highly fractured and water bearing. The three zones are also clearly visible on ground surface. From secondary information on ground strata, surface drainage pattern and water levels, it may be inferred that these zones have some effect on groundwater quality.
Bacteriological analysis indicated presence of harmful bacteria in some groundwater samples. In samples of November 2006, total coliform (TC) was observed in one production well from each of the two well fields. In June 2007 samples, TC was found in one production well in Baliapanda well field and four production wells in Chakratirtha well field. Feacal coliform (FC) was found in one production well from both the two well fields. TC and FC were also found in water samples from five water bodies inside the town.
13
3.2 Groundwater modellingThe objective of groundwater modelling study was to simulate the aquifer, understand flow, its direction and simulate salt water intrusion against safe pumping withdrawal from two well fields. The simulation was conducted in Visual MODFLOW Professional software. The study area is considered as a two layer system. The top layer is considered sandy unconfined layer with thickness up to 35 m. The layer below the sand layer is clayey. The soil properties of these two layers taken in the model are as follows (Table 6):
Table 6: Aquifer properties
Layer Kx (m/d)
Ky (m/d)
Kz (m/d)
Porosity (%)
Storage (1/m)
Specific yield (%)
Mixed sand 19.83 19.83 1.983 40 5x10⁻⁵ 30Clay 0.002 0.002 0.0002 50 5x10⁻³ 10Kx, Ky & Kz are coefficients of permeability of groundwater flow in soil medium
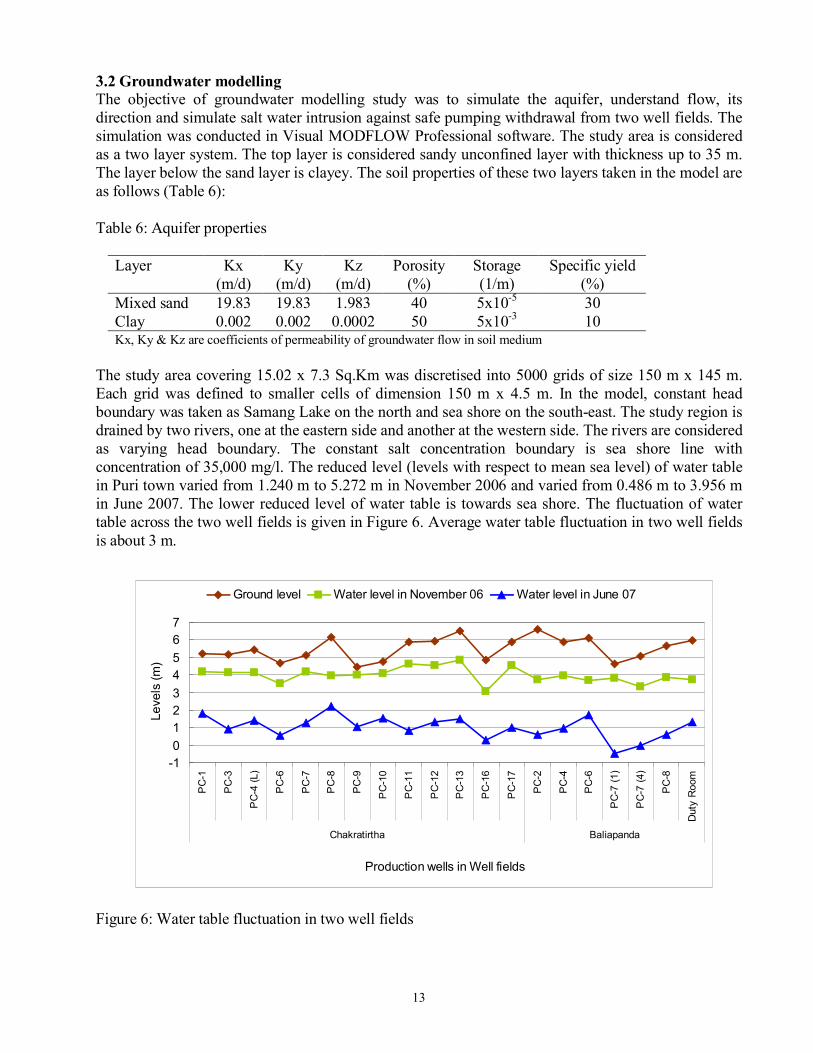
The study area covering 15.02 x 7.3 Sq.Km was discretised into 5000 grids of size 150 m x 145 m. Each grid was defined to smaller cells of dimension 150 m x 4.5 m. In the model, constant head boundary was taken as Samang Lake on the north and sea shore on the south-east. The study region is drained by two rivers, one at the eastern side and another at the western side. The rivers are considered as varying head boundary. The constant salt concentration boundary is sea shore line with concentration of 35,000 mg/l. The reduced level (levels with respect to mean sea level) of water table in Puri town varied from 1.240 m to 5.272 m in November 2006 and varied from 0.486 m to 3.956 m in June 2007. The lower reduced level of water table is towards sea shore. The fluctuation of water table across the two well fields is given in Figure 6. Average water table fluctuation in two well fields is about 3 m.
Figure 6: Water table fluctuation in two well fields
-10
123
45
67
PC
-1
PC
-3
PC
-4 (
L)
PC
-6
PC
-7
PC
-8
PC
-9
PC
-10
PC
-11
PC
-12
PC
-13
PC
-16
PC
-17
PC
-2
PC
-4
PC
-6
PC
-7 (
1)
PC
-7 (
4)
PC
-8
Dut
y R
oom
Chakratirtha Baliapanda
Production wells in Well fields
Le
vels
(m
)
Ground level Water level in November 06 Water level in June 07
14
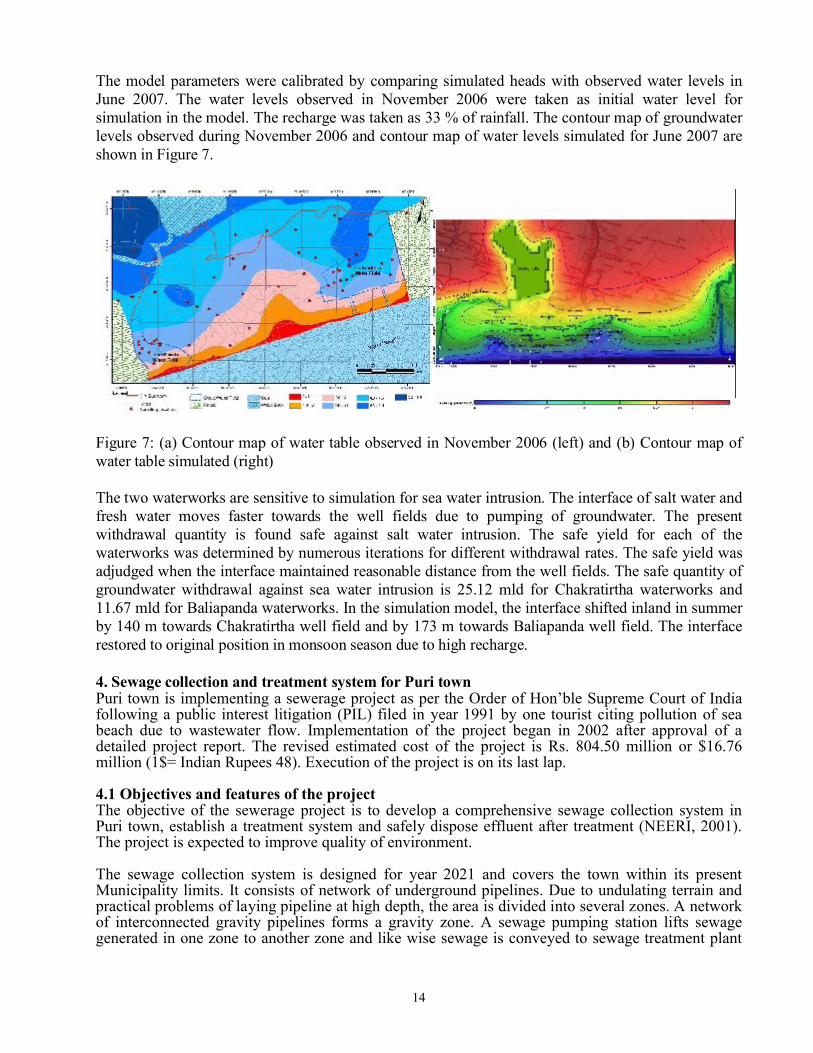
The model parameters were calibrated by comparing simulated heads with observed water levels in June 2007. The water levels observed in November 2006 were taken as initial water level for simulation in the model. The recharge was taken as 33 % of rainfall. The contour map of groundwater levels observed during November 2006 and contour map of water levels simulated for June 2007 areshown in Figure 7.
Figure 7: (a) Contour map of water table observed in November 2006 (left) and (b) Contour map of water table simulated (right)
The two waterworks are sensitive to simulation for sea water intrusion. The interface of salt water and fresh water moves faster towards the well fields due to pumping of groundwater. The present withdrawal quantity is found safe against salt water intrusion. The safe yield for each of the waterworks was determined by numerous iterations for different withdrawal rates. The safe yield was adjudged when the interface maintained reasonable distance from the well fields. The safe quantity of groundwater withdrawal against sea water intrusion is 25.12 mld for Chakratirtha waterworks and 11.67 mld for Baliapanda waterworks. In the simulation model, the interface shifted inland in summer by 140 m towards Chakratirtha well field and by 173 m towards Baliapanda well field. The interface restored to original position in monsoon season due to high recharge.
4. Sewage collection and treatment system for Puri townPuri town is implementing a sewerage project as per the Order of Hon’ble Supreme Court of Indiafollowing a public interest litigation (PIL) filed in year 1991 by one tourist citing pollution of sea beach due to wastewater flow. Implementation of the project began in 2002 after approval of a detailed project report. The revised estimated cost of the project is Rs. 804.50 million or $16.76million (1$= Indian Rupees 48). Execution of the project is on its last lap.
4.1 Objectives and features of the projectThe objective of the sewerage project is to develop a comprehensive sewage collection system in Puri town, establish a treatment system and safely dispose effluent after treatment (NEERI, 2001).The project is expected to improve quality of environment.
The sewage collection system is designed for year 2021 and covers the town within its present Municipality limits. It consists of network of underground pipelines. Due to undulating terrain and practical problems of laying pipeline at high depth, the area is divided into several zones. A network of interconnected gravity pipelines forms a gravity zone. A sewage pumping station lifts sewage generated in one zone to another zone and like wise sewage is conveyed to sewage treatment plant
15
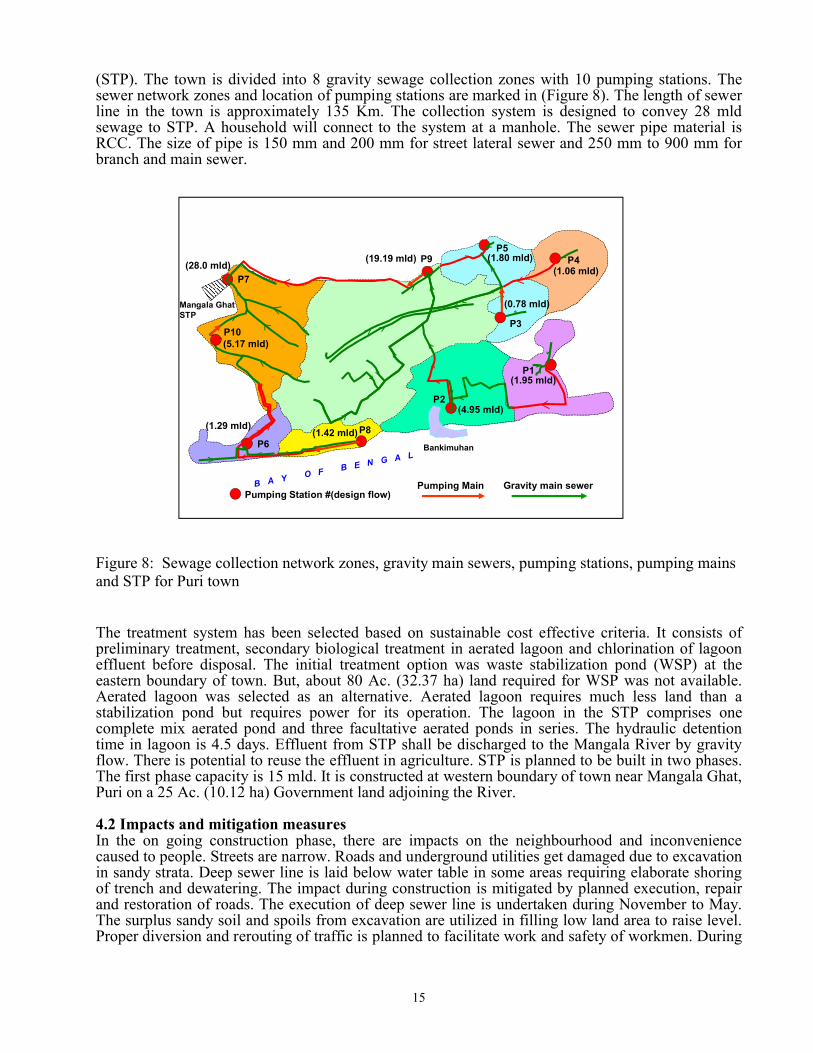
(STP). The town is divided into 8 gravity sewage collection zones with 10 pumping stations. The sewer network zones and location of pumping stations are marked in (Figure 8). The length of sewer line in the town is approximately 135 Km. The collection system is designed to convey 28 mldsewage to STP. A household will connect to the system at a manhole. The sewer pipe material is RCC. The size of pipe is 150 mm and 200 mm for street lateral sewer and 250 mm to 900 mm for branch and main sewer.
Figure 8: Sewage collection network zones, gravity main sewers, pumping stations, pumping mainsand STP for Puri town
The treatment system has been selected based on sustainable cost effective criteria. It consists of preliminary treatment, secondary biological treatment in aerated lagoon and chlorination of lagooneffluent before disposal. The initial treatment option was waste stabilization pond (WSP) at the eastern boundary of town. But, about 80 Ac. (32.37 ha) land required for WSP was not available. Aerated lagoon was selected as an alternative. Aerated lagoon requires much less land than astabilization pond but requires power for its operation. The lagoon in the STP comprises one complete mix aerated pond and three facultative aerated ponds in series. The hydraulic detention time in lagoon is 4.5 days. Effluent from STP shall be discharged to the Mangala River by gravity flow. There is potential to reuse the effluent in agriculture. STP is planned to be built in two phases. The first phase capacity is 15 mld. It is constructed at western boundary of town near Mangala Ghat, Puri on a 25 Ac. (10.12 ha) Government land adjoining the River.
4.2 Impacts and mitigation measuresIn the on going construction phase, there are impacts on the neighbourhood and inconvenience caused to people. Streets are narrow. Roads and underground utilities get damaged due to excavation in sandy strata. Deep sewer line is laid below water table in some areas requiring elaborate shoring of trench and dewatering. The impact during construction is mitigated by planned execution, repair and restoration of roads. The execution of deep sewer line is undertaken during November to May. The surplus sandy soil and spoils from excavation are utilized in filling low land area to raise level. Proper diversion and rerouting of traffic is planned to facilitate work and safety of workmen. During
P6
P8
P7
P2
P1
P4P5
P9
Bankimuhan
B A Y O F B E N G A L
P10P3
Mangala GhatSTP
(1.95 mld)
(4.95 mld)
(0.78 mld)
(1.06 mld)(1.80 mld)
(1.29 mld)
(28.0 mld)
(1.42 mld)
(19.19 mld)
(5.17 mld)
Pumping Main Gravity main sewerPumping Station #(design flow)

16
operation and maintenance phase, electric power failure can cause overflowing of sewer lines due to stoppage of pumps. Standby power generators are provided for each pumping station to meet any such exigencies. The pumping station is wet well type with submersible pumps. A screen is provided before the wet well to prevent choking of pumps by floating matter. Adequate spare parts of pumps and motors as well as sewer maintenance equipments shall enhance reliability of the system.
4.3 Expected outcome and performance criteriaAfter commissioning the system, there will be no need of septic tanks and soak pits in houses as domestic wastewater comprising blackwater originating from toilets and greywater arising from kitchen sinks and bath can be discharged to public sewer. Infiltration of wastewater from soak pits and septic tanks can be reduced with progressive increase in sewer connection and decommissioning of septic tank system. Contamination of groundwater can be minimized. Depending on the number of households and commercial establishments connected to public sewer, it is expected that wastewater flow in drain and its organic load will reduce progressively. With reduction of wastewater flow in drains, dry weather flow to Bankimuhan wastewater plant, located on sea shore,shall reduce. Performance of the sewerage system can be adjudged from three criteria such as quantity of sewage flowing to STP (aerated lagoon), quality parameters of treated effluent (such as BOD and feacal coliform), i.e., efficiency of treatment and quantity of dry weather flow in Bankimuhan wastewater treatment plant.
4.4 Sustainability measuresIn order to make the ongoing sewerage project sustainable, some steps are contemplated. These are:
Awareness building among the public by deploying NGOs, local intelligentsia etc. Legislation for connecting domestic wastewater to public sewer compulsory. Levy of user charges. Training of technical and maintenance staff.
All efforts are being made to make it a model project in the State.
Acknowledgement:The results of laboratory analysis and modelling described in this paper were carried out at National Environmental Engineering Research Institute (NEERI), Nagpur, India. The study was sponsored by the Orissa Water Supply and Sewerage Board. The author is part of the study team.
References:ASCI. (2008). 24/7 Water Supply to Puri City. Detailed Project Report (Draft). Administrative Staff College of India, Hyderabad, India, 2008.
GTZ-ASEM. (2008). EcoCity Project - Pilot Efforts on Achieving Action in Waste Management. GTZ-ASEM, July 2008.
IPCC, AR4, WGIII. (2007). Summary for Policymakers of the Synthesis Report of the IPCC Fourth Assessment Report, Draft Copy, 16 Nov 2007-subject to final edit.
INARE. (2008). Technical final report of the project “Solid Waste Management in Puri: a Euro-Asia Cooperation” at final Conference “A clean city for healthy citizens”, INARE, March, 2008. (www.indiapuriproject.eu).
17
Lundin, M. (1999). Assessment of the environmental sustainability of urban water systems. Department of Technical Environmental Planning, Chalmers University of Technology, Göteborg, Sweden.
Lundin, M., and Morrison, G.M. (2002). A life cycle assessment based procedure for development of environmental sustainability indicators for urban water systems. Urban water, 4, 145-152.
Mohapatra, P.K., Siebel M.A., Gijzen H.J., Van der Hoek J.P., and Groot, C. (2002). Improving eco-efficiency of Amsterdam water supply - a LCA approach. Journal of Water Supply: Research and Technology – Aqua, 51 (4), 217-227.
Morrison, G., Fatoki, OS., Zinn, E., and Jacobsson, D. (2001). Sustainable development indicators for urban water systems: a case study evaluation of King William’s Town, South Africa, and the applied indicators. Water SA, 27(2), 219-232.
NEERI. (1995). Wastewater Management in Puri Township (Orissa). NEERI, Nagpur, India, February1995.
NEERI. (2001). Sewage Collection and Treatment Systems for Puri. (Final Report). NEERI, Nagpur, India, October 2001.
NEERI. (2008). Study of Groundwater Aquifer System at Jagannath Puri and its Protection from Contamination. (Final Report). NEERI, Nagpur, India, April 2008.
Sahely, H.R., Kennedy, C.A., and Adams, B.J. (2005). Developing sustainability criteria for urban infrastructure systems. Can. J. Civ. Eng. 32, 72-85.
Samantasinghara, L. (2008). Solid Waste Management in Puri Town. PhD Thesis, Utkal University, India, 2008.
Tapia, M., Siebel, M.A., van der Helm, A.W.C., Baars, E.T., and Gijzen, H.J. (2008). Environmental, financial and quality assessment of drinking water processes at Waternet. Journal of Cleaner Production, 16, 401-409.
Vince, F., Aoustin, E., Bréant, P., and Marechal, F. (2008). LCA tool for the environmental evaluation of potable water production. Desalination, 220, 37–56.