Environmental Impact Assessment of Thai Minced Fish Paste ...
17
137 Environmental Research, Engineering and Management 2020/76/3 Environmental Impact Assessment of Thai Minced Fish Paste (Surimi) Using Life Cycle Assessment Methodology EREM 76/3 Journal of Environmental Research, Engineering and Management Vol. 76 / No.3 / 2020 pp. 137–153 DOI 10.5755/j01.erem.76.3.21928 Environmental Impact Assessment of Thai Minced Fish Paste (Surimi) Using Life Cycle Assessment Methodology Received 2018/10 Accepted after revision 2020/08 http://dx.doi.org/10.5755/j01.erem.76.3.21928 *Corresponding author: [email protected] Phairat Usubharatana, Harnpon Phungrassami* Excellence Centre of Eco-Energy, Chemical Engineering Department, Thammasat School of Engineering, Thammasat University, Pathumthani, Thailand Environmental impacts of fishery production have resulted in increased concern and awareness. Thailand, as one of the largest global fish exporters, faces challenges related to environmental problems caused by fish- ery processes. Here, the environmental impact of Thai surimi production was estimated based on life cycle assessment (LCA) methodology, focusing specifically on two Thai surimi products made from goatfish and ponyfish caught within the southern region of Thailand. Three impact categories where explored: global warm- ing, acidification and eutrophication. Life cycle impacts were calculated for one kg of product using both mass and economic allocations. Results of this study indicated that goatfish has lower impacts than ponyfish for all the impact categories. Fuel consumption during the fishery phase and electricity consumption during process- ing were the main parameters leading to most of the considered environmental impacts. The value of Global Warming Potential(GWP) ranged within 1.3–3.0 kg CO 2 eq for goatfish and 2.2–7.1 kg CO 2 eq ponyfish depending on the allocation method. The acidification impact of goatfish and ponyfish were revealed at 3.2–7.3 gSO 2 eq and 12.7–39.7 gSO 2 eq, respectively. The eutrophication of goatfish and ponyfish were 0.7–1.6 gPO 4 eq and 2.5–8.1 gPO 4 eq, respectively. Sensitivity analysis of fuel consumption, electricity consumption, product yield and allo- cation method were evaluated. Keywords: fishery, global warming, life cycle assessment, surimi.
Transcript of Environmental Impact Assessment of Thai Minced Fish Paste ...

137Environmental Research, Engineering and Management 2020/76/3
Environmental Impact Assessment of Thai Minced Fish Paste (Surimi) Using Life Cycle Assessment Methodology
EREM 76/3Journal of Environmental Research, Engineering and ManagementVol. 76 / No.3 / 2020pp. 137–153DOI 10.5755/j01.erem.76.3.21928
Environmental Impact Assessment of Thai Minced Fish Paste (Surimi) Using Life Cycle Assessment Methodology
Received 2018/10 Accepted after revision 2020/08
http://dx.doi.org/10.5755/j01.erem.76.3.21928
*Corresponding author: [email protected]
Phairat Usubharatana, Harnpon Phungrassami*Excellence Centre of Eco-Energy, Chemical Engineering Department, Thammasat School of Engineering, Thammasat University, Pathumthani, Thailand
Environmental impacts of fishery production have resulted in increased concern and awareness. Thailand, as one of the largest global fish exporters, faces challenges related to environmental problems caused by fish-ery processes. Here, the environmental impact of Thai surimi production was estimated based on life cycle assessment (LCA) methodology, focusing specifically on two Thai surimi products made from goatfish and ponyfish caught within the southern region of Thailand. Three impact categories where explored: global warm-ing, acidification and eutrophication. Life cycle impacts were calculated for one kg of product using both mass and economic allocations. Results of this study indicated that goatfish has lower impacts than ponyfish for all the impact categories. Fuel consumption during the fishery phase and electricity consumption during process-ing were the main parameters leading to most of the considered environmental impacts. The value of Global Warming Potential(GWP) ranged within 1.3–3.0 kg CO2eq for goatfish and 2.2–7.1 kg CO2eq ponyfish depending on the allocation method. The acidification impact of goatfish and ponyfish were revealed at 3.2–7.3 gSO2eq and 12.7–39.7 gSO2eq, respectively. The eutrophication of goatfish and ponyfish were 0.7–1.6 gPO4eq and 2.5–8.1 gPO4eq, respectively. Sensitivity analysis of fuel consumption, electricity consumption, product yield and allo-cation method were evaluated.
Keywords: fishery, global warming, life cycle assessment, surimi.

Environmental Research, Engineering and Management 2020/76/3138
IntroductionThe food industry is fundamental to the Thai economy with abundant resources delivering huge revenues to the nation in terms of foreign exchange exports. In 2016, the Thai fishery industry recorded a captured production of 1.5 million tonnes and was ranked 14th with 2% of the worldwide gross. Moreover, Thailand was also ranked no. 4 among fishery exporters with a total value of 6 billion USD after China, Norway and Vietnam (FAO, 2016), emphasizing its position as a leading fishery exporting country.
There are approximately 1,300 fish processing plants throughout Thailand including freezing plants, canning plants, fish disposed of in sauce, steaming, smoking, salted fish, dried shrimp, dried squid and dried shell-fish (Department of Fisheries, 2016). Total catches of marine and freshwater fish in 2016 were 1.08 and 0.57 million tonnes, respectively (Department of Fisheries, 2016). The fish processing industry is well known for high water consumption (Ferraciolli et al., 2017) and use of a wide variety of resources including fuel and electricity, which result in environmental impacts. In addition, following regulations for pollution control and environmental awareness by fish processing plants will reduce impact on the environment. Hos-pido et al. (2006) assessed the environmental impact of canned tuna production to identify the most signifi-cant contributor and improve the production process, while Thrane et al. (2009) focused on cleaner produc-tion in the fish processing industry. Results indicated significant environmental impacts related to the life cycle stages after landing the fish, including process-ing, transport, cooling and packaging. Morrissey and Tan (2000) claimed that surimi processing was re-sponsible for a massive scale for wastewater and sol-id wastes pollution. Both direct and indirect impacts of fishing operation, including extraction, transformation of natural materials and fossil fuels, are considered as environmental inventory (Avadi and Freon, 2013).
These negative impacts caused by fisheries have in-creased environmental awareness among consumers (Arvanitoyannis and Kassaveti, 2008). Entrepreneurs, therefore, have to set the highest priority to realize solutions for these pollution aspects using effective
tools such as life cycle assessment (LCA) to compe-tently address the problem (Henriksson, 2012). Moreo-ver, LCA can be used as a support tool for policy-mak-ers and used for benchmarking (Irabarren et al., 2010). LCA was applied to quantify the environmental im-pacts of seafood production systems by Ziegler et al. (2016). This methodology could provide a comprehen-sive evaluation of the environmental implications of fisheries management (Hornborg et al., 2012).
LCA is now increasingly applied to analyze green-house gas emissions associated with the seafood supply chain (Pelletier and Tyedmers, 2008; Thrane, 2009; Parker, 2012). The greenhouse gas emission from fisheries is an important issue due to Cancun Agreements Mexico in 1992, the Kyoto protocol in 2005 (Hyun-young et al., 2017) and the Paris Climate Change Accord in 2015 (Jaehyun et al., 2019). It was estimated that the greenhouse gas emissions from fisheries constitutes around 2.5% of global emission (Garnett, 2011). Therefore, this study focused on envi-ronmental impacts, especially greenhouse gas emis-sions of the processed seafood derived from surimi production in Thailand at around 90,000 tonnes per year and considered as the highest quality in South-east Asia (Guenneugues and Ianelli, 2014). Surimi is a Japanese word meaning a fillet which is cleaned and dehydrated while maintaining the existing protein and subsequently converted to other products (Arvani-toyannis and Kassaveti, 2008; Shaviklo and Rafipour, 2013), such as kamaboko, chikuwa, fish sausages and fish balls (Kaewudom, 2013). Despite an increas-ing number of LCA case studies related to fisheries and aquaculture products, including Avadi and Fre-on (2013), the focus has been limited to the study of specific species such as Atlantic cod, Atlantic salmon and rainbow trout (Parker, 2012) or mackerel (Iribar-ren et al., 2011; Vazques-Rowa et al., 2010). Moreo-ver, most LCA fishery studies were conducted in the Northeast Atlantic (Thrane, 2006; Vazques-Rowa et al., 2010) or Eastern Central Atlantic (Vazques-Rowa et al., 2012). Most of them summarized that fishing operation was the main environmental impact, espe-cially fuel production, transportation and consump-tion of the fishing. To reduce fuel intensity, some

139Environmental Research, Engineering and Management 2020/76/3
authors recommended changing the type of fishing gear (Thrane, 2006). Later, Laso et al. (2018) evalu-ated global warming potential of anchovy fishing in northern Spain. Results indicated that the production, transportation and use of diesel were the main envi-ronmental hotspots, especially in relation to the glob-al warming impact. One interesting result was studied by Ziegler et al. (2018). They analyzed the variability in environmental impacts of cod, haddock, saithe and shrimp in the Norwegian Sea. The crucial result was that no significant difference was observed in fuel use between years, but variability was within a year due to a difference catch rate. Although many researchers studied on the environmental impacts of fishery using LCA, none demonstrate thorough research concern-ing LCA or emission of greenhouse gases with regard to surimi production in Southeast Asia.
Therefore, here, goatfish and ponyfish as fish used for processing into surimi were evaluated using LCA meth-odology, focusing on the estimation of environmental impacts per kg of surimi, identification of hotspots in the surimi production chain and a sensitivity analysis to determine possible diverse variation parameters which potentially deliver high impact on the overall results.
MethodsLCA is a tool used to assess the environmental im-pacts of a specific product by considering the amount of resources consumed and the emissions to the receiving environment at all stages of its life cycle (Guinee et al., 2001). Evaluation is based on a system-atic way to study the likely environmental impacts of a product or a service from cradle to grave (Reckmann et al., 2012). According to ISO standards, ISO14040, LCA study has four phases as (1) goal and scope defi-nition, (2) life cycle inventory analysis, (3) life cycle impact assessment and (4) interpretation (ISO, 2006). Here, an attributional LCA approach was applied, fo-cusing on analysis of the environmental impacts from a product, a process or a system (Rehl et al., 2012).
Goal and scope definitions
The first phase of LCA is to define the goal and scope of the study. These include an objective, a functional
unit and a system boundary of work to be performed. The objectives of this study were to 1) collect invento-ry data of Thai surimi and 2) understand and evaluate environmental emissions of Thai surimi production caused by different elements throughout the process. These two objectives were achieved using LCA meth-odology. Analyses focused on estimating the cradle to gate life cycle contributions to global warming, acidification and eutrophication. Two types of suri-mi were investigated, namely goatfish and ponyfish. Emissions from each were compared based on the different processing plants. Hotspot identification of surimi processing areas was also discussed. Results are intended for use by fishing companies and sea-food industries using surimi as a raw material as well as LCA practitioners and other interested organisa-tions or individuals.
According to International Standard 14040 (ISO, 2006), the functional unit is the quantified performance of a product system for use as a reference unit in an LCA study and provides the basis on which alternative products or processes can be compared and analysed (Rebitzer et al., 2004). All the environmental indica-tors are calculated on the basis of a single functional unit (Aubin et al., 2009). Fisheries managers may be interested in the impacts per live tonne of fish landed, while seafood retailers may be more interested in the impacts of packaged sale ready fillets (Parker, 2012). Moreover, the functional unit can also be assessed in terms of per mass, while others may prefer in per pro-tein or per energy (Parker and Tyedmers, 2012). The most common functional unit for fishery case studies was a given mass of fillets (Parker, 2012). Therefore, the functional unit based on the interested impact and goal of this study was set at 1 kg of surimi.
The allocation method is a common discussion as-pect. Many researchers, especially regarding aquacul-ture, applied an economic based allocation (Iribarren et al., 2011; Ziegler et al., 2011), while others interest-ed in fisheries mostly applied a mass based allocation (Ellingsen and Aanondsen, 2006; Vazques-Rowe et al., 2010; Vazques-Rowe et al., 2012). ISO14040 series (ISO, 2006) recommends avoiding allocation by split-ting the processes or system expansion; however, splitting the processes is not possible for the fishing phase because the fish are caught in similar places
Environmental Research, Engineering and Management 2020/76/3140
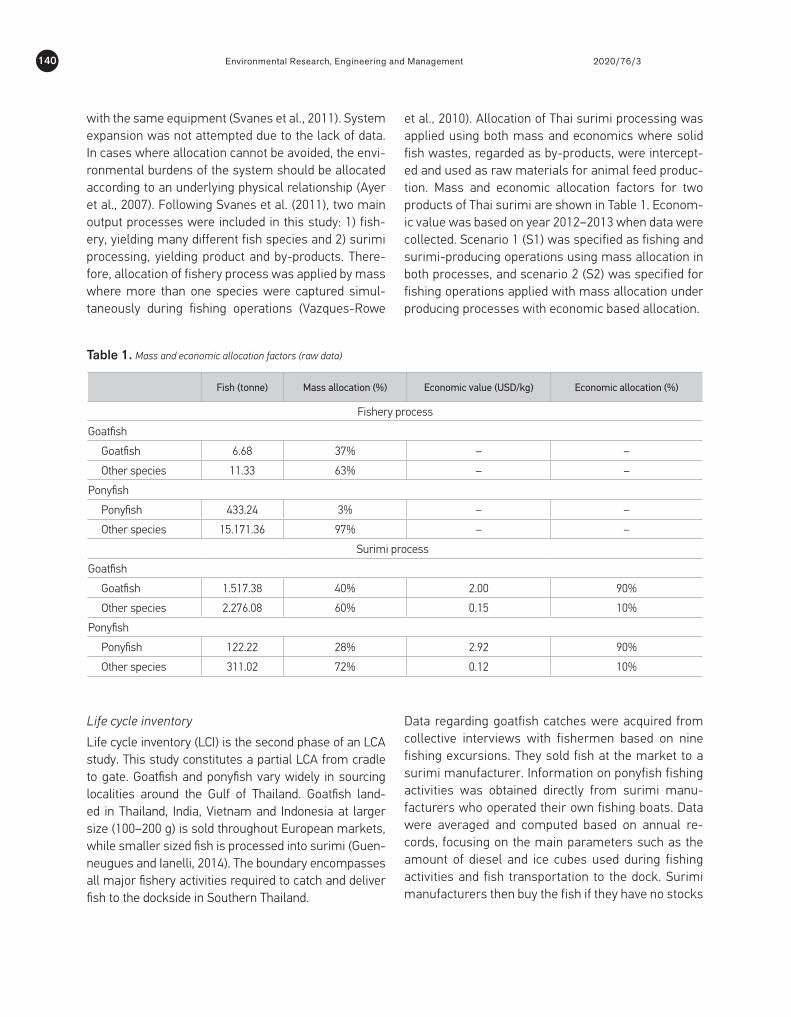
with the same equipment (Svanes et al., 2011). System expansion was not attempted due to the lack of data. In cases where allocation cannot be avoided, the envi-ronmental burdens of the system should be allocated according to an underlying physical relationship (Ayer et al., 2007). Following Svanes et al. (2011), two main output processes were included in this study: 1) fish-ery, yielding many different fish species and 2) surimi processing, yielding product and by-products. There-fore, allocation of fishery process was applied by mass where more than one species were captured simul-taneously during fishing operations (Vazques-Rowe
et al., 2010). Allocation of Thai surimi processing was applied using both mass and economics where solid fish wastes, regarded as by-products, were intercept-ed and used as raw materials for animal feed produc-tion. Mass and economic allocation factors for two products of Thai surimi are shown in Table 1. Econom-ic value was based on year 2012–2013 when data were collected. Scenario 1 (S1) was specified as fishing and surimi-producing operations using mass allocation in both processes, and scenario 2 (S2) was specified for fishing operations applied with mass allocation under producing processes with economic based allocation.
Fish (tonne) Mass allocation (%) Economic value (USD/kg) Economic allocation (%)
Fishery process
Goatfish
Goatfish 6.68 37% – –
Other species 11.33 63% – –
Ponyfish
Ponyfish 433.24 3% – –
Other species 15.171.36 97% – –
Surimi process
Goatfish
Goatfish 1.517.38 40% 2.00 90%
Other species 2.276.08 60% 0.15 10%
Ponyfish
Ponyfish 122.22 28% 2.92 90%
Other species 311.02 72% 0.12 10%
Table 1. Mass and economic allocation factors (raw data)
Life cycle inventory
Life cycle inventory (LCI) is the second phase of an LCA study. This study constitutes a partial LCA from cradle to gate. Goatfish and ponyfish vary widely in sourcing localities around the Gulf of Thailand. Goatfish land-ed in Thailand, India, Vietnam and Indonesia at larger size (100–200 g) is sold throughout European markets, while smaller sized fish is processed into surimi (Guen-neugues and Ianelli, 2014). The boundary encompasses all major fishery activities required to catch and deliver fish to the dockside in Southern Thailand.
Data regarding goatfish catches were acquired from collective interviews with fishermen based on nine fishing excursions. They sold fish at the market to a surimi manufacturer. Information on ponyfish fishing activities was obtained directly from surimi manu-facturers who operated their own fishing boats. Data were averaged and computed based on annual re-cords, focusing on the main parameters such as the amount of diesel and ice cubes used during fishing activities and fish transportation to the dock. Surimi manufacturers then buy the fish if they have no stocks

141Environmental Research, Engineering and Management 2020/76/3
Fig. 1. Surimi processing
and take them to the manufacturing plant, assumed to be 5 km away.
The surimi production process is shown in Fig. 1 and comprises the following: (1) material receipt, wash-ing, de-heading and gutting processes; (2) fish clean-ing in cold water and ice to maintain fish temperature and retain the freshest quality; (3) fish classification to debone and produce fish fillets (using too much strength during this process may cause dull colour of the fillets as colours of the internal organs may stick to them); (4) surimi cleaning and leaching to eliminate
undesired protein, fat, blood and other contaminants or grinding the fish meat using 20–30% concentrated saline water; (5) dehydration of the fish meat using a hydraulic filter press; (6) removal of dish scales, skin and bone (the surimi is passed through a refiner with a high-speed centrifuge to separate the soft white fish meat using a fine sieve); (7) packing and freezing (the refined minced fish meat is packed in polyeth-ylene-plastic bags and stored in freezers at –20oC). Fish waste is processed into animal food, priced as in Table 1.
Fishery Chilled and washed in iced water Deheading and gutting
(1)(1)
(2)Washed in iced water
(3)Deboning
(4)Leaching
(5)DehydrationStrainer/Refiner
Mixing Packing Cold Storage
(1)
(6)
(1)(7)
Impact assessment
After collection in the life cycle inventory phase, con-sumption and emission data were calculated for each of the environmental impact categories. Analysis focused on the life cycle contributions to the glob-al warming potential (GWP), acidification potential (AP) and eutrophication potential (EP). These three potentials were measured in carbon dioxide equiva-lent or CO2 eq, sulphur dioxide equivalent or SO2 eq and phosphate equivalent or PO4 eq, respectively. The method used for environmental characteriza-tion followed CML2001 (Guinee et al., 2001) as the most common characterization model (Parker, 2012).
Emissions associated with production of Thai surimi were quantified as:
Ex = �(Ai × EFx,i)n
i=1
(1)
Where: Ex is environmental impact x (index for impact category: global warming, acidification, eutrophica-tion); Ai is activity data in the fisheries and surimi processing as shown in Tables 2 and 3; EFx,i is the emission factor for x impact category due to activity i in each process.

Environmental Research, Engineering and Management 2020/76/3142
Results and DiscussionLife cycle inventory (LCI)
Results from the LCI study are summarised in Tables 2 and 3 as activity data and sources. Inventory data were divided into two subsystems: fishery activities and surimi processing. Fishery activities included fish catching, ice processing and fuel oil. The painting process as maintenance was not included due to the lack of data. Ziegler et al. (2003) maintained that the painting process was negligible with a very low con-tribution to environmental impacts. Surimi process-ing activities as previously discussed offer interesting
energy consumption in both the fishery and process-ing phases. For energy consumption, only direct elec-tricity and direct energy uses were taken into account.
According to Fig. 2, diesel consumption during fish catching and electricity use during surimi process-ing were the highest values. By contrast, values dur-ing fish transportation from dock to factory were the lowest. During fish catching, 1 kg of goatfish used 1.12×10⁻⁴ tonne oil equivalent (TOE) (S1) and 2.51×10⁻⁴ TOE (S2), equal to 48% of the total life cycle energy used. In terms of the manufacturing process, goatfish
Phase Parameter Value Data sources
Fishery
Fuel consumption 1.082×10⁻¹ kg of diesel per kg caught fish *
Ice 4.864×10⁻² kg per kg caught fish *
Electricity 8.848×10⁻³ kWh per kg ice *
Ammonia 2.807×10⁻⁵ kg per kg ice *
Sodium chloride 5.603×10⁻⁴ kg per kg ice *
Paint Not available data **
Catch 4 main species Threadfin Bream; 25%, Lizard; 30%, Goatfish; 37%, and others; 8%
*
Surimi processing
Processing yield Surimi; 40%, by product; 60% ***
Transportation of goatfish 3.224×10⁻³ tkm per kg surimi ****
Electricity 1.974 kWh per kg surimi ***
Ice 2.141 kg per kg surimi ***
Sugar 5.600×10⁻² kg per kg surimi ***
Chemical consumption All in kg of surimiPhosphate; 2.200×10⁻³ kg, Acetic acid 1.000×10⁻⁴ kg,Salt; 2.900×10⁻³ kg, Chlorine; 1.000×10⁻⁴ kg, Ammonia; 1.000×10⁻⁴ kg, CaCO3; 5.000×10⁻⁴ kgSodium hypochlorite; 7.300×10⁻³ kg
***
Water 5.000×10⁻² m3per kg surimi ***
Wastewater 5.060×10⁻² m3per kg surimi ***
Utility: wastewater treatment
Electricity; 5.074 kWh per m3 treated wastewater ***
Table 2. Inputs and outputs of the goatfish surimi supply chain
* Fishing company with catch records; average from nine fishing excursions (primary data of this present research)** Presumed to be negligible according to LCA results of Ziegler et al. (31)*** Average from 1 year collected data from a surimi processing company (primary data of this present research)**** Distance collected from a surimi processing company (primary data of this present research)

143Environmental Research, Engineering and Management 2020/76/3
Phase Parameter Value Data sources
Fishery
Fuel consumption 5.547×10⁻¹ kg of diesel per kg caught fish *
Ice 9.017×10⁻³ kg per kg caught fish *
Electricity 7.951×10⁻³ kWh per kg ice *
Sodium chloride 4.274×10⁻⁴ kg per kg ice *
NaOCl 6.480×10⁻⁵ kg per kg ice *
Paint No available data **
Catch Ponyfish; 3%, others; 97% *
Surimi processing
Processing yield Surimi; 28%, by-products; 72% *
Transportation of ponyfish 1.772×10⁻² tkm per kg surimi ***
Electricity 9.343×10⁻² kWh per kg surimi *
Ice 2.184×10⁻² kg per kg surimi *
Chemical consumption Ammonia; 4.664×10⁻⁴ kg per kg surimi *
Water 4.860×10⁻² m3 per kg surimi *
Wastewater 4.862×10⁻² m3 per kg surimi *
Utility: cool water processing
Electricity; 7.951 kWh per m3, Salt; 4.274×10⁻¹ kg per m3, ***
water; 1.142 m3 per m3 * ***
Utility: wastewater treatment
Electricity; 6.789×10⁻¹ kWh per m3 treated wastewater *
Table 3. Inputs and outputs of the ponyfish surimi supply chain
*Average from 1 year collected data from a surimi processing company (primary data of this present research)** Presumed to be negligible according to LCA results of Ziegler et al. (31)*** Distance collected from a surimi processing company (primary data of this present research)
surimi consumed 1.23×10⁻⁴ TOE (S1) and 2.77×10⁻⁴ TOE (S2), or 52% of the total life cycle energy used. For ponyfish surimi, fish catching consumed most energy or up to 5.75×10⁻⁴ TOE (S1) and 1.84×10⁻⁴ TOE (S2) with diesel as the greatest contributor, equiva-lent to 98% of the total life cycle energy used. In other words, ponyfish surimi exerted 2.5 times more energy than goatfish surimi in scenario 1 and 3.5 times less in scenario 2 because goatfish can be caught close to the shore. However, most energy consumption during surimi processing resulted from electricity used in the freezing system, ice and cold water production as well as the freezing process. Results showed that 14 times
less energy was required to produce ponyfish surimi than to produce goatfish surimi in scenario 1 and the figure was 10 times lower in scenario 2, equivalent to electricity consumption during processing at 1.90 kWh per kg for goatfish surimi and 0.09 kWh per kg for pon-yfish surimi. This was because manufacturing of pon-yfish surimi ran as a modern continuous process with sophisticated and efficient strategic procurement of raw materials whereas goatfish surimi manufacture relied on a batch process, causing system inconsistencies and requiring more energy. In addition, goatfish surimi en-trepreneurs did not have their own fishing boats, which increased complications in process planning.

Environmental Research, Engineering and Management 2020/76/3144
Fig. 2. Energy use in life cycle per kilogram of surimi (unit: 10-9 TOE)
1
10
100
1000
10000
100000
1000000
10000000
Ice production(Fishery process)
Ice production(Surimi
processinc)
Surimiprocessing
Wastewatertreatment
Diesel (Fisheryprocess)
Diesel(Transportation)
Goatfish surimi: S1 Goatfish surimi: S2 Ponyfish surimi: S1 Ponyfish surimi: S2
Life cycle impact assessment
Three impacts were studied as global warming (GWP), acidification (AD) and eutrophication (EP). These fac-tors are commonly assessed by LCA and widely used for aquatic product processing (Henriksson et al., 2012). Following the principle of environmental impact assessment, the acquired LCI values were
computed and converted into scales of environmental impacts. CML2001 was used as the characterization model. The main results from LCA of the two prod-ucts are summarized in Table 4. Tables 5 and 6 pres-ent emissions of selected pollutants in each impact category. Fish waste from surimi processing is sold as animal food; therefore, allocation is essential.
Table 4. Life cycle impact assessment results
Goatfish surimi Ponyfish surimi
Unit Scenario 1 Scenario 2 Scenario 1 Scenario 2
Global warming g CO2 eq 1330.94 2983.15 2230.60 7141.75
Acidification g SO2 eq 3.25 7.28 12.62 39.66
Eutrophication g PO4 eq 0.73 1.64 2.55 8.10

145Environmental Research, Engineering and Management 2020/76/3
Tabl
e 5.
Em
issi
ons
of s
elec
ted
pollu
tant
s ge
nera
ted
from
pro
duct
ion
of 1
kg
goat
fish
surim
i
Impa
ctU
nit
Tota
l
Emis
sion
s
From
fish
ery
phas
eFr
om
tran
spor
tatio
n
From
sur
imi p
roce
ssin
g
Die
sel
Ice
Elec
tric
ityCh
emic
als
and
wat
er tr
eatm
ent
Ice
Was
tew
ater
tr
eatm
ent
S1S2
S1S2
S1S2
S1S2
S1S2
S1S2
S1S2
S1S2
Glo
bal w
arm
ing
CO2
g13
09.2
229
34.4
640
5.45
908.
780.
270.
600.
040.
0986
6.92
1943
.10
25.6
257
.43
4.69
10.5
16.
2313
.96
CH4
g0.
611.
370.
511.
150.
000.
000.
000.
000.
050.
120.
050.
110.
000.
000.
000.
00
N2O
g0.
030.
060.
010.
030.
000.
000.
000.
000.
010.
030.
000.
010.
000.
000.
000.
00
Aci
dific
atio
n
SO2
g0.
471.
040.
310.
690.
000.
000.
030.
070.
000.
000.
120.
270.
000.
000.
000.
00
NO x
g5.
3411
.96
4.08
9.14
0.00
0.00
0.00
0.00
1.17
2.62
0.08
0.17
0.01
0.01
0.01
0.02
NH
3g
0.01
0.03
0.00
0.00
0.00
0.00
0.00
0.00
0.00
0.00
0.01
0.03
0.00
0.00
0.00
0.00
Eutr
ophi
catio
n
PO4
g0.
030.
070.
000.
000.
000.
000.
000.
000.
000.
000.
030.
070.
000.
000.
000.
00
NO x
g5.
3411
.96
4.08
9.14
0.00
0.00
0.00
0.00
1.17
2.62
0.08
0.17
0.01
0.01
0.01
0.02
NH
3g
0.01
0.03
0.00
0.00
0.00
0.00
0.00
0.00
0.00
0.00
0.01
0.03
0.00
0.00
0.00
0.00

Environmental Research, Engineering and Management 2020/76/3146
Tabl
e 6.
Em
issi
ons
of s
elec
ted
pollu
tant
s ge
nera
ted
from
pro
duct
ion
of 1
kg
pony
fish
surim
i
Impa
ctU
nit
Tota
l
Emis
sion
s
From
fish
ery
phas
eFr
om
tran
spor
tatio
n
From
sur
imi p
roce
ssin
g
Die
sel
Ice
Elec
tric
ityCh
emic
als
and
wat
er tr
eatm
ent
Ice
Was
tew
ater
tr
eatm
ent
S1S2
S1S2
S1S2
S1S2
S1S2
S1S2
S1S2
S1S2
Glo
bal w
arm
ing
CO2
g21
52.4
368
91.4
720
79.2
566
57.1
92.
217.
080.
060.
2015
.97
51.1
448
.69
155.
880.
511.
655.
7318
.33
CH4
g2.
648.
462.
638.
410.
000.
010.
000.
000.
000.
000.
010.
030.
000.
000.
000.
00
N2O
g0.
060.
190.
060.
190.
000.
000.
000.
000.
000.
000.
000.
000.
000.
000.
000.
00
Aci
dific
atio
n
SO2
g1.
785.
141.
595.
090.
010.
020.
000.
000.
000.
000.
180.
030.
000.
000.
000.
00
NO x
g21
.12
67.2
820
.91
66.9
60.
000.
010.
000.
000.
020.
070.
170.
220.
000.
000.
010.
02
NH
3g
0.01
0.00
0.00
0.00
0.00
0.00
0.00
0.00
0.00
0.00
0.01
0.00
0.00
0.00
0.00
0.00
Eutr
ophi
catio
n
PO4
g0.
010.
010.
000.
010.
000.
000.
000.
000.
000.
000.
010.
000.
000.
000.
000.
00
NO x
g21
.92
69.8
519
.44
62.2
30.
000.
010.
000.
000.
020.
072.
457.
500.
000.
000.
010.
02
NH
3g
0.01
0.00
0.00
0.00
0.00
0.00
0.00
0.00
0.00
0.00
0.01
0.00
0.00
0.00
0.00
0.00

147Environmental Research, Engineering and Management 2020/76/3
Goatfish surimi possessed the global warming poten-tial at 1.33 kg CO2 eq per kg (S1) and 2.98 kg CO2 eq per kg (S2). Change from mass allocation to economic al-location resulted in an increase of the global warming potential at up to 124% since the ratio for mass allo-cation was only 40% while that of economic alloca-tion was 90%. Similarly, acidification potential also in-creased from 3.25 g SO2 eq per kg of goatfish surimi to 7.28 g SO2 eq per kg of goatfish surimi with eutrophi-cation up from 0.73 g PO4 eq per kg of goatfish surimi to 1.64 g PO4 eq per kg of goatfish surimi. For ponyfish surimi, change of mode from mass allocation at 28% to economic allocation at 90% resulted in an increase of all three impact categories similar to goatfish suri-mi. Results after altering allocation methods were variable, depending on prices and proportions of the acquired yield. For ponyfish surimi as very small fish, yields were low. Using mass allocation, impacts are allotted to a waste rather than a product and the price of a product is much more than that of a waste when based only on economic allocation as shown in Table
0%
10%
20%
30%
40%
50%
60%
70%
80%
90%
100%
GWP AP EP
Wastewater treatment
Ice
Chemicals and water treatment
Electricity
Transportation
Fishery
1. Results concurred with Svanes et al. (2011a) and Svanes et al. (2011b) who determined increased envi-ronmental impacts as a result of economic allocation. Ayer et al. (2007) pointed out that economic allocation consistently varied and did not reflect actual flows of energies and materials.
Figs. 3–4 show percentage contributions of 6 process-es and activities to potential environmental impacts. Table 5 and Fig. 3 show electricity used in goatfish surimi processing as an important source of pollut-ants and environmental impacts at 65% of the global warming potential with 18% from acidification and 21% from eutrophication. In the fishery process, con-tribution percentages of global warming, acidification and eutrophication were 32%, 74% and 73%, respec-tively. The major parameter during fish catching was the consumption of diesel, which concurred with re-search by Vazques-Rowe et al. (2010) and Ziegler et al. (2016). Ice production and wastewater treatment processes presented very low percentages, ranging within 0.1–0.5%.
Fig. 3. Contribution of different phases of goatfish surimi production

Environmental Research, Engineering and Management 2020/76/3148
Fig. 4. Contribution of different phases of ponyfish surimi production
For production of ponyfish surimi (Table 6 and Fig. 4), the fish catching process resulted in 97% of the global warming potential, 97% acidification and 88% eutrophi-cation. The underlying parameter was diesel. However, during manufacturing activities, the potential only ranged within 0.02–2.20% for the total global warming potential, 0.003–2.48% for acidification and 0.003–11.62% for eu-trophication. The main contributor in this case, was the use of chemicals and water production, which are cru-cial to seafood processing plants for material, equipment and machine cleansing, including the production of cold water and ice. Each activity requires different types of wa-ter, such as normal room temperature water for general
use but cold water for the production process. Water for general use is filtered and added with chlorine to control microbe populations. To produce soft water, salt is ap-plied to eliminate existing resin. The use of chemicals, especially chlorine, for microbe control is maintained within the acceptable range.
Results indicated that several types of water used in manufacturing from cold to hot gave the global warm-ing potential at 98% with 98% for acidification and 99% for eutrophication. This thorough evaluation showed that using electricity to heat water presents the great-est impact on the environment at 94% of the global warming potential.
0%
10%
20%
30%
40%
50%
60%
70%
80%
90%
100%
GWP AP EP
Wastewater treatment
Ice
Chemicals and water treatment
Electricity
Transportation
Fishery
Sensitivity analysis
Life cycle impact assessment results contain several uncertain parameters; therefore, a sensitivity analy-sis was developed to assess the impact of variations, especially for the most significant parameters. This analysis involved calculation of different scenarios. From the results described earlier, fuel used during the fishery phase, allocation method, yield of product
and electricity were determined as the most impor-tant contributors to the outcome and these parame-ters were set as scenarios for the sensitivity analysis.
Fuel use
One of the substantial parameters leading to environ-mental impacts was determined as the amount of die-sel used during fish catching. Due to annual fuel data provided by participate company contained uncertainty,

149Environmental Research, Engineering and Management 2020/76/3
and previous research mentioned that the range is wide (Ziegler et al., 2016), therefore in this present work, sen-sitivity of fuel consumption was assumed to be 10% for scenario 1 and -10% for scenario 2. Result of this sen-sitivity analysis was shown in Table 7. Change of fuel consumption by 10% is possible due to the distribution of fish in the ocean. For goatfish surimi, when compared with the base case (S1), global warming potential, acid-ification and eutrophication varied at 3%, 7% and 7%, respectively. When compared with the base case (S2), similar results were 3%, 7% and 7%, respectively.
Goatfish surimi Ponyfish surimi
GWP AP EP GWP AP EP
Fuel use (+10%): (S1) 1373.00 3.49 0.78 2446.28 13.85 2.80
Fuel use (–10%): (S1) 1288.88 3.00 0.68 2014.92 11.38 2.29
Fuel use (+10%): (S2) 3077.41 7.82 1.76 7832.30 43.62 8.91
Fuel use (–10%): (S2) 2888.88 6.73 1.52 6451.20 35.70 7.29
Emissions associated with ponyfish surimi displayed a larger potential variation because the main factor af-fecting impacts was the use of diesel, while the key con-tributor from goatfish surimi processing was electricity consumption during processing. Sensitivity analysis variation was approximately 10%. Moreover, abundance of the target species is also a parameter to be consid-ered (Ziegler et al., 2016). Over the same time period, lower abundance leads to lower catch rates (Ziegler et al., 2016) and fuel consumption fluctuates depending on season and species behaviour.
Table 7. Sensitivity analysis for fuel use change
Table 8. Sensitivity analysis for economic allocation change
Unit: g per functional unit
Allocation
According to Ayer et al. (2007), economic allocation is not the most appropriate method to determine sea-food production LCA because it does not reflect bio-physical flows of material and energy between inputs and outputs of the production system. However, they found that both mass allocation and economic allo-cation contributed to variation at every impact level. Mass allocation resulted in a lower impact potential
economic allocation analysis because of discrepan-cies in selling price and yield quantity between fish products and fish waste. Hence, prices of fish products and fish waste as well as fish species are essential for LCA. Prices for surimi were increased or reduced by 10% and then analyzed using economic allocation as displayed in Table 8. Regardless of how the prices changed, variation on impact potential levels was only small at 1% compared with the base case (S2).
Goatfish surimi Ponyfish surimi
GWP AP EP GWP AP EP
Economic allocation (+10%) 3011.47 7.34 1.65 7205.14 40.01 8.17
Economic allocation (–10%) 2949.25 7.19 1.62 7065.77 39.24 8.01
Environmental Research, Engineering and Management 2020/76/3150
Table 9. Sensitivity analysis for variation of yield change
Table 10. Sensitivity analysis for electricity change
Unit: g per functional unit
Product yield
Fish waste has the fish skin and tiny bones remaining after processing are usually bought for other purpos-es, such as to produce animal food. Some seafood processing plants operate their own animal food producing facilities. Interview sessions with ponyfish surimi entrepreneurs determined that sometimes the fish they caught were smaller than usual, resulting in less surimi yield, since it is more difficult to manu-ally debone small fish. In other words, the acquired
yield quantity also depends on the skills of the work-ers. Analysis results based on increasing or reducing the yield by 10% are indicated in Table 9. For goatfish surimi, change of yield quantity contributed an impact variation of 5% in S1 and 1% in S2, while ponyfish surimi gave similar results at 10% in S1 and 1% in S2. Thus, in terms of economic allocation, change of yield quantity caused minor variation in environmen-tal impact levels. On the other hand, huge differences resulted from analysis by mass allocation.
Goatfish surimi Ponyfish surimi
GWP AP EP GWP AP EP
Yield (+10%): (S1) 1397.49 3.41 0.77 2453.66 13.88 2.80
Yield (–10%): (S1) 1264.40 3.08 0.69 2007.54 11.35 2.29
Yield (+10%): (S2) 3007.84 7.34 1.65 7230.36 40.15 8.20
Yield (–10%): (S2) 2956.32 7.21 1.62 7136.74 39.08 7.98
Electricity consumption
Electricity is required for both manufacturing and wa-ter production. Table 10 shows electricity as a key pa-rameter with a remarkable effect on global warming
caused by goatfish surimi production. If the electricity consumption rate was increased or reduced by 10%, the level of the GWP varied by 7% in terms of goatfish suri-mi, while ponyfish surimi showed only a slight change.
Goatfish surimi Ponyfish surimi
GWP AP EP GWP AP EP
Electricity (+10%): (S1) 1419.18 3.61 0.81 2237.33 12.66 2.55
Electricity (–10%): (S1) 1242.71 3.03 0.68 2223.87 12.54 2.52
Electricity (+10%): (S2) 3180.92 7.76 1.74 7163.30 39.74 8.08
Electricity (–10%): (S2) 2785.37 6.78 1.52 7120.20 39.01 7.86
Summary
Sensitivity analysis was conducted for four param-eters: fuel used in the fishery phase, economic al-location in surimi processing, yield of fish in surimi processing, and electricity use. During processing of
goatfish surimi, changes in parameters caused var-iation of the global warming potential at 3–7% with change in electricity use delivering the most outstand-ing variation (6.6%). Changes in diesel usage during the fishing phase gave the least effect on the result

151Environmental Research, Engineering and Management 2020/76/3
(3.1%). For ponyfish surimi, variation was identified at 0.3–10%. The use of electricity during processing resulted in the least variation to the GWP (0.3%), while change in yields delivered the greatest effect on the GWP in scenario 1 (10%) with change in diesel con-sumption showing the highest effect in scenario 2 (9.7%). Meanwhile, the impact on AP and EP was in the same way as the GWP.
ConclusionsConsiderable options exist for improvements regarding the environmental impacts of Thai surimi production and its supply chain. This environmental assessment for surimi produced in Southern Thailand resulted in global warming of 1.33–7.14 kg CO2 eq per kg surimi. Acidification and eu-trophication were calculated at 3.29–39.66 g SO2 eq per kg surimi and 0.75–8.10 g PO4 eq per kg surimi, respectively. In the fishery industry, the most important environmental
measure concerns the amount of fuel used and electric-ity consumption, with the main contributions to the GWP. Four sensitivity analysis scenarios were conducted. The results showed that changes in electricity use, fuel use and yield were the most influential factors depending on each scenario. Derived life cycle assessment methodology can benefit both companies and policy-makers to improve the sustainability of processes and products. To have a more sustainable improvement, some indicators might be se-lected to monitor, such as fuel use per landing in fishery and electricity consumption per production in surimi pro-cessing. Improving fishery methodology and fishing gears will lead to increasing in both environmental and economic performance. For policy-makers, results of this life cycle assessment can be utilized to identify and rectify hotspots in the supply chain. For example, increas-ing renewable energy sources could be considered in na-tional power plant policy and planning.
{Gurauskiene, 2006, Eco-design methodology for electrical and electronic equipment industry}
References Arvanitoyannis I.S. and Kassaveti A. (2008) Fish Industry Waste: Treatments, Environmental Impacts, Current and Potential Uses. International Journal of Food Science and Technologies 43(4): 726-745. https://doi.org/10.1111/j.1365-2621.2006.01513.x
Aubin J., Papatryphon E., van der Werf H.M.G. and Chatzifotis S. (2009) Assessment of the Environmental Impact of Carniv-orous Finfish Production System using Life Cycle Assessment. Journal of Cleaner Production 17(3): 354-361. https://doi.org/10.1016/j.jclepro.2008.08.008
Avadi A. and Freon P. (2013) Life Cycle Assessment of Fish-eries: A Review for Fisheries Scientists and Managers. Fish-eries Research 143: 21-38. https://doi.org/10.1016/j.fish-res.2013.01.006
Ayer N.W., Tyedmers P.H., Pelletier N.L., Sonesson U. and Scholz A. (2007) Co-Product Allocation in Life Cycle Assess-ment of Seafood Production Systems: Review of Problems and Strategies. International Journal of Life Cycle Assessment 12(7): 480-487. https://doi.org/10.1065/lca2006.11.284
Department of Fisheries (2016). Statistics of Fisheries Factory 2014, Thailand, No. 11/2016. Available at: http://www1.fisher-ies.go.th/it-stat/images/stories/yearbook/yearbook2557.pdf (accessed 6 June 2018).
Ellingsen H. and Aanondsen S.D. (2006) Environmental Impacts of Wild Caught Cod and Farmed Salmon-A Comparison with Chicken. International Journal of Life Cycle Assessment 11(1): 60-65. https://doi.org/10.1065/lca2006.01.236
Ferraciolli L., Luiz D. and Naval L.P. (2017) Potential for Reuse of Effluent from Fish Processing Industries. Revista Ambiente & Aqua 12(5): 730-742. https://doi.org/10.4136/ambi-agua.2045
FAO (Food and Agriculture Organization of the United Nations) (2016) FAO yearbook: Fishery and Aquaculture Statistics 2016, Rome, Italy.
Garnett T. (2011) Where are the best opportunities for reduc-ing greenhouse gas emissions in the food system (includ-ing the food chain)?. Food Policy 36: 523-532. https://doi.org/10.1016/j.foodpol.2010.10.010
Guinee J.B., Gorree M., Heijungs R., Huppes G., Kleijn R., de Koning A., van Oers L., Wegener A., Suh S. and Udo de Haes H.A. (2001) Life Cycle Assessment-An Operational Guide to the ISO Standards. Leiden: Centre of Environmental Science.
Guenneugues P. and Ianelli J. (2014) Surimi resources and mar-ket. In: Surimi and Surimi Seafood, 3rd edition, Park, J.W. (ed.), CRC Press, Boca Raton, FL: 25-53. https://doi.org/10.1201/b16009-4

Environmental Research, Engineering and Management 2020/76/3152
Henriksson P.J.G., Guinee J.B., Kleijn R. and de Snoo G.R. (2012) Life Cycle Assessment of Aquaculture Systems-a Review of Methodologies. International Journal of Life Cycle Assessment 17(3): 304-313. https://doi.org/10.1007/s11367-011-0369-4
Hornborg S., Nilsson P., Valentinsson D. and Ziegler F. (2012) Integrated environmental assessment of fisheries manage-ment: Swedish Nephrops trawl fisheries evaluated using a life cycle approach, Marine Policy 36: 1193-1201. https://doi.org/10.1016/j.marpol.2012.02.017
Hospido A., Vazques M.E., Cuevas A., Feijoo G. and Moreira M.T. (2006) Environmental Assessment of Canned Tuna Manufac-ture with a Life-Cycle Perspective. Resources, Conservation and Recycling 47(1): 56-72. https://doi.org/10.1016/j.rescon-rec.2005.10.003
Hyun-young K., Yong-su Y. and Bo-kyu H. (2017) A quantitative analysis of greenhouse gas emissions from the major coastal fisheries using the LCA method. Journal of the Korean Society of Fisheries and Ocean Technology 53(1): 77-88. https://doi.org/10.3796/KSFT.2017.53.1.077
ISO (International Standards Organization) (2006) Environmen-tal Management-Life Cycle Assessment-Principles and Frame-work, ISO14040, BSI, CEN.
Iribarren D., Moreira M.T. and Feijoo G., (2010) Life cycle assess-ment of fresh and canned mussel processing and consumption in Galicia (NW Spain). Resources, Conservation and Recycling 55: 106-117. https://doi.org/10.1016/j.resconrec.2010.08.001
Iribarren D., Vazques-Rowe I., Hospido A., Moreira M.T. and Fei-joo G. (2011) Estimation of the Carbon Footprint of the Galician Fishing Activity (NW Spain). Science of Total Environment 409: 1609-1611. https://doi.org/10.1016/j.scitotenv.2011.01.007
Jaehyun B., Yong-su Y., Hyun-young K., Bo-kyu H. and Chun-woo L. (2019), A quantitative analysis of greenhouse gas emis-sions from the major offshore fisheries. Journal of the Korean Society of Fisheries and Ocean Technology 55(1): 50-61. https://doi.org/10.3796/KSFOT.2019.55.1.050
Kaewudom P., Benjakul S. and Kijroongrojana K. (2013) Prop-erties of Surimi Gel as Influenced by Fish Gelatin and Micro-bial Transglutaminase. Food Bioscience 1: 39-47. https://doi.org/10.1016/j.fbio.2013.03.001
Laso J., Vazquez-Rowe I., Margallo M., Crujeiras R.M., Irabien A. and Aldaco R. (2018) Life cycle assessment of Europena an-chovy (Engraulis encrasicolus) landed by purse seine vessels in northern Spain. International Journal of Life Cycle Assessment 23: 1107-1125. https://doi.org/10.1007/s11367-017-1318-7
Morrissey M.T. and Tan S.M. (2000) World Resources for Surimi, In J.W. Park (ed.), Surimi and surimi seafood, New York, USA, Marcel Dekker: 1-21.
Parker R. (2012) Review of Life Cycle Assessment Research on Products Derived from Fisheries and Aquaculture: A Report for Seafish as Part of the Collective Action to Address Greenhouse Gas Emissions in Seafood. Sea Fish Industry Authority, Edin-burgh, UK.
Parker R. and Tyedmers P.H. (2012) Uncertainty and Natural Variability in the Ecological Footprint of Fisheries: A Case Study of Reduction Fisheries for Meal and Oil. Ecological Indicators 16: 76-83. https://doi.org/10.1016/j.ecolind.2011.06.015
Pelletier N. and Tyedmers P. (2008) Life Cycle Considerations for Improving Sustainability Assessments in Seafood Aware-ness Campaigns. Environmental Management 42(5): 918-931. https://doi.org/10.1007/s00267-008-9148-9
Reckmann K., Traulsen I. and Krieter J. (2012) Environmental Impact Assessment-Methodology with Special Emphasis on European Pork Production. Environmental Management 107: 102-109. https://doi.org/10.1016/j.jenvman.2012.04.015
Rebitzer G., Ekavall T., Frischknecht R., Hunkeler D., Norris G., Rydberg T. Schmidt W.P., Suh S., Weidema B.P. and Pennington D.W. (2004) Life Cycle Assessment Part 1: Framework, Goal and Scope Definition, Inventory Analysis and Applications. Environ-ment International 30(5): 701-720. https://doi.org/10.1016/j.envint.2003.11.005
Rehl T., Lansche J. and Muller J. (2012) Life Cycle Assessment of Energy Generation form Biogas-Attributional vs Consequen-tial Approach. Renewable and Sustainable Energy Reviews 16(6): 3766-3775. https://doi.org/10.1016/j.rser.2012.02.072
Shaviklo A.R. and Rafipour F. (2013) Surimi and Surimi Sea-food From Whole Ungutted Myctophid Mince. LWT-Food Sci-ence and Technology 54(2): 463-468. https://doi.org/10.1016/j.lwt.2013.06.019
Svanes E., Vold M. and Hanssen O.J. (2011a) Effect of Dif-ferent Allocation Method on LCA Results of Products from Wild-Caught Fish and on the Use of Such Results. Inter-national Journal of Life Cycle Assessment 16(6): 512-521. https://doi.org/10.1007/s11367-011-0288-4
Svanes E., Vold M. and Hanssen O.J. (2011b) Environmental Assessment of Cod (Gadus Morhua) from Autoline Fisheries. International Journal of Life Cycle Assessment 16(7): 611-624. https://doi.org/10.1007/s11367-011-0298-2
Thrane M. (2006) LCA of Danish Fish Product. New Methods and Insights. International Journal of Life Cycle Assessment 11(1): 66-74. https://doi.org/10.1065/lca2006.01.232
Thrane M., Nielsen E.H. and Christensen P. (2009) Cleaner Pro-duction in Danish Fish Processing-Experiences, Status and Possible Future Strategies. Journal of Cleaner Production 17(3): 380-390. https://doi.org/10.1016/j.jclepro.2008.08.006

153Environmental Research, Engineering and Management 2020/76/3
Vazques-Rowe I., Moreira M.T. and Feijoo G. (2010) Life Cycle Assessment of House Mackerel Fisheries in Galicia (NW Spain): Comparative Analysis of Two Major Fishing Methods. Fisher-ies Research 106(3): 517-527. https://doi.org/10.1016/j.fish-res.2010.09.027
Vazques-Rowe I., Moreira M.T. and Feijoo, G. (2012) Environ-mental Assessment of Frozen Common Octopus (Octopus Vul-garis) Captured by Spanish Fishing Vessels in the Mauritanian EEZ. Marine Policy 36(1): 180-188. https://doi.org/10.1016/j.marpol.2011.05.002
Weidema B.P., Thrane M., Christensen P., Schmidt J. and Lokke S. (2008) Carbon Footprint. A Catalyst for Life Cycle Assess-ment?. Journal of Industrial Ecology 12(1): 3-6. https://doi.org/10.1111/j.1530-9290.2008.00005.x
Ziegler F., Emanuelsson A., Eichelsheim J.L., Flysjo A., Ndiaye V. and Thrane M. (2011) Extended Life Cycle Assessment of Southern Pink Shrimp Products Originating in Senegalese Ar-tisanal and Industrial Fisheries for Export to Europe. Journal of
Industrial Ecology 15: 527-538. https://doi.org/10.1111/j.1530-9290.2011.00344.x
Ziegler F., Hornborg S., Green B.S., Eigaard O.R., Farmery A.K., Hammar L., Haartmann K., Molander S., Parker R.W.R., Hognes E.S., Vazquez-Rowa I. and Smith A.D.M. (2016) Expanding the concept of sustainable seafood using life cycle assessment, Fish and Fisheries 17: 1073-1093. https://doi.org/10.1111/faf.12159
Ziegler F., Nilsson P., Mattsson B. and Walther Y. (2003) Life Cy-cle Assessment of Frozen Cod Fillers including Fishery-Specific Environmental Impacts. International Journal of Life Cycle As-sessment 8: 39-47. https://doi.org/10.1007/BF02978747
Ziegler F., Groen E.A., Hornborg S., Bokkers E.A.M., Karlsen K.M. and de Boer I.J.M. (2018) Assessing broad life cycle impacts of daily onboard decision-making, annual strategic planning, and fisheries management in a northeast Atlantic trawl fishery. In-ternational Journal of Life Cycle Assessment 23: 1357-1367. https://doi.org/10.1007/s11367-015-0898-3
This article is an Open Access article distributed under the terms and conditions of the Creative Commons Attribution 4.0 (CC BY 4.0) License (http://creativecommons.org/licenses/by/4.0/ ).


![Untitled-4 [gingerthai.sg]gingerthai.sg/wp-content/uploads/2016/10/Ginger-Thai...salad -MANGO SALAD 2101 MINCED CHICKEN SALAD chicken. Chili served 21 POMELO SALAD Lime. shredded Lcucumber,](https://static.fdocuments.in/doc/165x107/5fc0848f5e3cac102210f653/untitled-4-salad-mango-salad-2101-minced-chicken-salad-chicken-chili-served.jpg)